Article

Thermal Analysis Tools for Physico-Chemical Characterization and Optimization of Perfluorocarbon Based Emulsions and Bubbles Formulated for Ultrasound Imaging

1
Université de Paris Cité, CNRS, INSERM, UTCBS, Chemical and Biological Technologies for Health Group (utcbs.cnrs.fr), Faculté de Santé, 4 Avenue de l’Observatoire, 75006 Paris, France
2
Université de Paris Cité, INSERM, Institu Cochin, 24 rue du Faubourg Saint Jacques, 75014 Paris, France
*
Author to whom correspondence should be addressed.
Colloids Interfaces 2022, 6(2), 21; https://doi.org/10.3390/colloids6020021
Submission received: 17 January 2022 / Revised: 15 March 2022 / Accepted: 18 March 2022 / Published: 1 April 2022
(This article belongs to the Special Issue Emulsion Applications)

Abstract

:
Self-emulsifying microbubbles, especially designed to increase the contrast of ultrasound images by the inclusion of perfluorocarbon molecules, have been studied by thermal analysis techniques. The microbubbles were made of a blend of gas (20%), surfactants (50%) and water (30%). The surfactants were mixtures of polysorbate-85, Span-80, poloxamer 188, glycerol and fluorinated surfactant (Zonyl®). Microbubbles have been characterized by means of diffusion light scattering and optical imaging. The effect of Zonyl® on encapsulation rate, as well as gas vaporization temperature and gas release temperature, has been assessed by means of Differential Scanning Calorimetry (DSC) and Thermogravimetric Analyses (TGA). Microscopy and laser granulometry techniques have been also carried out for each formulation in order to determine the number of microbubbles and their size, respectively. Moreover, stability of the emulsions has been evaluated by DSC and confronted with the results obtained from the ultrasound experiments. Average microbubble concentrations of 7.2 × 10⁷ and 8.9 × 10⁷ per mL were obtained for perfluorohexane and perfluoropentane based emulsions, respectively. The present study demonstrates that the amount of encapsulated perfluorocarbon increases and the gas evaporation temperature decreases with the concentration of Zonyl®. Furthermore, the best ultrasound contrast images have been obtained in vitro with the samples containing the lowest Zonyl® concentration. An explication regarding the role of Zonyl® in the emulsion/microbubbles preparations is proposed here in order to optimize self-emulsifying microbubble formulation for pharmaceutical development.

1. Introduction

Microbubble formulations were first developed for improving ultrasound imaging in tissues with low contrast, such as blood vessels [1]. Several formulations including perfluorocarbon (PFC) molecules or sulfur hexafluoride have been commercialized [2,3]. In these last decades, developments have been to combine microbubble formulations with DNA or drug, giving a new interest in microbubbles for ultrasound-activated drug release and delivery [4]. PFC liquid emulsions were more recently developed for in situ ultrasound-mediated generation of microbubbles from the droplets of liquid perfluorocarbon. For this purpose, liquid PFC with a relatively low boiling point has been formulated, forming micro-sized droplet emulsions of perfluoropentane [5] or nano-sized emulsions of perfluorohexane (PFH) or perfluoropentane (PFP) [6]. Microbubble emulsions are commonly obtained using high-shear homogeneization and are stabilized by lipid coating [6,7] or amphiphilic block copolymer insertion [8,9] at the hydrophilic/hydrophobic interface. Droplet size of liquid PFC determines the final use of the formulation. The nano-sized emulsions will increase blood half-life and improve potential for targeting when including perfluoropentane, the boiling point of which is 29 °C. The latter may stay liquid when injected intravenously and then, upon insonation of sufficient energy, will be converted into gas [7]. On the other hand, micro-sized PFC emulsions may be interesting to release nanomedicines via acoustic droplet vaporization [5,10,11]. Moreover, larger droplets are needed for better contrast as the ultrasound scattering cross-section of a microbubble is directly proportional to the sixth power of its radius [12].
The objective of the present study is to develop self-emulsifying emulsions containing perfluorocarbons (perfluorohexane or perfluoropentane), which are liquid at room temperature [13]. The obtained samples are therefore composed of micro-sized droplets—with a mean diameter lower than 10 µm—dispersed in an aqueous continuous medium. Since the ultrasound imaging contrast depends on the quantity of gas present in the microbubble emulsion, Zonyl®, a fluorinated surfactant emulsion stabilizer [14], was added to our formulations in order to improve the encapsulation rate of the liquid perfluorocarbon at room temperature. Thermal analyses, namely DSC and TGA, were used to characterize emulsions [15,16,17,18]. These two methods have been performed to quantify the encapsulation rate of PFC and determine the vaporization temperature of the micro-sized droplets as a function of the chain length of the perfluorocarbon and the Zonyl® proportion. Then, the formulations were evaluated in vitro using an ultrasound device.

2. Materials and Methods

2.1. Chemicals

Perfluorohexane (PFH, purity of 98%), and perfluoropentane (PFP, purity ≥ 96%) were supplied by Apollo (Bredbury, UK), and Strem Chemicals (Bischheim, France), respectively. The boiling points of PFH and PFP are: 29 and 41 °C, respectively. The compounds were therefore in their liquid state when formulated at room temperature.
Polysorbate-85 (PS85), a hydrophilic surfactant, was purchased from Seppic (La Garenne Colombes, France) with the following reference: Montanox® 85. Poloxamer 188, chosen for its hydrosoluble properties, was supplied by BASF (Ludwigshafen, Germany) under the name of Lutrol®. Span 80, a lipophilic surfactant, was purchased from Seppic (La Garenne Colombes, France), with the following reference: Montane® 80.
Zonyl®, a surfactant used to improve the perfluorocarbon encapsulation within the emulsion, was supplied by Aldrich (Saint-Quentin-Fallavier, France). Glycerin was provided by the Laboratory of Pharmaceutical Formulation (Université Paris Cité, Paris, France). Medium-chain triglycerides (MCT), used for the perfluorocarbon compound substitution in model emulsions, was supplied by ADM (Chicago, IL, USA).
Zonyl®-rhodamine derivative was synthesized in our laboratory by reacting Zonyl® with rhodamine-NHS in phosphate-buffered saline solution, then washing with ultracentrifugation the rhodamine, which had not reacted.

2.2. Emulsion Formulation and Preparation

Emulsion formulations were based on our previous work to obtain emulsion from a self-emulsification process to preserve perfluorocarbon as a liquid physical state [19]. In the latter work, the glycerol/polysorbate 85 excipient association was proven to be safe and efficient to prepare self-emulsifying formulations. Briefly, a titration method was used to determine the best ratio of surfactants, and pseudo ternary phase diagrams allowed selecting the best ratio, combining the best granulometric characteristics and stability results. A high glycerol concentration up to 30% was a valuable clue to obtain emulsion as it had also been described previously for parenteral self-emulsifying drug delivery systems [20]. Glycerol/polysorbate 85’s best ratios were found at 7:3, 8:2 and 9:1. However, none of the 3 ratios allowed to obtain perfluorocarbon emulsions, so we decided to empirically improve the emulsification by adding well-known non-ionic co-surfactants [21], i.e., sorbitan monoleate at 1% with low HLB and poloxamer 188 at 1% with high HLB added in the oil and water phases, respectively. Satisfactory emulsification results were obtained for the glycerol/polysorbate 85 ratio of 8:2. The final compositions are given in Table 1. The optimization of our formulations was then focused on the minimum percentage of Zonyl® to be incorporated in the formulation based on physico-chemical studies. In order to improve PFH or PFP encapsulation, all preparations were maintained at +4 °C in a cold water bath. Based on the overall expertise on emulsion formulations of our group [22], the emulsions were prepared as follows: perfuorocarbon or MCT was added to a mixture of Span 80, PS85 used as abbreviation and Zonyl®; then, an aqueous mixture of Poloxamer 188 and glycerol was progressively added to the latter mixture by gentle stirring. Oil/water (O/W) emulsions are therefore obtained, containing 20% of perfluorocarbon (replaced by MCT for the control emulsion), 1% of Span 80, 10% of PS85, 1% of Poloxamer 188, 30% of water. The final concentration of Zonyl® was varied from 0.5% to 3%. Then, glycerol was added to complete the formulation at 100%. Two grams of each formulation were then prepared. All samples were prepared in triplicate.

2.3. Emulsion Characterization

2.3.1. Size Measurement

Emulsion mean diameter has been determined by a laser diffraction particle size analyzer (Mastersizer®; Malvern Instruments Ltd., Malvern, UK), as described and validated elsewhere [23]. Each sample (n = 3) was automatically diluted in water to an appropriate concentration before measurement at 25 °C.

2.3.2. Number of Droplets

Optical microscopy was used to determine the number of droplets and their mean diameter, and to also evaluate the stability of the formulations. For this purpose, dilutions of one in a hundred were carried out and loaded on a malassez cell. Then, the emulsions (n = 1) were observed under white light with an optical microscope. Pictures of droplets in suspension were taken then analyzed by means of the ImageJ software to estimate the average diameter and the number of the droplets for each sample as described [24].

2.3.3. Localization of Fluorinated Surfactant in the Formulation

Fluorescence microscopy has also been used to locate the Zonyl® within the emulsion. For this purpose, a Zonyl® solution containing 10% rhodamine-coupled Zonyl® was used for the emulsion preparations. Photographs of the samples were taken on an Axiophot fluorescence microscope (Carl Zeiss France, Le Pecq, France) with excitation and emission filters for rhodamine (545 and 566 nm, respectively). Images were acquired with a retiga 2000 CCD camera (Q Imaging, Surrey, BC, Canada).

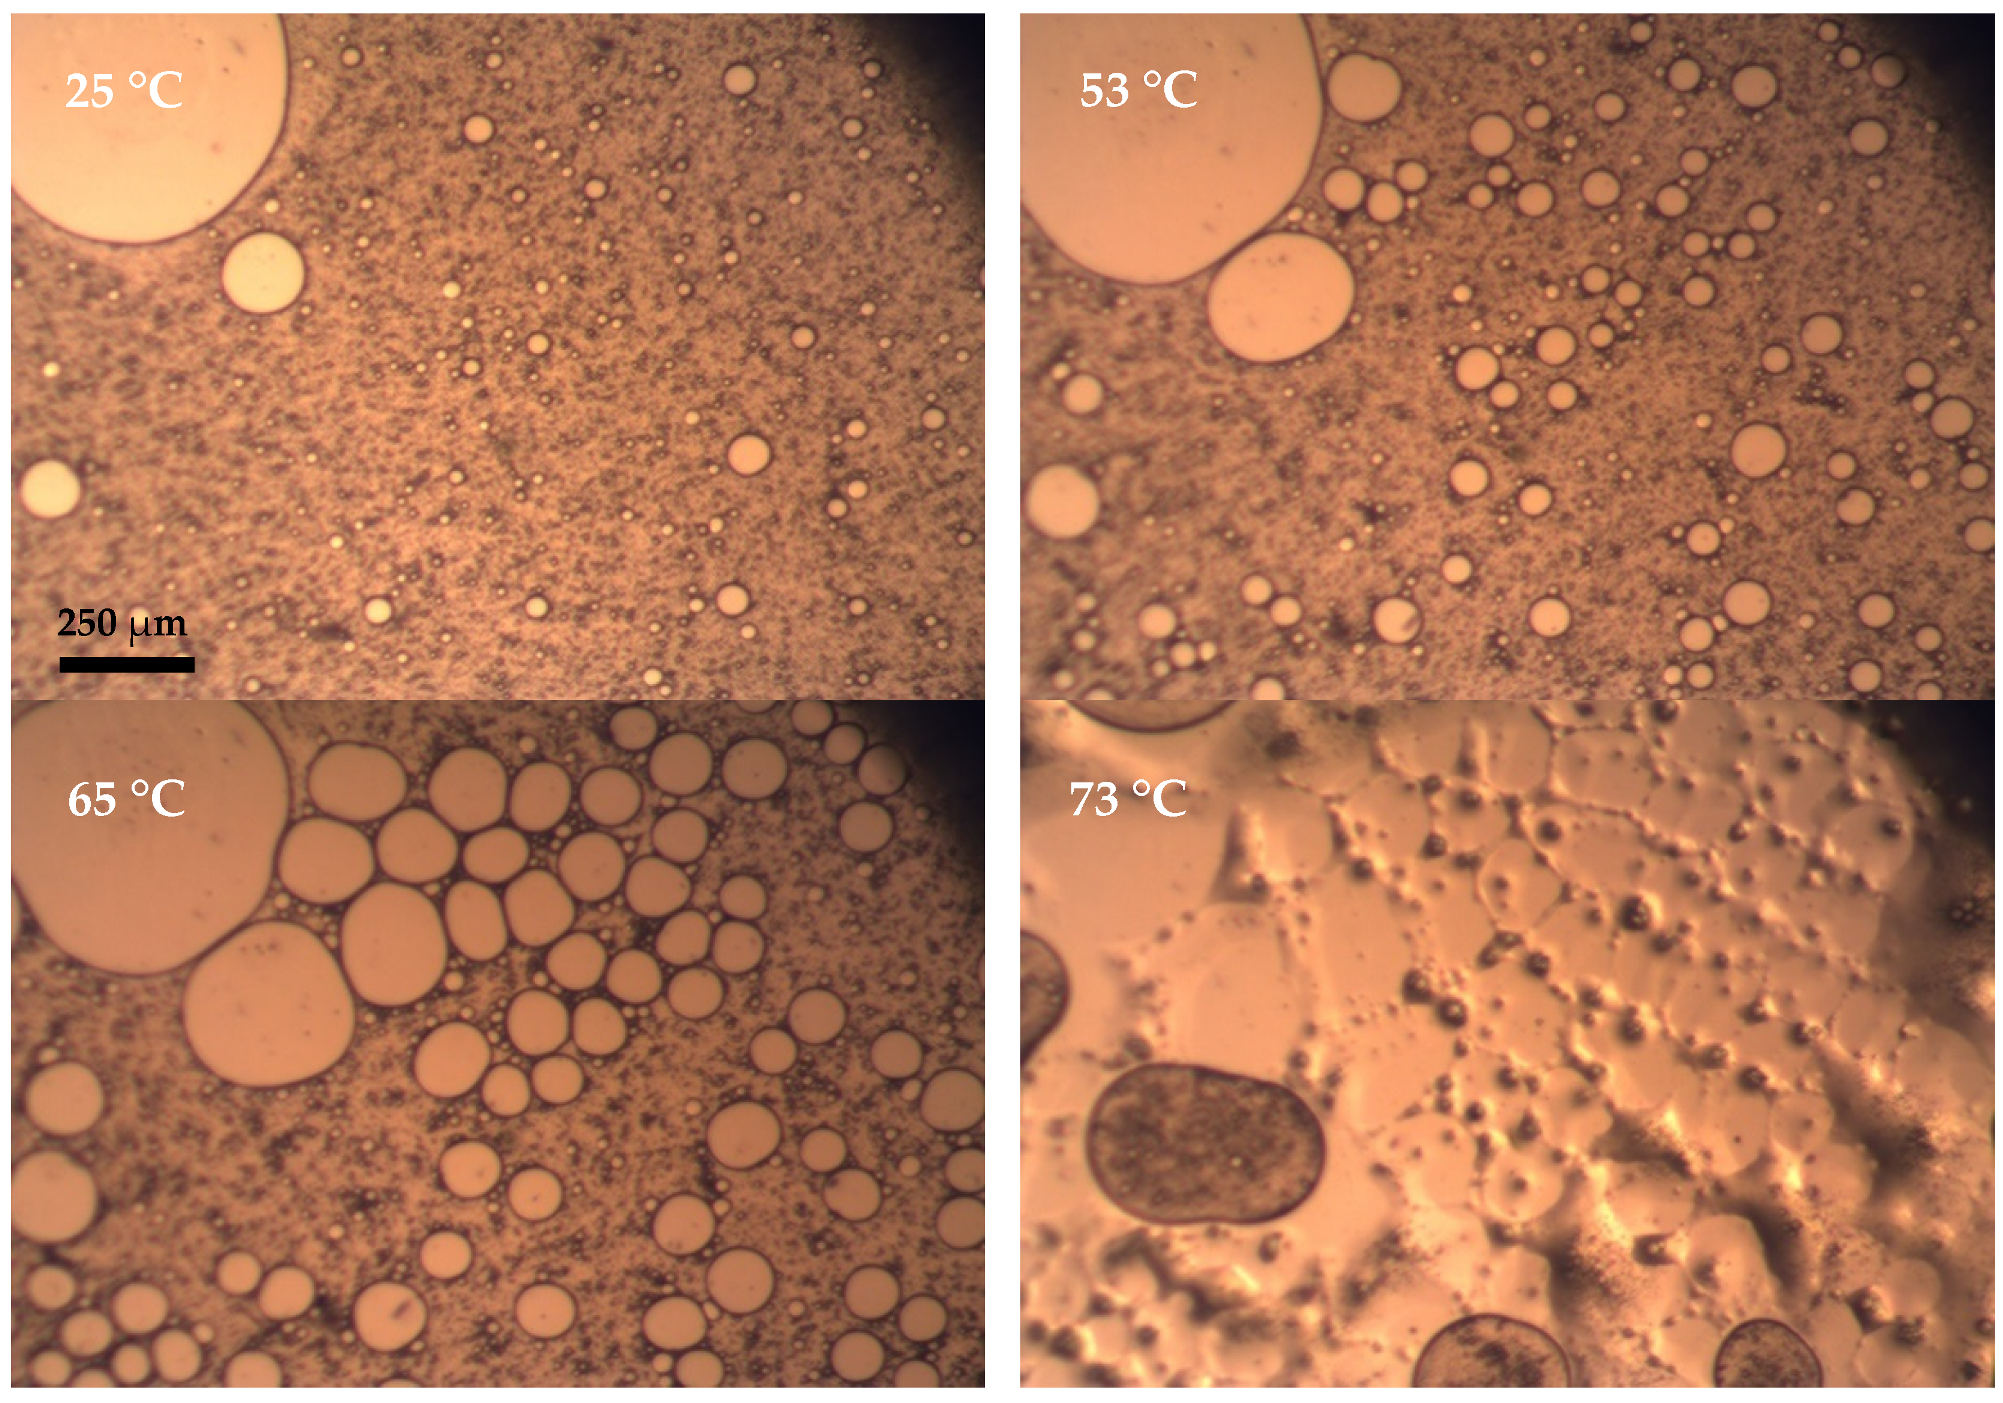
2.3.4. Visual Evaluation of the Emulsion Stability upon Heating by Thermal Microscopy

The influence of temperature on perfluorocarbon emulsions (n = 1 for each perfluorocarbon emulsion) was studied by thermal microscopy. A droplet of a given emulsion was placed on a glass slide, covered by a cover glass, and then placed into a sealed cell with controlled temperature (LTS 420 from Linkam Scientific Instruments Ltd., Tadworth, UK). Temperature range: 25 to 200 °C with a 5 °C·min−1 heating rate. The pictures were taken by means of a 5.0 mega pixel Moticam 2500 camera installed on a Motic® microscope ocular (Xiamen, China).

2.3.5. Thermal Analysis

The differential scanning calorimetry and thermogravimetric analysis experiments were performed using an 822e thermal analyzer and a TGA 850 from Mettler-Toledo (Greifensee, Switzerland). By using a 20 µL micropipette, approximately 25 mg of the emulsion samples was introduced in an aluminum pan for each experiment (n = 1). For the DSC experiments, an empty aluminum pan was used as a reference, and indium and zinc samples were used for temperature and enthalpy calibration of the device. The DSC and TGA experiments were carried out at 2 or 5 °C·min−1, temperature range: −60–200 °C, and 25–200 °C, respectively.

2.3.6. Ultrasound Imaging Assessment of the Emulsions

The emulsions were diluted by a tenth in an Eppendorf® tube placed on a gel in front of the probe. The experiments were conducted at room temperature and at 37 °C (n = 3). Ultrasound images were acquired using an ultrasound imaging system (VEVO2100, Visualsonics, Toronto, ON, Canada) driving an 18 MHz probe (MS250), with power output set up at 10%. This system provides images, the brightness of which indicates the ability of emulsions to reflect ultrasound. Conventional B-mode images were used to measure the echogenicity of the medium. Quantification of backscattered echo in linear imaging mode (B-Mode) was performed drawing Regions of Interest (ROI) in acquired image, using the contrast measurement tool from the provider (VevoLab, Visualsonics). This module ensures the linearization of data measured in images, ensuring that measurements are proportional to echo power.

2.3.7. Statistical Analysis

The hydrodynamic mean emulsion diameter and volume median diameter data were calculated as mean ± standard deviation. Statistical analysis was performed by one-way analysis of variance (ANOVA) test or an unpaired t test with Welch’s correction, by means of GraphPad Prism (version 8.0.2) for a given perfluorocarbon system or for a PFH vs. PFP system comparison, respectively. The p values found are indicated in the discussion of the related results.

3. Results

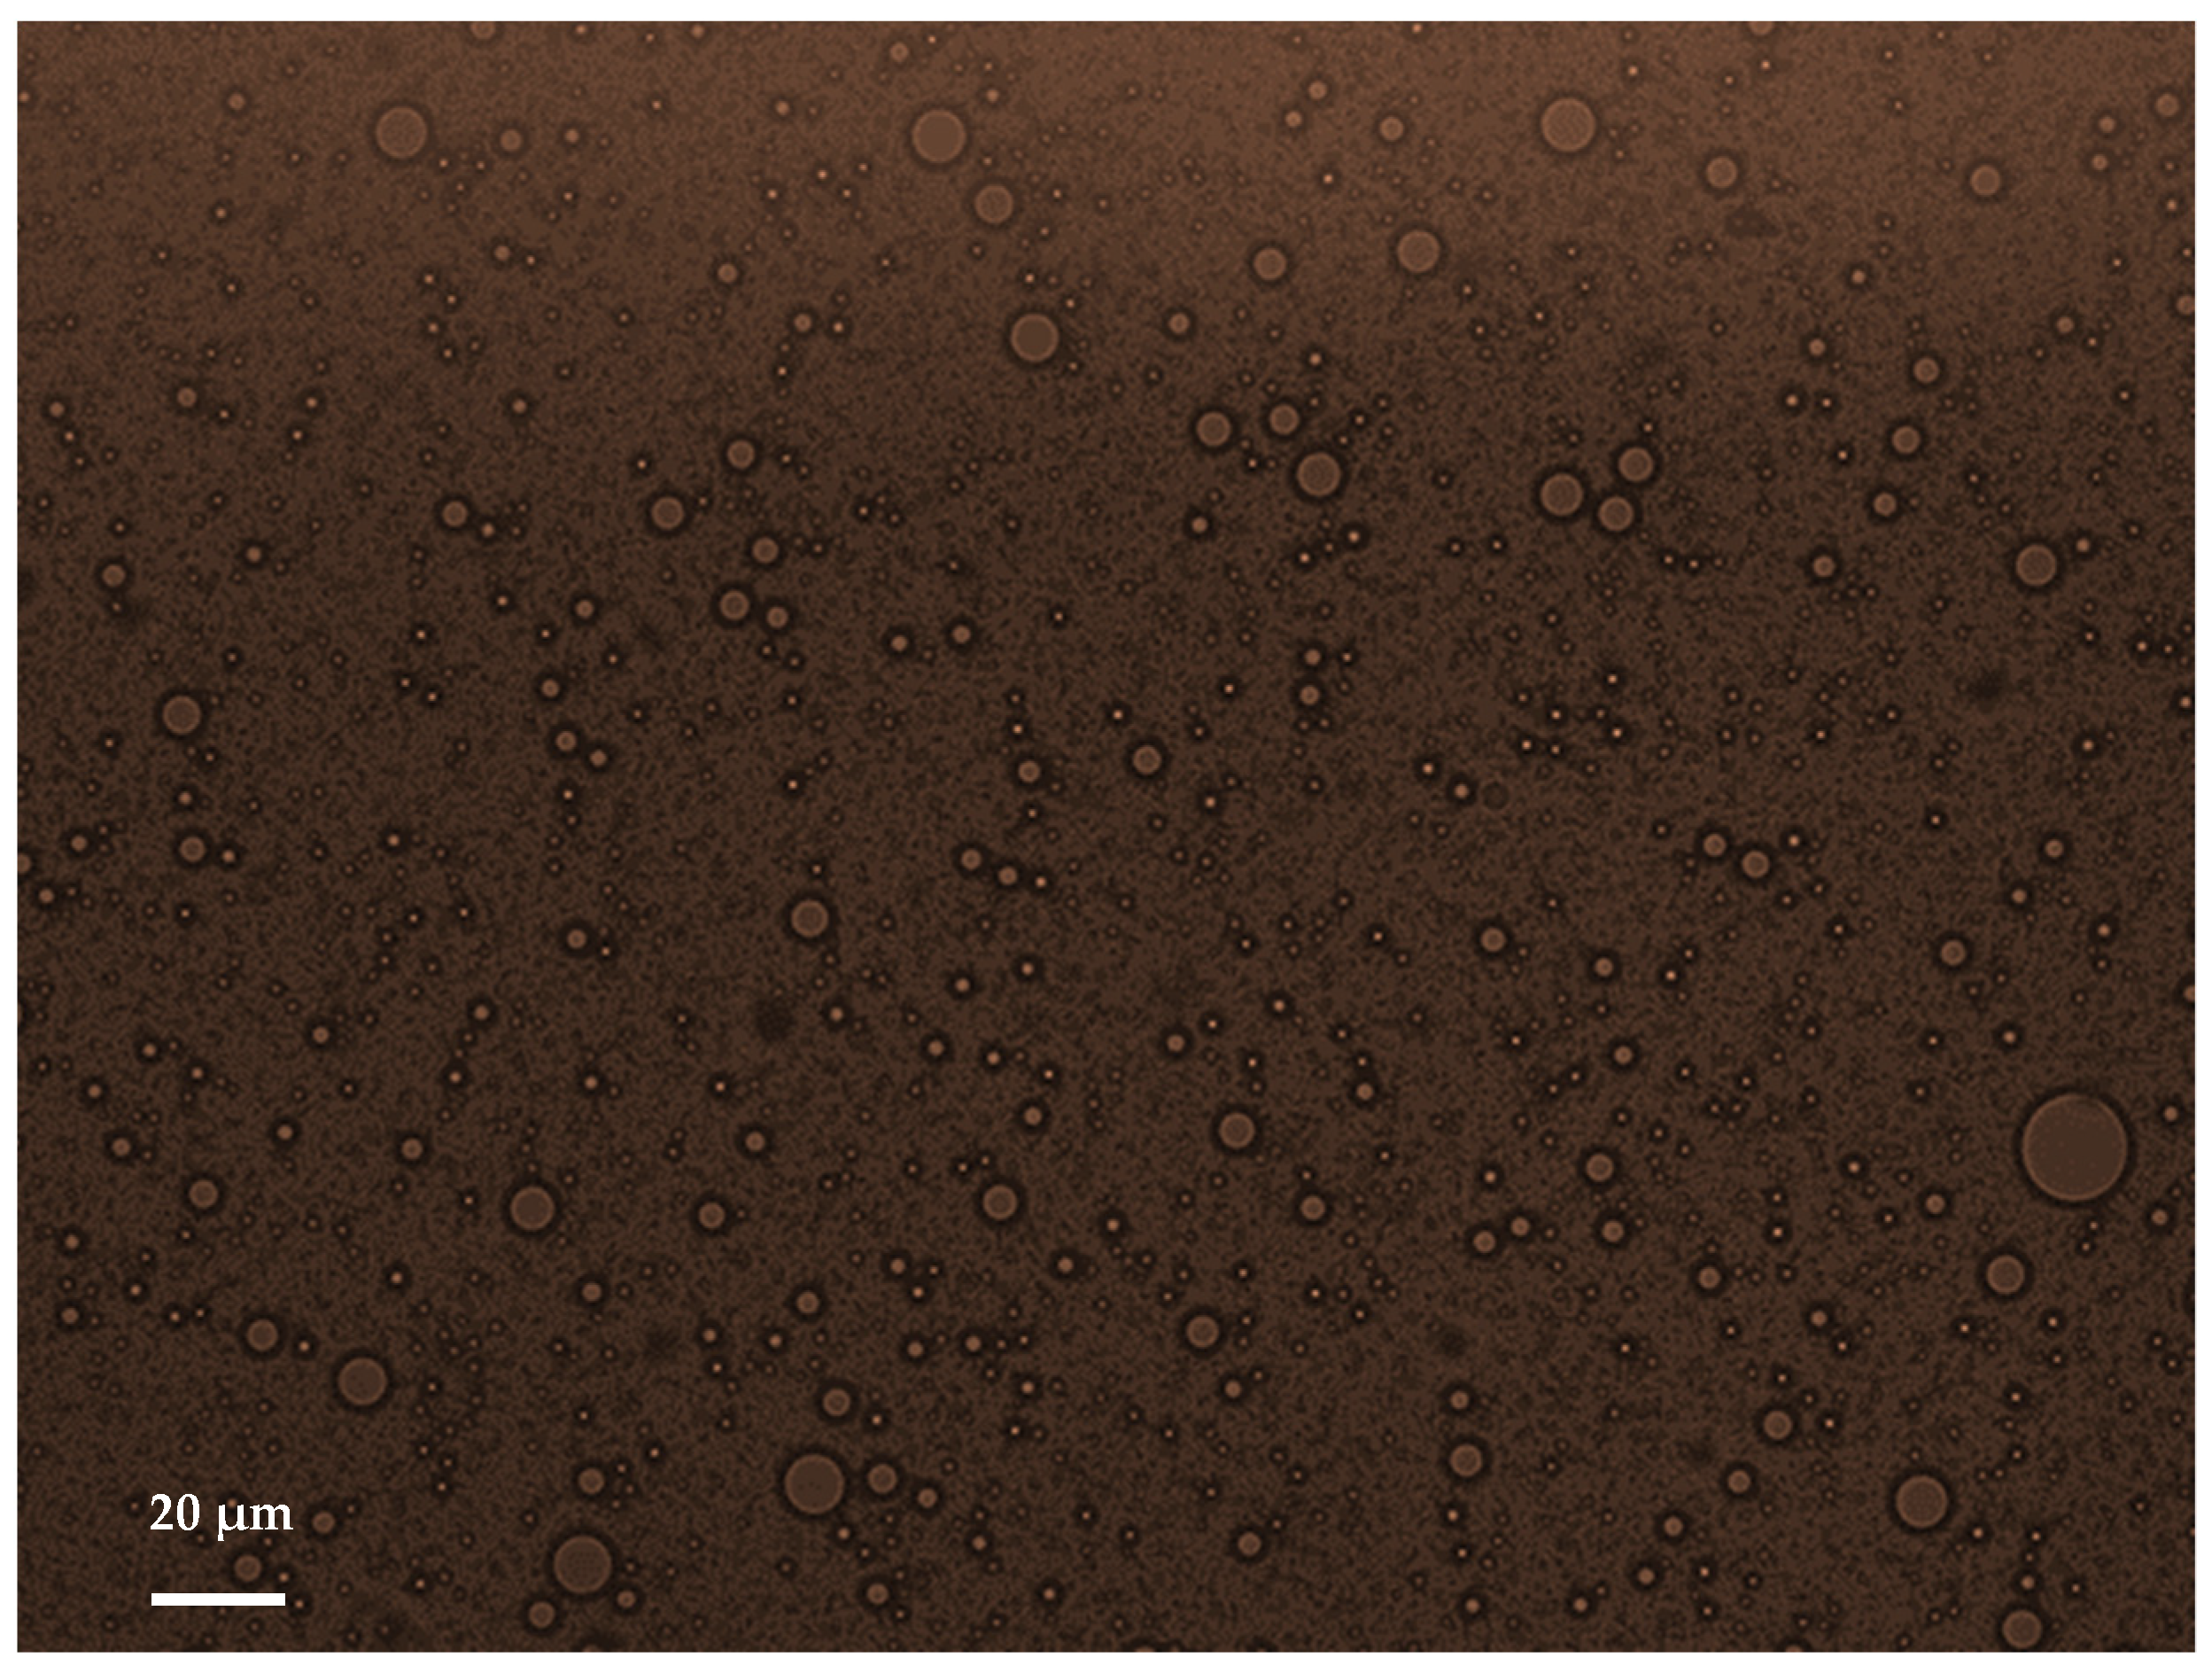
3.1. Characterization of the Droplets by Diffusion Light Scattering and Optical Imaging

The particle size distributions of the emulsions have been estimated by laser diffraction (Mastersizer®). Mean diameter and median diameter (DV50), meaning the size point below which 50% of the material is contained, are shown in Table 2 for both PFH and PFP systems. From our analyses, 99% of the droplets were less than 9 µm or smaller. As a matter of fact, two distinguishable populations have been highlighted, i.e., two sets of size distribution (Gaussian) populations were apparent, the majority being around 2 µm.
Interestingly, size distributions were independent of the surfactant concentration or the encapsulated perfluorocarbon (p > 0.05). From the distribution size results, the volume median diameter DV50, i.e., the diameter for which the droplets can be partitioned in two groups of equal quantity of droplets, shows more precise results with a slight influence of the percentage of Zonyl®. Unsurprisingly, increasing the amount of Zonyl® tends to significantly reduce the volume median diameter for the perfluoropentane-filled emulsion (p < 0.05 and p > 0.05, for PFH and PFP, respectively), which may be related to the larger amount of surfactant. This result is grouped together with the increase in the number of droplets with the surfactant content. As far as the PFH system is concerned, no significant evolution of DV50 was noticed with the increase in the surfactant content, confirming the same number of droplets for the related formulations. Moreover, a lower median diameter was obtained for perfluoropentane-filled emulsion (p > 0.05, Table 2).
An estimation of the mean droplet diameter of the emulsions has also been obtained by optical microscopy followed by image analysis [24]. The results regarding the number and the size of the droplets as a function composition of the emulsions are given in Table 2. As obtained with the Mastersizer, the mean diameter was comparable for all emulsions tested. For the PFP system, the number of droplets was slightly influenced by the nature of the gas and by the amount of Zonyl®, contrary to the PFH emulsions.
In comparison, the number of microbubbles given for commercial contrast agents, such as Sonovue, is between 108–1010 droplets per mL with larger mean particle sizes (from 1–10 µm) [25]. However, the half-life was determined by monitoring the number of the microbubbles by optical microscopy and image analysis. At room temperature, the half-lives for the PFH and PFP based emulsions containing 2% Zonyl® were 72 and 54 h, respectively, when the half-life is only 6 h and 36 h for the marketed Sonovue®, and Optison® [26], respectively. This result clearly demonstrates that those formulated in the present study have greater stability than the commercial ones.
In order to gain more insight into the possible influence of Zonyl® on microbubble physical characteristics, we labeled the Zonyl® with rhodamine and looked for its localization under a fluorescence microscope. We observed that emulsions present a red color, mostly located around the inner phase (Figure 1). The red color visualized, due to the physico-chemical property of the dye, indicates that the majority of Zonyl® molecules are present at the perfluorocarbon/water interface.

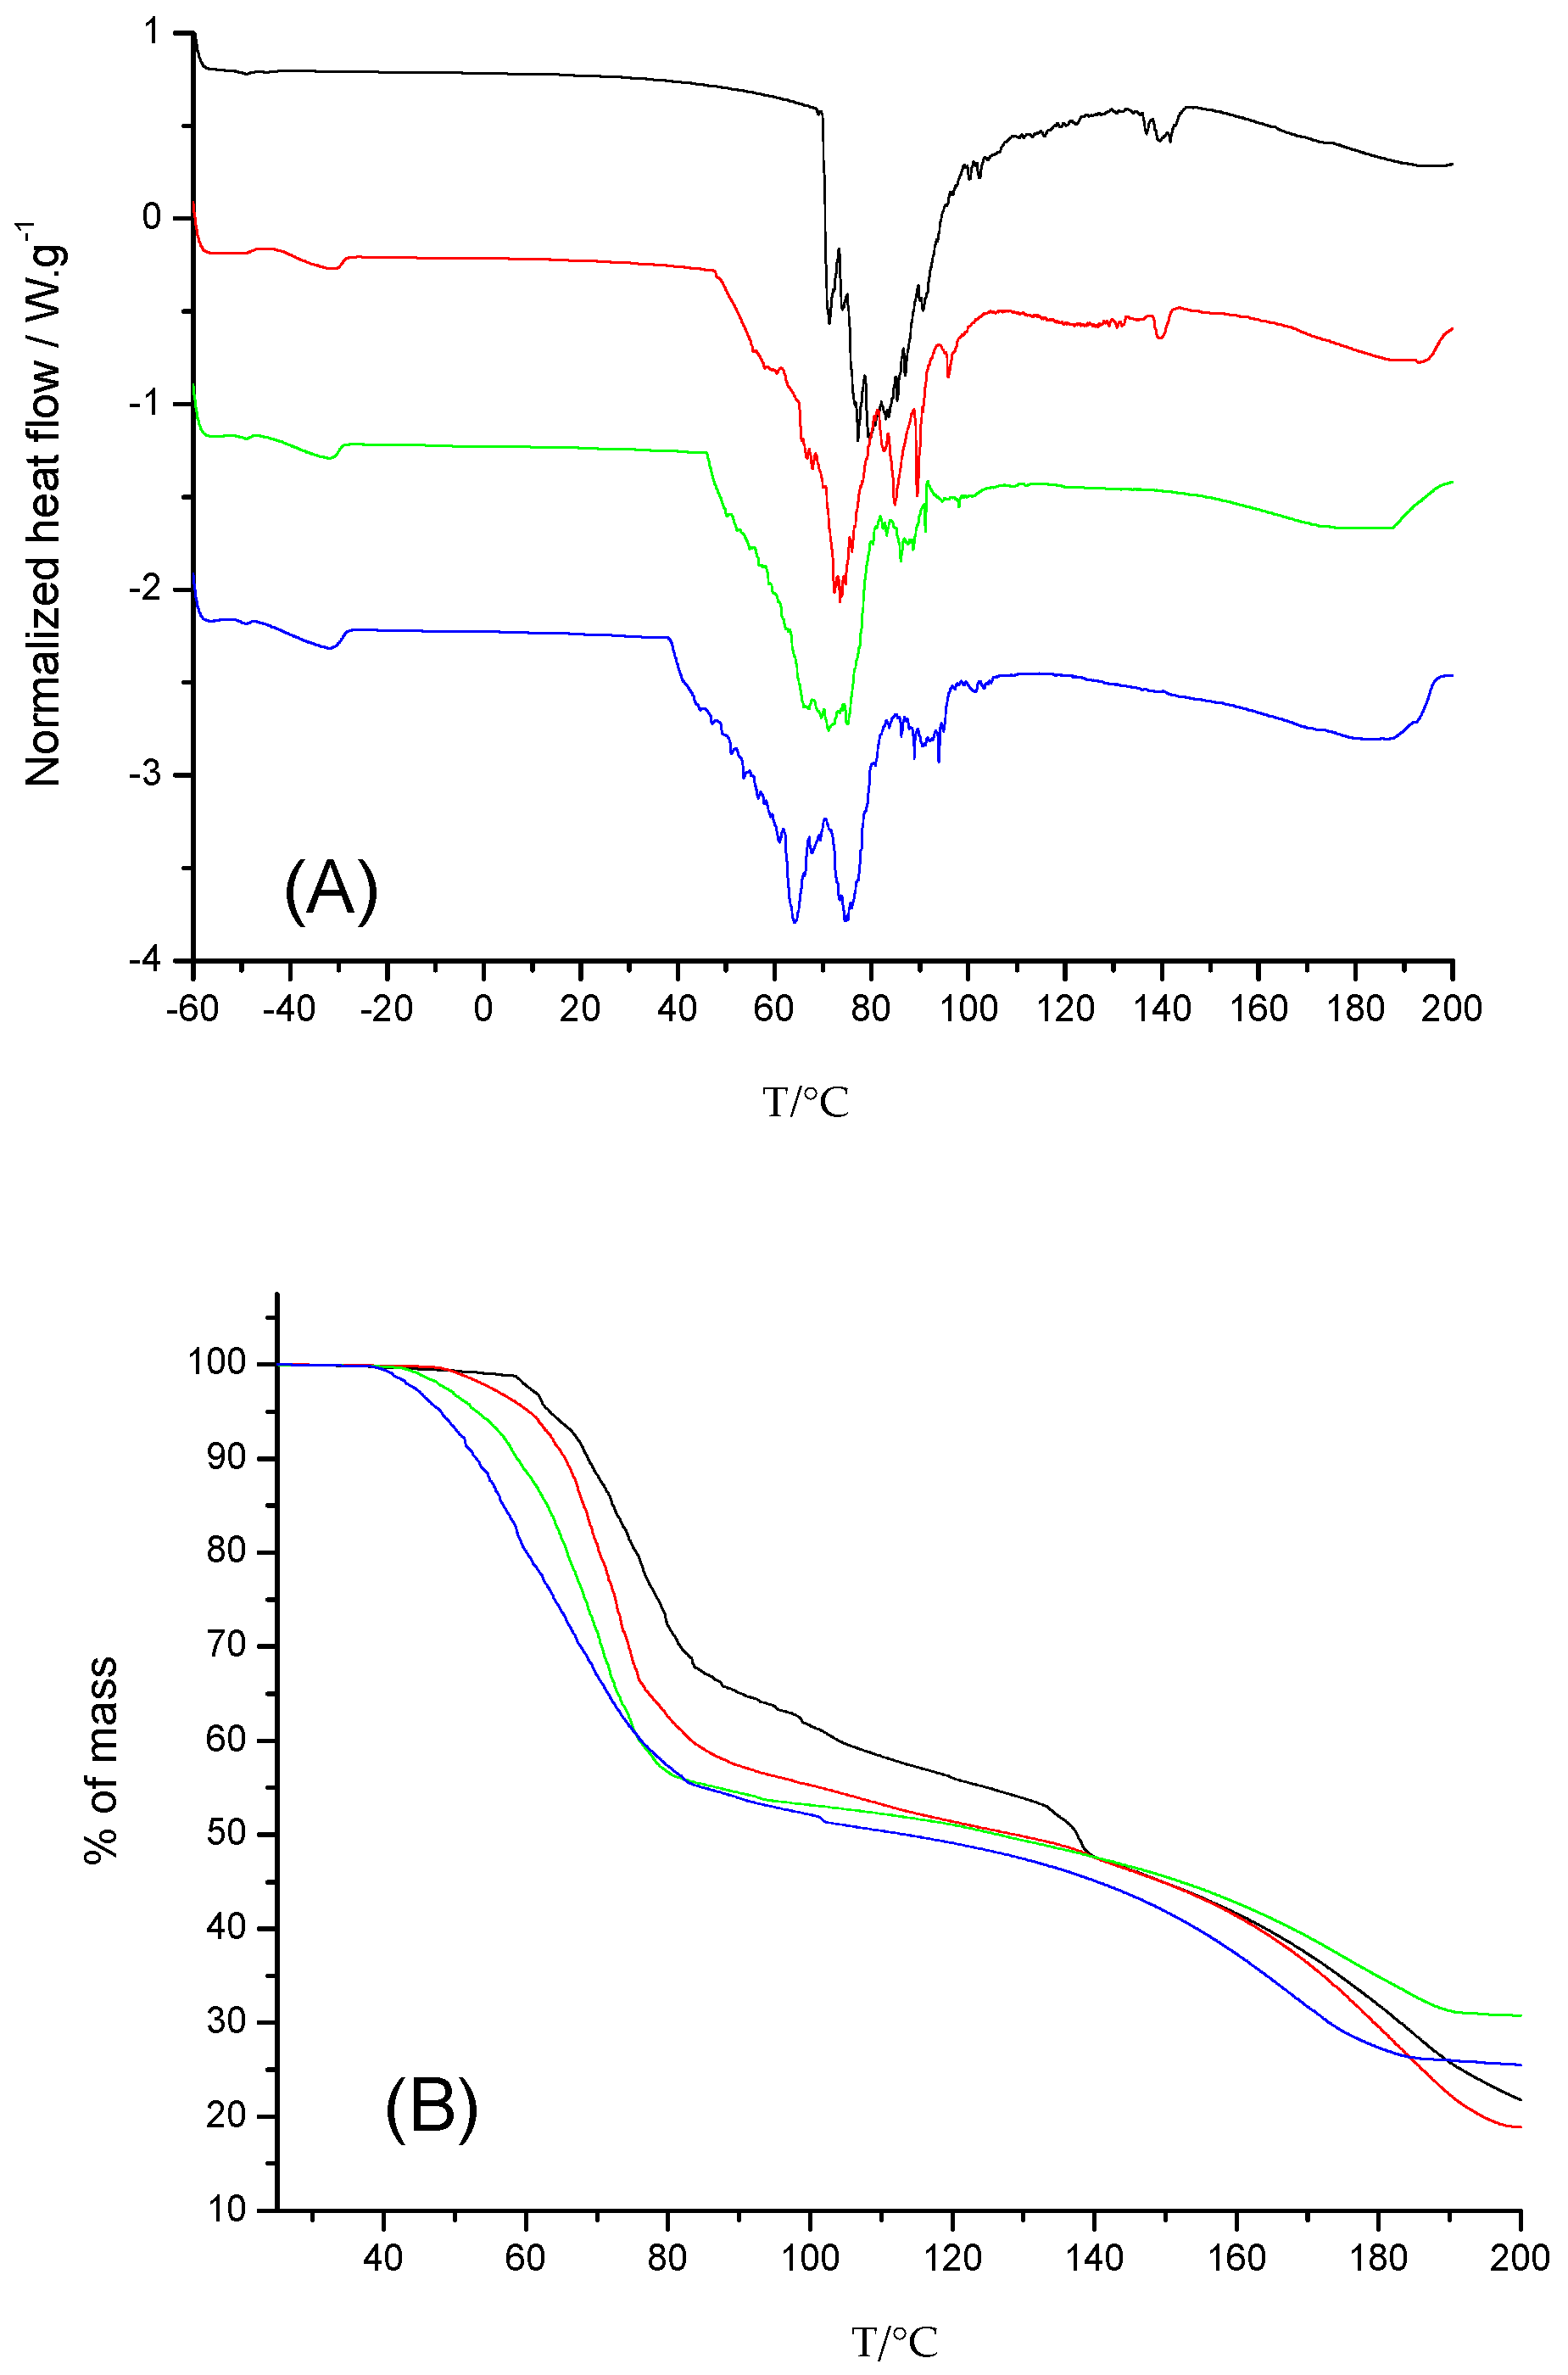
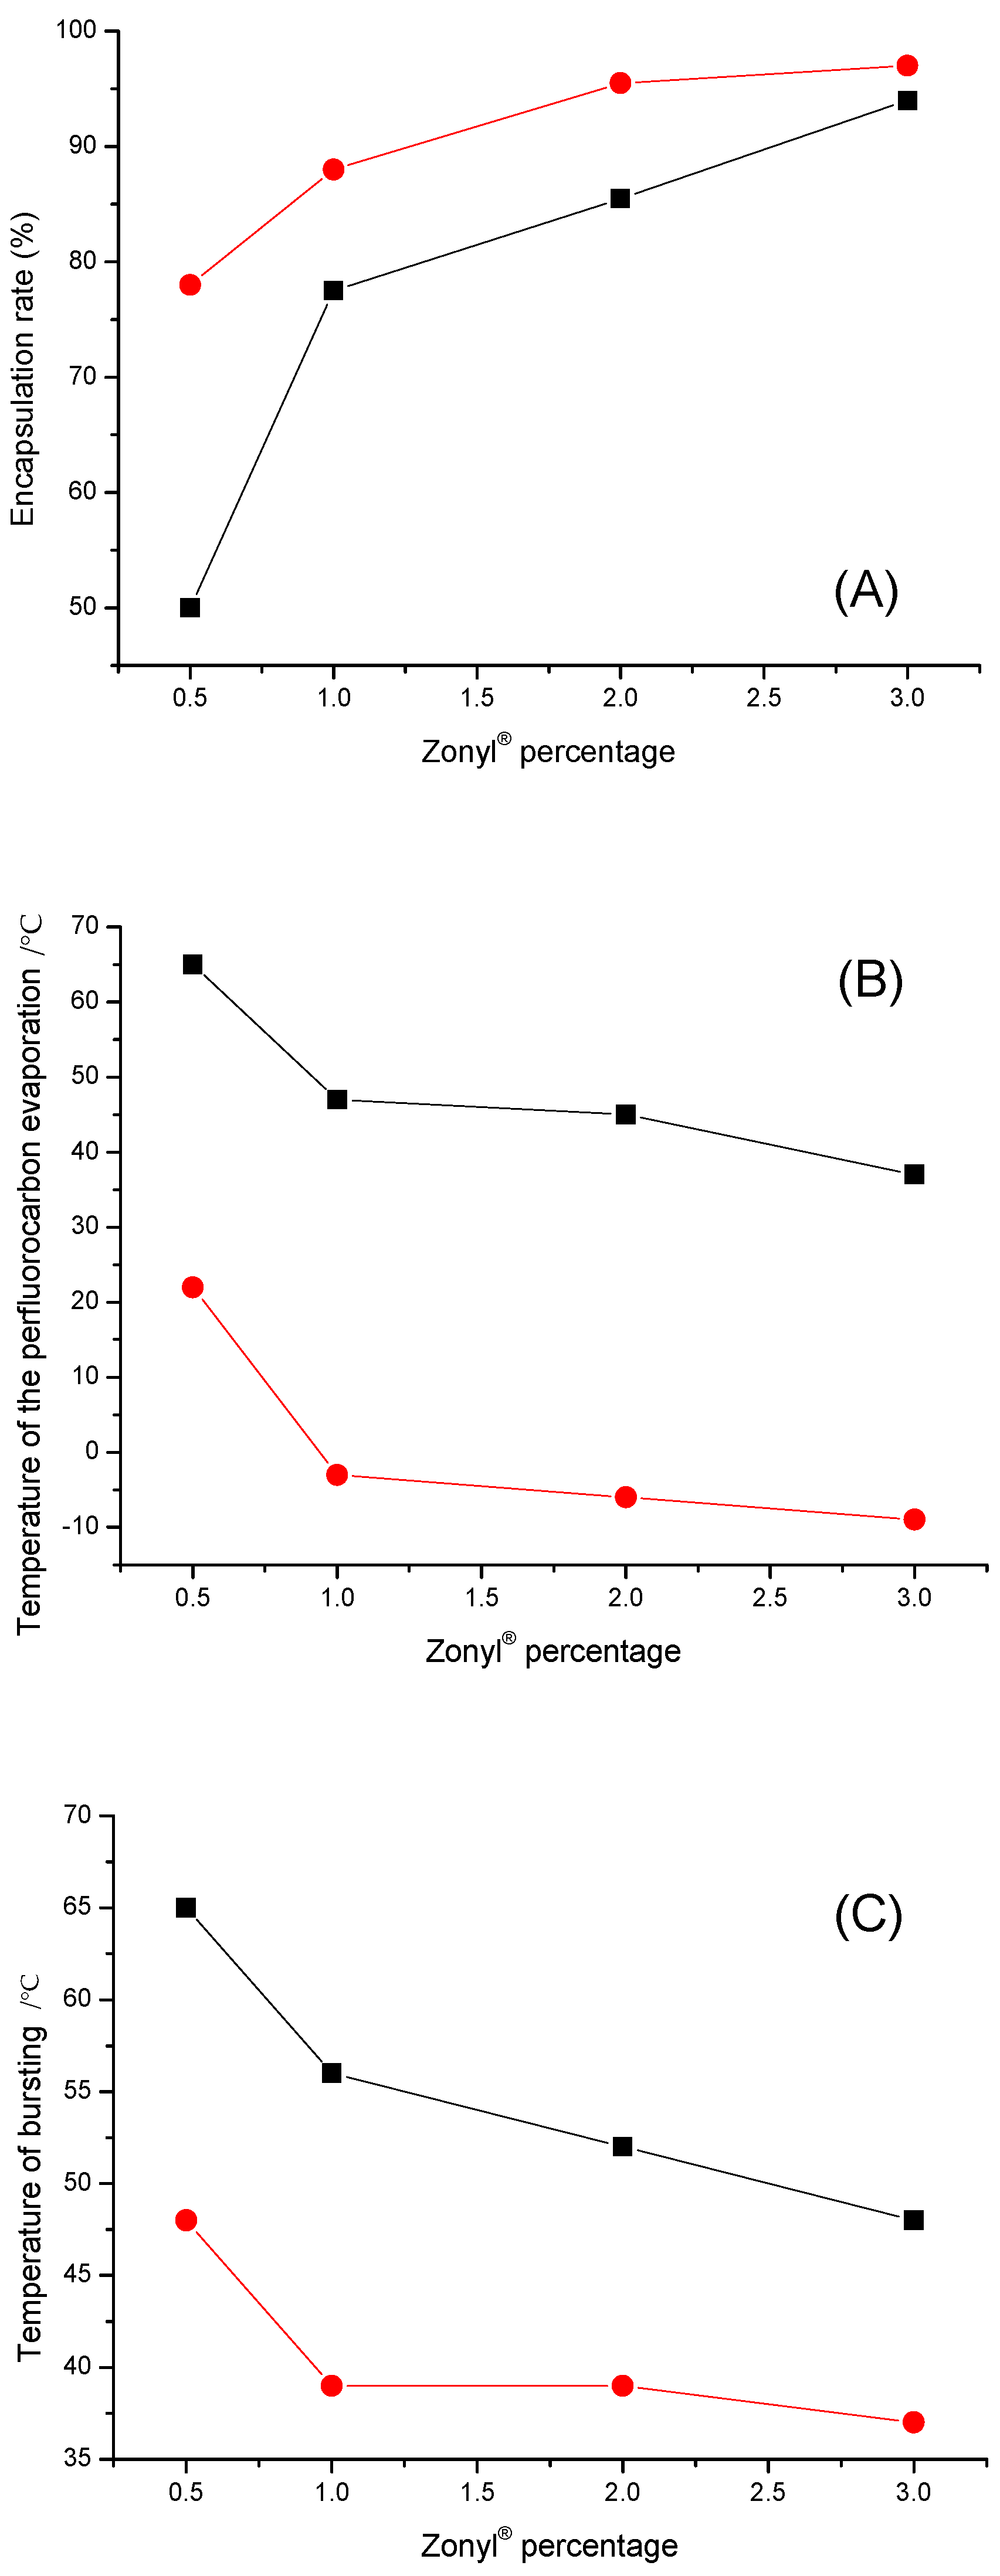
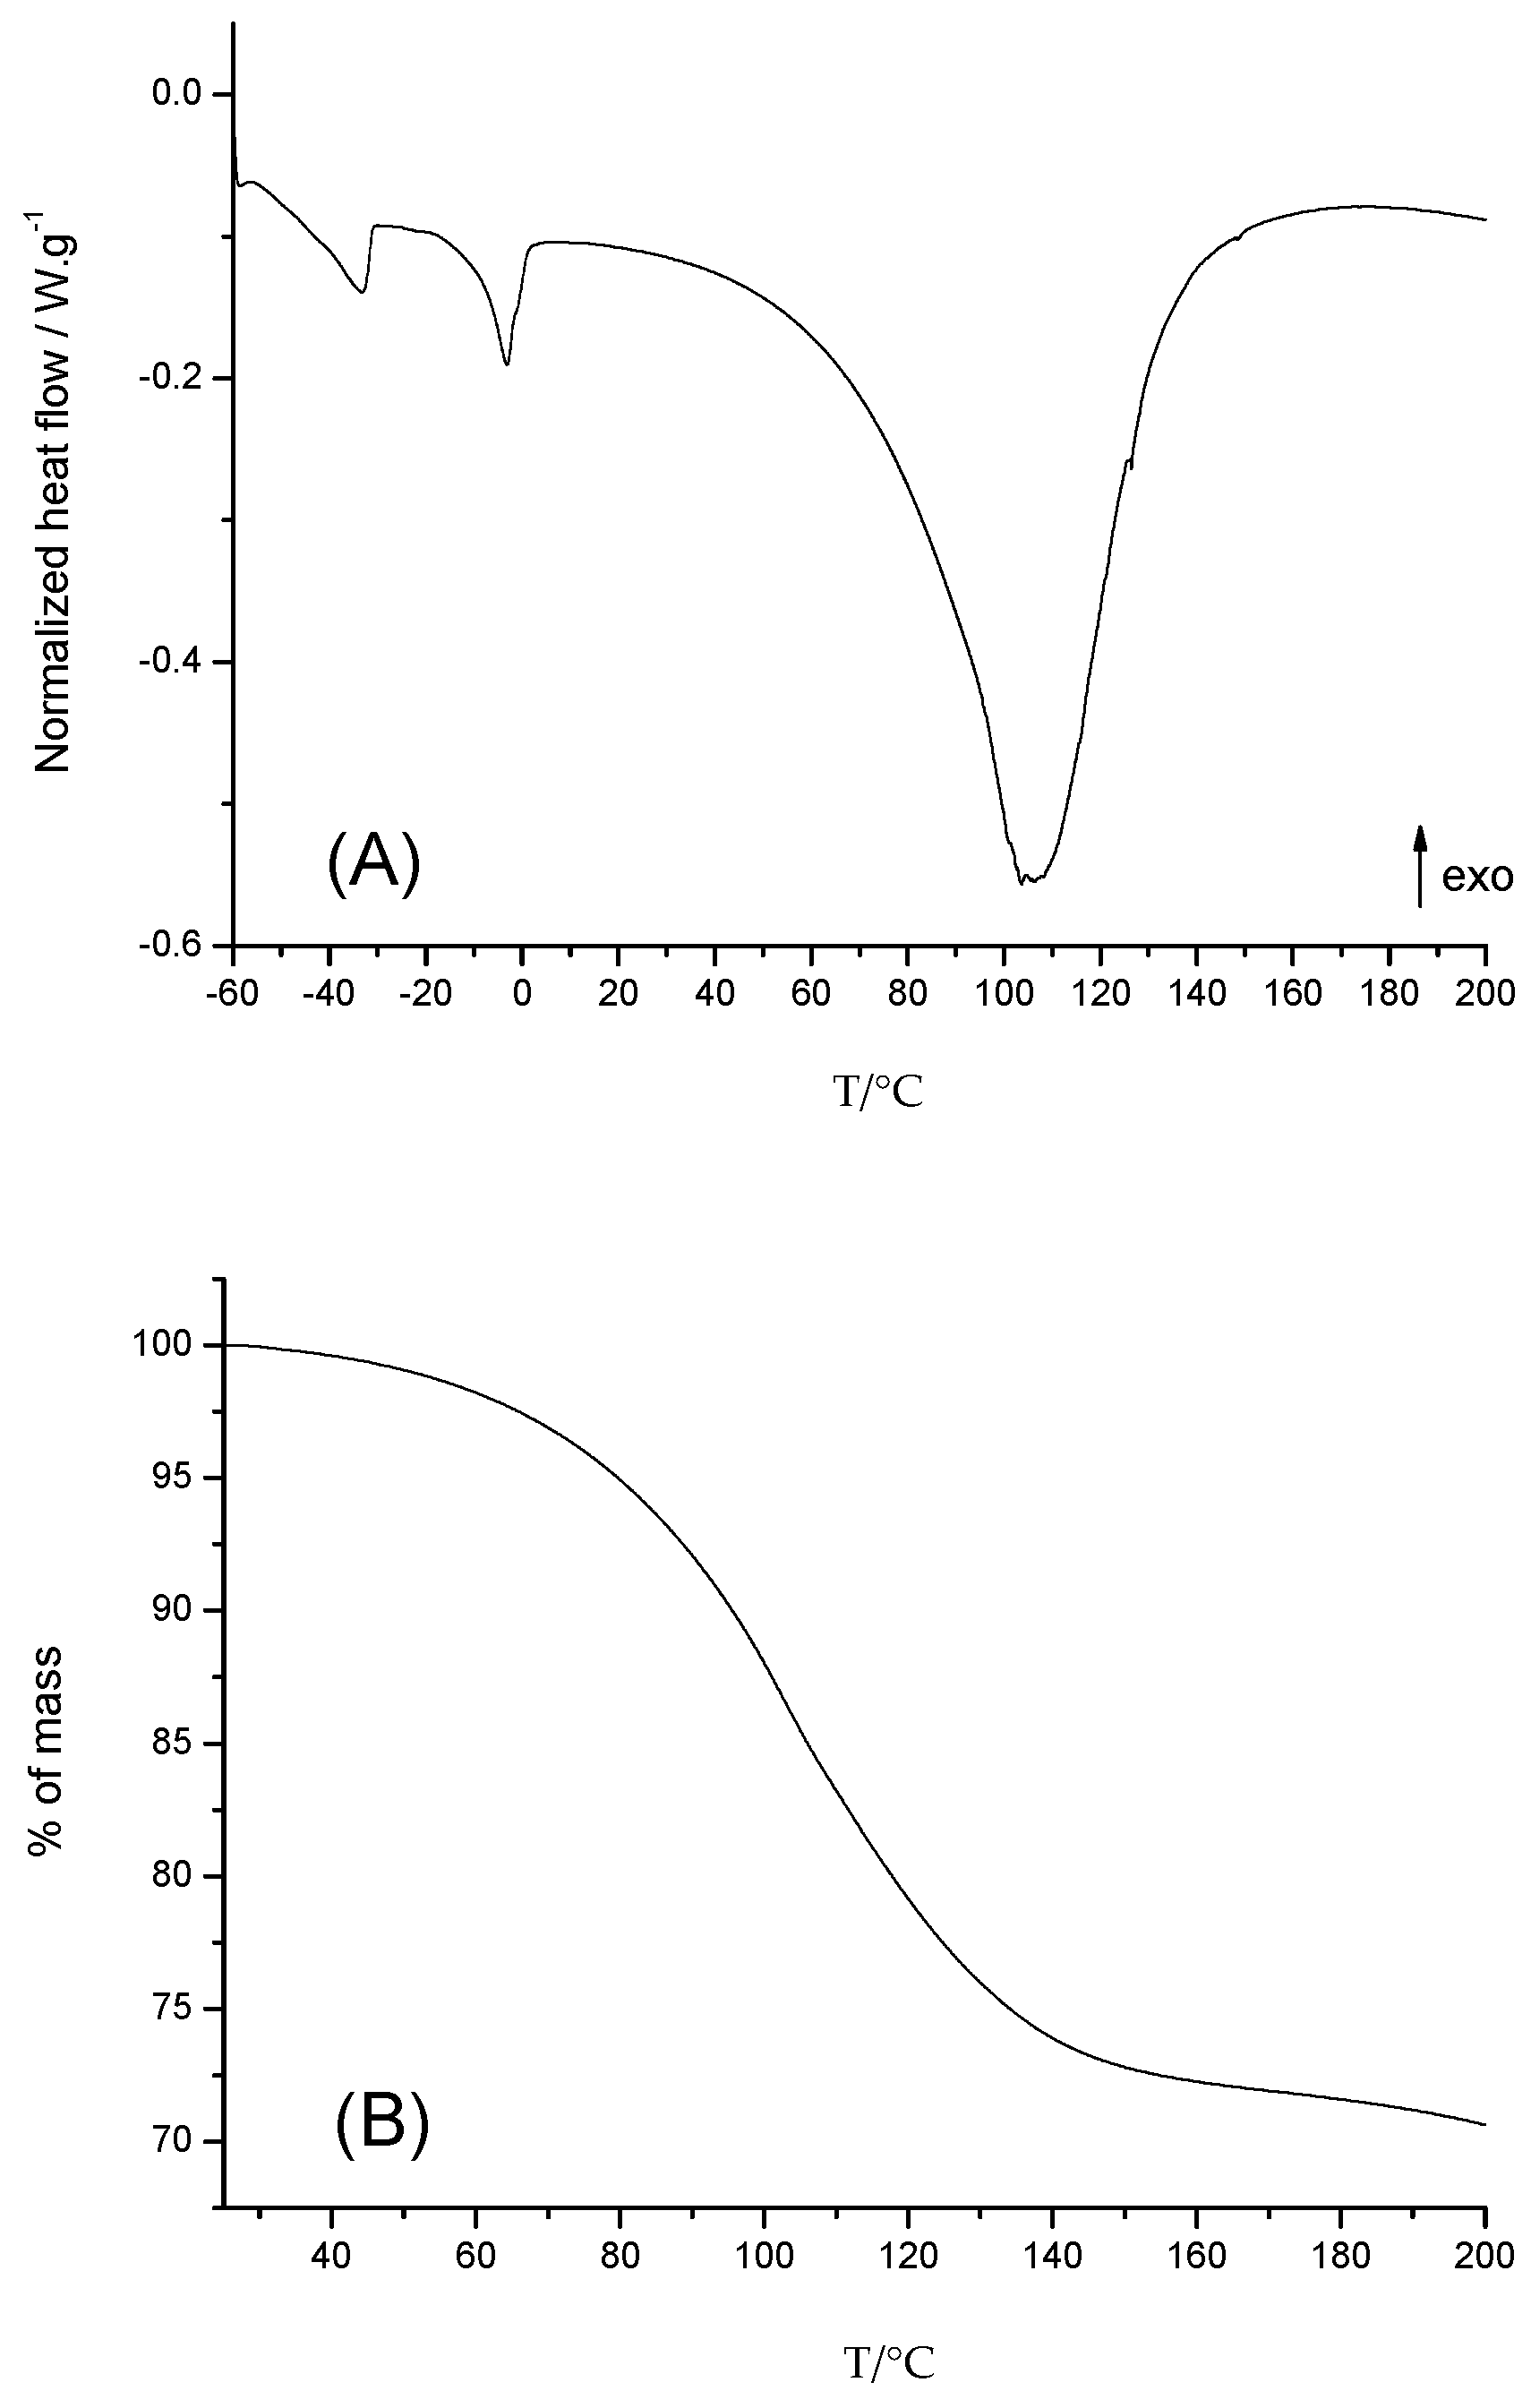
3.2. Characterization of the Microbubbles Using Thermal Analyses

PFH encapsulation rate of the emulsion, as well as its evaporation temperature and the gas-release temperature have been determined by coupling DSC and TGA experiments for emulsions containing 0.5, 1, 2 and 3% of Zonyl®. A broad endothermic signal, starting from 40 °C, was observed for all the formulations with an onset temperature decreasing when the concentration of Zonyl® increases (Figure 2A). Moreover, compared to the controlled emulsions without MCT, this wide endothermic signal is very noisy. This change in thermal behavior is obviously due to the presence of the volatile perfluorocarbon compound in the emulsions. The broad endothermic peak visible on the DSC curves is accompanied by a weight loss of between 40 and 50%, depending on Zonyl® concentration, as presented in TGA curves in Figure 2B. This weight loss may correspond to the loss of encapsulated perfluorohexane after its liquid–gas phase transition but also to water evaporation since all emulsions contained 20% of perfluorocarbon compounds. Moreover, we can assume that at 110 °C all the water is evaporated since TGA experiments carried out with emulsions containing a variable percentage of water (i.e., 25 to 35%) with a constant rate of perfluorocarbon (20%), showing that the change in mass loss varied between 45 and 55%. This allows the conclusion that the weight loss measured in Figure 2B corresponds to the removal of both water and encapsulated perfluorocarbon from the emulsion.
From Figure 2, the PFH evaporation temperature and the bursting temperature of the microbubbles have been determined for all the emulsions and are reported in Table 2. Surprisingly, the PFH encapsulated within the emulsion containing 1, 2 and 3% of Zonyl® is evaporated at lower temperatures than pure PHF (i.e., 57–60 °C) [27,28]. As far as the PFH emulsion with 0.5% of Zonyl® is concerned, the DSC signal corresponding to perfluorocarbon evaporation is close to the signal of the microbubble bursting. According to the DSC analyses (Figure 2A), the evaporation ends at around 110 °C. This allows determining the percentage of encapsulated PFH by subtracting the amount of water initially introduced to the overall weight loss (Table 3).
An observation of the shape of the emulsions upon heating by means of thermal microscopy revealed an expansion of the perfluorocarbon inner phase at approximately 40 °C before bursting (Figure 3). One can therefore correlate the outbreak of the microbubbles to the small endothermic peaks present on the DSC signal, leading to the weight loss highlighted in TGA curves (Figure 2).
Similar experiments have been carried with emulsions containing perfluoropentane in the inner phase.
From the DSC experiments (Figure 4A), the following facts have been deduced:
  • i/ The water/glycerol interactions manifested themselves with endothermic signals from −60 to −30 °C, as obtained with the PFH based emulsions.
  • ii/ The wide peak due to the bursting of microbubbles is noisy but shifted to lower temperatures compared to emulsions containing PFH due to a lower vaporization temperature for PFP.
  • iii/ When Zonyl® concentration increases, the onset evaporation of the gas and the onset bursting temperature of microbubbles decrease as observed for the PFH based emulsions (Table 4). However, the bursting temperature is still higher than pure PFP evaporation temperature (i.e., 29–32 °C) [27,28].
Interestingly, a major difference has to be noticed between the behaviors of the two types of emulsions. Indeed, the DSC curves for PFP show that, before the microbubbles began to burst, an endothermic pre-signal starts at about 0 °C, whereas this phenomenon starts at around 40 °C for PFH. In correlation with the thermal microscopy experiments, this endothermic pre-signal corresponds to the energy absorbed by the microbubbles during their heating. The expansion of the microbubbles during this endothermic phenomenon corresponds to the perfluorocarbon evaporation. In the case of the PFH based emulsions, the latter signal is much less pronounced, even absent for emulsion with 0.5% of Zonyl®. This is due to the fact that the PFH evaporation temperature is close to the bubble-bursting temperature, and for the PFH based emulsion with 0.5% of Zonyl®, the evaporation and the bursting occur at the same time (Figure 2, Table 3).
The rate of perfluoropentane encapsulation has been determined by TGA experiments (Figure 4B). The results are reported in Table 4. For all the formulations, the encapsulation rates are higher for the perfluorohexane based emulsions (Figure 5A). Interestingly, an increasing Zonyl® concentration improved the encapsulation rate, while the temperature of the gas evaporation decreases, as well as the temperature of the microbubble bursting (Figure 5B,C).
To confirm the behavior of the perfluorocarbon based emulsions upon heating, nanoemulsions, for which the inner phase compound was replaced by a non-volatile compound, were formulated. For that, medium-chain triglycerides (MCT) were used since this compound is known to be used in self-emulsifying stable emulsions [29,30]. Consequently, only the interactions between the components of the shell can be studied. On the DSC curve of MCT droplets formulated with 2% of Zonyl®, three endothermic signals were observed; the first one at −60 °C, the second one at 0 °C and an important endothermic signal with a peak position at 100 °C (Figure 6A). TGA experiments coupled with the latter DSC experiment (Figure 6B) showed that a weight loss of 30% is monitored at the same time as the endothermic event 100 °C. This weight loss corresponds to the water content in the emulsion. Moreover, whatever the concentration of Zonyl® in the formulation, the same onset temperature was found for the water evaporation.
To identify the phenomenon corresponding to each signal of the DSC curve, we assumed that some components of the emulsion interact more specifically with others. Binary mixtures between the main components of the control emulsion (glycerin, MCT and water) were thus prepared the same way as the perfluorocarbon emulsions and then analyzed by DSC. As a result, one can attribute the endothermic signal between −60 °C and −40 °C to the crossing of a two-phase domain of the glycerin/water eutectic system [31,32]. The endothermic peak near 0 °C is linked to the interaction between MCT and glycerin since this signal disappears when MCT is replaced by the perfluorocarbon compounds. The DSC experiment carried out on the MCT/water mixtures revealed no interaction between those two constituents.
The study of the MCT based model emulsions allows a better understanding of the perfluorocarbon based emulsions. As a matter of fact, the broad endothermic peak monitored at −60 °C could also be related to the interaction between water and glycerin in the PFH emulsions (Figure 2A).

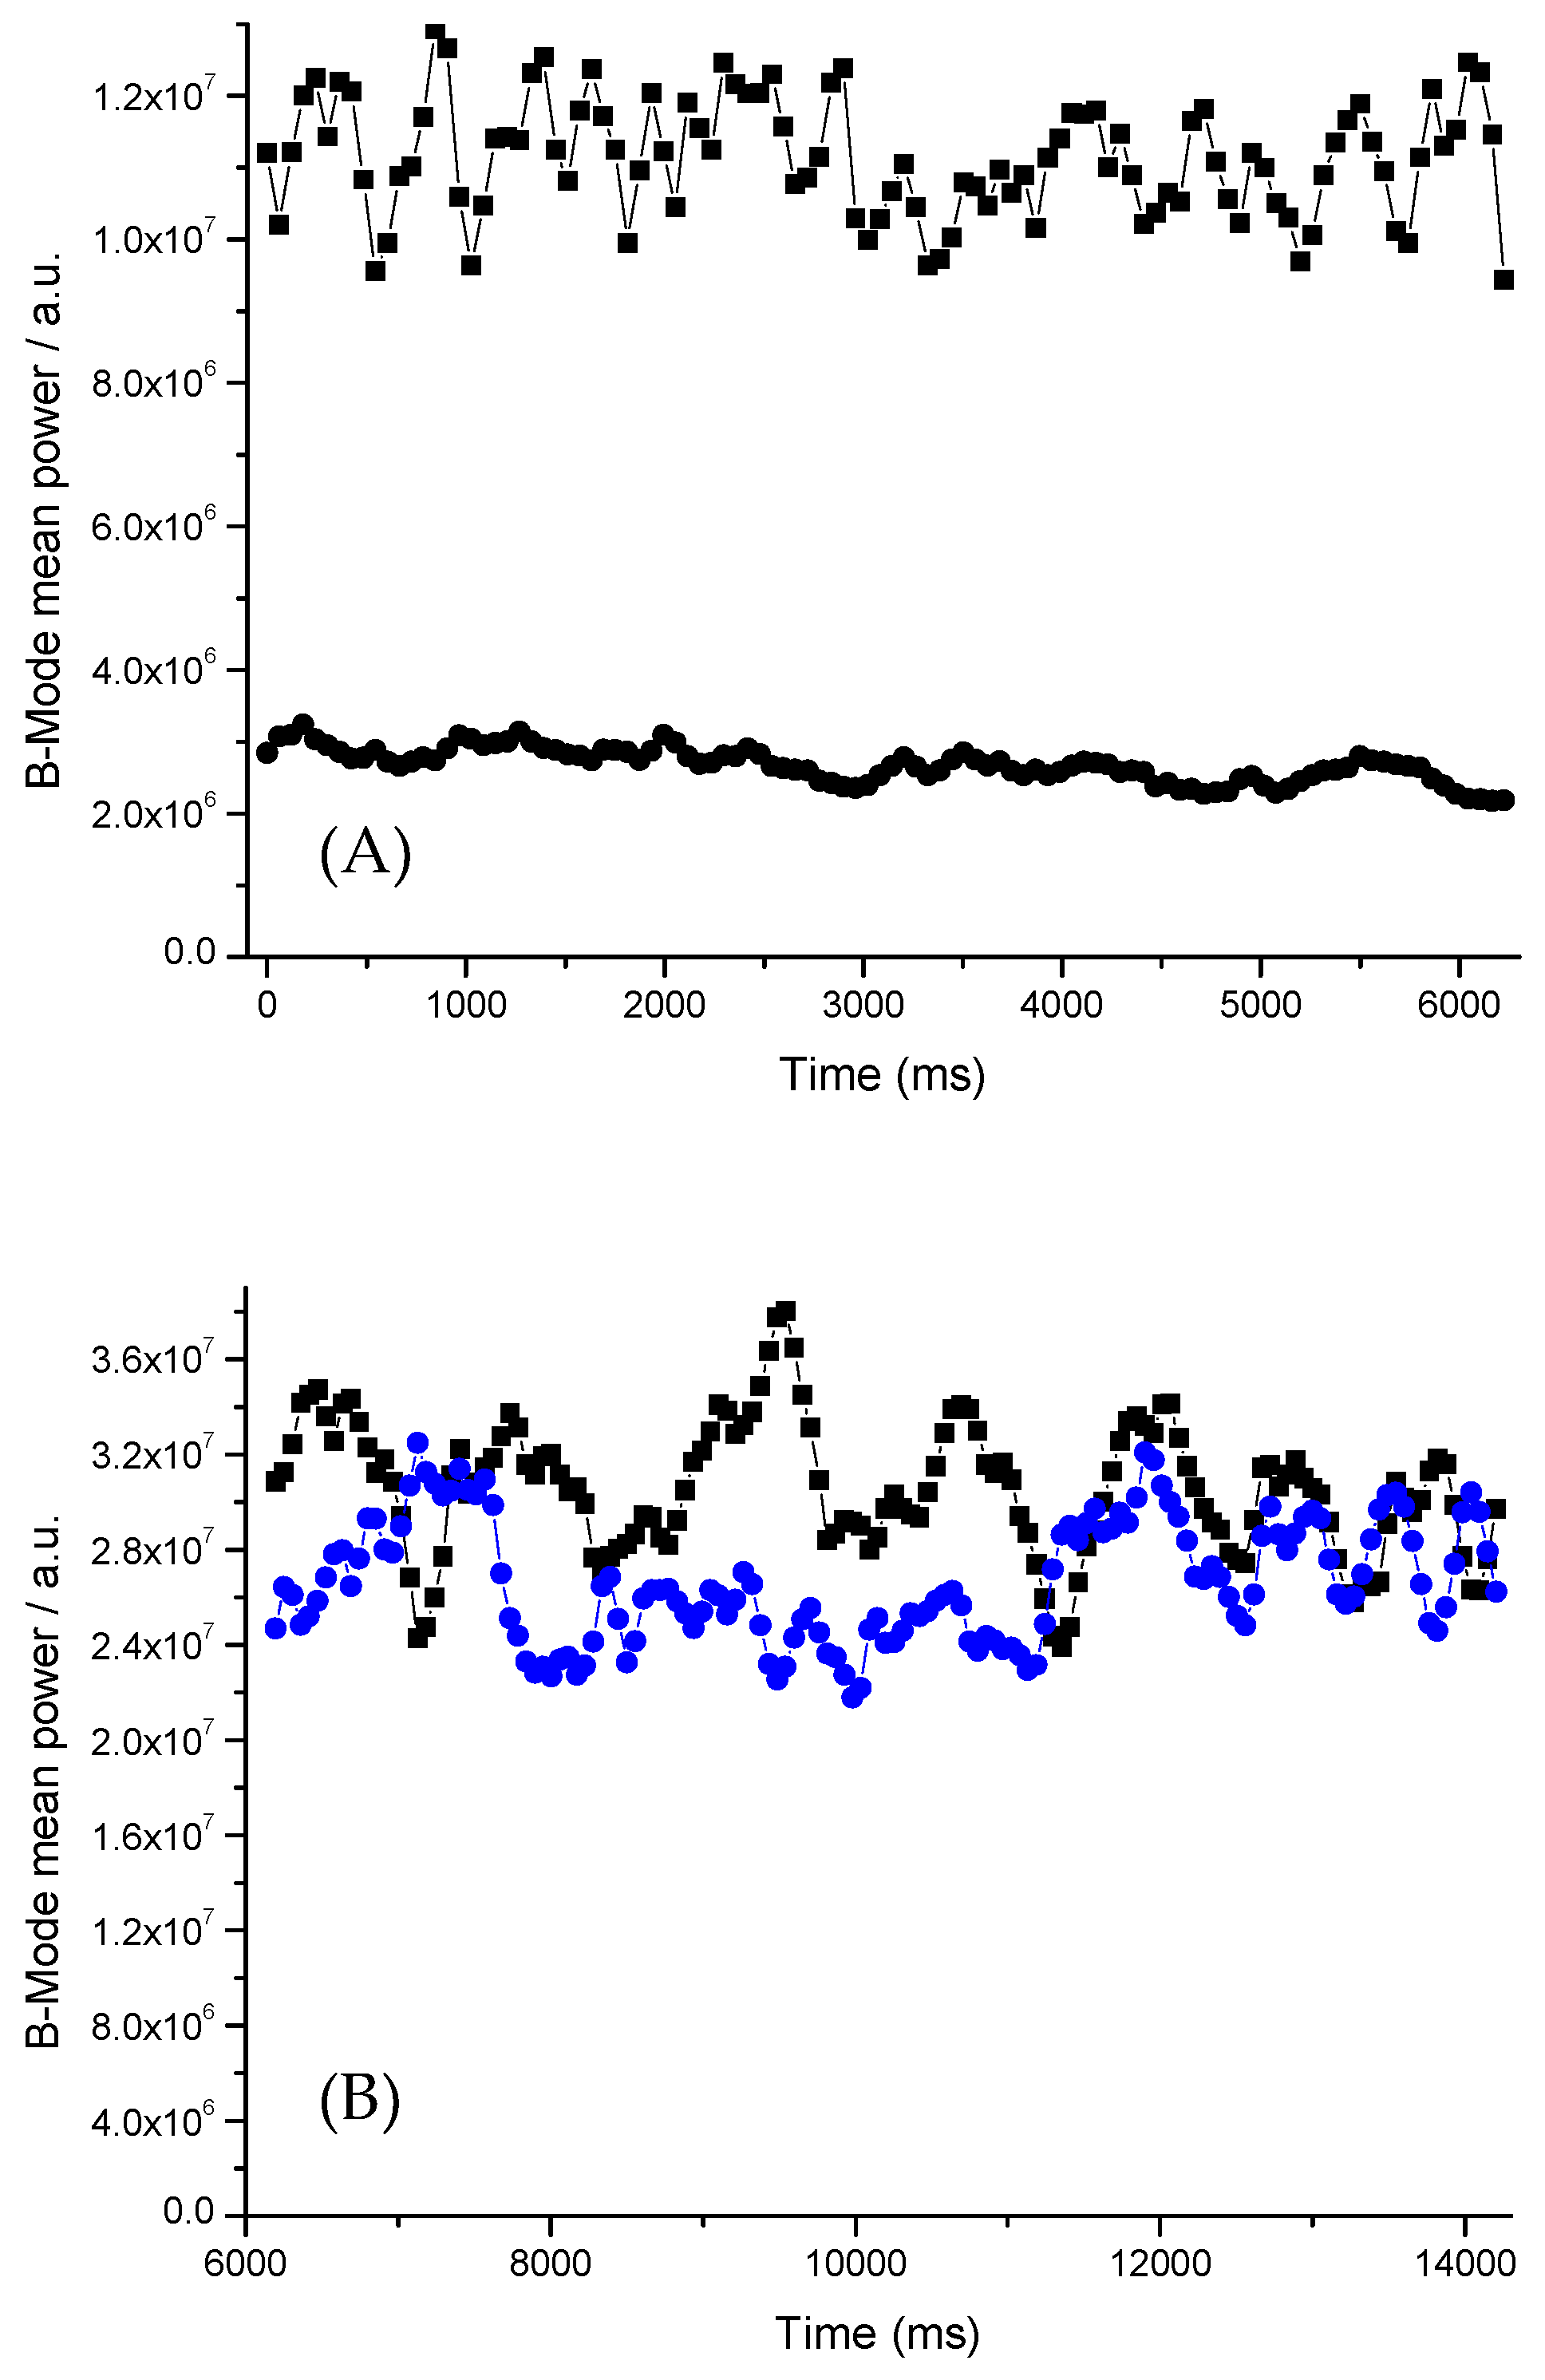
3.3. In Vitro Evaluation of Echogenicity of the Emulsion

The ultrasound contrast effect of PFP or PFH based emulsions has been assessed at room temperature, varying the Zonyl® concentration. From the ultrasound image sequence measurements, the PFH based emulsion with 0.5% of Zonyl® has been found to be the emulsion providing the best contrast at this temperature. For comparison, the contrast mean power in B-Mode obtained for emulsions containing PFH with 0.5 and 1% of Zonyl® is presented in Figure 7. As can be seen, the contrast in the B-Mode is 4.1 times higher for the emulsion containing 0.5% of Zonyl®. For PFP evaluation, the Zonly® concentration providing the best contrast was kept as reference. PFP showed an almost equivalent echogenicity in B mode, as compared to 0.5% Zonyl®–PFH preparation (32% increase in B mode mean power).
When heated at 37 °C, the PFH based emulsion containing 0.5% of Zonyl® is compared to the PFP based one (Figure 7). As observed, the contrast is approximately similar for the two emulsions. This similarity can be explained by the number of microbubbles, which is the same for the two emulsions with perfluorocarbon. However, the contrast of the PFH emulsion is slightly better than the PFP emulsion, probably due to a lower bursting temperature for the latter. It is noteworthy that the ultrasound signals are better at 37 °C compared to the one obtained at room temperature. This result can be explained by the fact that, at 37 °C, gas evaporation is more important, and the bursting is still limited.

4. Conclusions

The influence of the fluorinated surfactant in the formulation has been successfully evaluated in the present study by thermal analysis methods. Indeed, it has been proved that the evaporation temperature of the perfluorocarbon inner phase decreases when Zonyl® concentration increases, leading to lower ultrasound contrast. Nevertheless, an increase in the concentration of Zonyl® increases the percentage of encapsulation of the perfluorocarbon liquids. Consequently, the ideal content of Zonyl® has been evaluated at 0.5% in order to optimize both the stability and efficiency of encapsulation for the emulsion colloidal systems. Moreover, the emulsions prepared with perfluorohexane present slightly higher in vitro ultrasound contrast than that with perfluoropentane due to the higher boiling point for the former perfluorocarbon. We prove here that thermal analysis is a useful method for the pre-formulation of perfluorocarbon oil/water emulsions. However, further in vivo experiments should be performed to confirm these results.

Author Contributions

Conceptualization, S.C.-M. and P.E.; methodology, S.C.-M. and P.E.; validation, N.M., P.E., Y.C. and G.R.; formal analysis, F.R., M.-T.T., Y.C.; investigation, M.-T.T., Y.C.; writing—original draft preparation, S.C.-M., Y.C. and P.E. All authors have read and agreed to the published version of the manuscript.

Funding

This research received no external funding.

Institutional Review Board Statement

Not applicable.

Informed Consent Statement

Informed consent was obtained from all subjects.

Data Availability Statement

Not applicable.

Acknowledgments

The authors would like to thank Simona Manta and Caroline Auvray for their help with the microbubble formulations.

Conflicts of Interest

The authors declare no conflict of interest.

References

  1. Gramiak, R.; Shah, P.M. Echocardiography of the aortic root. Investig. Radiol. 1968, 3, 356–366. [Google Scholar] [CrossRef]
  2. Quaia, E. Microbubble ultrasound contrast agents: An update. Eur. Radiol. 2007, 17, 1995–2008. [Google Scholar] [CrossRef] [PubMed]
  3. Holman, R.; Lorton, O.; Guillemin, P.C.; Desgranges, S.; Contino-Pépin, C.; Salomir, R. Perfluorocarbon emulsion contrast agents: A mini review. Front. Chem. 2022, 9, 810029. [Google Scholar] [CrossRef] [PubMed]
  4. Hernot, S.; Klibanov, A.L. Microbubbles in ultrasound-triggered drug and gene delivery. Adv. Drug Deliv. Rev. 2008, 60, 1153–1166. [Google Scholar] [CrossRef] [PubMed] [Green Version]
  5. Fabiilli, M.L.; Haworth, K.J.; Sebastian, I.E.; Kripfgans, O.D.; Carson, P.L.; Fowlkes, J.B. Delivery of chlorambucil using an acoustically-triggered perfluoropentane emulsion. Ultrasound Med. Biol. 2010, 36, 1364–1375. [Google Scholar] [CrossRef] [PubMed] [Green Version]
  6. Fang, J.-Y.; Hung, C.-F.; Hua, S.-C.; Hwang, T.-L. Acoustically active perfluorocarbon nanoemulsions as drug delivery carriers for camptothecin: Drug release and cytotoxicity against cancer cells. Ultrasonics 2009, 49, 39–46. [Google Scholar] [CrossRef]
  7. Unger, E.C.; Porter, T.; Culp, W.; Labell, R.; Matsunaga, T.; Zutshi, R. Therapeutic applications of lipid-coated microbubbles. Adv. Drug Deliv. Rev. 2004, 56, 1291–1314. [Google Scholar] [CrossRef] [PubMed]
  8. Corvis, Y.; Manta, S.; Thebault, C.; Couture, O.; Dhotel, H.; Michel, J.-P.; Seguin, J.; Bessodes, M.; Espeau, P.; Pichon, C.; et al. Novel perfluorinated triblock amphiphilic copolymers for lipid-shelled microbubble stabilization. Langmuir 2018, 34, 9744–9753. [Google Scholar] [CrossRef]
  9. Rapoport, N.; Nam, K.-H.; Gupta, R.; Gao, Z.; Mohan, P.; Payne, A.; Todd, N.; Liu, X.; Kim, T.; Shea, J.; et al. Ultrasound-mediated tumor imaging and nanotherapy using drug loaded block copolymer stabilized perfluorocarbon nanoemulsion. J. Control. Release 2011, 153, 4–15. [Google Scholar] [CrossRef] [Green Version]
  10. Dwivedi, P.; Kiran, S.; Han, S.; Dwivedi, M.; Khatik, R.; Fan, R.; Mangrio, F.A.; Du, K.; Zhu, Z.; Yang, C.; et al. Magnetic Targeting and Ultrasound activation of liposome-microbubble conjugate for enhanced delivery of anticancer therapies. ACS Appl. Mater. Interfaces 2020, 12, 23737–23751. [Google Scholar] [CrossRef] [PubMed]
  11. Snipstad, S.; Vikedal, K.; Maardalen, M.; Kurbatskaya, A.; Sulheim, E.; de Lange Davies, C. Ultrasound and microbubbles to beat barriers in tumors: Improving delivery of nanomedicine. Adv. Drug Deliv. Rev. 2021, 117, 113847. [Google Scholar] [CrossRef] [PubMed]
  12. De Jong, N.; Bouakaz, A.; Frinkerg, P. Basic acoustic properties of microbubbles. Echocardiography 2002, 19, 229–240. [Google Scholar] [CrossRef] [PubMed]
  13. Pouton, C.W. Formulation of self-emulsifying drug delivery systems. Adv. Drug Deliv. Rev. 1997, 25, 47–58. [Google Scholar] [CrossRef]
  14. Holtze, C.; Rowat, A.C.; Agresti, J.J.; Hutchison, J.B.; Angilè, F.E.; Schmitz, C.H.J.; Köster, S.; Duan, H.; Humphry, K.J.; Scanga, R.A.; et al. Biocompatible surfactants for water-in-fluorocarbon emulsions. Lab Chip 2008, 8, 1632–1639. [Google Scholar] [CrossRef] [PubMed]
  15. Clausse, D.; Gomez, F.; Pesron, I.; Komunjer, L.; Dalmazzone, C. Morphology characterization of emulsions by differential scanning calorimetry. Adv. Colloid Interface Sci. 2005, 117, 59–74. [Google Scholar] [CrossRef] [PubMed]
  16. Gupta, S.; Chavhan, S.; Sawant, K.K. Self-nanoemulsifying drug delivery system for adefovir dipivoxil: Design characterization in vitro and ex vivo evaluation. Colloids Surf. A 2011, 392, 145–155. [Google Scholar] [CrossRef]
  17. Castelli, F.; Puglia, C.; Grazia Sarpietro, M.; Rizza, L.; Bonina, F. Characterization of indomethacin-loaded lipid nanoparticles by differential scanning calorimetry. Int. J. Pharm. 2005, 304, 231–238. [Google Scholar] [CrossRef]
  18. Jia, L.; Shen, J.; Zhang, D.; Duan, C.; Liu, G.; Zheng, D.; Tian, X.; Liu, Y.; Zhang, Q. In vitro and in vivo evaluation of oridonin-loaded long circulating nanostructured lipid carriers. Int. J. Biol. Macromol. 2012, 50, 523–529. [Google Scholar] [CrossRef]
  19. Sigward, E.; Mignet, N.; Rat, P.; Dutot, M.; Muhamed, S.; Guigner, J.-M.; Scherman, D.; Brossard, D.; Crauste-Manciet, S. Formulation and cytotoxicity evaluation of new self-emulsifying multiple W/O/W nanoemulsions. Int. J. Nanomed. 2013, 8, 611–625. [Google Scholar]
  20. Krishna, G.; Sheth, B.B. A novel self emulsifying parenteral drug delivery system. PDA J. Pharm. Sci. Technol. 1999, 53, 168–176. [Google Scholar]
  21. Zhang, D. Handbook of Pharmaceutical Excipients, 6th ed.; Rowe, R.C., Sheskey, P.J., Quinn, M.E., Eds.; Pharmaceutical Press: London, UK, 2009. [Google Scholar]
  22. Sigward, E.; Corvis, Y.; Doan, B.-T.; Kindisko, K.; Seguin, J.; Scherman, D.; Brossard, D.; Mignet, N.; Espeau, P.; Crauste-Manciet, S. Preparation and Evaluation of Multiple Nanoemulsions Containing Gadolinium (III) Chelate as a Potential Magnetic Resonance Imaging (MRI) Contrast Agent. Pharm. Res. 2015, 32, 2983–2994. [Google Scholar] [CrossRef] [PubMed]
  23. Melich, R.; Valour, J.-P.; Urbaniak, S.; Padilla, F.; Charcosset, C. Preparation and characterization of perfluorocarbon microbubbles using Shirasu Porous Glass (SPG) membranes. Colloids Surf. Physicochem. Eng. Asp. 2019, 560, 233–243. [Google Scholar] [CrossRef]
  24. Manta, S.; Bessodes, M.; Bureau, M.-F.; Scherman, D.; Delalande, A.; Pichon, C.; Mignet, N. Characterization of positively charged lipid shell microbubbles with tunable resistive pulse sensing (TRPS) method: A technical note. Ultrasound Med. Biol. 2016, 42, 624–630. [Google Scholar] [CrossRef]
  25. Kang, S.-T.; Yeh, C.-K. Ultrasound Microbubble Contrast Agents for Diagnostic and Therapeutic Applications: Current Status and Future Design. Chang Gung Med. J. 2012, 35, 125–139. [Google Scholar]
  26. Podell, S.; Burrascano, C.; Gaal, M.; Golec, B.; Maniquis, J.; Mehlhaff, P. Physical and biochemical stability of Optison®, an injectable ultrasound contrast agent. Biotechnol. Appl. Biochem. 1999, 30, 213–223. [Google Scholar] [PubMed]
  27. Varshni, Y.P. Critical temperatures of organic compounds from their boiling points. Phys. Chem. Liq. 2009, 47, 383–398. [Google Scholar] [CrossRef]
  28. Postelnek, W. Boiling points of normal perfluoroalkanes. J. Phys. Chem. 1959, 63, 746–747. [Google Scholar] [CrossRef]
  29. Saberi, A.H.; Fang, Y.; McClements, D.J. Fabrication of vitamin E-enriched nanoemulsions: Factors affecting particle size using spontaneous emulsification. J. Colloid Interface Sci. 2013, 391, 95–102. [Google Scholar] [CrossRef]
  30. Schuh, R.S.; Bruxel, F.; Teixeira, H.F. Physicochemical properties of lecithin-based nanoemulsions obtained by spontaneous emulsification or high-pressure homogenization. Quím. Nova 2014, 37, 1193–1198. [Google Scholar]
  31. Miner, C.S.; Dalton, N.N. Glycerol, 1st ed.; Reinhold Publishing Corp.: New York, NY, USA, 1953. [Google Scholar]
  32. Leffingwell, G.; Lesser, M.A. Glycerin: Its Industrial and Commercial Applications, 1st ed.; Chemical Publishing Co., Inc.: New York, NY, USA, 1945. [Google Scholar]
Figure 1. Representative picture of the droplets prepared with rhodamine-labelled Zonyl® using fluorescence microscopy at room temperature.
Colloids 06 00021 g001
Figure 2. DSC (A) and TGA (B) curves obtained for PFH based emulsions prepared with 0.5 (black), 1 (red), 2 (green), and 3% (blue) of Zonyl®.
Colloids 06 00021 g002
Figure 3. Images of the PFH emulsion with 1% of Zonyl® recorded as a function of the temperature.
Colloids 06 00021 g003
Figure 4. DSC (A) and TGA (B) curves obtained for PFP based emulsions prepared with 0.5 (black), 1 (red), 2 (green) and 3% (blue) of Zonyl®.
Colloids 06 00021 g004
Figure 5. Evolution of encapsulation rate (A), perfluorocarbon temperature of evaporation (B), and temperature of bursting (C) as a function of Zonyl® concentration for perfluorohexane (■) and perfluoropentane () based emulsions.
Colloids 06 00021 g005
Figure 6. DSC (A) and TGA (B) curves obtained for the MCT based emulsion prepared with 2% of Zonyl®.
Colloids 06 00021 g006
Figure 7. Contrast in the ultrasound B-Mode as function of time. (A) PFH base emulsions with 0.5% (■) and 1% (●) of Zonyl® at room temperature. (B) 0.5% Zonyl® PFH (■) and PFP () based emulsions at 37 °C.
Colloids 06 00021 g007
Table 1. Composition of emulsions in %.
PFH EmulsionPFP EmulsionControl Emulsion
Perfluorohexane20--
Perfluoropentane-20-
Medium chain triglyceride--20
Sorbitan monooleate (Span 80)111
Polysorbate 85101010
Poloxamer 188111
Water303030
Zonyl®0.5;1;2;30.5;1;2;30.5;1;2;3
Glycerol qs 100100100
Table 2. Average number of droplets per milliliter and the diameter measured by optical microscopy and the corresponding mean diameter measured by Mastersizer® for a given composition of the emulsion at 25 °C.
Perfluorohexane/Water
Emulsions
Perfluoropentane/Water
Emulsions
% of Zonyl®1%2%3%1%2%3%
Mean diameter (µm)2.4 ± 0.42.0 ± 0.32.0 ± 0.11.9 ± 0.12.1 ± 0.11.9 ± 0.1
DV50 (µm)3.6 ± 0.62.8 ± 0.52.3 ± 0.32.4 ± 0.32.2 ± 0.71.9 ± 0.2
Number of droplets/mL7.6 × 1077.1 × 1077.1 × 1078.7 × 1078.0 × 10710.0 × 107
Table 3. Mass percentage, onset evaporation temperature, and onset bubble bursting temperature of encapsulated PFH as a function of Zonyl® concentration.
Zonyl (%)Encapsulated PFH (%)Onset PFH
Evaporation Temperature (°C)
Onset PFH
Bursting Temperature (°C)
0.5506565
177.54756
285.54552
3943748
Table 4. Mass percentage, onset evaporation temperature, and onset microbubble bursting temperature of encapsulated PFP as a function of Zonyl® concentration.
Zonyl® (%)Encapsulated PFP
(%)
Onset PFP
Evaporation Temperature (°C)
Onset PFP
Bursting Temperature (°C)
0.5782248
188−339
295.5−639
397−937
Publisher’s Note: MDPI stays neutral with regard to jurisdictional claims in published maps and institutional affiliations.

