Impact of Aggressive Media on the Properties of Polymeric Coatings with Solidification Products as Fillers


Faculty of Civil Engineering, Brno University of Technology, 602 00 Brno, Czech Republic
*
Author to whom correspondence should be addressed.
Coatings 2019, 9(12), 793; https://doi.org/10.3390/coatings9120793
Submission received: 9 October 2019
/
Revised: 17 November 2019
/
Accepted: 22 November 2019
/
Published: 26 November 2019
Abstract
:Dealing with waste materials, particularly hazardous waste, is a serious problem. Disposal areas keep growing, and the costs incurred are high. Disposing of such waste reduces negative environmental impacts and offers considerable financial savings. This paper focuses on the possibilities of incorporating pollutants found in hazardous wastes as fillers in coatings based on polymers (epoxide and polyurethane). These coatings are intended mainly for concrete and metal bases and offer secondary protection against adverse weather conditions. Important physical and mechanical properties of the newly developed materials were determined; they include surface hardness, impact resistance, tensile properties, and chemical resistance. These properties were also compared to those of the reference filler. At the same time, the influence of aggressive media on the properties of these materials was observed, in particular on flexural characteristics. The microstructures of the developed coatings were tested using a high-resolution optical microscope, before and after exposure to the chemicals. The positive effect of using progressive fillers, such as solidified hazardous waste (a solidification product (SF)), was witnessed by their constructive contribution to the materials’ physical and mechanical properties. The use of solidification products is unambiguously advantageous from technical, ecological, and economical stand points (utilization of hazardous waste as a progressive filler instead of landfilling, improvement of tensile properties, reduction in the price of coating system, and incorporation of the pollutants into the polymer matrix).
1. Introduction
Polymerous base materials have great potential in the building industry; they have high strength, excellent resistance, and harden quickly [1]. For this research, selected binders were based on epoxide and polyurethane resins. Epoxide resins are known to have very good strength, surface hardness, bond to cement based composites, and resistance to aggressive substances [2]. Polyurethanes offer very good flexibility, capability of bridging cracks, and small fissures [3].
Solidification is an interesting way of using dangerous wastes as secondary raw materials. Solidification is based on mixing hazardous waste with a solidifying agent; it is advisable to use the maximum possible amount of hazardous waste for this process [4,5]. On using suitable solidification technology, hazardous waste (HW) can be reprocessed to a progressive material—solidification product [6]. Portland cement is the most widely used for solidification as a solidifying agent. Many formulations have been developed for the process, according to the kind of hazardous wastes, containing heavy metals, polychlorinated biphenyl (PCB), etc. Fly ash, lime, slag, soluble silicates, clay, etc. can also be used as a solidifying agent instead or in combination with Portland cement for solidification of HW [7].
Fly ash obtained from coal combustion is frequently used in concrete as a cost-effective substitute for Portland cement [5]. Like most common industrial by-products, fly ash is a complex anthropogenic material, and processing it prevents many problems, like the toxicity caused by the presence of various organic and inorganic compounds derived from the type of coal used [8]. This material is a mix of oxides rich in silicon (SiO2), iron (Fe2O3), and aluminum (Al2O3) [9]. The American US Energy Information Administration (USEIA, 2014) states that 40% of the energy produced worldwide is made from coal; India and China are the largest producers of coal. The growing consumption of energy has caused a considerable increase in the production of fly ash. Compared to 2005 when fly ash production was around 500 million tons, fly ash production increased to 750 million tons in 2015 [10,11]. This enormous amount of produced fly ash presents a major ecological threat connected to storage and disposal [8]. The utilization of fly ash as a filler for epoxide resin is a topic dealt with by many authors all over the world. For example, Krishna et al. [12] observed the influence of the action of various proportions of resin and filler (fly ash and wood dust) on the physical and mechanical properties of composites. They noted that increasing the proportion of filler not only reduces the price of the product, but also has a potential influence on its life span [12]. Currently, quartz flour (dust) is the most widely used filler in organic coatings, mainly because of the quartz high Mohs hardness value. The quartz filler showed the mechanical and anticorrosive behavior of epoxy coatings of steel materials [13]. In order to use the wastes in polymeric patching and grouting materials, and especially in coatings to improve the environmental aspects of its production, natural river and crushed fine aggregate, sand, and quartz flour can be replaced in different percentages by natural waste or sub-products, such as silica fume, milled recycle glass, fly ash, polystyrene granules, saw dust, polyethylene terephthalate (PET) particle, etc. [14,15,16,17,18,19,20].
Lokuge and Aravinthan [1] noted that the use of 0%–10% filler in the form of fly ash increases its physical and mechanical properties. However, they also concluded that further addition worsens these properties. In a study by Sosoi et al. [14], fly ash was added as a filler, and aggregate fraction 0–4 mm was replaced in different dosages by saw dust, where epoxy resin was used as a binder. Waste substitution influenced the properties of the concrete. This waste decreased the density of the hardened polymer concrete to values less than 2000 kg/m3, and saw dust decreased the workability of the polymer concrete. For dosages of 25% and 50% saw dust, the polymer concrete with waste substitution presented higher values of compressive strength than in the control mix (12.4% of epoxy resin, fly ash as filler in a dosage of 12.8%, and natural river aggregates: 37.4% of the size fraction 0–4 mm and 37.4% of the fraction 4–8 mm). The highest value of compressive strength—25%—was obtained for polymer concrete with saw dust substitution of aggregate, a value bigger than that of the control mix with 18.1% [14].
Polyurethanes were discovered in 1937 when Bayer was synthesizing polymer fibers to compete with nylon—he developed the first fiber-forming polyurethane. His invention ranks among the major breakthroughs in polymer chemistry, but Bayer’s polymer was dismissed as impractical by his superiors at the company I.G. Farbenindustrie, which produced typical polyurethane, in addition to polyurethane linkages, aliphatic and aromatic hydrocarbons, esters, ethers, amides, urea, and isocyanurate groups [21]. Polyurethane (PUR) elastomers are largely applied to industrial and consumer products, particularly in the fields of heavy pressure, load, impact, and wear because they possess excellent comprehensive properties, such as high wear, oil, and corrosion resistance, high elasticity and damping, good adhesion to other materials, etc. [22].
The main aim of this research was, in particular, to determine ways of using specific type of dry by-products (end product and cement bypass dust (CBPD)). These are classified as hazardous waste based on their dangerous properties. For storage and handling of such waste products, it is necessary to prevent the possible release of pollutants (lead, mercury, arsenic, etc.) into the ambient environment. Successful utilization of these wastes will, therefore, have significant environmental benefits. It is assumed that the two-stage stabilization and solidification (S/S) of these wastes could lead to perfect incorporation of the pollutants. The first stage of S/S is the formation of a solidification product in the form of a fine filler. The second step is to incorporate this filler into a polymer matrix, possibly improving the physical and mechanical properties and chemical resistance of the developed polymer coatings.
2. Materials and Methods
2.1. Binder
Two types of polymer-based binders were examined: epoxy resin- and polyurethane-based binders.
2.1.1. Epoxy Resin (ER-C)
This binder is a bi-component colorless epoxide resin with no thinner. It offers good mechanical and chemical resistance, high ultraviolet (UV) stability, rapid polymerization, minimal odor, and easy application. It contains no thinners, benzyl alcohol, or nonylphenol. ER-C’s compressive strength is around 60 MPa, and its bending strength is 30 MPa. It has long-term resistance to temperatures around 50 °C and short-term resistance to temperatures around 80 °C. The workability of ER-C ranges from 30 to 50 min, depending on the temperature. This epoxy resin can be painted 18 to 30 h after application. The epoxy thermoset is completely hardened after 7 days. The mixing proportion by mass is A:B = 2.3:1. Component A (epoxy resin) contains epoxy resin from bisphenol A and epichlorhydrine, low molecular epoxide resin based on bisphenol F, and solvent naphtha (petroleum) light, aromatic. Component B (hardener) contains benzyl alcohol m-phenylenbis (methylamine) phenol, 4,4’-(1-methylethylidene)bis-, an oligometric reaction product with 2-(chlormethyl)oxirane, a reaction product with 1,3-benzendimethanamine, and 4,4’-methylenbis (cykloxylamine).
2.1.2. Polyurethane Resin (PUR-C)
The PUR-C binder is a bi-component colorless polyurethane resin. It has high UV stability, rapid polymerization, high strength, toughness, minimal odor, and excellent resistance to water. Its compressive strength is around 31 MPa and its bending strength 22 MPa. It has long-term resistance to temperatures around 50 °C and short-term resistance to temperatures around 80 °C. PUR-C’s workability is approximately 45 min, depending on the application temperature; the next layer can be applied 24 h after application, depending on the temperature. The resin is completely hardened after 5 days. The mixing proportion of the components by mass is A:B = 2:1. Component A contains fumaric acid diethyl ester. Component B contains hexamethylene-diisocyanate oligomers.
2.2. Filler Component
Quartz dust was used as the reference filler. As an experimental secondary raw material, a mix in the form of solidification product was used, which was prepared by the dry homogenization of quartz dust, hazardous waste as a by-product of solid municipal waste combustion (end product), and, eventually, cement bypass dust (CBPD); the fly ash from the fluidized bed combustion (CFBC) contaminated by the denitrification process from a thermal power plant in the Czech Republic was used in combination with quartz dust as a solidifying agent.
2.2.1. Quartz Dust
Quartz dust (powder) is made by grinding dry clean quartz sand, followed by a subsequent selection process to ensure the highest possible quality and lowest content of undesirable fractions. Quartz dust has high mechanical and chemical resistance [10]. In the building industry, it is used to manufacture building cements, glues, resin mixes, and special renovation concrete. It is characterized by exact granulometry and constant grain structure, chemical resistance to aggressive environments, resistance to UV radiation and weather conditions, wide range of grain size, and high chemical resistance. The used quartz dust contained 99.4% SiO2, 0.3% Al2O3, 0.2% K2O and 0.1% Fe2O3, grain size up to 0.2 mm, no organic contamination, specific gravity of 2680 kg/m3, specific surface area of 4660 cm2/g.
2.2.2. Fly Ash from Fluidized Bed Combustion (CFBC)
Fly ash is contaminated by selective non-catalytic reduction (SNCR) technology and is a by-product of lignite burning thermal power plant in western Czech Republic. The specific weight of this material was experimentally determined to be 2872 kg/m3, with a specific surface area of 627 m2/kg, and concentration of ammonia ions (NH3) = 30.11 ppm.
2.2.3. End Product
The end product is hazardous waste (HW), produced as a by-product from the combustion of municipal solid waste in the Czech Republic; the experimentally determined specific weight of the used material is 2340 kg/m3 and specific surface is 5190 cm2/g.
2.2.4. Cement Bypass Dust (CBPD)
Cement bypass dust (CBPD) is a by-product of the production of cement in cement plants, also called bypass dust. Bypass refers to exhaust from a portion of furnace gasses from the transitional section of a rotary cement furnace, caused by the rapid cooling of this part of furnace gas and its diversion into an independent filter. This portion of gas does not pass through the exchanger before entering the furnace, where partial calcination of the raw-material mix takes place. This bypass limits or eliminates the formation of stickers in the exchanger by diverting alkalis (mainly in the form of chlorides) out of the furnace circuit and limits the content of alkalis directly in the forming clinker. Bypass gasses with fine parts are cooled down to 150 °C so that they can be dusted off with a fabric filter. Bypass dust can be mechanically divided into two fractions: The coarser fraction (particles over 70 μm) contains mainly clinker and raw material dust with a low content of alkalis (including CaSO4), while the fine fraction (particles under 70 μm) contains mainly clinker and raw material dust with a high content of alkalis. The amount of coarse fraction is 85%–90%, and fine fraction is 10%–15% of the total amount of dust. This material´s specific weight is 2790 kg/m3, and its specific surface is 6440 cm2/g.
2.3. Solidification of Wastes
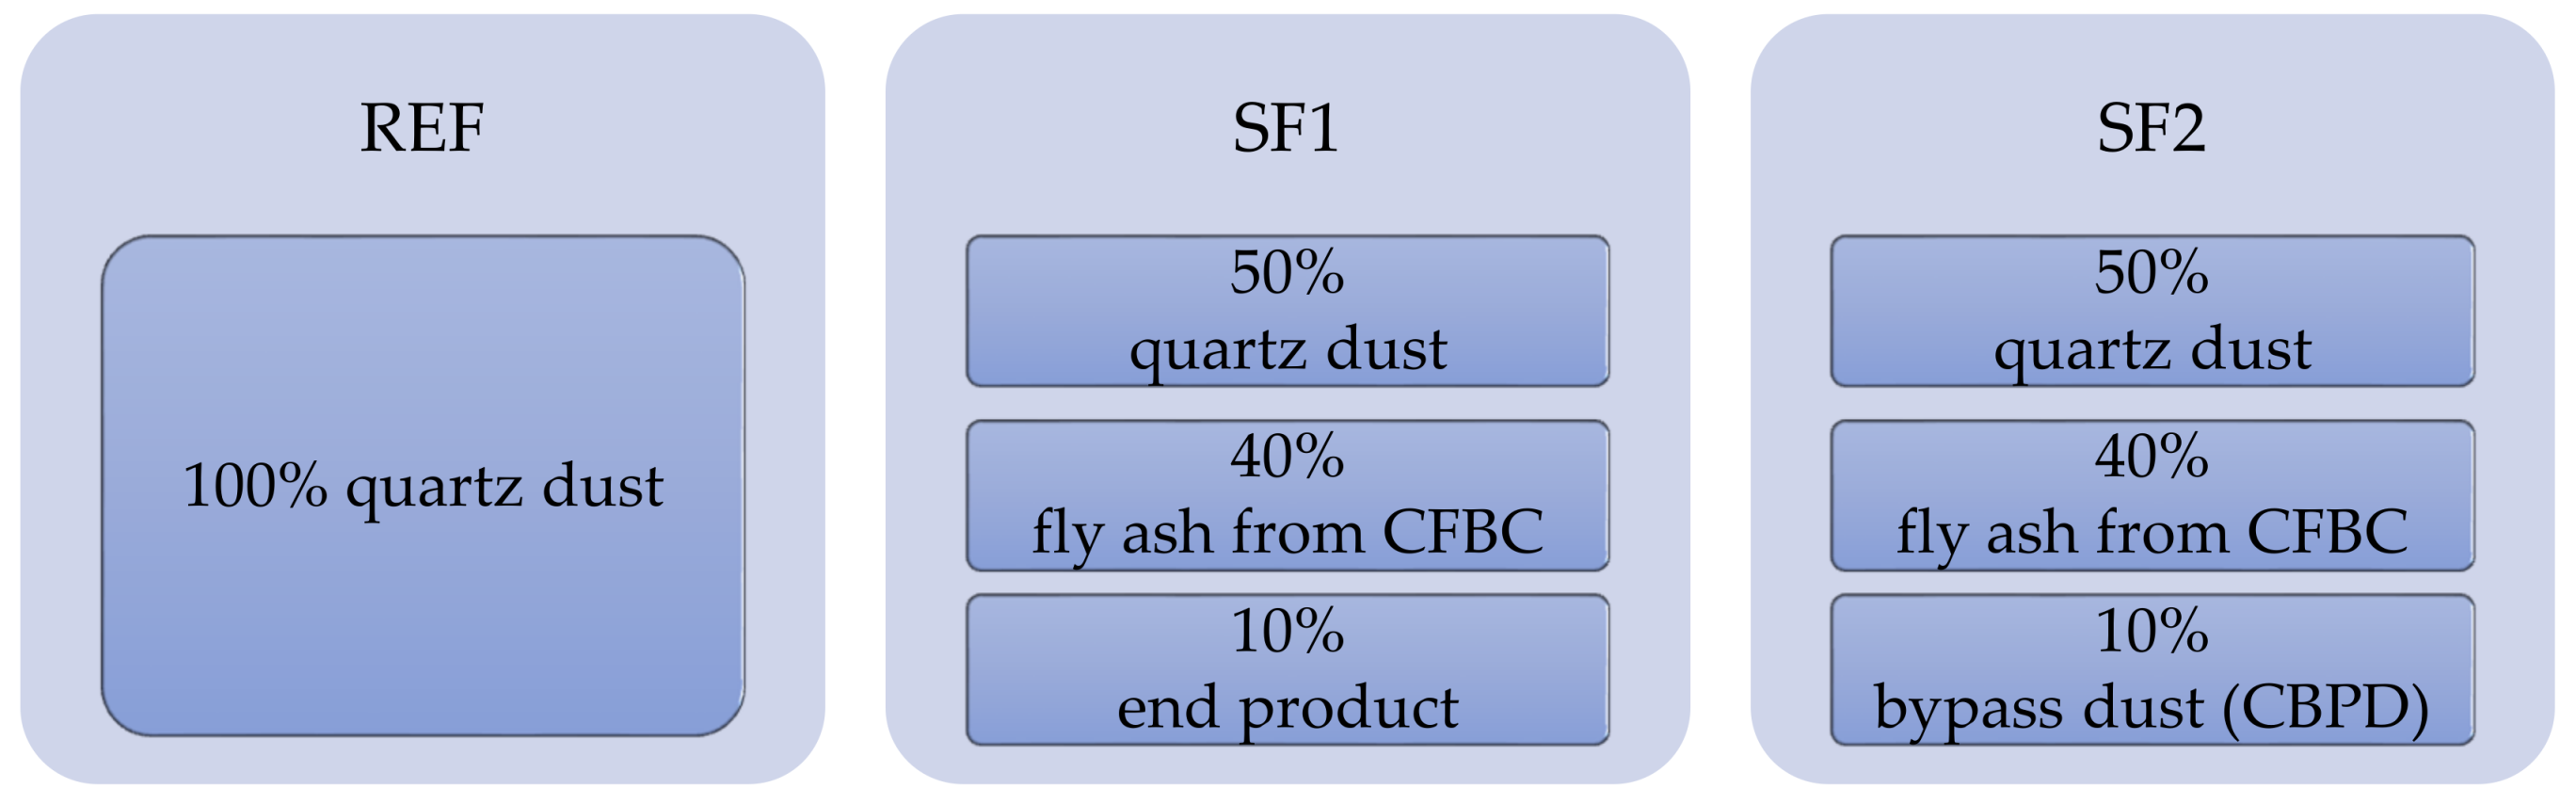
In the first stage, a filling component was created as a mix of individual secondary raw materials. All dry input materials were homogenized within the dry solidification way in the homogenizer for 48 h. In order to thoroughly mix all the components, the total homogenized volume was 1 L, in cylindrical vessels, at 80 rpm of the homogenizer. The filler in the form of a solidification product (SF) was produced. The first filler (SF1) consisted of quartz powder, fly ash, and the end product; the other filler (SF2) consisted of quartz powder, fly ash (CFBC), and cement dust (CBPD). The third filler, the reference (REF), contained only quartz powder (dust). The fly ash with combination of quartz dust, in proportion to mass 4:5, was used as the solidifying agent during the solidification of HW by dry homogenization.
Proportion of Filler Components
The percental proportion of individual components is shown in Figure 1.
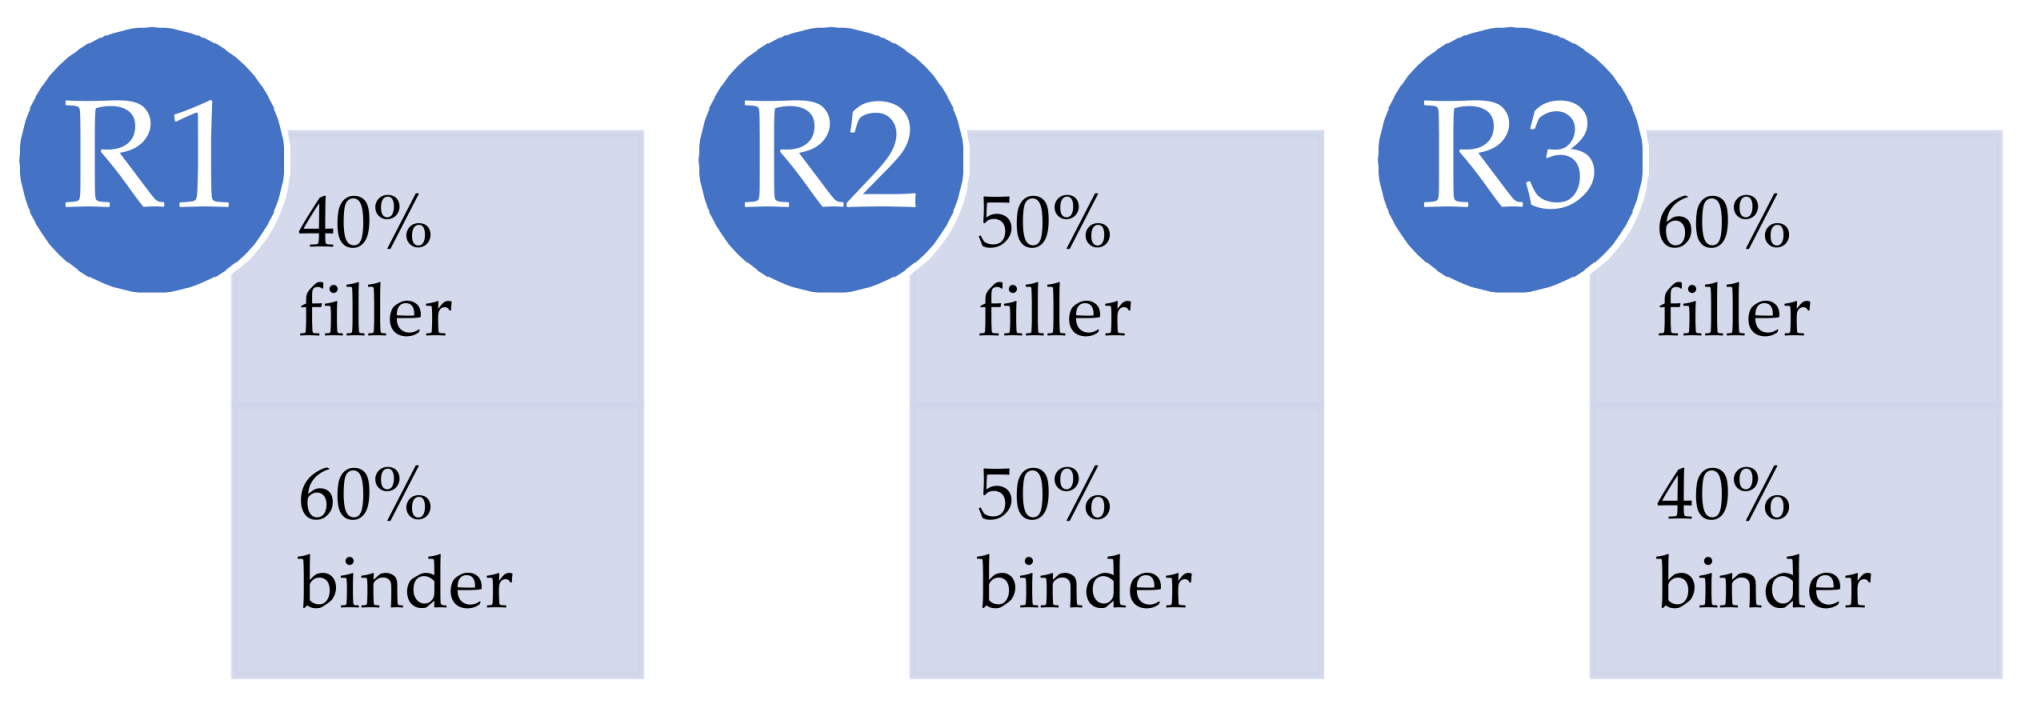
2.4. Design of Formulations
In mixed designs with polyurethane and an epoxide binder, three different proportions of filler and binder were examined (R1, R2, and R3). The specific proportions are shown in Figure 2.
2.5. Filler Test Methods
2.5.1. Granulometry
The particle size distribution of the input hazardous waste (end product, cement bypass dust), solidifying agents (quartz dust and CFBC fly ash), reference filler (quartz flour), and fillers in the form of solidification products (SF1, SF2) was measured using a Mastersizer 2000 device (Malvern Instruments, Malvern, UK) by the dry method [15].
2.5.2. Microscopic Analysis of Fillers (Solidification Products)
The microstructure of the fillers in the form of solidification products (SF1, SF2) was monitored using both a digital optical microscope (Keyence VHX-950F, Osaka, Japan) and a scanning electron microscope (SEM) (TESCAN MIRA3 XMU, Brno, The Czech Republic). For the digital microscope, a resolution of 67.7× was used, and for SEM analysis, a resolution of 5000× was the most appropriate to observe particle size, shape, and distribution in the filler.
2.5.3. Specific Gravity and Specific Surface Area
The specific gravity of the fillers (SF1, SF2, REF) was determined using the AccuPyc II 1340 Pycnometer (Norcross, GA, USA). It is an automatic gas pycnometer, where specific gravity is calculated by measuring the volume of helium in the sample chamber of known mass. The specific surface area of the fillers used was determined using the Blain permeable method by aid of ZEB MAXAM PC Blain Star equipment (São Paulo, Brazil). Calculation of the specific surface area is based on the time of air flows through a sample of defined weight, specific gravity, and porosity.
2.5.4. Determination of the Concentration of Harmful Substances in Dry Matter
Determination of the concentration of pollutants in the dry matter of the fillers in the form of solidification product (SF1, SF2) and input hazardous waste (HW) was carried out and subsequently evaluated according to Regulation 294/2005 Coll. (as amended) [23]. Limit values for the concentration of pollutants and biological agents selected on the basis of knowledge of waste generation technology are among the critical indicators. The above-mentioned regulation sets the limit concentration of pollutants in waste dry matter as the amount allowed on ground surface.
2.5.5. Leaching of Hazardous Waste and Fillers
The performance of the leachability test was based on Regulation 294/2005 Coll. (as amended) [23]. The leachability of waste and individual leachability classes (I, IIa, IIb, III) are given in Annex 2 with regard to this Regulation. The leachability test was carried out according to the standard EN 12457-4 [24].
2.5.6. Ecotoxicity
Ecotoxicity tests are based on exposing the following organisms to the influence of water waste leachants: algae Desmodemus subspicatus, Daphnia magna, Poecilia reticulata, and Sinapsis alba. The requirements to carry out these tests, and the demands for the results of ecotoxicological tests, are provided in Regulation 294/2005 Coll.
Table 1 shows the time of exposure of the water leach of waste for the tested organisms and the test method. The acute toxicity test was carried out with undiluted aqueous leachate of waste material. Wastes and treated wastes can be used for reclamation of mined open-cast mine workings (open-cast mines, quarries, sand pits) if the requirements set out in Table 1, Column II, are fulfilled in the acute toxicity tests. Wastes and treated wastes can be used in the top reclamation layer at least 1 m thick from the ground surface, meeting the requirements set out in Column I; stimulation of algae and seed growth is not a limiting factor [23].
2.6. Coating Test Methods
2.6.1. Consistency
Consistency was determined in accordance with the modified European standard ISO 2431:2019 (paints and varnishes–Determination of flow time by use of flow cups) [25]. The flow time was determined using flow cups. Rather than a standard cup with a maximum nozzle diameter of 6 mm, a special flow cup with a 12 mm nozzle was used. The reason for this change was the rapid setting of the mix, which began to set even before the liquid flowed through the cup with a 6-mm nozzle (polyurethanes). Consistency determination was performed three times for each sample.
2.6.2. Coat Thickness
Coat thickness was determined in accordance with standard ISO 2808:2019 (Paints and Varnishes—Determination of Film Thickness) [26].
2.6.3. Flexural Properties
Flexural properties were determined in accordance with (EN ISO 178 Plastics—Determination of Flexural Properties). The width of the sample was 10 mm and thickness was 4 mm. The length of the sample was 80 mm, with a span of 64 mm, in accordance with the mentioned standard. The loading rate was 5 mm/min until break. Measurements were taken by a press with electronic measurement recording. The flexural elasticity modulus was measured in the linear part of the stress-strain curve. The linear part of the curve is the elastic region and the modulus of elasticity is calculated in the slope. The range of deflections, represented by the strain difference of εf2 (= 0.0025)–εf1 (= 0.0005), was used according to the prescribed standard. Three specimens were tested for each type of coating sample. Contact force of 1 N was applied before imitation of the test.
2.6.4. Determination of Tensile Properties
Tensile properties were determined in accordance with the standard ISO 527-1:2019 (Plastics–Determination of Tensile Properties—Part 1: General principles) [27] and ISO 527-2:2012 (Plastics–Determination of Tensile Properties—Part 2: Test conditions for moulding and extrusion plastics) [28]. The loading rate was 5 mm/min. The initial length of extensometer was 50 mm. Dumbbell-shaped type 1B test specimens with length of 150 mm, width of 10 mm, and thickness of 4 mm were used for this test. Three specimens were tested for each type of coating sample.
2.6.5. Determination of Surface Hardness
This test was carried out in accordance with the standard ISO 868:2003 Plastics and Ebonite—Determination of Indentation Hardness by Means of a Durometer (Shore hardness) [29]. This test is based on the indentation of a point of durometer type A (for softer materials) or type D (for harder materials). In this particular case, the durometer used was type D–TQC, model LD0551, because the material surface was harder. This type of durometer made of stainless steel and anodized aluminum had accuracy of 0.006, width of 25 mm, height of 110 mm, length of 60 mm, and weight of 230 g. During the surface hardness measurement, the durometer was in a vertical position above the specimen. The durometer was then pressed down until the presser foot was in full contact with the specimen; maximum reading from the drag pointer was taken after 1 s.
2.6.6. Adhesion of Coatings
The adhesion of coatings was determined by a digital pull-off device, Elcometer 506, in accordance with the standard ISO 4624:2016 Paints and Varnishes—Pull-off Test for Adhesion [30]. The measurement range of this machine was up to 25 MPa, with an accuracy ± 1.5% in the whole range. The method for determining the adhesion by carrying out a pull-off test on a single coating was used. The coating was in the fresh state applied on the clean surface of the concrete pavement (300 mm × 300 mm) at a thickness of approximately 400 μm, and after 7 days, metal dolls of 20 mm diameter were stuck 275 on the surface of hardened coating. After 24 h, the dolls were cut up to the substrate and the coating adhesion to the concrete surface was determined.
2.6.7. Determination of Impact Resistance
This test was carried out in accordance with the standard ISO 6272-1:2011 Paints and Varnishes—Rapid-deformation (impact resistance) tests—Part 1: Falling-weight Test, large-area indenter [31]. To determine the impact resistance of the developed composite material, samples with thicknesses of 4 mm were applied to the test panels after completely hardening. These samples were tested with a falling weight of 1 kg from various heights. The initial height of the falling weight was 10 cm, and this height was increased by 10 cm, up to the point when the crack occurred.
2.6.8. Resistance to Abrasion
Abrasion resistance was determined in accordance with the standard ČSN EN 14157: Natural stone test methods–Determination of the abrasion resistance [32]. The test was performed using method B: determination the abrasion according to the method of Böhme. The test specimen is placed on the test track of the Böhme wear pad 289 to which the corundum abrasive is poured. The wheel was spinning and the specimens were subjected to the abrasive load of (294 ± 3) N for a given number of cycles. The value was determined as the difference in the volume of the tested specimen after the required number of cycles ΔV in cm3/50 cm2.
2.6.9. Chemical Resistance
Test specimens in the form of beams (80 mm × 10 mm × 4 mm) were left under laboratory conditions, where they were completely polymerized. The samples were then placed in glass cuvettes with selected chemicals (oil fuel, 15% solution of citric acid, 20% solution of sulfuric acid, 10% solution of acetic acid, and 20% solution of sodium hydroxide). These chemicals were selected as the most frequent aggressive agents causing the degradation of concrete structures (e.g., the gradual washing out of concrete, as well as the common reactions causing volumetric changes or the formation of new substances, the crystallization pressure of which substantially exceeds the values of the tensile strength of concrete and thus destroys the material). After 14 days of exposure, the resistance of the material to chemical environments was evaluated. The assessed properties were the visual changes and influence of the given environments on flexural properties.
2.6.10. Microstructure
Optical microscopy was used to evaluate the filler distribution in the polymeric matrix of the examined coatings, the presence and distribution of pores, the method of incorporation of the filler, and the solidification products (SF1, SF2). In the matrix, we evaluated the transition zone between the substrate and coating layer, and the degree of failure after the tests of resistance to grindability, as well as the location of failure after the flexural strength test. We also evaluated the resistance to impact, including the mode of failure and determination of the area of the impact weights, as well as changes in the microstructure after exposure of the samples to a chemically aggressive environment. To estimate the microstructure, an optical digital microscope (Keyence VHX-950F) was used. This digital microscope has aa CMOS sensor with virtual pixels 1600 (H) × 1200 (V), scanning frequency 50 F/s, and enables maximum real magnification of 67.7×. The Easy mode was used in the microscope software to analyze the particle sizes of the filler, the pores in the coatings, and the deterioration after chemical stress. The function “Epi-illumination” was switched on, the “Transmitted illumination” was off, and the “Edge enhance” was at a value of 1.0.
3. Results and Discussion
This section discusses the results of the development of a special surface treatment using pre-treated hazardous wastes. The first part of Section 3.1. presents the fillers (SF1, SF2, REF) and the input hazardous waste (end product, cement bypass dust) including the assessment of the dangerous properties of hazardous waste. The second part (Section 3.2.) evaluates the resulting values of surface hardness, impact resistance, tensile strength, relative elongation at break, flexural properties of samples with fillers containing hazardous wastes (HW), and a comparison of these basic properties with those of the reference material with a quartz powder filler.
3.1. Fillers Results
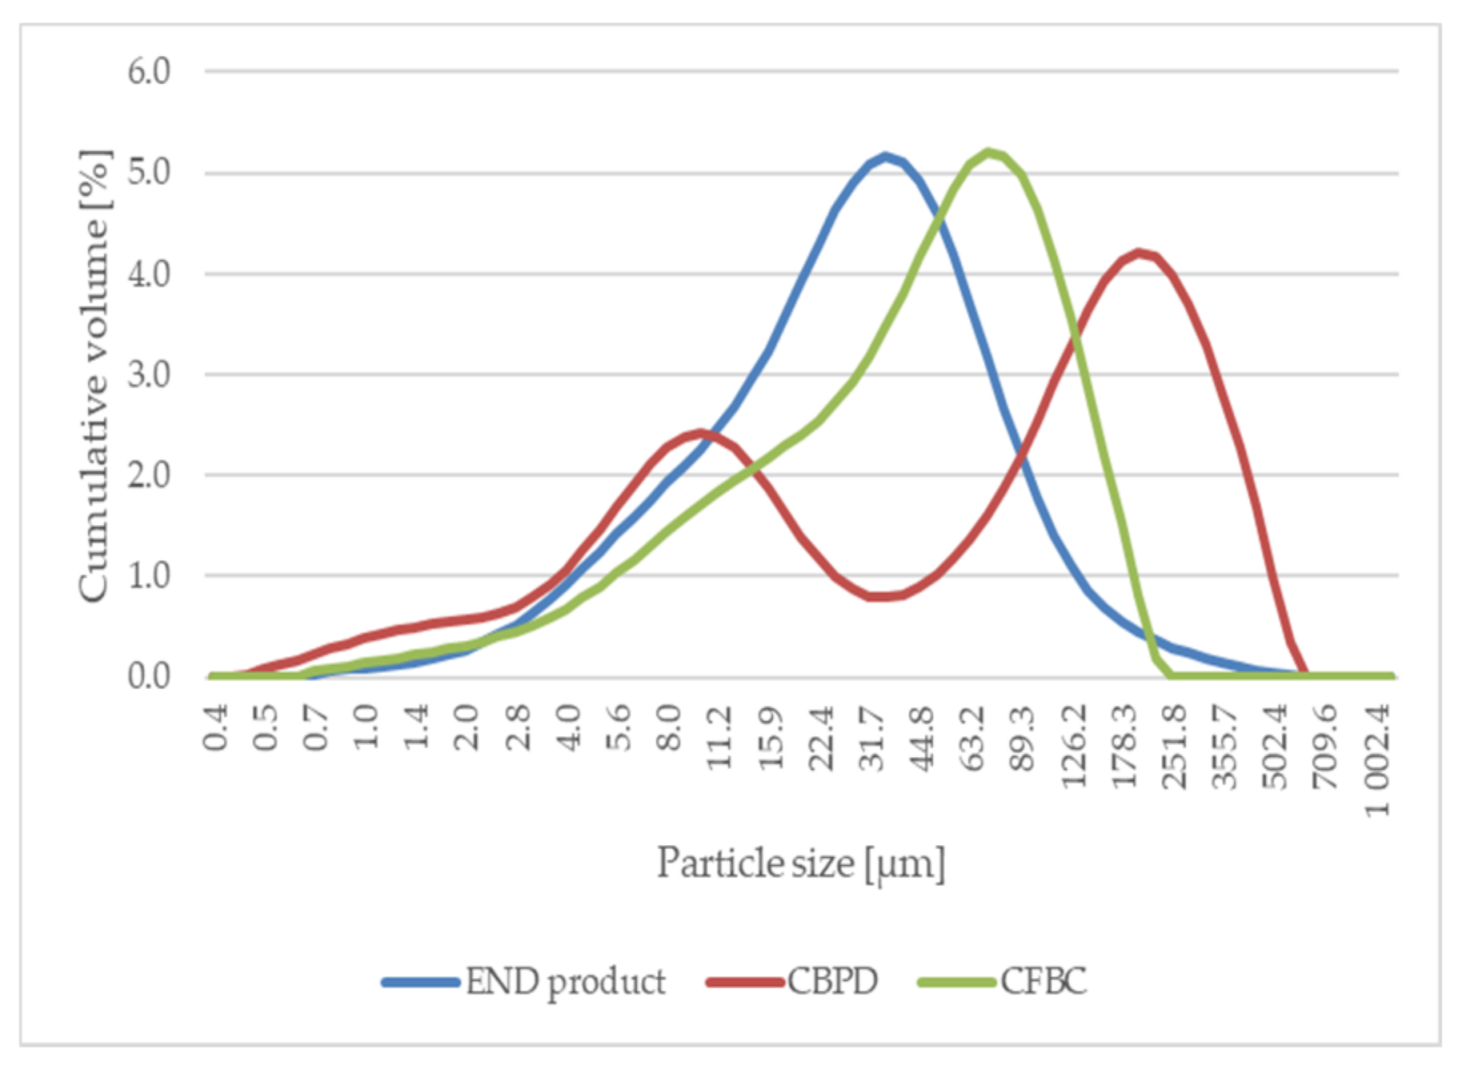
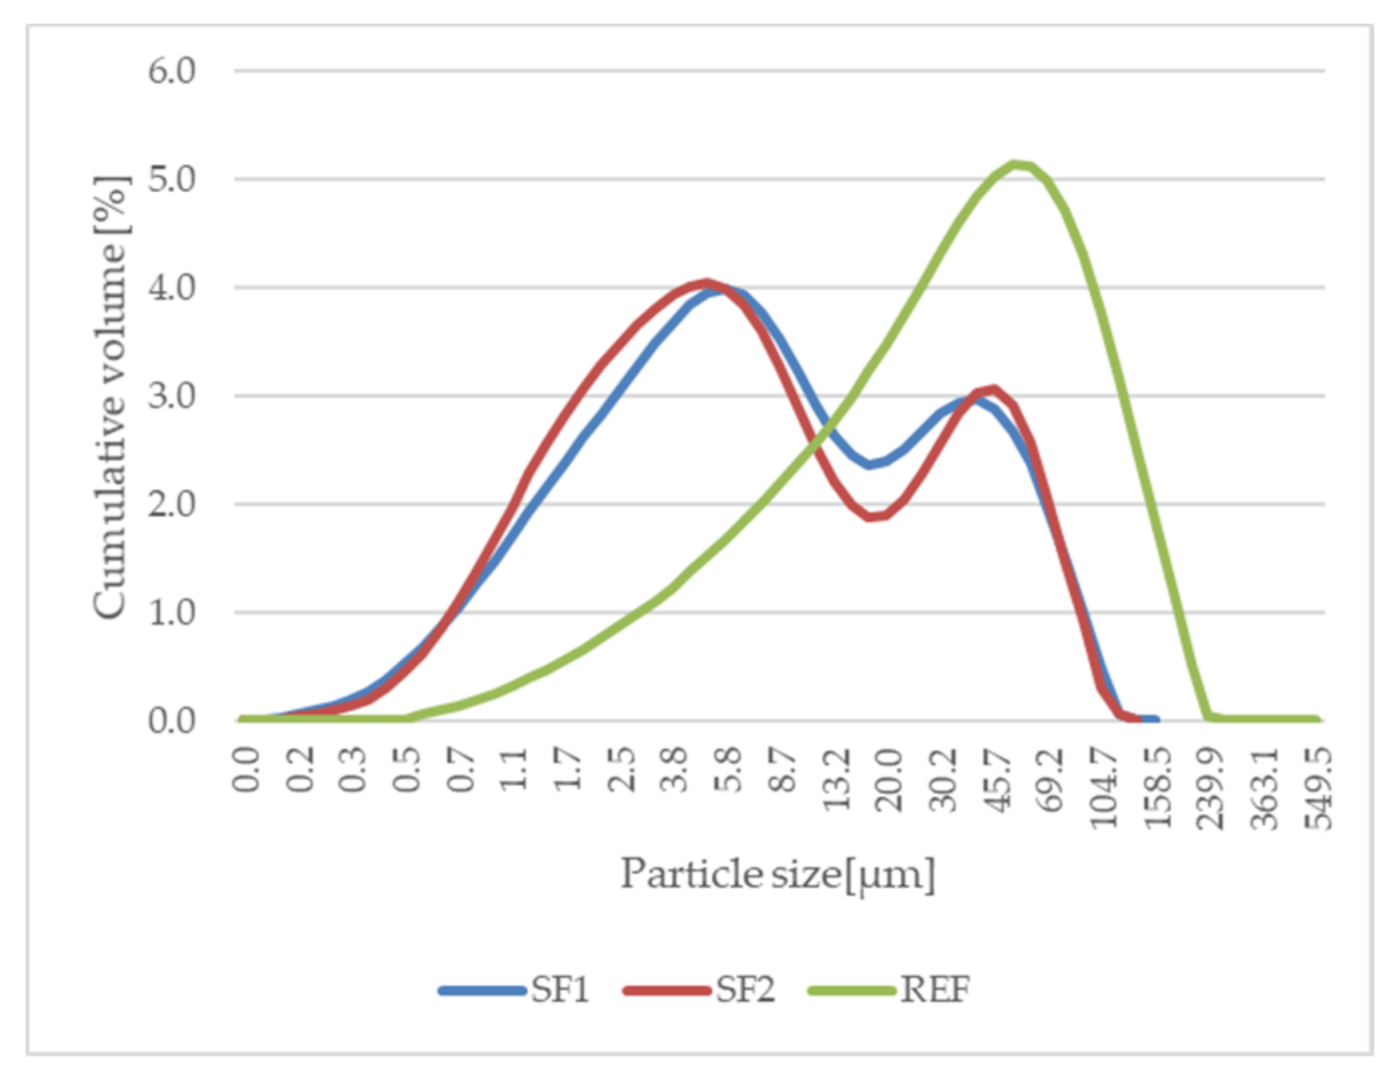
3.1.1. Granulometry of Used Input Materials
Based on the determination of grain size (Figure 3 and Figure 4), the end product and fly ash (CFBC) showed similar granulometric curves, while the end product had more fine particles. The distribution curves of the created solidified fillers have similar profiles, sizes, and particles, which are slightly larger than those of the quartz powder.
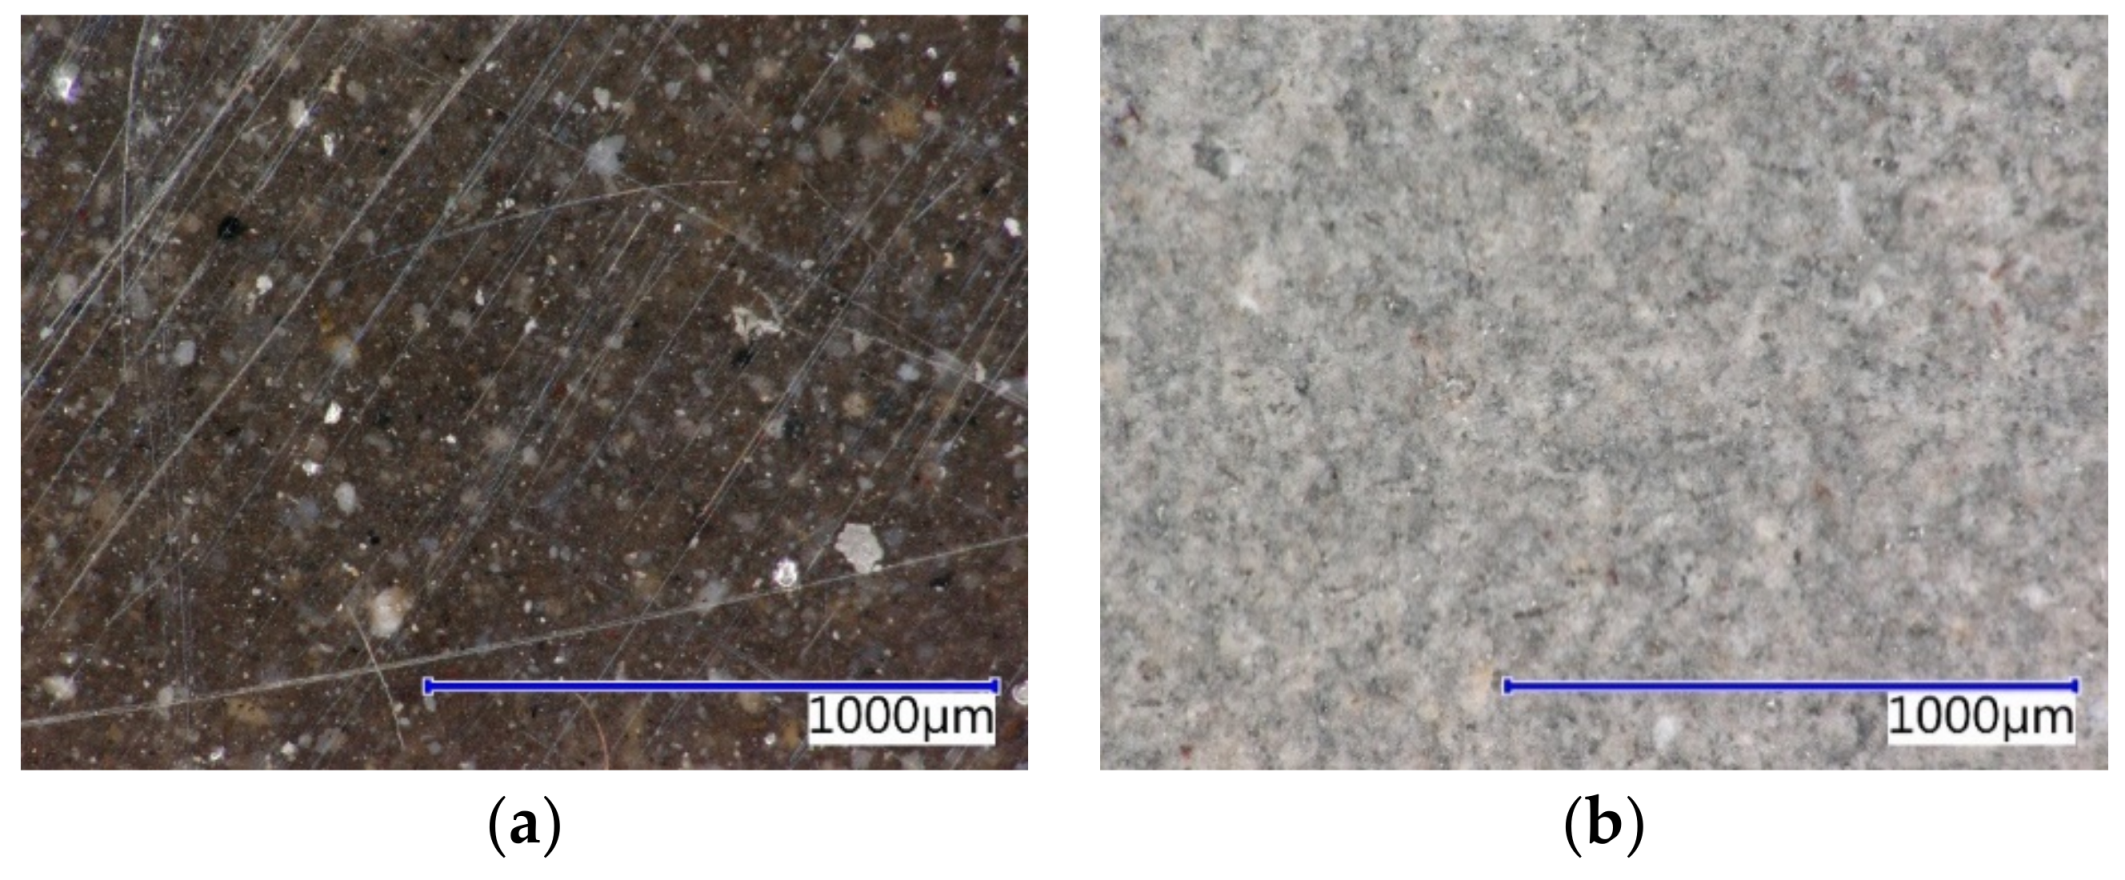
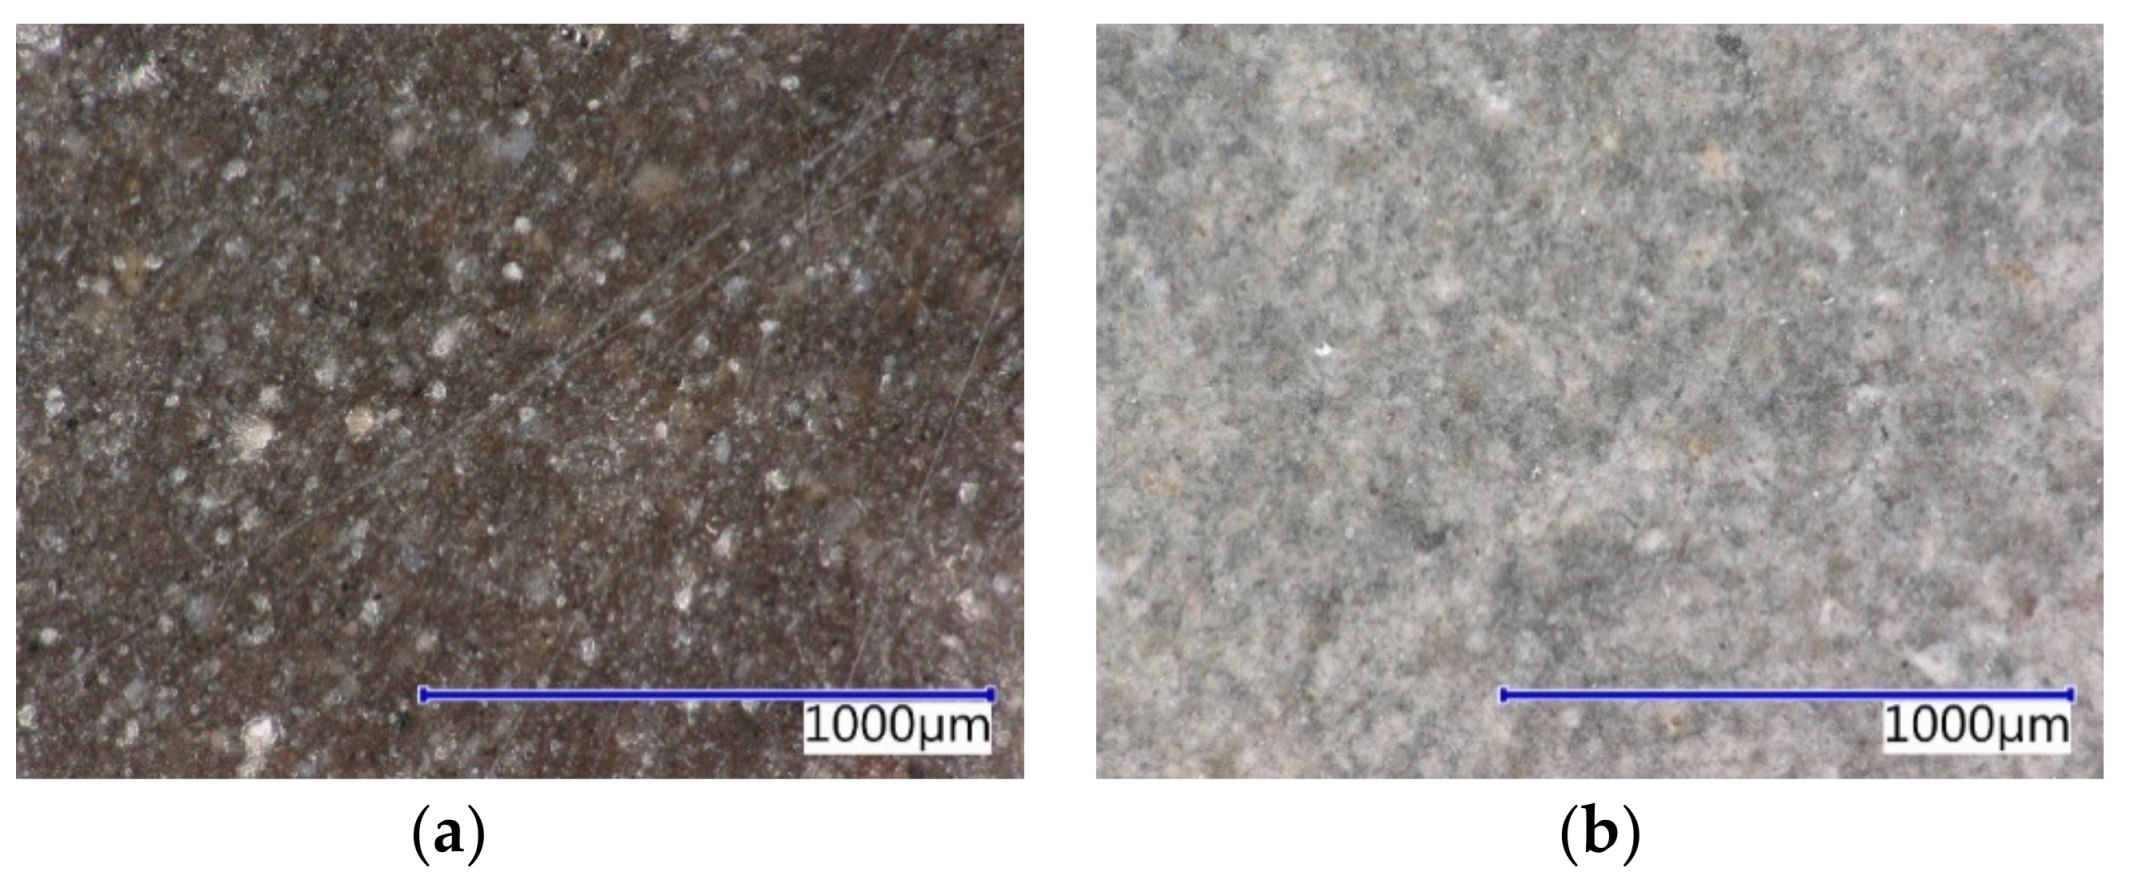
3.1.2. Microscopic Analysis of Fillers (Solidification Products)
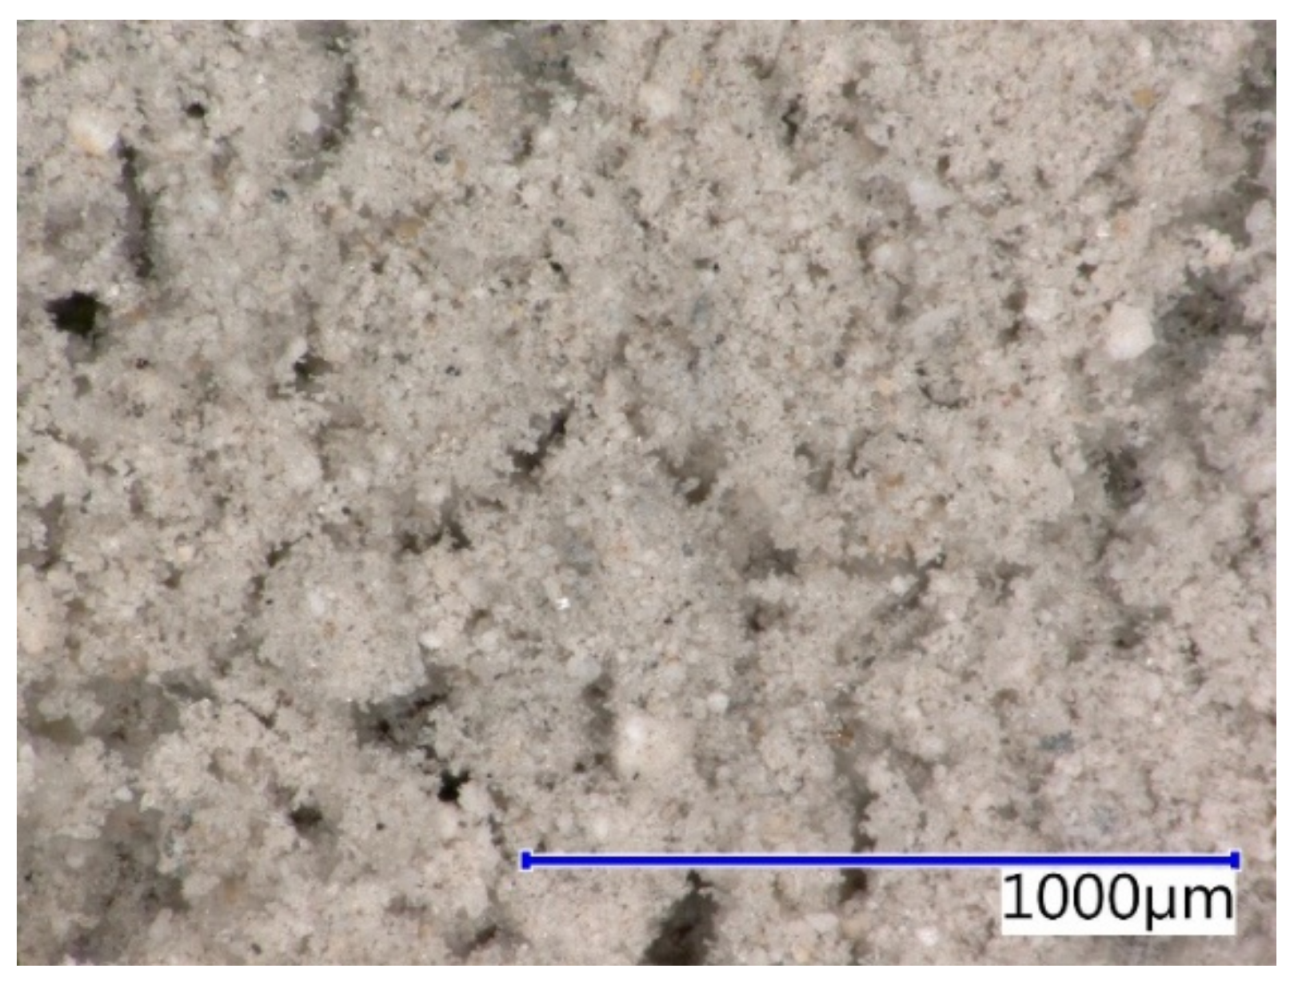
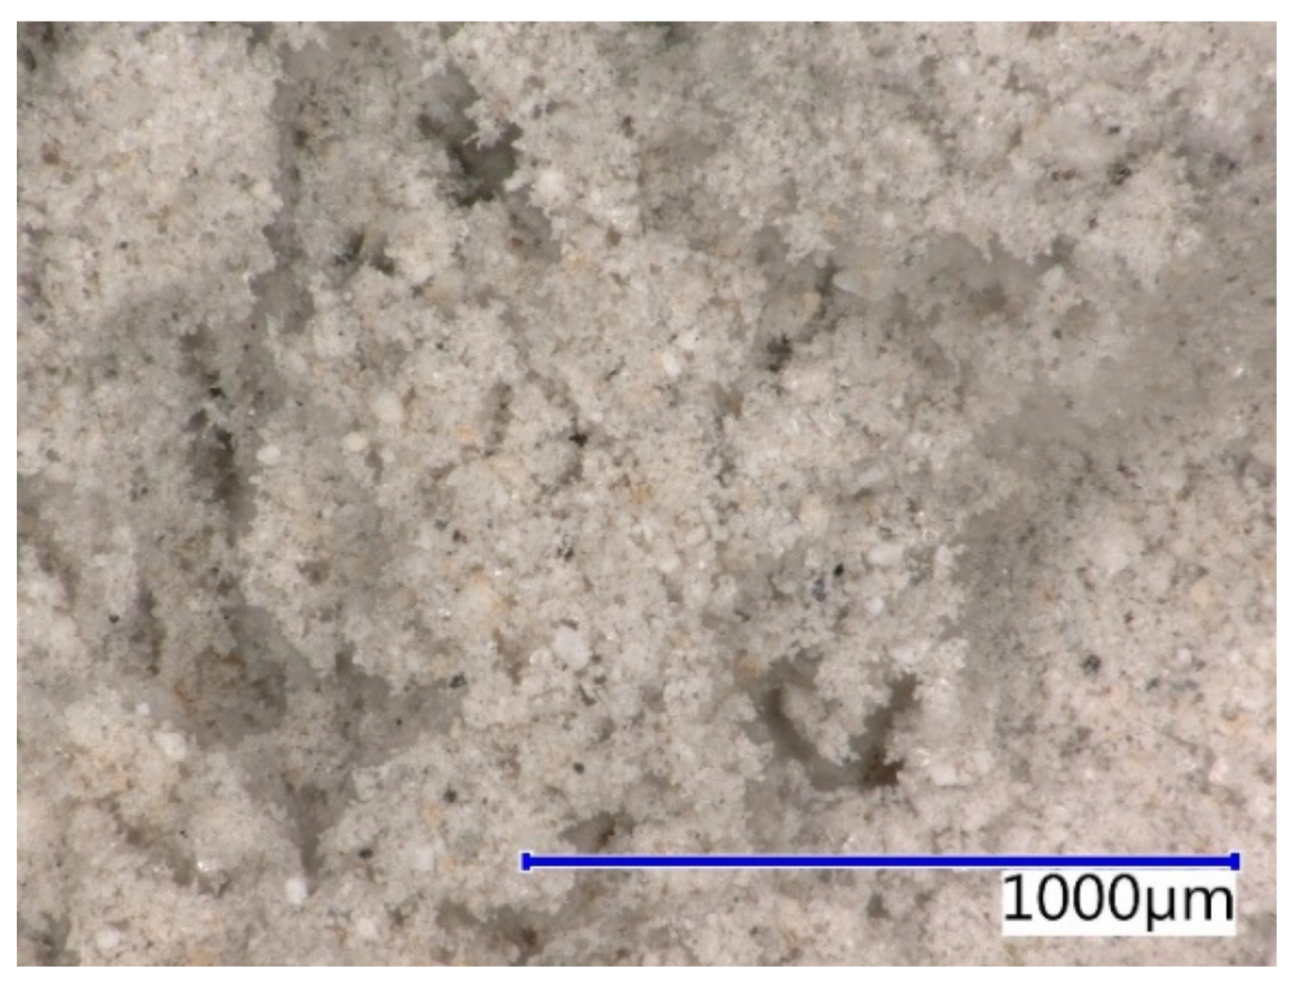
The microstructures of the particles in used fillers were tested with respect to their size, shape, agglomerates, and the degree of homogenization of the solidified product. The structure of the solidification products and the way the material behaves in larger quantities are clear from the following images (Figure 5 and Figure 6).
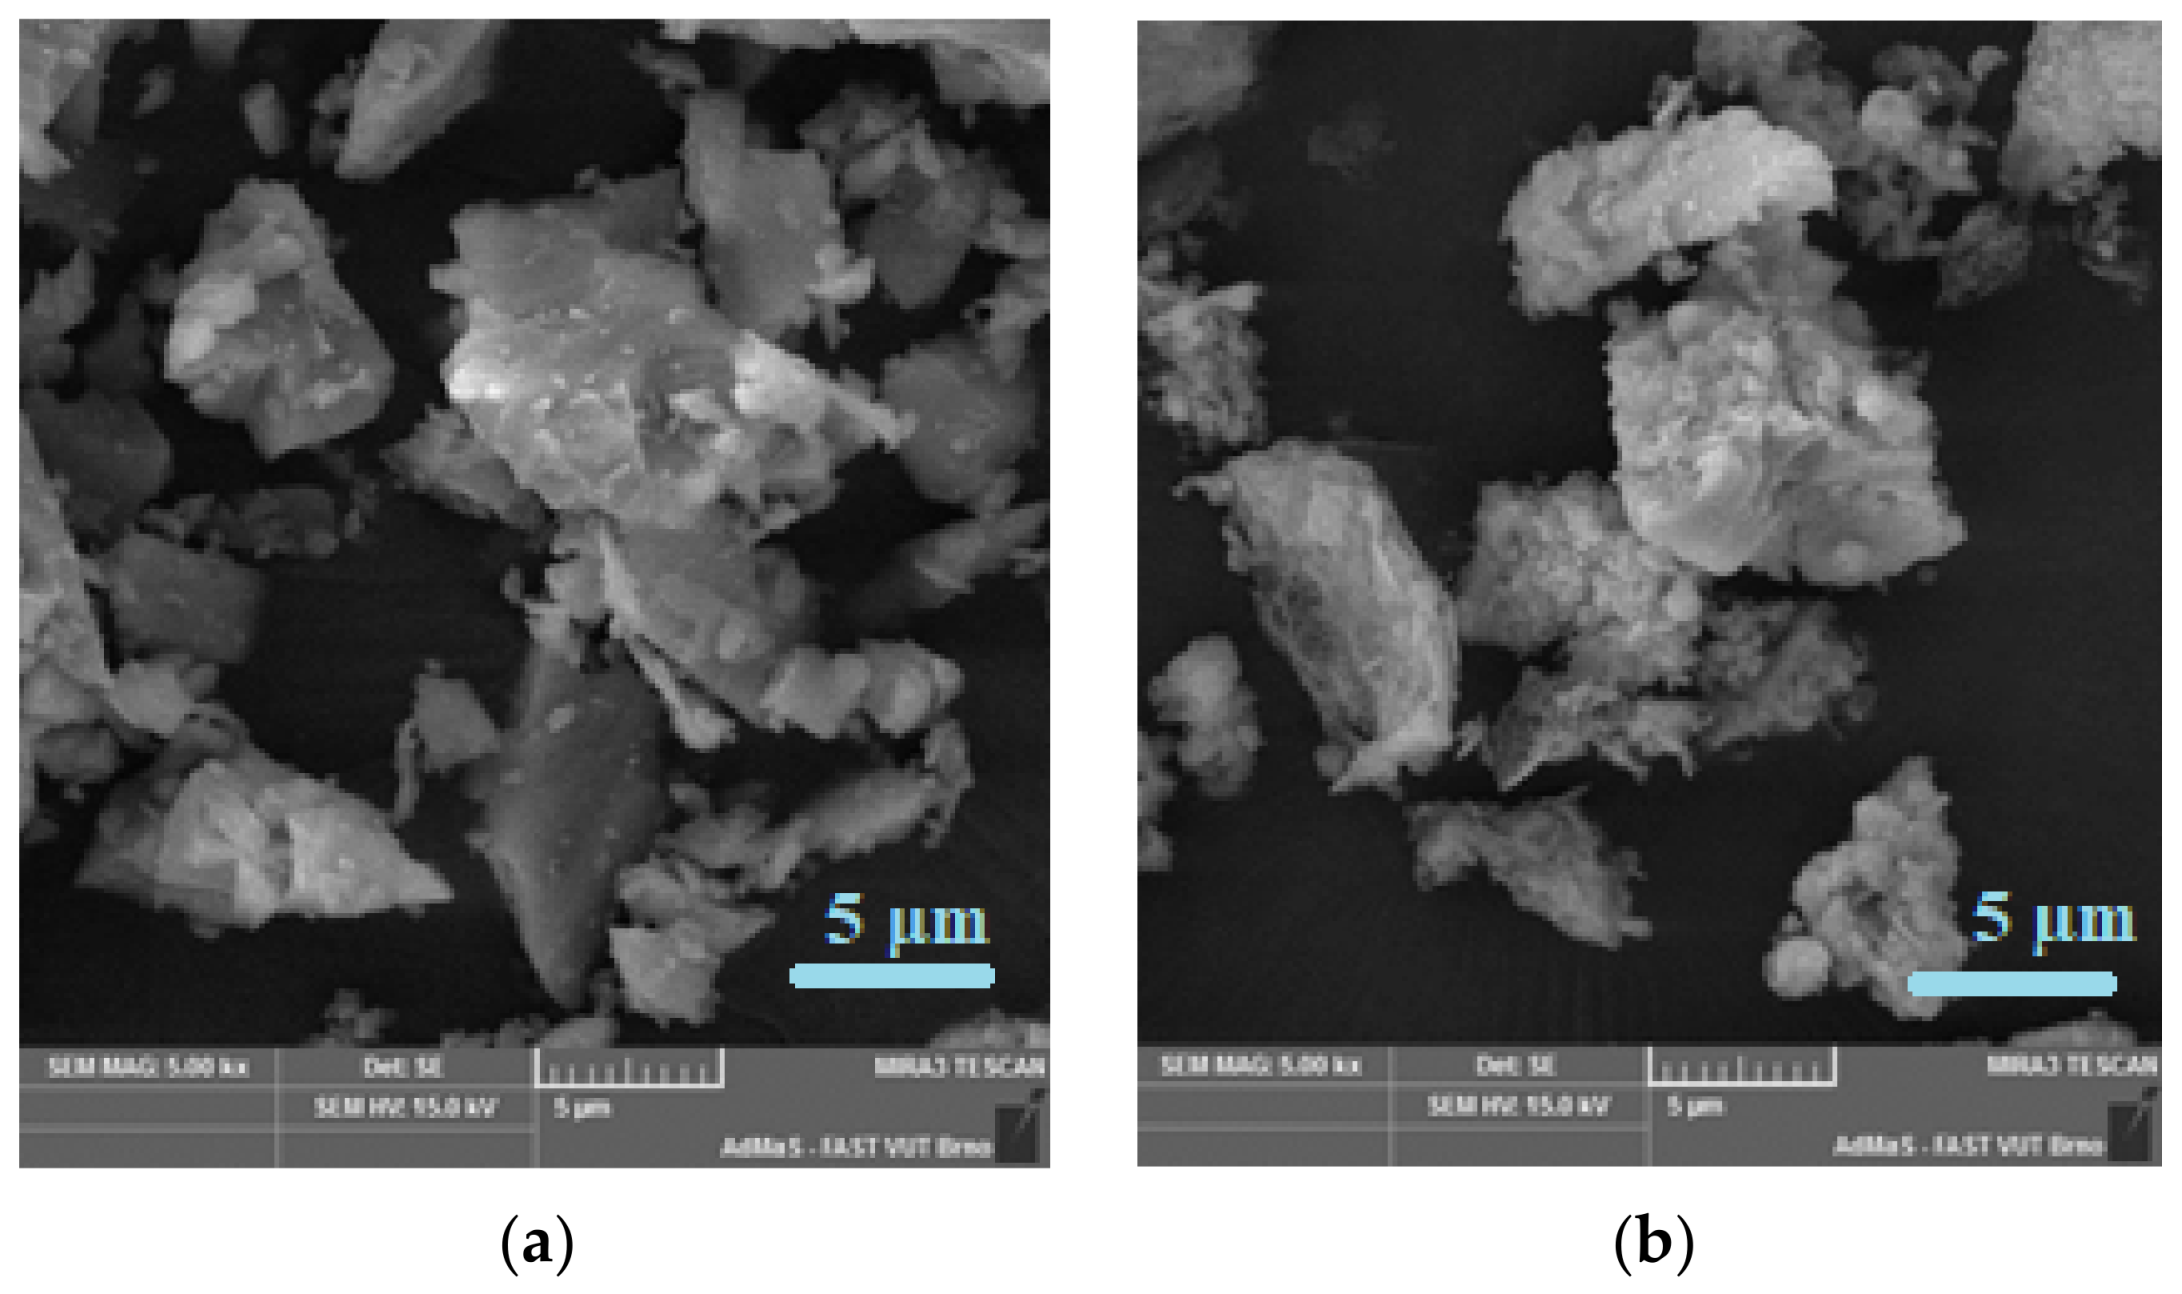
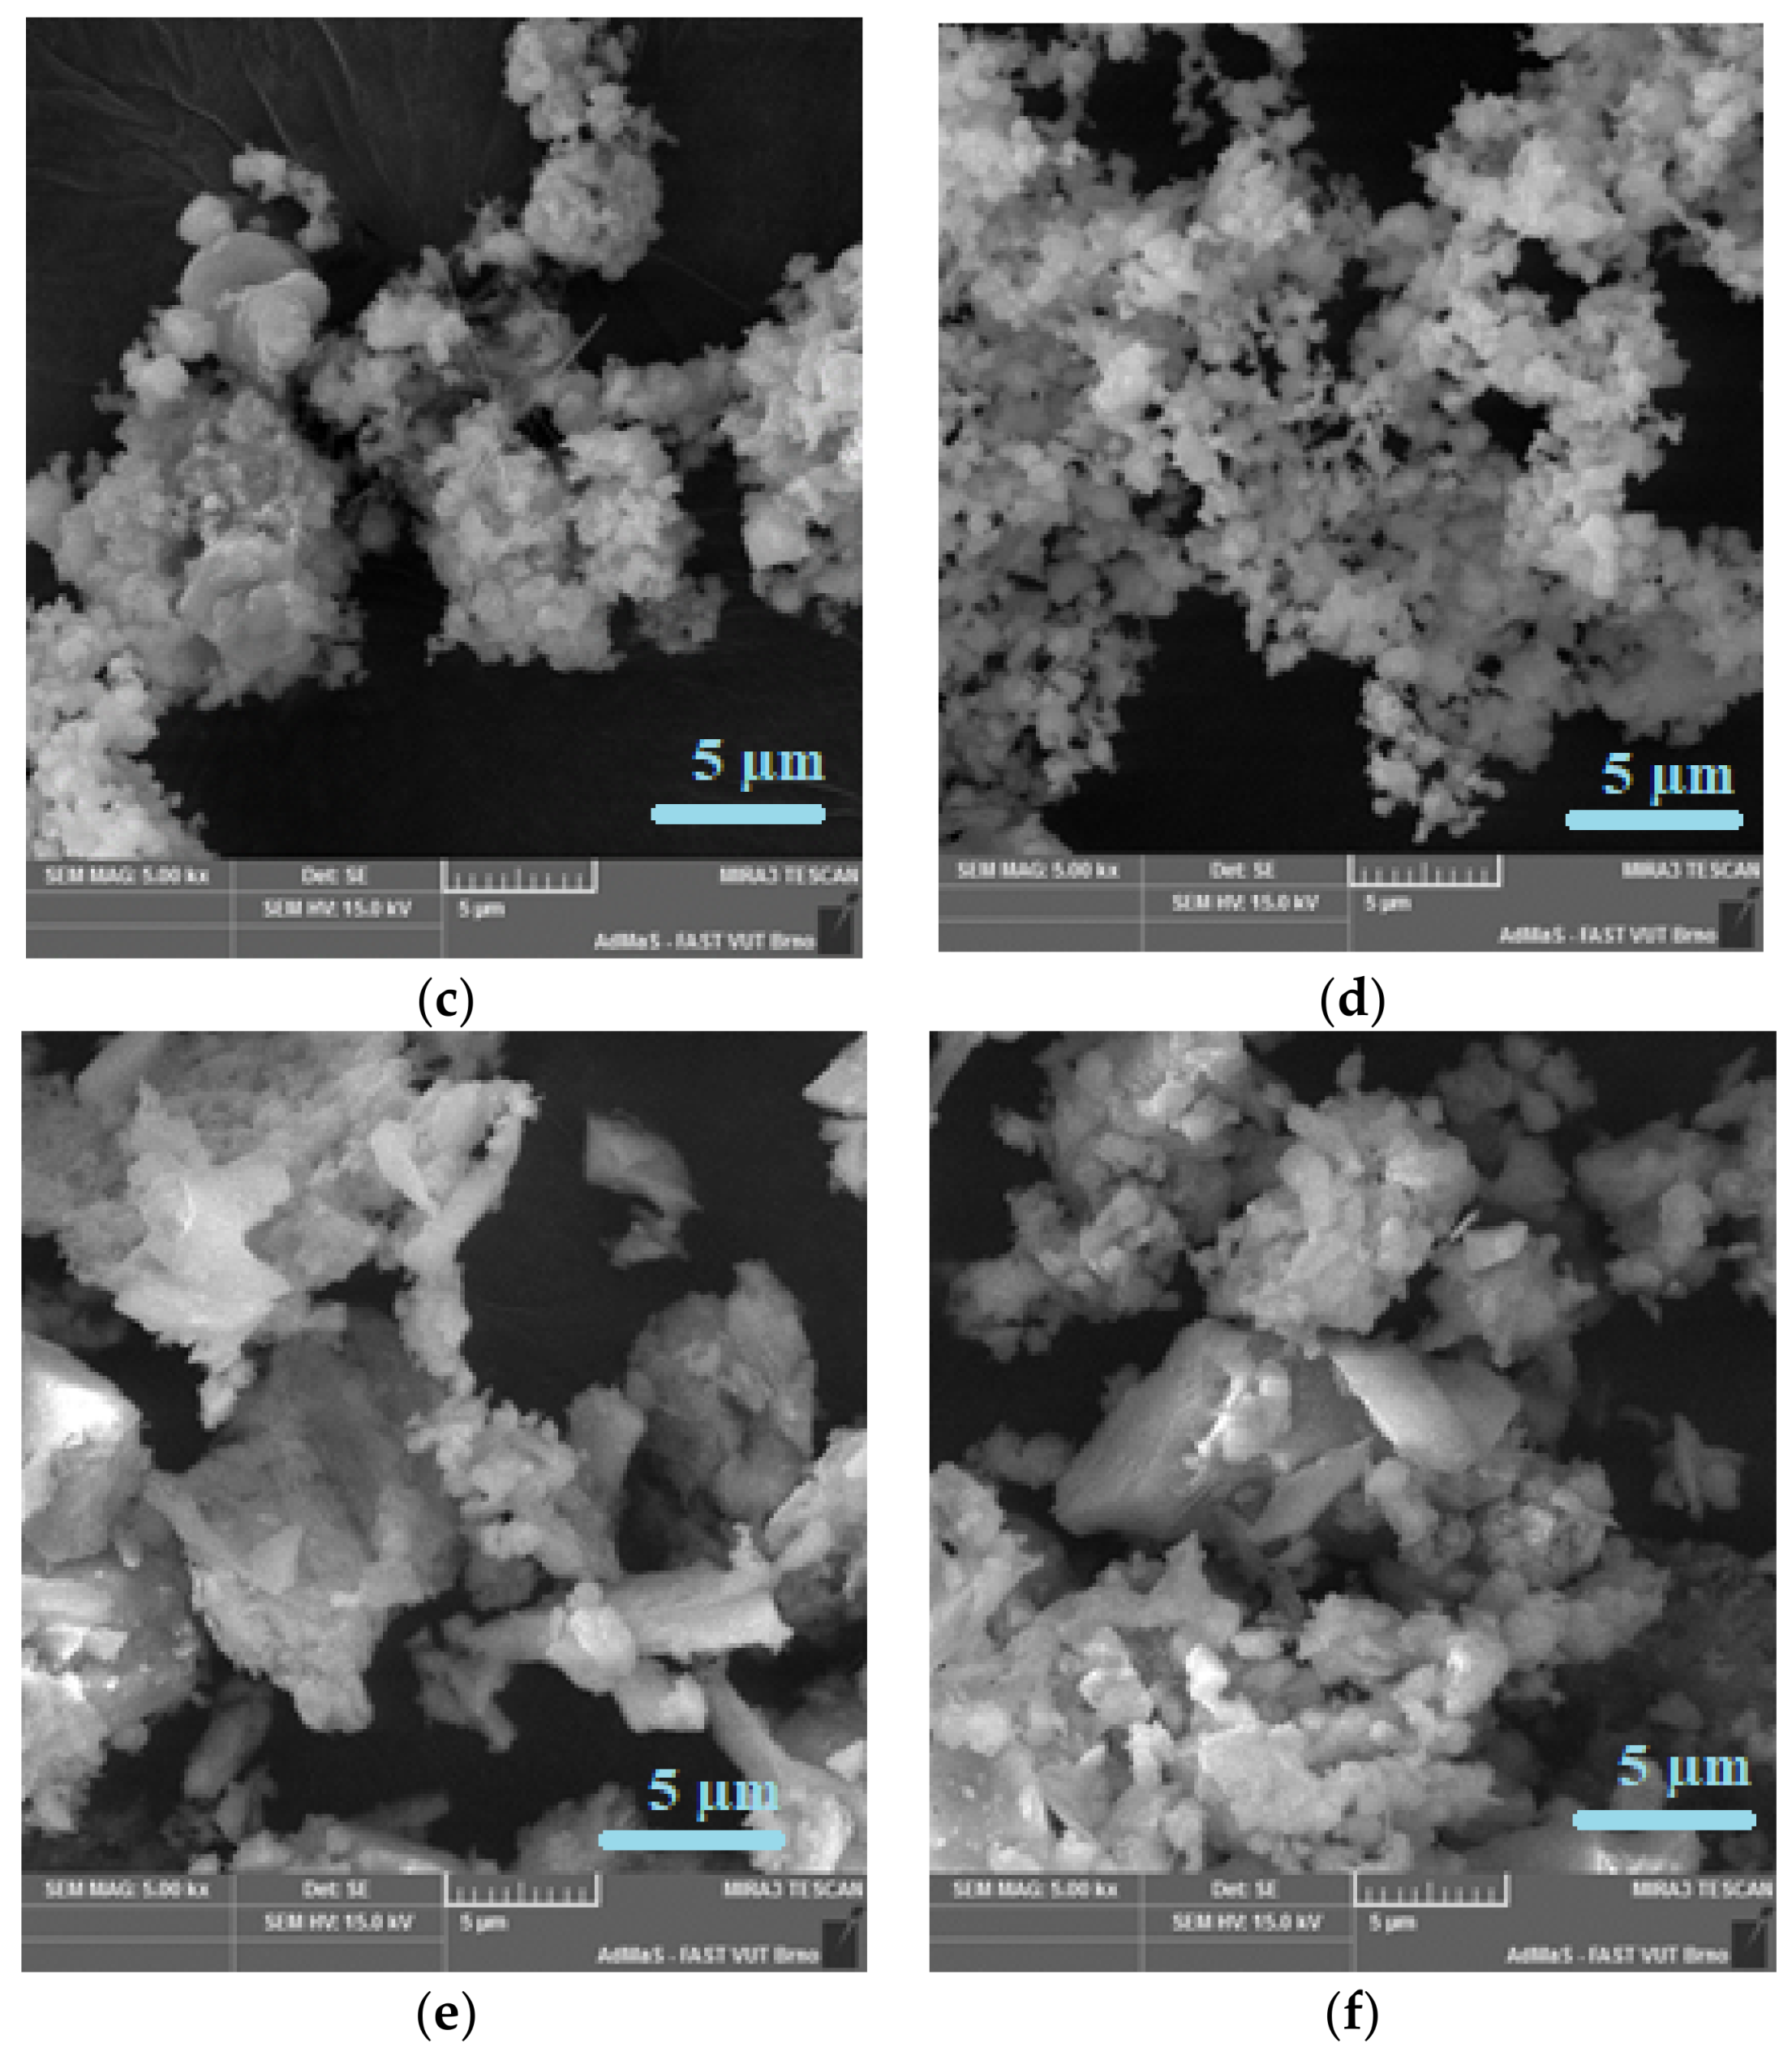
To characterize the degree of the shape of the filler particles, a scanning electron microscope (SEM) with 5000× magnification was used. Figure 7a shows the used quartz dust and the shape of its particles (mostly sharp edges). Figure 7b shows that the fly ash (CFBC) particles had various shape indexes with a large deviation in particle size. The end product (Figure 7c) contains relatively small particle-created clusters; this image shows a grain of the cenosphere in the top-left. Cement bypass dust (CBPD) (Figure 7d) contains the smallest particles; however, these particles create significant clusters.
SEM photomicrographs of the solidification products SF1 and SF2 (Figure 7e,f) show that the individual components of the filler were perfectly homogenized, and the pollutants were effectively incorporated by the solidifying agents (CFBC fly ash + quartz powder).
3.1.3. Specific Gravity and Specific Surface Area
Specific gravity of the three fillers (Table 2) is, on average, the same, while the specific surface area (fineness) of the quartz powder is considerably lower, although the quartz powder (REF) contained a higher proportion of small grains. Fillers in the form of solidifications products (SF1, SF2) showed almost the same value of specific weight and specific surface.
3.1.4. Leaching of Hazardous Waste and Fillers
All tested materials conform to the requirements of Regulation 294/2005 Coll. (as amended) for chlorides, Hg, As, Ba, Cd, Cr, Cu, Mo, Ni, Sb, Se, Zn, extractible organic halogens, Cr, Ni, V, benzene, xylene, toluene and pH values, and dissolved organic carbon (DOC). The results that do not conform to the requirements of the regulation (chlorides, sulphates, dissolved substances (DS), Pb, and As) are shown in Table 3.
3.1.5. Determination of the Concentration of Harmful Substances in Dry Matter
Table 4 lists heavy metals (Cd, Hg) that exceed the content of pollutants in waste, as prescribed by Regulation 294/2005 Coll. (as amended) for ground surface. Other unlisted pollutants are not mentioned because their amount in by-products (HW) and fillers did not exceed the limits.
3.1.6. Ecotoxicity
The results of ecotoxicological tests done in accordance with Regulation 294/2005 Coll. (as amended) for the solidified fillers (SF1, SF2) and their resistance to living organisms are stated in Table 5. Unlike the filler SF1, the filler SF2, containing the cement bypass dust (CBD) as hazardous waste, 379 failed to meet Poecilia reticulata’s mortality requirement. The increased mortality of this fish was caused by the presence of hazardous substances that contain CBD, such as lead. However, the inhibition of Sinapis alba growth was more favorable for the SF2 filler. The results of these tests also showed that different organisms react differently to the presence of specific pollutants. None of the fillers (SF1, SF2) met all the requirements of the Regulation 294/2005 Coll. (as amended), stated in Table 1, for the waste utilization in the top reclamation layer at least 1 m thick from the ground 385 surface.
3.2. Coatings Test Result
3.2.1. Consistency
Consistency was determined based on the time of flow from the Ford cup with a flow nozzle diameter of 12 mm. The results stated in Table 6 imply that the time of flow was shorter for the reference samples with quartz powder because of the lower specific surface area of the used filler. Optimal consistency was achieved with 50% of the filler in polymer resin.
3.2.2. Application Test
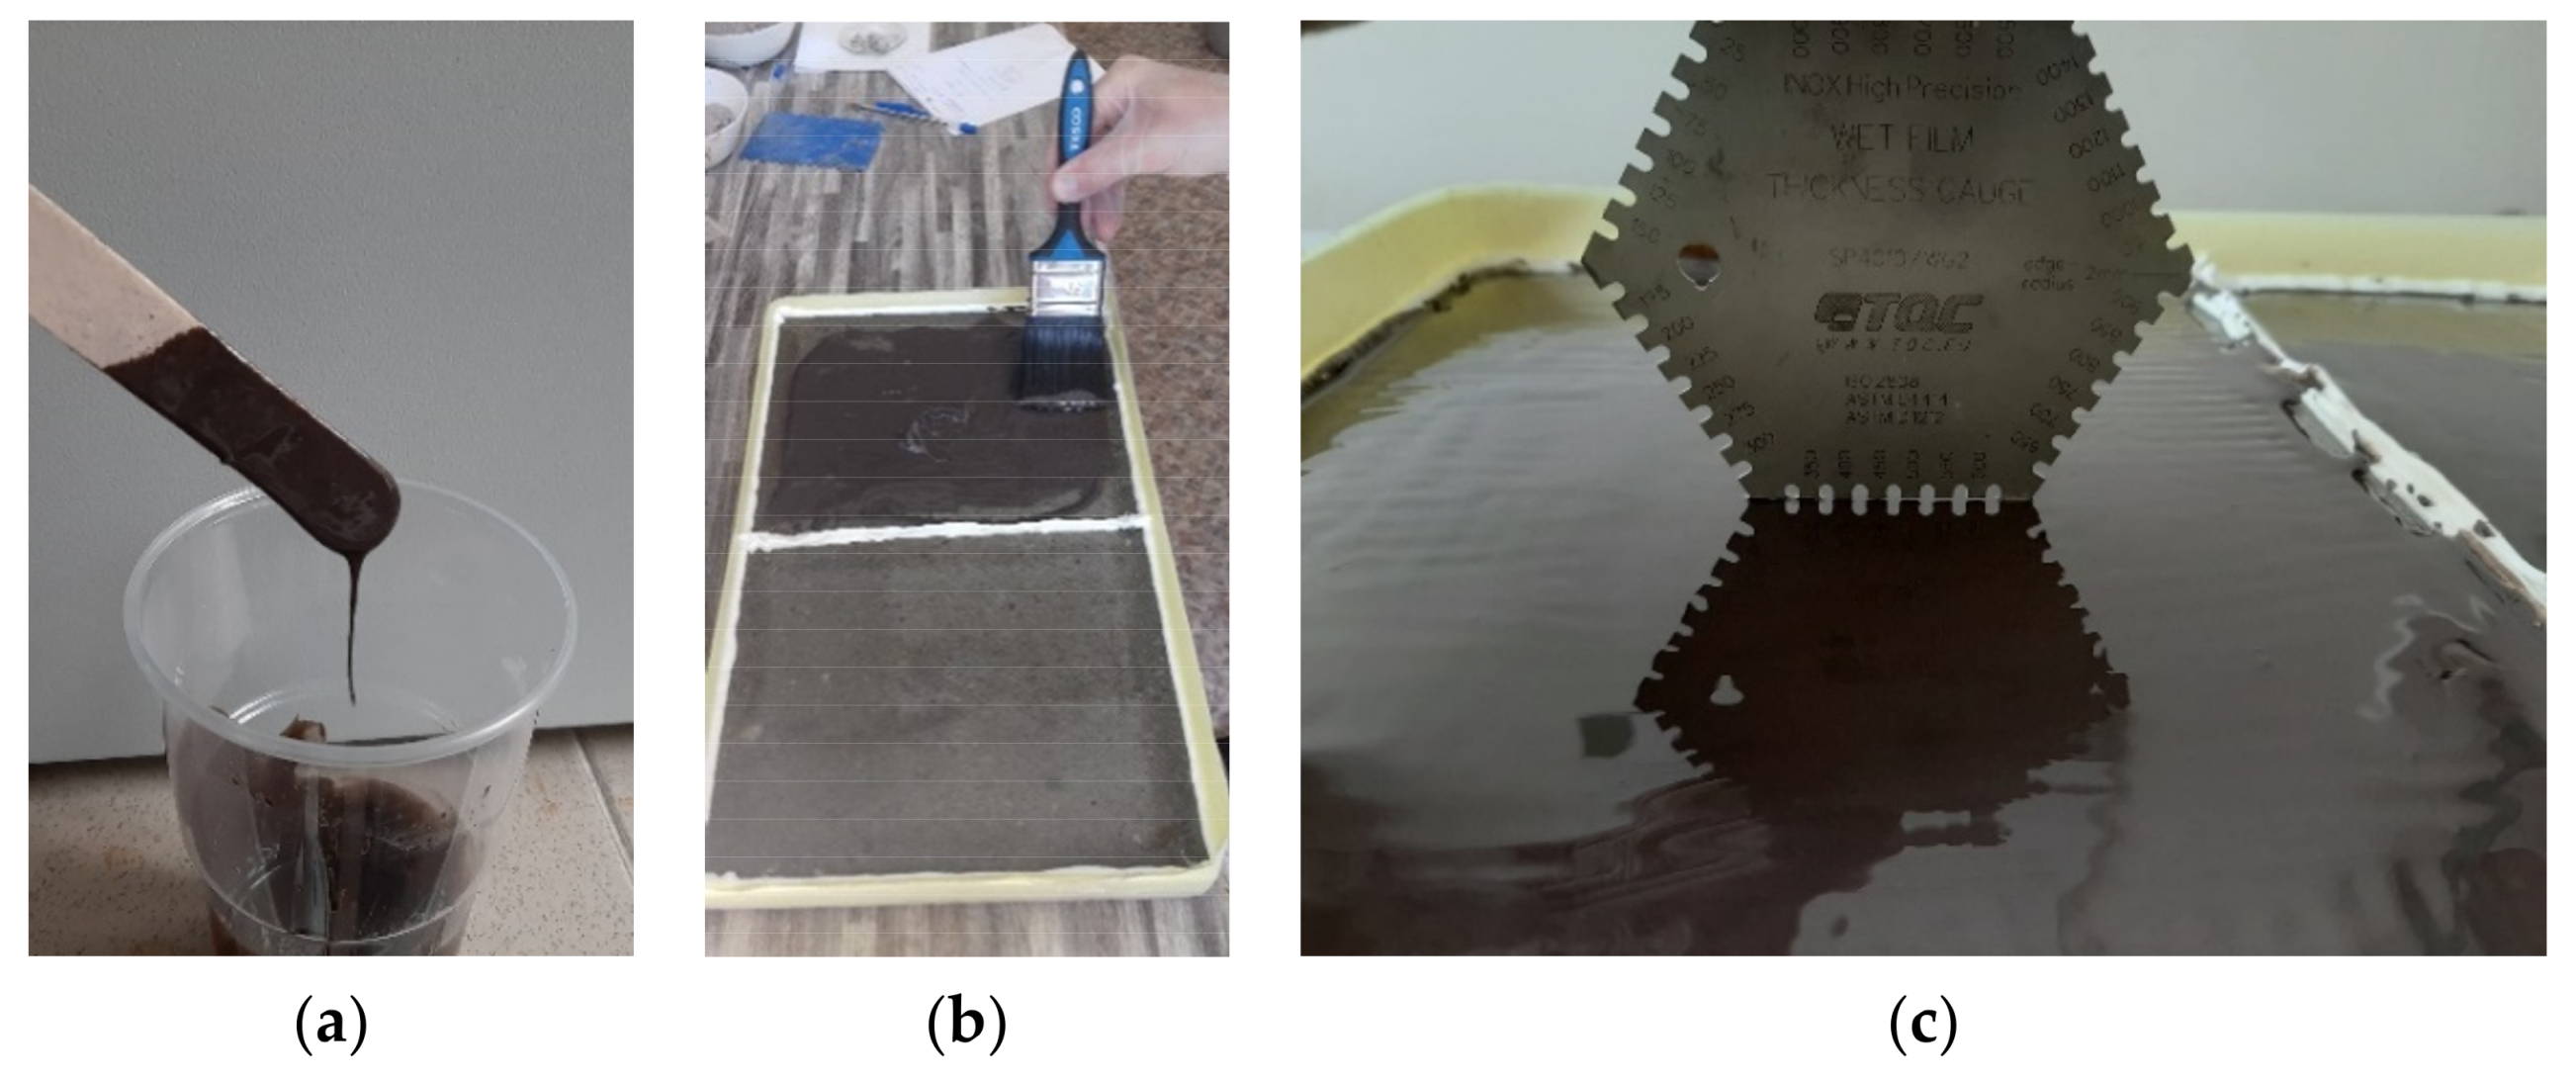
The application test (Figure 8) is based on application of the developed material with a brush on the cement-based substrate (cement-bonded particleboard), while the observed parameters include the amount running down, grooves, folding, capability of bridging cracks, segregation of the filler in the polymer binder, and thickness in a fresh state or on the resulting surface.
The application test revealed that 50% filler seems to be an optimal proportion for polymer coating, both with epoxy and polyurethane. Coatings with 50% filler did not show any particle sedimentation. This applicability was found to be the best among all filler grades, and the cured surface was smooth and even.
3.2.3. Tensile Properties
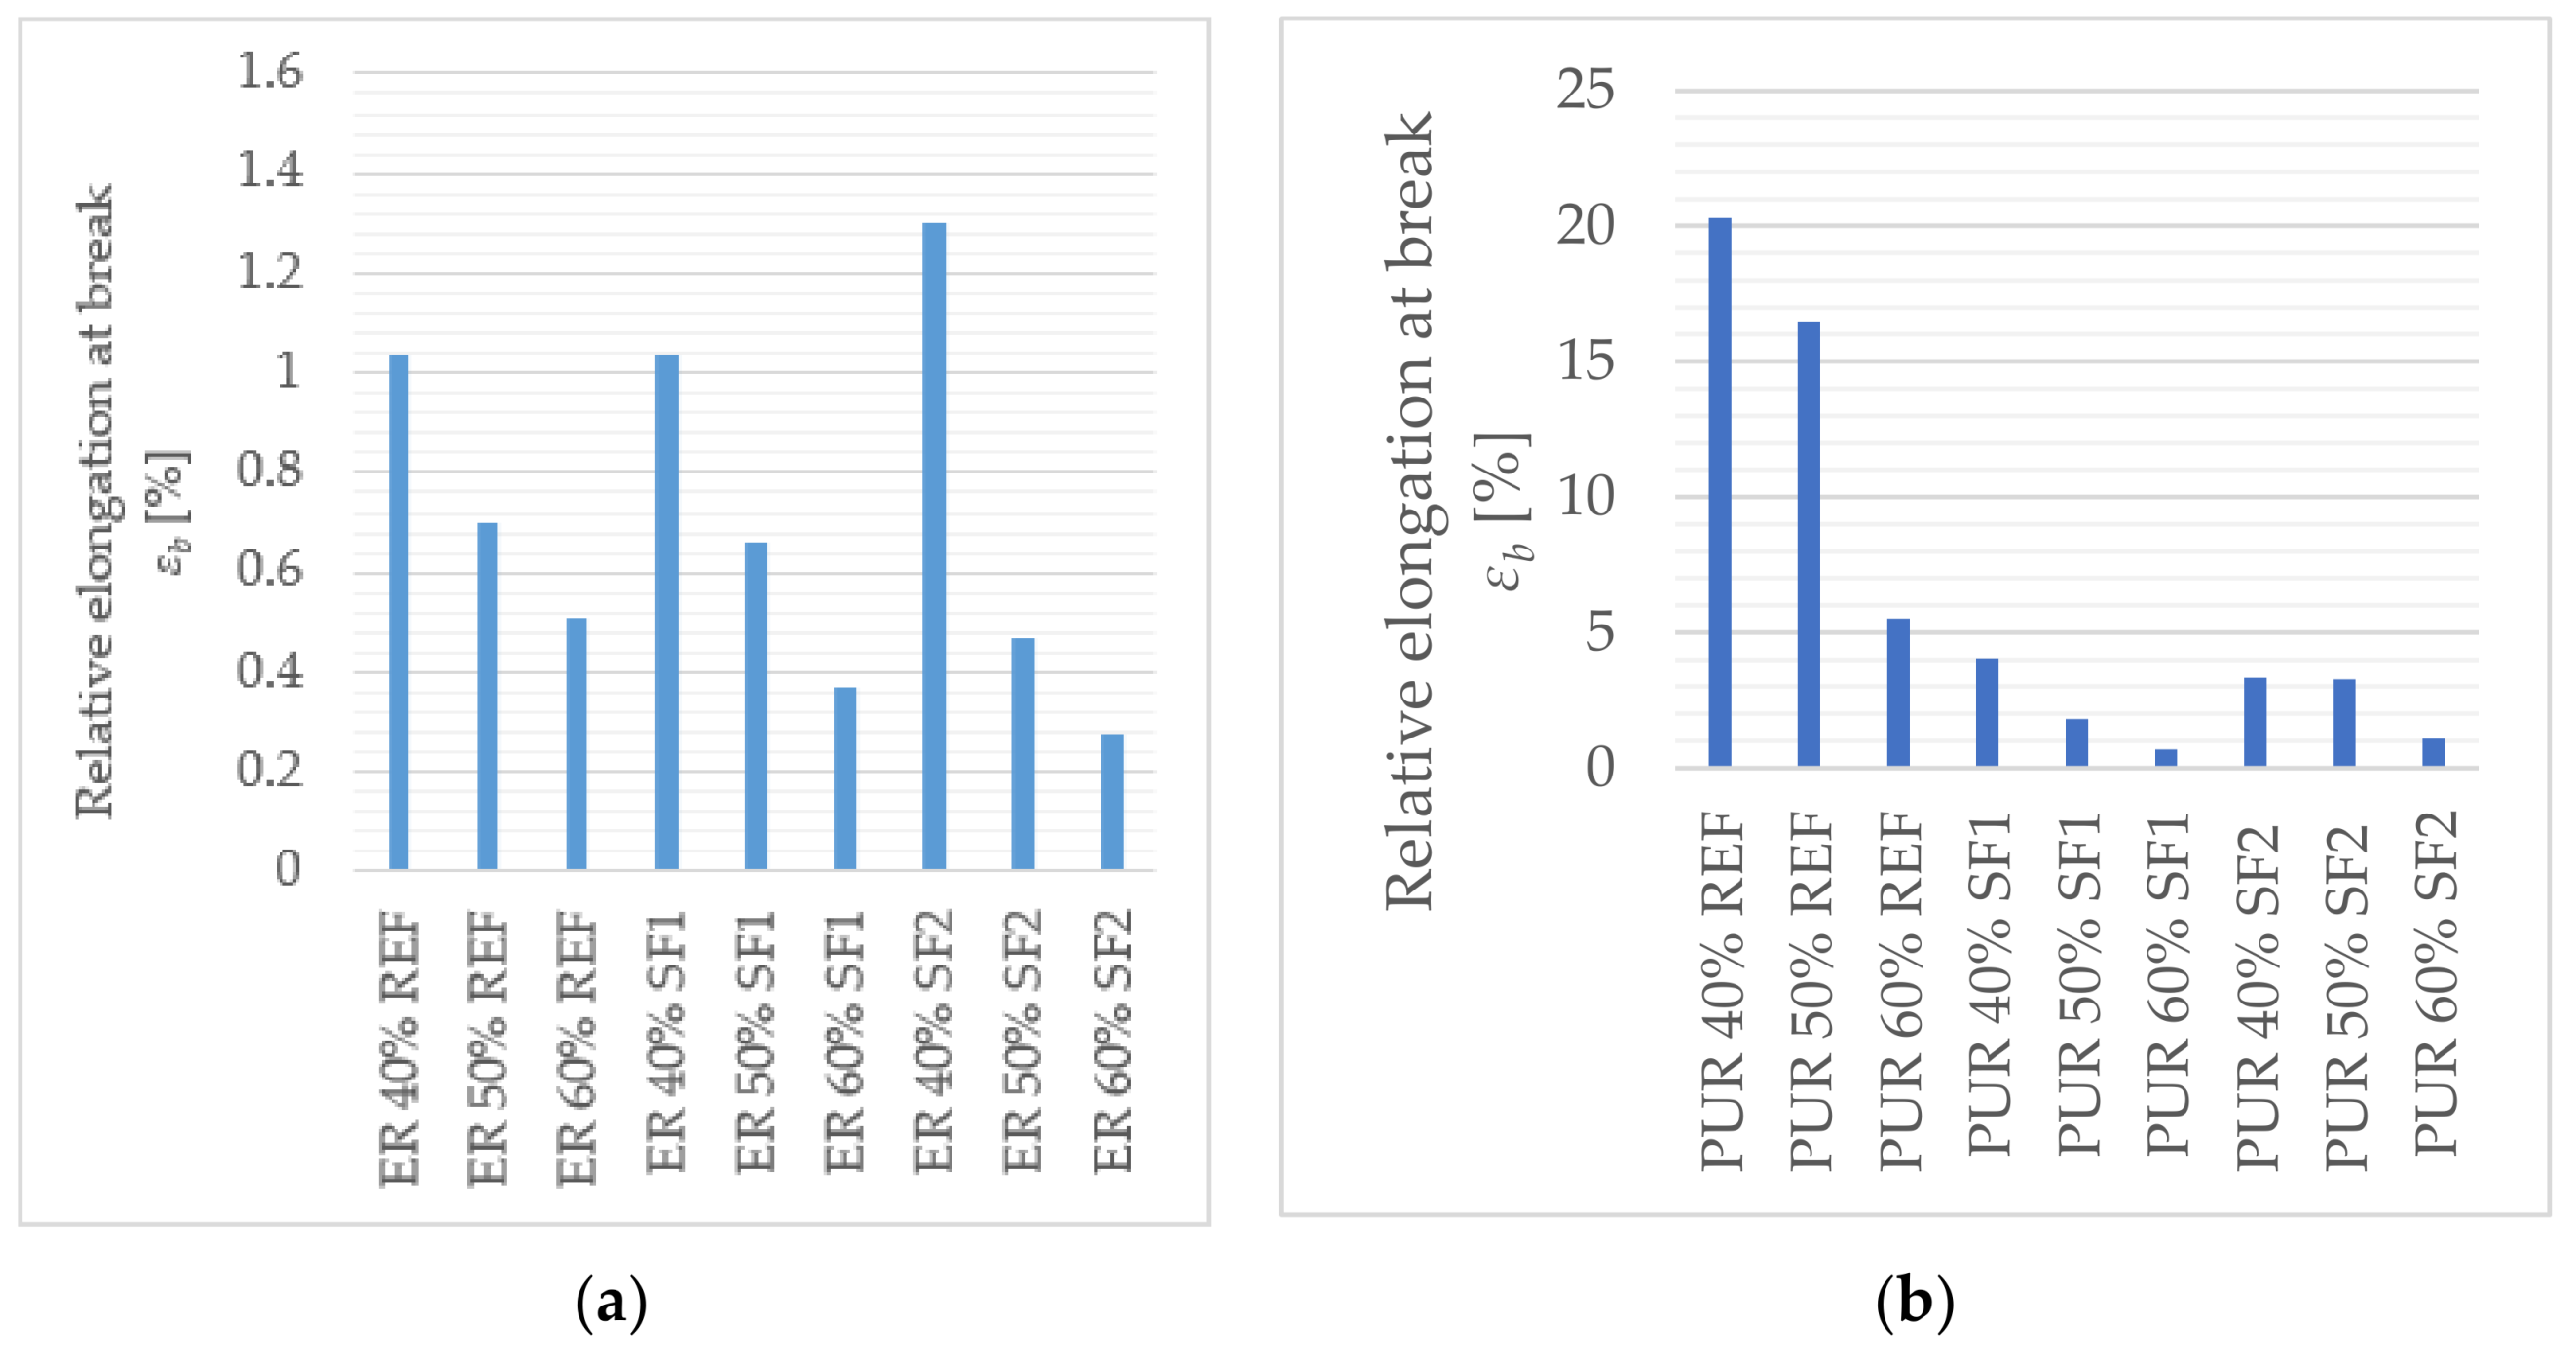
Materials with the polyurethane (PUR) binder show significantly higher values for relative elongation at break. The highest value of relative elongation at break (εb) was measured in the material with quartz powder filler at a proportion of 40%; increasing the proportion of the filler caused a decrease in value. The measured values are shown in the following diagrams (Figure 9a,b). The addition of an alternative filler (SF1, SF2) yielded minimum values of εb. The value of the relative elongation at break (εb) of the epoxy resin without any filler was 2.2%; εb of unfilled PUR resin was 27.5%. These values were identified experimentally using the same standard and test equipment as that of the tested coatings; the values of εb are shown in Figure 9.
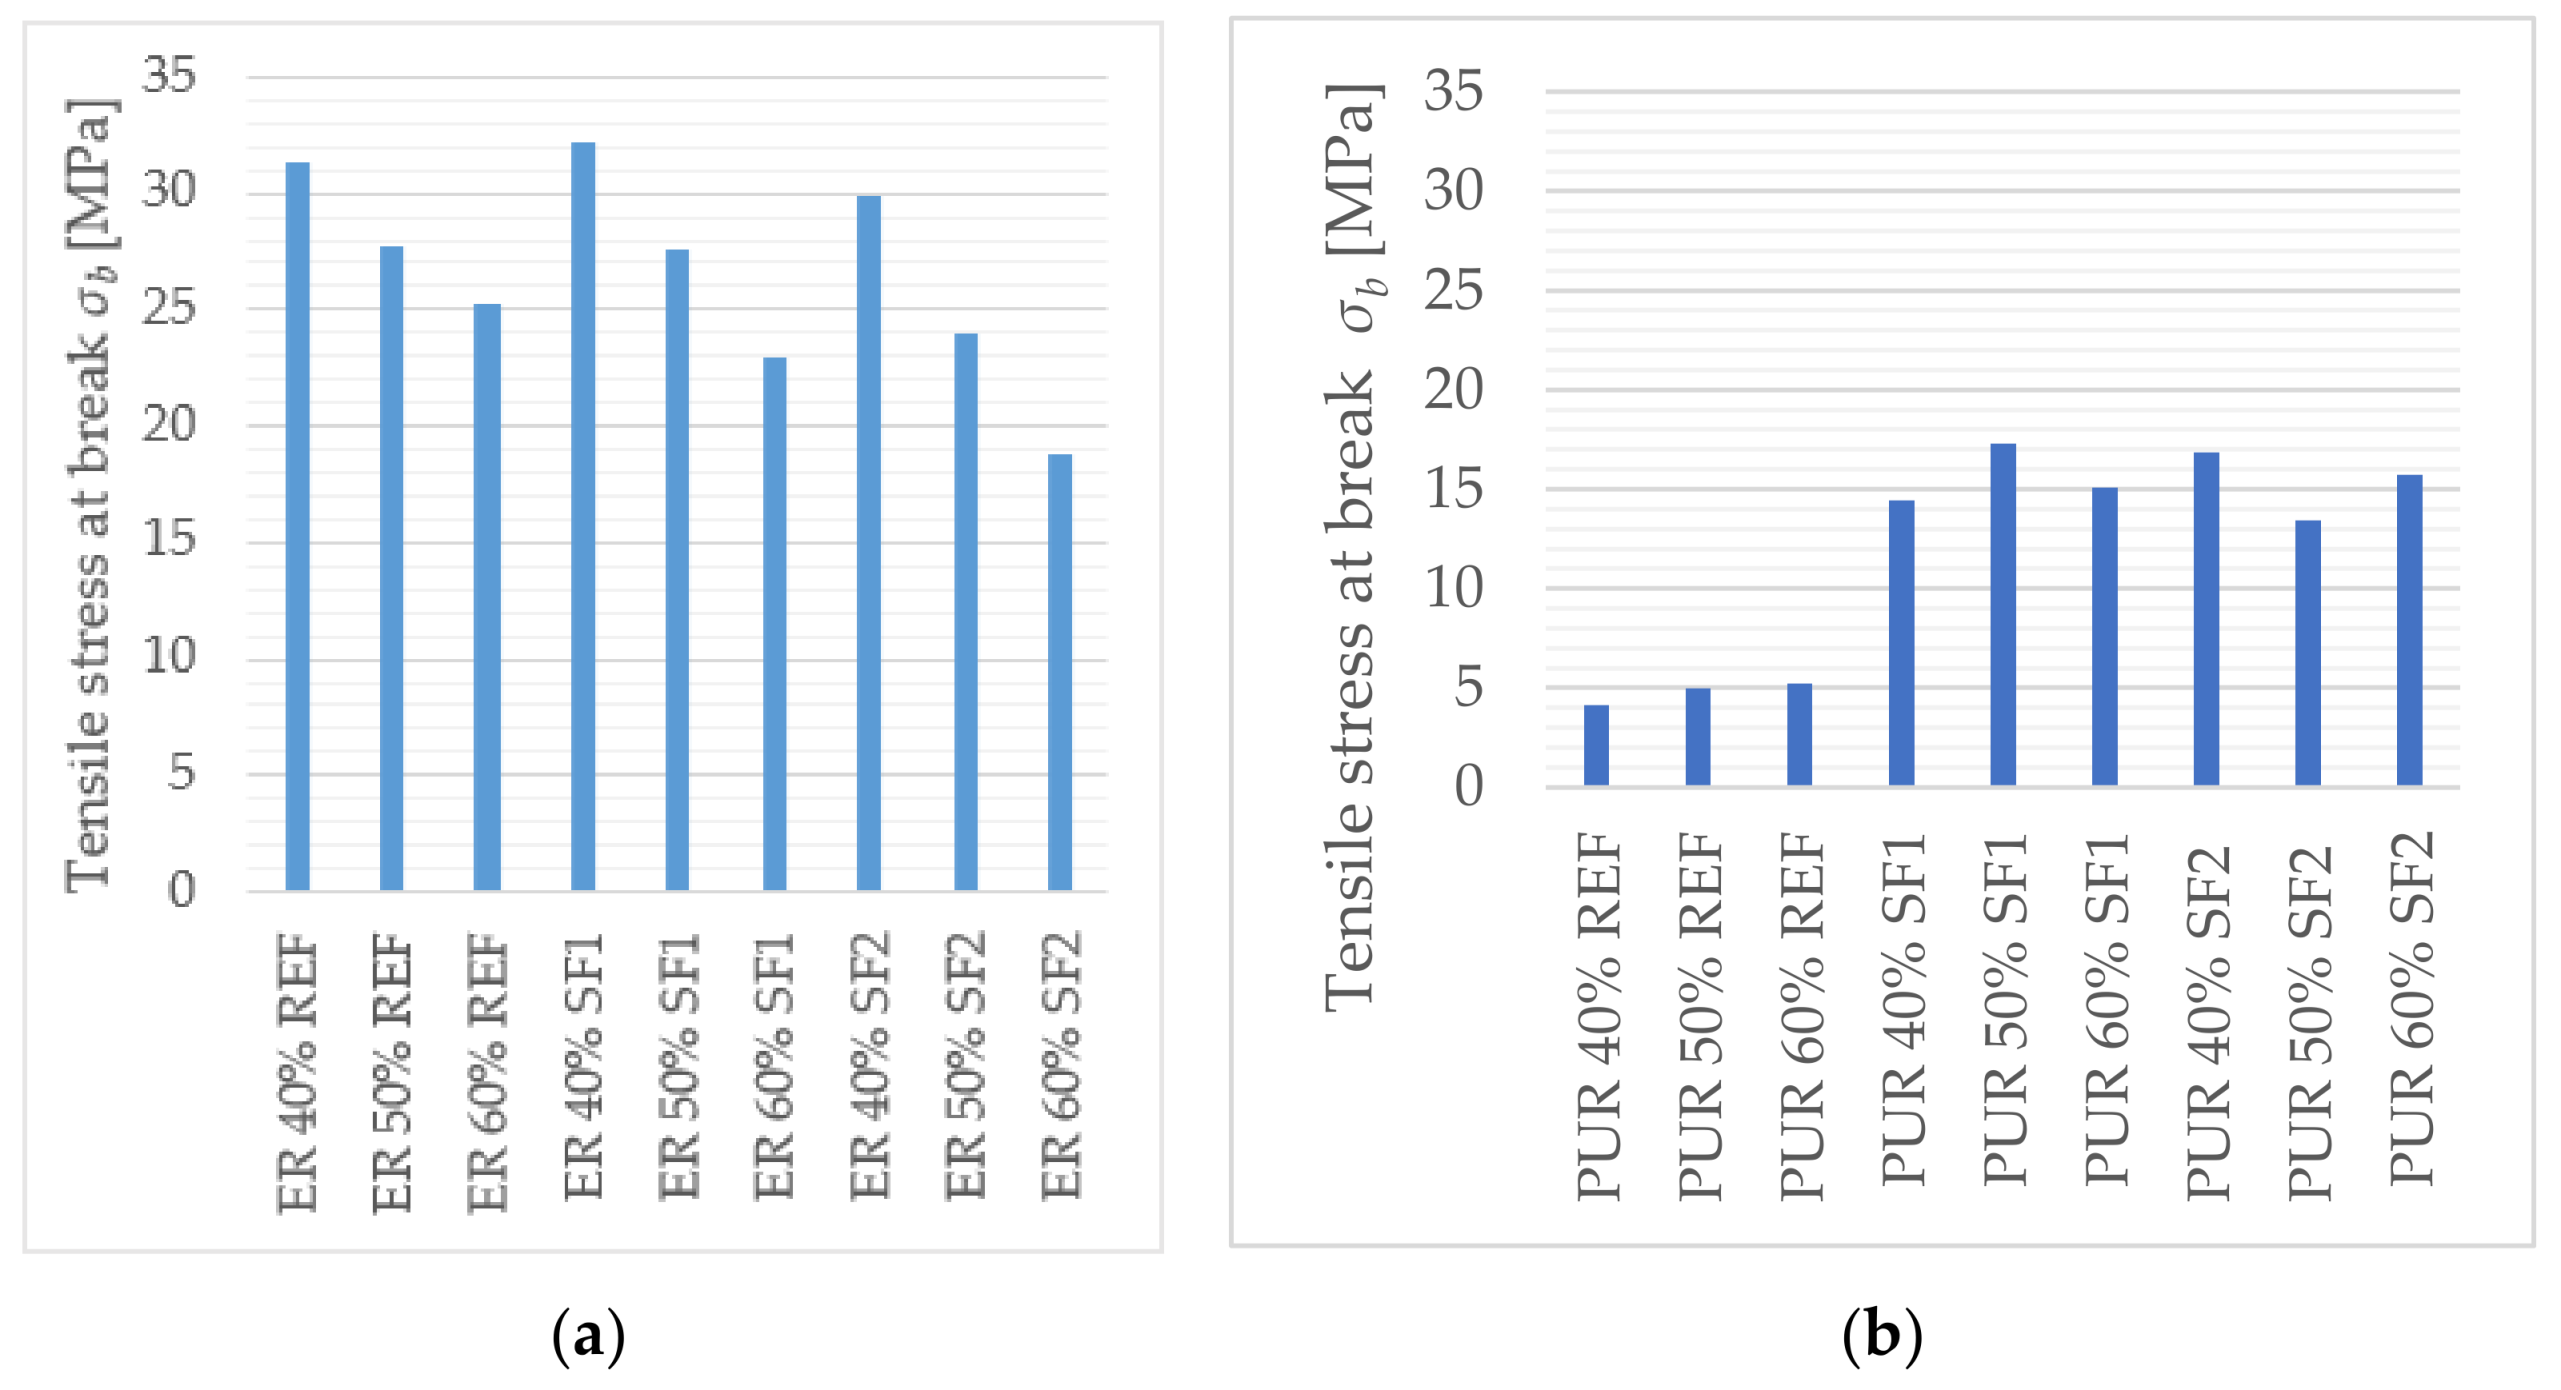
Higher values of tensile strength at break were observed for samples with the epoxide resin binder. The maximum tensile stress of all tested coatings (PUR, ER) was 32 MPa (ER 40% SF1). The polyurethane resins did not show such strength; maximal strength was observed in the sample with 50% proportion of SF1 filler and 40% proportion of SF2 (around 17 MPa). The values of tensile strength at break are shown in the following diagrams (Figure 10a,b).
These results imply that the addition of an alternative filler based on solidification products SF1, SF2 has a positive impact on tensile stress when a polyurethane binder is used. The tensile stress of the samples with an alternative filler was found to be double that of the reference quartz powder (Figure 9b and Figure 10b). The polyurethane binder improved incorporation of the developed fillers into the polymer matrix. Polyurethane resin was found to be more flexible than epoxy resin, which made it possible to increase its strength just by adding fillers SF1, SF2, showing approximately two times higher surface area than the reference quartz flour.
3.2.4. Adhesion of Coatings
Adhesion of the developed coatings to concrete substrate was examined in the select materials, fulfilling the requirements of consistency and applicability. This process proved that the adhesion of the coatings to concrete was higher than the tensile strength of the concrete substrate, or adhesion of the used glue based on epoxy resin. As is shown in Table 7, the adhesion limit of the epoxy adhesive was exceeded in most cases. The average adhesion value was determined from three measurements and place of failure was the same within one formulation (glue or substrate).
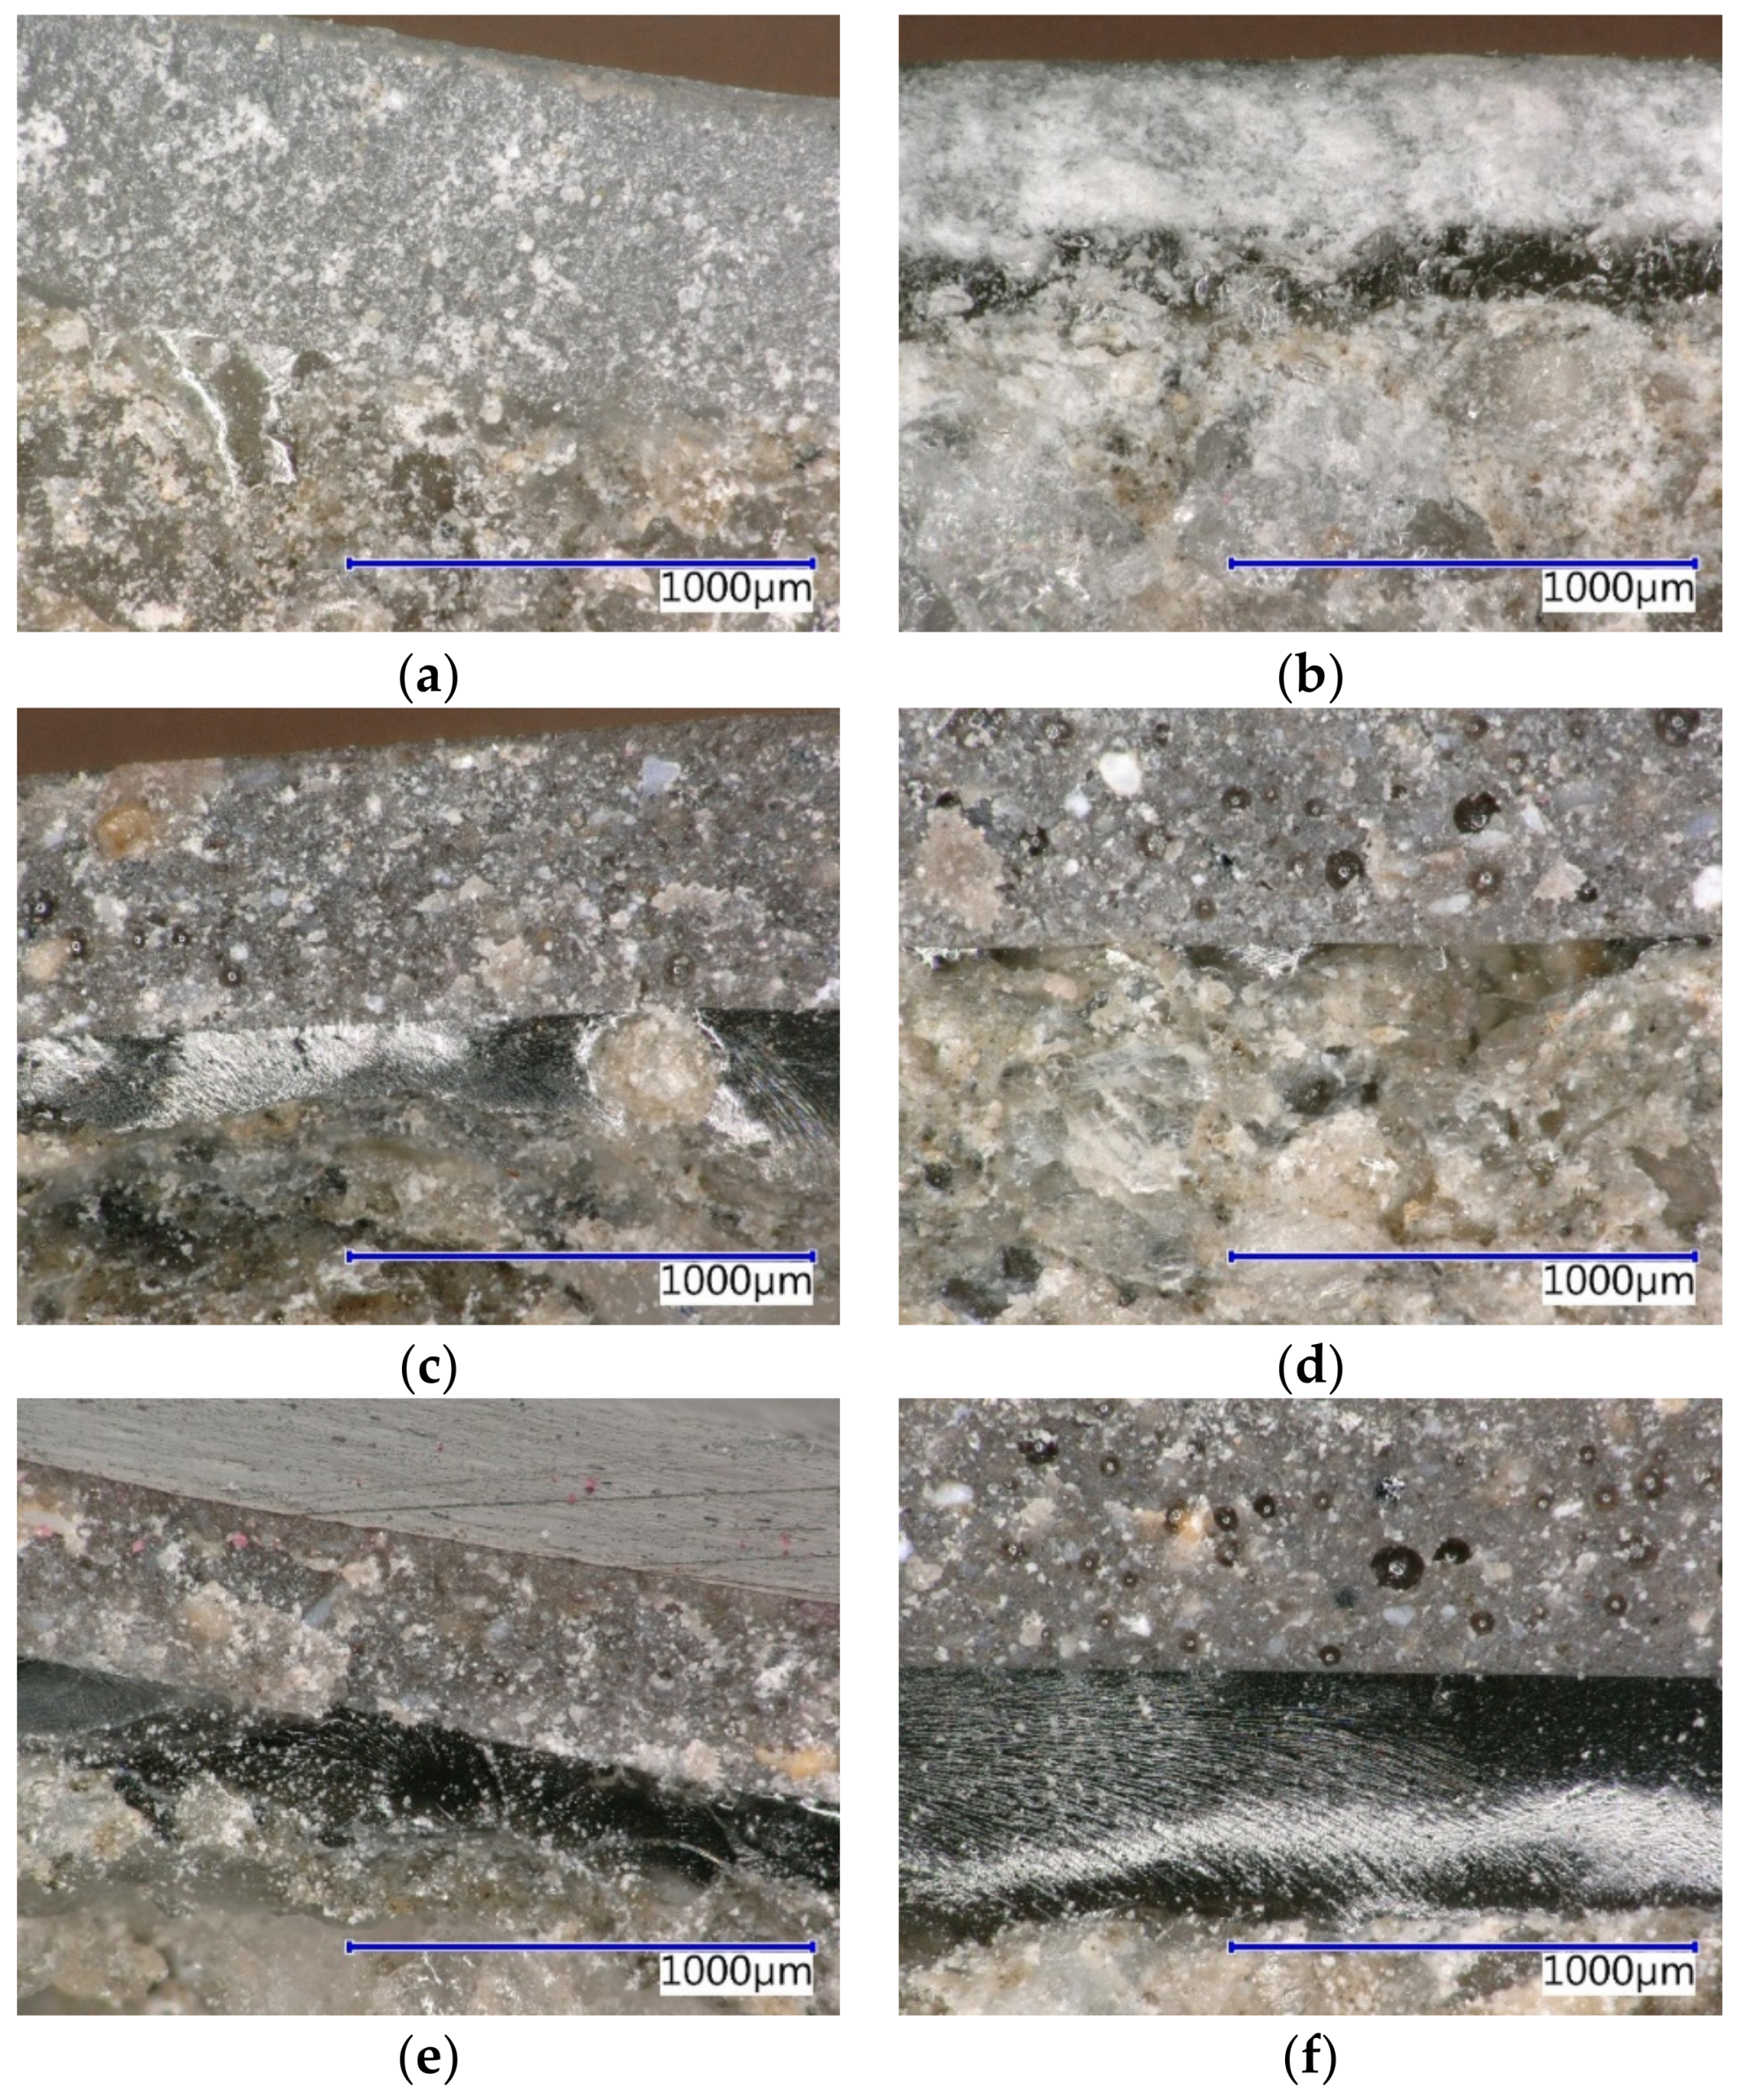
High values of the coating adhesion are caused by perfect anchoring of the mass to the surface of the subconcrete, which is evident from the optical microscope images. Figure 11a–f shows the principles of anchoring for the developed coats in the concrete substrate. It is clearly visible that resin leaked into the open pores of the concrete and created a perfect bond between the coat and the substrate. All specimens showed a strong contact zone between the coating layer and the subconcrete. None of the examined samples showed a separation layer with air gap in the contact zone. Images from the digital optical microscope show high cohesion between the concrete substrate and the coating.
3.2.5. Abrasion Resistance
Considering the results of resistance to abrasion according to the Böhm test method (Table 8), the coating containing filler SF1 showed properties comparable with those of the reference quartz powder, while filler SF2 had better properties. A comparison of binders shows that when polyurethane resin (PUR) is used, volume reduction is smaller than that with the epoxide binder. As a result, the last column of Table 8 has to be considered—weight loss after 16 cycles (A16). After four cycles, the PUR 50% REF sample exhibited the lowest weight loss probably due to sedimentation of the filler in the polyurethane binder.
The following images from an optical microscope (Figure 12 and Figure 13) show the mode of failure after testing resistance to grindability. Flawless grinding is visible in the top layers, including the filler component. Both fillers show a unified color. These results imply that the developed polymeric coatings containing hazardous waste, should, in practice, resist long-term cyclical mechanical grinding. However, 16 cycles may not be enough to identify the same behavior in the long-term, when the number of cycles is extremely high.
3.2.6. Surface Hardness Shore D
Using progressive secondary raw materials in the form of solidification products as filler (SF1, SF2) prepared by the dry homogenization of input materials (with neither filler prepared by wet pelleting) caused significant differences in surface hardness, compared to the reference samples filled only with quartz powder (REF). Specific values of hardness Shore D are stated in Table 9. The results show that the surface hardness value depends primarily on the type of polymer resin used. The polyurethane matrix samples (PUR) exhibited approximately 15% lower surface hardness because, as seen from the results of the mechanical parameters, these resins are more flexible and exhibit a lower modulus of elasticity than the epoxy resin samples. With the PUR 50% REF sample, a sedimentation of the filler probably occurred, which resulted in lower hardness.
3.2.7. Determination of Impact Resistance
Specific values of the coatings’ impact resistance are shown in Table 10. The polyurethane coating with 50% filler SF2 content showed the highest impact resistance when cracks on the coating occurred on impact of the firing pin from a height of 85 cm, which corresponds to the value of 8.5 Nm. Epoxides are not as elastic as polyurethanes, and therefore these coatings are damaged at lower impact heights (70 cm). The results imply that the type of filler has no significant impact on the resistance of the material, but the type of polymer resin does.
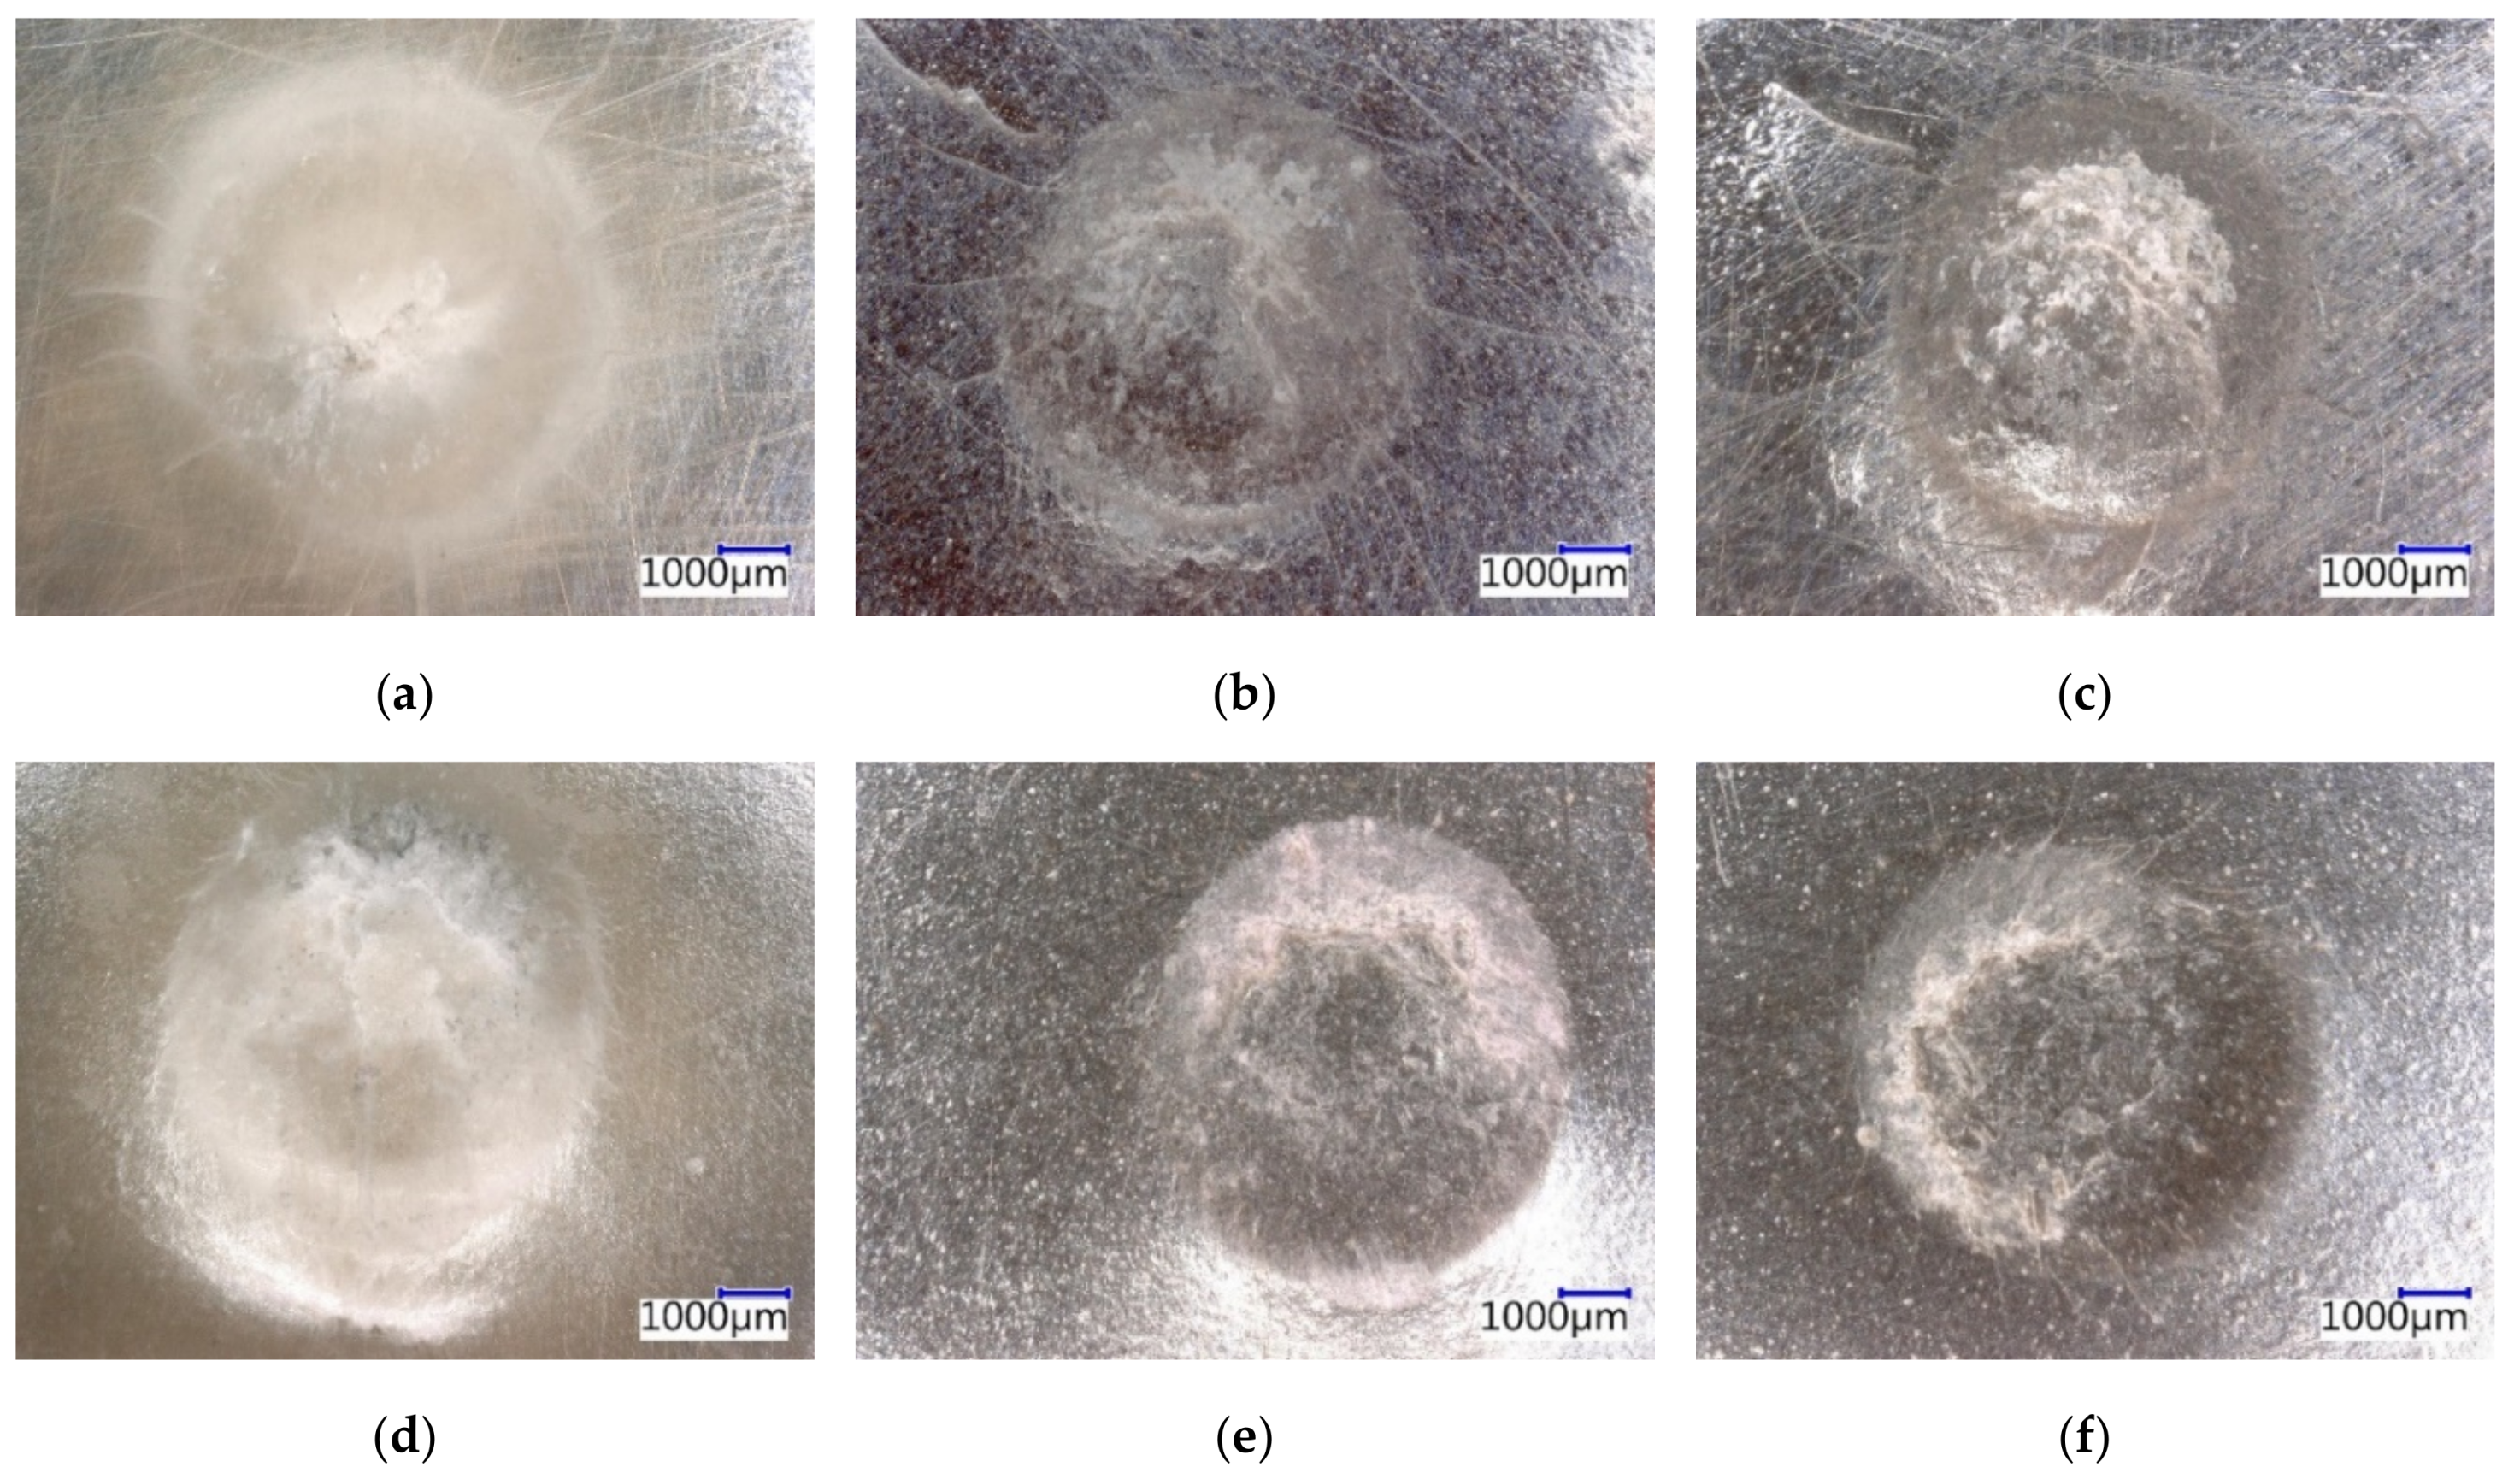
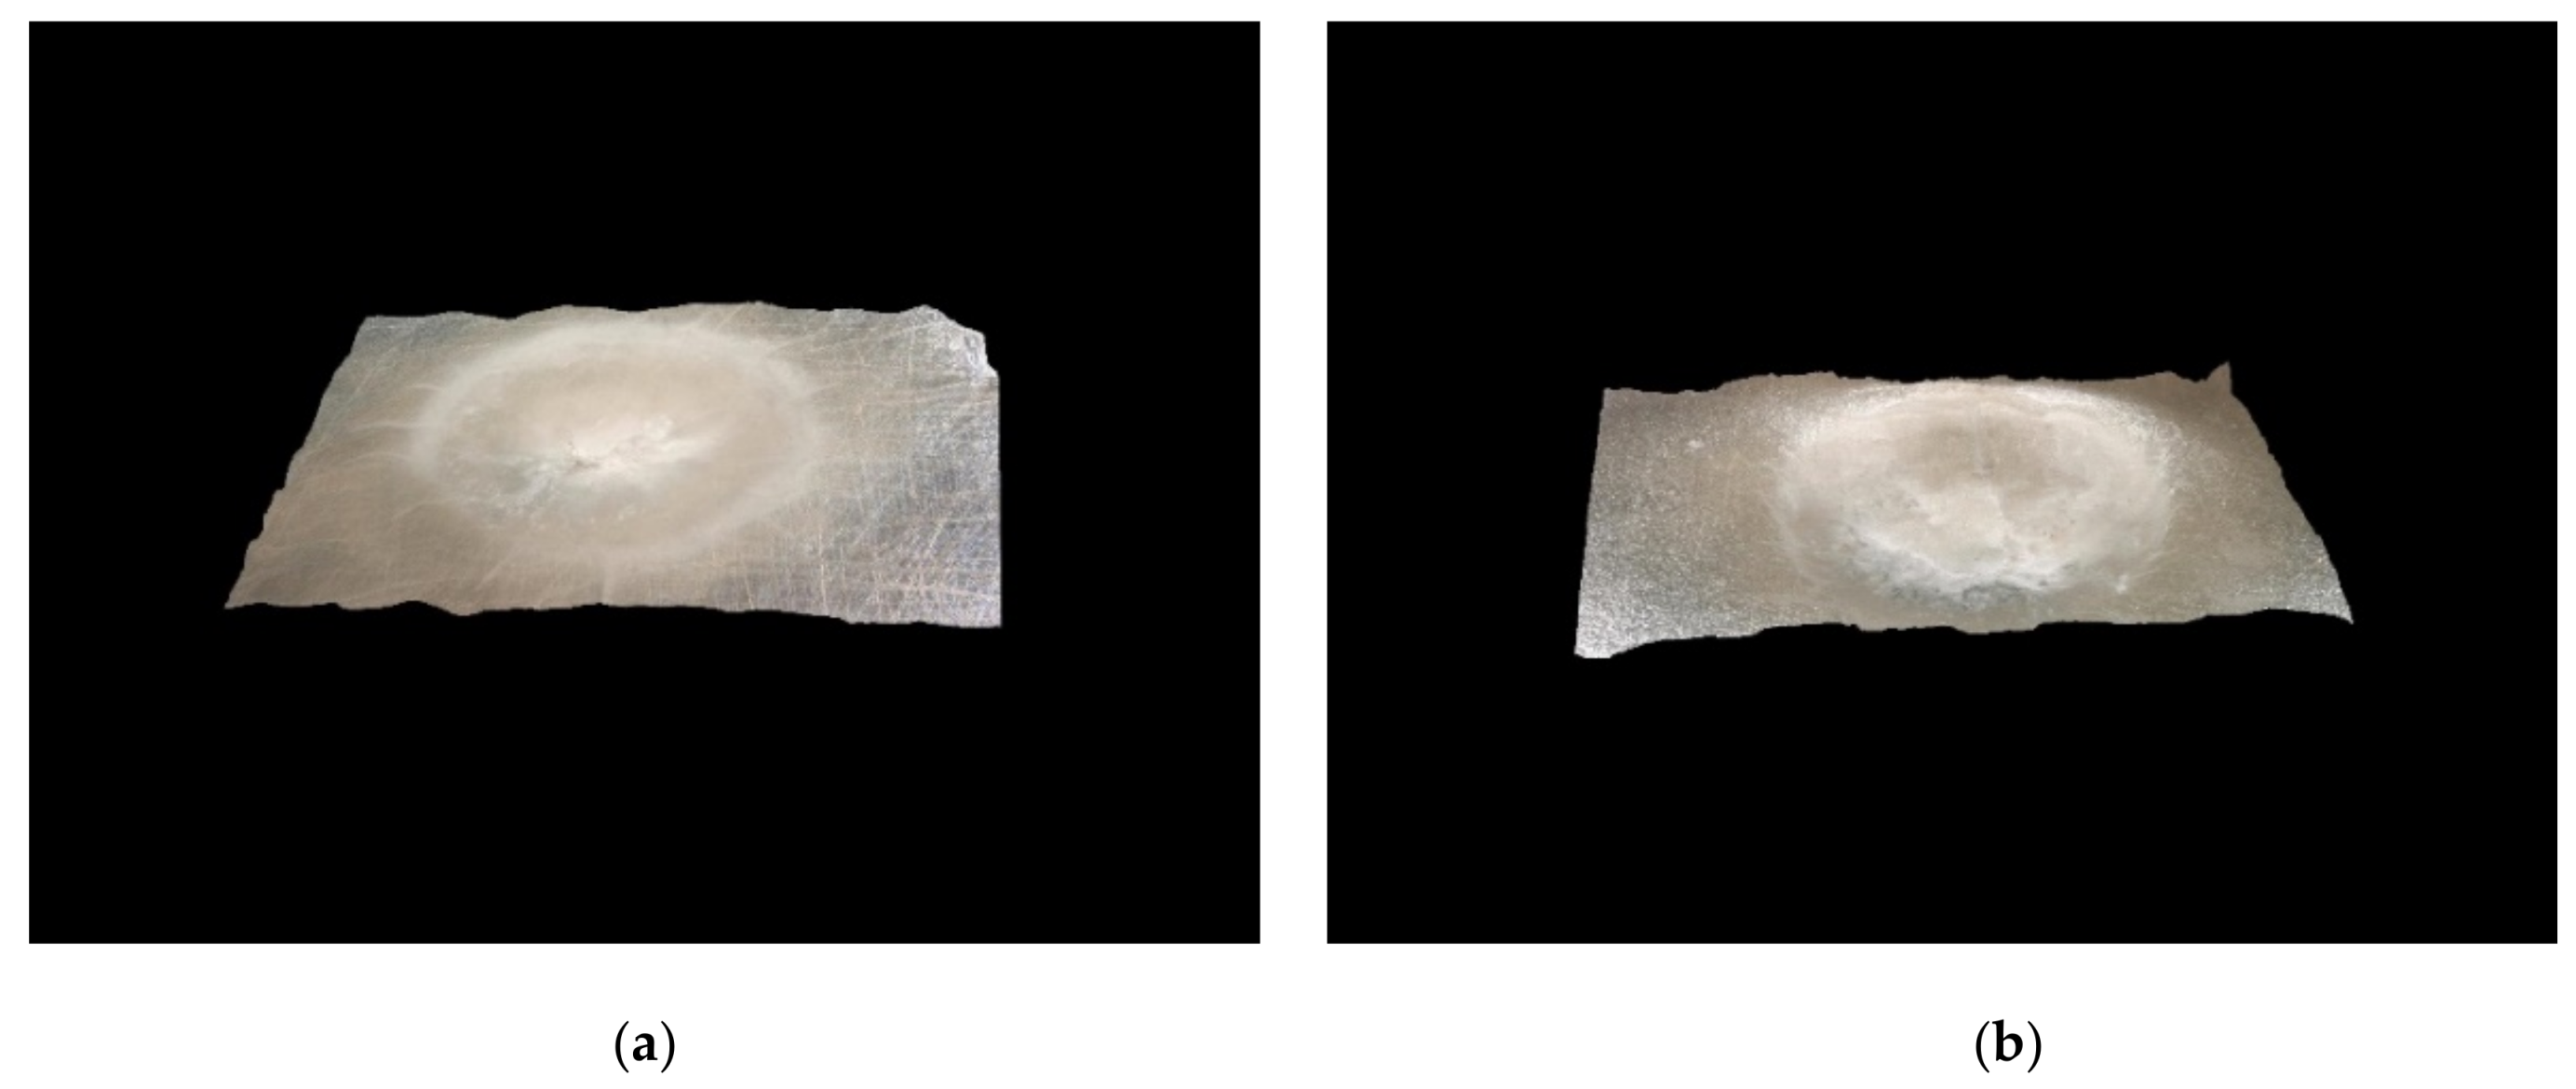
Figure 14a–f shows the failure of the sample after testing of impact resistance using a large area of firing pin indentor. The circular outline connected with weight imprint is clear in all the samples (portrayed in Figure 14; the area of the weight imprint is also shown). The coatings with the reference filler had the most significant failure mid-impact, and microcracks spread from the center to all areas around the outline. The results of this test imply that epoxy coatings created stronger, but less flexible, structures. The samples showed microcracks with an average width of 10 μm using the quartz powder filler and an average width of 6 μm with the SF1 and SF2 fillers. When polyurethane was used as the coating binder, there were no microcracks; all the tested samples showed wrinkling of the mass and formation of a slight depression. Three-dimensional views of the weight imprint, taken by a digital optical microscope, are illustrated in Figure 15.
3.2.8. Chemical Resistance
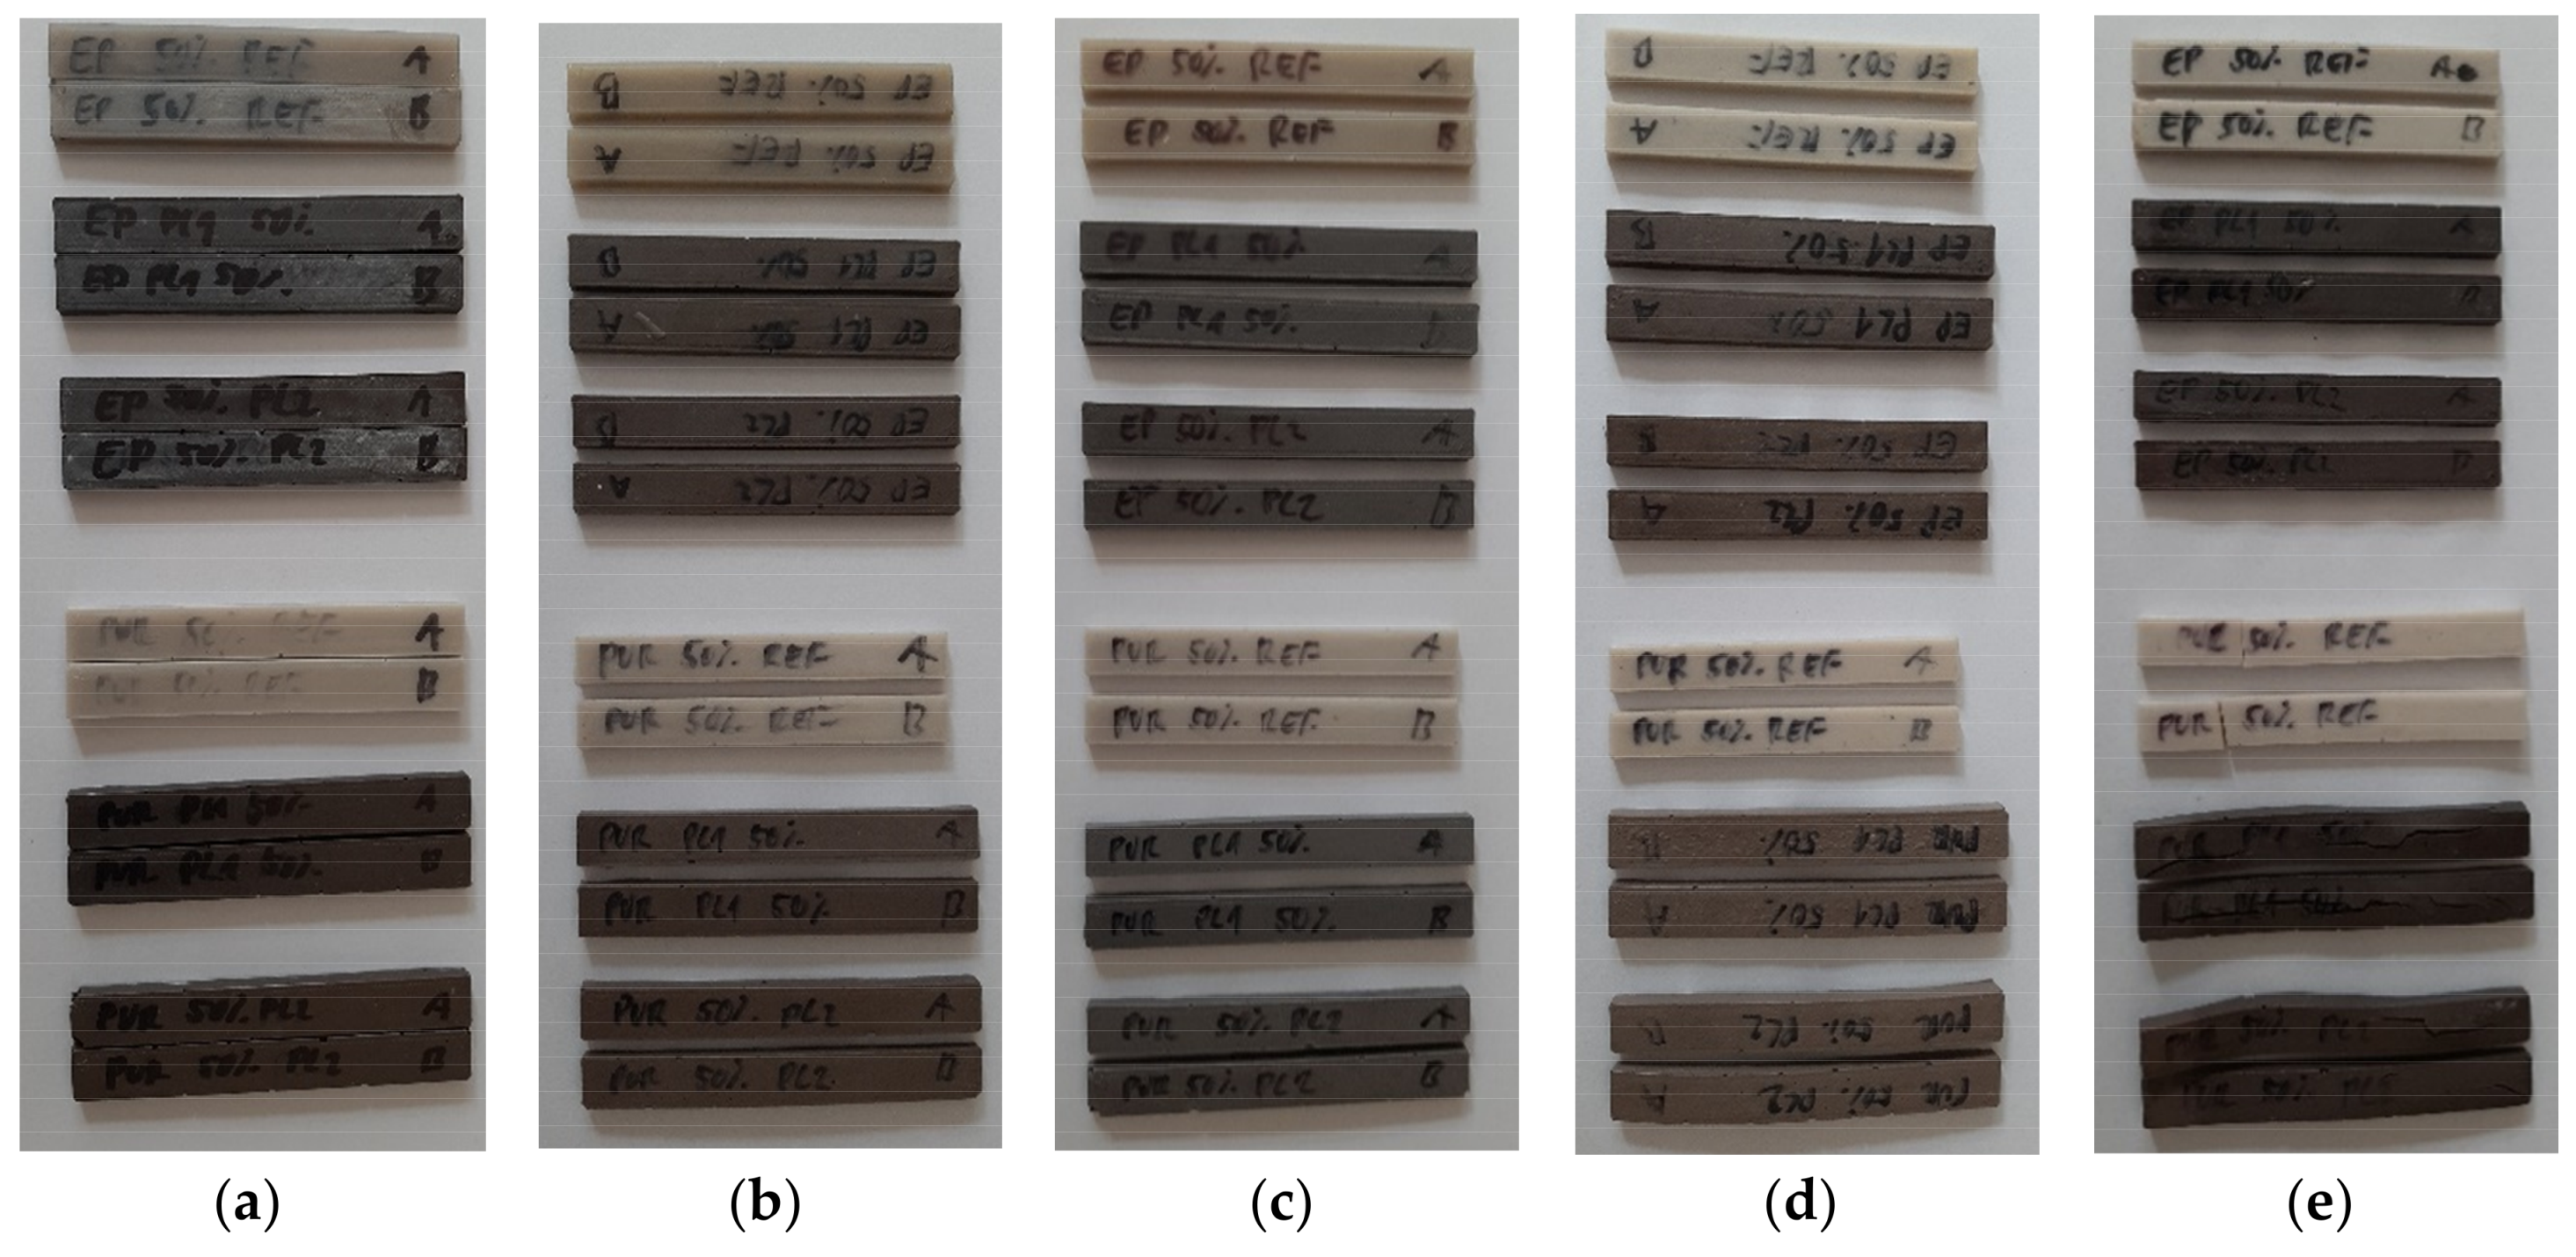
The following images (Figure 16a–e) show the mode of disruption for individual samples caused by exposure to select aggressive chemicals (oil fuel, 15% solution of citric acid, 20% solution of sulfuric acid, 10% solution of acetic acid, and 20% solution of sodium hydroxide). Samples with a solidification product as filler (SF1, SF2) showed no visual changes caused by exposure to oil fuel, the 15% solution of acetic acid, or the 20% solution of sulfuric acid. Exposure to the 10% solution of acetic acid caused an increase in the volume of the samples. After four days, the structure of the samples disintegrated in 10% acetic acid (Figure 16d). The structure of all samples with a polyurethane binder totally decomposed after exposure to a 20% solution of sodium hydroxide (Figure 16e).
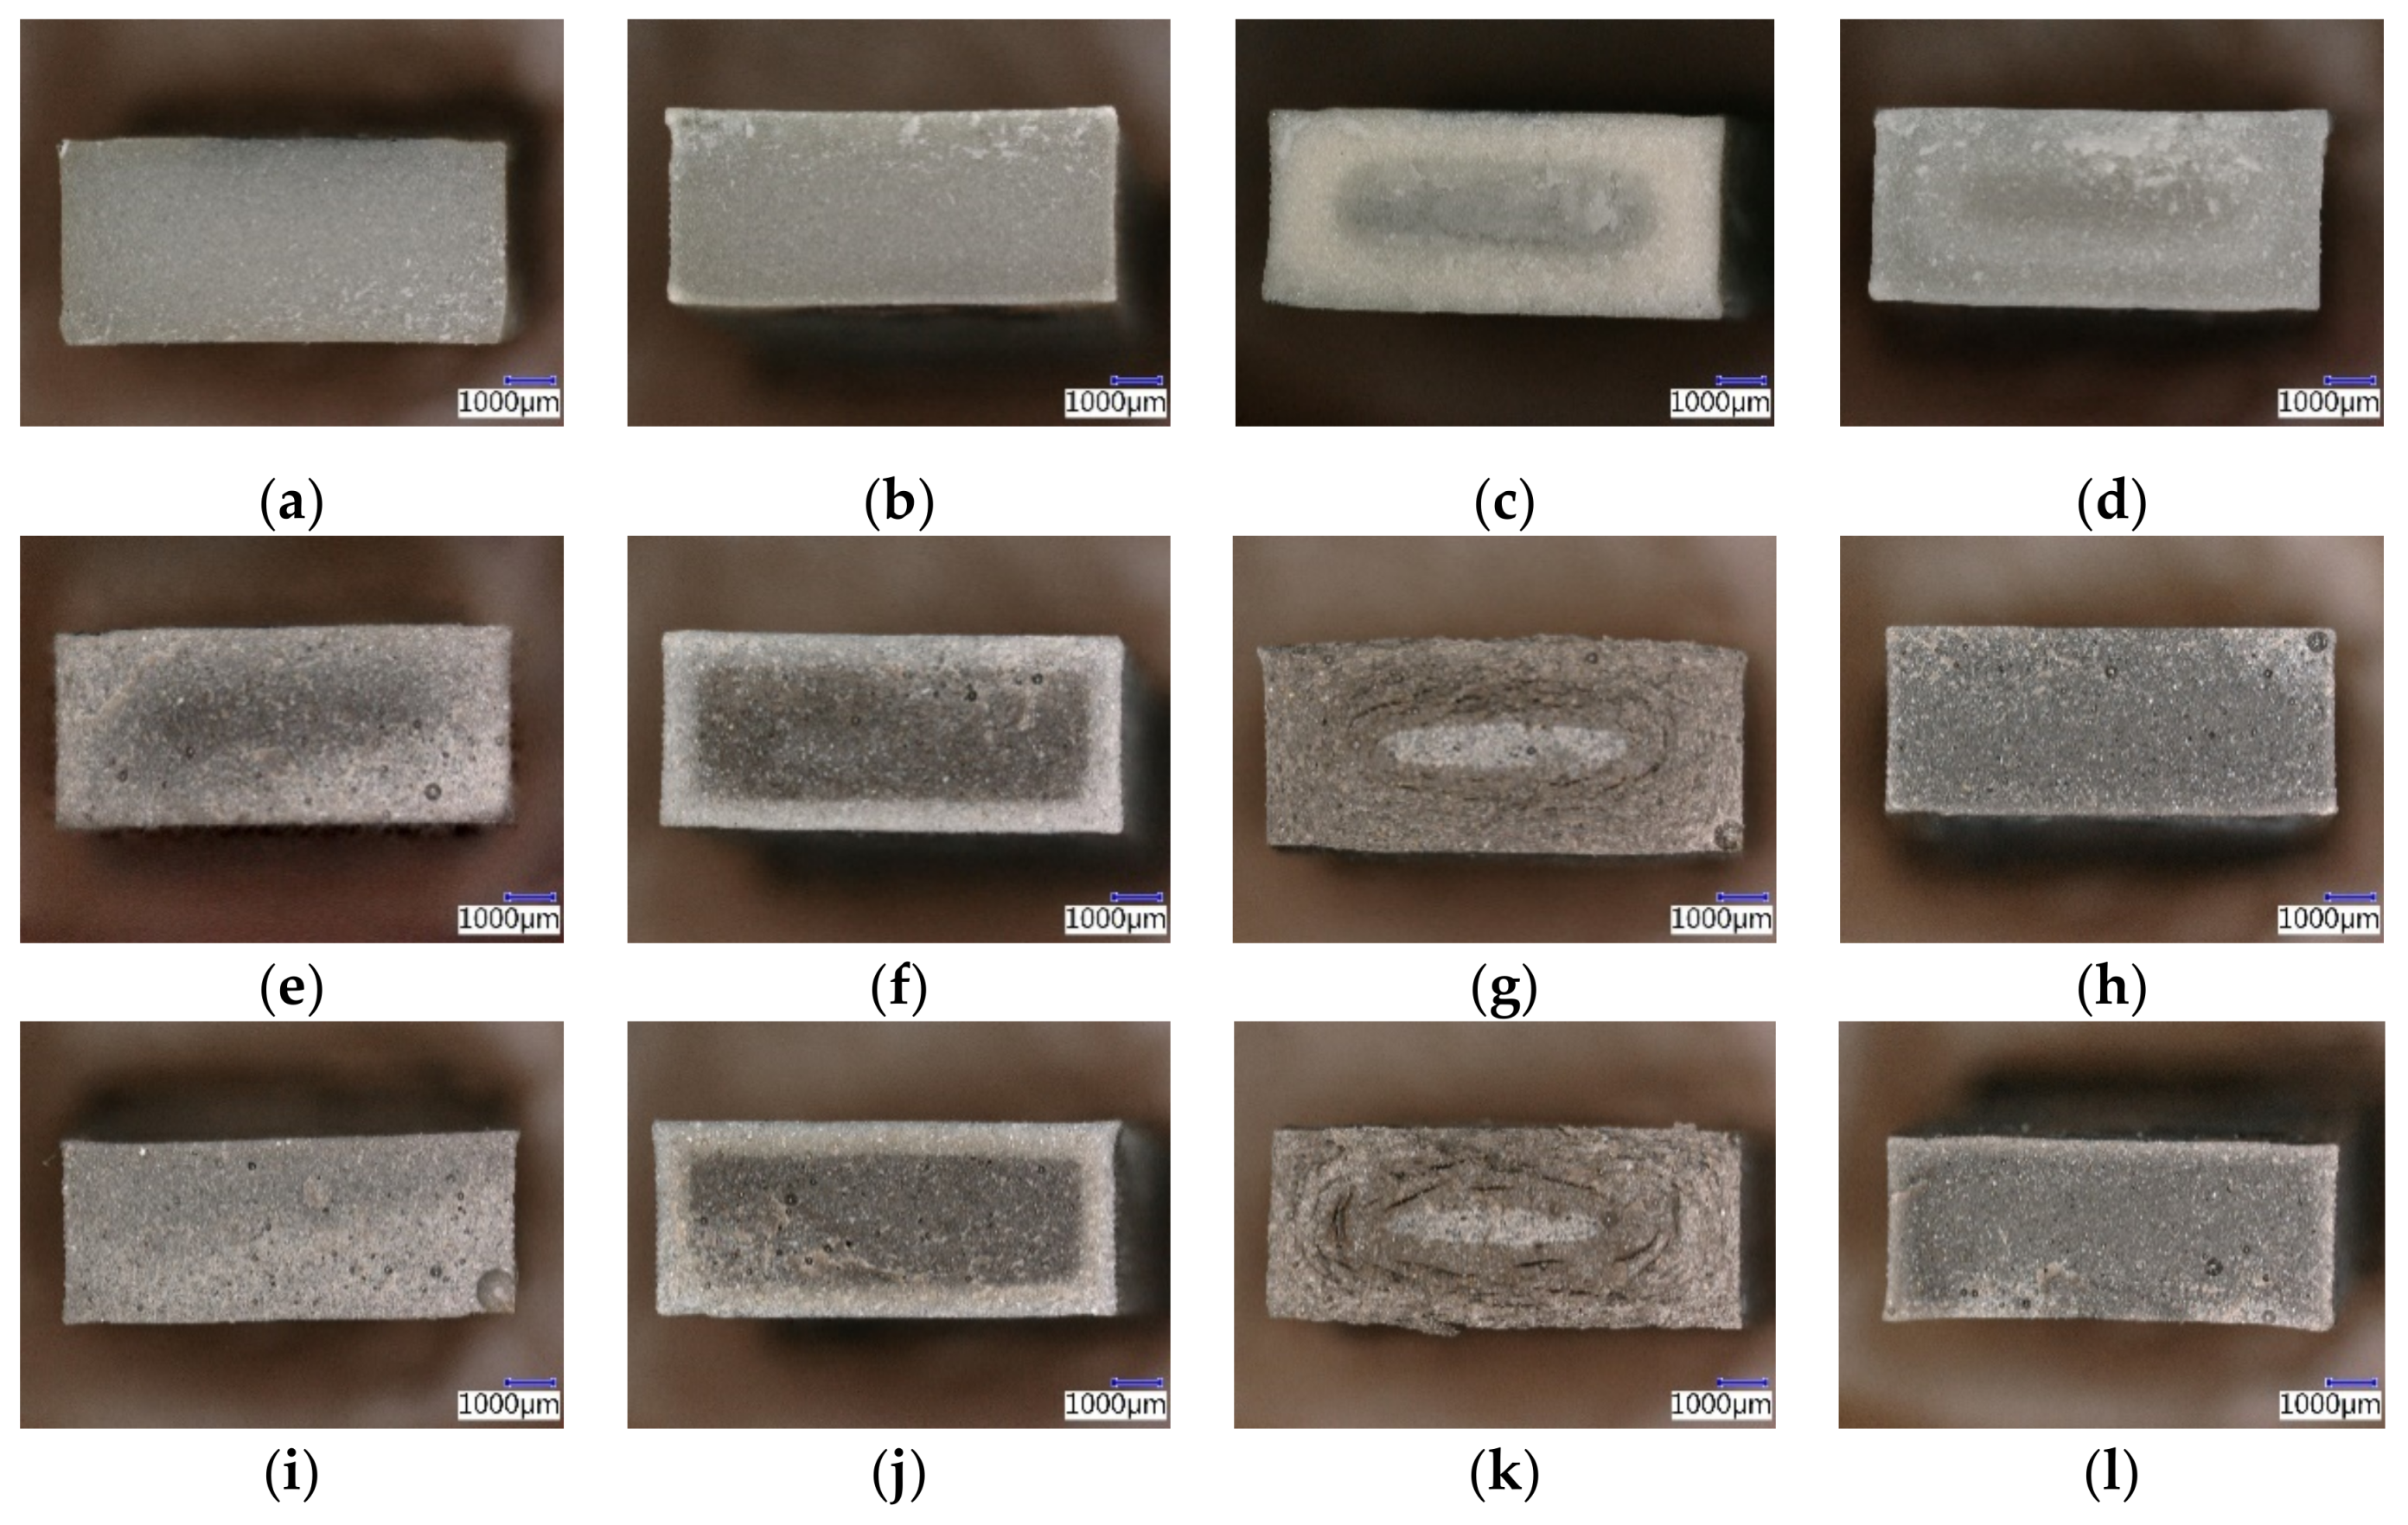
Microscopic analysis of the section of samples damaged by the aggressive liquid media showed that a 10% solution of acetic acid disturbed the structure of the samples filled with the SF1 and SF2 filler-containing hazardous waste; this solution also caused an increase in matrix volume. Swelling is apparent in the form of regular microcracks propagating from the center to the borders in both types of binder. A 20% solution of sodium hydroxide had a similar impact on the structure of the material with a polyurethane binder and solidified waste filler. This took place because the NaOH solution penetrated the inner structure, where the solution chemically reacted with the matrix and the fillers. On the exposure of the PUR coatings to NaOH solution, they were hydrolyzed in the presence of aq. alkali to form compounds having -NH2 and -COOH hydrophilic functional groups. Other samples were not disturbed; only a color change (a lighter color shade) was observed, which was significant mainly in samples with an epoxide binder. Epoxy resins have generally good resistance to alkali solutions, and better chemical resistance to aggressive chemical environments than polyurethane resins—mainly because of their chemical composition. All the changes are shown in Figure 17a–x.
3.2.9. Flexural Properties
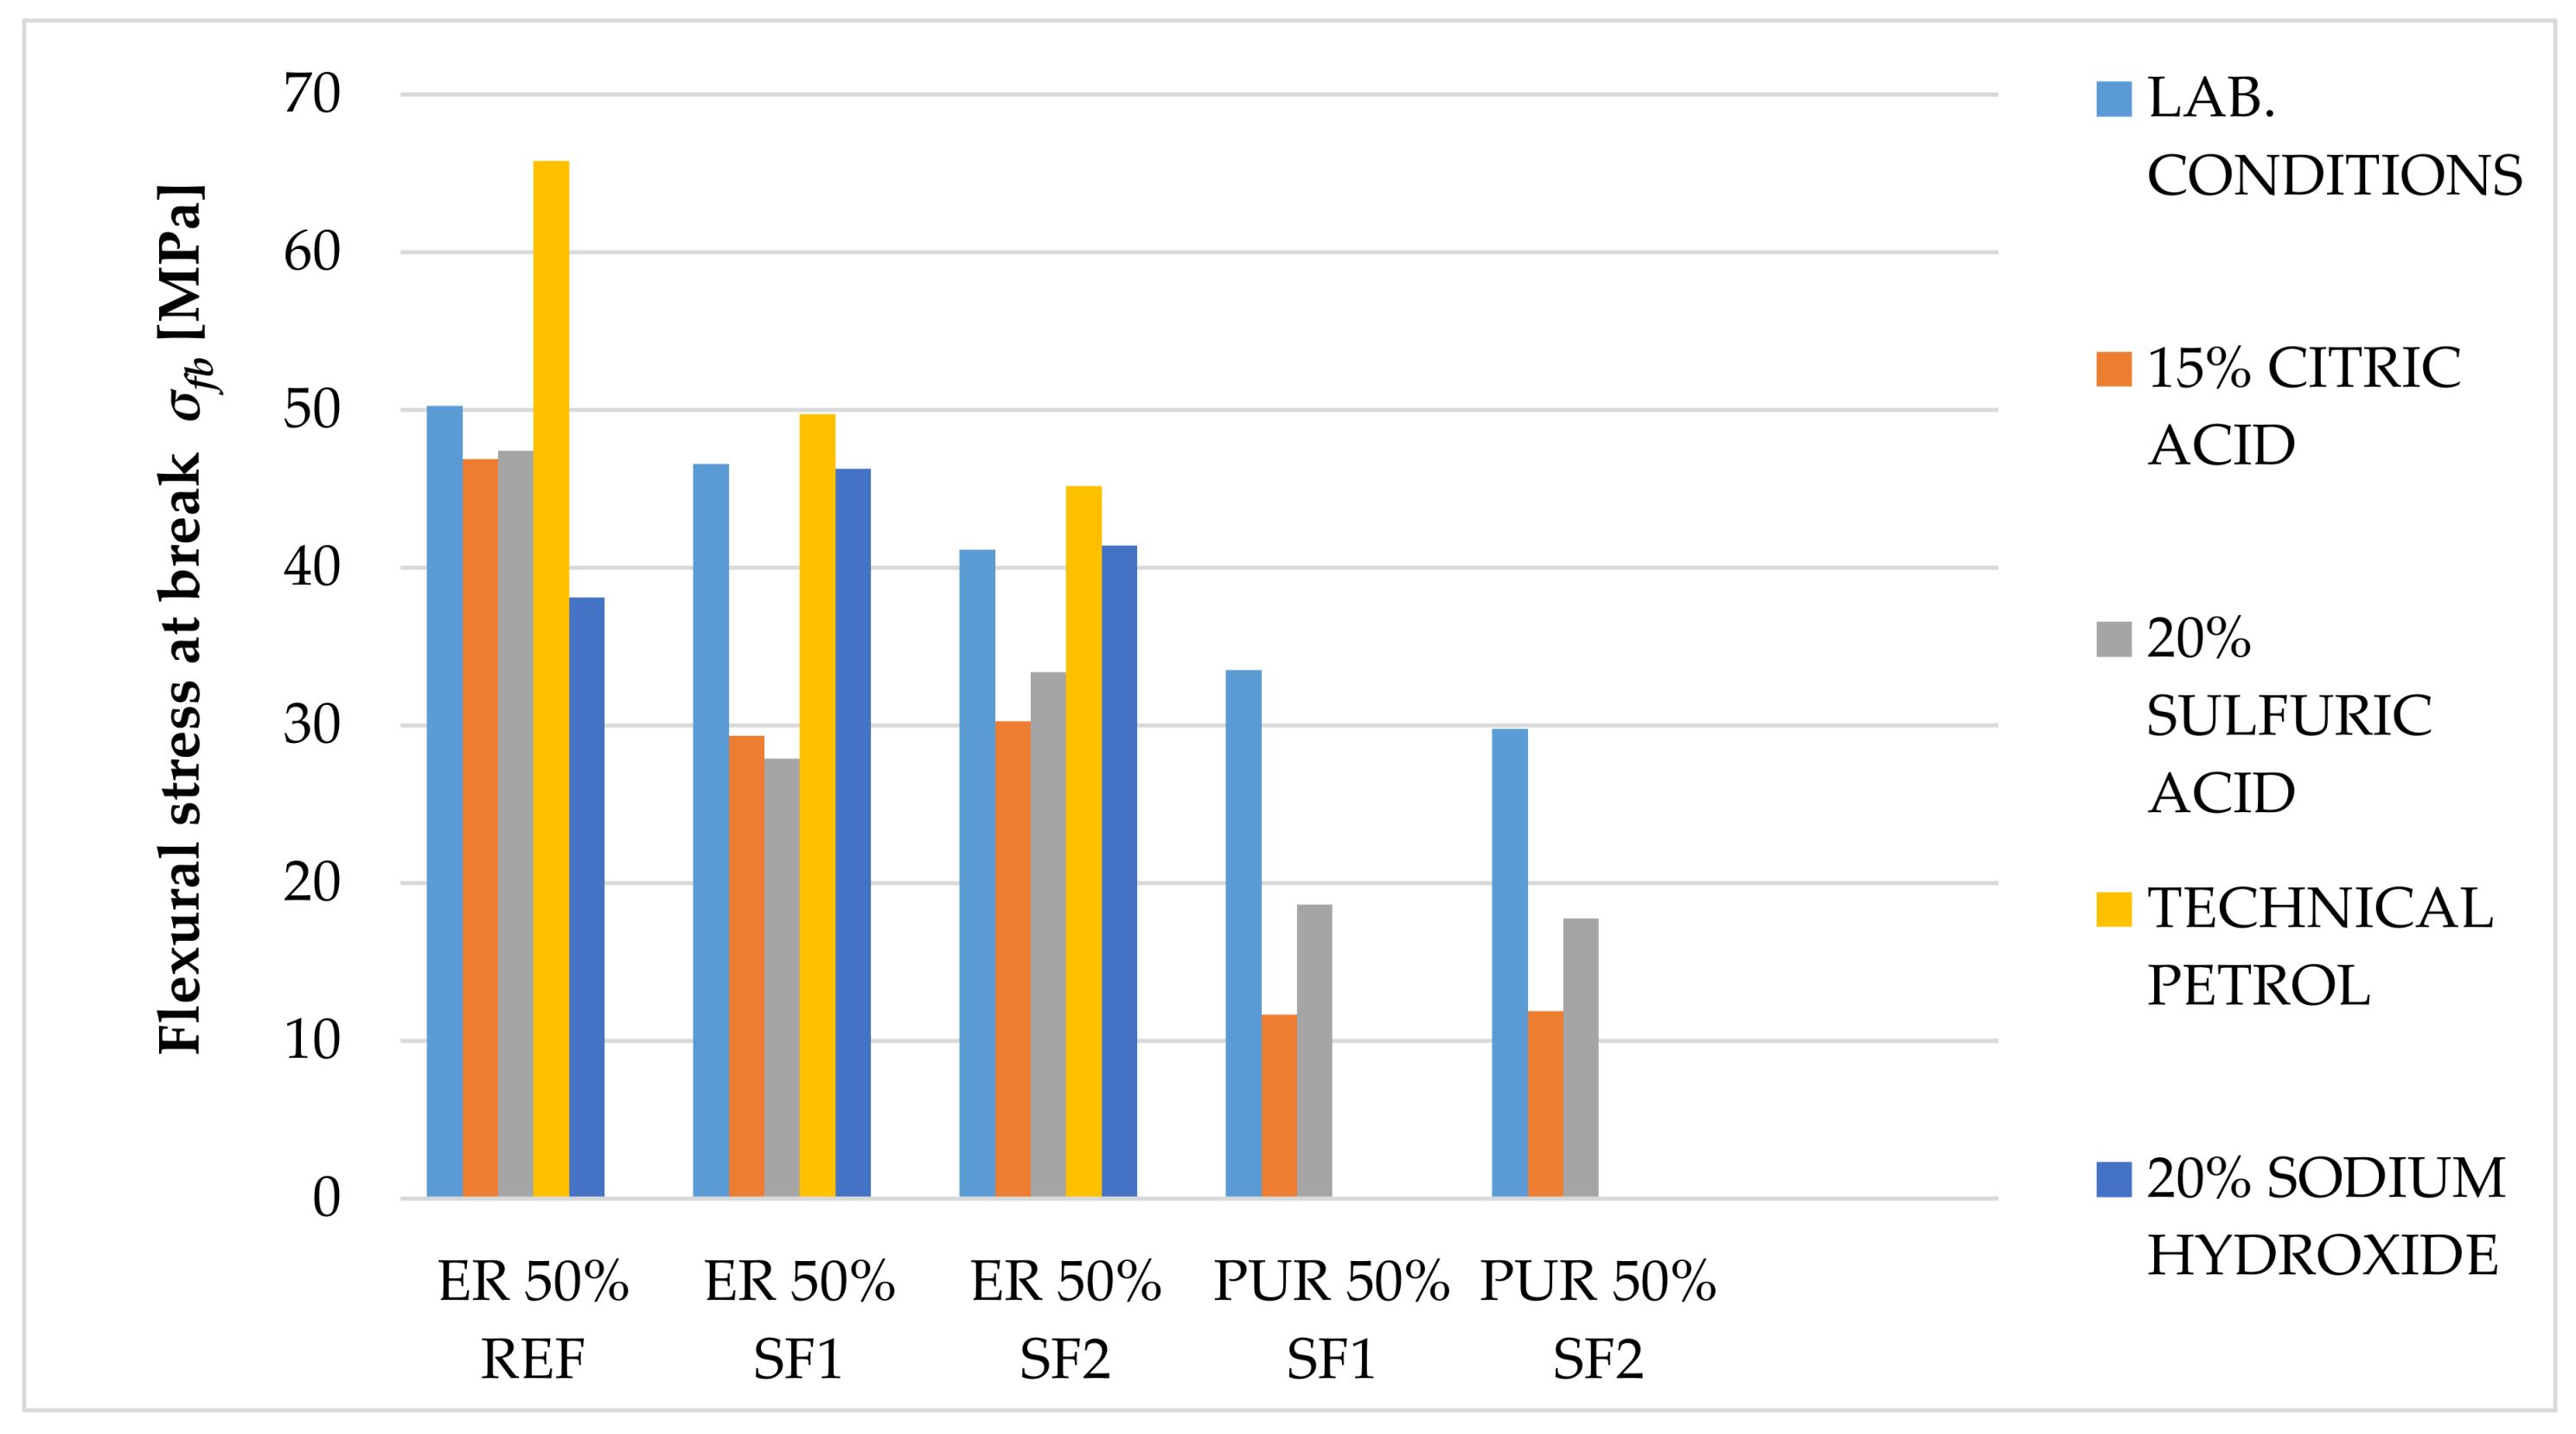
The samples with various binders showed different mechanical properties after exposure to aggressive liquid solutions. The epoxy samples retained their properties, while polyurethanes showed extra flexibility because the chemicals penetrated into their inner structures. Consequently, polyurethanes showed no resistance at loading. For this reason, it was not possible to achieve the required flexural properties after the test. The results of the tests are shown in Figure 18. Sulfuric acid and citric acid reduced the flexural stress at break with epoxide binder and solidification product as the fillers, while oil fuel and sodium hydroxide had no impact on this parameter. When quartz powder was used as the filler with epoxide resin, the tensile stress at break decreased by 20% in the solution of sodium hydroxide. However, oil fuel increased this value. It was not possible to determine the flexural properties for any of the samples exposed to acetic acid; the samples showed almost no resistance to bending loading because of the severe deterioration of the material (acetic acid penetrated into the inner structure of the coating and reacted with the polymer matrix).
Similar to the previously observed parameter, the flexural modulus test was influenced by the exceptional flexibility of the polyurethane (PUR) binder. The PUR samples showed no resistance during the three-point flexural loading, so it was not possible to achieve the required test results (as in the case of acetic acid). The results (Figure 19) show that the flexural modulus Ef of the samples with an epoxide binder had similar values with quartz powder and the SF1 and SF2 fillers. After exposure to aggressive environments, the solution of sulfuric acid and sodium hydroxide showed the largest influence in reduction of the elasticity modulus. Sulfuric acid and citric acid had the highest impact on fillers from solidified waste. By evaluating coatings with solidification products as fillers, it was determined that citric and sulfuric acid caused a decrease in the short-term flexural modulus. It was not possible to measure this value with any of the samples exposed to acetic acid.
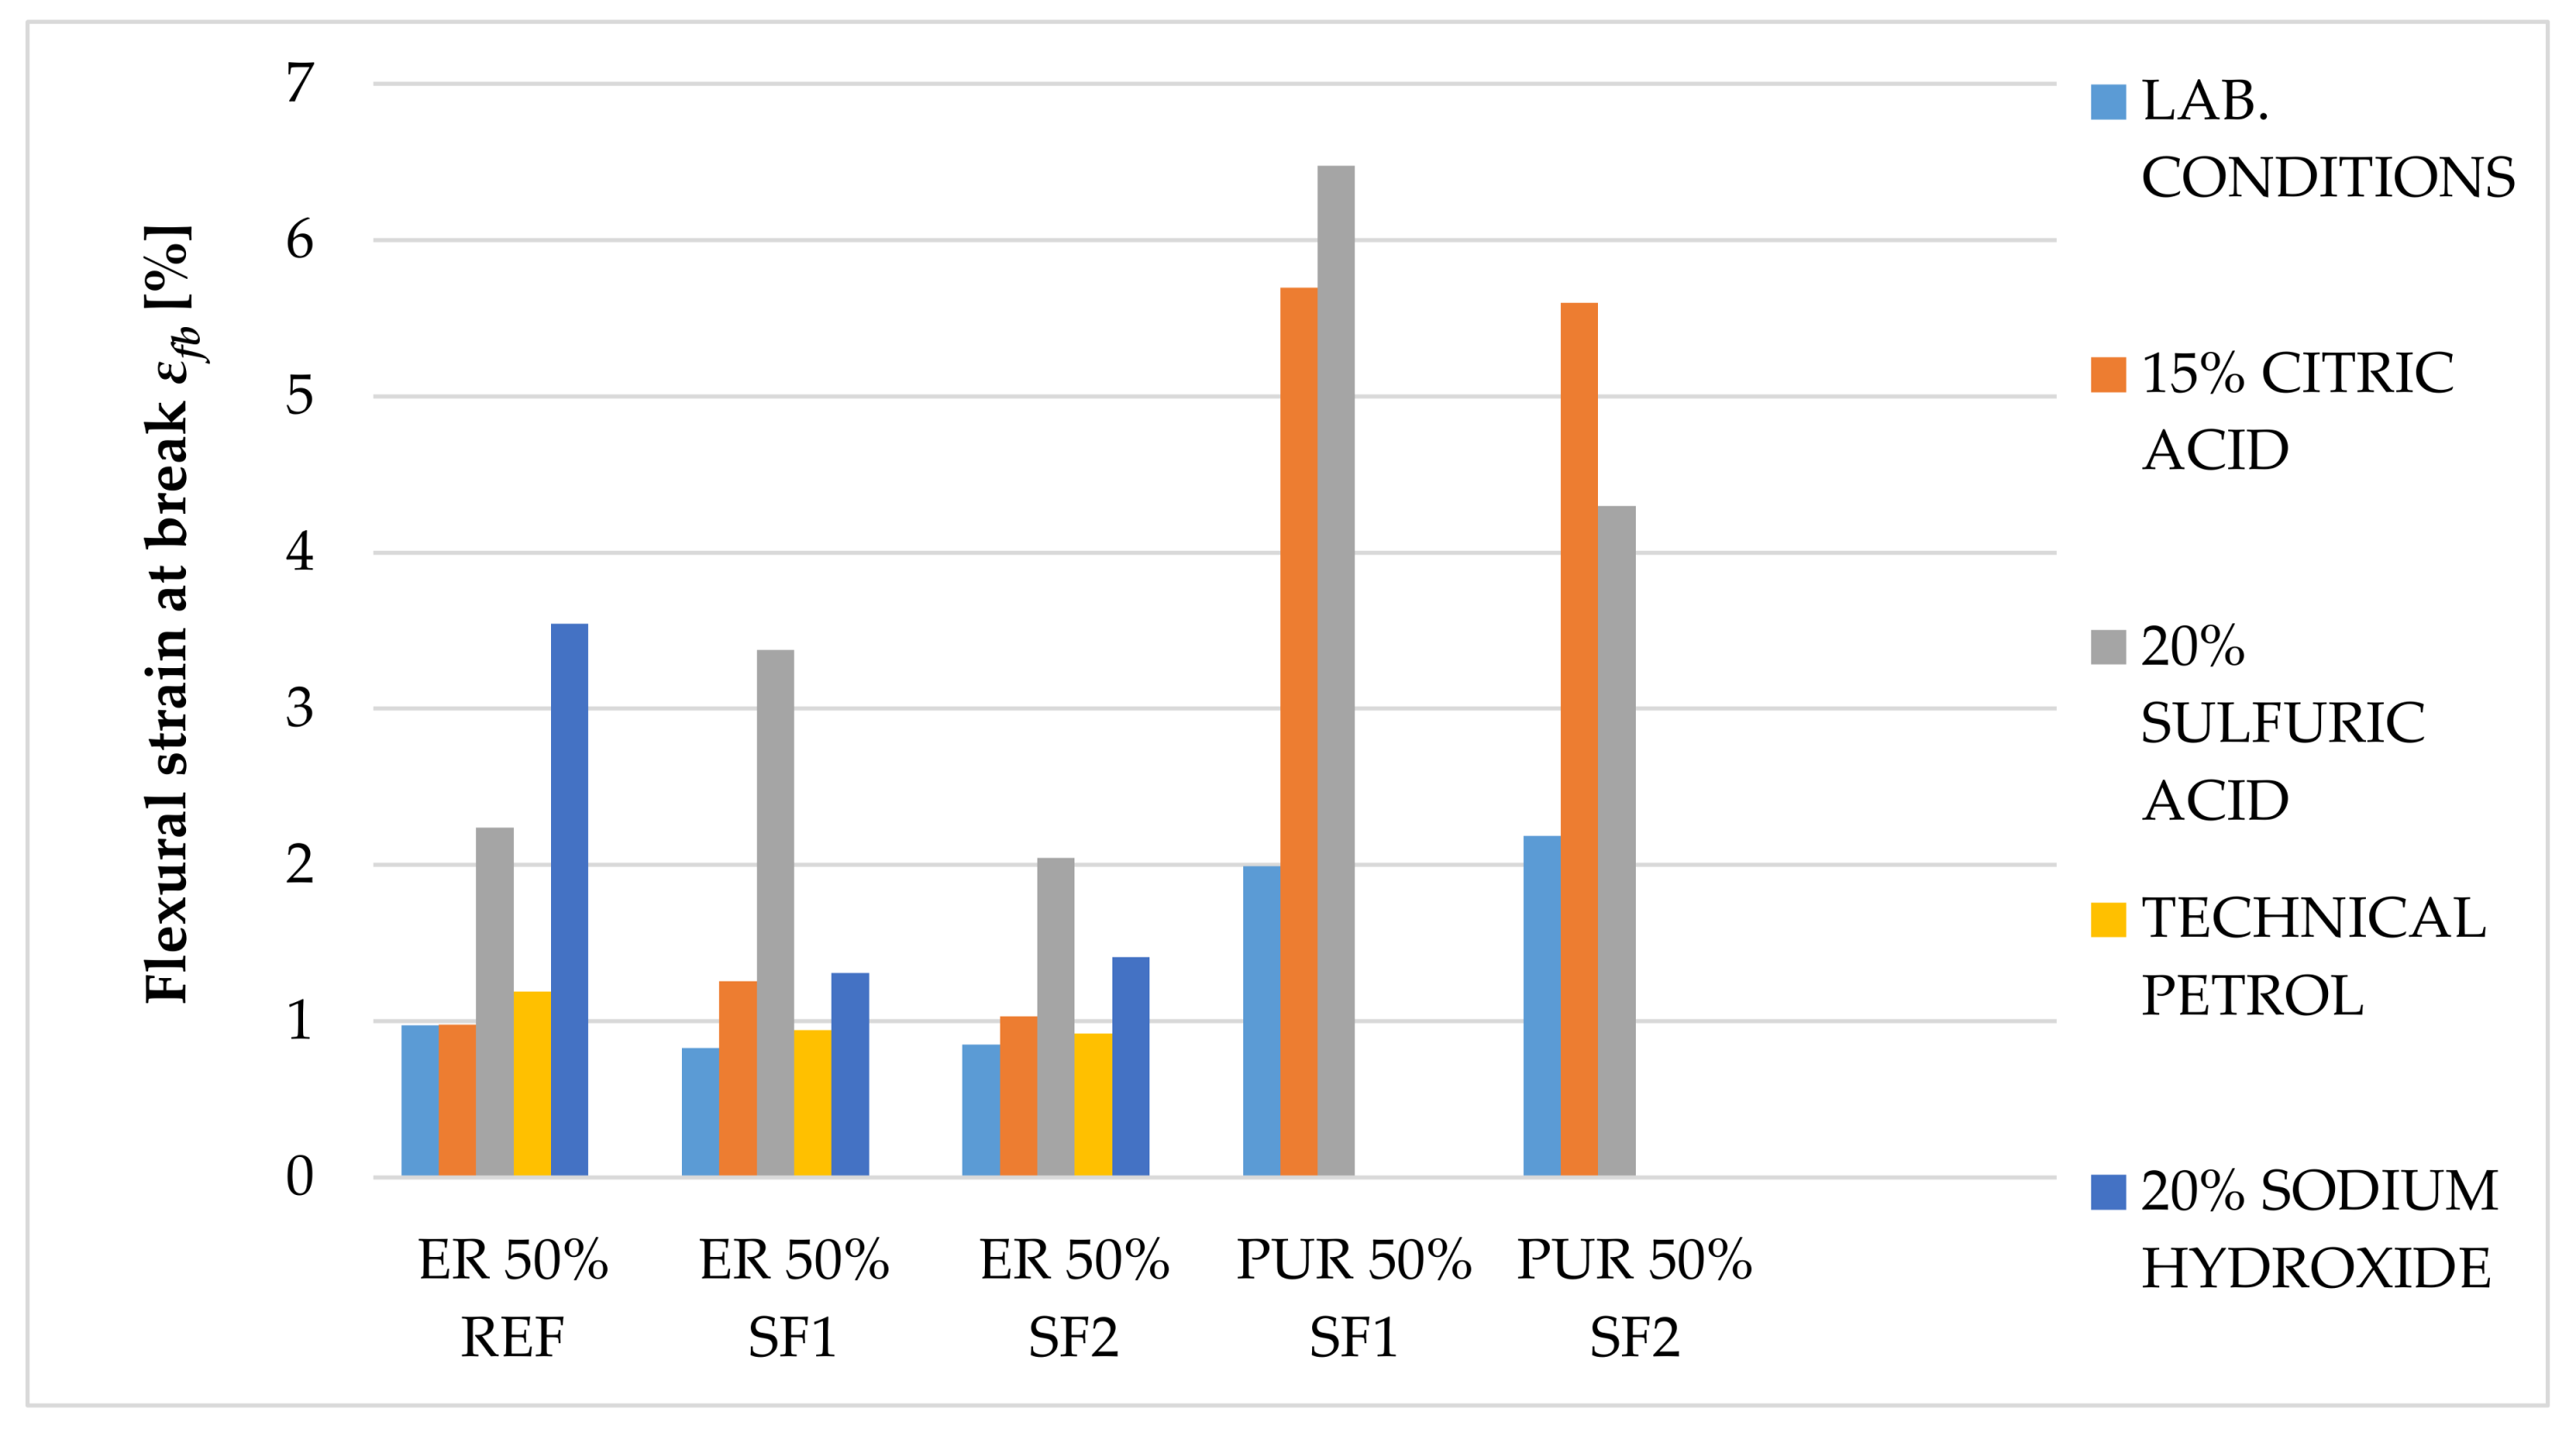
The samples in laboratory conditions had the same properties, regardless of the fillers used. The samples with an epoxide binder and quartz powder filler showed higher values of flexural strain due to the action of sulfuric acid and sodium hydroxide. Samples with solidified wastes showed the same effects, only after the action of sulfuric acid. All samples with a polyurethane binder had considerably higher values of flexural deformation because of the action of the aggressive environments. It was not possible to measure this value with any of the samples exposed to acetic acid. The results of these tests are shown in the diagram below (Figure 20).
4. Conclusions
The main goal of this paper was to verify the possibility of using solidified hazardous waste (solidification products), a progressive filler produced during the dry process of solidification, as a filler in polymeric protective coatings for the secondary protection of reinforced concrete and metal structures. With respect to the planned use of these materials, in particular for concrete and metal surfaces, the following properties were determined: surface hardness, impact resistance, tensile properties and flexural properties, adhesion, and chemical resistance, as well as a comparison of these parameters with the reference coating material containing only the primary input materials. In the preliminary verification (the application test and consistency determination), it was found that 50% filler seems to be optimal. At this proportion, the material showed optimal consistency for the proposed application, and the cured surface was smooth and free from irregularities. The test results imply that the coating materials created using pretreated hazardous wastes offer adhesion, resistance to abrasion, surface hardness, impact resistance, and relative elongation at break, compared to the reference material. The epoxide binder (ER) created a stronger but less flexible structure, compared to the polyurethane binder (PUR), which was proven mainly in the tests of impact resistance and tensile stress. For tensile strengths, coatings with epoxy resin had significantly higher values than polyurethane coatings. Polyurethane-based coatings have better resistance to mechanical damage because of their lower modulus of elasticity, which implies that they can better distribute mechanical loads in their inner structure. Epoxide-based coatings showed better resistance to chemical exposure. Chemical stress caused the flexural properties to change significantly. Acetic acid caused the highest level of degradation for all tested samples (their flexural properties could not be determined); all tested specimens showed a decrease in their flexural strength and modulus of elasticity after exposure to citric and sulfuric acid, and technical petrol caused a slight increase in flexural strength with the epoxy samples. Samples with the most severe degradation also showed a maximal decrease in their flexural modulus (acetic acid and sodium hydroxide with PUR coatings). In conclusion, the use and implementation of specifically prepared fillers, solidification products containing hazardous waste (SF1, SF2), enabled the incorporation of pollutants into the polymerous matrix and the developed coatings portrayed the required physical and mechanical properties, comparable to the reference materials. These coatings can thus be used for secondary protection in construction.
Author Contributions
Conceptualization, J.H.; Data Curation, L.M. and T.Ž., Formal Analysis, J.H. and L.M., Methodology, J.H., Investigation, T.Ž; Project Administration, R.D. and Z.D.; Writing – original draft, L.M.; Funding acquisition, R.D. and Z.D.; Resources, J.H.; Writing - review & editing, J.H. and L.M.
Funding
This research was funded by Faculty of Civil Engineering, Brno University of Technology, FAST-S-19-5779 and partially supported by the Ministry of Industry and Trade of the Czech Republic, FV20303.
Acknowledgments
This paper was supported by the following projects: FAST-S-19-5779, “Problems of Effective Use of Secondary Raw Materials in the Area of Silicate and Non-silicate Based Composites”; and FV20303, “Progressive Polymer Materials for Chemically High Aggressive Environments Using Secondary Raw and Hazardous Wastes”, a project by the Ministry of Industry and Trade of the Czech Republic.
Conflicts of Interest
The authors declare no conflict of interest.
References
- Lokuge, W.; Aravinthan, T. Effect of fly ash on the behaviour of polymer concrete with different types of resin. Mater. Des. 2013, 51, 175–181. [Google Scholar] [CrossRef]
- Barcia, F.L.; Amaral, T.P.; Soares, B.G. Synthesis and properties of epoxy resin modified with epoxy-terminated liquid polybutadiene. Polymer 2003, 44, 5811–5819. [Google Scholar] [CrossRef]
- Pattanaik, S.C. Repair of Active Cracks of Concrete Structures with a Flexible Polyurethane Sealant for Controlled Movement. Amas-2011 2011, 158. Available online: https://www.masterbuilder.co.in/repair-of-active-cracks-of-concrete-structures-with-a-flexible-polyurethane-sealant-for-controlled-movement/ (accessed on 30 October 2019).
- Vacenovska, B.; Cerny, V.; Drochytka, R.; Urbanek, B.; Vodickova, E.; Pavlikova, J.; Valko, V. Verification of the possibility of solidification product made of neutralization sludge use in the building industry. Proced. Eng. 2013, 57, 1192–1197. [Google Scholar] [CrossRef]
- Safiuddin, M.; Jumaat, M.Z.; Salam, M.A.; Islam, M.S.; Hashim, R. Utilization of solid wastes in construction materials. Intern. J. Phys. Sci. 2010, 5, 1952–1963. [Google Scholar]
- Hodul, J.; Dohnálková, B.; Drochytka, R. Solidification of Hazardous Waste with the Aim of Material Utilization of Solidification Products. Proced. Eng. 2015, 108, 639–646. [Google Scholar] [CrossRef]
- Park, C.K. Hydration and solidification of hazardous wastes containing heavy metals using modified cementitious materials. Ce. Concr. Res. 2000, 30, 429–435. [Google Scholar] [CrossRef]
- Gollakota, A.R.K.; Volli, V.; Shu, C.-M. Progressive utilisation prospects of coal fly ash: A review. Sci. Total Environ. 2019, 672, 951–989. [Google Scholar] [CrossRef] [PubMed]
- Baheti, V.; Militky, J.; Mishra, R.; Behera, B.K. Thermomechanical properties of glass fabric/epoxy composites filled with fly ash. Compos. Part. B Eng. 2016, 85, 268–276. [Google Scholar] [CrossRef]
- Yao, Z.T.; Ji, X.S.; Sarker, P.K.; Tang, J.H.; Ge, L.Q.; Xia, M.S.; Xi, Y.Q. A comprehensive review on the applications of coal fly ash. Earth Sci. Rev. 2015, 141, 105–121. [Google Scholar] [CrossRef]
- USEIA. Statistics on Global Coal Production, Consumption [WWWDocument]. 2014. Available online: https://www.eia.gov/coal/data.php#production (accessed on 15 September 2019).
- Krishna, M.P.; Kireeti, M.P.; Krishna, M.R.; Jyothi, Y.; Swami, G.R.K. Mechanical properties of fly ash/ sawdust reinforced epoxy hybrid composites. Mater. Today Proc. 2018, 5, 13025–13030. [Google Scholar] [CrossRef]
- Kouloumbi, N.; Ghivalos, L.G.; Pantazopoulou, P. Effect of quartz filler on epoxy coatings behavior. J. Mater. Eng. Perform. 2003, 12, 135–140. [Google Scholar] [CrossRef]
- Sosoi, G.; Barbuta, M.; Serbanoiu, A.A.; Babor, D.; Burlacu, A. Wastes as aggregate substitution in polymer concrete. Proced. Manuf. 2018, 22, 347–351. [Google Scholar] [CrossRef]
- Buurman, P.; Pape, T.; Reijneveld, J.A.; de Jong, F.; van Gelder, E. Laser-diffraction and pipette-method grain sizing of Dutch sediments: Correlations for fine fractions of marine, fluvial, and loess samples. Neth. J. Geosci. 2001, 80, 49–57. [Google Scholar] [CrossRef]
- Kou, S.C.; Poon, C.S. A novel polymer concrete made with recycled glass aggregates, fly ash and metakaolin. Constr. Build. Mater. 2013, 41, 146–151. [Google Scholar] [CrossRef]
- Saribiyik, M.; Piskin, A.; Saribiyik, A. The effects of waste glass powder usage on polymer concrete properties. Constr. Build. Mater. 2013, 47, 840–844. [Google Scholar] [CrossRef]
- Barbuta, M.; Rujanu, M.; Nicuta, A. Characterization of Polymer Concrete with Different Wastes Additions. Proced. Technol. 2016, 22, 407–412. [Google Scholar] [CrossRef]
- Martinez-Barrera, G.; Menchaca-Campos, C.; Gencel, O. Polyester polymer concrete: Effect of the marble particle size and High gamma radiation doses. Constr. Build. Mater. 2013, 41, 204–208. [Google Scholar] [CrossRef]
- Ioniuc, I.; Diaconu, L.I.; Grigorescu, C.; Alexoaie, A.M. The Flying Ash Taken by Wet Process from C.E.T. Holboca Iassy–Major Pollution Source. Proced. Technol. 2016, 22, 413–418. [Google Scholar] [CrossRef]
- Szycher, M. Szycher´s Handbook of Polyurethanes, 2nd ed.; CRC Press: Boca Raton, FL, USA, 2012. [Google Scholar]
- Zhou, R.; Lu, D.H.; Jiang, Y.H.; Li, Q.N. Mechanical properties and erosion wear resistance of polyurethane matrix composites. Wear 2005, 259, 676–683. [Google Scholar] [CrossRef]
- Regulation No. 294/2005 Coll., on the Conditions of Depositing Waste in Landfills and Their Use on Terrain Surface on Amendments to Some Laws (in Czech Language). In: The Collection of Laws of the Czech Republic. 2005. Available online: https://www.mzp.cz/www/platnalegislativa.nsf/96F060C6A3D87823C125708F00317B16/%24file/V%20294_2005.pdf (accessed on 30 October 2019).
- EN 12457-4–Characterization of waste–Leaching–Compliance test for leaching of granular waste materials and sludges–Part 4: One stage batch test at a liquid to solid ratio of 10 l/kg for materials with particle size below 10 mm (without or with size reduction); European Committee for Standardization (CEN): Brussels, Belgium, 2002.
- ISO 2431:2019–Paints and varnishes—Determination of flow time by use of flow cups; International Organization for Standardization (ISO), Technical Committee ISO/TC35/SC9: Geneva, Switzerland, 2019.
- ISO 2808:2019–Paints and varnishes— Determination of Film Thickness; International Organization for Standardization (ISO), Technical Committee ISO/TC35/SC9: Geneva, Switzerland, 2019.
- ISO 527-1:2019–Plastics—Determination of Tensile Properties—Part 1: General Principles; International Organization for Standardization (ISO), Technical Committee ISO/TC61/SC2: Geneva, Switzerland, 2019.
- ISO 527-2:2012–Plastics—Determination of Tensile Properties—Part 2: Test Conditions for Moulding and Extrusion Plastics; International Organization for Standardization (ISO), Technical Committee ISO/TC61/SC2: Geneva, Switzerland, 2012.
- ISO 868:2003–Plastics and Ebonite—Determination of Indentation Hardness by Means of a Durometer (Shore Hardness); International Organization for Standardization (ISO), Technical Committee ISO/TC61/SC2: Geneva, Switzerland, 2003.
- ISO 4624:2016–Paints and Varnishes– Pull-Off Test for Adhesion; International Organization for Standardization (ISO), Technical Committee ISO/TC35/SC9: Geneva, Switzerland, 2016.
- ISO 6272-1:2011–Paints and varnishes–Rapid-Deformation (Impact Resistance) Tests—Part 1: Falling-Weight Test, Large-Area Indenter; European Committee for Standardization (CEN): Brussels, Belgium; International Organization for Standardization (ISO), Technical Committee ISO/TC35/SC9: Geneva, Switzerland, 2011.
- ČSN EN 14157– Natural Stone Test Methods–Determination of the Abrasion Resistance; Czech Standardization Agency: Prague, Czech Republic, 2018.
Figure 1.
Percental proportions of individual filler components (solidification products (SF1, SF2, and reference filler (REF)).
Figure 1.
Percental proportions of individual filler components (solidification products (SF1, SF2, and reference filler (REF)).

Figure 2.
Examined binder/filler ratios.

Figure 3.
Granulometry of the used input materials.

Figure 4.
Granulometry of the used fillers.

Figure 5.
The filler prepared by dry homogenization of raw materials SF1; magnification 67.7×.

Figure 6.
The filler prepared by dry homogenization of raw materials SF2; magnification 67.7×.

Figure 7.
Microstructure of the input materials and the used fillers observed by SEM at a magnification of 5000×. (a) Quartz dust, (b) fly ash from fluidized bed combustion (CFBC), (c) end product, (d) cement bypass dust (CBPD), (e) SF1, and (f) SF2.
Figure 7.
Microstructure of the input materials and the used fillers observed by SEM at a magnification of 5000×. (a) Quartz dust, (b) fly ash from fluidized bed combustion (CFBC), (c) end product, (d) cement bypass dust (CBPD), (e) SF1, and (f) SF2.


Figure 8.
Application test: (a) consistency; (b) application; (c) thickness.

Figure 9.
Relative elongation at break. (a) Epoxy (ER) binder); (b) polyurethane (PUR) binder.

Figure 10.
Tensile stress at break. (a) Epoxy (ER) binder); (b) polyurethane (PUR) binder.

Figure 11.
Anchoring of the coating layer to the subconcrete. (a) ER 50% REF, (b) PUR 50% REF, (c) ER 50% SF1, (d) PUR 50% SF1, (e) ER 50% SF2, and (f) PUR 50% SF2.
Figure 11.
Anchoring of the coating layer to the subconcrete. (a) ER 50% REF, (b) PUR 50% REF, (c) ER 50% SF1, (d) PUR 50% SF1, (e) ER 50% SF2, and (f) PUR 50% SF2.

Figure 12.
Surface of the sample ER 50% SF2 at a magnification of 66.67× (a) prior to the abrasion resistance test and (b) after the abrasion resistance test.
Figure 12.
Surface of the sample ER 50% SF2 at a magnification of 66.67× (a) prior to the abrasion resistance test and (b) after the abrasion resistance test.

Figure 13.
Surface of the sample PUR 50% SF2 at a magnification of 66.67× (a) prior to the abrasion resistance test and (b) after the abrasion resistance test.
Figure 13.
Surface of the sample PUR 50% SF2 at a magnification of 66.67× (a) prior to the abrasion resistance test and (b) after the abrasion resistance test.

Figure 14.
Details of the damaged surface after the impact resistance test at a magnification of 9.55×: (a) ER 50% REF (0.3476 cm2), (b) ER 50% SF1 (0.3406 cm2), (c) ER 50% SF2 (0.3089 cm2), (d) PUR 50% REF (0.3714 cm2), (e) PUR 50% SF1 (0.3263 cm2), and (f) PUR 50% SF2 (0.3466 cm2).
Figure 14.
Details of the damaged surface after the impact resistance test at a magnification of 9.55×: (a) ER 50% REF (0.3476 cm2), (b) ER 50% SF1 (0.3406 cm2), (c) ER 50% SF2 (0.3089 cm2), (d) PUR 50% REF (0.3714 cm2), (e) PUR 50% SF1 (0.3263 cm2), and (f) PUR 50% SF2 (0.3466 cm2).

Figure 15.
Mode of failure for the samples after a test of impact resistance—3D view from a digital optical microscope: (a) epoxide coating ER 50% REF—cracks propagating from the center of the impact area are visible; (b) more flexible polyurethane coating PUR 50% REF—impact of test weight caused wrinkling of the coat; no cracks are observed.

Figure 16.
Disruption of individual samples caused by exposure to these aggressive chemicals: (a) oil fuel; (b) 15% solution of citric acid; (c) 20% solution of sulfuric acid; (d) 10% solution of acetic acid; (e) 20% solution of sodium hydroxide.
Figure 16.
Disruption of individual samples caused by exposure to these aggressive chemicals: (a) oil fuel; (b) 15% solution of citric acid; (c) 20% solution of sulfuric acid; (d) 10% solution of acetic acid; (e) 20% solution of sodium hydroxide.

Figure 17.
Details of structural failure caused by aggressive liquid solutions; the lines show mix-designs, and columns indicate types of aggressive substances: (a) ER 50% REF in 15% citric acid solution; (b) ER 50% REF in 20% sulfuric acid solution; (c) ER 50% REF in 10% acetic acid solution; (d) ER 50% REF in sodium hydroxide solution; (e) ER 50% SF1 in 15% citric acid solution; (f) ER 50% SF1 in 20% sulfuric acid solution; (g) ER 50% SF1 in 10% acetic acid solution; (h) ER 50% SF1 in sodium hydroxide solution; (i) ER 50% SF2 in 15% citric acid solution; (j) ER 50% SF2 in 20% sulfuric acid solution; (k) ER 50% SF2 in 10% acetic acid solution; (l) ER 50% SF2 in sodium hydroxide solution; (m) PUR 50% REF in 15% citric acid solution; (n) PUR 50% REF in 20% sulfuric acid solution; (o) PUR 50% REF in 10% acetic acid solution; (p) PUR 50% REF in sodium hydroxide solution; (q) PUR 50% SF1 in 15% citric acid solution; (r) PUR 50% SF1 in 20% sulfuric acid solution; (s) PUR 50% SF1 in 10% acetic acid solution; (t) PUR 50% SF1 in sodium hydroxide solution; (u) PUR 50% SF2 in 15% citric acid solution; (v) PUR 50% SF2 in 20% sulfuric acid solution; (w) PUR 50% SF2 in 10% acetic acid solution; (x) PUR 50% SF2 in sodium hydroxide solution.


Figure 18.
Three-point flexural stress at break σfB [MPa].

Figure 19.
Modulus of elasticity in flexure Ef [MPa].

Figure 20.
Flexural deformation at first break εfb [%].


Table 1.
Requirements for ecotoxicity tests results.
| Tested Organism | Exposure Time [Hour] | I. | II. |
|---|---|---|---|
| Poecilia Reticulata | 96 | Fish must not show a considerable change of behavior compared to the reference samples, and not a single fish may die. | Fish must not show a considerable change of behavior compared to the reference samples, and not a single fish may die. |
| Daphnia Magna Straus | 48 | Percentage of immobilized cladocerans must not exceed 30% compared to the reference samples. | Percentage of immobilized cladocerans must not exceed 30% compared to the reference samples. |
| Desmodesmus Subspicatus | 72 | Inhibition of the growth of algae must not be greater than 30% compared to the reference samples. | Inhibition or stimulation of the growth of algae must not be greater than 30% compared to the reference samples in a verification test. |
| Sinapis Alba | 72 | Proven inhibition of the growth of seed roots must not exceed 30% compared to the reference samples. | Proven inhibition or stimulation of the growth of seed roots must not exceed 30% compared to the reference samples in the verification test. |
Table 2.
Specific gravity and specific surface area of the fillers.
| Specific Weight [g/cm3] | Specific Surface [cm2/g] | |
|---|---|---|
| REF | 2.68 | 4 660 |
| SF1 | 2.76 | 10 620 |
| SF2 | 2.74 | 10 470 |
Table 3.
Results of the leaching test performed according to EN 12457-4.
| Filler/Param. | Lim Max | Unit | End Product | CBPD | SF1 | SF2 | ||||
|---|---|---|---|---|---|---|---|---|---|---|
| Value | Eval. | Value | Eval. | Value | Eval. | Value | Eval. | |||
| Chlorides | 1500 | mg/L | 18,500 | × | 10,700 | √ | 1610 | × | 1100 | √ |
| Sulphates- | 3000 | mg/L | 743 | √ | 4980 | × | 928 | √ | 1350 | √ |
| DS dried (105 °C) | 8000 | mg/L | 34,700 | × | 39,500 | × | 6600 | √ | 6210 | √ |
| Pb | 5 | mg/L | 45.7 | √ | 163 | × | 0.417 | √ | 0.785 | √ |
| As | 10 | mg/L | 45.1 | × | 16.0 | × | 7.62 | √ | 6.44 | √ |
Table 4.
Determination of the concentration of harmful substances in dry matter.
| Type of Filler/ Parameter | Limit | Unit | End Prod. | Cement Bypass Dust | SF1 | SF2 | ||||
|---|---|---|---|---|---|---|---|---|---|---|
| Value | Eval. | Value | Eval. | Value | Eval. | Value | Eval. | |||
| dry matter (105 °C) | - | 99.6 | - | 100 | - | 99.5 | 100 | - | ||
| Cd | max. 1 | mg/kg dry matter | 83.7 | × | 76.3 | × | 10.0 | × | 7.64 | × |
| Hg | max. 0.8 | mg/kg dry matter | 12.6 | × | <0.2 | √ | 1.07 | × | <0.20 | √ |
Table 5.
Ecotoxicological tests—living organisms.
| Type of Sample/Matrix: LEACHATE | Limit (max.) | Unit | SF1 | Evaluation | SF2 | Evaluation |
|---|---|---|---|---|---|---|
| Scenedesmus (Desmodesmus) suspicatus—inhibition of D. s. (origin sample) | 30 | % | 12.5 | √ | 13.4 | √ |
| Daphnia magna immobilisation (origin sample) | 30 | % | 100 | × | 100 | × |
| Poecilia reticulata mortality (origin sample) | 0 | % | 0 | √ | 100 | × |
| Sinapis alba inhibition of S. a. (origin sample) | 30 | % | 65.8 | × | 37.2 | × |
Table 6.
Consistency of the polymer coatings.
| Binder Content | 40% | 50% | 60% |
|---|---|---|---|
| Type of Coating | Flow Time [s] | ||
| PUR-C_SF1 | 33 | 45 | 158 |
| PUR-C_SF2 | 31 | 43 | 161 |
| PUR-C_REF | 17 | 27 | 144 |
| ER-C_SF1 | 21 | 32 | 122 |
| ER-C_SF2 | 19 | 30 | 118 |
| ER-C_REF | 10 | 19 | 105 |
Table 7.
Adhesion of coatings.
| Sample | Adhesion [MPa] | Place of Failure |
|---|---|---|
| PUR 50% SF1 | 6.73 | glue |
| PUR 50% SF2 | 8.41 | glue |
| PUR 50% REF | 7.59 | glue |
| ER 50% SF1 | 5.78 | glue |
| ER 50% SF2 | 6.49 | concrete |
| ER 50% REF | 9.04 | concrete |
Table 8.
Böhm abrasion resistance of coatings.
| Sample | A4 [cm3/50 cm2] | A8 [cm3/50 cm2] | A12 [cm3/50 cm2] | A16 [cm3/50 cm2] |
|---|---|---|---|---|
| PUR 50% SF1 | 0.825 | 1.275 | 1.671 | 2.181 |
| PUR 50% SF2 | 0.361 | 0.981 | 1.471 | 1.989 |
| PUR 50% REF | 0.166 | 0.750 | 1.314 | 2.024 |
| ER 50% SF1 | 1.399 | 2.268 | 3.045 | 3.861 |
| ER 50% SF2 | 0.865 | 1.678 | 2.214 | 2.659 |
| ER 50% REF | 0.955 | 1.728 | 2.423 | 3.092 |
Table 9.
Surface hardness Shore D.
| Sample | Surface Hardness Shore D [–] | Average Value | ||
|---|---|---|---|---|
| PUR 50% SF1 | 79 | 80 | 80 | 80 |
| PUR 50% SF2 | 77 | 76 | 78 | 77 |
| PUR 50% REF | 72 | 74 | 75 | 74 |
| ER 50% SF1 | 88 | 89 | 88 | 88 |
| ER 50% SF2 | 89 | 89 | 88 | 89 |
| ER 50% REF | 88 | 86 | 89 | 88 |
Table 10.
Results of the impact resistance test using a large area of firing pin indenter.
| Sample | Impact Resistance [Nm] | Average Value | ||
|---|---|---|---|---|
| PUR 50% SF1 | 7.5 | 8.0 | 8.0 | 8.0 |
| PUR 50% SF2 | 8.0 | 8.5 | 8.5 | 8.5 |
| PUR 50% REF | 7.5 | 7.0 | 7.0 | 7.0 |
| ER 50% SF1 | 7.0 | 7.0 | 7.5 | 7.0 |
| ER 50% SF2 | 7.0 | 7.0 | 7.0 | 7.0 |
| ER 50% REF | 7.5 | 7.0 | 7.5 | 7.5 |
© 2019 by the authors. Licensee MDPI, Basel, Switzerland. This article is an open access article distributed under the terms and conditions of the Creative Commons Attribution (CC BY) license (http://creativecommons.org/licenses/by/4.0/).
Share and Cite
MDPI and ACS Style
Hodul, J.; Mészárosová, L.; Žlebek, T.; Drochytka, R.; Dufek, Z. Impact of Aggressive Media on the Properties of Polymeric Coatings with Solidification Products as Fillers. Coatings 2019, 9, 793. https://doi.org/10.3390/coatings9120793
AMA Style
Hodul J, Mészárosová L, Žlebek T, Drochytka R, Dufek Z. Impact of Aggressive Media on the Properties of Polymeric Coatings with Solidification Products as Fillers. Coatings. 2019; 9(12):793. https://doi.org/10.3390/coatings9120793
Chicago/Turabian StyleHodul, Jakub, Lenka Mészárosová, Tomáš Žlebek, Rostislav Drochytka, and Zdeněk Dufek. 2019. "Impact of Aggressive Media on the Properties of Polymeric Coatings with Solidification Products as Fillers" Coatings 9, no. 12: 793. https://doi.org/10.3390/coatings9120793
Note that from the first issue of 2016, this journal uses article numbers instead of page numbers. See further details here.