Article

Influence of Heat Treatment on the Corrosion Behavior of Electrodeposited CoCrFeMnNi High-Entropy Alloy Thin Films

by
Ana-Maria Julieta Popescu
1,
Florina Branzoi
1,
Marian Burada
2,
Irina Atkinson
1,
Ionut Constantin
1,
Jose Calderon Moreno
1,
Florin Miculescu
3,
Dumitru Mitrica
2,
Ioana-Cristina Badea
2,
Mihai Tudor Olaru
2 and
Virgil Constantin
1,*
1
Laboratory of Electrochemistry and Corrosion, “Ilie Murgulescu” Institute of Physical Chemistry—IPC, 202 Splaiul Independentei, 060021 Bucharest, Romania
2
National R&D Institute for Nonferrous and Rare Metals—IMNR, 102 Biruintei Blvd., 077145 Pantelimon, Romania
3
Department of Metallic Materials Science, Physical Metallurgy, University Politehnica of Bucharest, 313 Splaiul Independentei, J Building, District 6, 060042 Bucharest, Romania
*
Author to whom correspondence should be addressed.
Coatings 2022, 12(8), 1108; https://doi.org/10.3390/coatings12081108
Submission received: 23 June 2022 / Revised: 18 July 2022 / Accepted: 1 August 2022 / Published: 3 August 2022
(This article belongs to the Special Issue Electrochemical Properties and Applications of Thin Films)

Abstract

:
In this paper, we investigate what effects heat treatment can have on potentiodynamically electrodeposited high-entropy thin film (HEA) CoCrFeMnNi alloys. We focused our study on the corrosion resistance in synthetic seawater, corroborated with the structure and microstructure of these thin films. Thin films of HEA alloys were deposited on a copper foil substrate, using an electrolyte based on the organic system dimethyl-sulfoxide (DMSO-(CH3)2SO)-acetonitrile (AN-CH3CN) (in a volume ratio of 4:1), which contains LiClO4 as electrolyte support and chloride salts of CoCl2, CrCl3 × 6H2O, FeCl2 × 4H2O, MnCl2 × 4H2O and NiCl2 × 6H2O. Using MatCalc PC software, based on the CALPHAD method, the structure and characteristics of the HEA system were investigated, and thermodynamic and kinetic criteria were calculated. The modeling process generated in the body-centered-cubic (BCC) or face-centered-cubic (FCC) structures a series of optimal compositions that are appropriate to be used in anticorrosive and tribological applications in a marine environment. Electrochemical measurements were carried out in an aerated artificial seawater solution at ambient temperature. In the experimental media, HEA thin films proved to have good corrosion resistance and were even better than the copper substrate. Corrosion resistance was improved after heat treatment, as shown by polarization and EIS tests. The structure and microstructure of HEA thin films before and after corrosion in artificial seawater were investigated by X-ray diffraction (XRD), scanning electron microscopy (SEM) and energy dispersive spectrometry (EDS). The XRD data showed no significant changes in the structure of HEA heat-treated thin films after the corrosion in saline media. The data obtained by polarization and ESI are supported by results from SEM-EDS. This complex study reveals that, for HEA thin films, heat treatment leads to an increase in corrosion resistance. So, this finding suggests that thermal annealing is an appropriate method for improving the corrosion performance of HEA thin films.

1. Introduction

Metallic materials have represented one of the underpinning elements of human civilization throughout the course of its history. The continuous endeavors in the field of materials science and engineering lead to the development of a wide range of structural and functional metallic materials for applications encompassing all areas of the economical specter.
One of the most recent advances is represented by high-entropy alloys (HEAs), a new class of metallic alloys that steer away from the conventional approach [1,2,3].
According to the traditional paradigm, alloys consist of a main component and a small number of additional chemical elements, whereas HEAs are multi-component cocktails based on equiatomic mixtures of five or more elements.
The classical metallurgical theory states that such materials should exhibit a microstructure formed by intermetallic compounds; however, due to their high mixing entropy, HEAs present the tendency to generate simple solid-solution structures, and the formation of single-phase crystal structures is quite common.
A triple range of factors, severe lattice distortions, slow diffusion and the high-entropy effect, determine the structure and properties of these alloys.
These considerations have spurred extensive research efforts aimed at studying these innovative metallic materials, which resulted in the development of a broad range of alloy systems exhibiting remarkable properties, such as high resistance to anneal softening, high strength, high hardness, high corrosion and wear resistance and good electromagnetic capabilities, which render them suitable for potential industrial application as structural and functional materials. The main characteristic of HEAs is represented by their capability to maintain their properties at elevated temperatures [4,5,6,7,8,9].
HEAs are obtained through the majority of presently known synthesis methods for bulk materials and functional coatings: furnace melting and casting, mechanical alloying, rapid solidification, laser cladding, magnetron sputtering, etc. [10,11,12,13,14,15,16,17,18].
In recent years, the state of play in the supply chain of raw materials considered critical or strategic has emphasized an urgent need in increasing the efficiency with which these commodities are used in industrial manufacturing processes. Therefore, fabrication methods which maximize the production output and minimize the materials losses as byproducts are continuously developed and improved.
One of such manufacturing techniques is electrochemical deposition, which can lead to the synthesis of advanced functional materials in the form of thin films and coatings. Electrodeposition exhibits a series of advantages, such as reduced raw material and energy consumption, low temperature processing, short time synthesis duration, simplified equipment design and a high potential of technological scalability [19,20,21].
The obtaining of HEAs through electrochemical synthesis still remains a pioneering effort, as few works are known until now in the scientific literature.
Li et al. [22,23,24,25] investigated the preparing of TmFeCoNiMn, BiFeCoNiMn, and MgMnFeCoNiGd multi-component HEA thin films by electrochemical deposition and researched their potential as materials solutions for next-generation thermoelectric, magnetic, and photoelectronic and fuel cell applications.
Other approaches focused on the pulse electrodeposition method to obtain HEA thin films [26,27].
Our group studied quinary and senary high-entropy alloys in the AlCrCuxFeMnNi system obtained by potentiostatic electrodeposition in an organic electrolyte [28].
In our previous paper, we investigated the synthesis of CoCrFeMnNi HE alloy thin films by electrochemical deposition using a similar organic electrolyte. The electrochemical tests carried out in an artificial seawater environment revealed promising potential for application as anti-corrosive coatings, owing to the protective behavior exhibited by the obtained alloys [29].
More recent research has focused on microstructure and corrosion properties of CoCrFeMnNi HEAs [30], the examination of microstructure and corrosion properties of multicomponent HEAs [31], the effect of heat treatment on microstructure, wear behavior and corrosion resistance of bulk HEAs [32], as well as the comparison of corrosion resistance of CoCrFeMnNi HEAs with pipeline steels in an artificial alkaline soil solution [33].
The present work studies the corrosion behavior and microstructure of CoCrFeMnNi HEA thin layers deposited electrodynamically or potentiodynamically, depending on the thermal treatment. Calculations carried out using the CALPHAD method allowed for the determination of the thermodynamic and kinetic criteria and the modeling and investigation of the structure and characteristics of the alloy system. We consider the obtained results to be new, because we could not compare them with others in the literature denying similar reports.

2. Materials and Methods

2.1. Alloy Obtaining and Thermic Treatment

A 400 mL Berzelius beaker was used for the electrochemical depositions that were carried out at room temperature (20 °C) All electrochemical measurements were performed on PAR 263A potentiostat-galvanostat electrochemical workstation (Princeton Applied Research, Oak Ridge, TN, USA) and PC Power Suite software with a three-electrode cell. A platinum foil (approx. 10 cm2) and a platinum wire (Ø1 mm) were used as counter and reference electrodes.
The HEA thin films were deposited on Cu foil substrates (thickness of 1 mm) by potentiostatic electrodeposition in an organic electrolyte based on dimethylsulfoxide [DMSO-(CH3)2SO]-acetonitrile (AN-CH3CN) (4:1 by vol.) system containing LiClO4 (0.1 mol × L−1) as supporting electrolyte and CoCl2, CrCl3 × 6H2O, FeCl2 × 4H2O, MnCl2 × 4H2O and NiCl2 × 6H2O as raw materials (0.01 mol·L−1 for the equimolar samples). Prior to electrodeposition, the Cu substrates were thoroughly prepared by polishing with abrasive paper of various sizes, etching in 4 M HNO3 solution, and finally rinsing with distilled water. For this study, we used three samples noted, 1, 2, 3, obtained at 2.0 V by 60 min electrodeposition and at different temperatures, and the following samples were obtained: 1(equimolar)-20 °C; 2(non-equimolar: Co0.12Cr0.55Fe0.11Mn0.1Ni0.12)-25 °C; 3(equimolar)-25 °C.
In order to homogenize the microstructure of the submitted samples while releasing their internal stress, thermal treatment is used as a post-processing technique. The obtained HEA thin films were annealed at 400–500 °C for 1.5–3 h, in an inert Ar atmosphere (>99.9% purity), in a sealed steel container (diameter: 80 mm, height: 140 mm, approx. 1 L capacity, IMNR, Pantelimon, Romania), using a CARBOLITE 100–900 electric furnace. The inert gas was purified through a CRS (chromatography research supplier, Louisville, KY, US) all in one purifier cartridge. By this method, we obtained the heat-treated samples. Because we found in preliminary studies that HT at temperatures above 420 °C led to partial or total damage to the HEA thin film, we used for this study only HT at temperatures near this limit. The HT samples (1HT, 2HT and 3HT) were the same as those as-deposited (1, 2, 3).

2.2. Modeling

The most adequate HEA compositions were identified using kinetic and thermodynamic criteria [34]. The governing equations are:
a.
Boltzmann’s equation to calculate the mixing entropy (ΔSmix):
Δ S m i x = R c i ln c 1
where: R is the ideal gas constant (8.314 J/mol·K); ci is the molar fraction of the element i.
b.
Miedema model was used to determine the alloy mixing enthalpy (ΔHmix) [35]:
Δ H m i x = 4 c i c j Δ H i j
where i and j are indices of the containing elements and ΔHij is the binary enthalpy of the containing element pair.
c.
The following equation determines the atomic size difference (δ) [36]:
δ = 100 c i 1 r i r ¯ 2
where r ¯ is the average atomic radius and ri is the atomic radius of element i.
d.
A combined criterion for alloy mixing entropy and enthalpy, introduced by [37] as Ω, was calculated using following formula:
Ω = T m Δ S m i x Δ H m i x
where Tm is the alloy melting temperature and Tmi is the melting temperature of the element i.
e.
The influence of electronegativity was determined by applying the difference Δχ criterion, calculated using Equation (5) [38]:
Δ χ = 100 c i 1 χ i χ ¯ 2
where: χi is element i electronegativity after Pauling and χ ¯ is the average electronegativity.
f.
In order to determine the type of solid solution formed in the alloy, the valence electron concentration (VEC) criterion was applied. The calculation formula is presented as follows [39]:
V E C = c i V E C i
where VECi is the valence electron concentration of element i.
g.
A new criterion was developed to represent the influence of mixing entropy (ΔSmix) and atomic size difference (δ). The geometrical parameter (Λ) is a ratio of both thermodynamic and atomic configuration units, through the following formula [40]:
Λ = Δ S m i x δ 2
Data for the thermodynamic and kinetic calculations were provided using a dedicated software, MatCalc Pro edition software, version 6.02. The modeling results were obtained using CALPHAD (CALculation of PHAse Diagrams) method and is appropriate for pertinent thermodynamic calculations, with verified applicability for multicomponent systems. The database of the program includes most of the thermodynamic parameters for describing Gibbs free energy, equilibrium calculations, precipitation kinetics and microstructure simulations. To analyze the solid solution redistribution process during solidification, the variation of the available phase’s proportions were simulated.

2.3. Corrosion Behavior

A Voltalab 80 PGZ 402 (Radiometer Analytical SAS, Lyon, France), equipped with a special soft Corr, was used to perform the corrosion tests. A thermostatic glass cell with a standard three-electrode systems was used, with the HEA thin-film sample (well-defined at 1 cm2 area) as the working electrode (WE), a saturated calomel electrode as reference electrode (SCE) and a platinum sheet (with a surface area considerably greater than that of the WE) as the auxiliary electrode (AE). In order to prevent electrical interferences, the cell assembly was placed in a Faraday cage. The corrosion medium used was aerated synthetic seawater at room temperature. Because our samples were thin films of HEAs, no surface preparation was done, in order not to destroy the films. The samples were immersed in the synthetic seawater before the tests start and were allowed to reach equilibrium, which usually took around 20 min. In order to obtain the linear polarization curves, the electrode potential was sweeping by ±20 mV with respect to the OCP starting from the cathode pinace region, a constant value of the OCP was reached. Tafel polarization experiments were performed with a constant scan rate of 0.166 mV·s−1, while the potential was shifted within ±250 mV vs. EOCP.
Using a frequency range from 100 kHz to 40 mHz and an AC wave of ±10 mV (peak-to-peak), we obtained the EIS techniques at open circuit potential (OCP). The impedance tests were achieved at a rate of 10 points per decade change in frequency. The Nyquist plots were fitted by ZSympWin soft, in order to determine the equivalent circuits. All electrochemical experiments were carried out at room temperature (25 ± 1 °C).

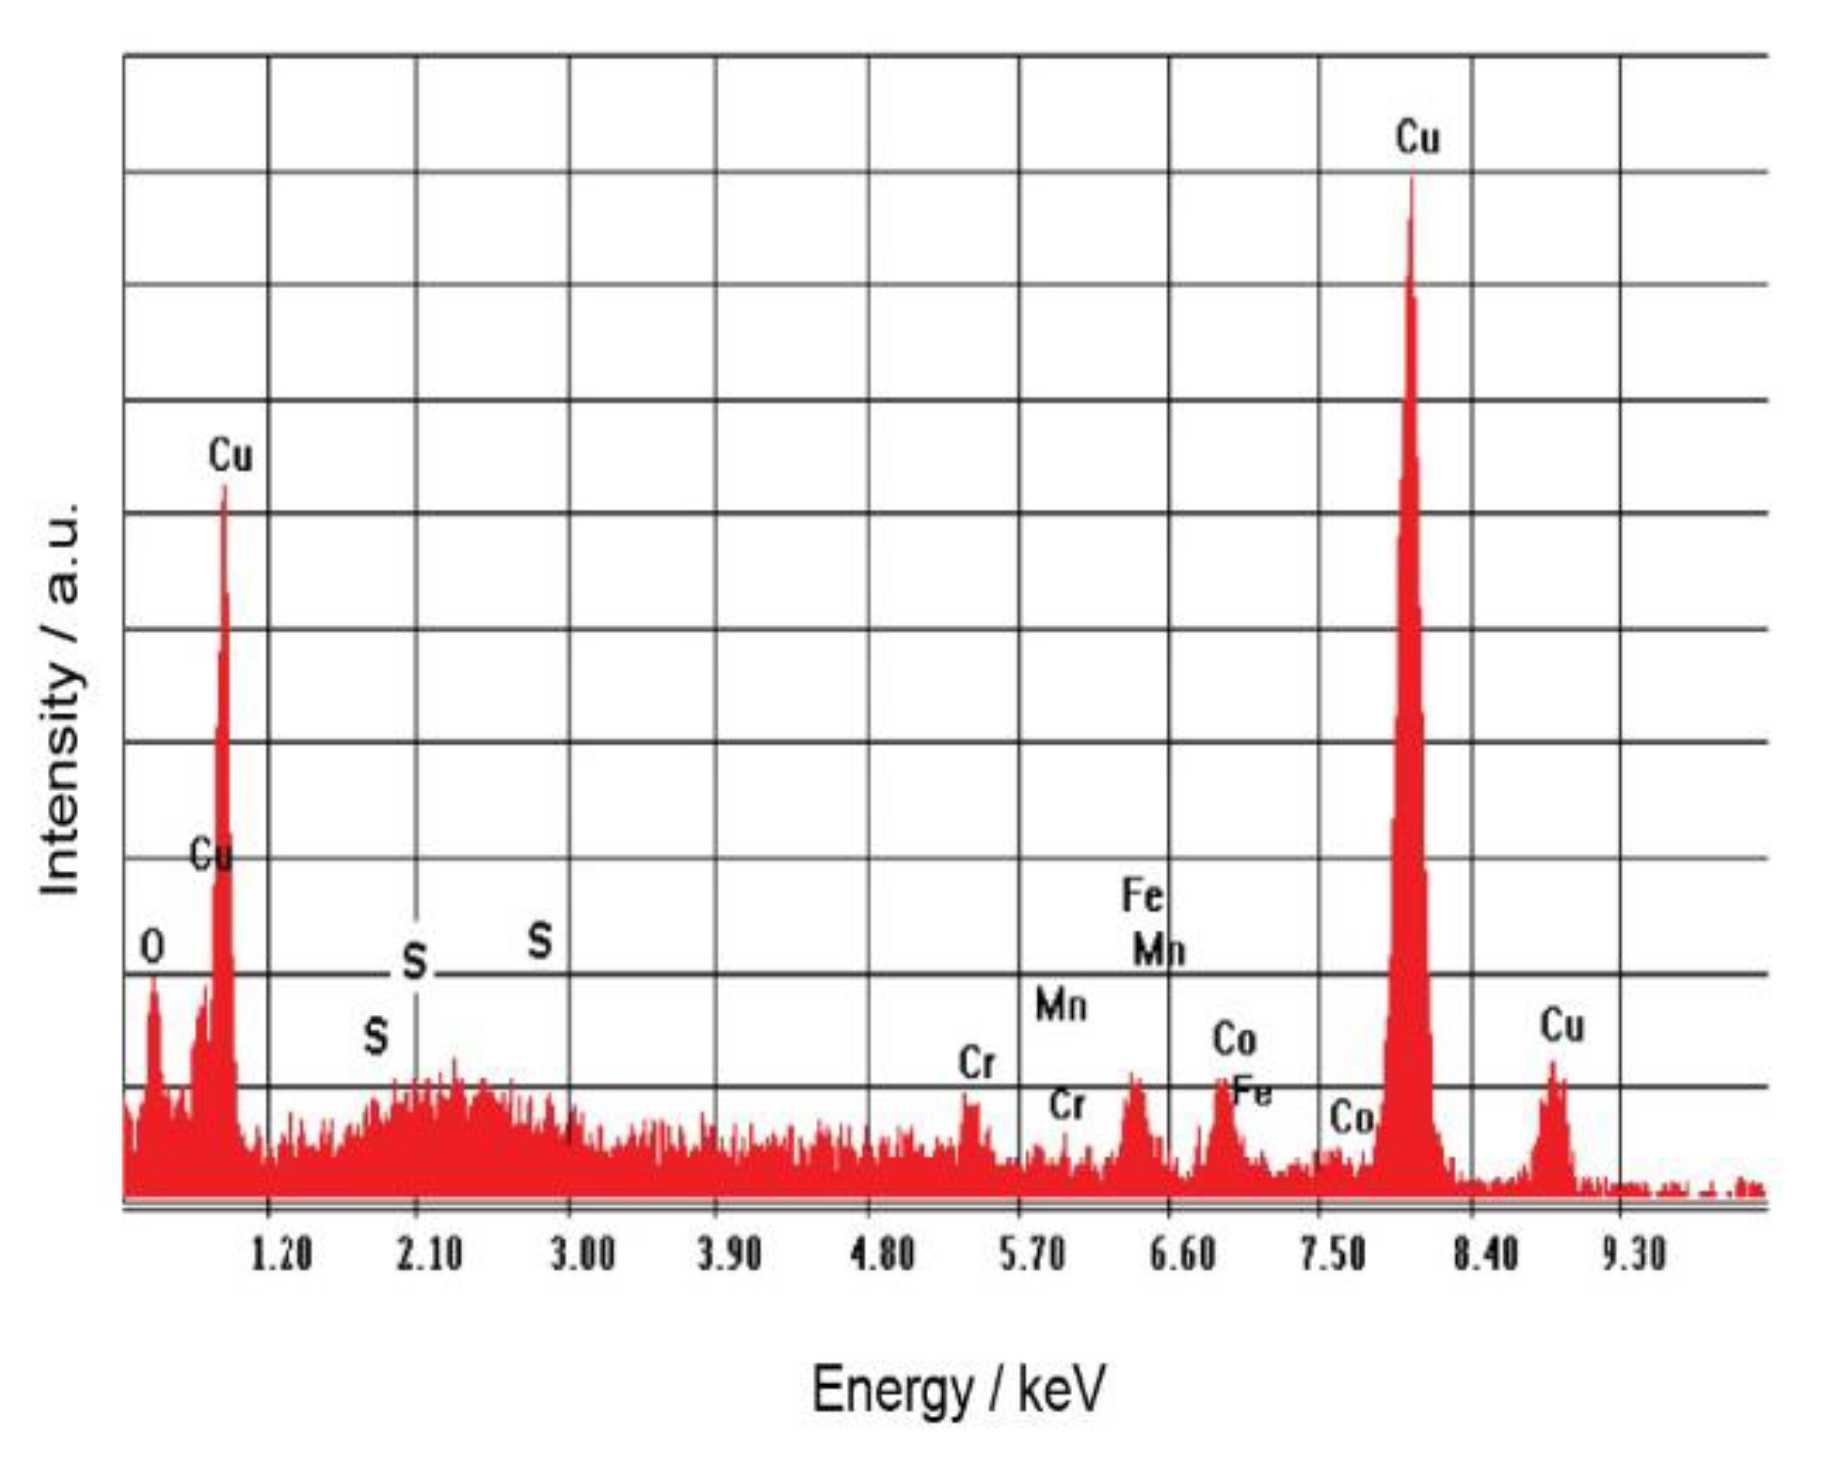
2.4. Surface Characterization of the Alloys

The crystalline structure of the samples was determined by “grazing incidence” X-ray diffraction, in thin-film geometry (GIXRD). The GIXRD measurements were performed with an Ultima IV “diffractometer” (Rigaku Corp., Akishima, Japan), equipped with parallel beam optics and a thin-film attachment, using Cu Kα radiation (λ = 1.5405 Å), operated at 30 mA and 40 kV, over the 2θ range 20–100°, at a scanning rate of 2°/min, with a step width of 0.02°. The fixed incidence angle ω was set at 0.5°. The XRD patterns were further refined using the Whole Pattern Powder Fitting (WPPF) method on the PDXL software (version 2.6.1.2, Rigaku, Tokyo, Japan). The diffraction peak profiles were modeled by a split-pseudo-Voigt function and the B-spline background model.
A Quanta 3D field emission scanning electron microscope (SEM, Quanta, Hillsboro, OR, USA) equipped with an energy dispersive X-ray spectrometer (EDS), presented in our previous investigation [29], was used to evaluate the surphace morphology and chemical composition of the HEA thin films.

3. Results

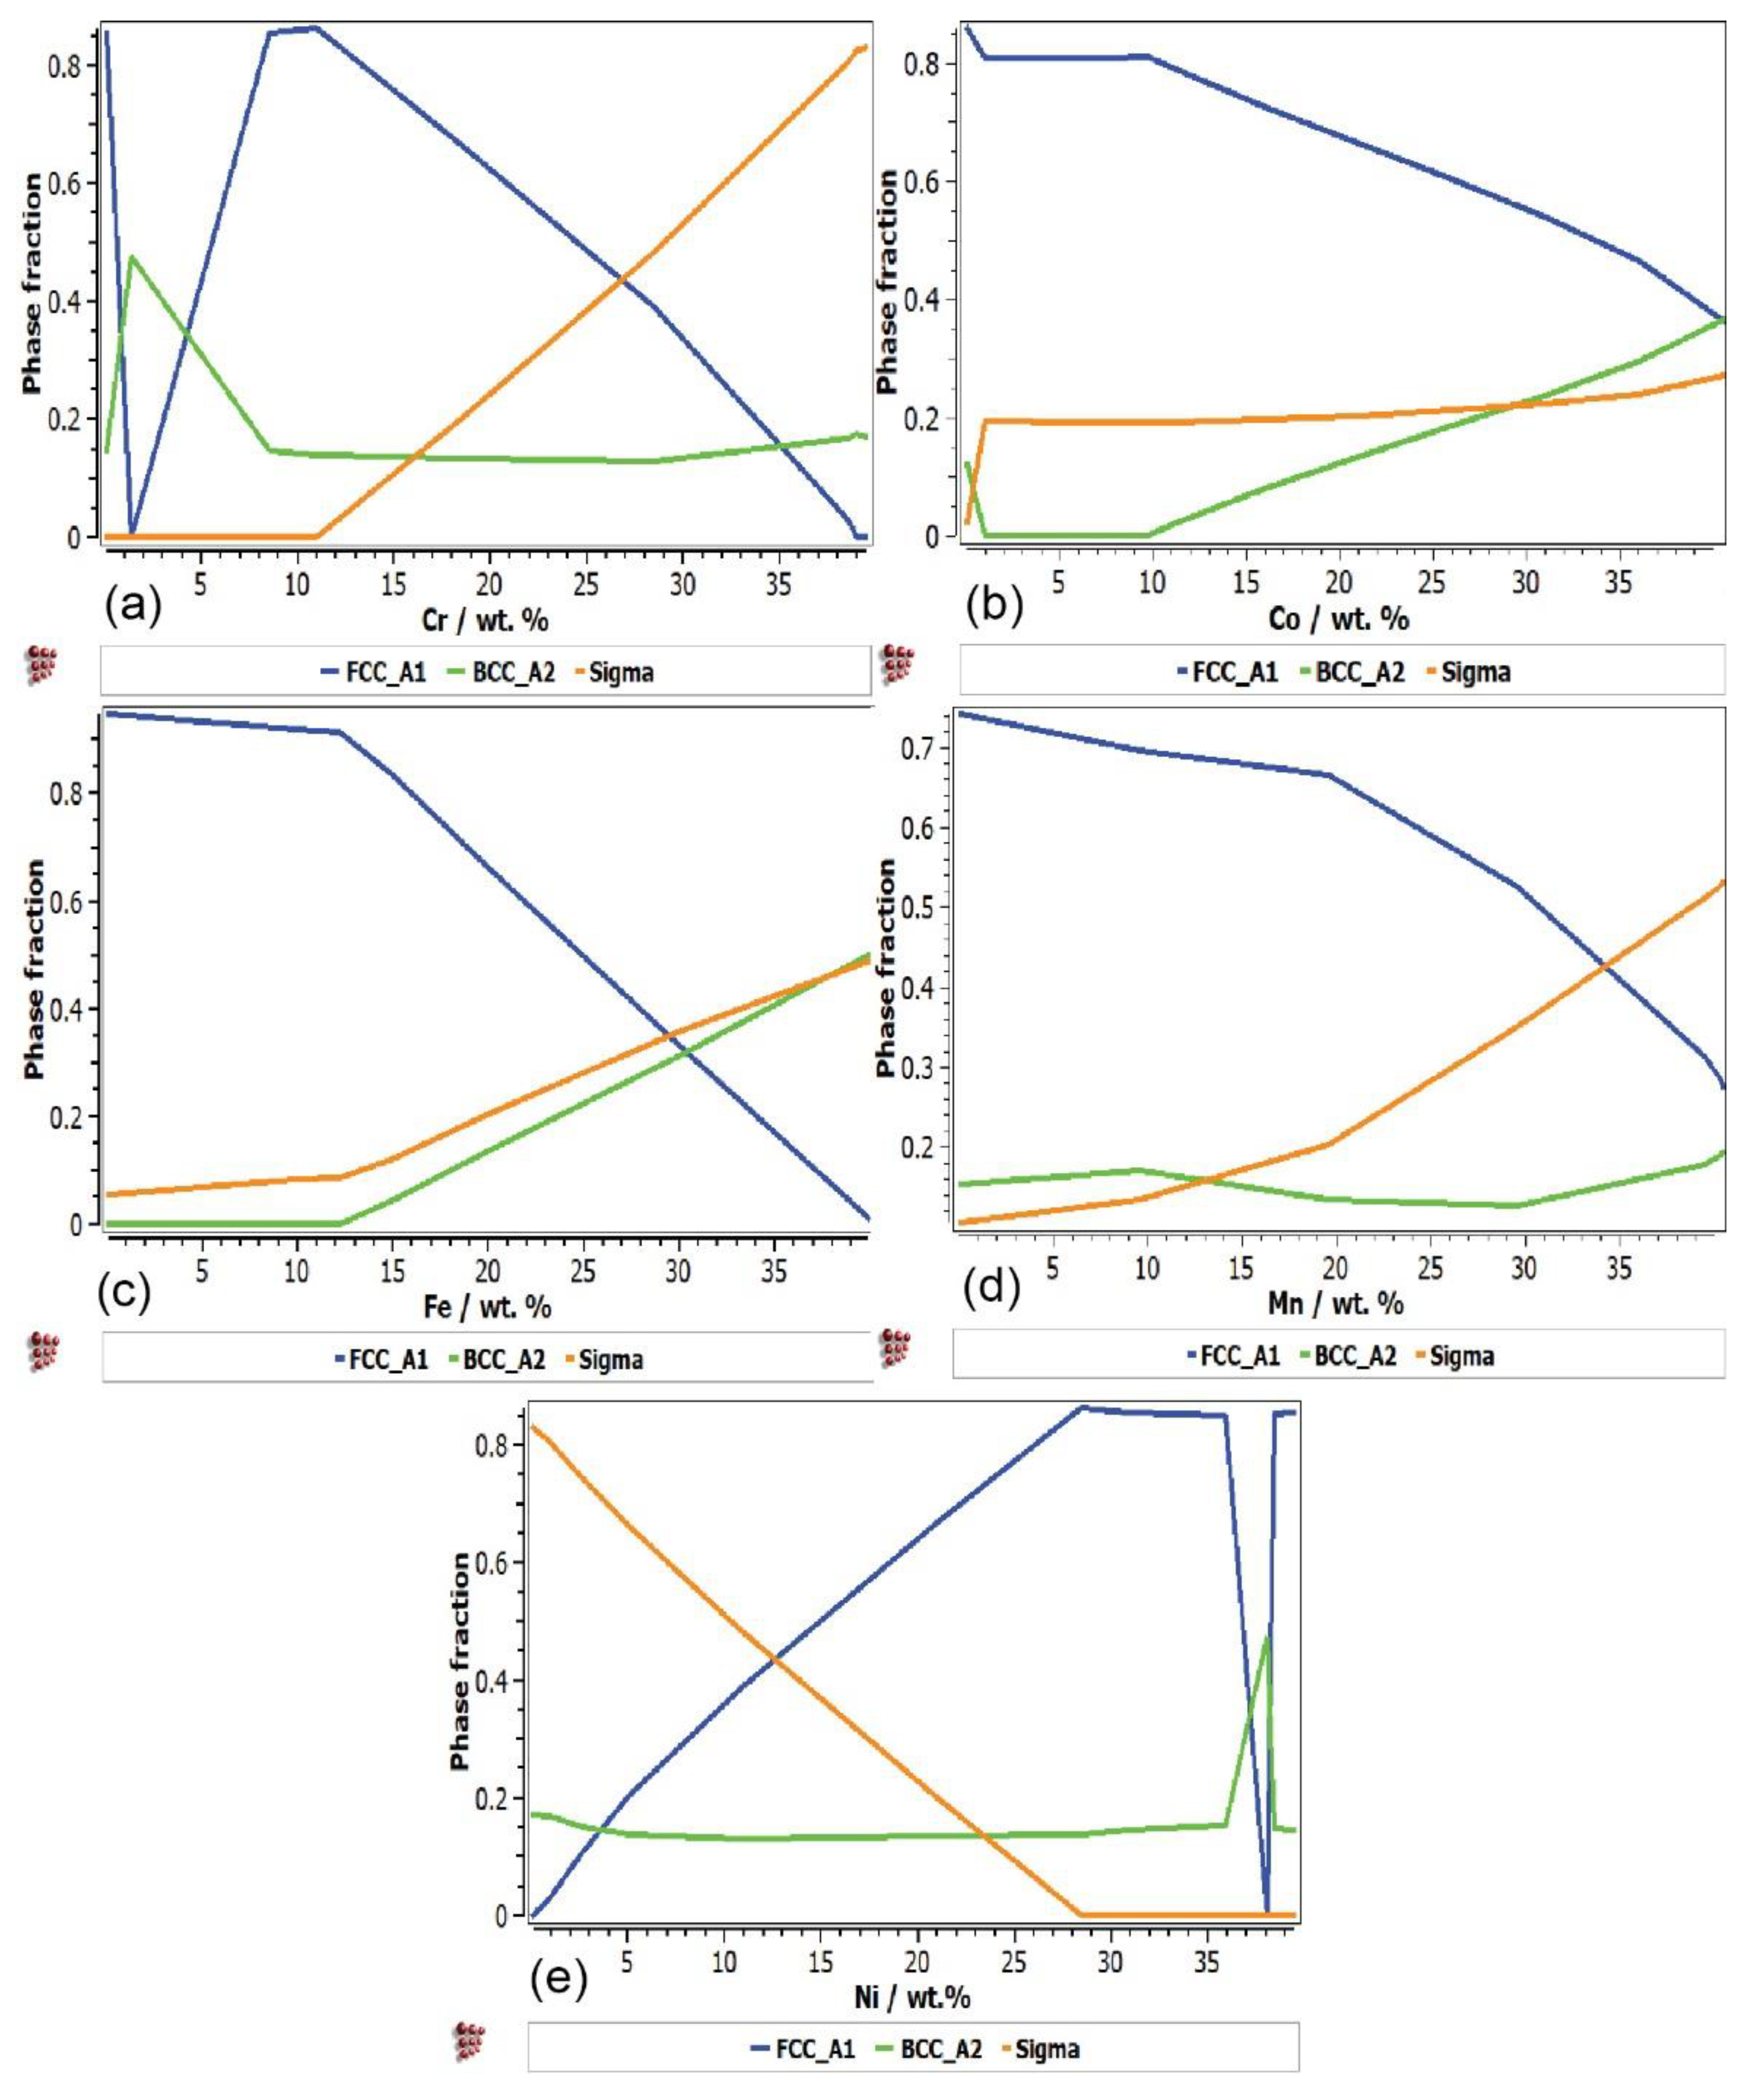
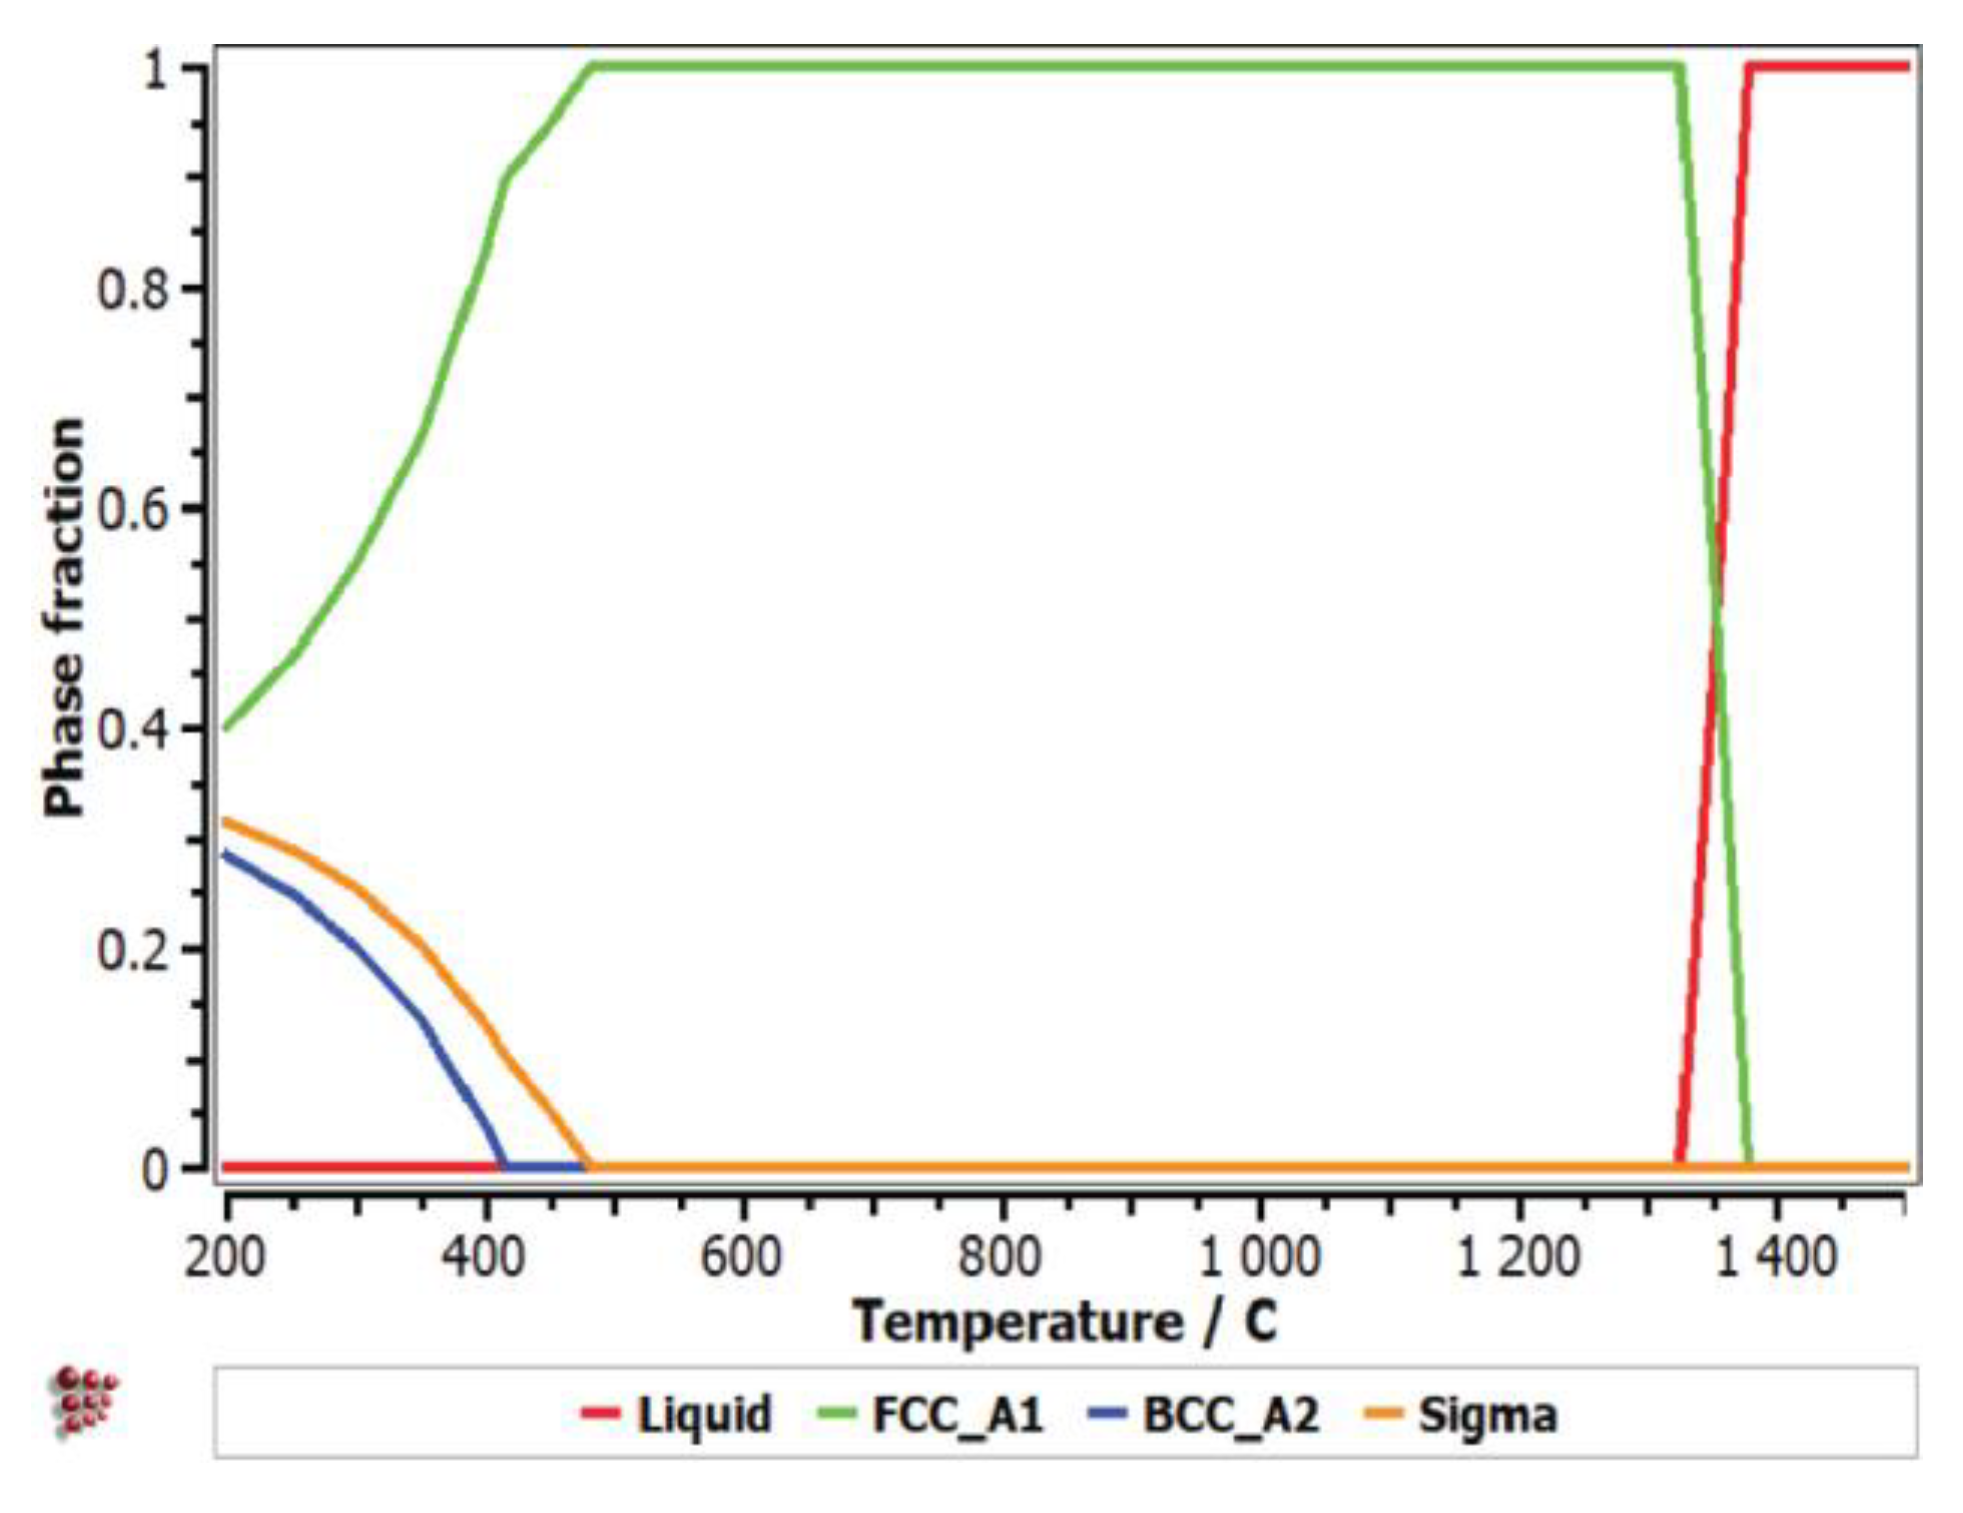
3.1. Modelling of the Concentration Influence over the CAAs Structure

To analyze the solid solution redistribution process during solidification, the variation of the available phase’s proportions, were simulated.
Figure 1 presents the influence of each element on the formation of solid solution in the CoCrFeMnNi alloy. In order to obtain the structural evolution, the software varied each element composition, while the rest of the elements were maintained at constant values.
In general, the influence of the containing elements is specific to their individual properties. Cr, Fe and Mn are known to be hard elements that favor the formation of hard intermetallic phases. From Figure 1a, the strong influence of Cr on the increase in the hard sigma phase can be seen. The same effect has Fe and Mn. In Figure 1a,c,d, a steep decrease in the FCC phase is observed with the increase in hard elements, also due to the formation of the sigma phase. A large influence on the formation of the BCC phase is attributed to Co (Figure 1b) and Fe (Figure 1c), which have the most significant contribution to the decrease in FCC phase. Increasing the Co (Figure 1b) content in the alloy reduces the FCC A1 solid solution phase to about 30% but increases BCC A2 solid solution and the Sigma phase content. Increasing the Fe concentration in the alloy lowers the content of the FCC A1 phase but increases BCC and Sigma beyond a 12 wt. % Fe content (Figure 1c). The increase in Mn determines the decrease in the proportion of FCC_A1 solid solution (Figure 1d), while BCC-A2 solid solution and sigma phase proportion are increasing. The addition of Ni determines an opposite behavior, bringing the FCC phase to high concentrations while drastically decreasing the Sigma phase (Figure 1e). Regarding the BCC phase, Ni addition does not have a real effect on the proportion of this phase in the alloy. In order to select a compositional range for the optimized alloys, it is necessary to provide required properties, which are influenced by the phase composition. In the present case, a combination of high hardness and toughness could be achieved if the resulted alloy contains a proper balance of hard and soft phases. The equimolar alloy is placed in Figure 1 in the area where soft phases (FCC) have a percentage higher than 60%, leading to the obtaining of a material with lower toughness.

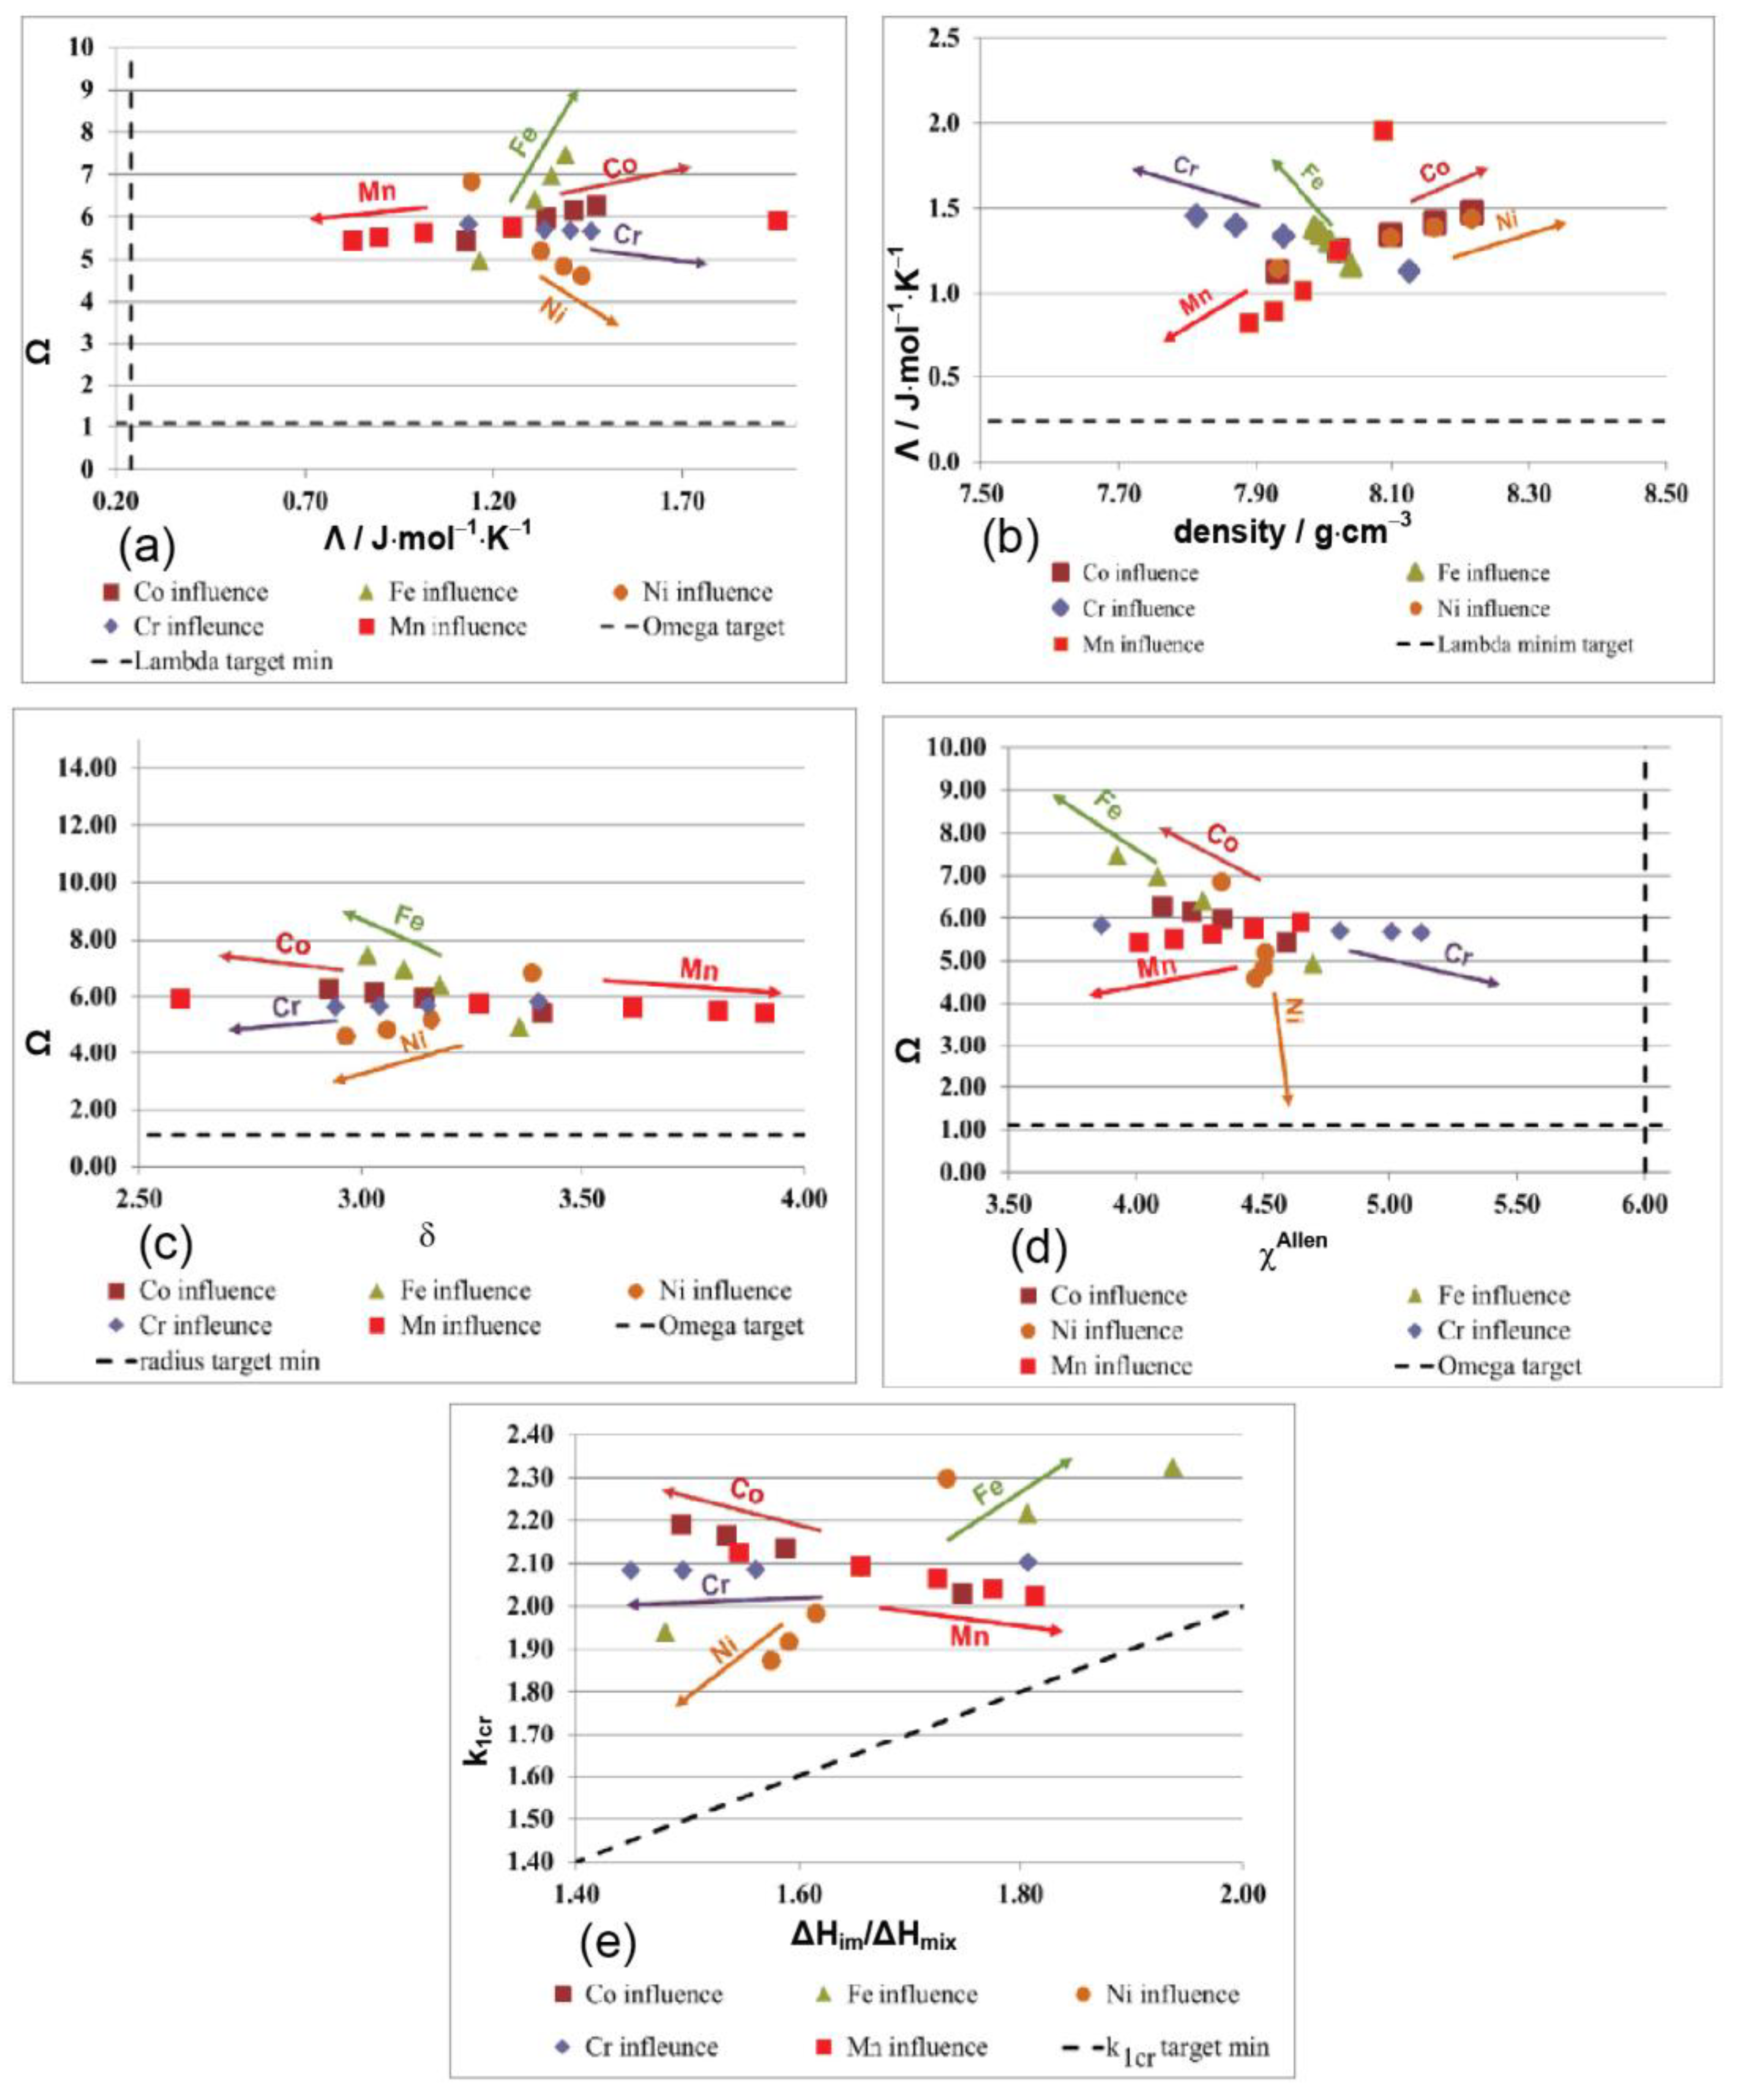
3.2. Kinetic and Thermodynamic Criteria Calculation

In order to obtain the optimal composition and identify the variation of each constituent element (Figure 2), several calculations were performed to determine appropriate thermodynamic and kinetic criteria.
In Figure 2a, the ratio between the derived parameters omega, Ω, and lambda is presented. It can be observed that Fe and Co content have a positive influence over the formation of the solid solution phase, while Mn, Ni and Cr can shift the alloy from the optimal area. Analyzing the variation of the parameter Λ with density, it was observed that increasing the content of Co and Ni raises the possibility of obtaining a solid solution structure, but with a significant increase in alloy density. The ideal is to increase the Fe and Cr content to promote solid solution formation and lower the alloy density. Mn lowers alloy density but also decreases Λ value.
Figure 2c presents the variation between derived parameter omega Ω, and the atomic radius difference δ. Analyzing the elements, it was observed that only Mn has a negative influence over the formation of solid solutions. Fe and Co have an optimal influence, while Ni and Cr have a slight influence on decreasing Ω values. The graphic representation of the ratio between the derived parameters omega, Ω, and Allen electronegativity, χAllen, shows that most elements tend to push the alloy outside the solid solution zone, except for Fe and Co, which has a positive effect for the solid solution formation. The ratio between derived parameters k1cr and ΔHimHmix is important in analyzing the influence of the constituent elements on the formation of solid solutions. To obtain the desired phase, the content of Co, Cr and Fe has to be increased, and the content of the other elements must decrease. The results of the thermodynamic and kinetic criteria determination provided information about the structure of the alloy and the influence of the constituent elements. For the CoCrFeMnNi HEAs, Fe and Co have a positive influence on the evolution of Ω and lambda parameters, while Fe and Cr have a favorable influence on the Λ variation with density.
The phase equilibrium diagram, presented in Figure 3, shows a single-phase FCC-A1 configuration at temperatures higher than 500 °C. Phases BCC-A2 and Sigma are increasing rapidly in the alloy composition as the temperatures decrease towards 200 °C, where a phase fraction of 0.3 is presented. As a result, the FCC phase is found to decrease significantly, reaching a 0.4 fraction at 200 °C. The simulation indicated the melting temperature of the alloy at 1400 °C.

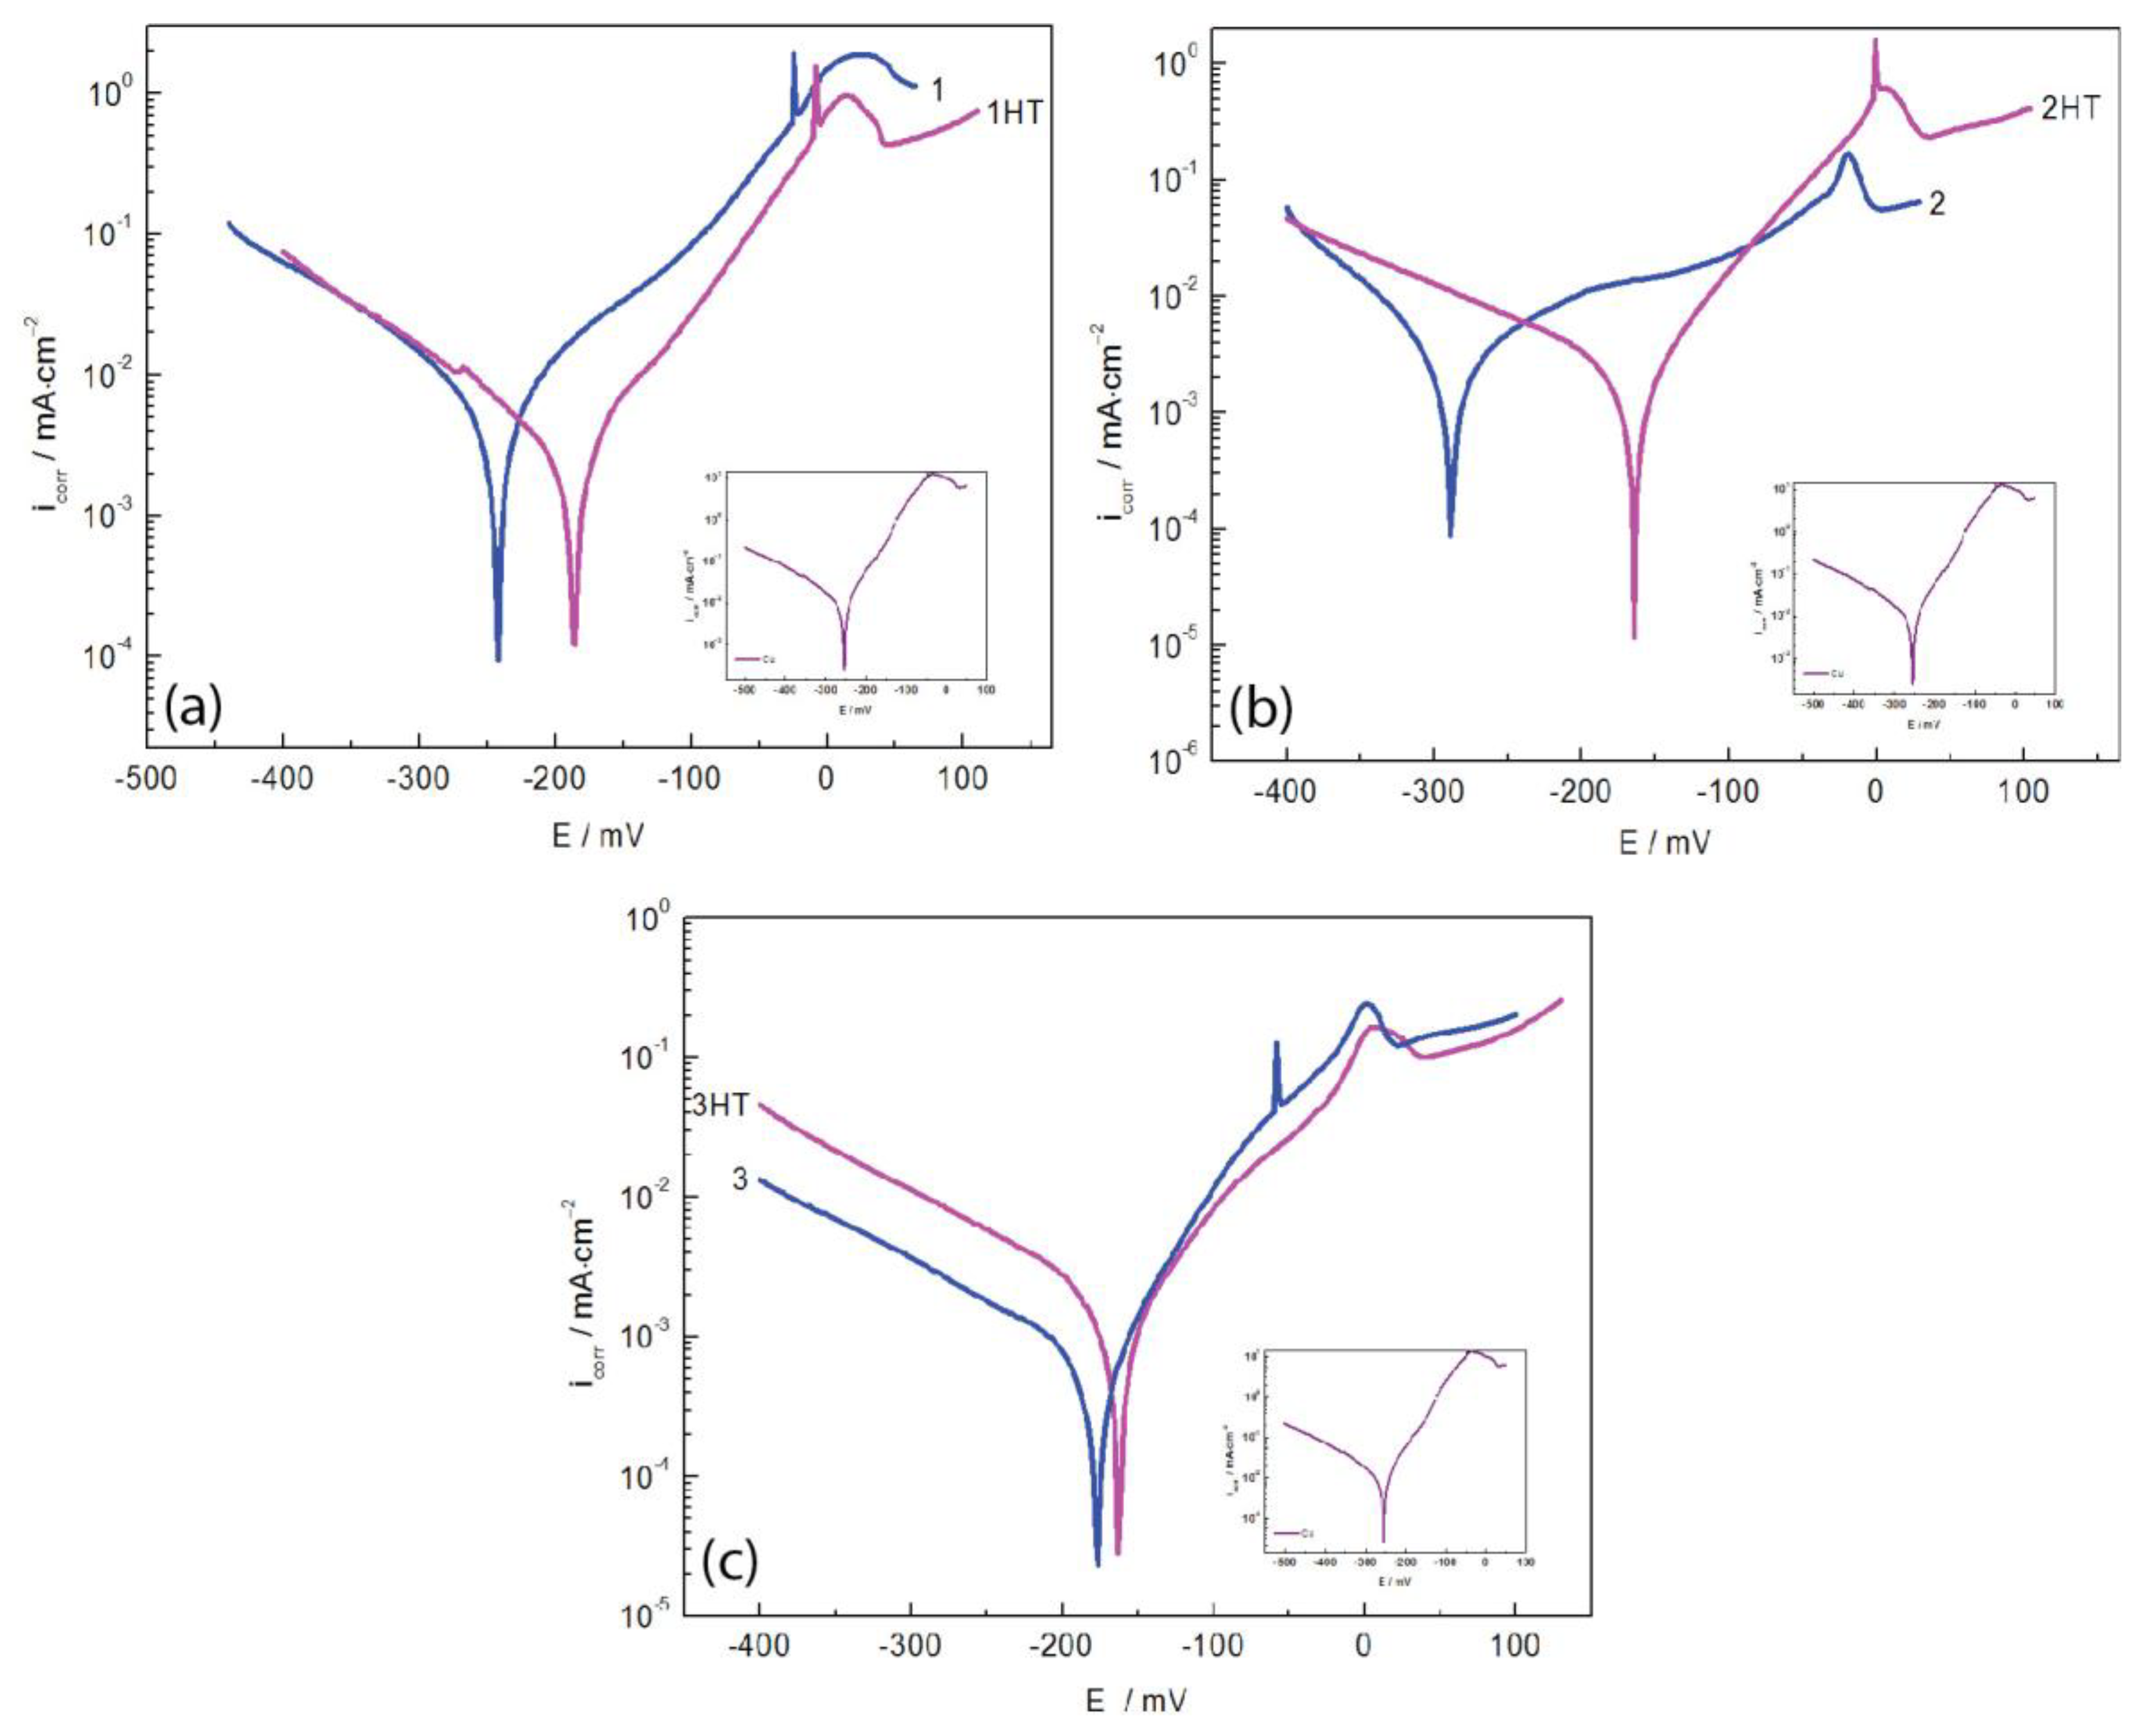
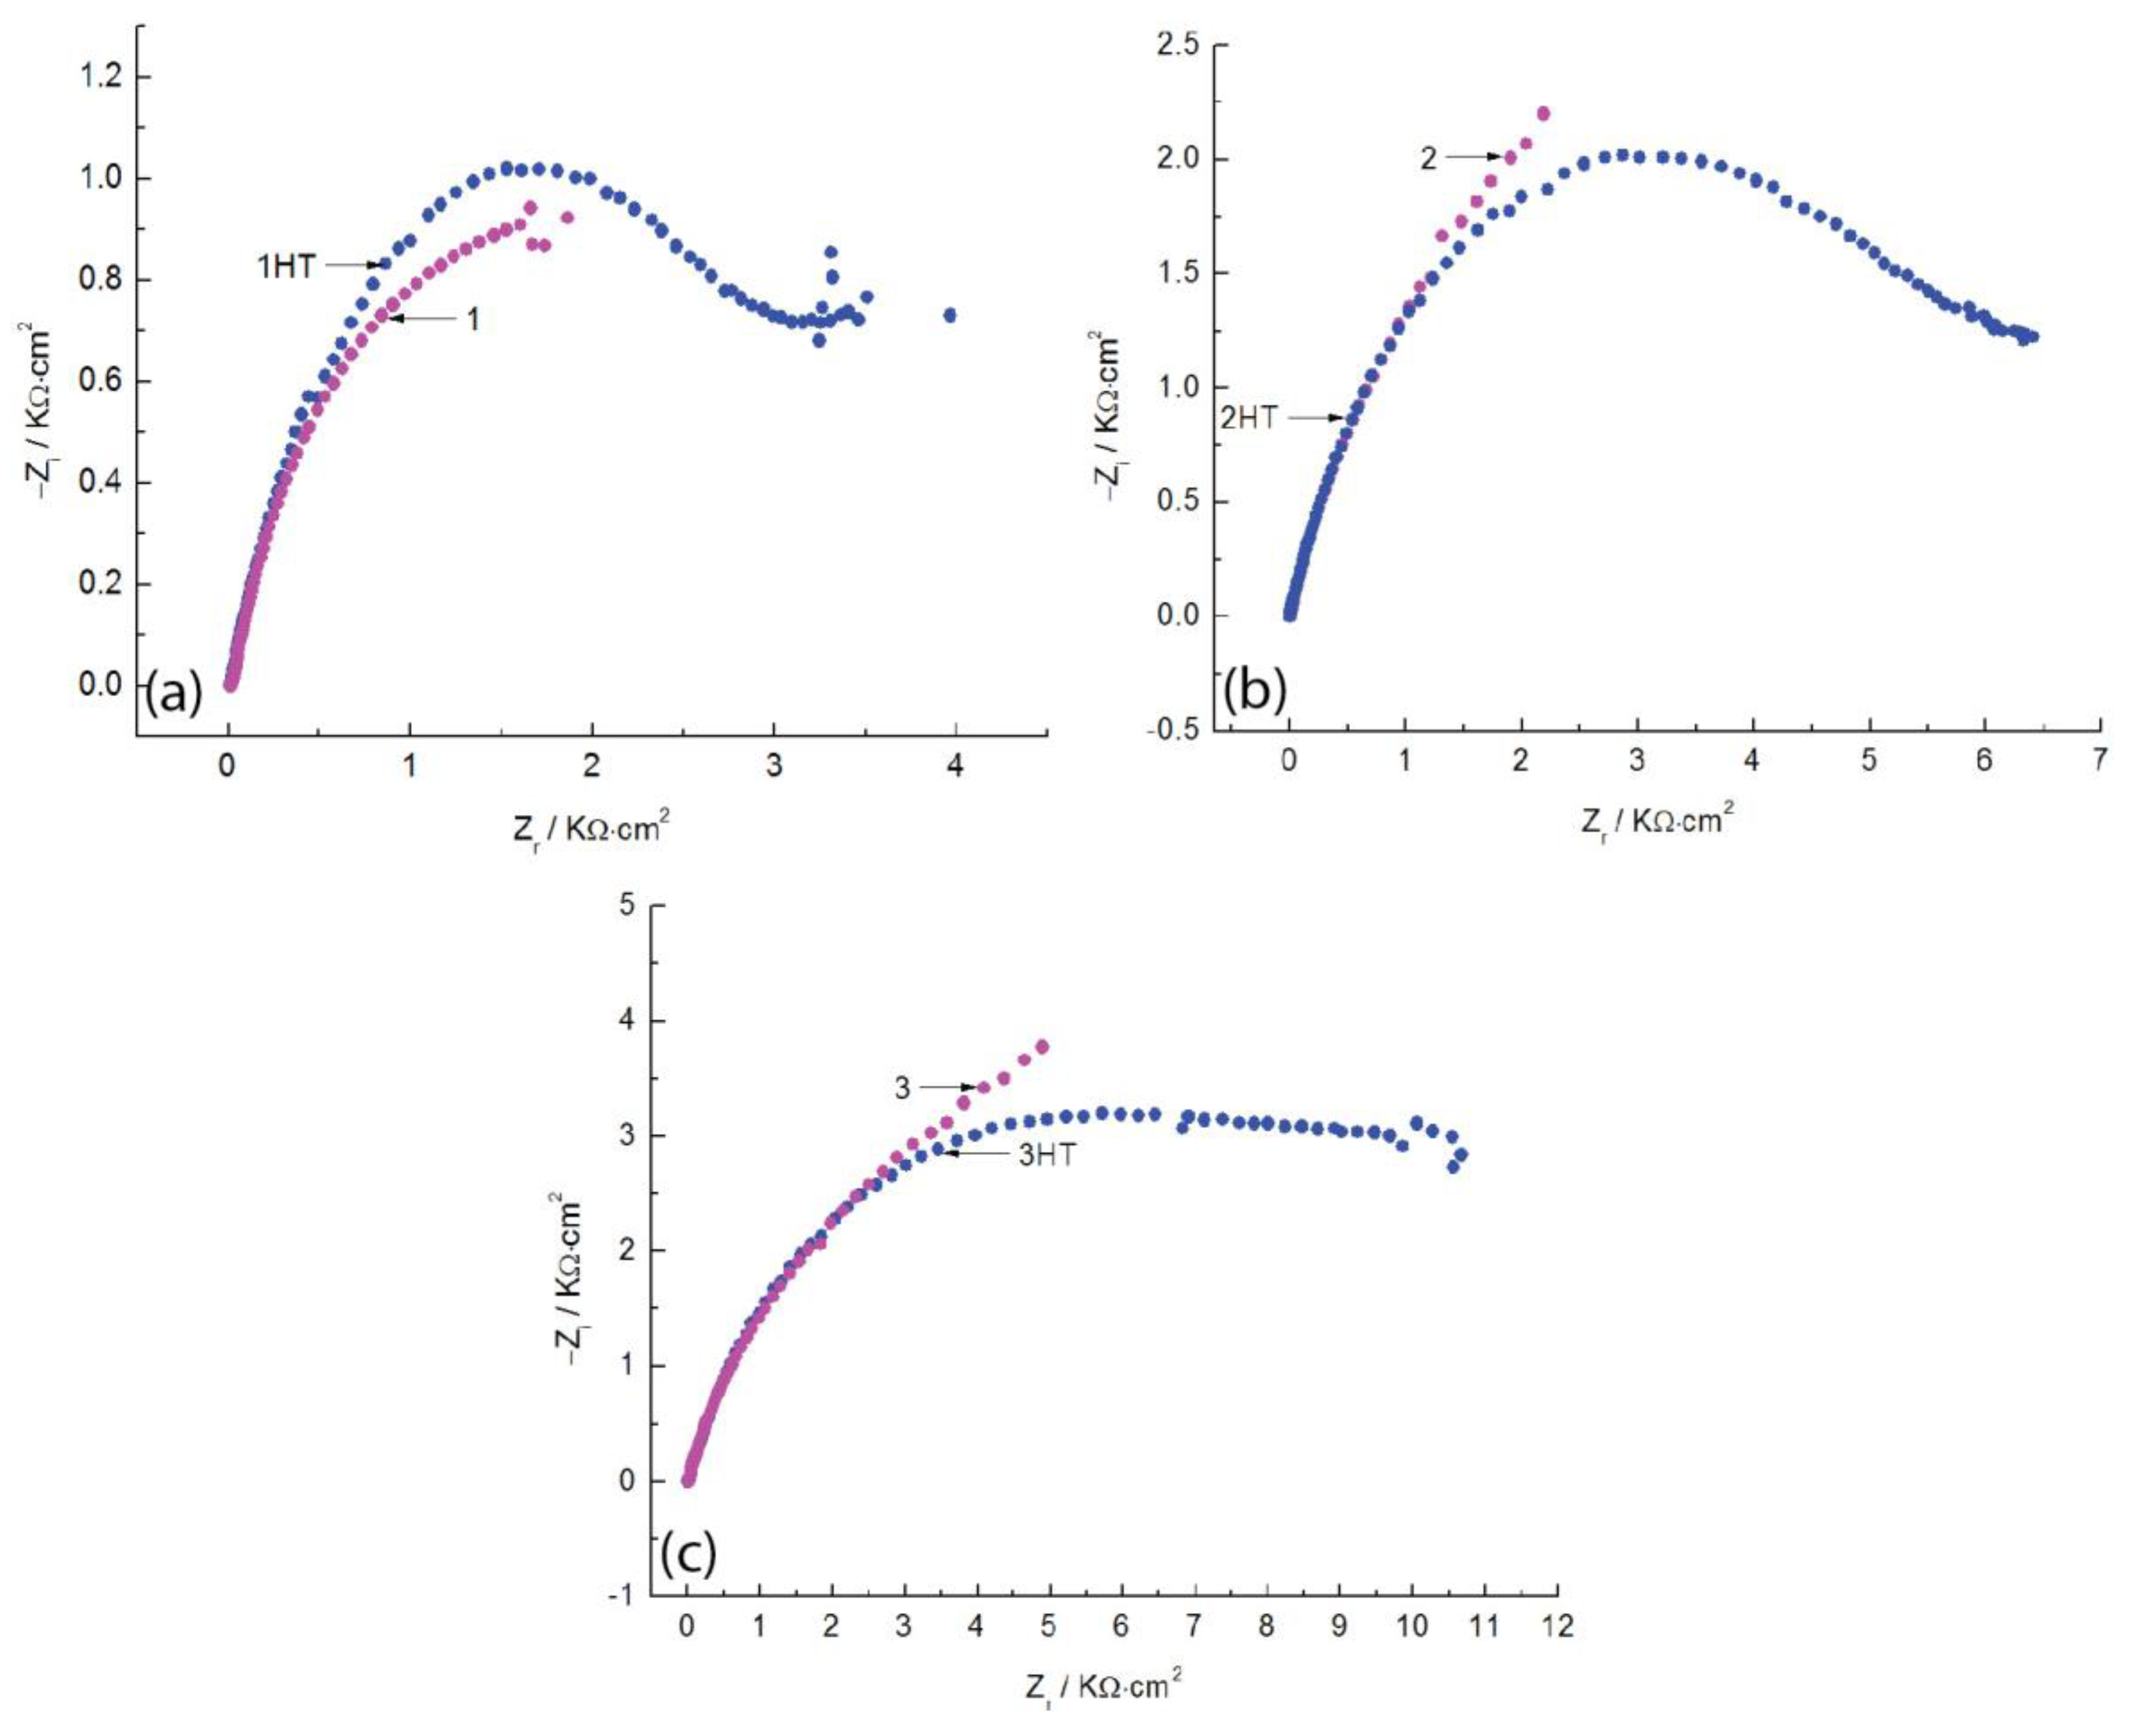
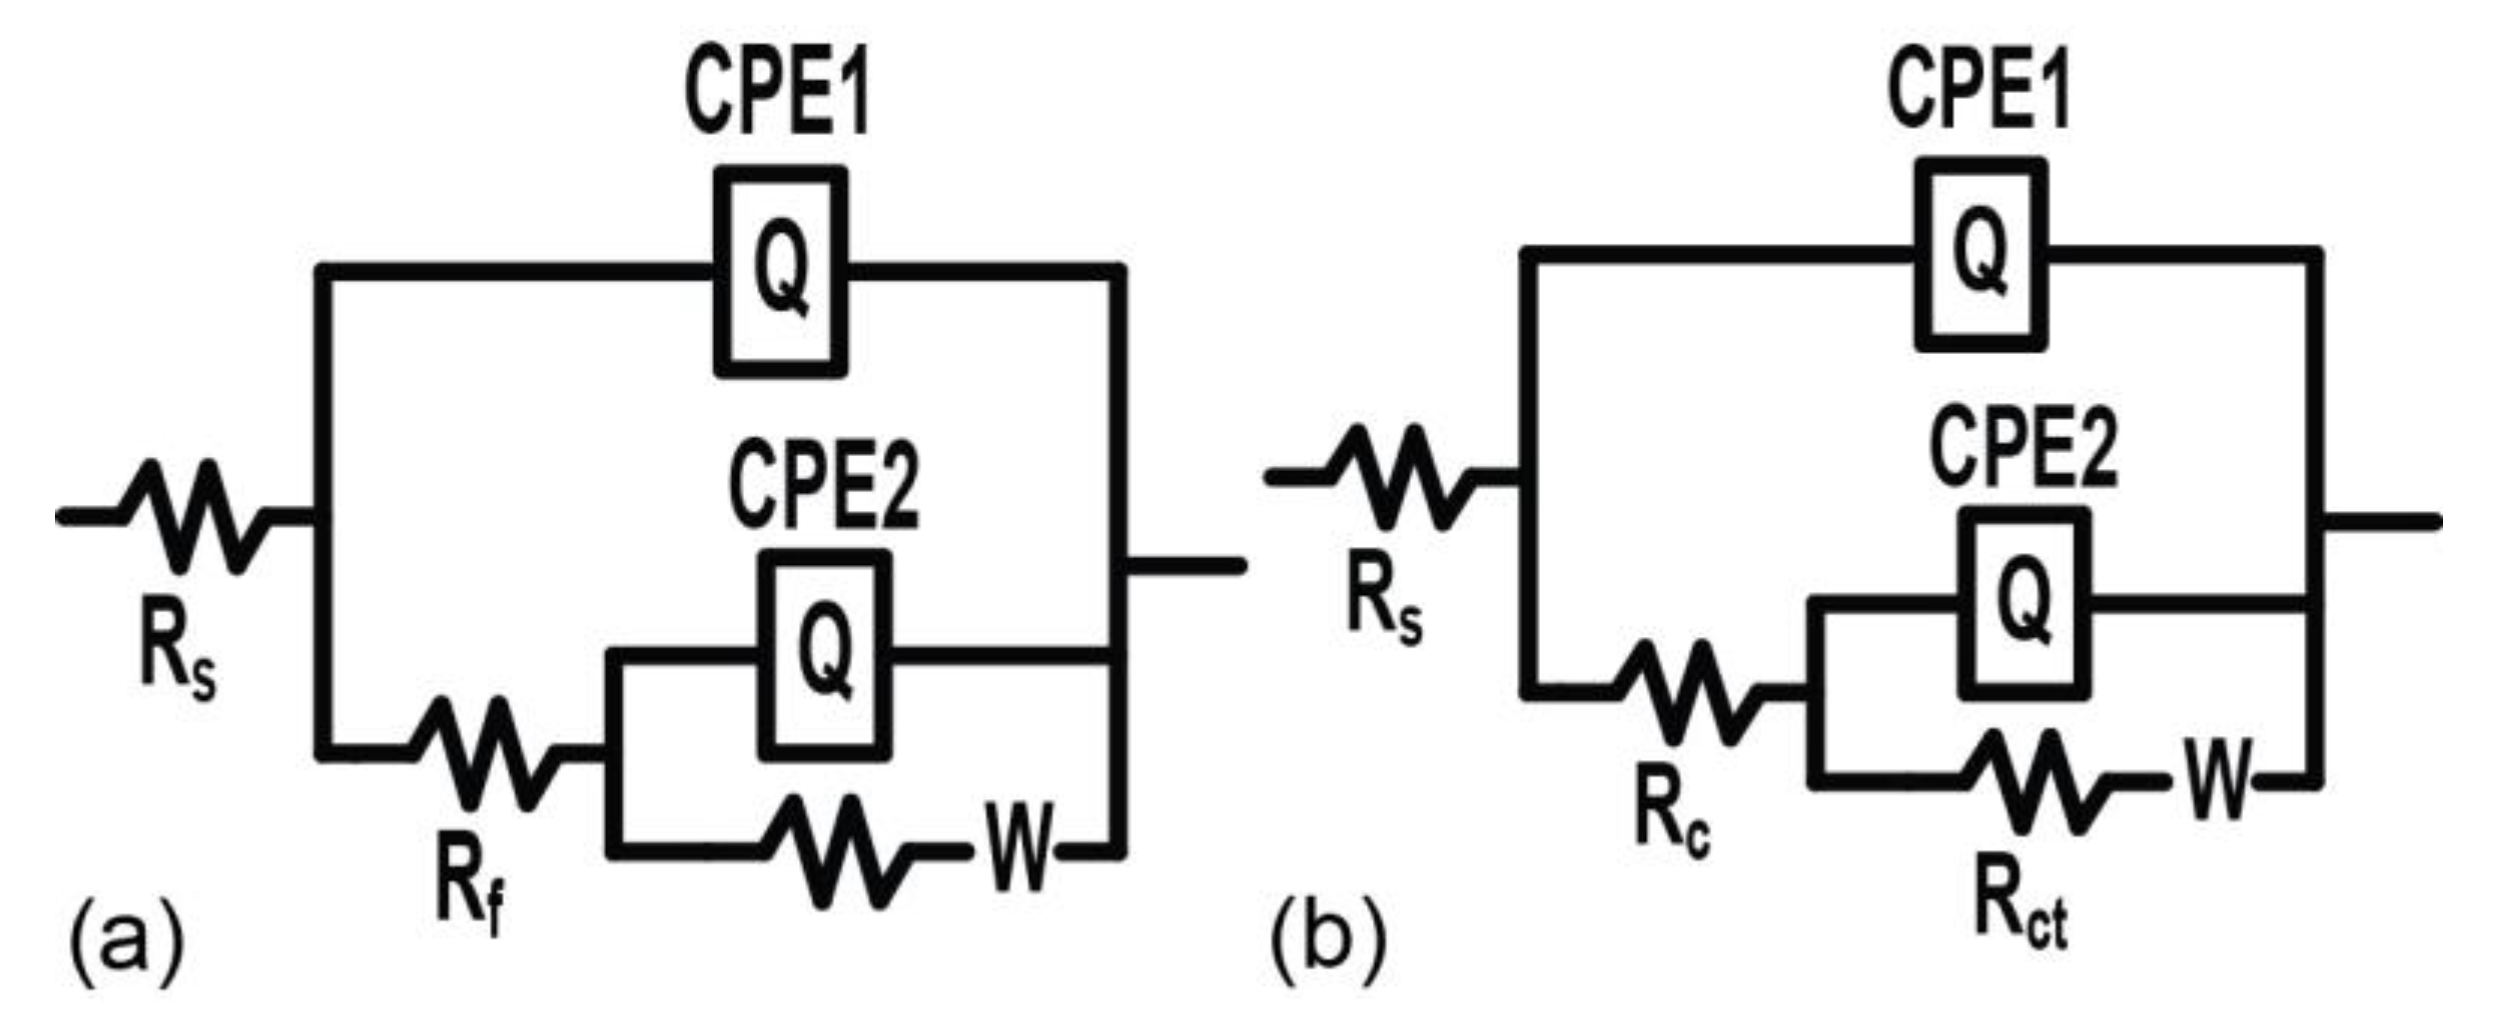
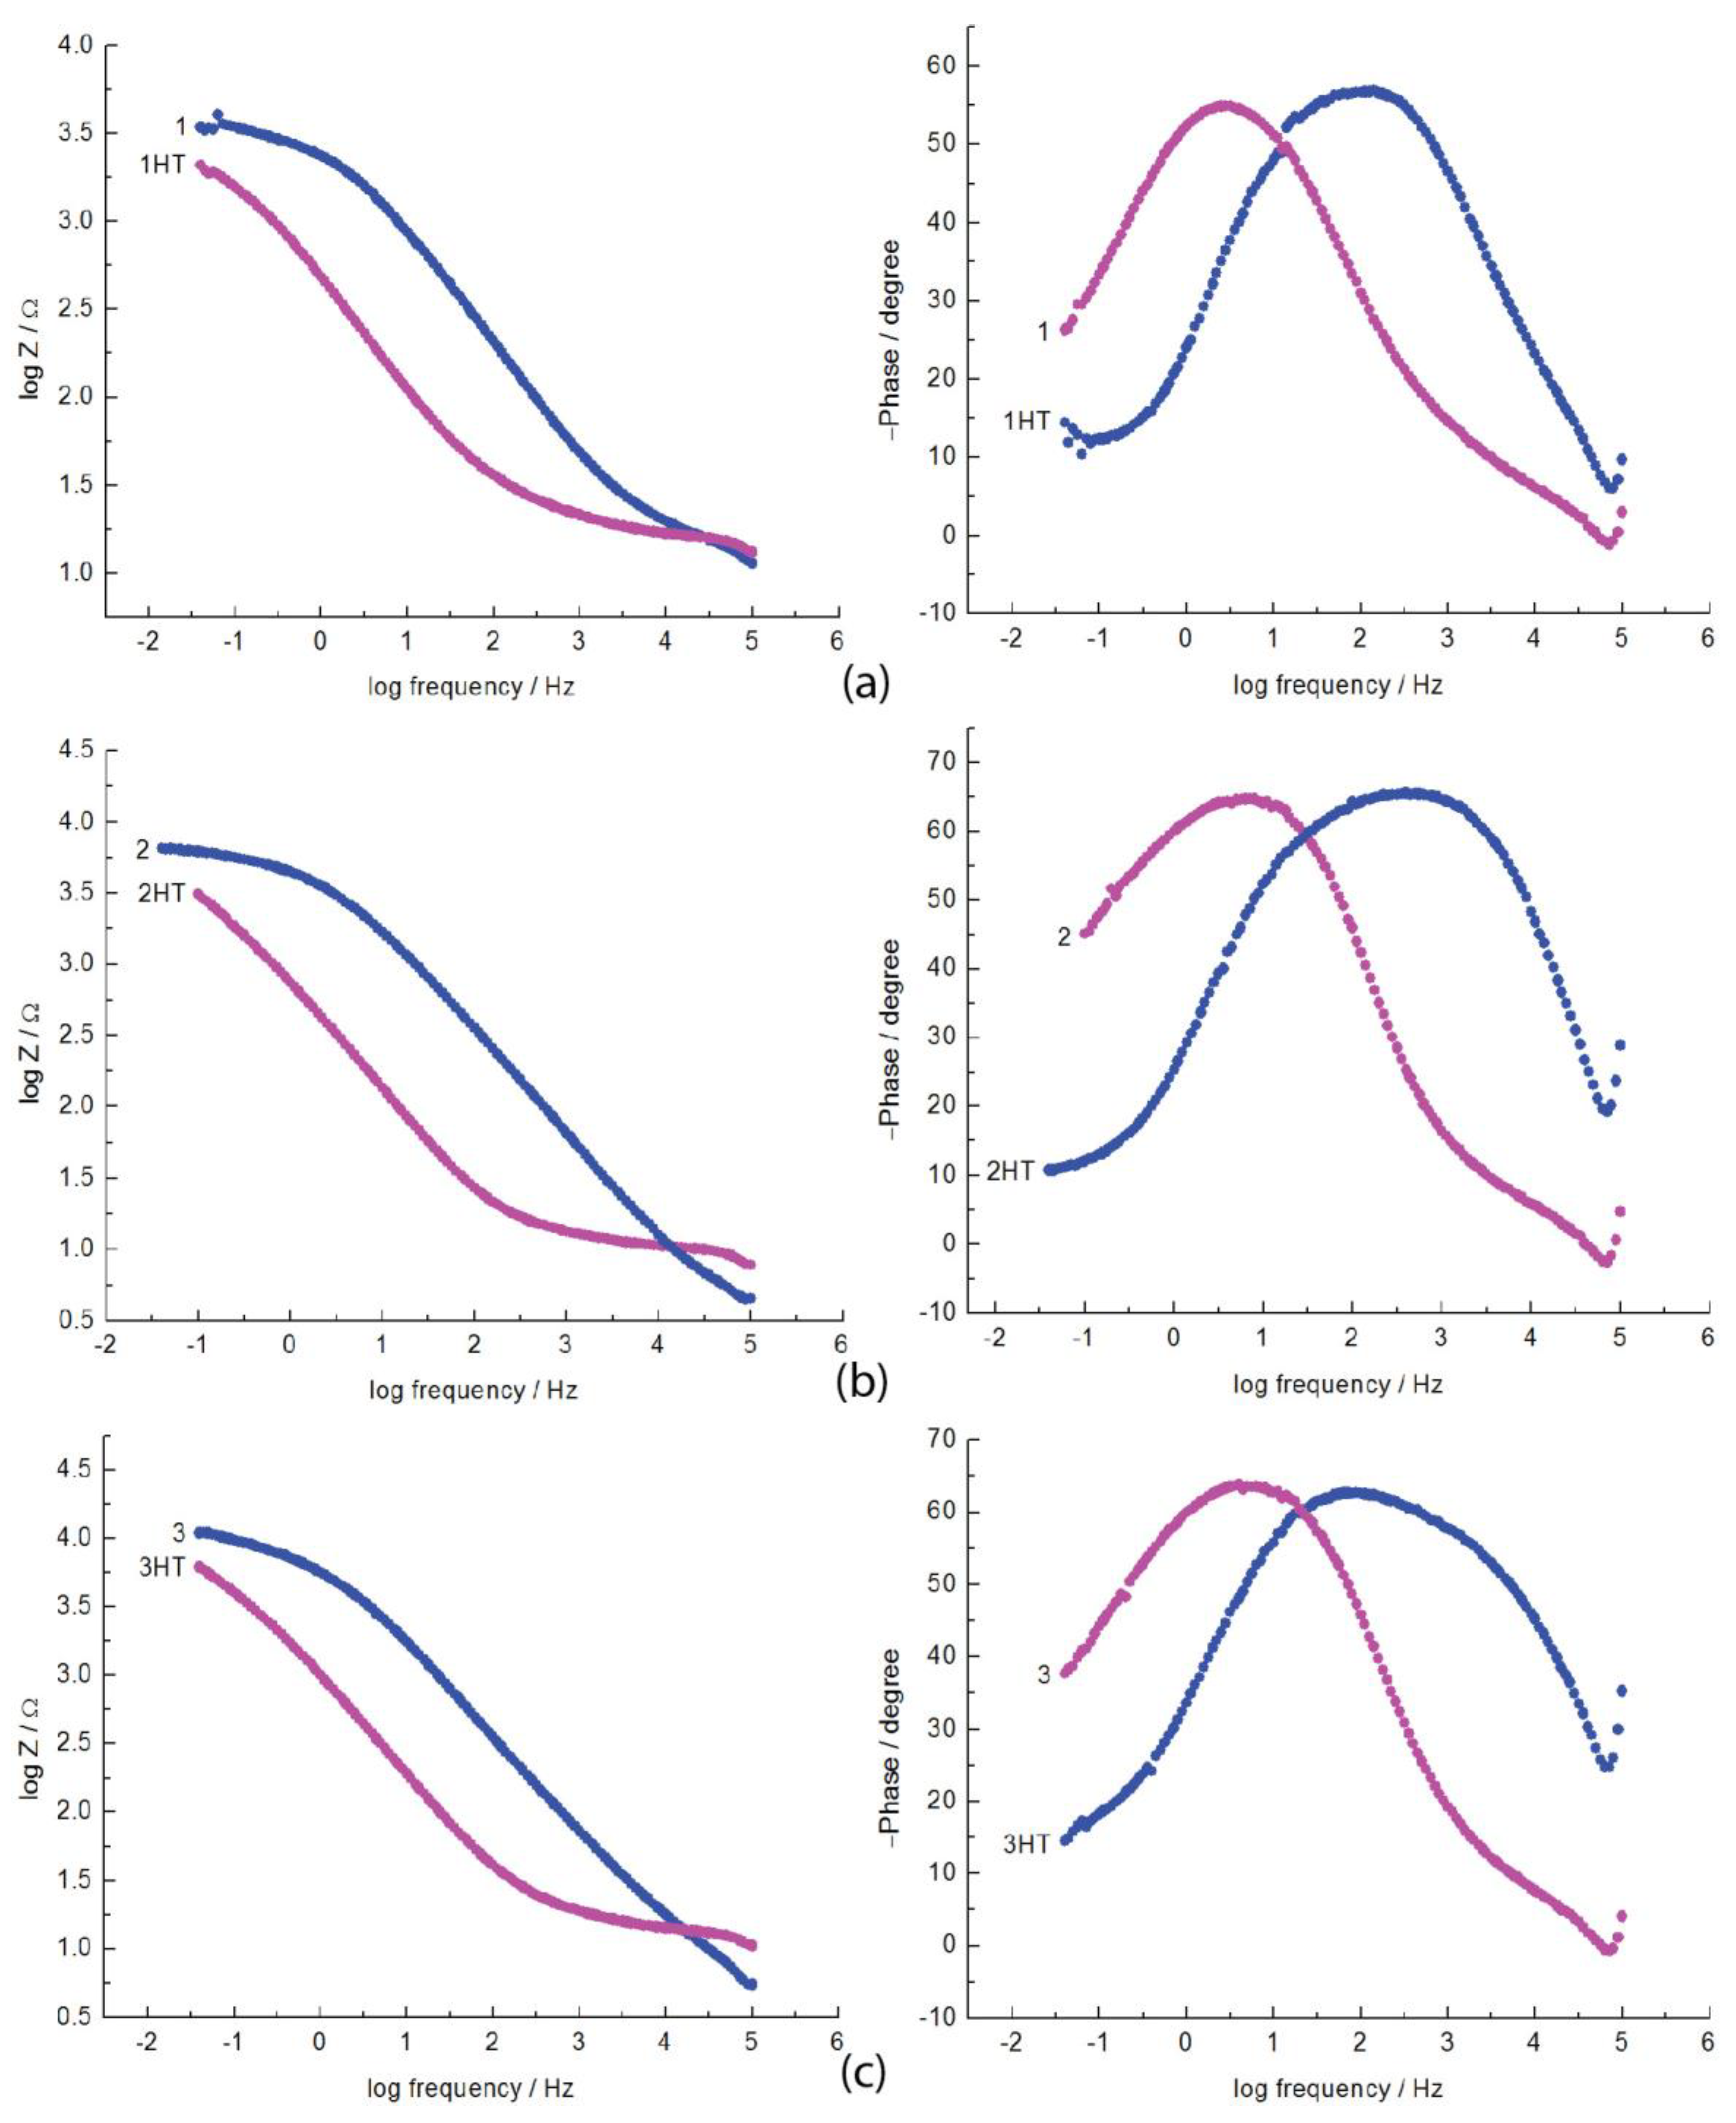
3.3. Corrosion of HEA Alloys (Electrodeposited and HT)

In this investigation, one of the best methods to protect metal electrodes against corrosion in an aggressive environment was to deposit protective thin films which verify the anodic reaction, the cathodic reaction or both. The polarization behavior was studied at room temperature in a synthetic seawater environment for all electrodes: Cu uncoated, Cu coated with HEA thin films and Cu coated with HEA thin films that were heat treated. The polarization curves of the uncoated, as-deposited and heat-treated samples are shown in Figure 4 (the inserted figures represent the polarization of the Cu support, for the comparison of the results), and cathodic and anodic polarization curves indicate in the presence of HEA thin film a lower current density (Figure 4).
For the electrodes covered with HEA thin films and especially for the heat-treated samples the polarization curves manifested a positive shift of the corrosion potential. This indicates the protection of the electrode surface against corrosion by the HEA-deposited coatings. This behavior demonstrates that the HEA protective thin films had a significant effect on both cathodic and anodic reactions during the electrochemical process.
From the analysis of the Tafel curves that are presented in Figure 4 and of the data from Table 1, where the measured and calculated corrosion parameters are given (open circuit potential/OCP, polarization resistance, corrosion potential/Ecorr and corrosion current density/icorr, corrosion rate), the differences between the coated and support Cu samples and between the heat-treated and as-deposited electrodes can be observed. The experimental results show very good corrosion resistance for the coated samples with the CoCrFeMnNi thin films (as-deposited 3 and heat-treated 3HT and 2HT), a good behavior for samples 1HT (heat-treated) and 2 (as-deposited) in the synthetic seawater solution, while sample 1 exhibited a much lower level of corrosion resistance.
This analysis of the polarization curves indicates that the protective films of the heat-treated and as-deposited HEA thin films had a major influence on the electrochemical process (cathodic and anodic reactions). This proved also that the deposited HEA film prevented the attack of the aggressive ions (Cl) on the surface of the electrode.
Moreover, from this analysis, it can be seen that the heat-treated samples 3HT, 2HT and as-deposited 3 HEA thin film demonstrated higher protective properties with an efficiency of 89%, 83% and 85%, compared to heat-treated sample 1HT and the as-deposited sample 2, which exhibited a good efficiency of 74% and 62%, while sample 1 did not offer good protection with an efficiency of 40%. All the samples investigated electrochemically in the artificial seawater solution manifested corrosion protection, but with different efficiency values (1 < 2 < 1HT < 2HT < 3 < 3HT). Nyquist diagrams (Figure 5) for samples deposited with HEAs and those with HEA heat-treated films determined in the synthetic seawater. The diagram of uncoated Cu substrate is not presented but we will discuss it. The impedance diagram of the uncoated Cu substrate can be described by two semicircles, a smaller one at a high frequency followed by a larger one at lower frequencies. The first semicircle is attributed to the formation of the corrosion products film and is represented by the resistance and capacity of the corrosion film. The second semicircle is attributed to the diffusion of copper cations (soluble CuCl2) in the saline solution and is characterized by the charge transfer resistance and double-layer capacity and the Warburg impedance (W). The existence of the Warburg impedance indicates the diffusion of the soluble species. The corrosion mechanism of the uncoated electrode is under mixed control: by copper dissolution and diffusion of the copper cations in the electrolyte. Warburg impedance takes into consideration the diffusion process of the soluble copper compounds from the electrode surface into the solution bulk. The Nyquist impedance plot of the uncoated Cu substrate is characteristic for a dissolution process followed by the precipitation of a corrosion product thin film on the electrode surface.
The Nyquist diagram for the electrodes coated with heat-treated and as-deposited protective HEA thin film is modeled using approximately the same equivalent circuit shown in Figure 6a for Cu substrate. Moreover, the parameter values had a very good fit of the impedance diagrams and are significantly distinctive from those obtained for the uncoated Cu substrate. In this case, the first capacitive loop was assigned to the characteristics of the coating/electrolyte interface and is represented by the coating resistance and coating capacity. The second semicircle in the low frequency range is attributed to the coating/Cu substrate interface and to the processes taking place under the deposited film and it may be characterized by the charge transfer resistance and double-layer capacity, while also in the low frequency range it can be noticed that the coated electrodes exhibited a Warburg impedance, which can indicate the diffusion of soluble corrosion compounds.
From the analysis of the Nyquist diagrams, it can be noted that the impedance response of the coated electrode was significantly modified by the protective thin film deposition, which implies that the presence of the coating was highlighted. It can be seen that the diameter of the electrochemical impedance loop for the coating was greater than the one of the uncoated samples, which indicates a higher protective efficiency for the coated electrodes, especially for the heat-treated 3HT and the as-deposited 3 samples.
The corrosion behavior, the analysis of the corrosion mechanisms and the adsorption phenomena of the thin films deposited on the surface of the Cu substrate were studied by electrochemical impedance spectroscopy (EIS) in a synthetic sea water medium. The experimental EIS results show the electrochemical properties of the protective coating at the electrode–electrolyte interface.
After analyzing the EIS data, the equivalent electric circuit from Figure 6 was used. An equivalent Cu in synthetic seawater electrical circuit was proposed in order to match the impedance spectra of uncoated copper, as shown in Figure 6a. The component parameters were: electrolyte resistance Rs, phase element constant CPEf (CPE1) related to the corrosion film capacity, the corrosion film resistance Rf, phase element constant CPEp (CPE2) connected to the corrosion compounds and the double-layer capacity, the charge transfer resistance Rct and the Warburg impedance (W).
An equivalent circuit was suggested to match the impedance spectra of the electrodes on which the protective coatings were plated, as shown in Figure 6b, where Rs is the resistance of the solution, CPEc (CPE1) is the phase element constant related to the coating capacity, Rc represents the coating resistance, CPEct (CPE2) and the phase element constant represent all the frequencies during the electrochemical phenomena comprising the double-layer capacity, Rct represents the charge transfer resistance and W represents the Warburg impedance.
Thus, from the fitting and exploration of the EIS experimental data, an equivalent circuit model (Figure 6) was proposed in the studied frequency range.
In this case, the phase element constant CPE is introduced in the circuit instead of a regular double-layer capacitor (Cdl) in order to provide a more accurate match: Cdl = Y0max)n−1; CPE is used to describe the deformation of the capacitive semicircle corresponding to the heterogeneity of the electrode surface due to its roughness and the presence of impurities.
The CPE impedance can be defined as: ZCPE = Y0−1 (jω)–n, where ω is the angular frequency (ω = 2πf), j is an imaginary number (j2 = −1), Y0 is the amplitude compared to a capacitance and n is the phase change. The value of n provides details about the degree of in homogeneity of the metal surface. A higher value for n is associated with a lower surface roughness (reduced in homogeneity).
Depending on the value of n, the phase element constant may be taken into account as acting as a resistance when n = 0 and Y0 = R, as a capacitance when n = 1 and Y0 = C, as an inductance when n = −1 and Y0 = 1/L or as a Warburg impedance for n = 0.5 and Y0 = W.
It may be stated that the higher Rct values for the coatings are attributed to the high efficiency barrier effect, and the lower value of CPE for the films ensures a higher anticorrosive protection of the coated electrode, especially for the heat-treated 3HT and the as-deposited 3 samples studied in the corrosive environment of artificial seawater. It is obvious that a very good fit has been achieved with this equivalent circuit model. All experimental EIS data are in good agreement with those obtained by polarization experiments. Moreover, the best corrosion protection performance of the coated electrode in the artificial seawater solution was revealed by the higher Rct and lower Cdl values.
From the analysis of the EIS data, it can be concluded that some of the coated electrodes, both heat-treated and as-deposited (3HT, 3 and 2HT), exhibited a much better polarization behavior and provided excellent anticorrosive protection compared to other samples (heat-treated 1HT, as-deposited 1). Sample 1 demonstrated a mediocre behavior, which may suggest that during the corrosion process the protective film underwent more changes than the other samples and it can be said that the film was partially destroyed and the aggressive ions (Cl) penetrated and corroded the electrode surface.
The parameters obtained after assessing the equivalent circuit of the coated and uncoated electrodes are presented in Table 2.
The Bode diagrams (Figure 7) are consistent with the Nyquist diagram. It can be seen that a higher value at low frequency for the impedance modulus (Zmod) represents a better efficiency on corrosion of the surface protection, which was observed for the as-deposited and heat-treated electrodes. Both Nyquist and Bode diagrams suggest that the protective coatings formed on the surface of the HEA heat-treated and as-deposited electrodes halted the corrosion process, especially in the case of the 3HT, 3 and 2HTsamples. This behavior acted as a barrier through the charge transfer phenomenon.
We can conclude that EIS and potential polarization data are in good agreement.

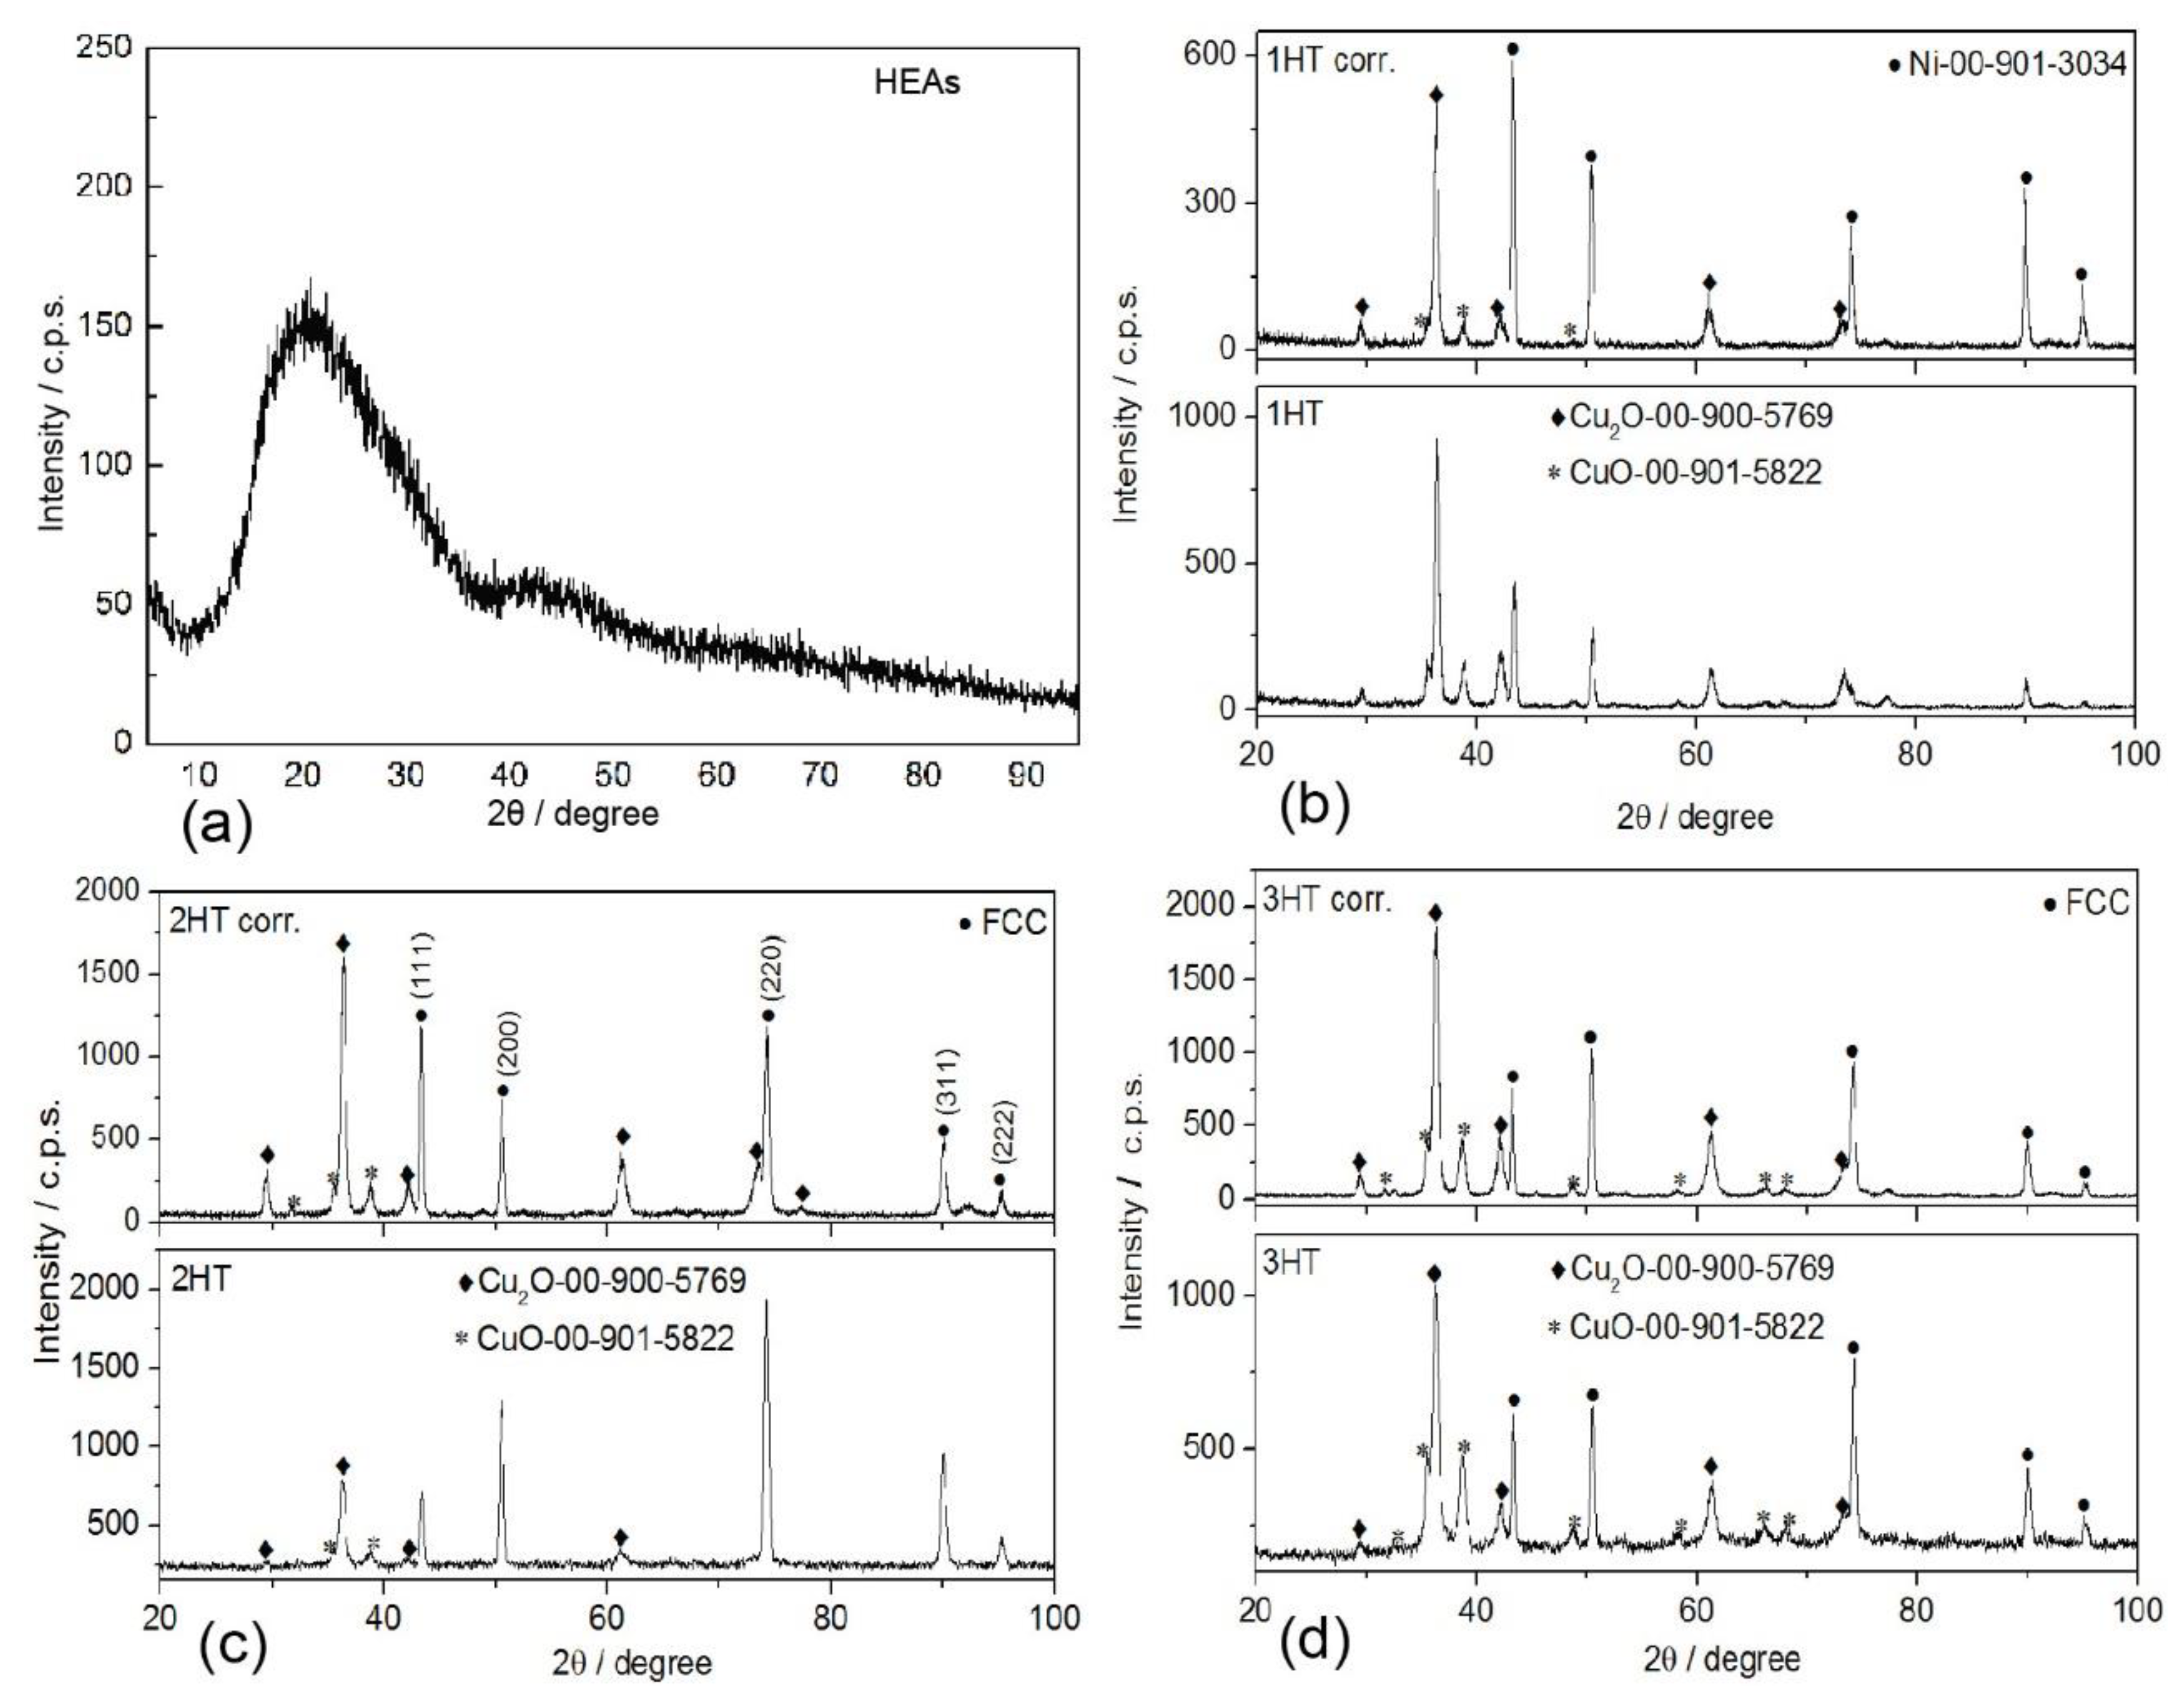
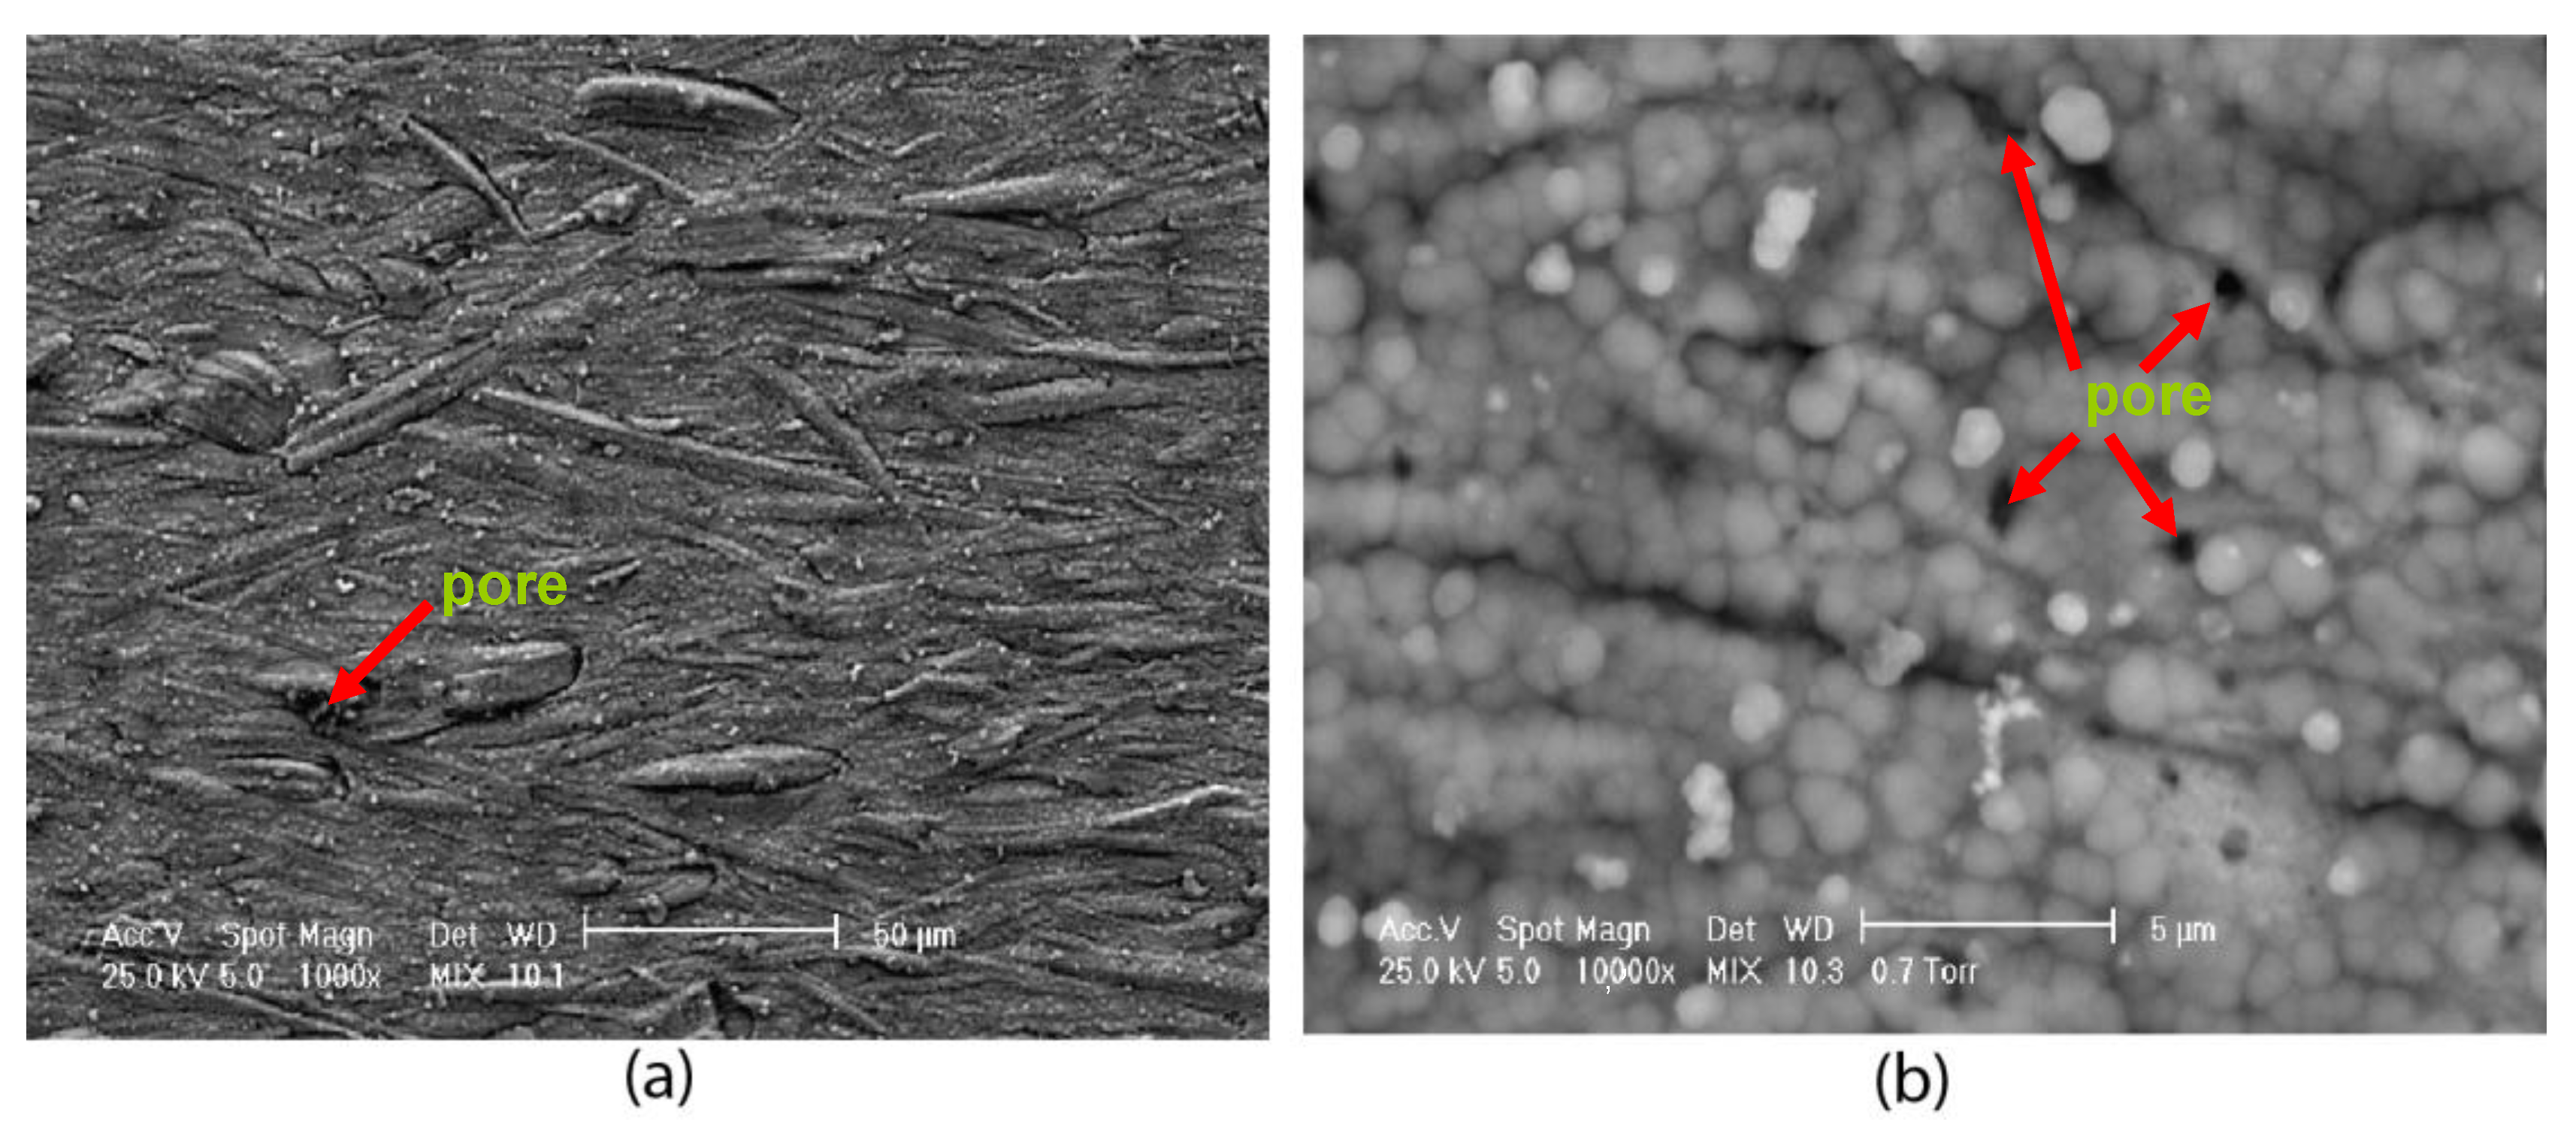
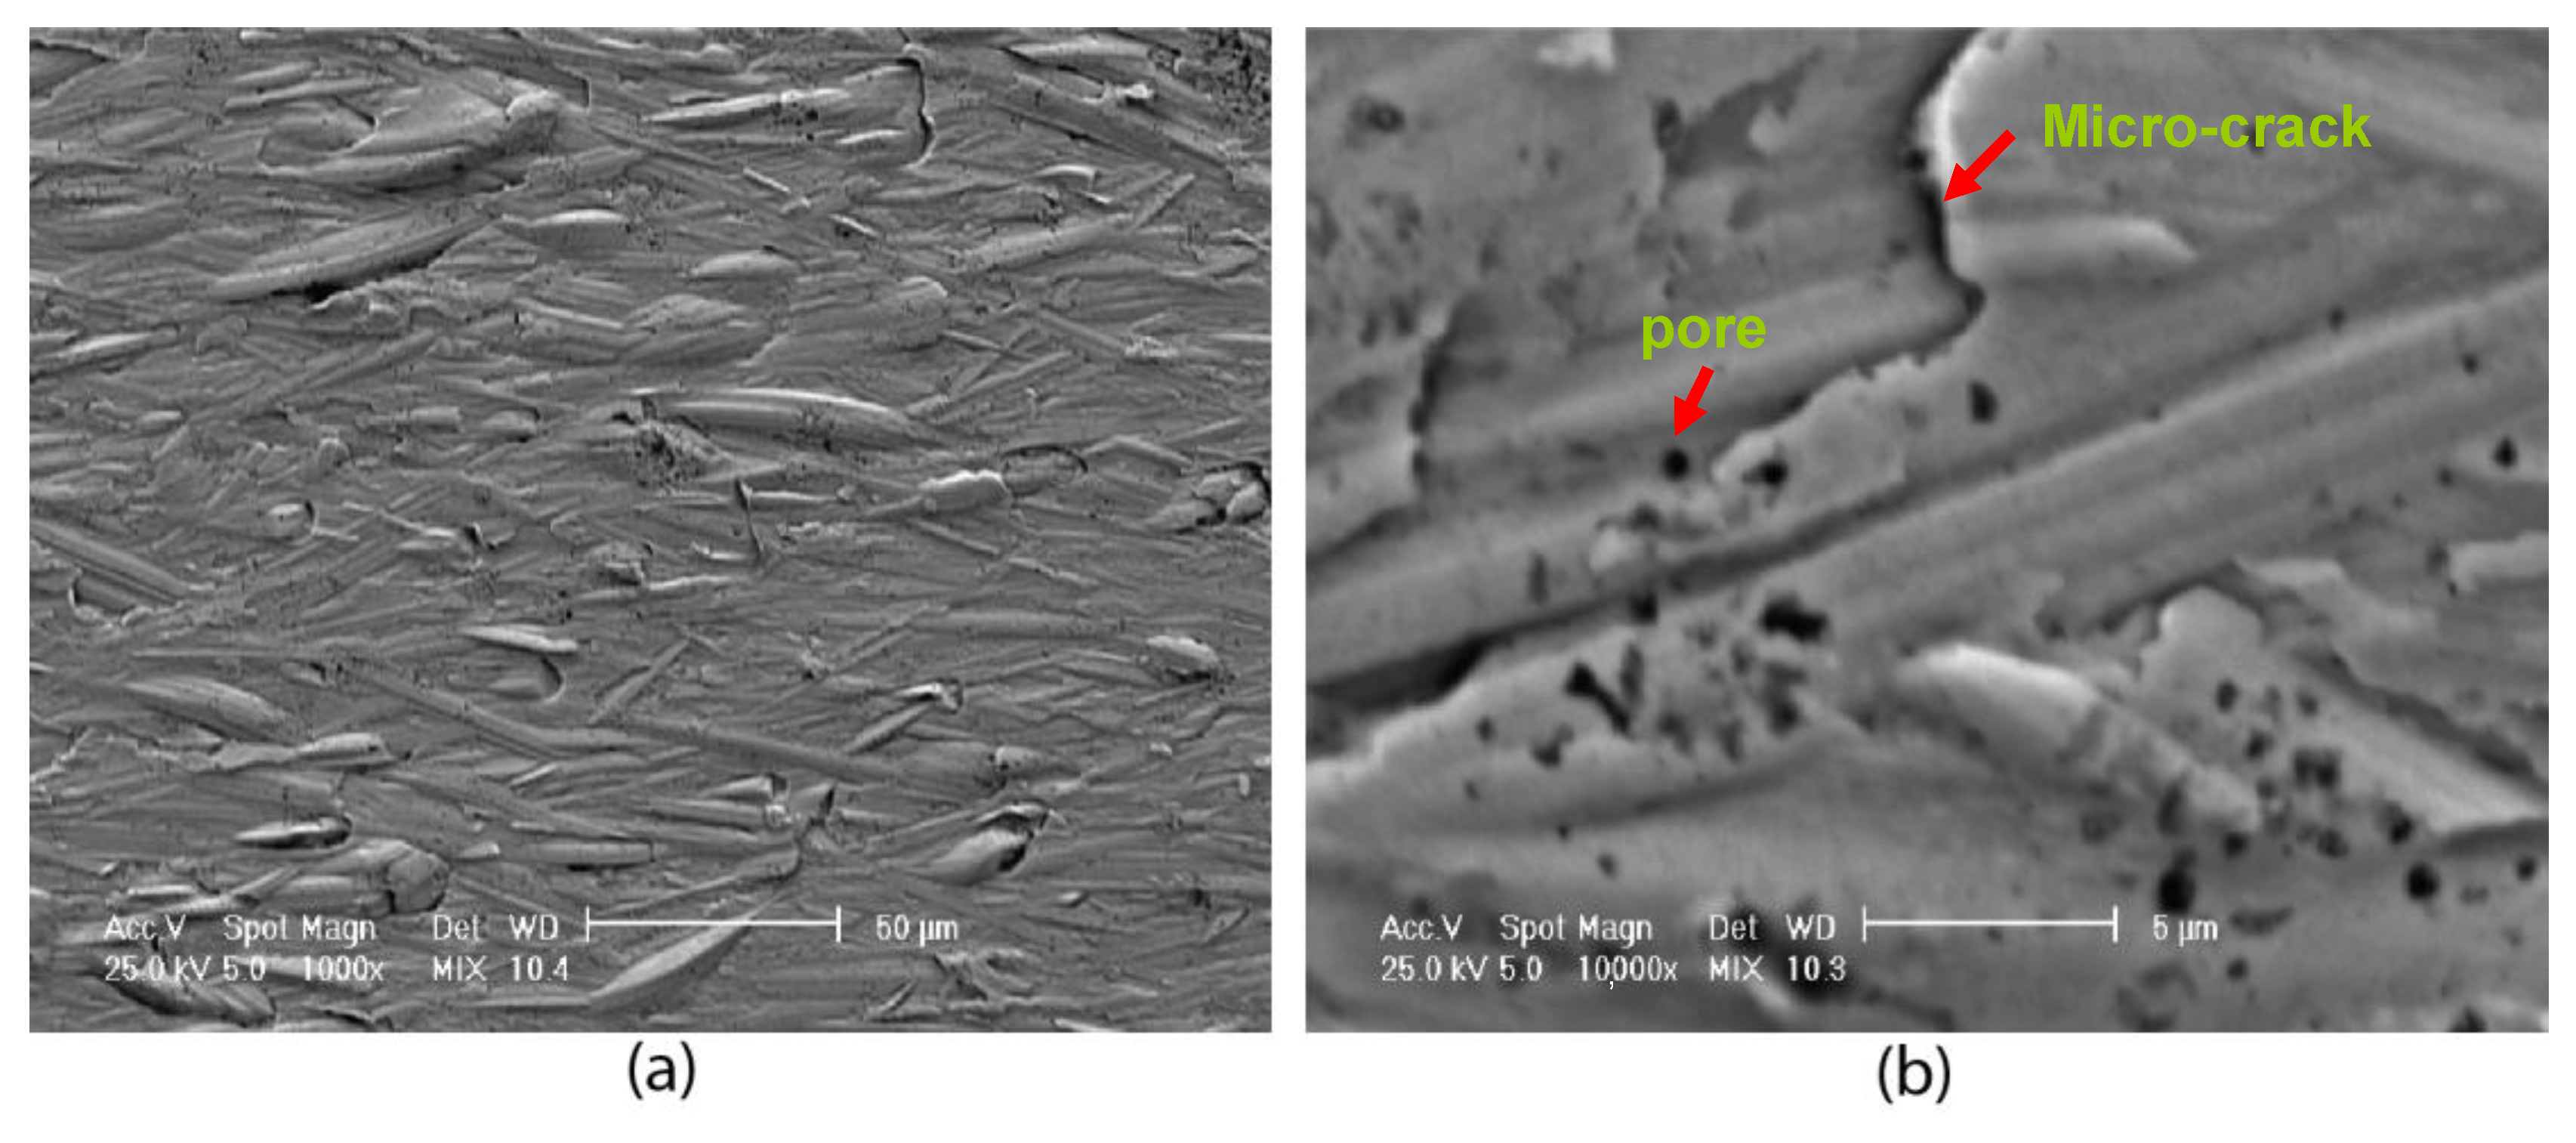
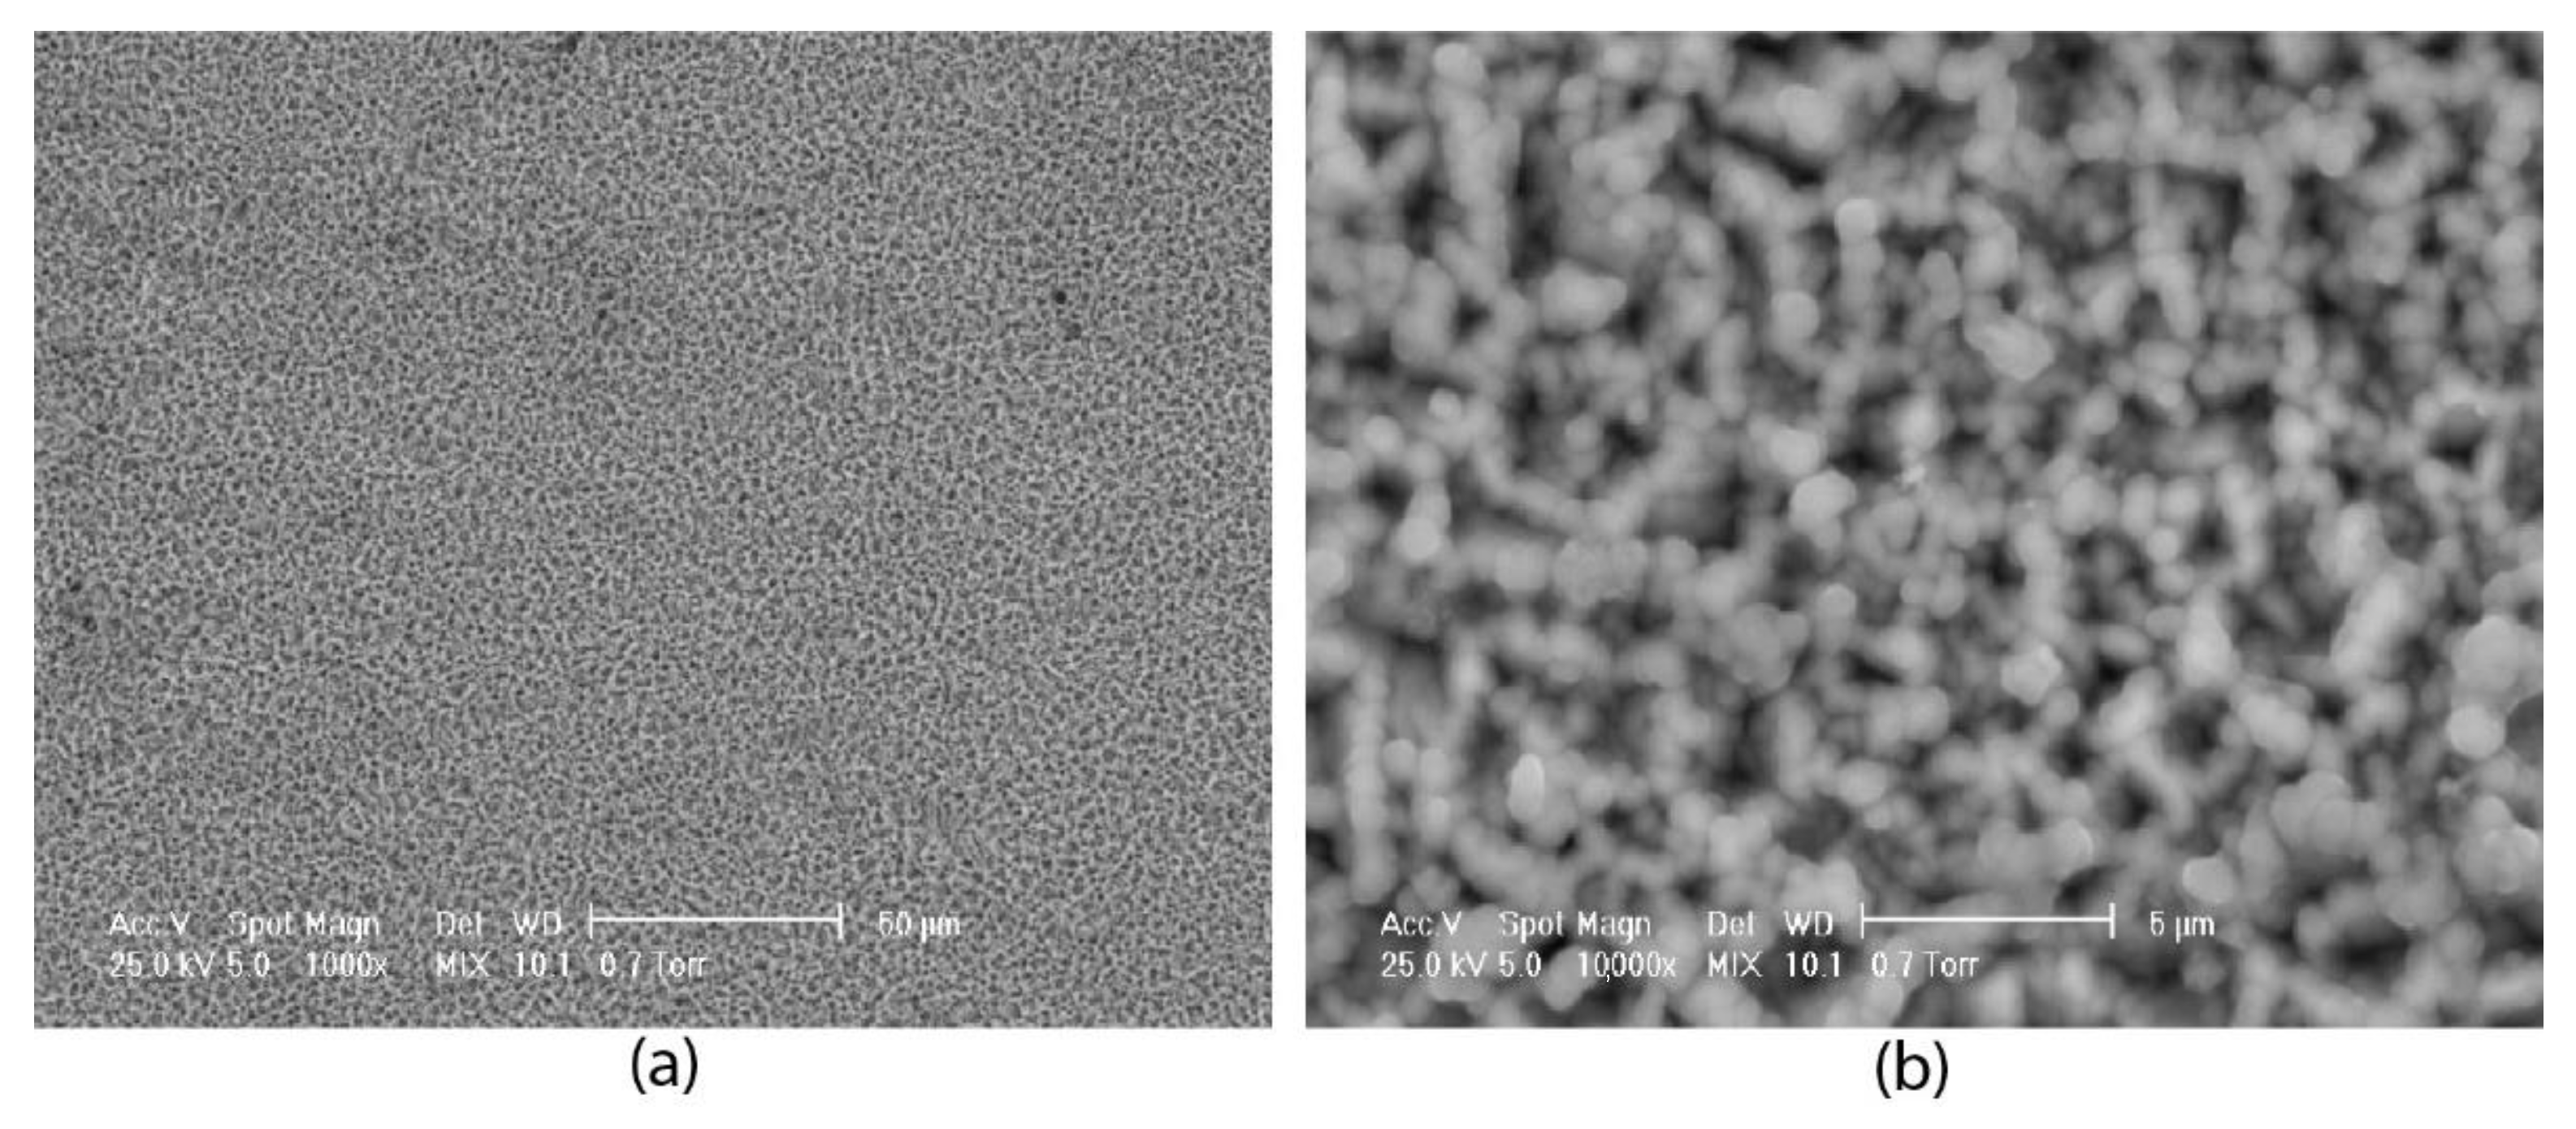
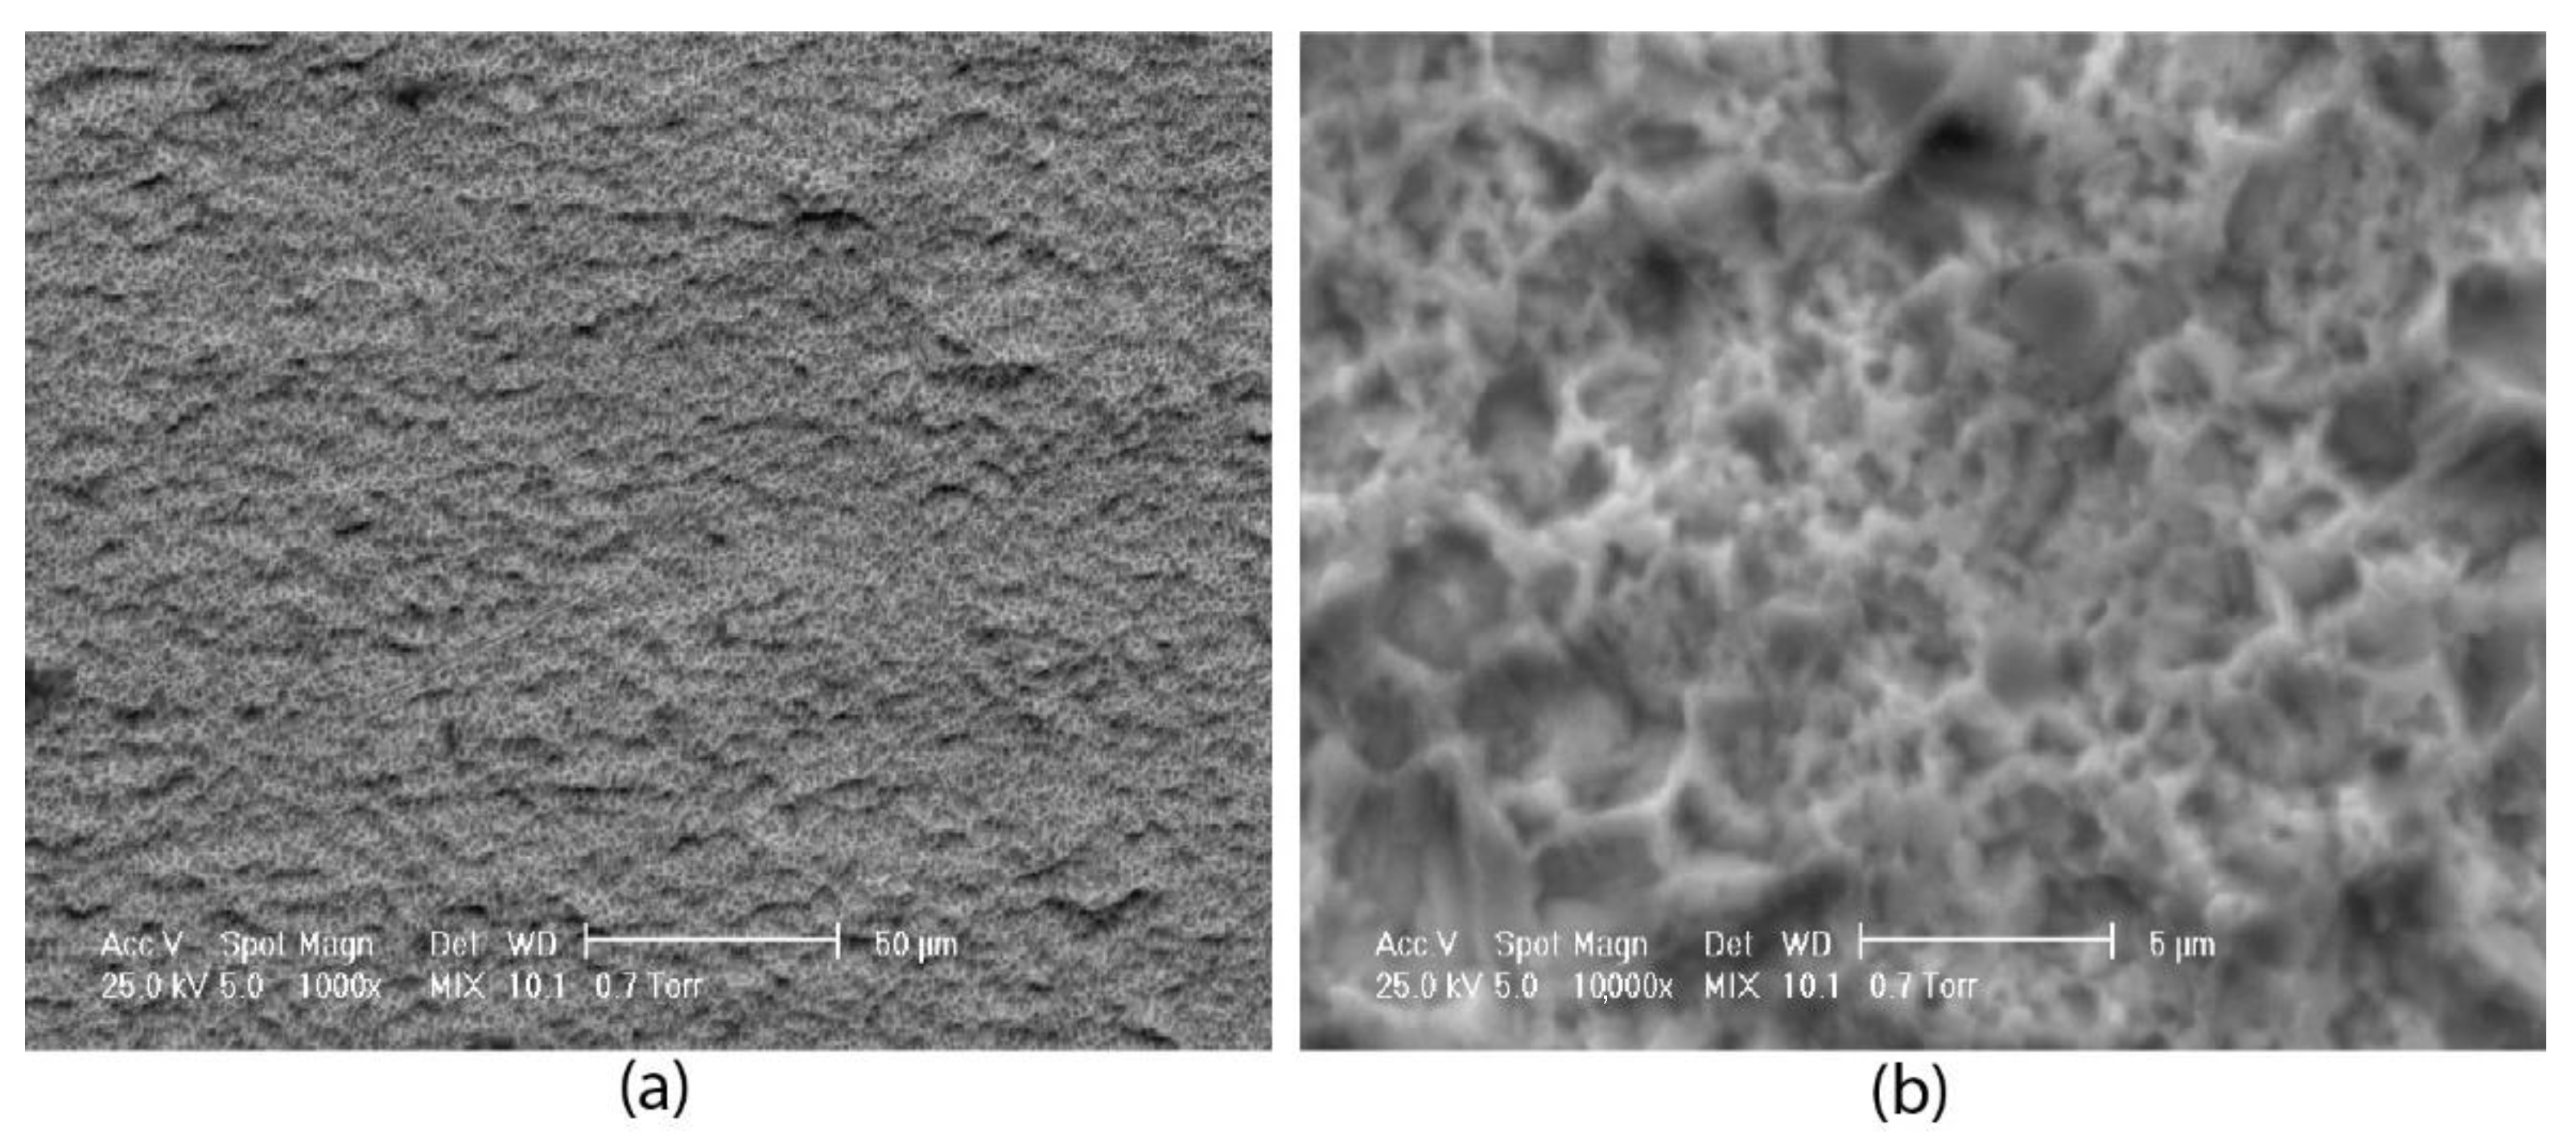
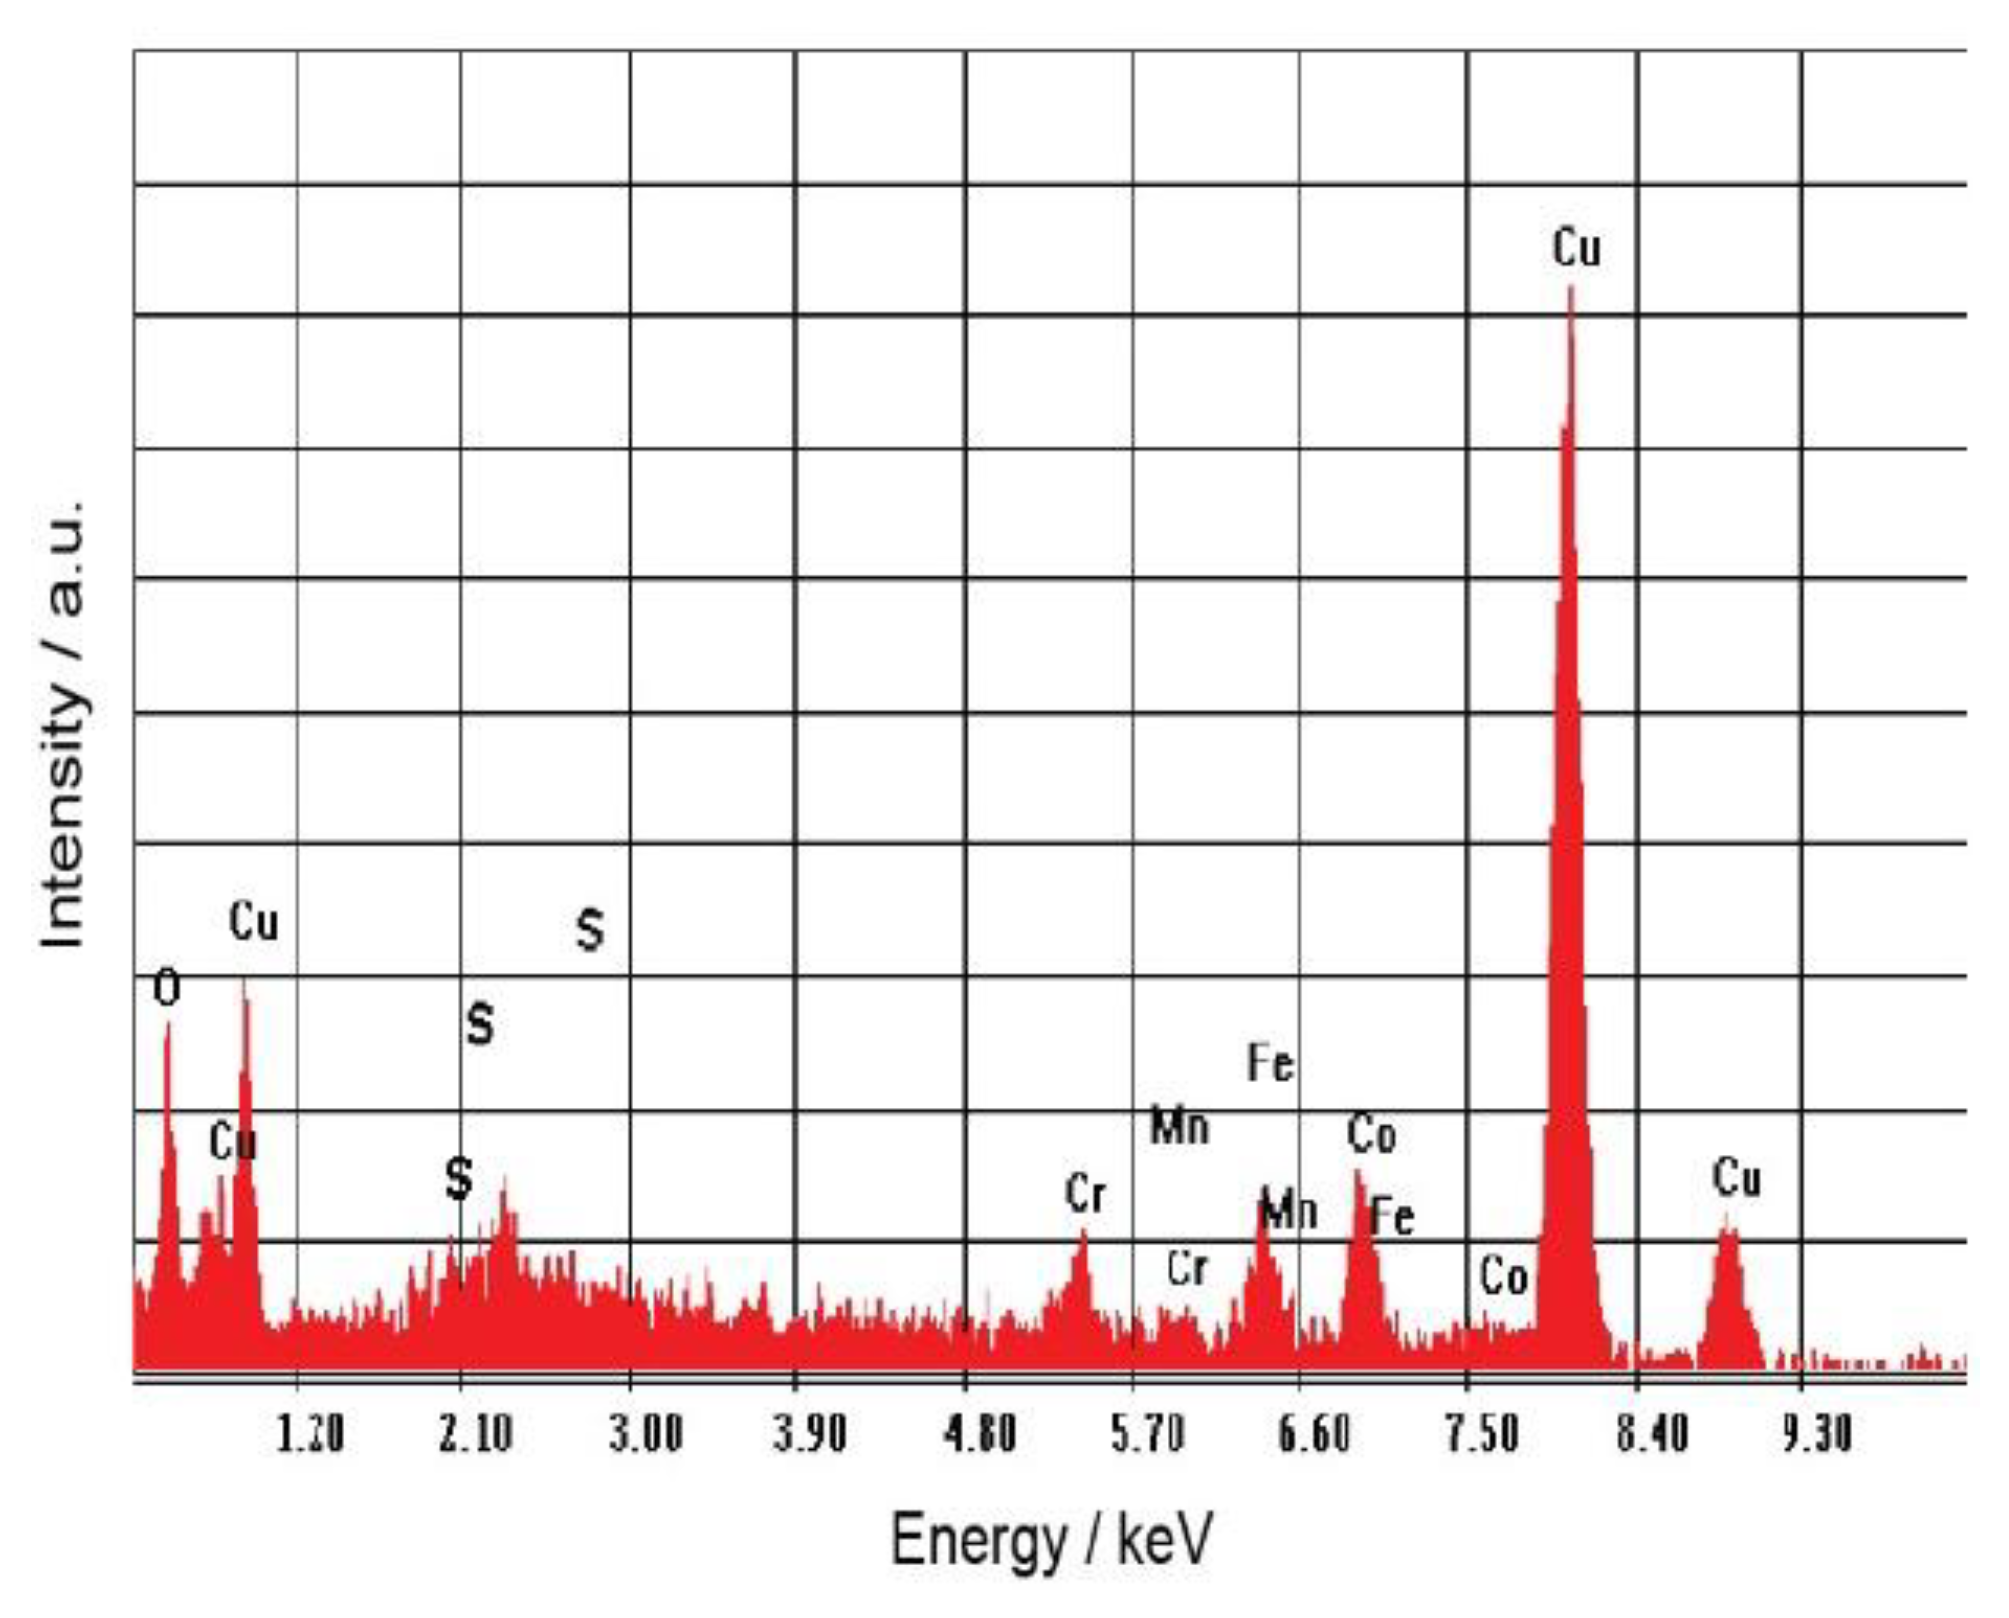
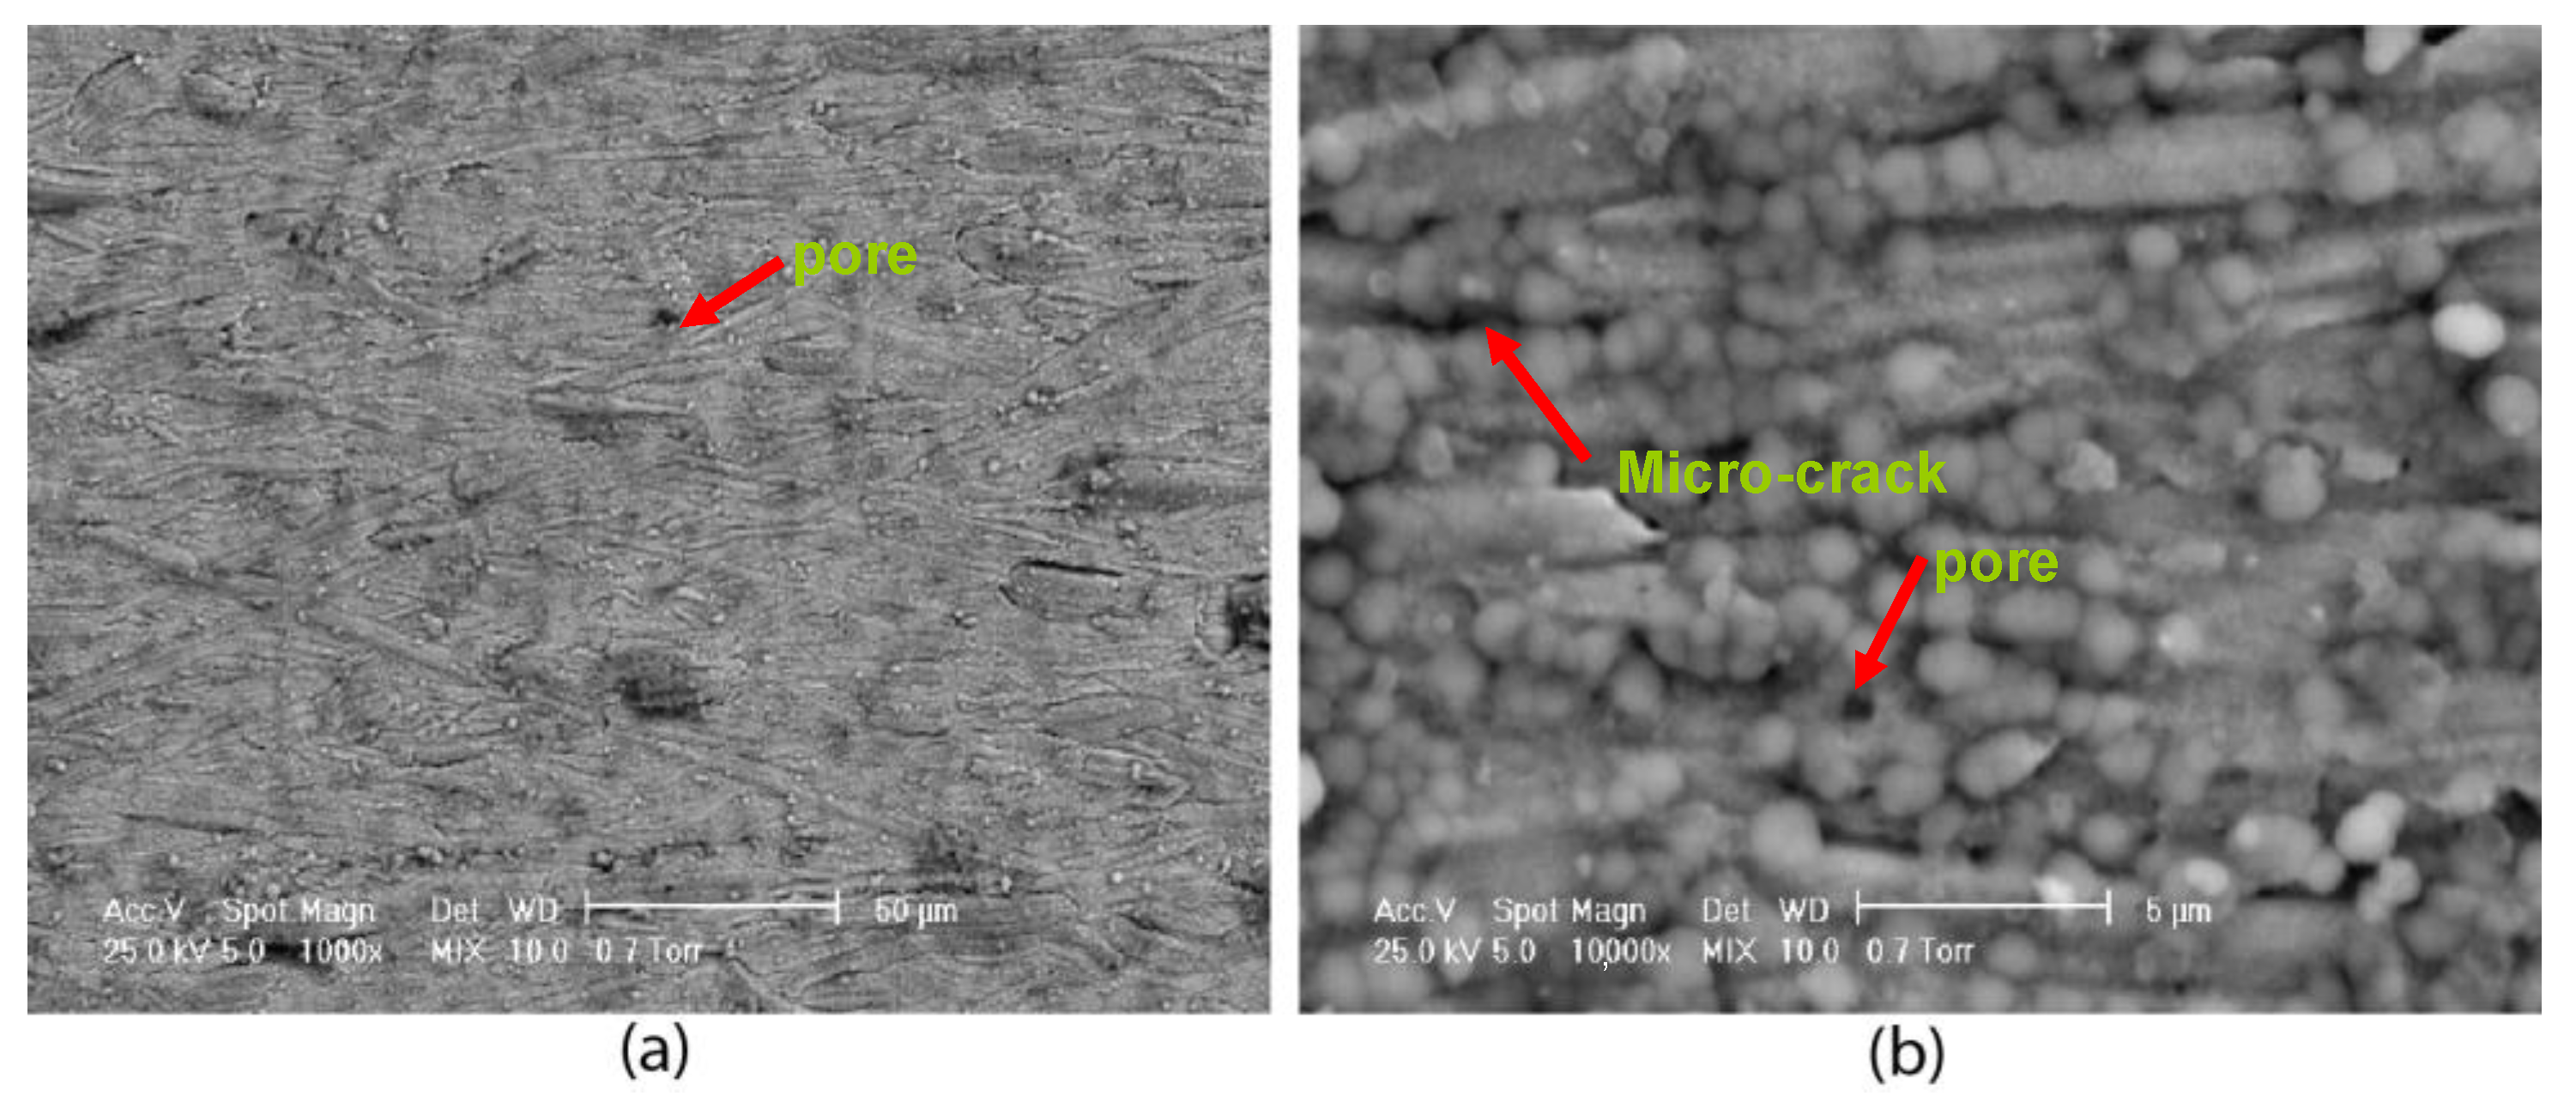
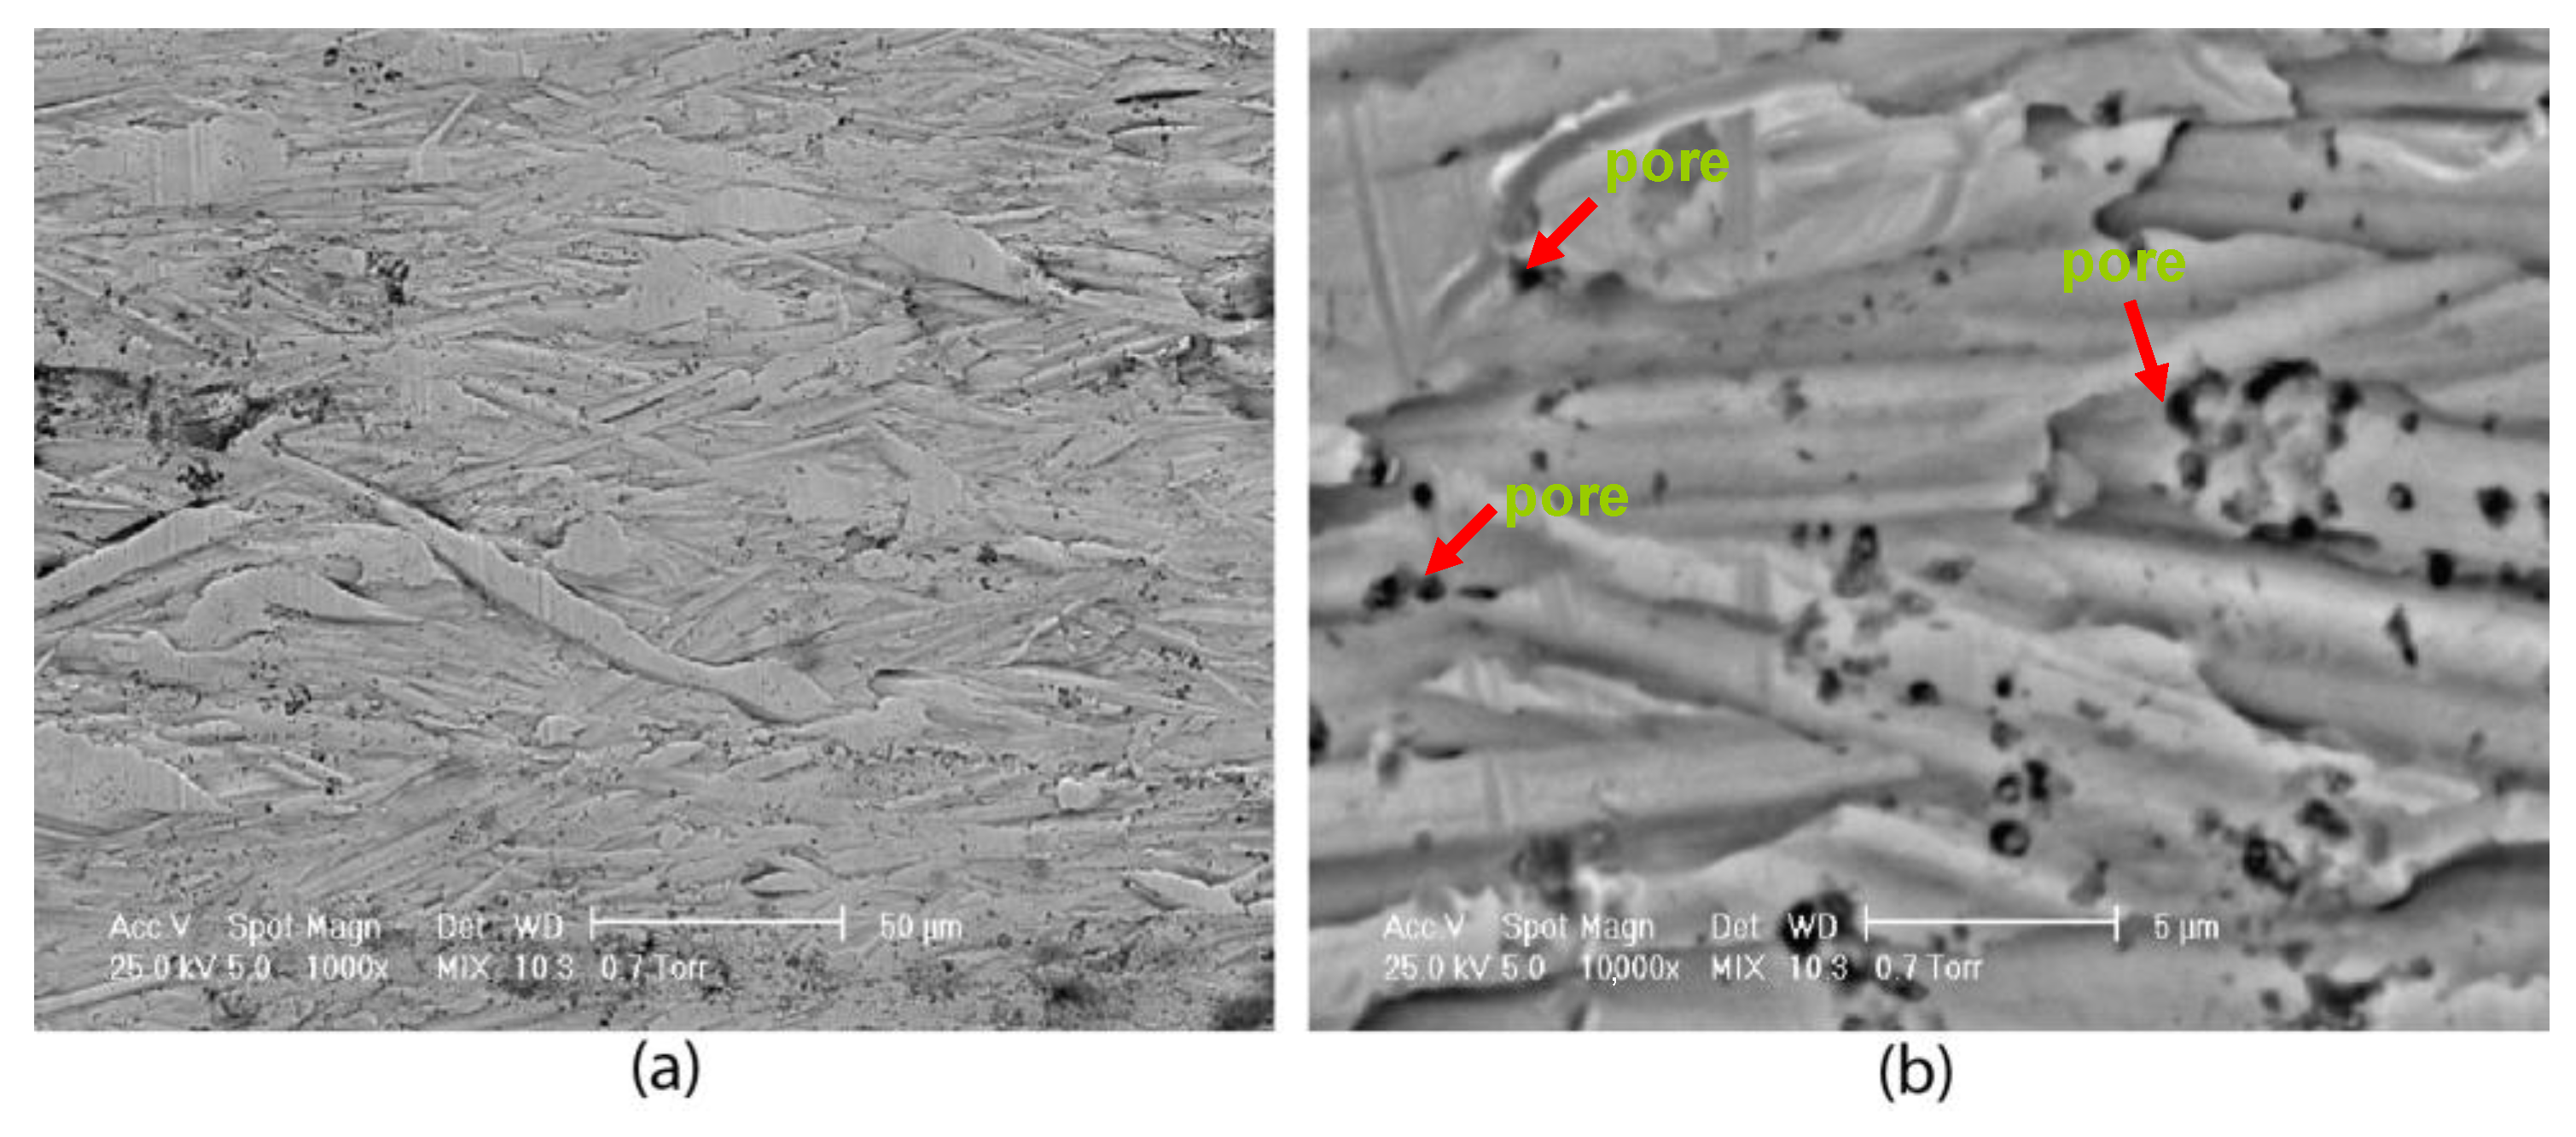
3.4. Microstructure of HEA Alloys

The structure of the HEA thin film was studied by XRD.
For the as-deposited CoCrFeMnNi HEA thin films the XRD data ascertained the amorphous nature (Figure 8a), which is typical for very thin films or nano films. So, we hoped to obtain better results on the heat-treated HEA thin films.
The result of the X-ray diffraction for the HEA heat-treated samples and after corrosion in artificial seawater medium (Figure 8b–d) shows that the obtained films have a polycrystalline structure.
The diffraction lines marked by the black circle at around 43.36°, 50.48°, 74.29°, 90.08°, and 95.18° can be indexed to (111), (200), (220), (311) and (222) planes of the face-centered cubic (FCC) structure. The diffraction lines corresponding to Cu2O (JCPDS card no. 00-900-5769) and CuO (JCPDS card no. 00-901-5822) arise from the substrate, suggesting that the thickness of the films is small.
An increase in the diffraction lines intensity was observed for the thermally treated films (Figure 8). According to the preferred orientation, the most preferred orientation of the FCC structure is the (1 1 1) plane, which is perpendicular to the substrate, and both (2 0 0) and (2 2 0) have weak intensity [38]. In the case of both films (Figure 8b), thermally treated (2HT) and corroded (2HT corr), the high intensity of the 220 reflections shows that both develop a preferred orientation in the {110} direction.
The calculated lattice parameters of FCC structured HEAs (CoCrFeMnNi) were 3.6126(5) (1HT), 3.6163(5) (1HT corr), 3.6127(6) (2HT), 3.6141(5) (2HT corr), 3.6144(6) (3HT), and 3.6167(5) (3HT corr), respectively.
A slight increase in lattice parameters of the FCC phase was observed as a consequence of the corrosion procedure for all the films.
The XRD data proved no significant changes in the structure of HEA heat-treated thin films after the corrosion in saline media.
The microscopic structure of the HEA samples, as-deposited and heat-treated, in the initial stage and after corrosion, was studied by SEM-EDS measurements. The SEM image of the cross-section of the thin films indicates that the thin films had a thickness of 1.457–1.996 μm at different points of the sample.
SEM images of the heat-treated CoCrFeMnNi thin film, sample 1, are presented in Figure 9. The deposited film consists of fiber-like structures, tens of microns long and several microns wide (Figure 9a). The surface of these fiber-like structures is covered with globular particles with a sub-micron diameter. After corrosion (Figure 10), the globular particles are not present, leaving only smooth surfaces of the fiber-shaped structures, with some local pores and micro-cracks (such as that marked with an arrow in Figure 10b). The EDS spectra (Figure 11) of the corroded film detects, besides the film elements Co, Cr, Fe, Mn and Cu from the substrate, an additional feature at 2.3 keV that correspond to S.
In “Supplementary Materials” (SM), we present the SEM and EDS of the CoCrFeMnNi thin-film HT. The study of the CoCrFeMnNi film sample 1HT by SEM, presented in SM, Figure S1, shows the formation of a uniform layer (Figure S1a) with a dendritic microstructure and as seen in the higher magnification image (SM, Figure S1b, marked with an arrow). After corrosion (SM, Figure S2), the film layer appears with macro-cracks, also delaminated in many areas. Parts of the film have come off the substrate surface, and there are also areas of bare substrate without film (SM, Figure S2a,b).
The EDS spectra (SM, Figure S3) of the thin films detect the alloy elements Mn, Fe, Co Ni, and Cu from the substrate on both samples before and after corrosion.
SEM images of the CoCrFeMnNi thin-film sample 2 (Figure 12) show an outer layer of submicron globular particles with significant gaps between particles (Figure 12b). After corrosion, the SEM images (Figure 13) show that the shapes in the outer layer have sharpened significantly, leaving a uniform outer layer of thin walls, replacing the globular shapes of the original film.
The EDS spectra (Figure 14) of the corroded sample 2 detect Cu from the substrate, the film elements Co, Cr, Fe, and Mn, and the additional S peak.
The SEM images of the CoCrFeMnNi thin film, sample 2HT (SM, Figure S4), also show fiber-like structures, tens of microns long and several microns wide. Aggregates of globular particles can be observed that fill the gaps between the fiber-shaped structures, and some individual particles scattered along the surface of the fibers. After corrosion, there are areas of the film coming off from the substrate surface (Figure S5a), and bare substrate areas without film, marked with an arrow in SM, Figure S5a and shown in more detail in SM, Figure S5b. The EDS spectra (SM, Figure S6) of the films detect the following elements from the substrate: Co, Fe, Mn, Ni, and Cu. After corrosion, the presence of S, Na and Cl is also detected.
Figure 15 shows SEM images of the heat-treated CoCrFeMnNi thin film, sample 3. The deposited film consists of fiber-like structures, tens of microns long and several microns wide (Figure 15a). The surface of these fiber-like structures is only partially covered with globular particles with a sub-micron diameter and also appears in some pores (Figure 15b).
After corrosion, the SEM images (Figure 16) shows bare surfaces of the fiber-shaped structures and pores, such as those marked with an arrow in Figure 16b, without globular particles. The EDS spectra (Figure 17) of the corroded film detect the presence of S besides the film elements Co, Cr, Fe, Mn and Cu from the substrate.
The film Co0.12Cr0.55Fe0.11Mn0.1Ni0.12, sample 3HT presents cracks associated to areas where the film appears lifted (SM, Figure S7). The film consists of closely packed globular particles (SM, Figure S7b). After corrosion, the film is not present in many areas (SM, Figure S8). The EDS spectra (SM, Figure S9) of the film detects only the film elements Co, Fe, Mn, Ni, and Cu from the substrate.
We can conclude that films 1 and 2 and have a tendency toward local delamination, leaving the bare substrate exposed. On the other hand, the thermally treated films (1HT, 2HT, 3HT) tend to be uniformly corroded along all the film surface, compared to the as-deposited films. We believe this effect can be explained by the relaxation of stresses between the as-deposited films and the substrate in thermally treated samples.
Good agreement was found between data from SEM-EDS and potential polarization and EIS study.

4. Conclusions

Using potentiostatic electro-deposition at various potentials in the DMF-CH3CN organic system with LiClO4 additive, we obtain the CoCrFeMnNi HEA thin films on copper support.
The HEA thin films were obtained as-deposited and then were subjected to heat treatment. For both of the samples, the analysis of structural and corrosion behavior in artificial seawater was conducted.
CALPHAD software was used to make a simulation of alloy obtaining and to compare results with an experimental one. A structure composed mainly of solid solutions of FCC and BCC types was obtained after simulation. The results of the thermodynamic and kinetic criteria determination provided information about the structure of the alloy and the influence of the constituent elements.
The equimolar alloy with soft phases (FCC) has a percentage higher than 60%, leading to the obtaining of a material with lower toughness. The simulation indicated the melting temperature of the alloy at 1400 °C.
The results of the corrosion polarization curve in artificial seawater show that the as-deposited HEA thin films have good corrosion resistance and the coating after annealing treatment has even better corrosion resistance. Sample 1, as-deposited at 20 °C, and HT demonstrated a mediocre behavior, which may suggest that during the corrosion process the protective film underwent more changes than the other samples, and it can be said that the film was partially destroyed. The best corrosion rate was obtained for the as-deposited sample 3 equimolar (85%) and heat-treated thin films, 2HT and 3HT (83%; 89%). The impedance tests proved the same good corrosion resistance. So, we can conclude that the best deposition temperature was 25 °C and that HT has a positive effect on these HEA thin films.
XRD data show that corrosion in artificial seawater does not significantly change the structure of the heat-treated HEA thin films. A slight increase in lattice parameters of the FCC phase was observed as a consequence of the corrosion procedure for all the films.
HEA thin films, as-deposited, consist of two types of particles (fiber-like and globular), while the heat-treated films consist of three types (dendritic, fiber-like and globular), as revealed by SEM surface analysis. The het-treated HEA thin films exhibit better growth and more homogeneous distribution of the particles compared with the as-deposited samples.
The EDS data proved the presence of all elements in the HEA thin films. The samples 2HT and 3HT showed better SEM and EDS results, proving the positive result of the heat treatment on these samples.
The influence of heat treatment on the HEA thin films deposited on copper electrode was analyzed during immersion in artificial seawater. It was proved that the HEA thin-film amorphous alloy coating can be used in high-temperature and aggressive environments. The HEA film, heat-treated, had a corrosion efficiency of 74–89%, which proved a good level of protection of the copper electrode during immersion in artificial seawater. However, the imperfections present in the film structure could influence the corrosion behavior for long-term corrosion in aggressive artificial seawater, and so the HEA anti-corrosion protection could change over time. The suitable usage to form surface protection layers by these HEA coatings is proven by this study. So, this study suggests that thermal annealing is an appropriate method for improving the corrosion performance of HEA thin films. This conclusion is subject to long-term corrosion studies on as-deposited and heat-treated HEA thin films, using also AFM and XPS experiments.

Supplementary Materials

The following supporting information can be downloaded at: https://www.mdpi.com/article/10.3390/coatings12081108/s1, Figure S1: SEM morphology of the equimolar film CoCrFeMnNi electrodeposited and heat treated, sample 1HT: (a) ×1000; (b) ×10,000, Figure S2: SEM morphology of the equimolar film CoCrFeMnNi sample 1HT corroded in artificial seawater: (a) ×1000; (b) ×10,000, Figure S3: EDS spectra for the CoCrFeMnNi alloy, sample 1HT, in the initial stage(a) and after corrosion (b), Figure S4: SEM morphology of the Co0.12Cr0.55Fe0.11Mn0.1Ni0.12CoCrFeMnNi film, sample 2HT: (a) ×1000; (b) ×5000, Figure S5: SEM morphology of the Co0.12Cr0.55Fe0.11Mn0.1Ni0.12 film, sample 2HT(corroded): (a) ×1000; (b) ×10,000, Figure S6: EDS spectra for of the Co0.12Cr0.55Fe0.11Mn0.1Ni0.12 film, sample 2HT, in the initial stage (a) and after corrosion (b), Figure S7: SEM morphology of the equimolar CoCrFeMnNi thin film, sample 3: (a) ×1000; (b) ×10,000, Figure S8: SEM morphology of the equimolar CoCrFeMnNi thin film, sample 3 (corroded): (a) ×1000; (b) ×10,000, Figure S9: EDS spectra for the equimolar CoCrFeMnNi thin film, sample 3 in the initial stage(a) and after corrosion (b).

Author Contributions

Conceptualization, A.-M.J.P.; methodology, F.B. and I.A.; electrodeposition, M.B. and I.-C.B.; software, M.T.O. and D.M.; validation, M.B. and D.M.; formal analysis, F.B. and V.C.; investigation, F.B., I.A., J.C.M. and F.M.; resources, A.-M.J.P., writing—original draft preparation, A.-M.J.P., F.B. and I.C.; writing—review and editing, A.-M.J.P. and V.C.; visualization, F.B.; supervision, V.C. and I.C.; project administration, A.-M.J.P. and M.B.; funding acquisition, A.-M.J.P. and M.B. All authors have read and agreed to the published version of the manuscript.

Funding

This research was funded by Romanian Executive Agency for Higher Education, Research Development and Innovation Founding (UEFISCDI), project HEASYNTCORR/PN-III-P2-2.1-PED-2019-0022, contract 330PED/2020.

Institutional Review Board Statement

Not applicable.

Informed Consent Statement

Not applicable.

Data Availability Statement

Not applicable.

Conflicts of Interest

The authors declare no conflict of interest.

References

  1. Srivatsan, T.S.; Gupta, M. High Entropy Alloys Innovations, Advances, and Applications; CRC Press Taylor & Francis Group: Boca Raton, FL, USA, 2020. [Google Scholar]
  2. Gao, M.C.; Yeh, J.W.; Liaw, P.K.; Zhang, Y. High-Entropy Alloys Fundamentals and Applications; Springer International Publishing: Cham, Switzerland, 2016. [Google Scholar]
  3. Murty, B.S.; Yeh, J.W.; Ranganathan, S. High-Entropy Alloys; Butterworth-Heinemann: London, UK, 2014. [Google Scholar]
  4. Zhang, Y.; Zuo, T.T.; Tang, Z.; Gao, M.C.; Dahmen, K.A.; Liaw, P.K.; Lu, Z.P. Microstructures and properties of high-entropy alloys. Prog. Mater. Sci. 2014, 61, 1–93. [Google Scholar] [CrossRef]
  5. Kao, Y.-F.; Chen, S.-K.; Chen, T.-J.; Chu, P.-C.; Yeh, J.-W.; Lin, S.-J. Electrical, magnetic, and Hall properties of AlxCoCrFeNi high-entropy alloys. J. Alloys Compd. 2011, 509, 1607–1614. [Google Scholar] [CrossRef]
  6. Tsai, M.-H.; Yuan, H.; Cheng, G.; Xu, W.; Jian, W.W.; Chuang, M.-H.; Juan, C.-C.; Yeh, A.-C.; Lin, S.-J.; Zhu, Y. Significant hardening due to the formation of a sigma phase matrix in a high entropy alloy. Intermetallics 2013, 33, 81–86. [Google Scholar] [CrossRef]
  7. Senkov, O.N.; Wilks, G.B.; Scott, J.M.; Miracle, D.B. Mechanical properties of Nb25Mo25Ta25W25 and V20Nb20Mo20Ta20W20 refractory high entropy alloys. Intermetallics 2011, 19, 698–706. [Google Scholar] [CrossRef]
  8. Tang, Z.; Huang, L.; He, W.; Liaw, P.K. Alloying and processing effects on the aqueous corrosion behavior of high-entropy alloys. Entropy 2014, 16, 895–911. [Google Scholar] [CrossRef]
  9. Miracle, D.B.; Senkov, O.N. A critical review of high entropy alloys and related concepts. Acta Mater. 2017, 122, 448–511. [Google Scholar] [CrossRef] [Green Version]
  10. Maiti, S.; Steurer, W. Structural-disorder and its effect on mechanical properties in single-phase TaNbHfZr high-entropy alloy. Acta Mater. 2016, 106, 87–97. [Google Scholar] [CrossRef]
  11. He, J.Y.; Liu, W.H.; Wang, H.; Wu, Y.; Liu, X.J.; Nieh, T.G.; Lu, Z.P. Effects of Al addition on structural evolution and tensile properties of the FeCoNiCrMn high-entropy alloy system. Acta Mater. 2014, 62, 105–113. [Google Scholar] [CrossRef]
  12. Yao, M.J.; Pradeep, K.G.; Tasan, C.C.; Raabe, D. A novel, single phase, non-equiatomicFeMnNiCoCr high-entropy alloy with exceptional phase stability and tensile ductility. Scripta Mater. 2014, 72–73, 5–8. [Google Scholar] [CrossRef]
  13. Gómez-Esparza, C.; Ochoa-Gamboa, R.; Estrada-Guel, I.; Cabañas-Moreno, J.; Barajas-Villarruel, J.; Arizmendi-Morquecho, A.; Herrera-Ramírez, J.; Martínez-Sánchez, R. Microstructure of NiCoAlFeCuCr multi-component systems synthesized by mechanical alloying. J. Alloys Compd. 2011, 509, S279–S283. [Google Scholar] [CrossRef]
  14. Kao, S.-W.; Yeh, J.-W.; Chin, T.-S. Rapidly solidified structure of alloys with up to eight equal-molar elements—a simulation by molecular dynamics. J. Phys. Condens. Matter 2008, 20, 145214. [Google Scholar] [CrossRef]
  15. Wu, Z.; Wang, X.; Cao, Q.; Zhao, G.; Li, J.; Zhang, D.; Zhu, J.-J.; Jiang, J. Microstructure characterization of AlxCo1Cr1Cu1Fe1Ni1 (x = 0 and 2.5) high-entropy alloy films. J. Alloys Compd. 2014, 609, 137–142. [Google Scholar] [CrossRef]
  16. Zhang, H.; Pan, Y.; He, Y.-Z. Synthesis and characterization of FeCoNiCrCu high-entropy alloy coating by laser cladding. Mater. Des. 2011, 32, 1910–1915. [Google Scholar] [CrossRef]
  17. Xie, L.; Brault, P.; Thomann, A.-L.; Bauchire, J.-M. AlCoCrCuFeNi high entropy alloy cluster growth and annealing on silicon: A classical molecular dynamics simulation study. Appl. Surf. Sci. 2013, 285, 810–816. [Google Scholar] [CrossRef] [Green Version]
  18. Tang, W.Y.; Yeh, J.W. Effect of Aluminum Content on Plasma-Nitrided AlxCoCrCuFeNi High-Entropy Alloys. Metall. Mater. Trans. A 2009, 40, 1479–1486. [Google Scholar] [CrossRef]
  19. Simka, W.; Puszczyk, D.; Nawrat, G. Electrodeposition of metals from non-aqueous solutions. Electrochim. Acta 2009, 54, 5307–5319. [Google Scholar] [CrossRef]
  20. Wang, S.; Guo, X.; Yang, H.; Dai, J.; Zhu, R.; Gong, J.; Peng, L.; Ding, W. Electrodeposition mechanism and characterization of Ni–Cu alloy coatings from a eutectic-based ionic liquid. Appl. Surf. Sci. 2014, 288, 530–536. [Google Scholar] [CrossRef]
  21. Abbott, A.P.; McKenzie, K.J. Application of ionic liquids to the electrodeposition of metals. Phys. Chem. Chem. Phys. 2006, 8, 4265–4279. [Google Scholar] [CrossRef] [PubMed]
  22. Li, H.; Sun, H.; Wang, C.; Wei, B.; Yao, C.; Tong, Y.X.; Ma, H. Controllable electrochemical synthesis and magnetic behaviors of Mg-Mn-Fe-Co-Ni-Gd alloy films. J. Alloys Compd. 2014, 598, 161–165. [Google Scholar] [CrossRef]
  23. Yao, C.; Wei, B.; Zhang, P.; Lu, X.; Liu, P.; Tong, Y. Facile preparation and magnetic study of amorphous Tm-Fe-Co-Ni-Mn multicomponent alloy nanofilm. J. Rare Earths 2011, 29, 133–137. [Google Scholar] [CrossRef]
  24. Yao, C.; Zhang, P.; Tong, Y.X.; Xia, D.; Ma, H. Electrochemical synthesis and magnetic studies of Ni-Fe-Co-Mn-Bi-Tm high entropy alloy film. Chem. Res. Chin. Univ. 2010, 26, 640–644. [Google Scholar]
  25. Yao, C.; Zhang, P.; Liu, M.; Li, G.R.; Yea, J.Q.; Liu, P.; Tong, Y.X. Electrochemical preparation and magnetic study of Bi-Fe-Co-Ni-Mn high entropy alloy. Electrochim. Acta 2008, 53, 8359–8365. [Google Scholar] [CrossRef]
  26. Pavithra, C.L.P.; Janardhana, R.K.S.K.; Reddy, K.M.; Murapaka, C.; Joardar, J.; Sarada, B.V.; Tamboli, R.R.; Hu, Y.; Zhang, Y.; Wang, X.; et al. An advancement in the synthesis of unique soft magnetic CoCuFeNiZn high entropy alloy thin films. Sci. Rep. 2021, 11, 8836. [Google Scholar] [CrossRef] [PubMed]
  27. Yoosefan, F.; Ashrafi, A.; Vaghefi, S.M.M.; Constantin, I. Synthesis of CoCrFeMnNi High Entropy Alloy Thin Films by Pulse Electrodeposition: Part 1: Effect of Pulse Electrodeposition Parameters. Met. Mater. Int. 2019, 26, 1262–1269. [Google Scholar] [CrossRef]
  28. Soare, V.; Burada, M.; Constantin, I.; Mitrică, D.; Bădiliţă, V.; Caragea, A.; Târcolea, M. Electrochemical deposition and microstructural characterization of AlCrFeMnNi and AlCrCuFeMnNi high entropy alloy thin films. Appl. Surf. Sci. 2015, 358, 533–539. [Google Scholar] [CrossRef]
  29. Popescu, A.-M.J.; Branzoi, F.; Constantin, I.; Anastasescu, M.; Burada, M.; Mitrică, D.; Anasiei, I.; Olaru, M.-T.; Constantin, V. Electrodeposition, Characterization, and Corrosion Behavior of CoCrFeMnNi High-Entropy Alloy Thin Films. Coatings 2021, 11, 1367. [Google Scholar] [CrossRef]
  30. Yoosefan, F.; Ashrafi, A.; Monir Vanghefi, S.M. Microstructure and Corrosion Properties of Electrodeposited CoCrFeMnNi High Entropy Alloy Coatings. Front. Mater. 2022, 9, 891011. [Google Scholar] [CrossRef]
  31. Kemény, D.M.; Pálfi, N.M.; Fazakas, E. Examination of microstructure and corrosion properties of novel AlCoCrFeNi multicomponent alloy. Mater. Today: Proc. 2021, 45, 4250–4253. [Google Scholar] [CrossRef]
  32. Guoa, W.; Lia, J.; Qia, M.; Ezatpourb, H.R. Effects of heat treatment on the microstructure, wear behavior and corrosion resistance of AlCoCrFeNiSi high-entropy alloy. Intermetallics 2021, 138, 107324. [Google Scholar] [CrossRef]
  33. Zhao, B.; Zhu, M.; Yuan, Y.; Guo, S.; Yin, S. Comparison of corrosion resistance of CoCrFeMnNi high entropy alloys with pipeline steels in an artificial alkaline soil solution. JCSCP 2022, 42, 425–434. [Google Scholar]
  34. Troparevsky, M.C.; Morris, J.; Kent, P.R.C.; Lupini, A.; Stocks, G.M. Criteria for Predicting the Formation of Single-Phase High-Entropy Alloys. Phys. Rev. X 2015, 5, 011041. [Google Scholar] [CrossRef] [Green Version]
  35. Takeuchi, A.; Inoue, A. Calculations of Mixing Enthalpy and Mismatch Entropy for Ternary Amorphous Alloys. Mater. Trans. JIM 2000, 41, 1372–1378. [Google Scholar] [CrossRef] [Green Version]
  36. Zhang, Y.; Zhou, Y.J.; Lin, J.P.; Chen, G.L.; Liaw, P.K. Solid-Solution Phase Formation Rules for Multi-component Alloys. Adv. Eng. Mater. 2008, 10, 534–538. [Google Scholar] [CrossRef]
  37. Yang, X.; Zhang, Y. Prediction of high-entropy stabilized solid-solution in multi-component alloys. Mater. Chem. Phys. 2012, 132, 233–238. [Google Scholar] [CrossRef]
  38. Poletti, M.; Battezzati, L. Electronic and thermodynamic criteria for the occurrence of high entropy alloys in metallic systems. Acta Mater. 2014, 75, 297–306. [Google Scholar] [CrossRef]
  39. Guo, S.; Ng, C.; Lu, J.; Liu, C.T. Effect of valence electron concentration on stability of fcc or bcc phase in high entropy alloys. J. Appl. Phys. 2011, 109, 103505. [Google Scholar] [CrossRef] [Green Version]
  40. Singh, A.K.; Kumar, N.; Dwivedi, A.; Subramaniam, A. A geometrical parameter for the formation of disordered solid solutions in multi-component alloys. Intermetallics 2014, 53, 112–119. [Google Scholar] [CrossRef]
Figure 1. Effect of the elemental content on the phase constitution at 350 °C: (a) Co; (b) Cr; (c) Fe; (d) Mn; and (e) Ni.
Coatings 12 01108 g001
Figure 2. The influence of the constituent concentration on the ratio: (a) Ω vs. Λ; (b) Λ vs. ρ; (c) Ω vs. δ; (d) Ω vs. χAllen; and (e) k1cr vs. ΔHimHmix, for the CoCrFeMnNi alloy.
Coatings 12 01108 g002
Figure 3. Equilibrium diagrams for the CoCrFeMnNi alloy.
Coatings 12 01108 g003
Figure 4. Taffel plots of the studied HEA thin-film electrodeposited and heat-treated samples: (a) 1, 1HT; (b) 2, 2HT; and (c) 3, 3HT.
Coatings 12 01108 g004
Figure 5. Nyquist plots obtained for the samples: (a) 1, 1HT; (b) 2, 2HT; (c) 3, 3HT.
Coatings 12 01108 g005
Figure 6. The equivalent electrical circuit model used to fit the experimental data: (a) for uncoated Cu and (b) Cu/HEA thin films in artificial seawater.
Coatings 12 01108 g006
Figure 7. Bode plots for the as-deposited and heat-treated 1, 2, 3 samples of HEA thin films. (a) is log freq. vs. log Z and log freq. vs.–Phase, for sample 1 and 1HT, (b) is log freq. vs. log Z and log freq. vs.–Phase, for sample 2 and 2HT, (c) is log freq. vs. log Z and log freq. vs.–Phase, for sample 3 and 3HT.
Coatings 12 01108 g007
Figure 8. XRD patterns obtained on the HEA CoCrFeMnNi thin films: (a) as-deposited; (bd) heat-treated and corroded.
Coatings 12 01108 g008
Figure 9. SEM morphology of the equimolar CoCrFeMnNi thin film, sample 1: (a) ×1000; (b) ×10,000.
Coatings 12 01108 g009
Figure 10. SEM morphology of the equimolar CoCrFeMnNi thin film, sample 1 (corroded): (a) ×1000; (b) ×10,000.
Coatings 12 01108 g010
Figure 11. EDS spectra for the equimolar CoCrFeMnNi thin film, sample 1, after corrosion.
Coatings 12 01108 g011
Figure 12. SEM morphology of the non-equimolar CoCrFeMnNi thin film, sample 2: (a) ×1000; (b) ×10,000.
Coatings 12 01108 g012
Figure 13. SEM morphology of the non-equimolar CoCrFeMnNi thin film, sample 2 (corroded): (a) ×1000; (b) ×10,000.
Coatings 12 01108 g013
Figure 14. EDS spectra for the CoCrFeMnNi alloy, sample 2, after corrosion.
Coatings 12 01108 g014
Figure 15. SEM morphology of the Co0.12Cr0.55Fe0.11Mn0.1Ni0.12 film, sample 3: (a) ×1000; (b) ×10,000.
Coatings 12 01108 g015
Figure 16. SEM morphology of the Co0.12Cr0.55Fe0.11Mn0.1Ni0.12 thin film, sample 3 (corroded): (a) ×1000; (b) ×10,000.
Coatings 12 01108 g016
Figure 17. EDS spectra for the Co0.12Cr0.55Fe0.11Mn0.1Ni0.12 thin film, sample 3 after corrosion.
Coatings 12 01108 g017
Table 1. Kinetic and corrosion parameters of the uncoated and coated electrodes, as-deposited and heat-treated, in synthetic seawater solution.
SampleEcorr
(mV)
icorr
µA/cm2
Rp
Ohm·cm2
ba
mV/Decade
bc
mV/Decade
R
mpy
P
mm/an
E
%
Cu−2637.83178263−1253.660.093-
1−2474.81350096.3−1192.240.05740
1HT−1872.01617064−1060.9390.02374
2−2893.0186570161−921.4140.03562
2HT−1651.362889059−1030.6360.016183
3−2421.1916,550117−990.5590.01485
3HT−1630.89312,38064−840.4170.010689
Table 2. Electrochemical parameters of the uncoated and coated electrodes as-deposited and heat-treated, in a synthetic seawater solution.
CPE1 CPE2
SampleRs
ohm·cm2
Q-Yo
s−n·cm−2
Q-nR
ohm·cm2
Q-Yo
s−n·cm−2
Q-nR
ohm·cm2
W
s−1/2·cm−2
χ2
Cu16.751.157 × 10−40.7252381.653 × 10−40.64318642.257 × 10−36.23 × 10⁻⁴
116.565.979 × 10−40.657533000.092610.7850.061184.736 × 1065.317 × 10−3
1HT6.5881.075 × 10−60.9929.5186.253 × 10−30.682532680.002494.603 × 10−4
27.463.204 × 10−40.76357451.15 × 10−30.96413935.6 × 1061.690 × 10−3
2HT5.2151.208 × 10−60.99116.22.66 × 10−50.67960410.001341.111 × 10−3
36.1342.308 × 10−40.738123.883.39 × 10−50.91811,0700.0026465.13 × 10−4
3HT5.0862.894 × 10−50.706210,1004.77 × 10−40.99213816.223 × 10−33.301 × 10⁻³
Publisher’s Note: MDPI stays neutral with regard to jurisdictional claims in published maps and institutional affiliations.

