
Impacting Droplet Can Mitigate Dust from PDMS Micro-Post Array Surfaces
by
 , , ,
, , ,
Abba Abdulhamid Abubakar
1 ,
,
Bekir Sami Yilbas
1,2,3,*,
Mubarak Yakubu
1,
Hussain Al-Qahtani
1,
Ghassan Hassan
1,3 and
Johnny Ebaika Adukwu
1,3 1
Mechanical Engineering Department, King Fahd University of Petroleum and Minerals (KFUPM), Dhahran 31261, Saudi Arabia
2
IRC for Renewable Energy and Power, King Fahd University of Petroleum and Minerals (KFUPM), Dhahran 31261, Saudi Arabia
3
K.A.CARE Energy Research & Innovation Center, Dhahran 31261, Saudi Arabia
*
Author to whom correspondence should be addressed.
Coatings 2021, 11(11), 1377; https://doi.org/10.3390/coatings11111377
Submission received: 1 October 2021
/
Revised: 3 November 2021
/
Accepted: 4 November 2021
/
Published: 10 November 2021
(This article belongs to the Special Issue Multifunctional Coatings and Lubrication)
Abstract
:In this paper, the impact mechanisms of a water droplet on hydrophobized micro-post array surfaces are examined and the influence of micro-post arrays spacing on the droplet behavior in terms of spreading, retraction, and rebounding is investigated. Impacting droplet behavior was recorded using a high-speed facility and flow generated in the droplet fluid was simulated in 3D geometry accommodating conditions of the experiments. Micro-post arrays were initially formed lithographically on silicon wafer surfaces and, later, replicated by polydimethylsiloxane (PDMS). The replicated micro-post arrays surfaces were hydrophobized through coating by functionalized nano-silica particles. Hydrophobized surfaces result in a contact angle of 153° ± 3° with a hysteresis of 3° ± 1°. The predictions of the temporal behavior of droplet wetting diameter during spreading agree with the experimental data. Increasing micro-post arrays spacing reduces the maximum spreading diameter on the surface; in this case, droplet fluid penetrated micro-posts spacing creates a pinning effect while lowering droplet kinetic energy during the spreading cycle. Flow circulation results inside the droplet fluid in the edge region of the droplet during the spreading period; however, opposing flow occurs from the outer region towards the droplet center during the retraction cycle. This creates a stagnation zone in the central region of the droplet, which extends towards the droplet surface onset of droplet rebounding. Impacting droplet mitigates dust from hydrophobized micro-post array surfaces, and increasing droplet Weber number increases the area of dust mitigated from micro-post arrays surfaces.
1. Introduction
The impact of liquid droplets on hydrophobic surfaces has various applications, some of which include biomedicine [1], combustion [2], forming and coating [3], and self-cleaning [4]. Although various mechanisms are adopted for droplet mobility on surfaces such as polydimethylsiloxane (PDMS) surface [5], the surface texture [6] and droplet fluid properties [7] remain the important properties assessing the droplet behavior. The topology of hydrophobic surfaces has hierarchically distributed micro/nanopillars and cavities and depending on the texture characteristics, such as texture profile, texture spacing, and pillar heights, the contact angle of droplet changes [8]. On the other hand, in self-cleaning applications, the average size and shape of the dust particles remain critical. This is because small dust particles with sharp edges can precipitate in texture gaps and retain them on hydrophobic surfaces [8]. Hence, the texture characteristics of the hydrophobic surfaces become critically important for efficient dust mitigation from surfaces. The dust particles have varying sizes with different shapes and the average size of the dust particles is about 1.2 μm [9]. However, some particles have sizes less than the particle average size and these particles most likely settle in between the wide texture spacings. The removal of these particles from the texture hydrophobic surface with external effects, such as sonic and vibrational excitations [10,11], and rolling droplets [12], becomes less likely. Hence, hydrophobic surfaces with considerable large gap spacing or extremely small texture widths become favorable for self-cleaning applications. Moreover, impacting liquid droplets can be utilized for dust removal from hydrophobic surfaces similar to creating a raining effect on dusty surfaces. The maximum spreading area of the droplet on the dusty surface remains critical for assessing the size of the dust mitigated area. Although the droplet spreading is related to the energy balance on the impacting surface, enhancing droplet impacting velocity increases the expanding droplet diameter over the surface. However, further increase of kinetic energy may cause droplets to break off over the impacting surface under the high inertial force. In this case, retraction and rebounding may be replaced by rolling off the breaking droplets over the surface. Consequently, dust mitigation by impacting droplets with high kinetic energy is interrupted by the droplet breaking off during the spreading period. Therefore, care must be taken towards the selection of texture characteristics of hydrophobic surfaces and proper assessment of dynamics of the droplet during the impact.
On the other hand, dust settlement creates undesired effects over the surfaces, particularly for solar energy devices, while degrading device efficiency [13]. Although several methods have been proposed for dust mitigation from surfaces [14], the self-cleaning process offers advantages over the conventional methods in terms of operational costs. In general, self-cleaning of hydrophobic surfaces can be achieved either by utilizing rolling droplets [12] or impacting droplets [4]. Although dust mitigation from hydrophobic surfaces has been presented in an earlier study [4], the texture morphology consisting of micro/nanopillars gave rise to a large amount of dust residue remaining on the impacted surface. This is due to the small size particles, which are anchored and remained in between the texture gaps. To minimize the dust residues over the impacted surface, texture structure needs to be revisited and further arrangement towards increasing the texture gaps becomes necessary while keeping the hydrophobic state of the surface. Hence, in the present study, impacting droplet behavior over the hydrophobized micro-post arrays with large texture spacings was examined. Micro-post arrays were formed over polydimethylsiloxane (PDMS) via copying from initially produced silicon micro-post array surfaces by a lithography technique. The selection of PDMS micro-post arrays is because of high optical transmittance to UV visible spectrum, which can be used for photovoltaic applications as cover sheets. Micro-post array surfaces were hydrophobized through depositing functionalized nano-silica particles. Impacting droplet behavior was monitored and evaluated accommodating a high-speed recording system and a tracker program. The flow structures inside the droplet fluid were simulated numerically adopting the conditions set in the experiments. The droplet spreading and retraction periods were compared with those of the experimental data. The study was extended to include dust mitigation by the impacting droplet from micro-post array surfaces.
2. Experimental Methods
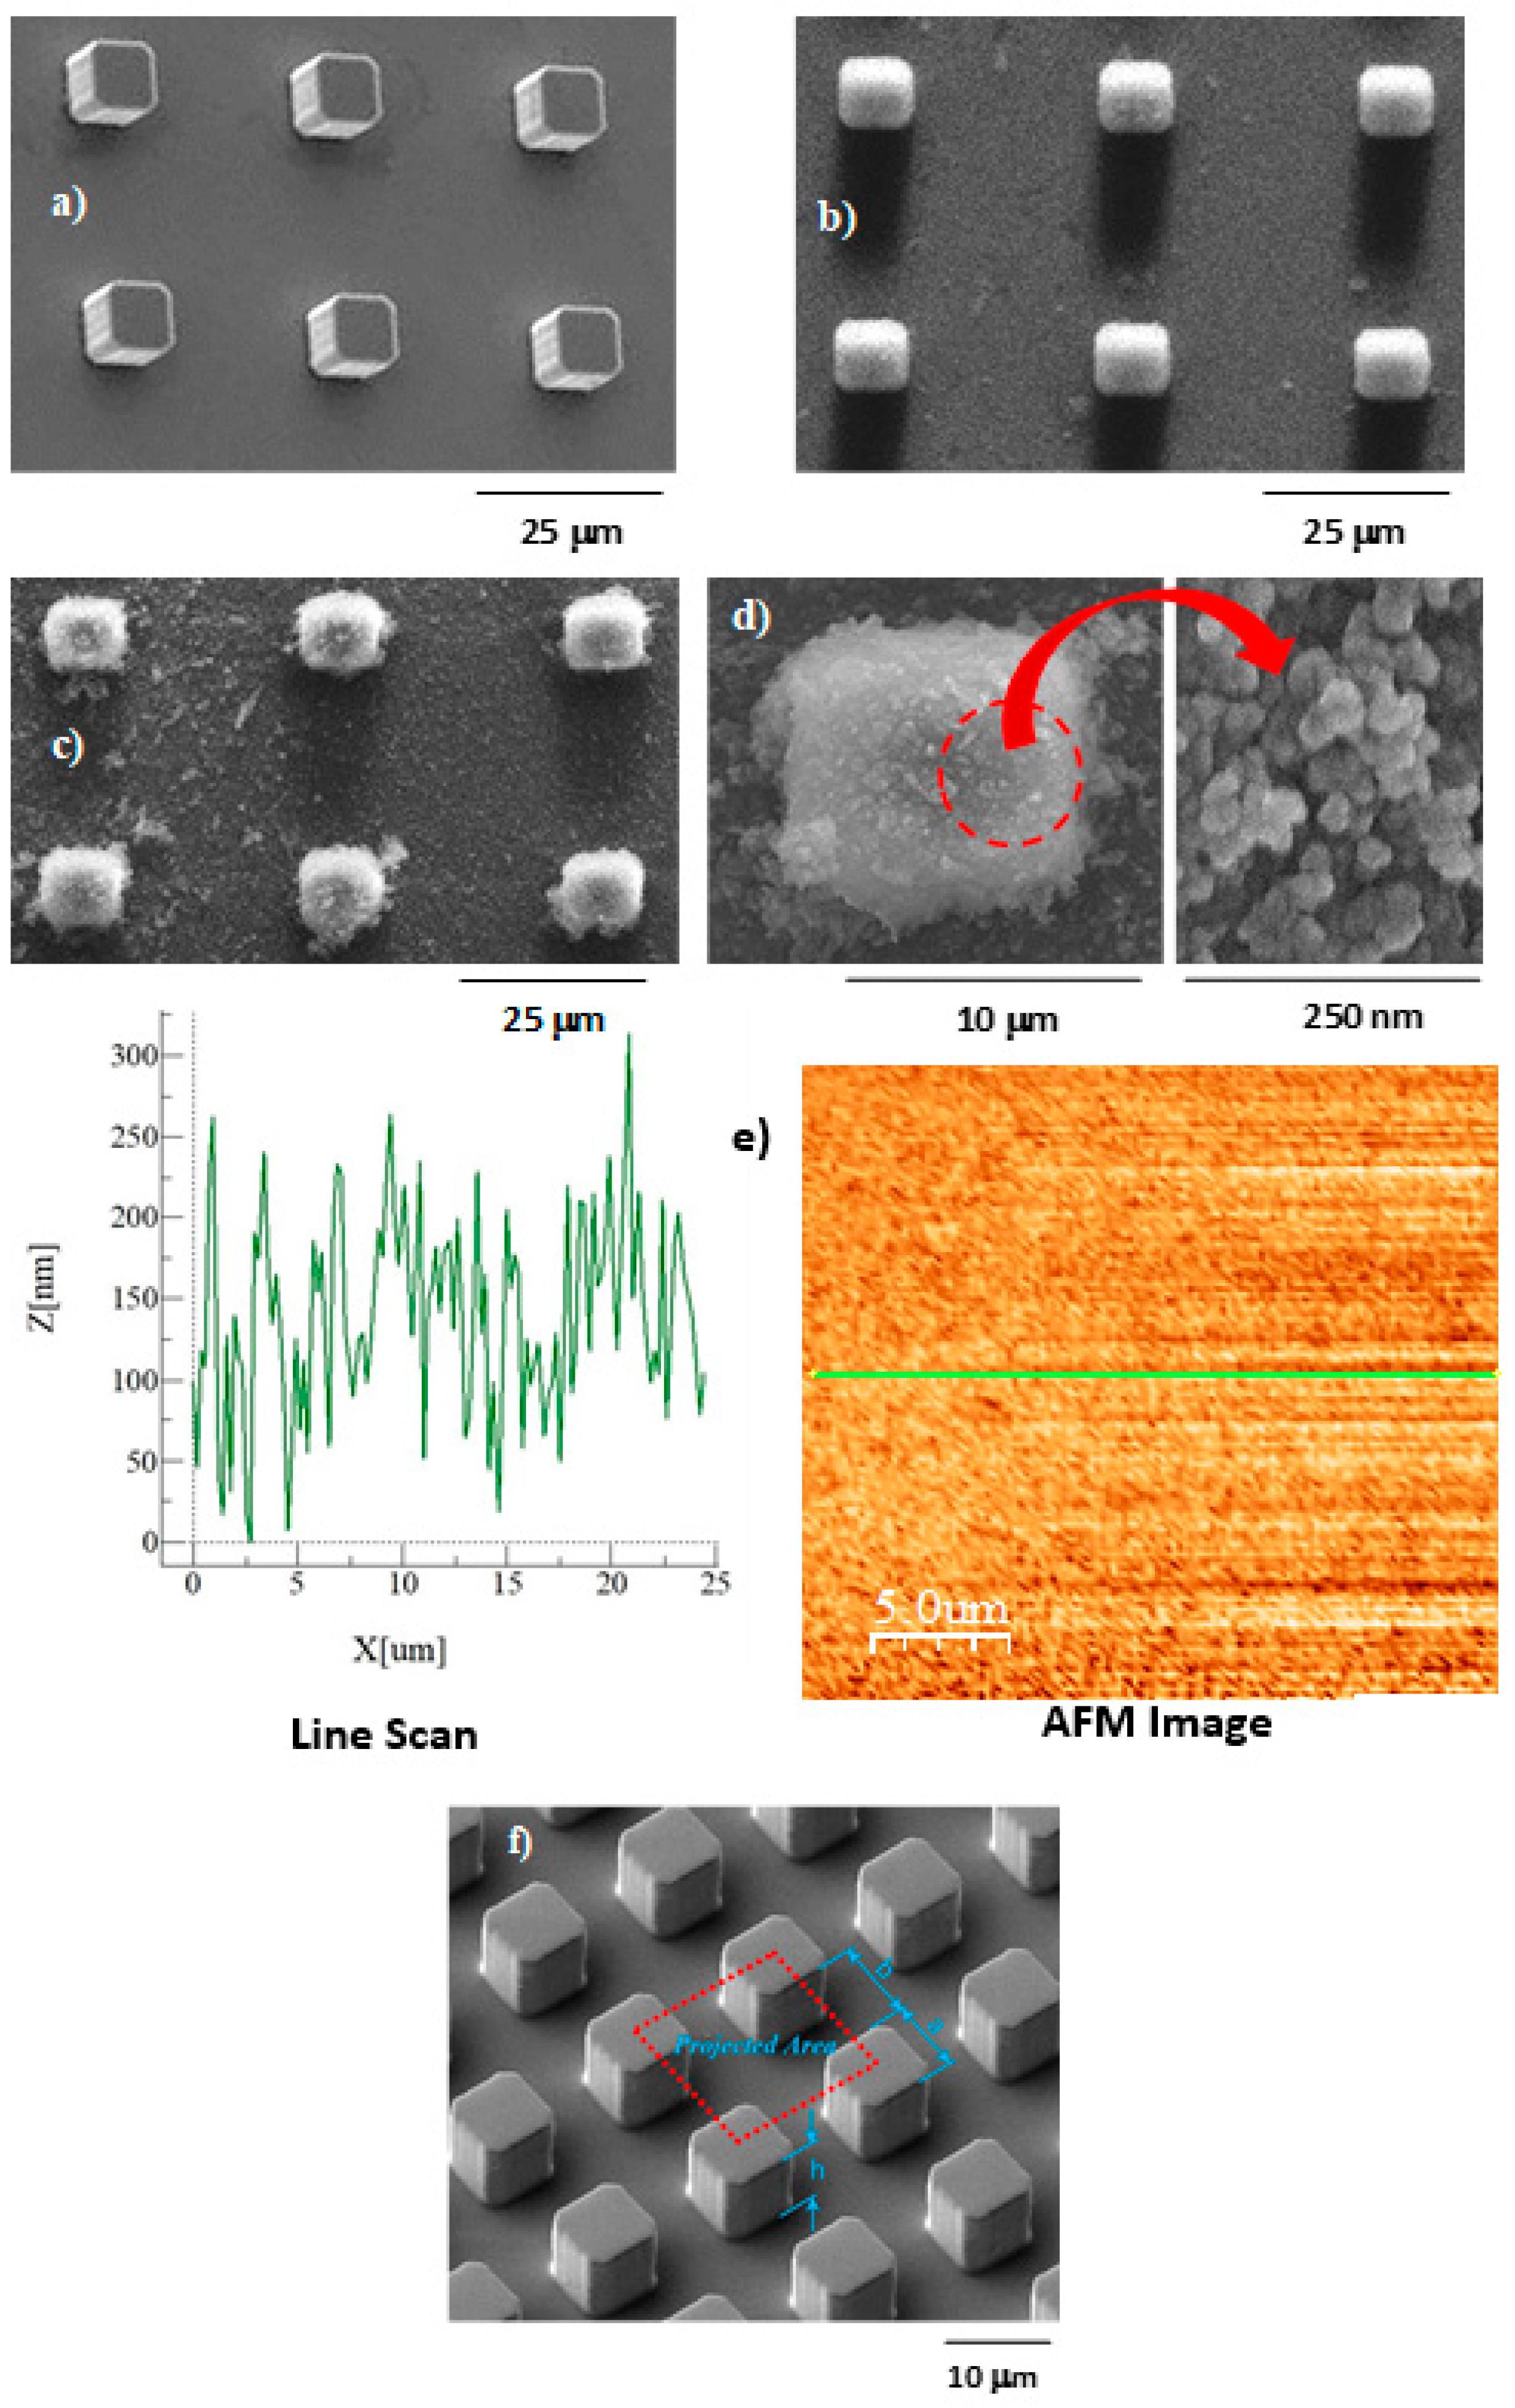
Initially, micro-post arrays were formed on silicon wafer surfaces employing a lithography technique. Micro-posts had a cubic shape (Figure 1a, height (c), and length (b) of the micro-posts were kept at 10 μm) and the size of the micro-post arrays was varied by increasing the spacing between the micro-posts. The spacing between the micro-posts was set at 10, 25, and 35 μm. Since silicon wafer was opaque to optical light, they were replicated with polydimethylsiloxane (PDMS).
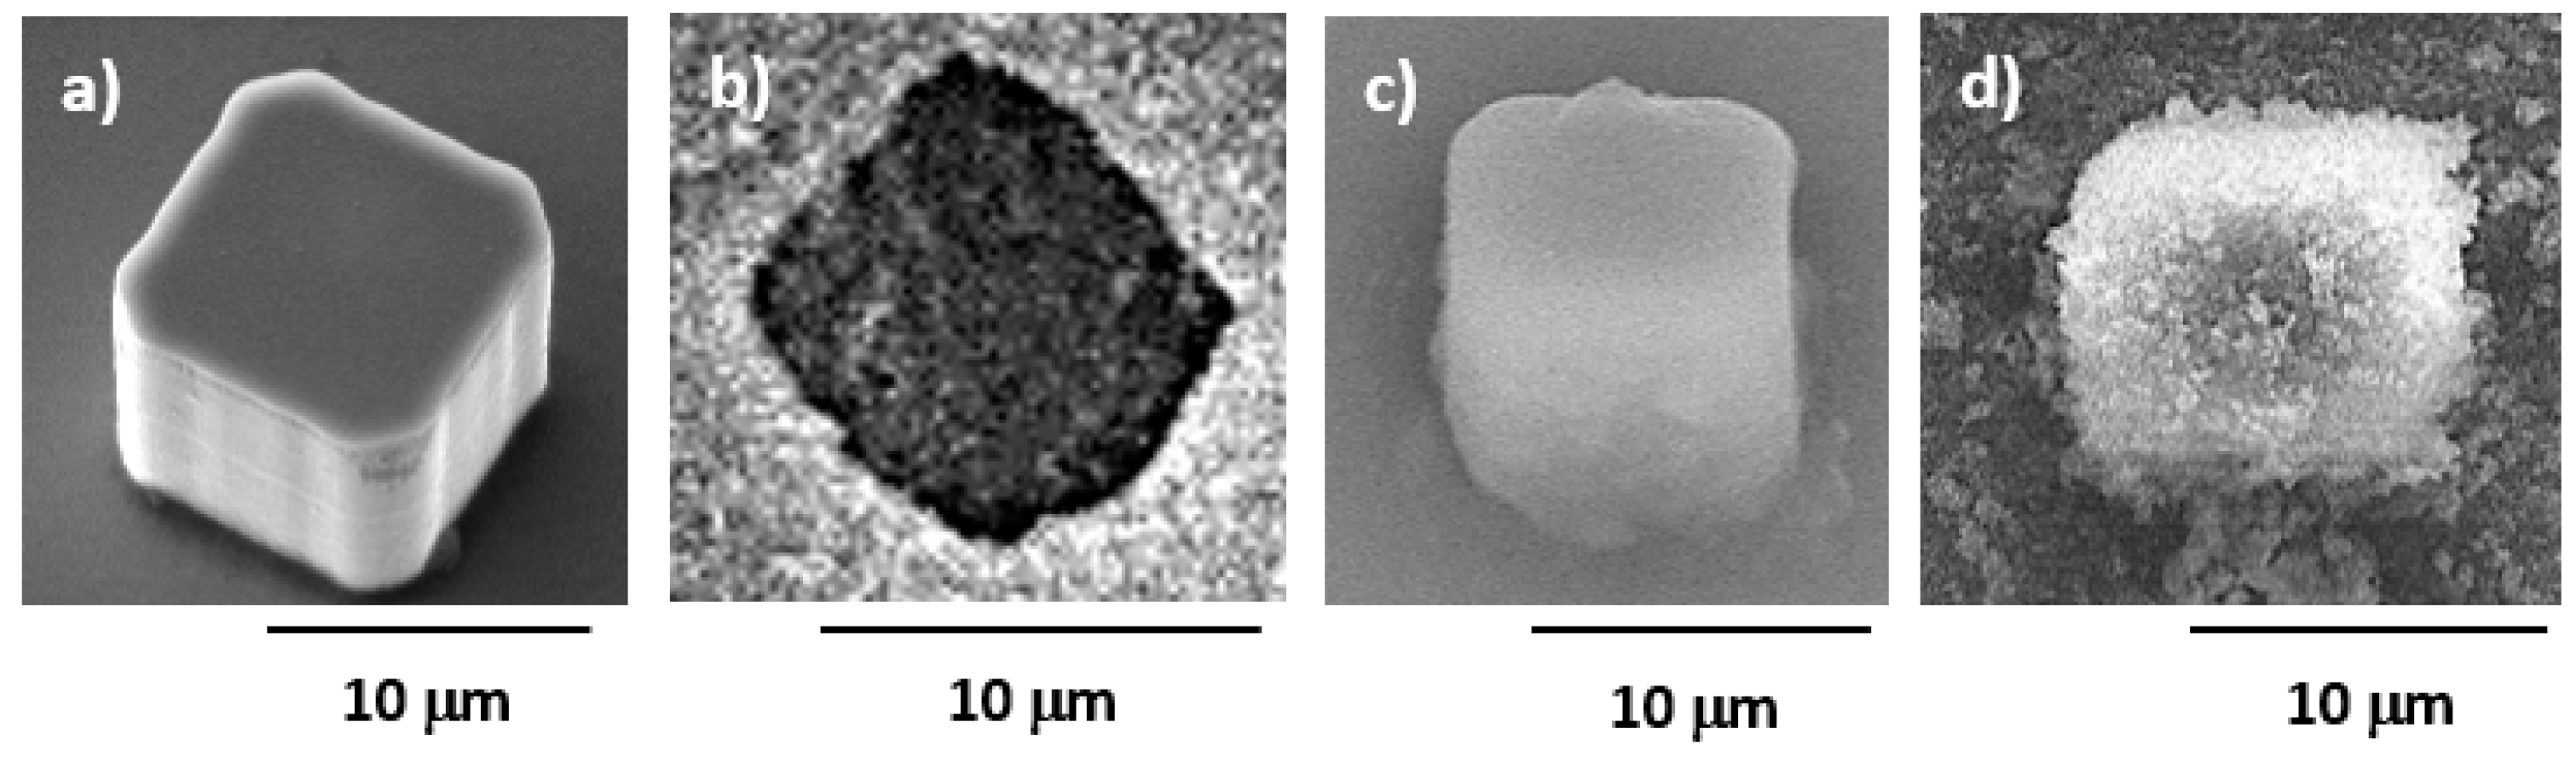
The micro-post arrays were replicated via casting. In this case, the micro-post arrays were initially copied through casting and, later, it was recast using the PDMS copied arrays. Figure 2 shows the SEM micrographs of a micro-post produced from the lithography technique (Figure 2a), a copied PDMS micro-post (Figure 2b), a replicated PDMS micro-post (Figure 2c), and hydrophobized micro-post (Figure 2d).
To hydrophobize the micro-posts arrays surface, functionalized silica particles were used. The functionalized silica particles were prepared following the early procedure [15]. In this case, the mixture of tetraethyl orthosilicate (TEOS), isobutyltrimethoxysilane (OTES), ethanol, and ammonium hydroxide was prepared for coating. The functionalized silica particles were deposited on the sample surfaces using the dip-coating method (KSV NIMA Dip Coater, Biolin Scientific, Manchester, UK). The geometric feature of the replicated micro-post arrays was assessed by scanning electron microscope (JOEL 6460, Tokyo, Japan). The micro-post array surfaces were gold-coated before SEM analysis to minimize the electron charges on the sample surface during the SEM imaging. In addition, the atomic force microscope (AFM, Flex-Axiom, Nanosurf, New Delhi, India) was used for the profiling of the functionalized silica particles deposited on micro-posts array surface. The AFM was operated at contact mode to secure the surface profiling of nanosized texture characteristics of the functionalized silica particles coating surface. The hydrophobicity of the coated PDMS micro-post array surfaces was evaluated by a goniometer (Kyowa, model—DM 501, Tokyo, Japan) while utilizing the high precision drop technique [16]. A high-speed monitoring system (Speed Sense 9040, Bristol, UK) was incorporated recording the impacted droplet behavior on hydrophobized PDMS micro-post array surfaces. The recording was carried out at 5000 frames-per-second having the pixel resolution of 14 µm × 14 µm with 1280 × 800 pixels. A tracker program [17] was utilized to extract the droplet data recorded. The recording tests were cycled 11 times and the error estimated based on test repeatability was almost 2.8%. The measurement uncertainty (σu) was determined by [18]:
here, xe is the mean value of data (x), m represents the number of points in the data set, and (x) corresponds to the probability distribution function. The function (x) was obtained using the instant correlation plane. The data were fit in a function determining the Gaussian diameter. The uncertainty was obtained via using a least-squared-Gaussian-fit method while normalizing the data by pixel numbers adding to the cross-correlation peak. The bias error was 0.02 pixels depending on the complexity associated with quantifying the small peaks in the fitted function. The uncertainty was determined as 2.9%.
Dust was collected by soft brushes from the outdoor, in the Dammam area in Saudi Arabia, and was stored in sealed containers before the experiments. A 3D optical microscope (ContourX-100, Bruker, Billerica, MA, USA) was used to assess the dust layer thickness. Measurements were taken at several locations to ensure the constant thickness of the dust layer on the micro-post array surfaces. The dust layer thickness was kept at 300 μm on the micro-post array surfaces during the experiments. It is worth mentioning that the dust layer thickness on average over the flat panel surfaces was almost 300 μm for six months in the outdoor conditions of the local area.
3. Numerical Methods
The constitutive equations were utilized to model the flow behavior in impacting droplet fluid over micro-post array surfaces. A water droplet and surrounding air domains are represented incorporating the two-phase flow approach (level set model). Using the level set model for two-phase flow, the properties of the droplet and air (such as density, viscosity, etc.) are scaled according to mixture rules. The mathematical details of the two-phase formulation care are provided in the Appendix A.
3.1. Initial and Boundary Conditions
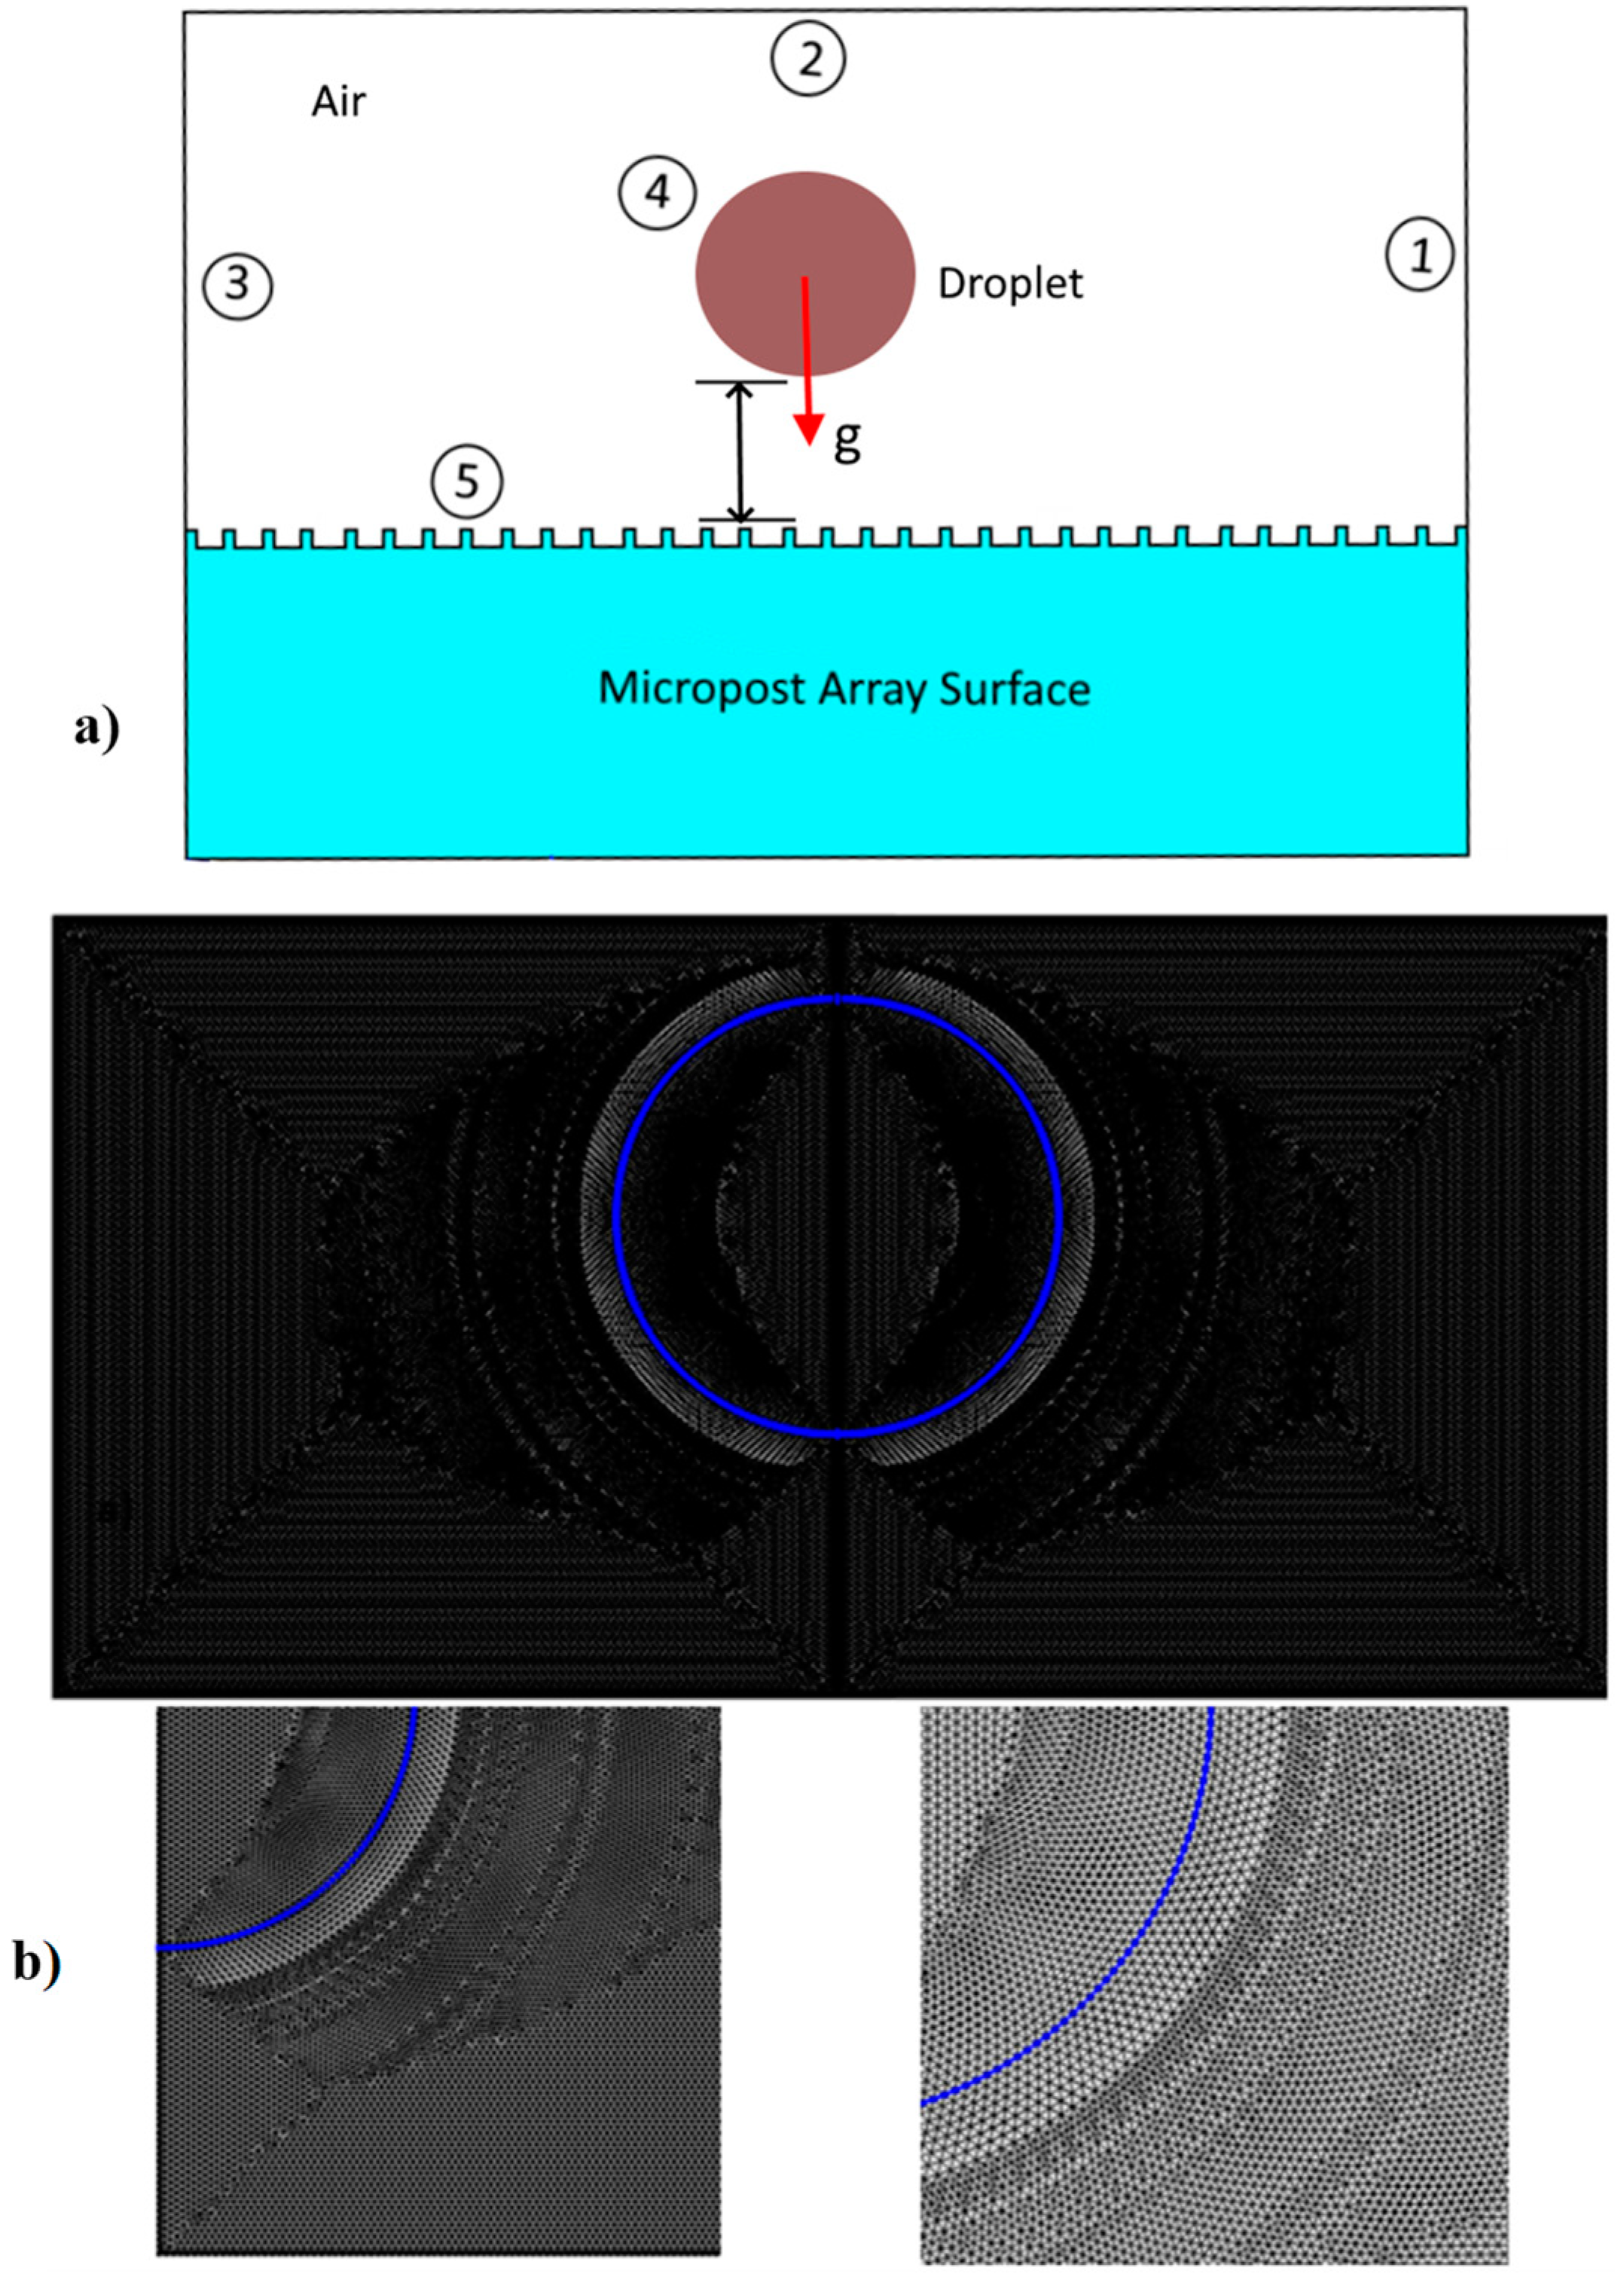
The schematic view of impacting droplets on the micro-post array surface is shown in Figure 3a. For all cases, the water droplet is assumed to have moved over 18 mm under the gravitational influence. This is done to reduce the computational time for the duration of droplet inflight in the ambient air. Hence, an initial velocity of 0.536 m/s is imposed on the droplet. The initial conditions adopted for the simulations can be expressed as:
It is worth mentioning that the initial condition for the droplet and air temperature settings were based on the experimental conditions in the lab environment. In addition, the droplet initial velocity of 0.536 m/s corresponds to the experimental droplet impact height, which was measured as 14.64 mm.
The following boundary conditions were adopted in the simulations. In line with Eulerian methods (such as level set), the interface (boundary 4) between the droplet and surrounding air is considered to change from one location to another during droplet motion (Figure 3a). Hence, the Marangoni boundary condition is imposed at the droplet–air interface using the volumetric source term. Furthermore, the convective boundary condition is applied at the droplet–air interface, while thermal insulation is imposed at all exterior boundaries (i.e., boundaries (1)–(3)). The substrate surface (i.e., boundary (5)) is considered to be a wetted wall with predefined contact angle and slip velocity. Boundary (4) is also considered as a slip boundary. Boundaries (1)–(3) are the pressure outlets. In addition, experimentally obtained adhesion/frictional forces are defined at the boundary (5) from which the droplet motion is inhibited by the resistive interfacial forces. Hence, the adopted boundary conditions are expressed as:
where: is a unit vector normal to the wall, is a unit vector normal to the contact line, is the dynamic contact angle [19], is Dirac-Delta function, is slip length, is time, is adhesion force at the contact area, is the droplet hydraulic diameter, is a solid fraction, is maximum receding contact angle, and is maximum advancing contact angle. For numerical calculations, a suitable choice is , where is the edge length of the mesh element. It is worth mentioning that the micro-post array surfaces are hydrophobized and to account for the hydrophobic surface, the slip condition is considered at the interface between the droplet liquid and micro-post array surface, i.e., a hydrophobic wetting state is adopted at the boundary (5). In addition, the pinning force (Fad) is added to account for the droplet adhesion over the three-phase-contact-line under the surface tension.
3.2. Numerical Implementation
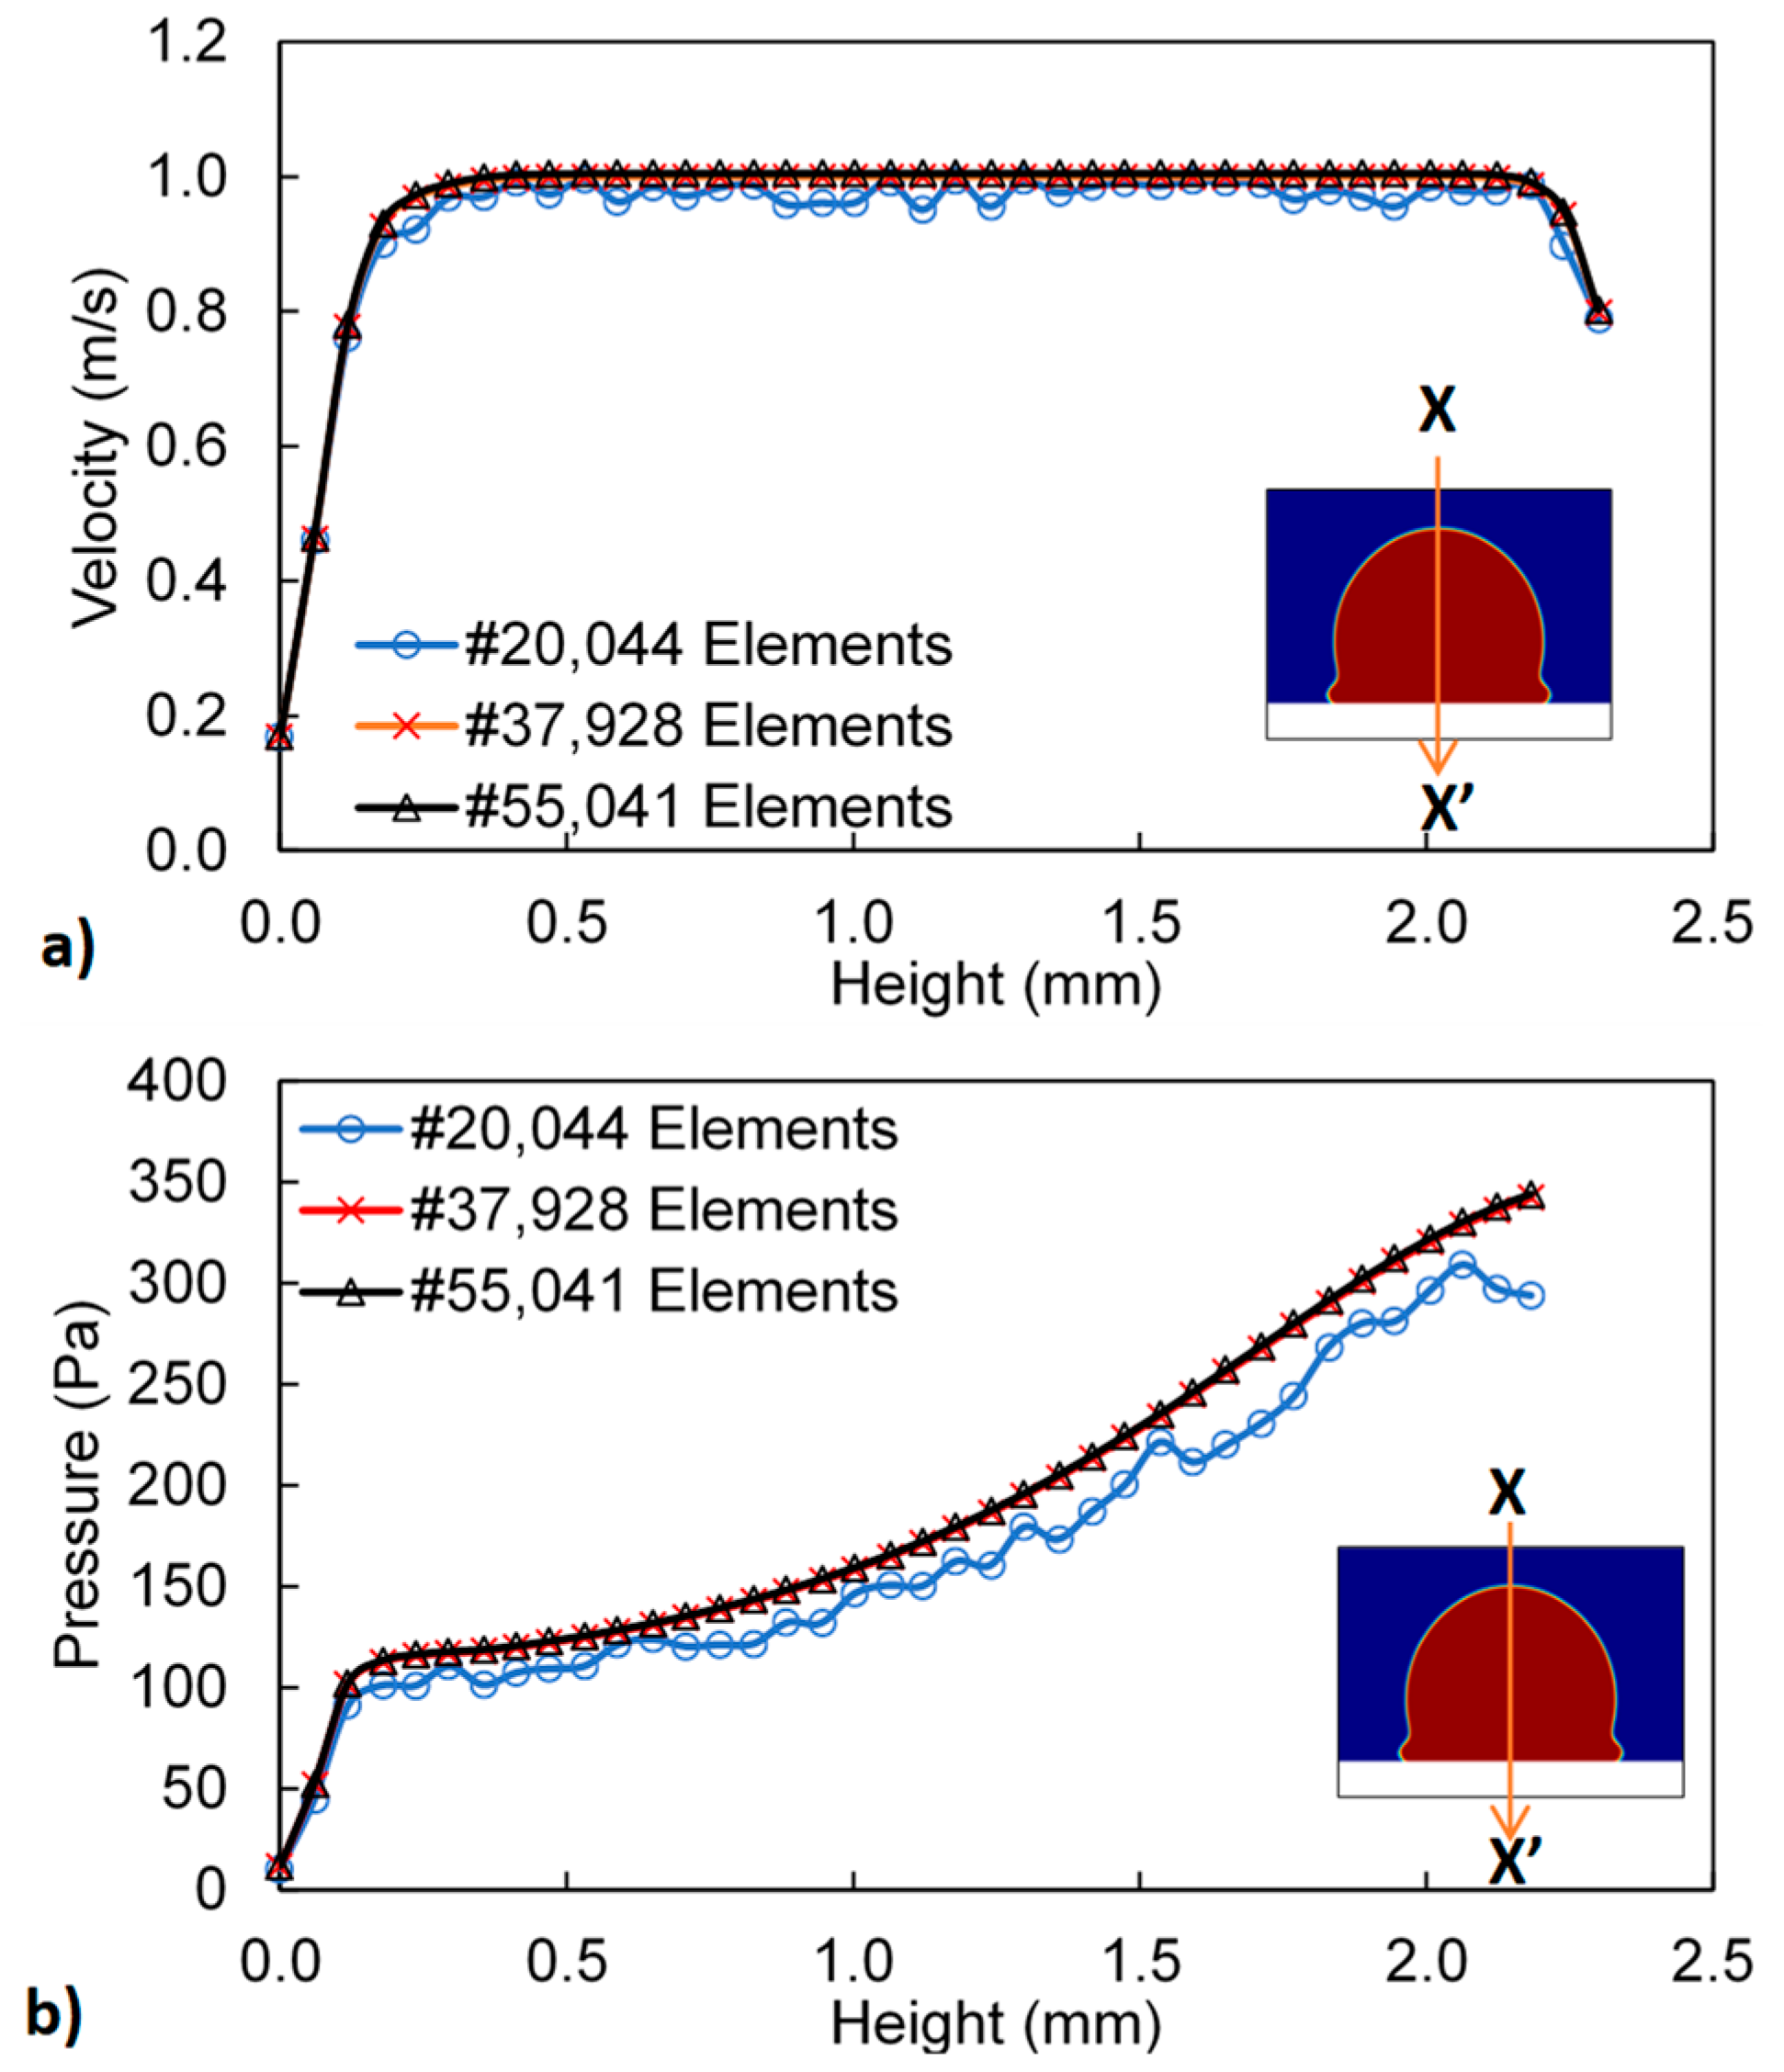
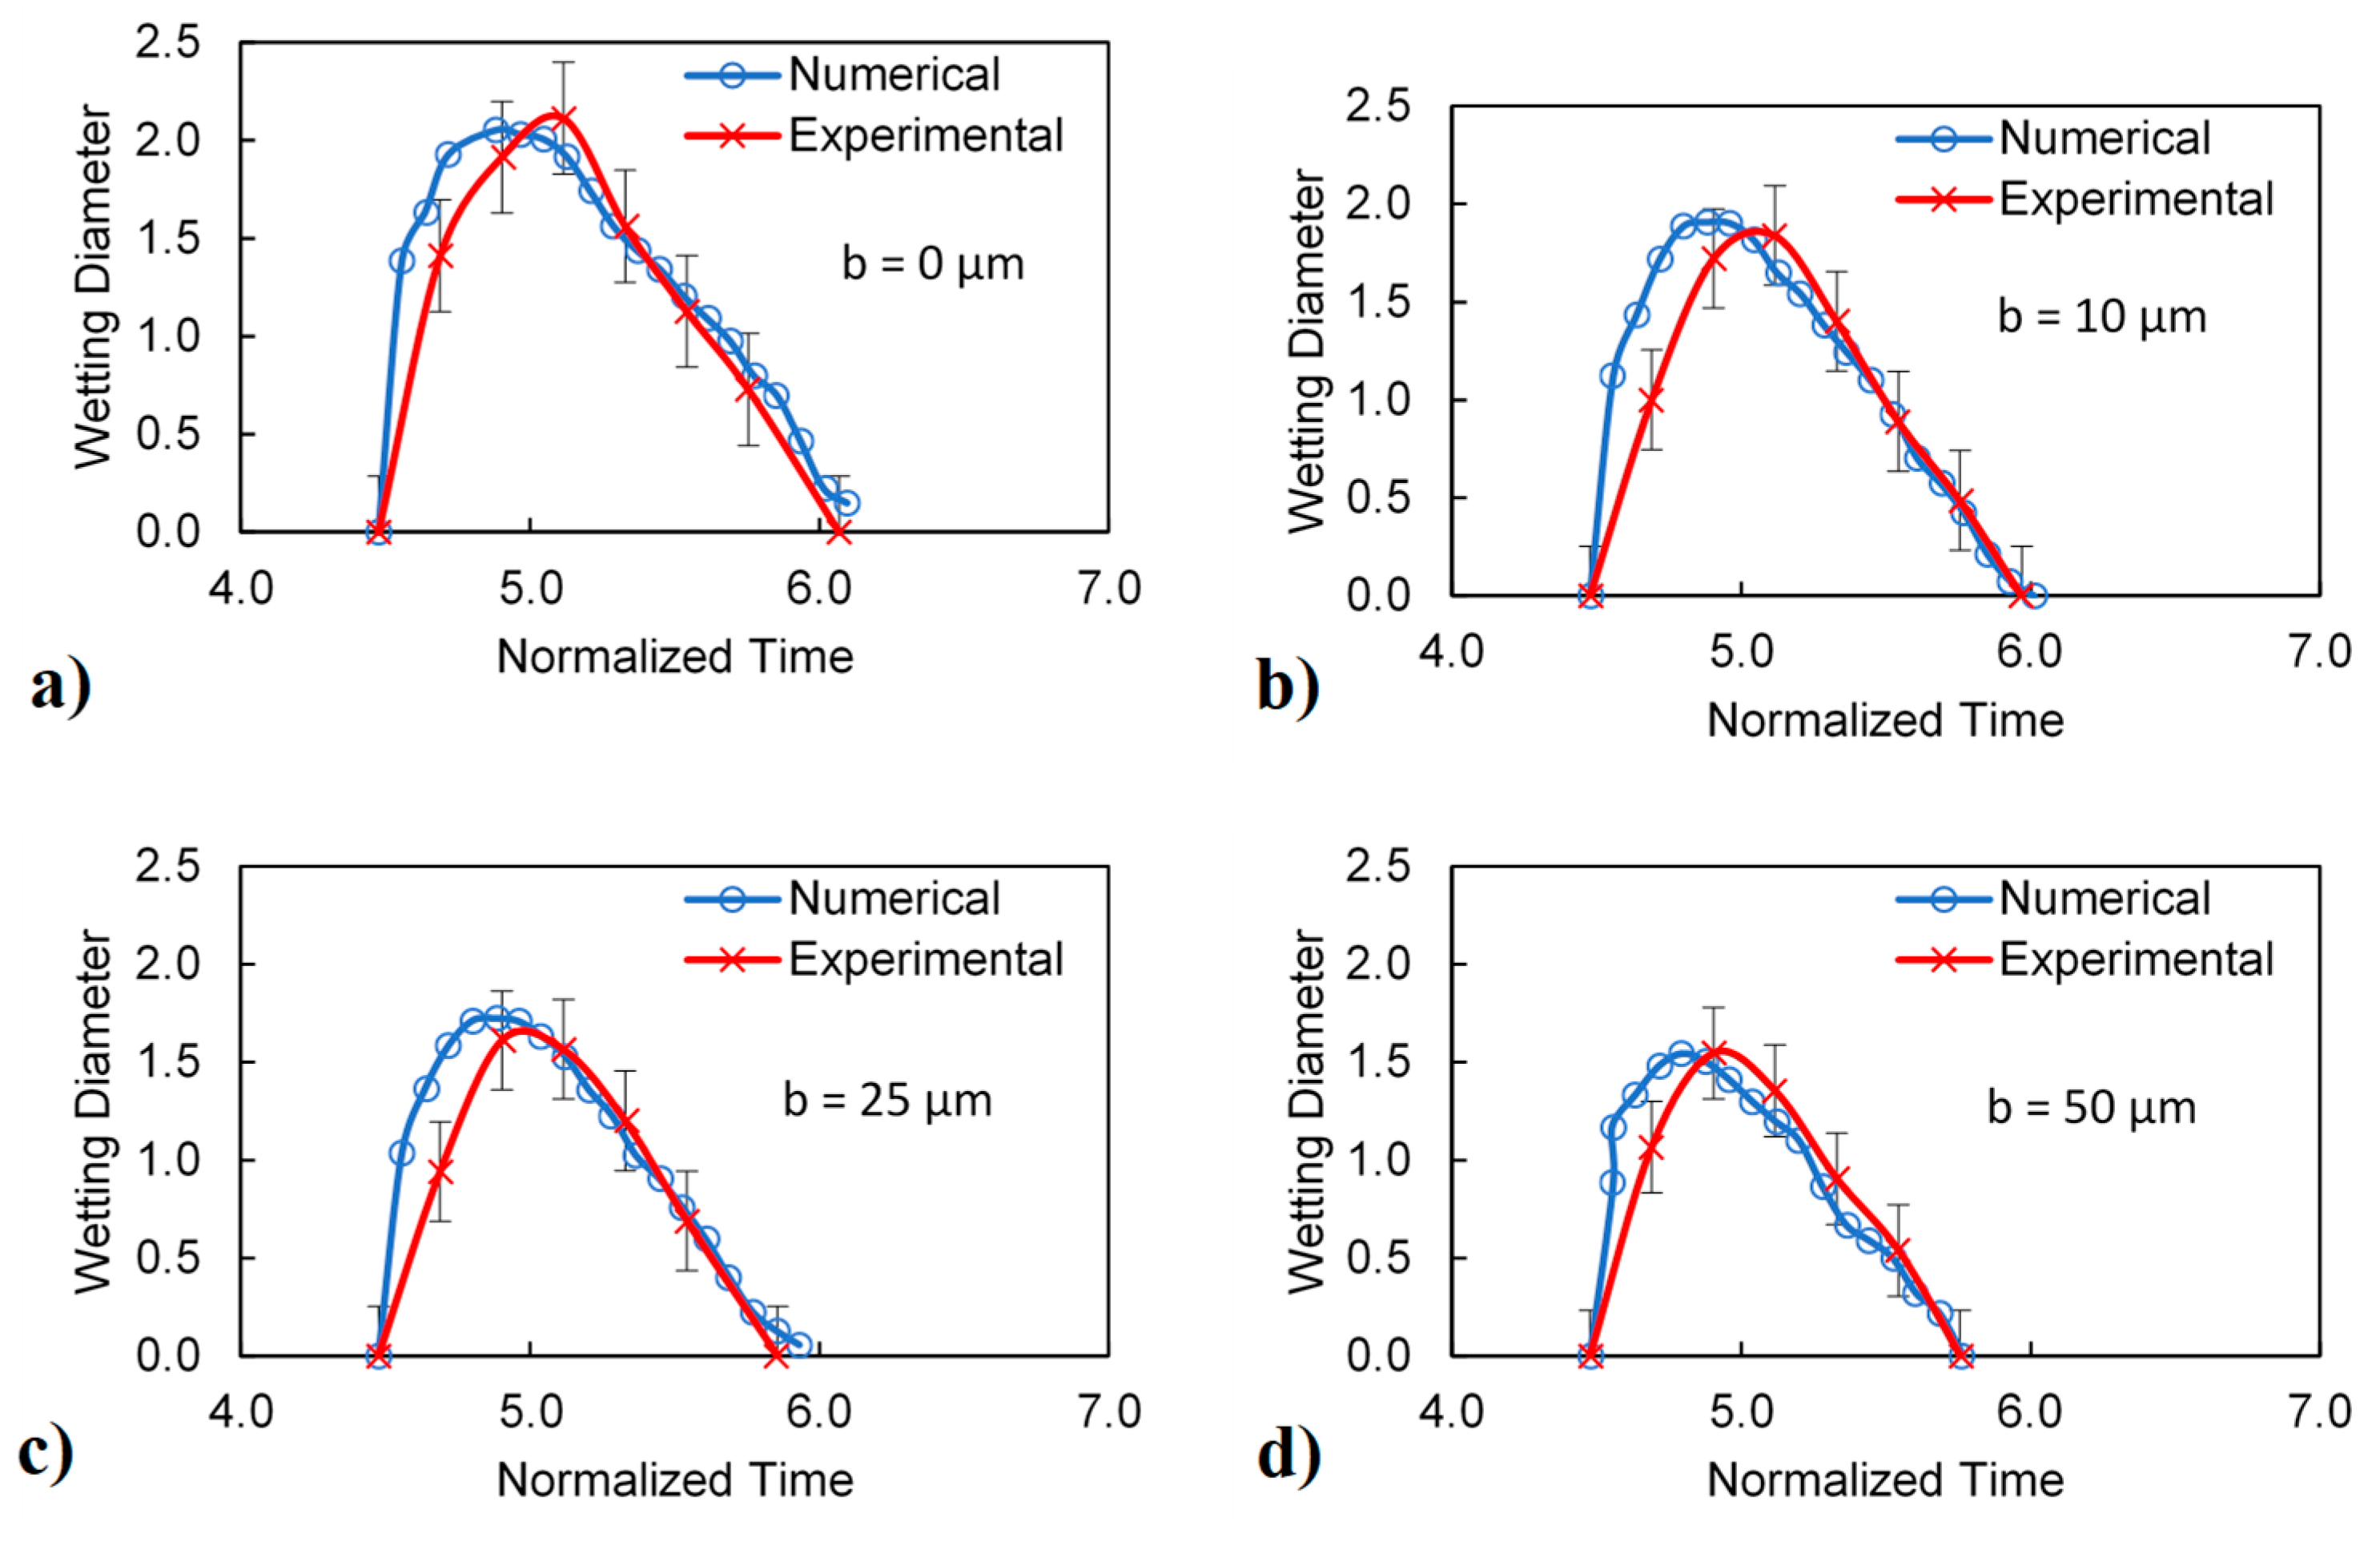
The numerical model was implemented in the environment of the commercial FE package, COMSOL multi-physics [20]. The simulations were carried out in 3D. The accuracy of the computation depends on the mesh and time step sizes; hence, a careful arrangement of mesh size and time increment was made ensuring converge results. Furthermore, the stable second-order Euler backward difference scheme was used to discretize the time derivatives, and an automatic time-stepping scheme was used in which time steps as small as 10−8 s were selected for the simulations. Figure 3b shows the meshes used in the simulations. The predictions of the pressure field along with the droplet central height at the point of impact (i.e., 54 ms) are shown in Figure 4. The grid-independent solution can be obtained with a mesh consisting of 37,928 triangular elements (Figure 4). The level set model is an Eulerian scheme. Hence, the air–droplet interface is implicitly treated within the computational domain with the aid of the level set function. However, the level-set tuning parameters ( and ) need to be optimized to avoid numerical instabilities that may lead to prolonging of simulation time. Based on the initial tests, the re-initialization parameter () was set the same as the maximum flow velocity (0.6 m/s) while the interface thickness () was considered to be 10 μm. Furthermore, a preliminary check shows that the loss in droplet mass during spreading and retraction cycles does not surpass < 10−8 gm (i.e., negligible). Table 1 gives temperature dependent on fluid properties used in the simulations and the geometric dimensions of the micro-post arrays are also provided in Table 1. The predictions of the wetting diameter of the droplet on the impacted surface were compared with the experimental data for validation purposes. Figure 5 shows the normalized droplet wetting diameter with normalized time obtained from predictions and experiments. The predictions and experimental data are found to agree. The differences in wetting diameters are because of droplet pinning created by the nanocavities formed on the hydrophobized micro-post surfaces and round-off errors in the simulations. The pinning effect is difficult to incorporate accurately in the simulations because of the random distribution of such nanostructures over the actual coating surface.
4. Results and Discussion
4.1. Surface Texture and Hydrophobic State of Micro-Post Arrays
Figure 1a–d illustrates SEM images of micro-post array surfaces before replicated (Figure 1a), after being replicated by polydimethylsiloxane (PDMS) (Figure 1b), hydrophobized replicated (Figure 1c), and coating surface (Figure 1d). It is worth mentioning that micro-post arrays were lithographically produced over silicon wafer surfaces and later replicated by PDMS using the molding technique. PDMS replicated surfaces have good optical transparency, which can be used over the photovoltaic panel surfaces. The lithographically produced micro-post arrays have repeating micro-posts with uniform spacings over the silicon wafer (Figure 1a). The PDMS replicated micro-post arrays have identical sizes with those of lithographically produced micro-post arrays. The replication error in terms of size of micro-post spacing and height is less than 0.1%. In addition, no defect sites are observed on the edges of the PDMS replicated micro-posts. This indicates that the replicated micro-post arrays geometry (Figure 1b) is identical to that of the lithographically produced silicon micro-post arrays. The hydrophobized surface of the replicated micro-post arrays has an almost uniform coating of functionalized silica particles (Figure 1c). The coating covers the entire surface of micro-post arrays including the micro-posts and gap spacings. The coating has clustered nano-silica particles of about 30 nm (Figure 1d). The clustering demonstrates web-like formation with few sub-micro/nanocavities over the coating surfaces (Figure 1d). Hence, the hydrophobic coating possesses nano-pillars on the micro-post array posts, which can be observed from the line scan of AFM as depicted in Figure 1e. The average roughness of the coating surface is 180 nm and the average depth of the cavities is 300 nm. The AFM microbe in contact mode was operated to profile the nano-size texture surface. The surface was scanned over 20 with 2 μm intervals. The texture characteristic such as skewness (Ssk) and kurtosis (Sku) appeared to be similar in each interval over the scanned length. The skewness is estimated as 1.3 while kurtosis is about 3.5. The values of Ssk and Sku demonstrate that the peaks are dominant over the valleys (Ssk > 1), and the peaks are sharp (Sku > 3), which is also observed from Figure 1e. The skewness (Ssk) is estimated from [21]:
where l is the sampling length over the roughness profile (AFM line profile), z(x) is the vertical heights of the peaks in the profile, and Ra is the average roughness of the surface. The kurtosis (Sku) is formulated as [21]:
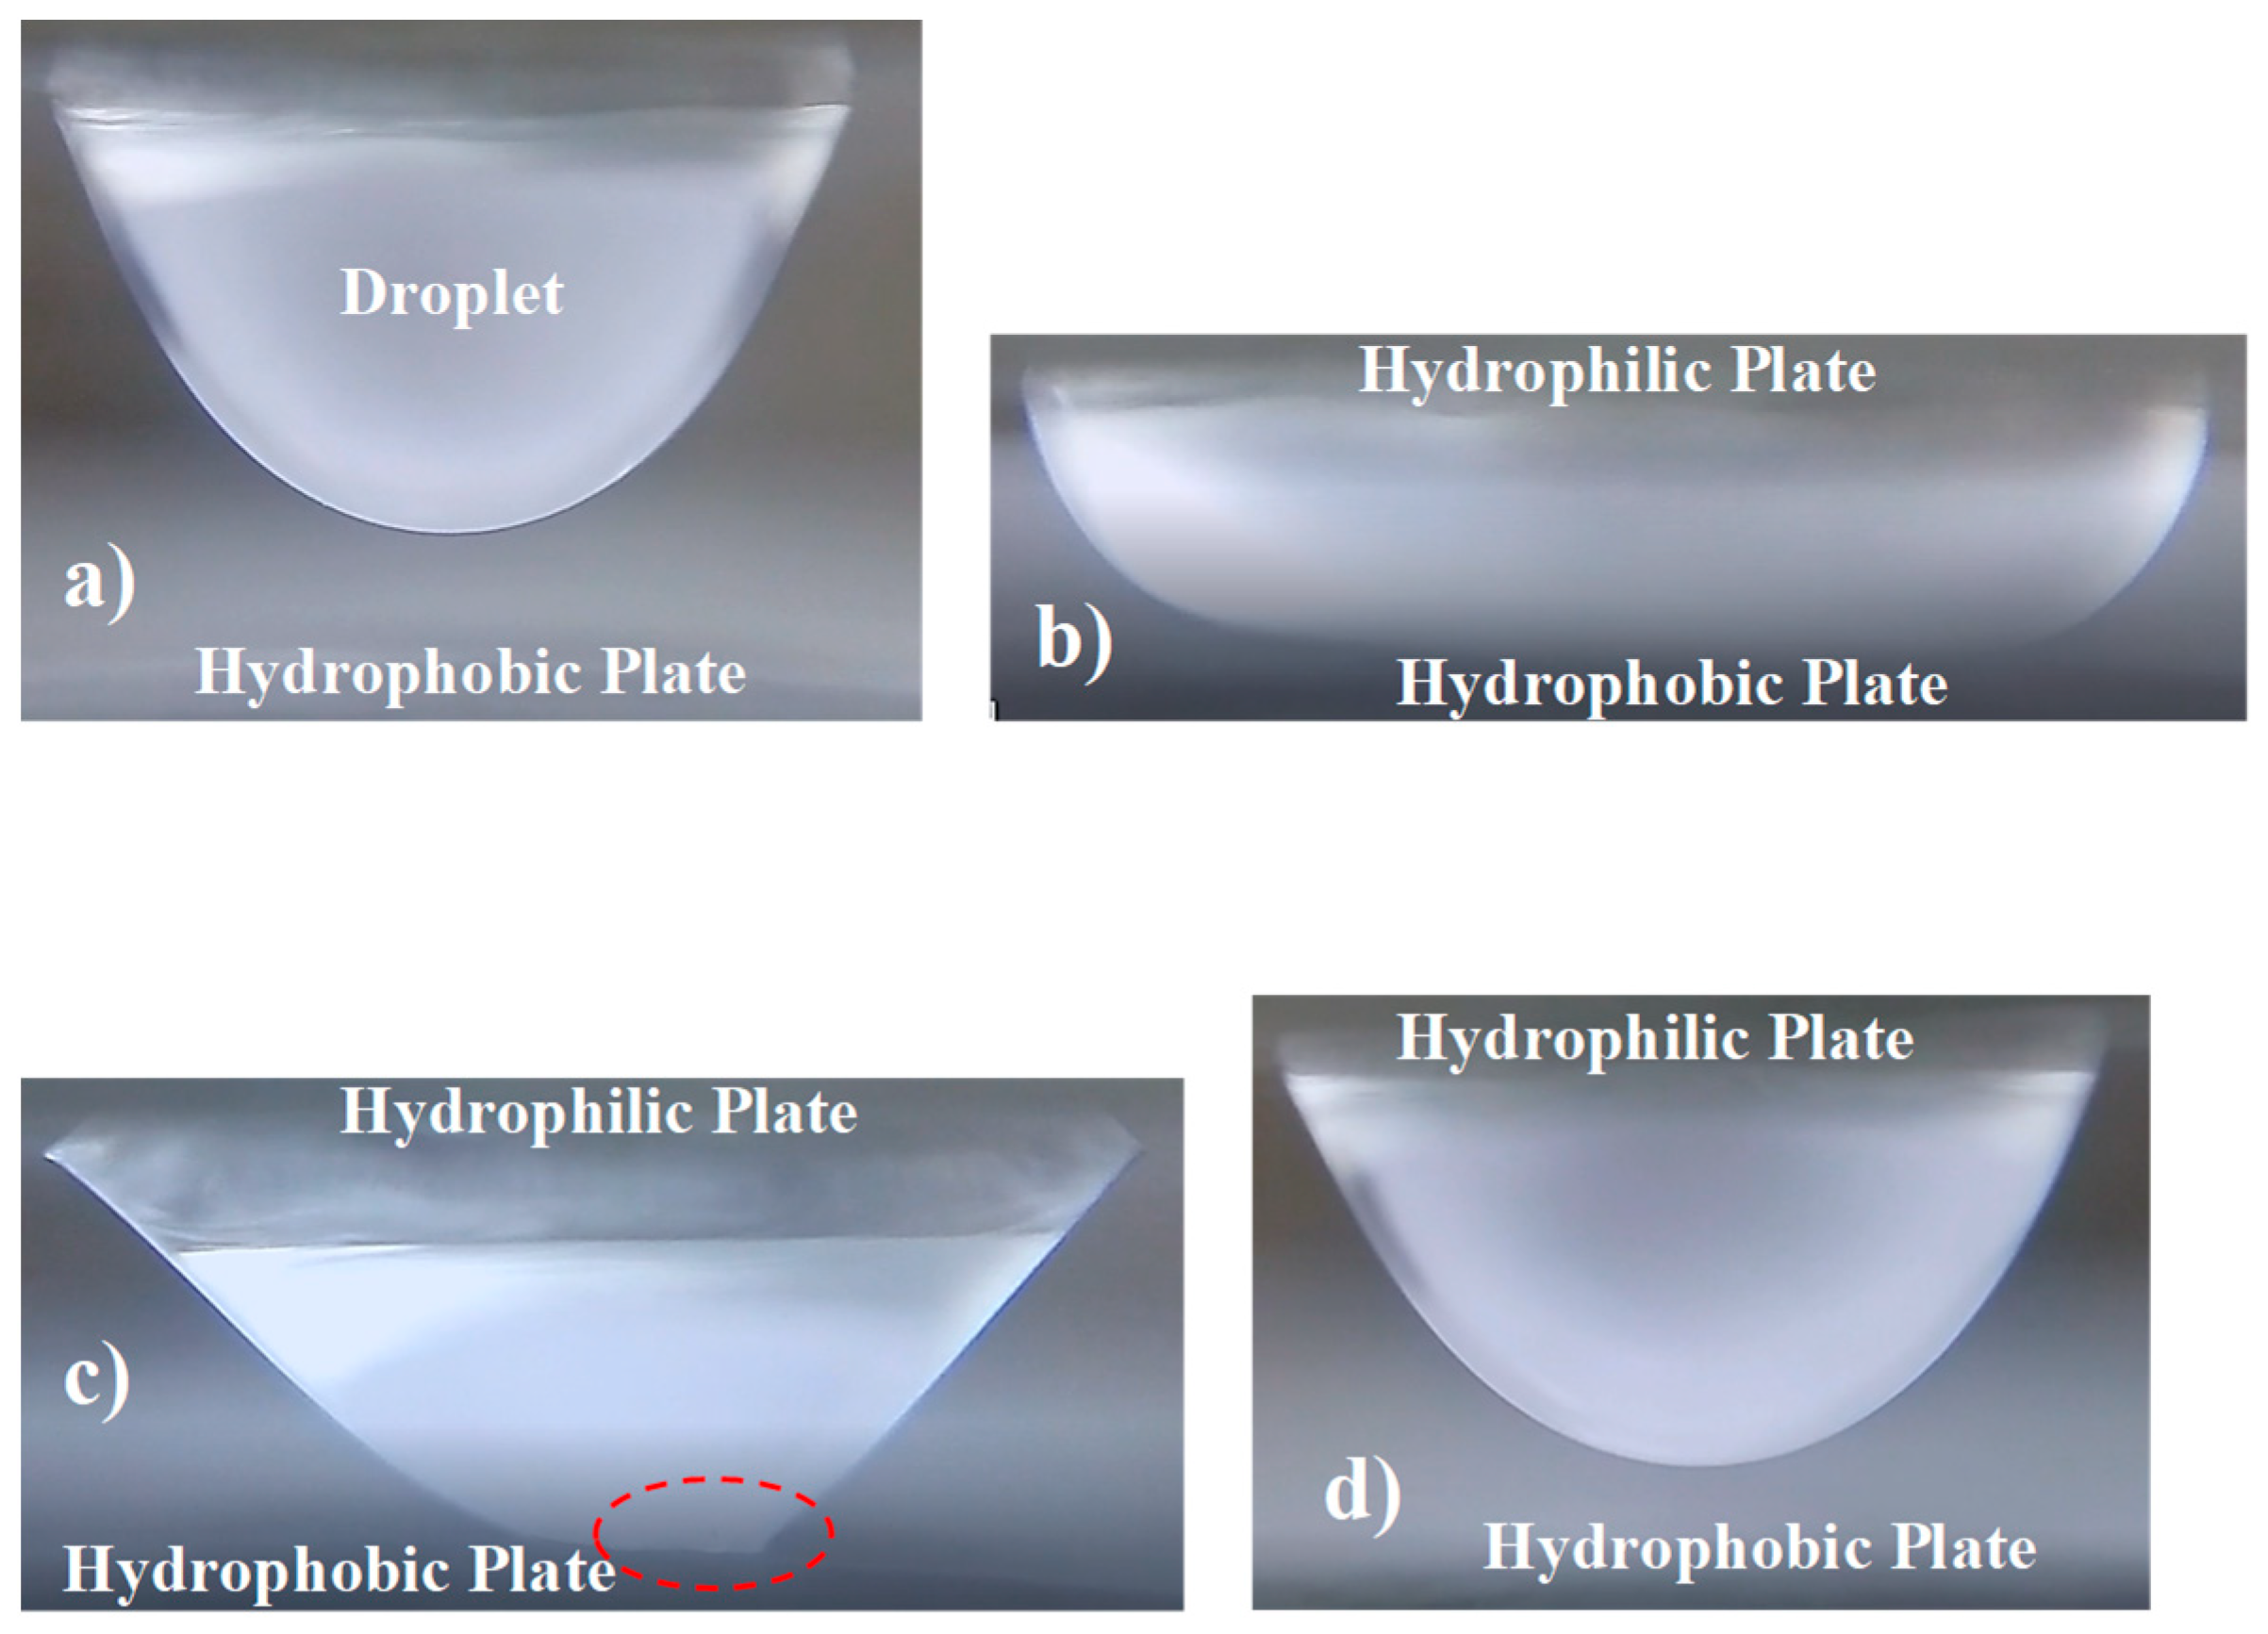
It is worth mentioning that kurtosis (Sku) represents the measure of the sharpness of the peaks in the roughness profile (Sku > 3: height distribution is spiked) while skewness (Ssk) corresponds to the degree of peaks in the roughness profile (Ssk > 0: the peak height distribution in terms of peaks and pits is skewed below the mean plane). Moreover, the sub-micron/nano size cavities can act as droplet pinch-off centers and add to droplet fluid pinning on the surface. Therefore, the roughness parameter of the coating affects the three-phase contact line and droplet pinning. The roughness parameter represents the ratio of pillar area over the projected area of the surface. The roughness parameter of the coating surface is estimated as 0.52. It is worth mentioning that the pinning force acts as an anchoring force over the impacted droplet and lowers the spreading/retraction and rebounding rates of the droplet on the surface. The contact angle of the droplet over the coated surface is evaluated using a Goniometer while adopting the high precision droplet geometry assessment. The droplet on the hydrophobized surface has a 3D configuration while the image recorded from the Goniometer is in the 2D plane, hence, care is taken to focus the image on to the Goniometer screen to minimize the errors on the recorded image. To estimate the contact angle, the contact line (baseline) at the droplet and surface interface needs to be located precisely. Hence, the interfacial contact line is introduced on the recorded image and the best curve technique is used to fit the droplet shape in a function so that the contact angle can be determined precisely from the fitted function while using the early formulation [16], i.e.: , here δBL is baseline tilt angle (due to correction of horizontal positioning), Δy is the vertical space between mathematically fitted curve (circle) and center of the fitted circle, and R is the radius of the fitted circle. The contact angle measured on the hydrophobized surface is about 153° ± 3° and hysteresis are 3° ± 1°, the measurements were repeated eight times at different locations over the surface and the contact angle variation is about 3°. Hence, a hydrophobized surface via coating results in a uniform wetting state over the surface. Since the hydrophobized surface possesses nanoporous webs, it can cause inflection of the droplet liquid during the initial period of impact. The volume of inflection of droplet liquid () into nanopore sites on the hydrophobized surface can be approximated by Hagen–Poiseuille’s approach [22], i.e., , here, DH is cavity diameter, is liquid total pressure, μ is viscosity, x is the depth of liquid inflection depth, and t is the time variable. The liquid total pressure upon impact, cavity size, and fluid viscosity become important for the inflection of droplets into nanocavity sides. The total droplet fluid pressure may be approximated as the sum of the contribution of capillary, dynamic, and water hammer pressures. Moreover, the capillary pressure (PL) is the same order as Laplace pressure, i.e., PL ~ , here, γ being surface tension, θ the contact angle, and RH the hydraulic radius of the porous structure. The capillary pressure opposes the penetration of liquid into the porous structure [23]. The pressure (Ph) created under the water hammer is approximated as Ph ~ aρcvi, here, a being a constant (and it is about 5 for small volume droplets [24]), c being sound speed in the fluid, and vi is droplet velocity at impact. The pressure increase upon impact is referred to as dynamic pressure (Pd) and it is related to droplet velocity onset of impact: . After considering the nanopore site geometry being in a conical shape, droplet fluid inflecting in the porous site becomes ~ , here, dx is the incremental depth of fluid inflection. Therefore, rearranging the Hagen–Poiseuille’s equation, it yields:. It can be noted that if fluid inflection takes place in a cylindrical volume of pore-site, the total pressure yields the Laplace pressure, and Hagen–Poiseuille’s equation gives the capillary liquid inflection in a pore site [22]. The fluid inflection into nanopores can cause droplet pinning, and droplet fluid pinches off during droplet rebounding. To determine the state of the droplet fluid pinning and pinch off during impact, further tests were conducted. In this case, the droplet was squeezed in between hydrophobic (bottom surface) and hydrophilic (top surface) to the state at which the squeezed droplet has a similar shape to the impacting droplet. Later, the top hydrophilic plate was lifted vertically unless the droplet on the hydrophobic surface geometry becomes the same as before a squeezed state. Droplet behavior was recorded at high speed and analyzed from the data recorded. Figure 6a,b show the images of the squeezed droplet (Figure 6a) and the droplet adhering on the hydrophobic surface (Figure 6b). It can be noted that as the top hydrophilic plate is lifted, the droplet fluid adheres to the hydrophobic surface (Figure 6b). This may be because of the texture topology on which the droplet fluid fills the nanocavities while creating localized pinning over the coated surface. Nevertheless, no pinched-off fluid residue was observed over the hydrophobic surface.
4.2. Dynamics of Droplet on Impacted Surface
The impacting droplet kinetic energy is converted into lateral motion associated with lateral kinetic energy, deformation work, and dissipation energy because of mainly: (i) interfacial friction under shear, and (ii) pinning under the surface tension influence around the wetted line over the surface. The pinning occurs because of: (i) lateral extension of the wetted contact line, and (ii) droplet fluid inflection into micro-post arrays gap and nanocavities on the hydrophobized surface. The pinning because of droplet fluid occupation into the nanopore sites is associated with the roughness parameter (r) since the area of cavity sites on the hydrophobic surface is related to projected area minus the area covered by pillars, i.e., the ratio of area covered by the nanocavities over the projected area becomes ~(1 − r). Since r for the hydrophobic surface is about 0.52, therefore, the area covered by the nanoporous-like nanocavities is an almost similar order of the pillars area. This demonstrates that droplet pinning over the surface of the micro-post pillars affects the droplet kinematics upon impact. Moreover, the fluid inflection in between the micro-post array gaps occurs because of pressure created in the droplet fluid upon impact. The area ratio () determining the fraction of post area () over the projected area () for the micro-post arrays is (Figure 1f):
In addition, the area ratio of the total micro-posts surface over the projected area yields:
Here, a is the length of the micro-post, b is the gap length (spacing between two-consecutive micro-posts), and h is the height of the micro-post. The droplet fluid penetration into the micro-post array gaps is related to droplet inflection height upon impact. The inflection height (meniscus height of the droplet in between the micro-post gaps) is formulated and the mathematical arrangements are given in the appendix. The equation describing the meniscus height becomes (details of derivation in Appendix B):
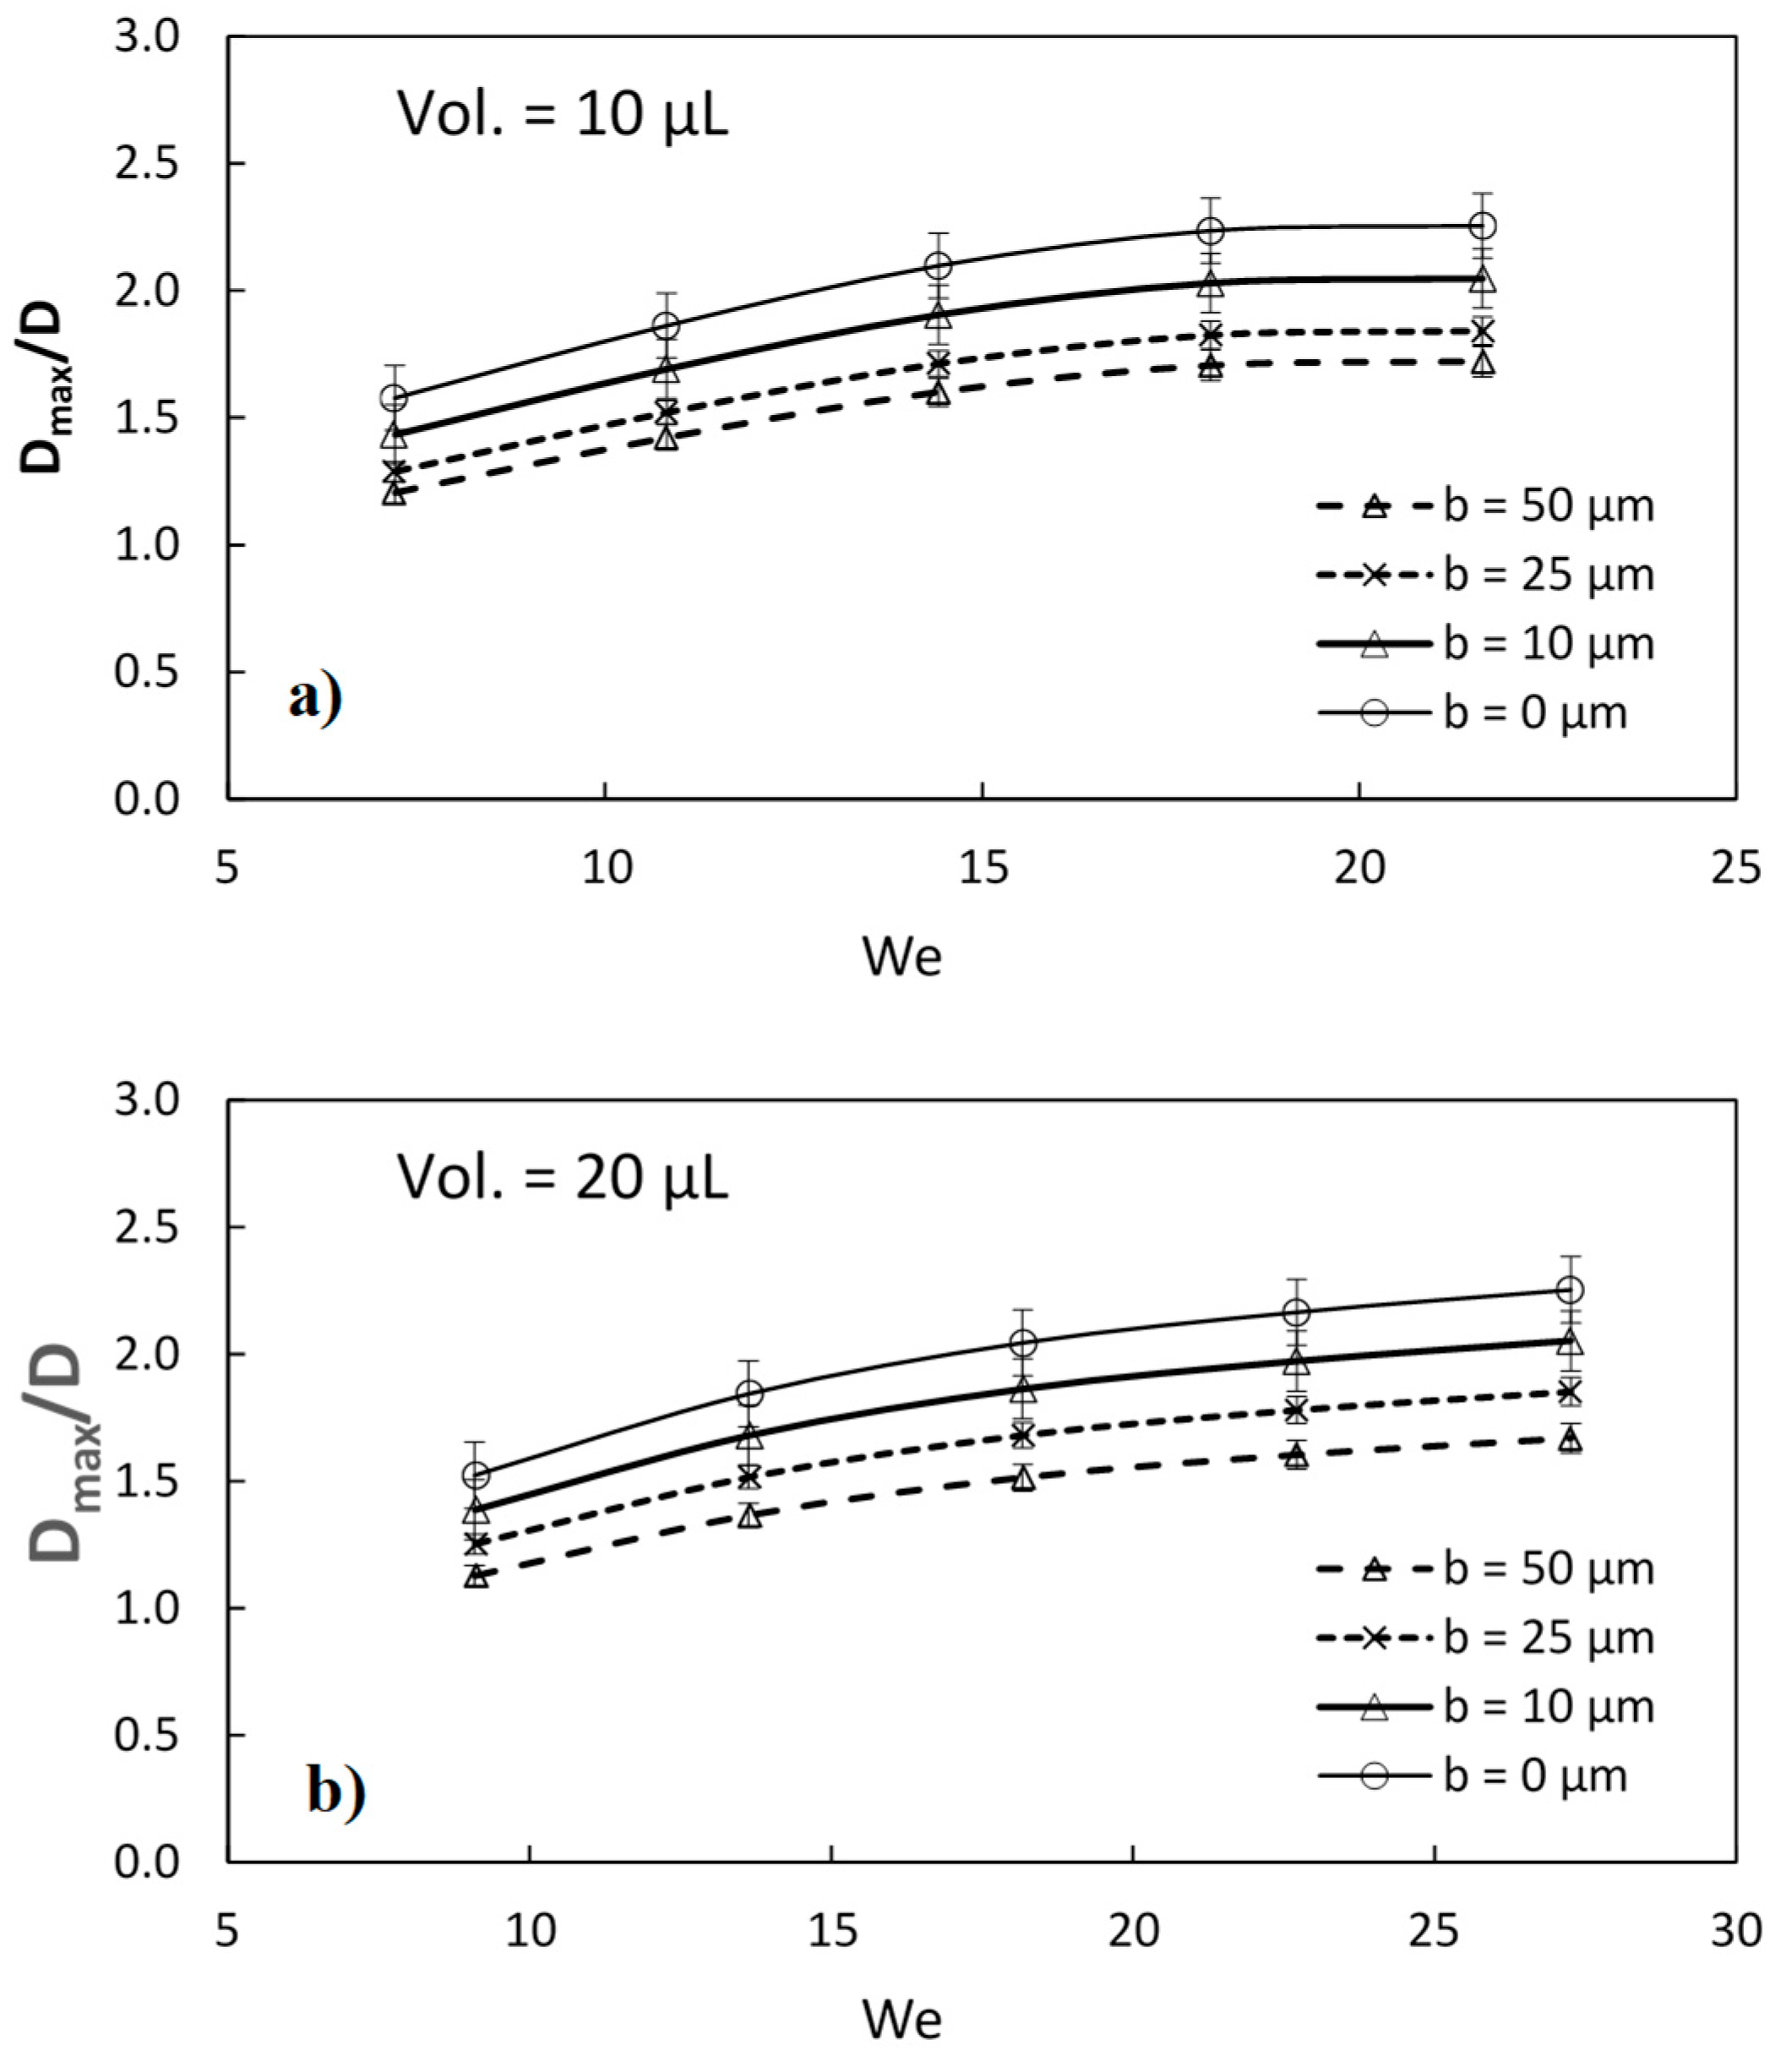
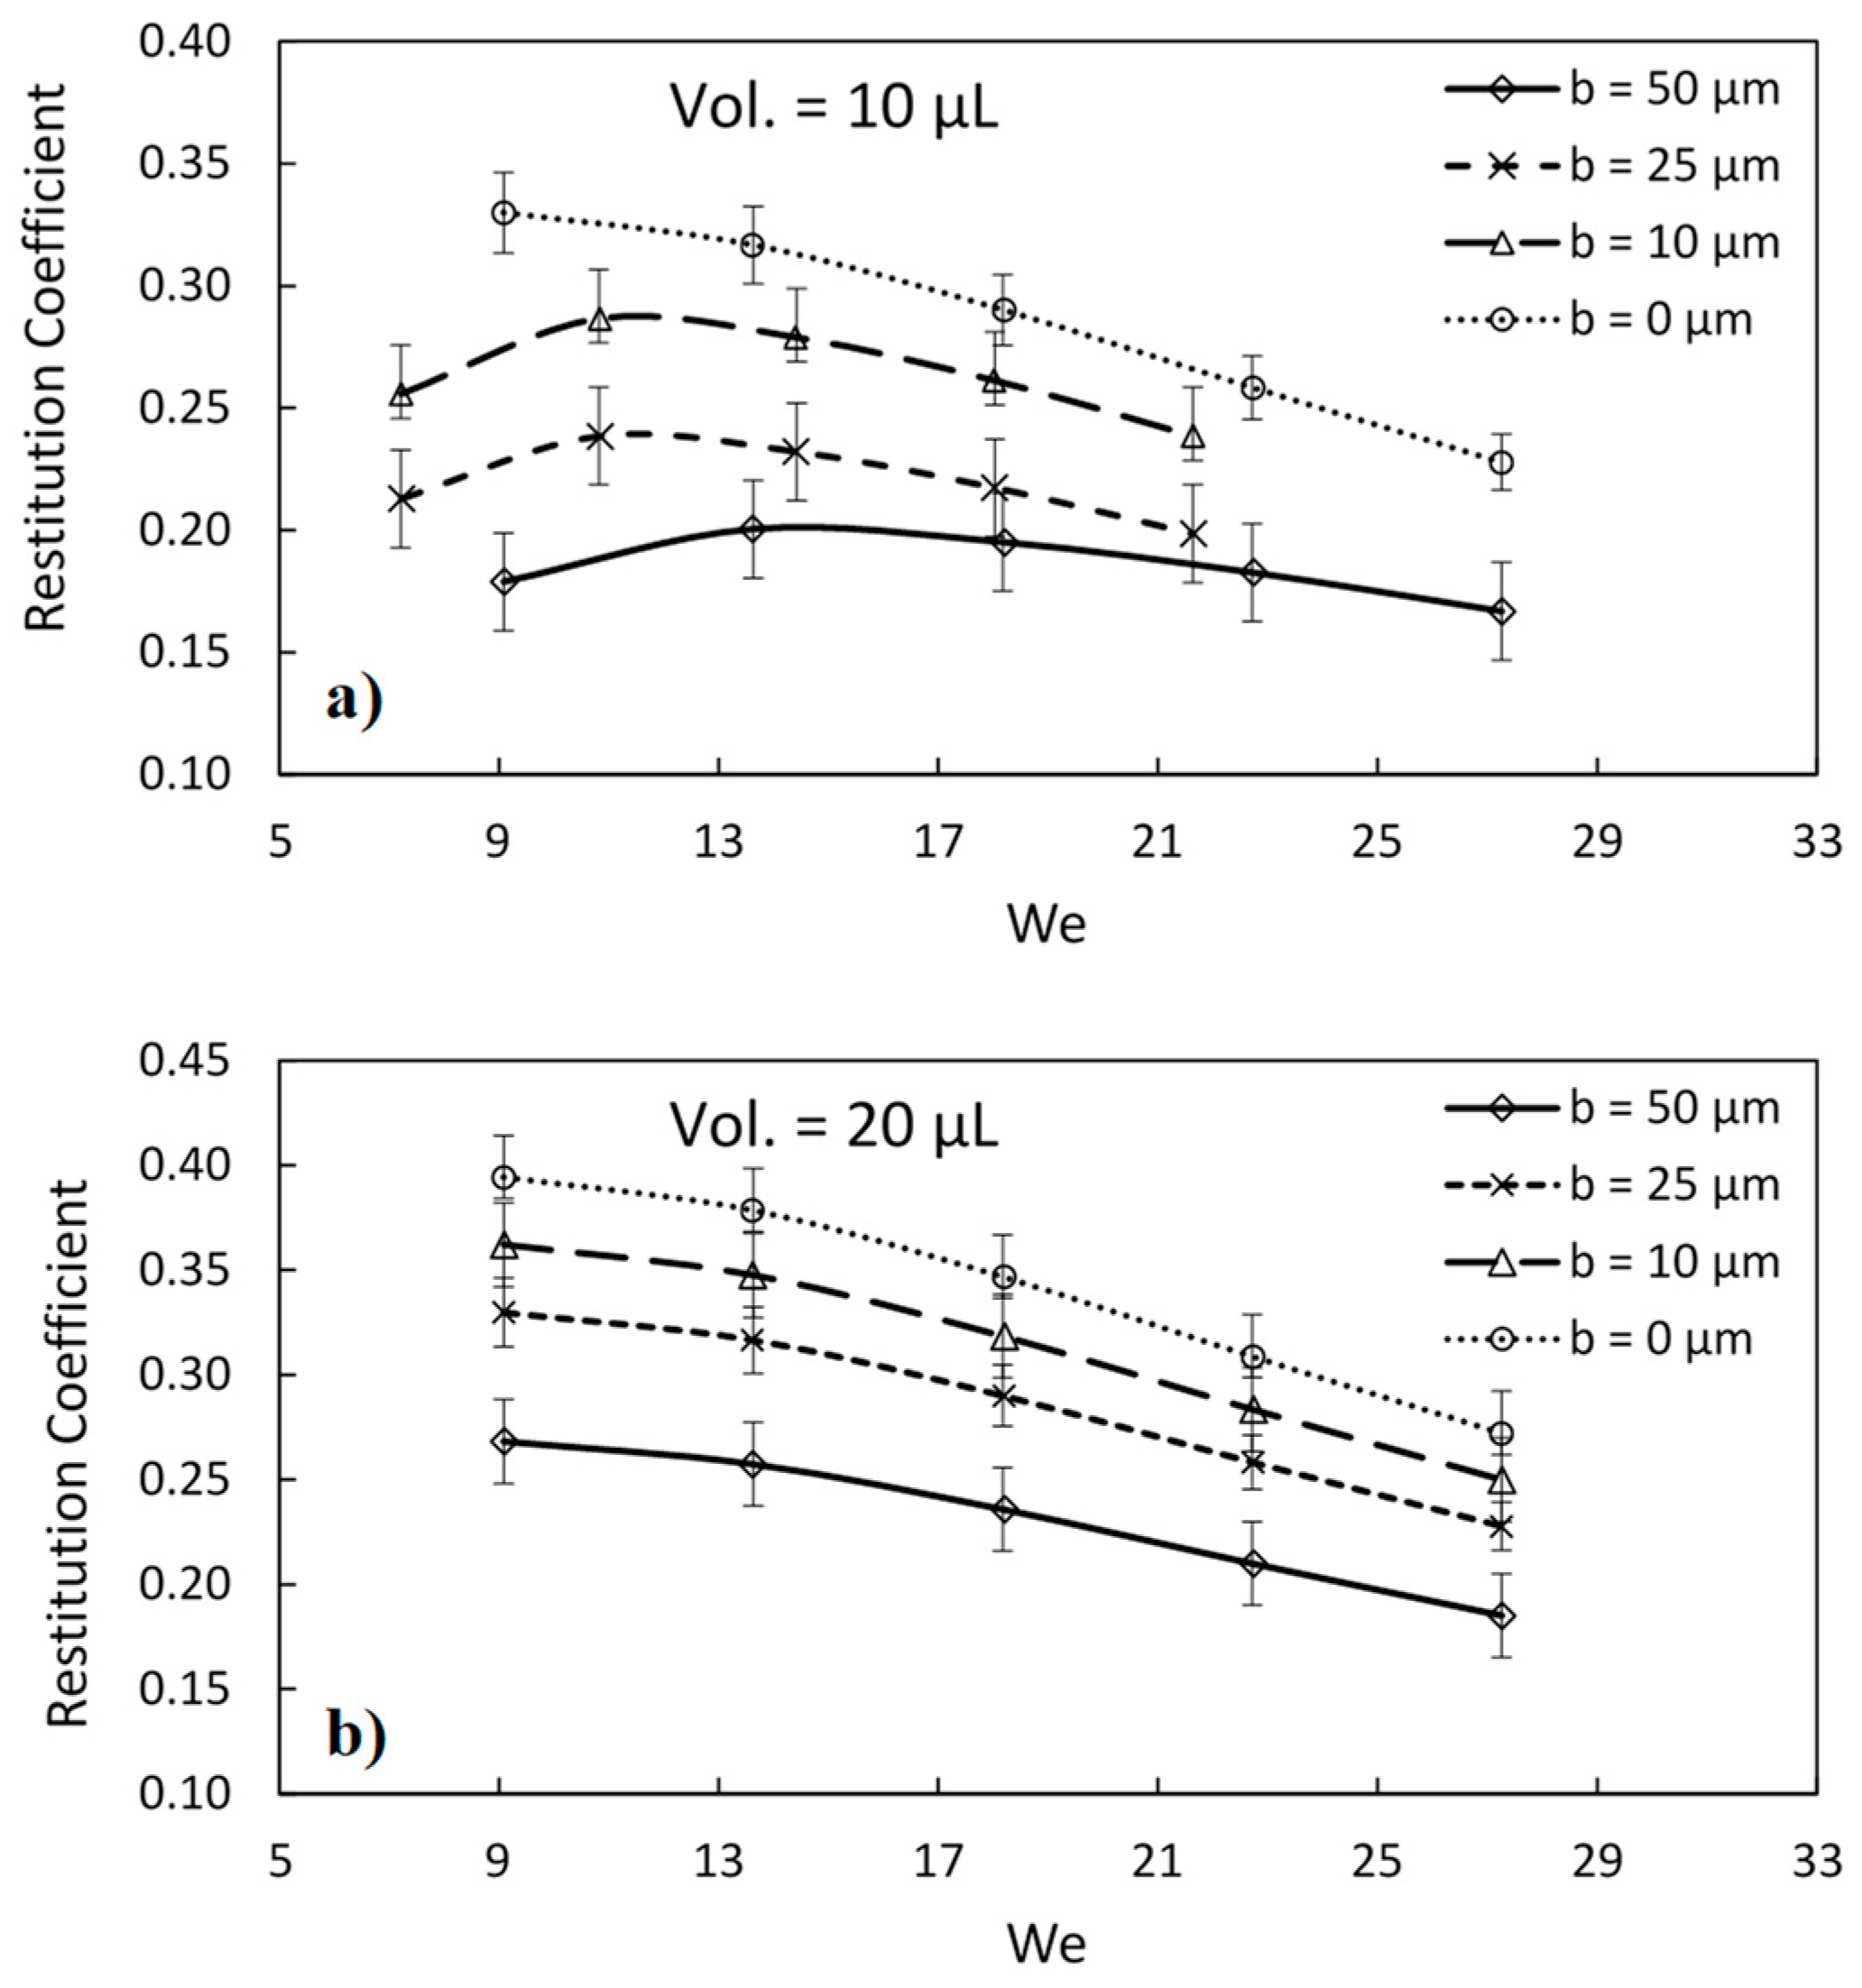
Equation (12) is an algebraic equation, and the solution of the equation depends on micro-post geometric features (post spacing, post height, and post width). The geometric configuration of micro-post arrays considered in the present study reveals that the meniscus height of the droplet fluid well exceeds the micro-post gap height (10 μm). Hence, droplet fluid reaches the bottom of the micro-post gaps upon impact. Consequently, penetrated fluid within the micro-post array gaps influences the droplet spreading, retraction, and rebounding characteristics. Figure 7 shows the experimental data of the spreading factor (Dmax/D) of the droplet with Weber number for various micro-post array spacing (b). The spreading factor increases with reducing spacing, which is more pronounced with increasing Weber number, which represents the enhanced droplet inertial force. Hence, the volume of occupation of the inflected droplet fluid in micro-post array gaps increases with increasing Weber number. Similarly, an increase of micro-post spacing enhances the inflected droplet fluid volume in between micro-post gaps. This demonstrates that a large volume of penetrated fluid in the micro-post gaps results in reduced spreading and lowers the maximum spreading diameter on the impacting surface. Enlarging droplet size also slightly reduces the spreading factor. Moreover, the volume of fluid penetration becomes less as the micro-post gap spacing reduces. This is caused because of: (i) volume occupied by the impacting droplet fluid becomes small for short spacing of micro-post gaps, and (ii) the fluid penetrated micro-post gaps have a curvature feature over the penetrated fluid top because of surface tension while creating an air gap between the penetrated fluid and the micro-post gap surface. Figure 8 shows experimental data of restitution coefficient variation for different micro-post spacing and two droplet volumes. It is worth mentioning that the restitution coefficient represents the kinetic energy ratio of the droplet onset of rebounding and impact. In general, the restitution coefficient reduces as Weber number increases, provided that some small increase in the restitution coefficient is observed for small volume droplets (10 μL) at low Weber numbers (We < 13). This increase disappears as the droplet volume increases to 20 μL. In this case, the inertial force increase contributes to the kinetic energy of the rebounding droplet. Hence, for the large volume droplet, the kinetic energy dissipation during spreading and retraction periods become smaller as compared to the kinetic energy at impact. Moreover, increasing micro-post spacing allows a large area of contact between the droplet fluid and the gap bottom surface. This in turn enhances the droplet fluid contact line at the gap bottom and droplet pinning on the contact area becomes large because of nanopore structures on the gap surface. This adds to the kinetic energy dissipation during impact.
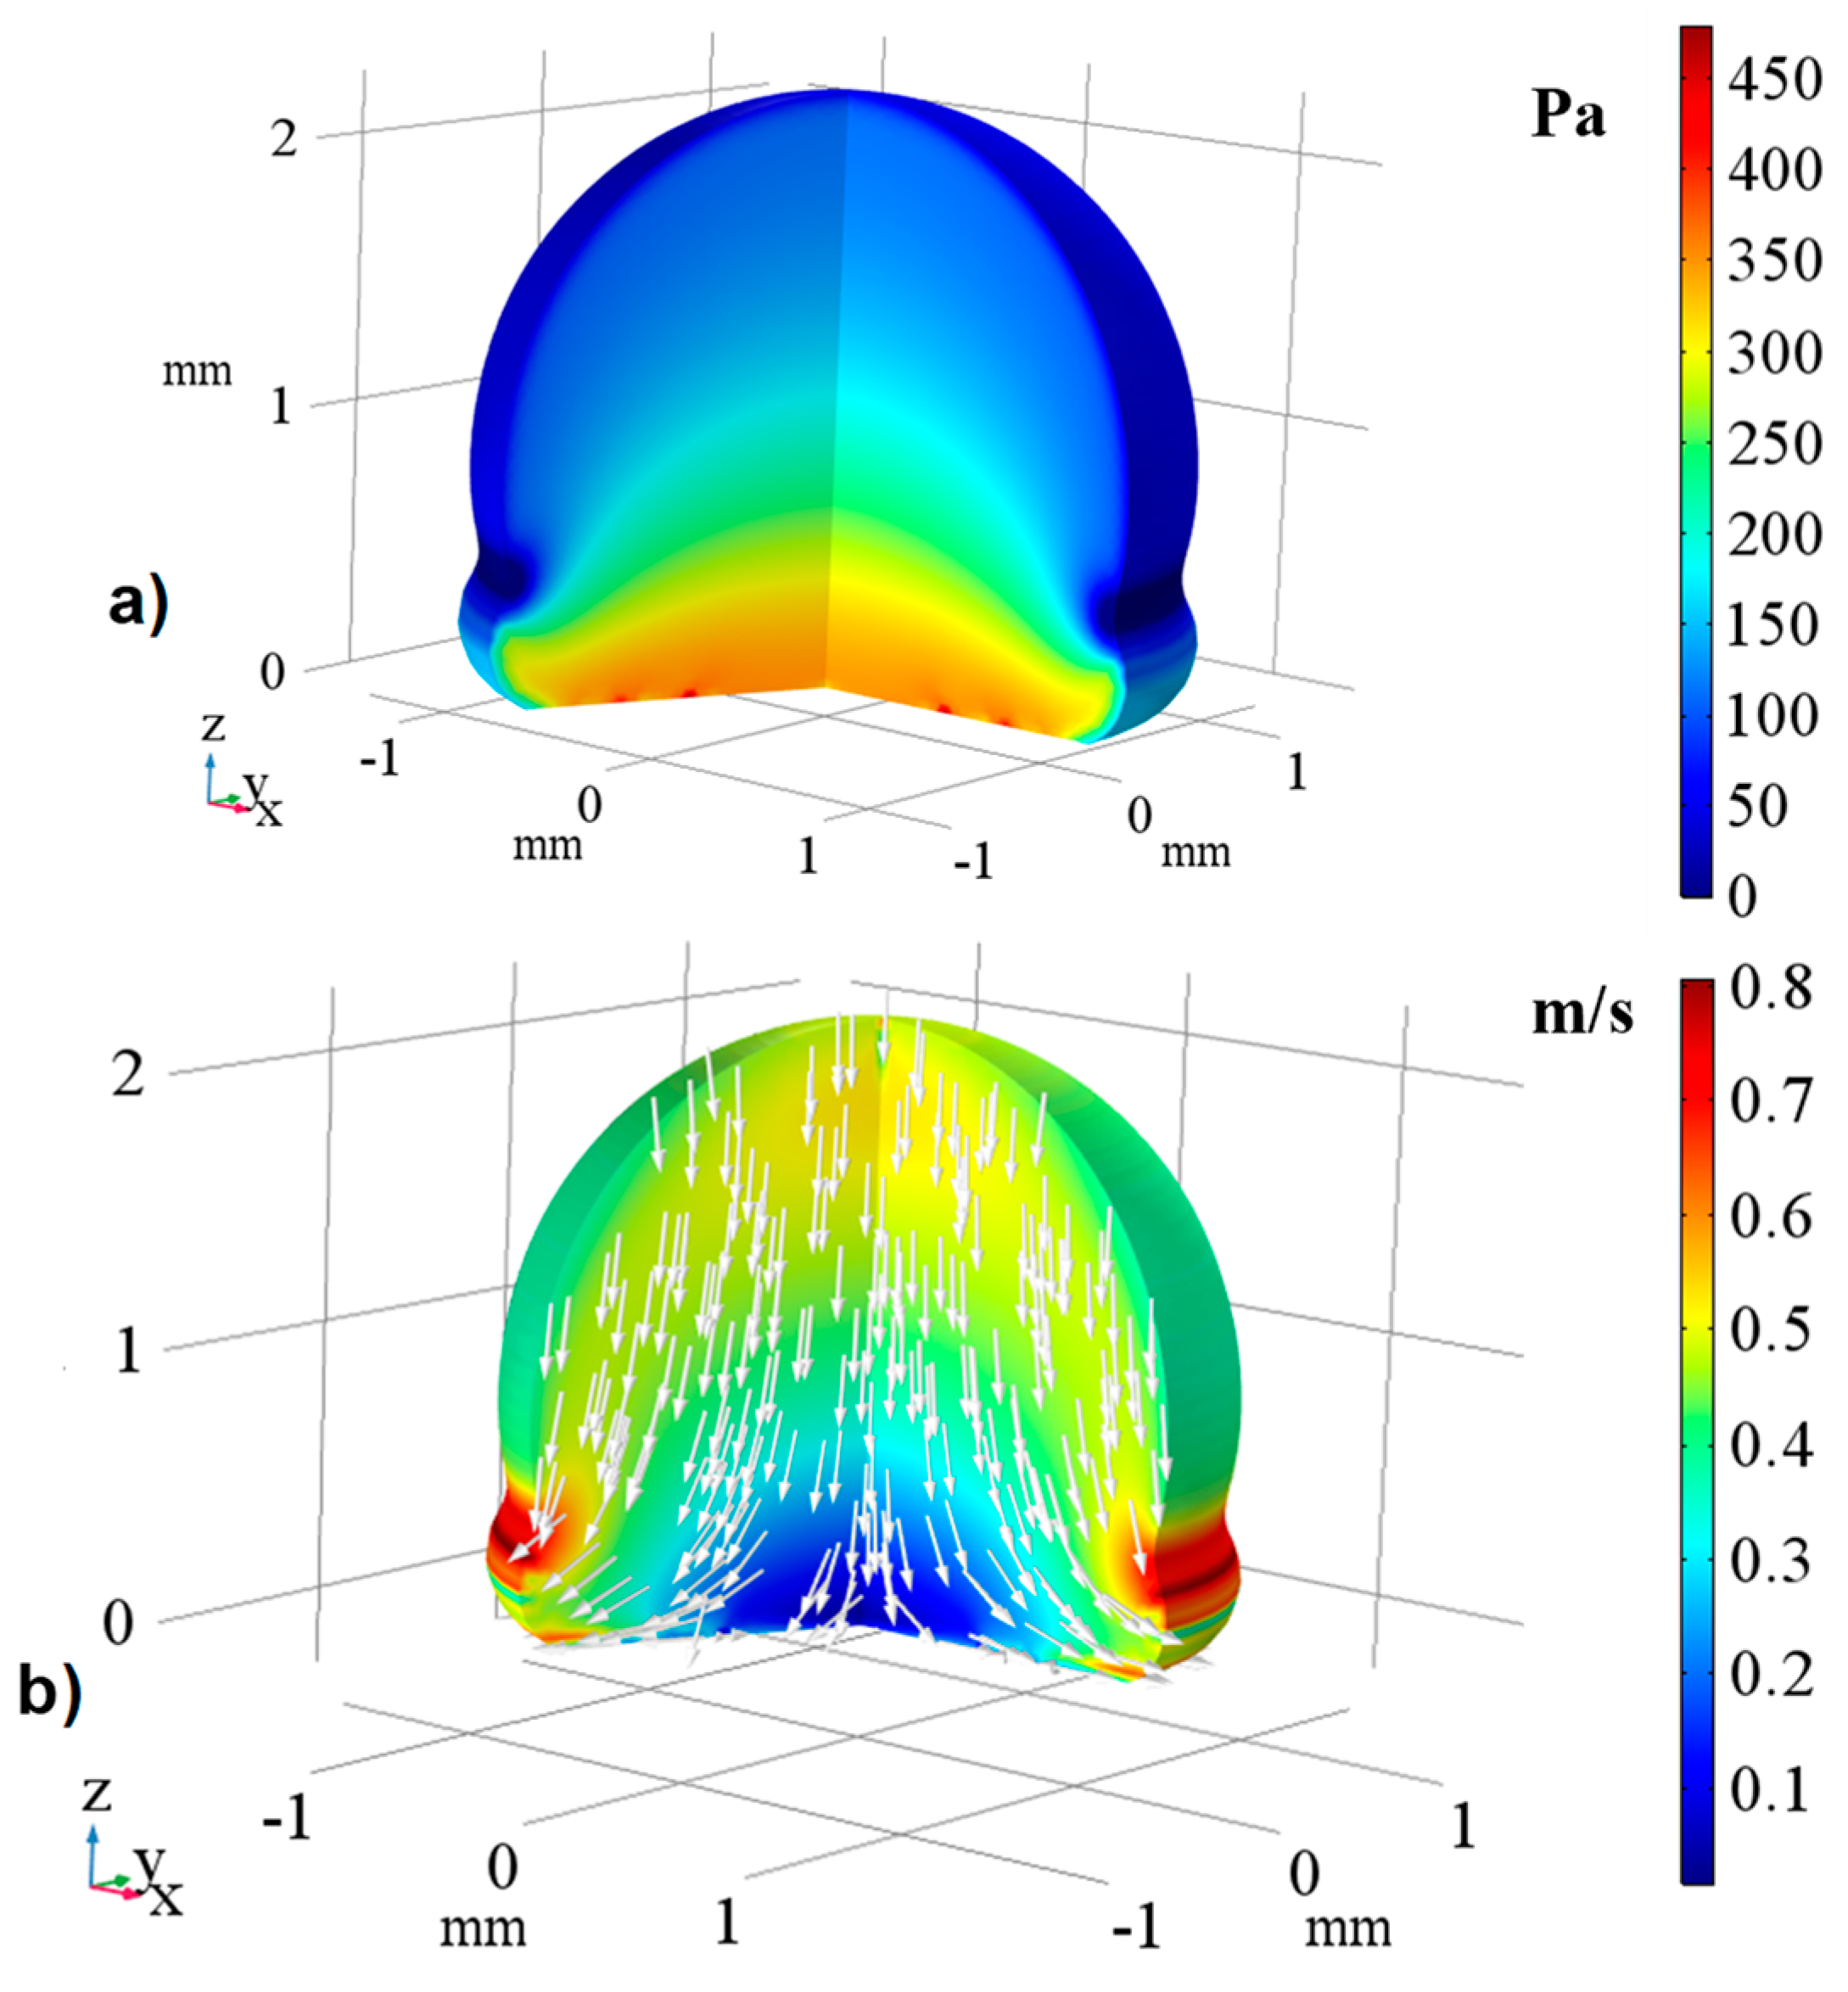
Figure 9a shows the predictions of pressure (gauge pressure) while Figure 9b depicts velocity inside the droplet fluid after t = 0.54 s of impact on the hydrophobized surface. Velocity remains zero at the impact center and in the close region of the surface. Since velocity and pressure are represented for a short period of time after the onset of impact, the direction of flow velocity is towards the surface, and pressure increase is not substantially high. However, as the impact period progresses, velocity distribution across.
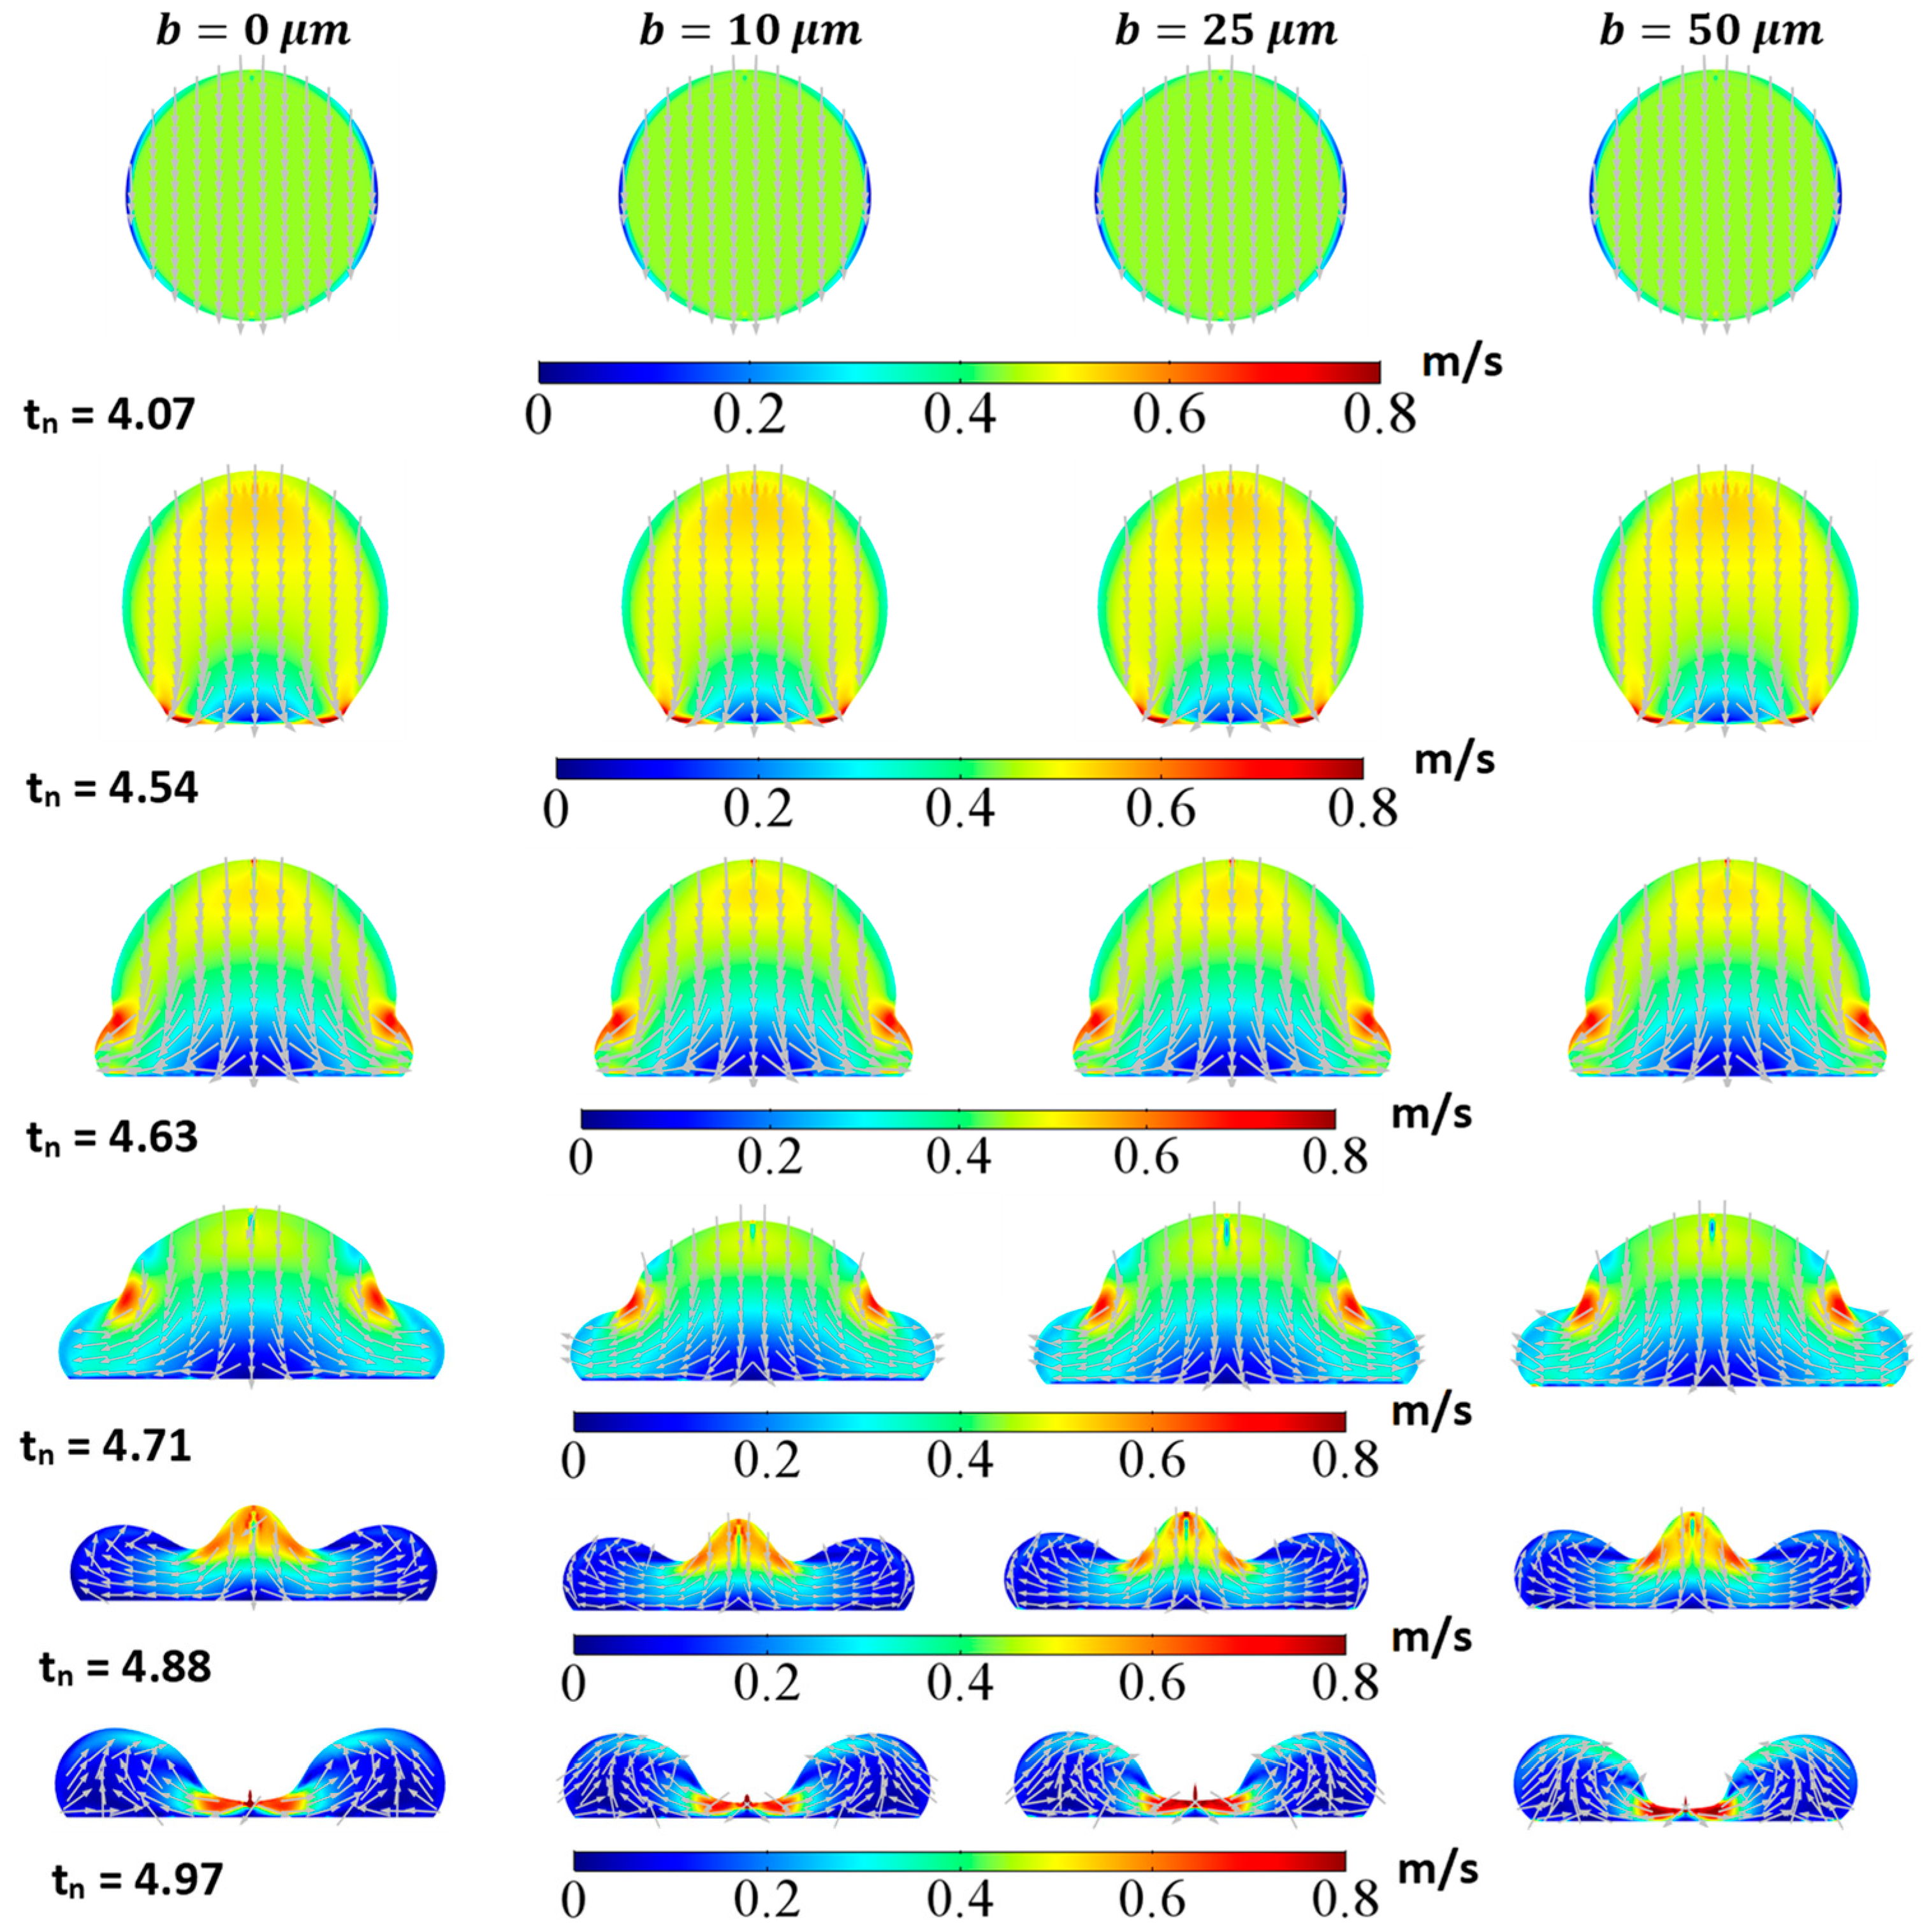
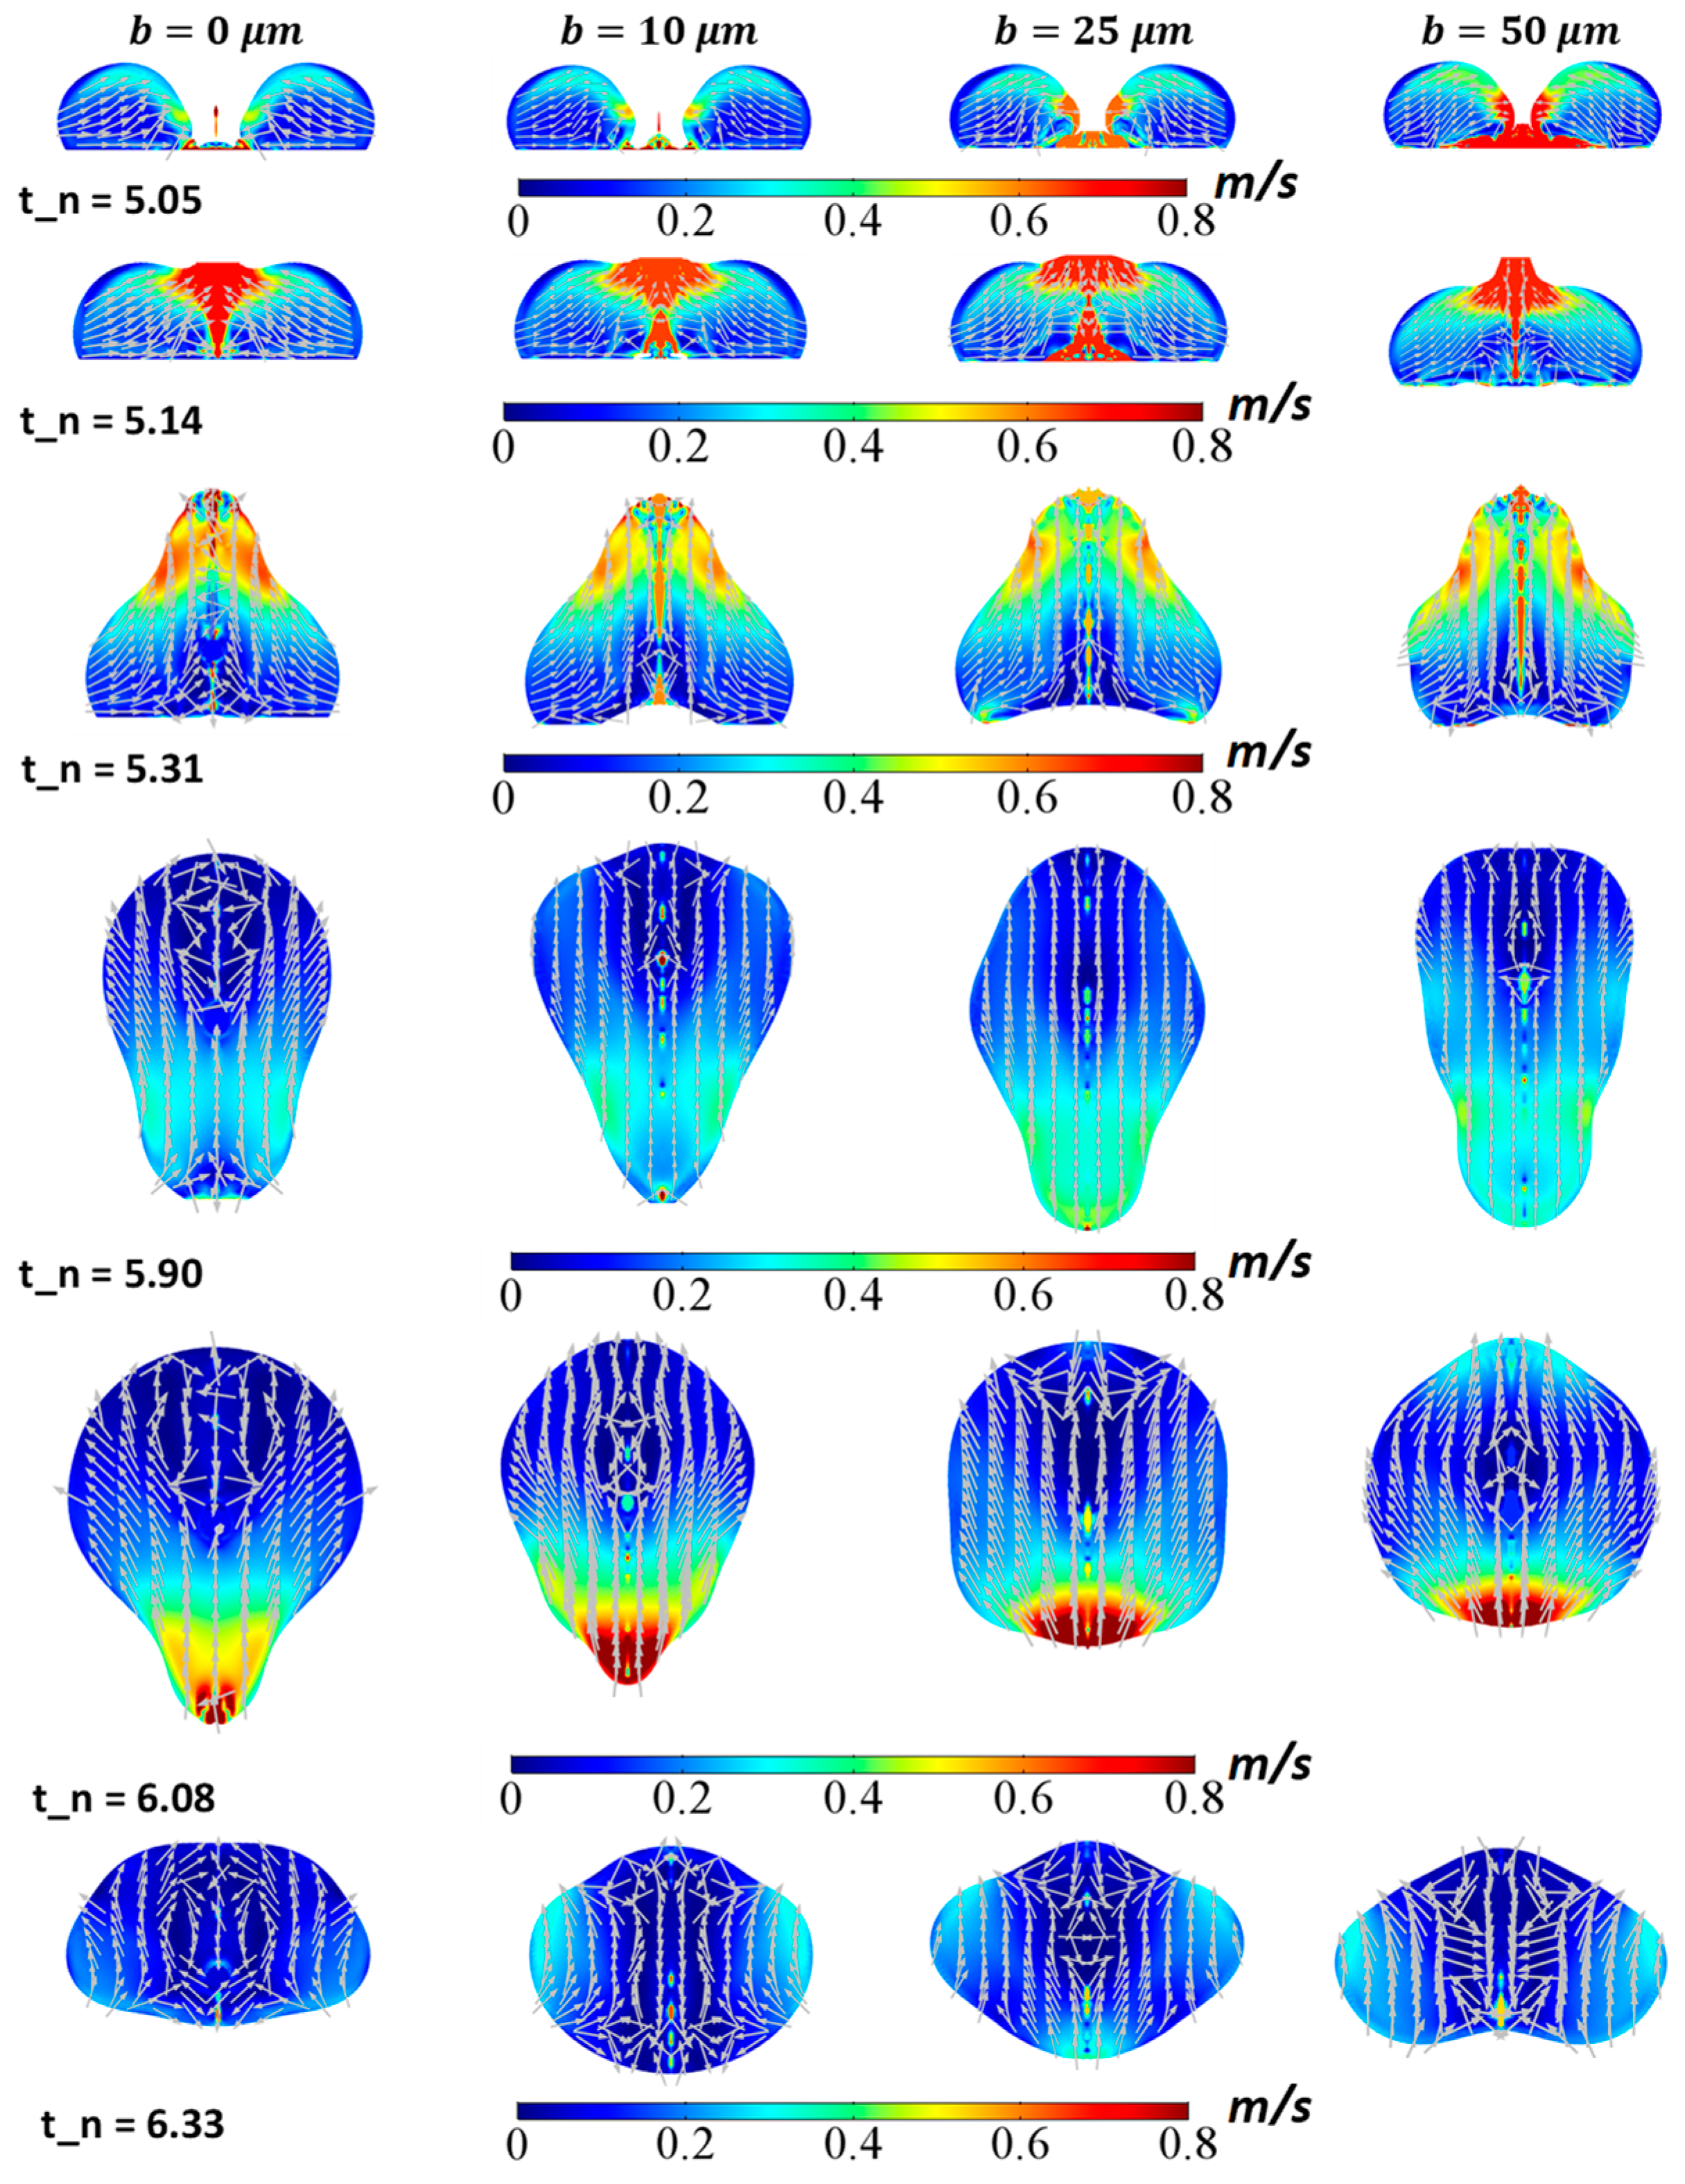
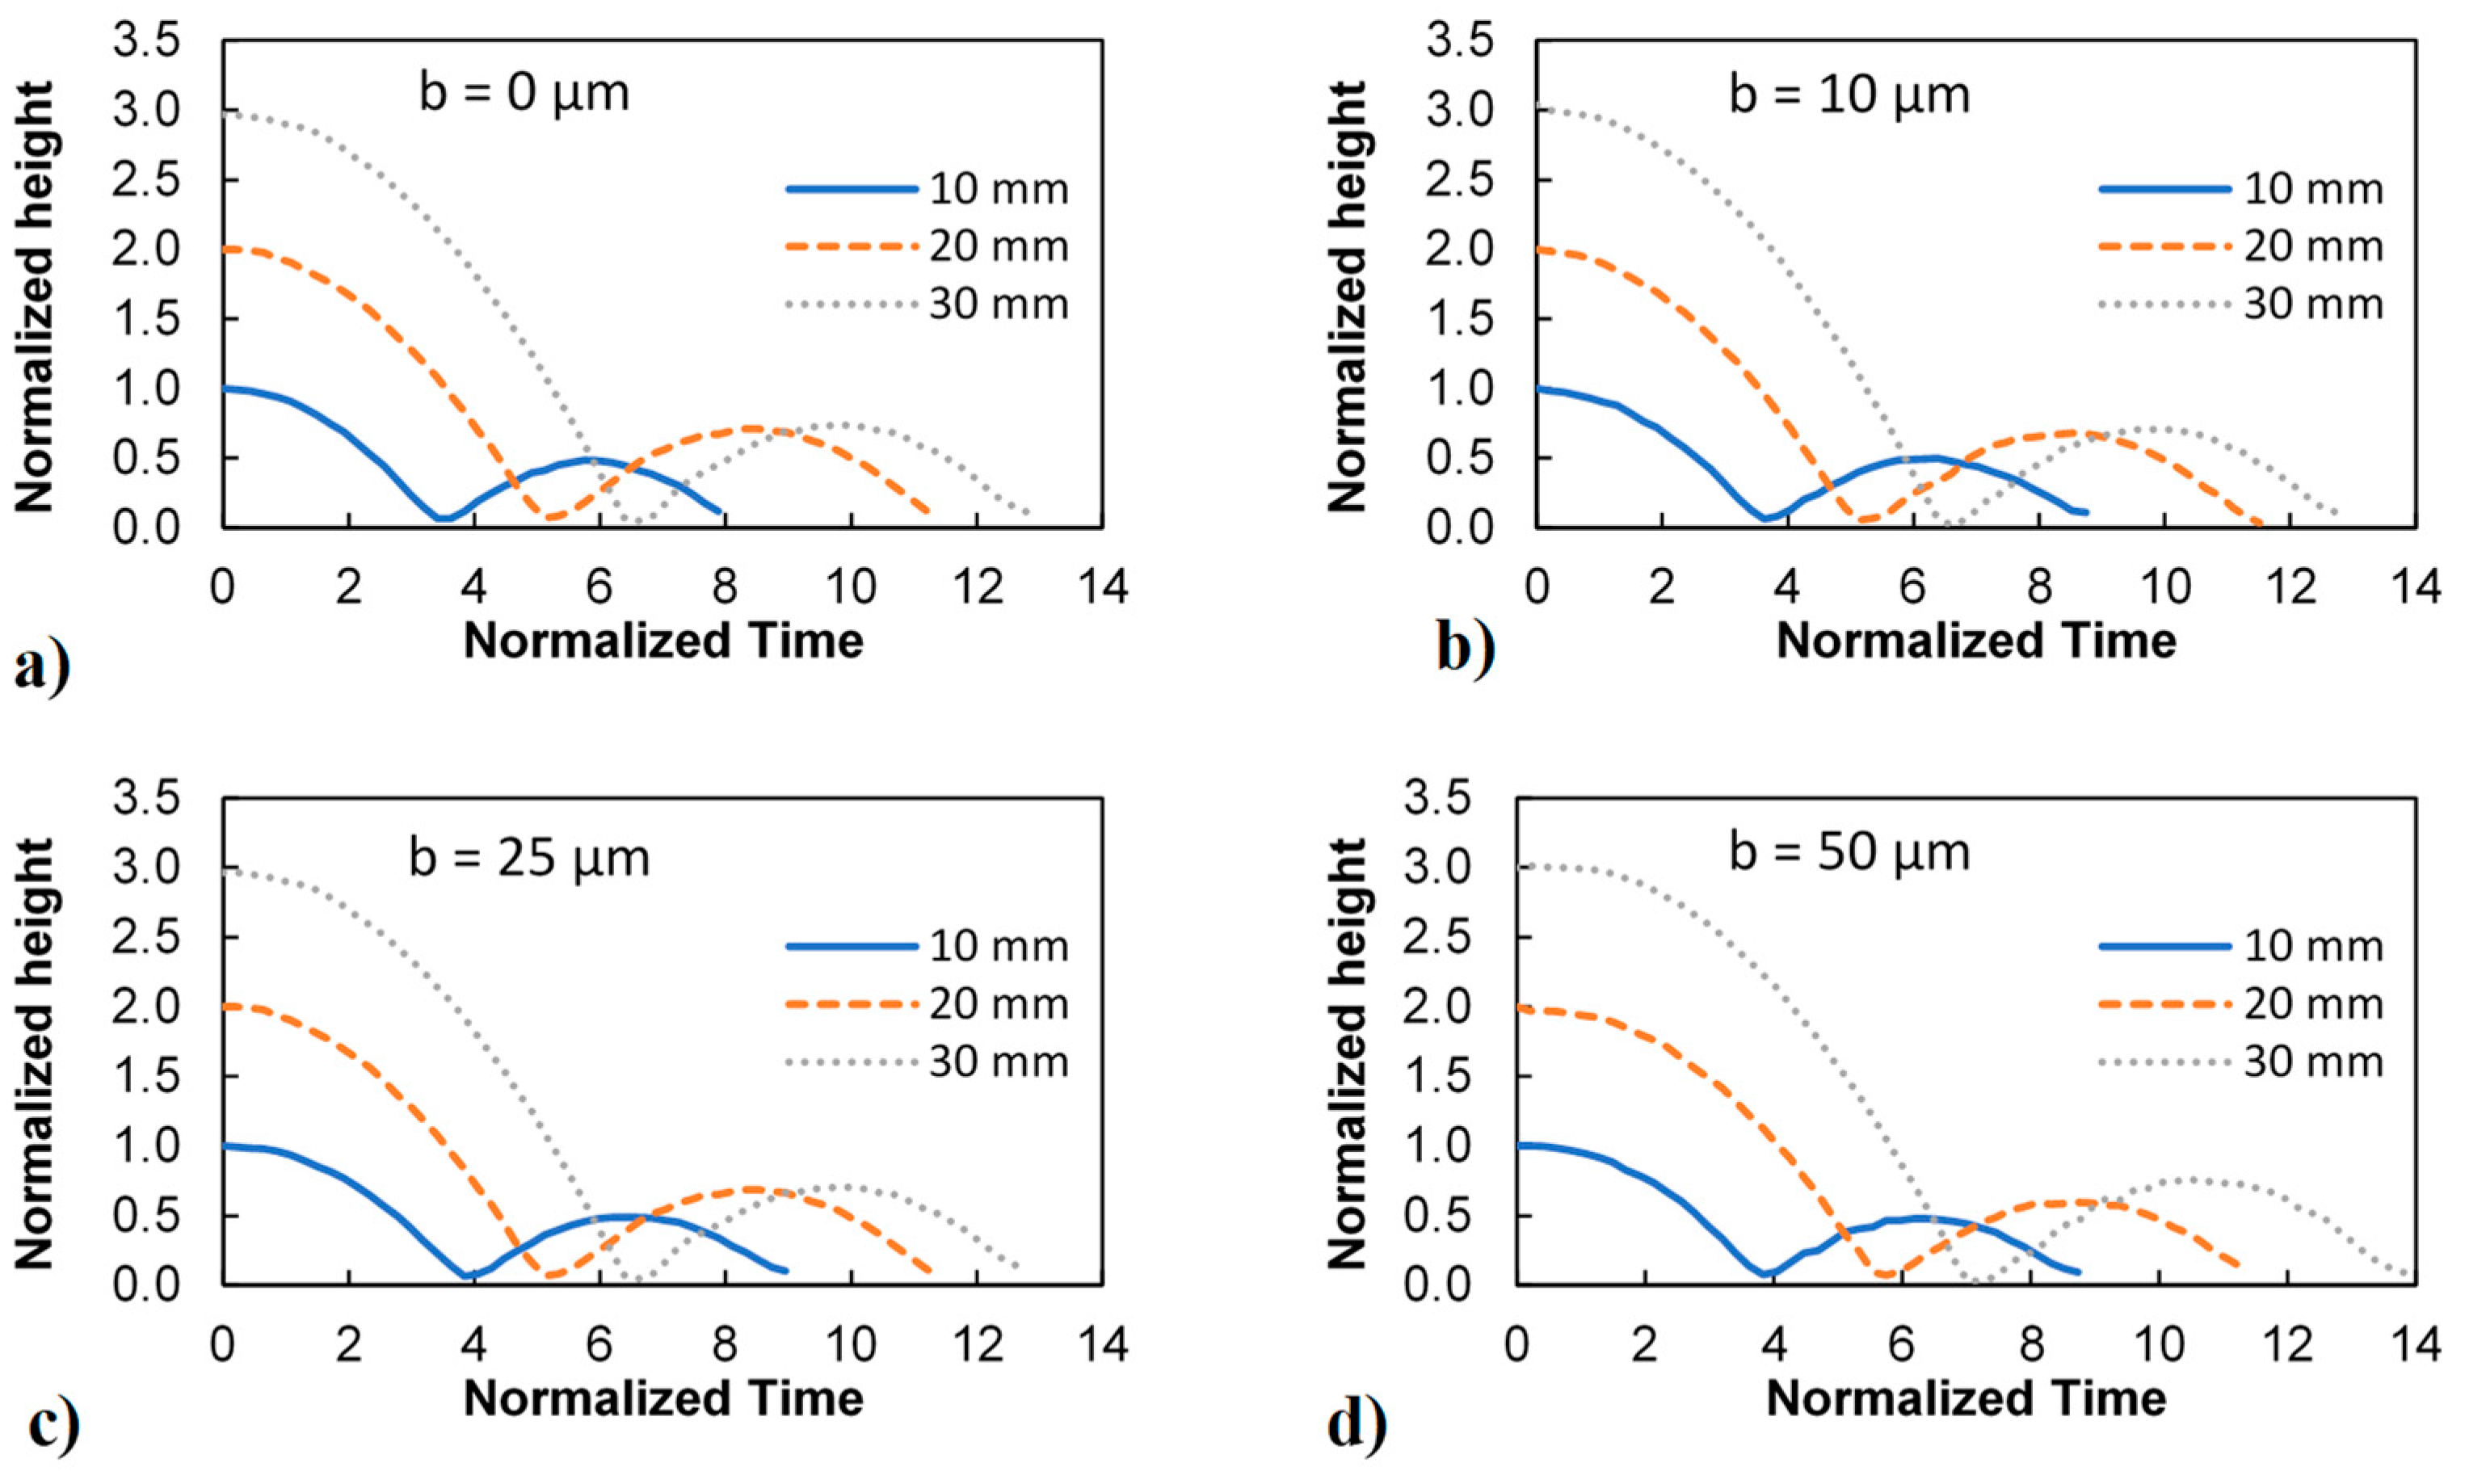
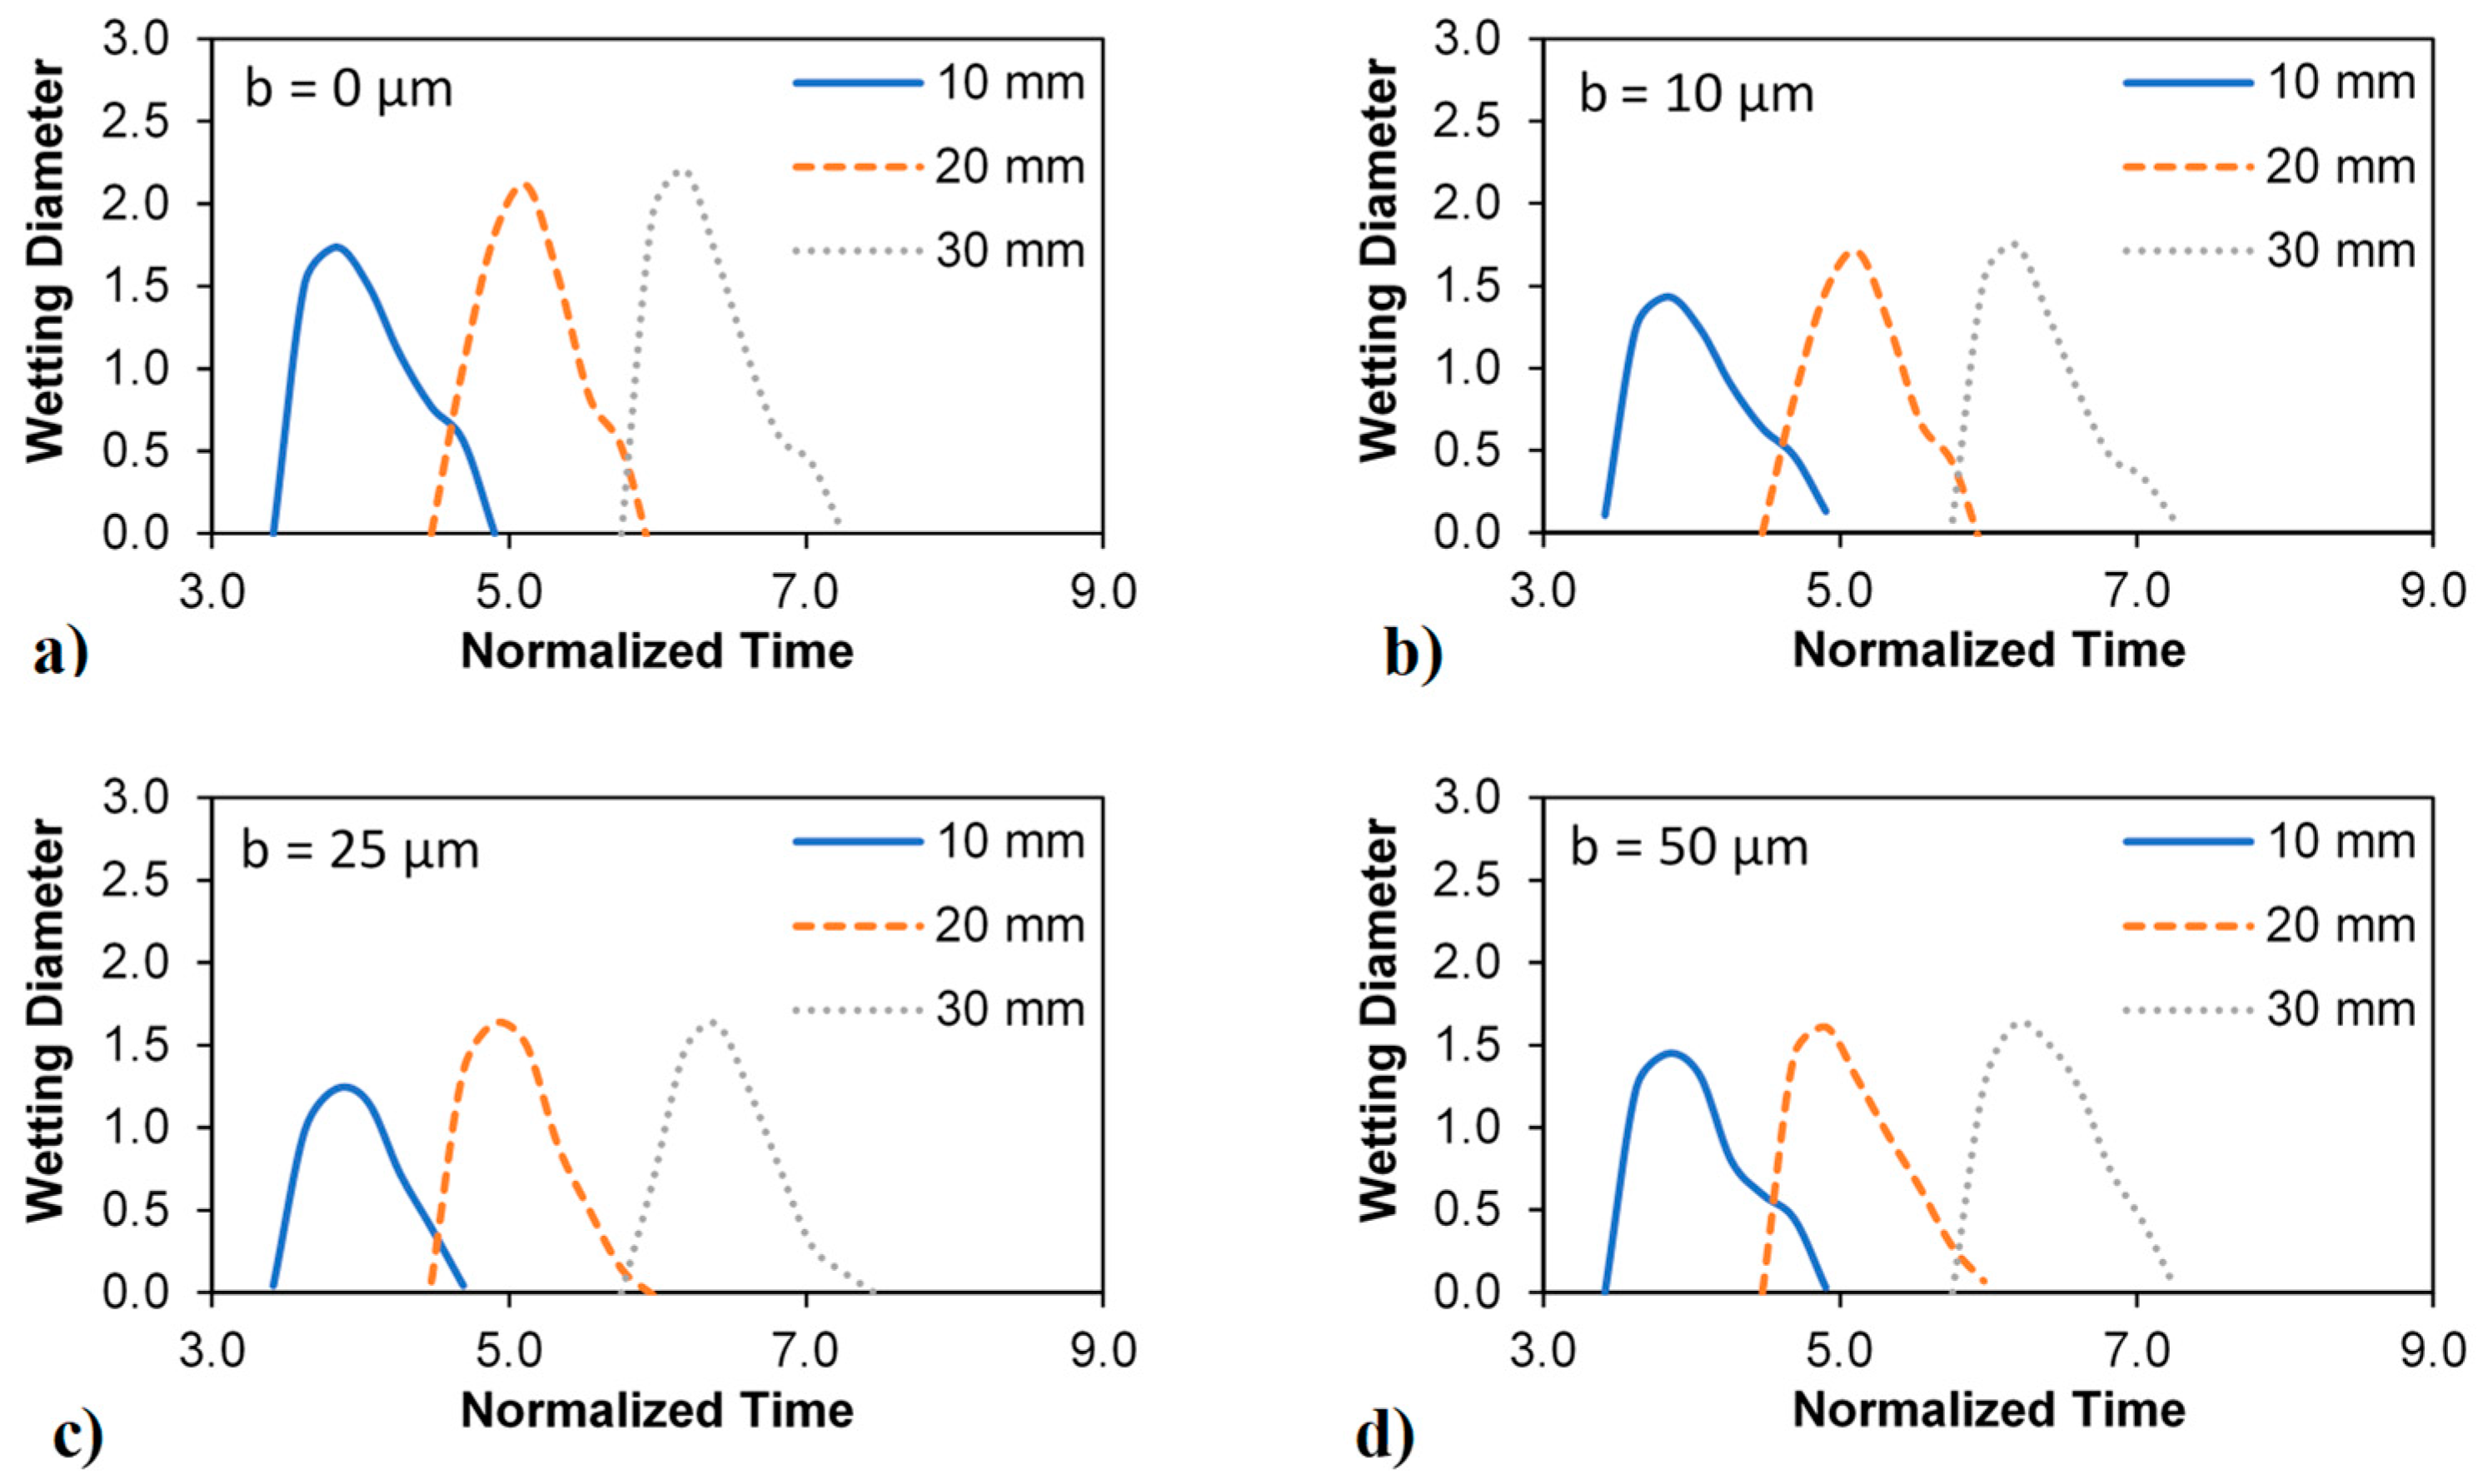
The impacted droplet changes considerably. This can be observed from Figure 10 in which the velocity field inside the impacted droplet is depicted during the spreading period. Droplet spreading over the surface gives rise to radial flow in the droplet fluid and the flow circulation has resulted in the end regions of the droplet being spread, which occurs at 10.5 ms after the onset of impact. In addition, flow velocity remains high in the central region of the droplet. This indicates that the droplet central region undergoes thinning during the spreading. However, flow behavior changes during the retraction and rebounding periods. This can be observed from Figure 11, in which flow inside the droplet during retraction and rebounding periods are shown. During the retraction period, two different flow behaviors can be distinguishable. In the early period, droplet fluid tends to flow from the expanded region towards the droplet central region, which creates two opposing flows emanating from expanded edges. With progressing time, the droplet reshapes due to opposing flows and the stagnation zone is created in the region where the opposing flow interfere. Due to flow complexity created by opposing flow currents, the stagnation zone extends above the surface forming an umbrella shaped zone within the central region of the droplet. Upon initiation of rebounding, the flow field changes towards forming the velocity vector pointing opposite to the surface. The droplet vertical expansion within the rebounding period forms a complicated flow structure inside the droplet fluid. As the droplet rebound cycle progresses, the droplet shape changes from elongated to round while forming transiently varying flow filed side the droplet fluid. Figure 12 and Figure 13 show predicted normalized droplet height and normalized droplet wetting diameter with normalized time (tn = t/tc, where tc is the capillary time, , here, a is the droplet radius) for various micro-post array spacings (b). It is worth mentioning that the droplet height and wetting diameter are normalized with the impacting droplet diameter when it is spherical, and the time is normalized with the capillary time. The normalized droplet height attains slightly larger values for the micro-post width of b = 50 μL than the other micro-post widths upon the end of the spreading period (tn = 4.97). However, the droplet normalized wetting diameter remains the lowest for the micro-post spacing of b = 50 μL. This is related to the droplet volume, which remains constant for impacting droplets. As the wetting length reduces because of fluid penetration in between the micro-post gaps, the droplet height becomes large. Hence, micro-post spacing has a notable effect on the geometric configuration of the impacted droplet.
4.3. Removal of Dust by Impacting Droplet
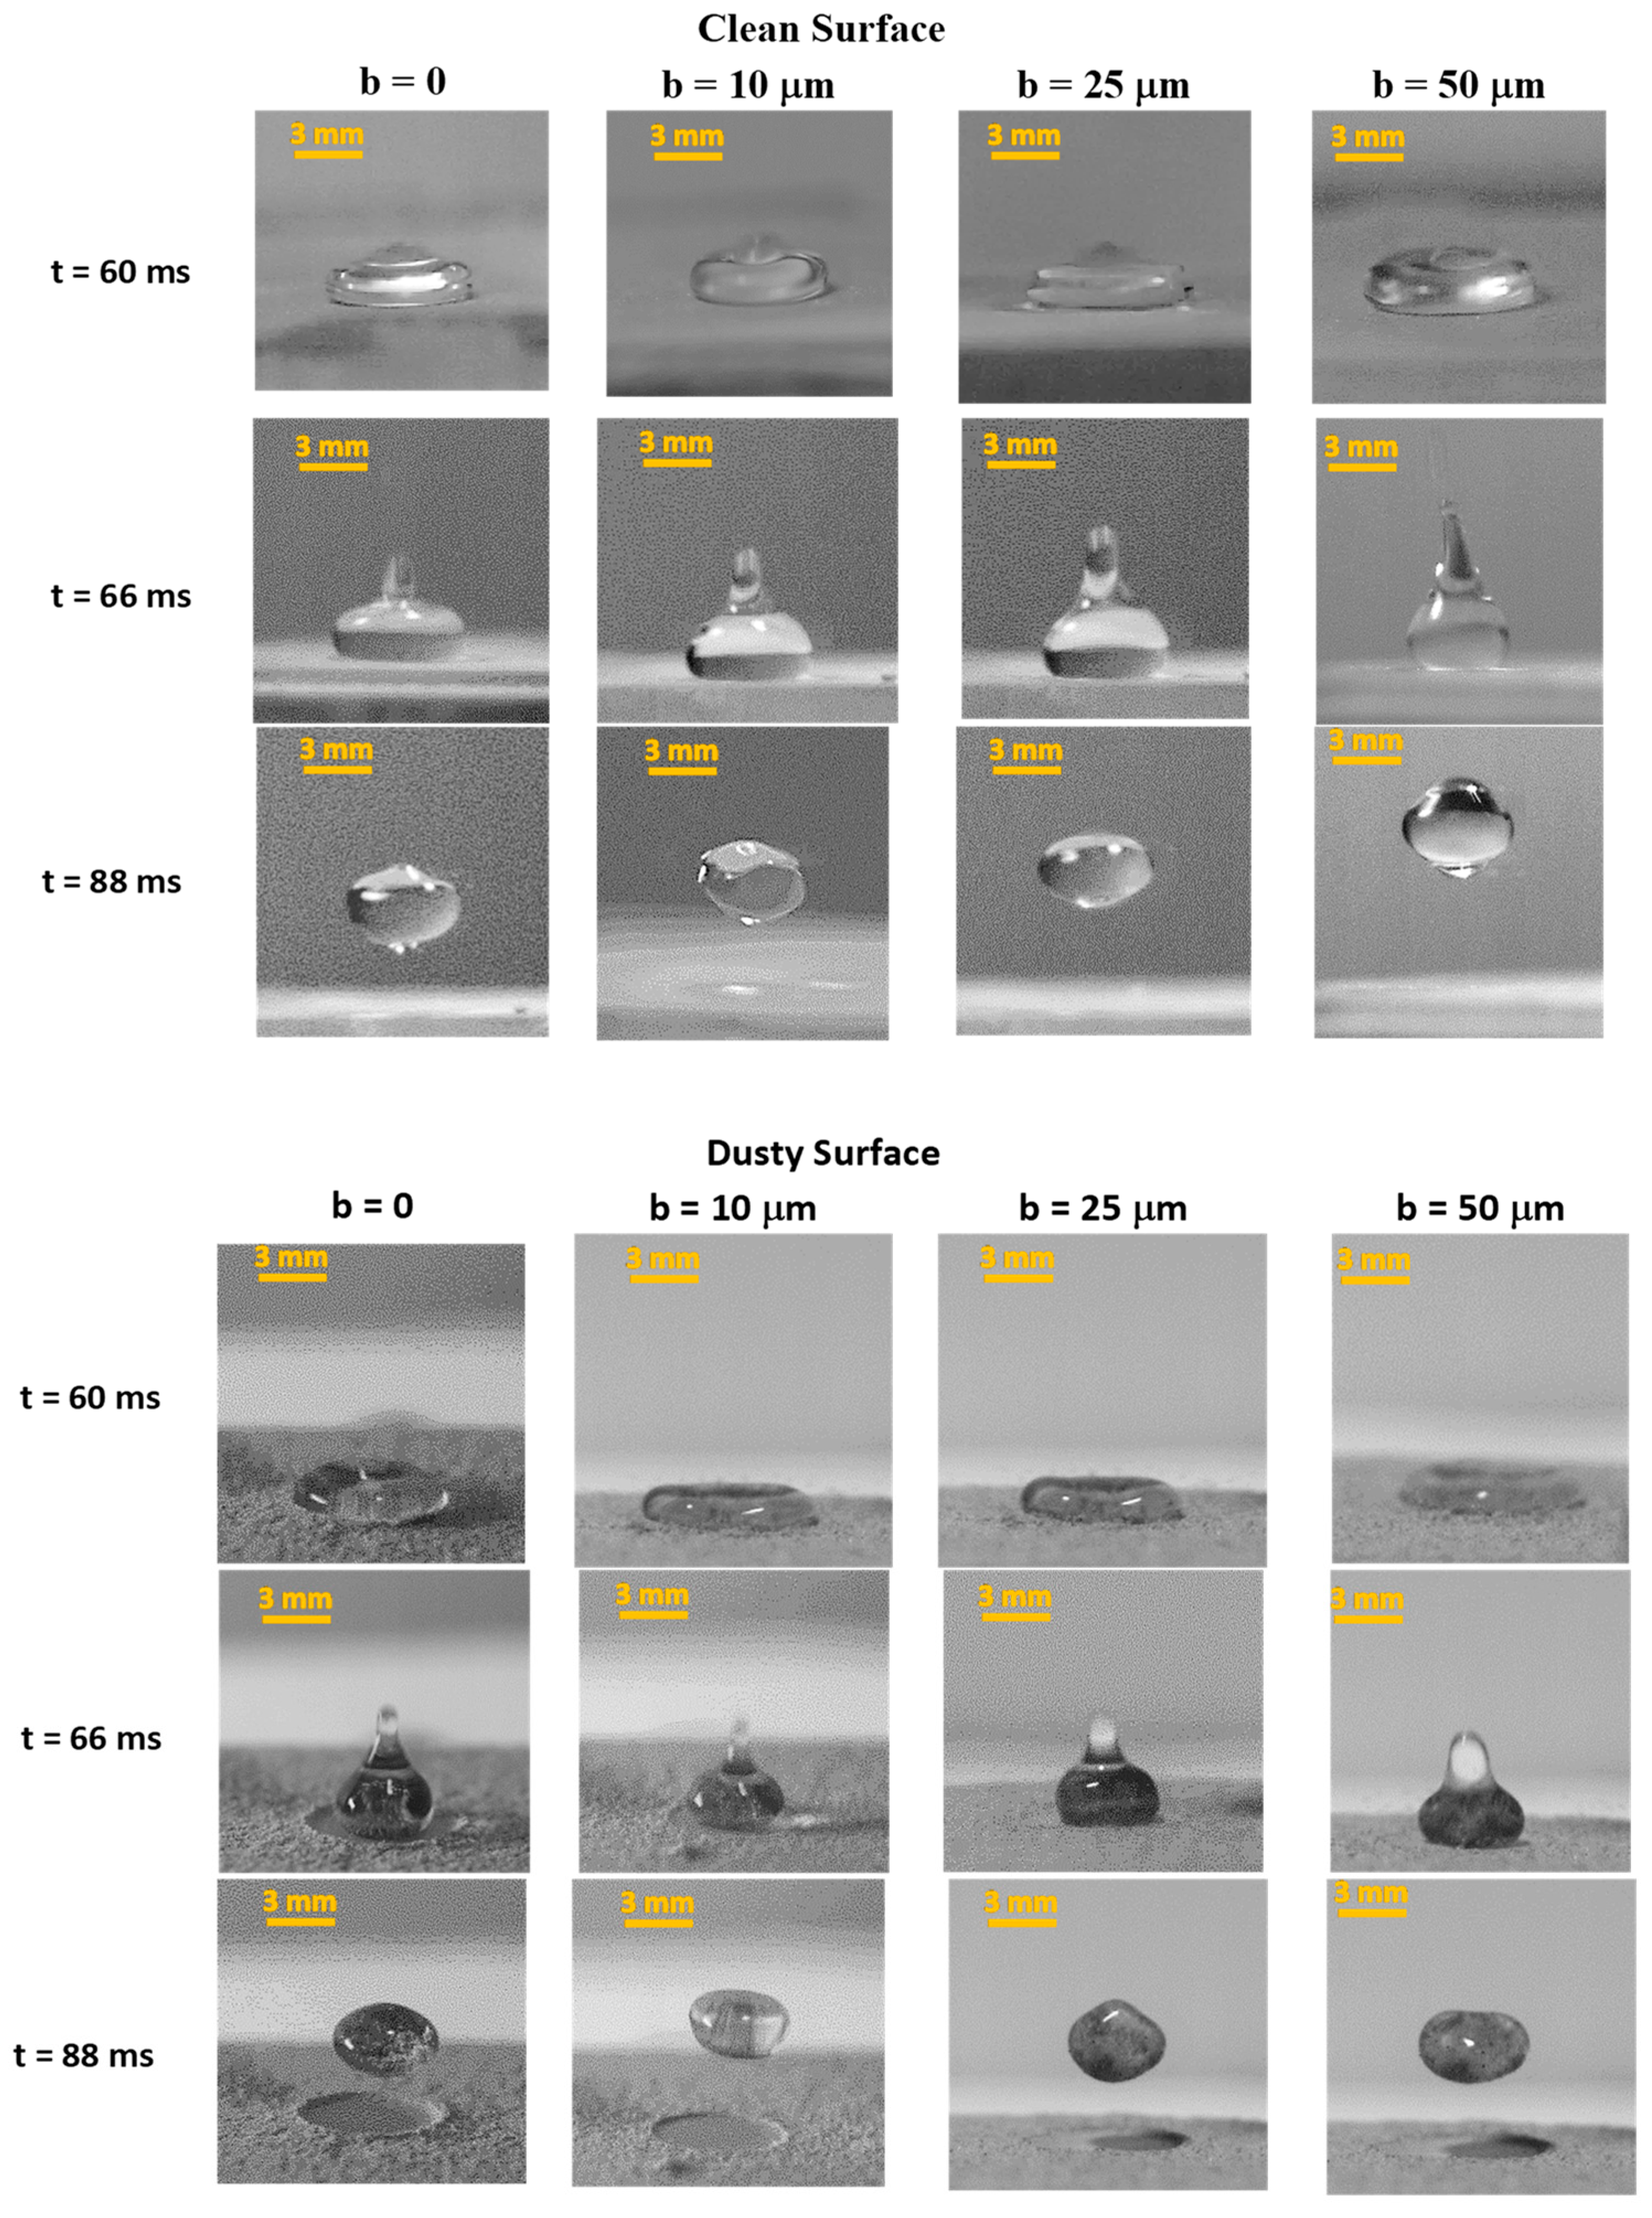
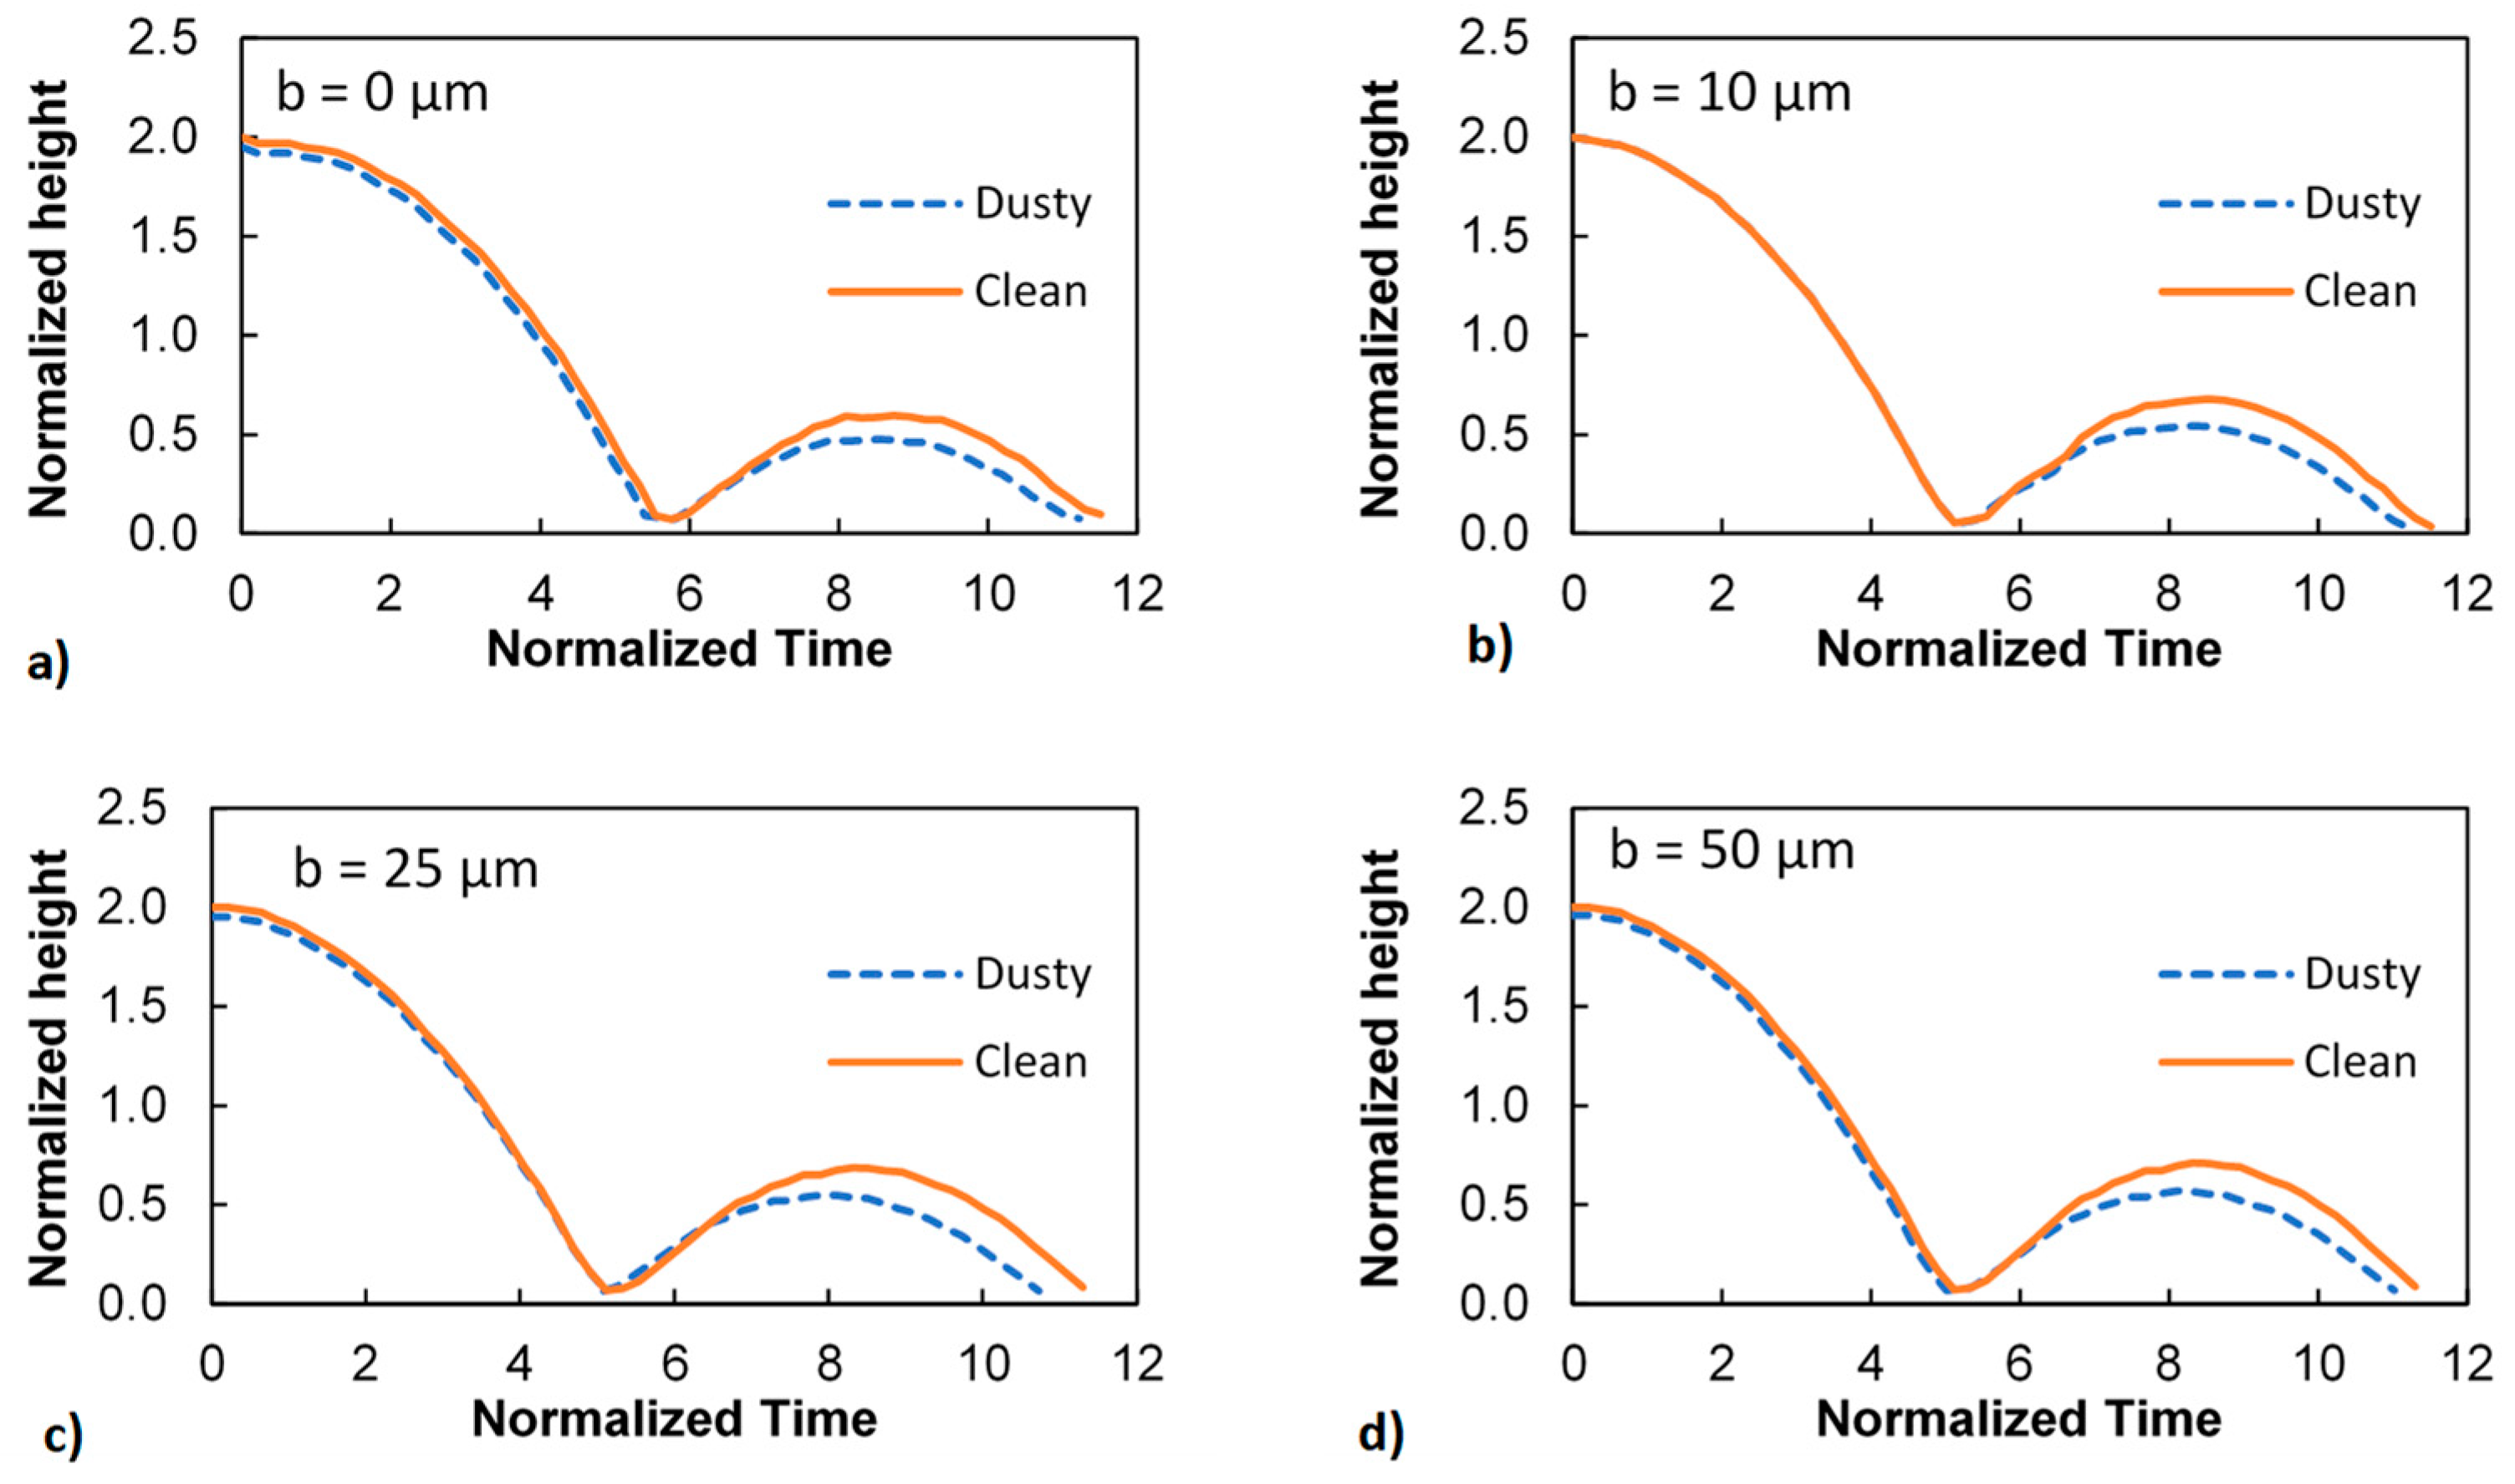
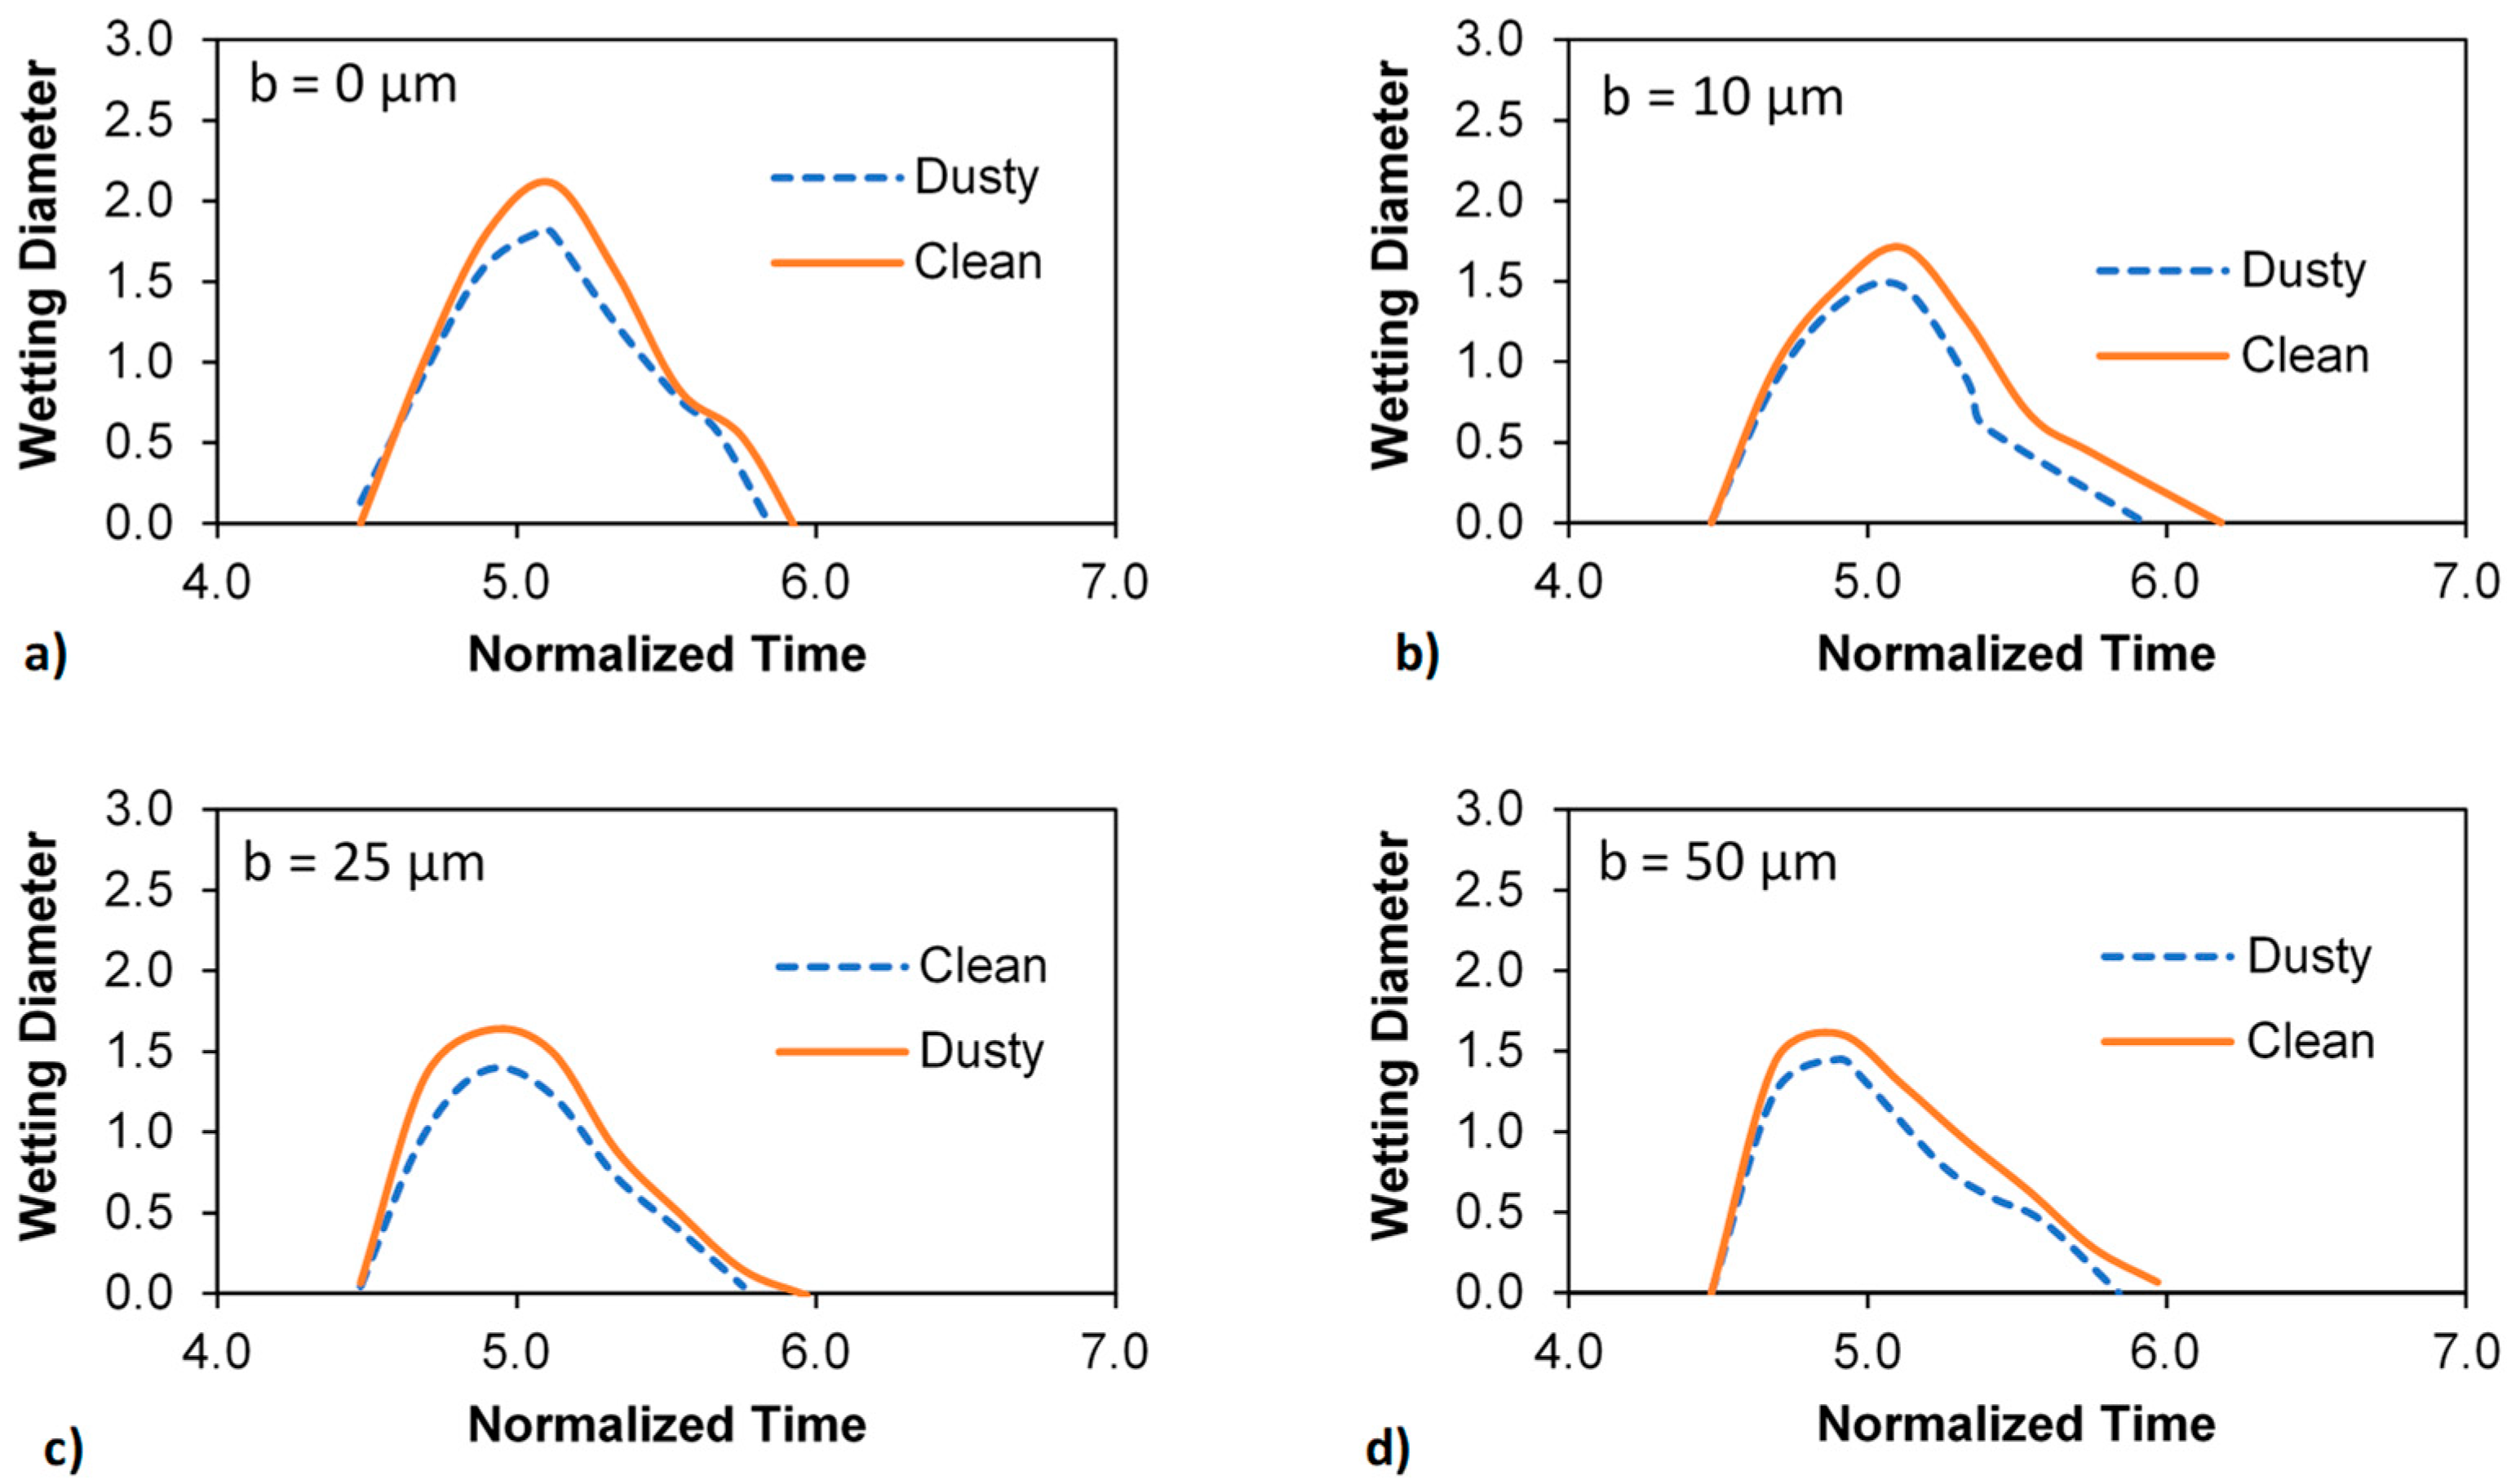
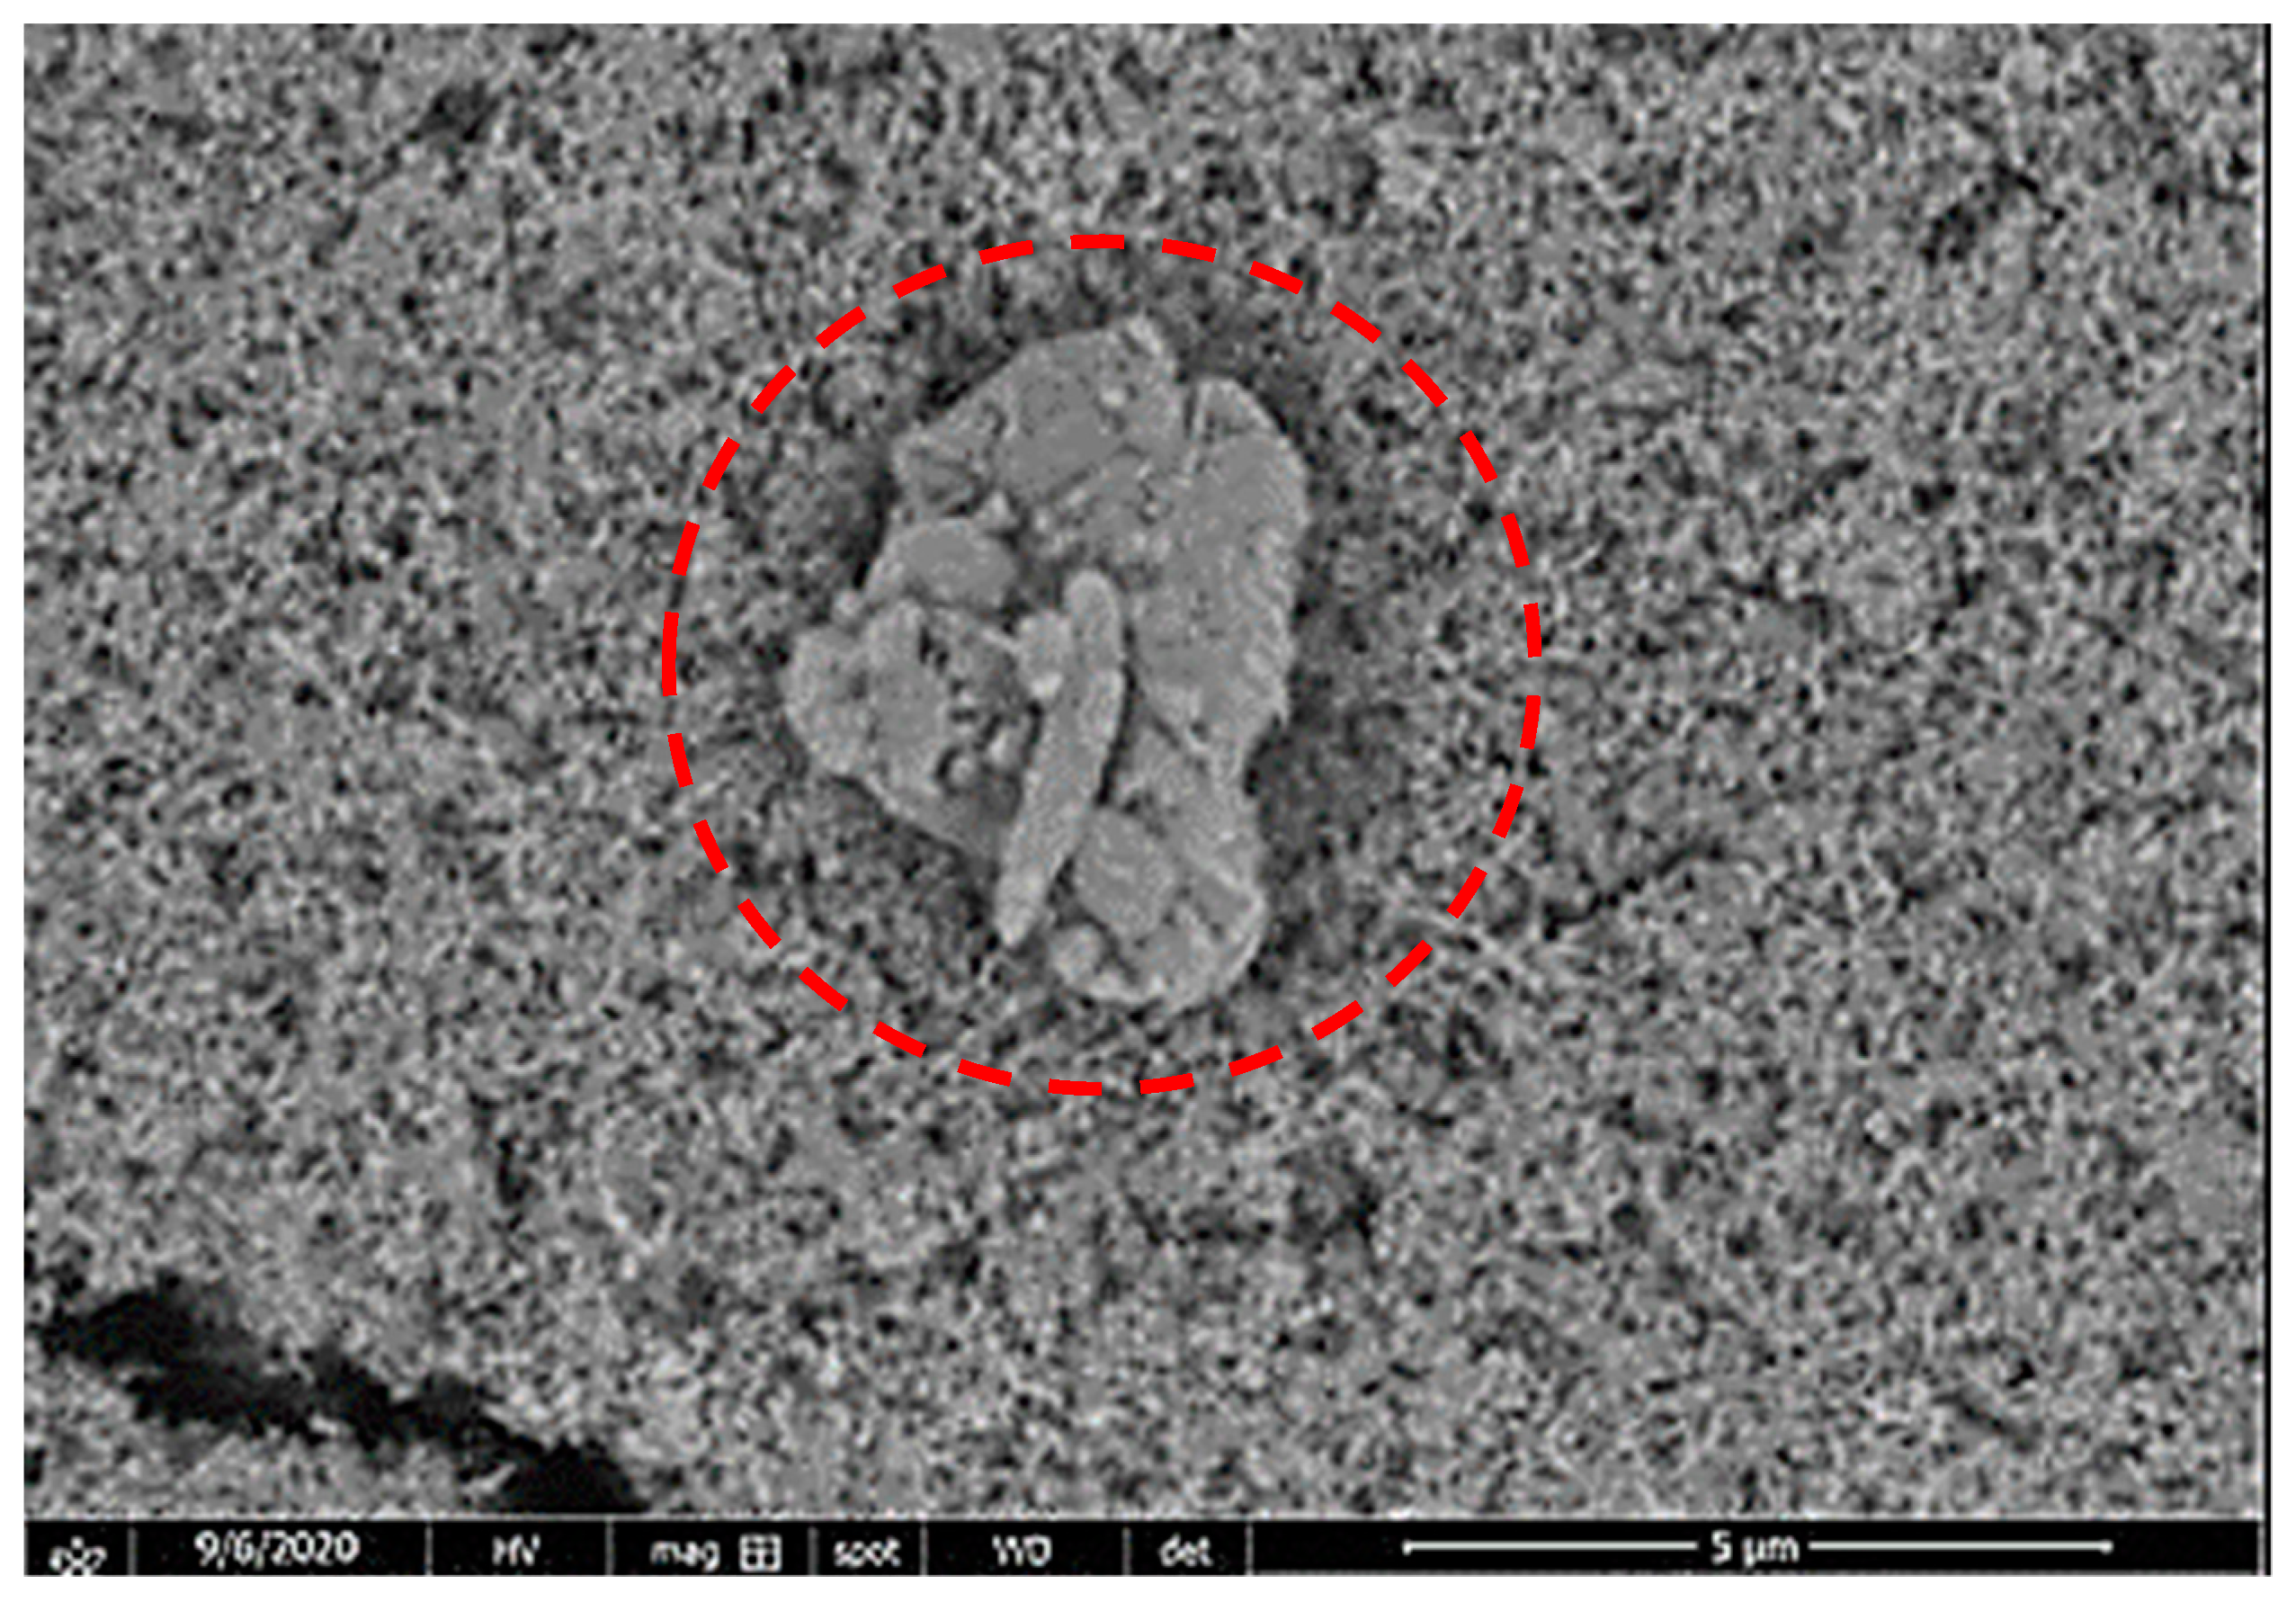
Dust particles were spread uniformly over the hydrophobized micro-post arrays surface and droplet wetting diameter and impacting characteristics were evaluated experimentally. The impacting droplet fluid picks up the dust from the surface. The presence and the dissolution of alkaline compounds of the dust particles in the droplet fluid can slightly change the droplet fluid properties such as surface tension, density, and viscosity [25]. However, the amount of dust picked up by the droplet is considered to be small as compared to the droplet volume and the impact duration is short; hence, the change of the properties because of the presence and dissolution of the dust compounds is neglected in the analysis. Figure 14 shows images obtained from a high-speed camera for impacting droplets on the clean and dusty micro-post arrays surfaces with different micro-post spacings (b). The droplet picks up dust from the surface (Figure 14). In addition, the impacting droplets over clean and dusty surfaces demonstrate similar behavior such that droplet breaking is not observed during the spreading, retraction, and rebounding phases of the impact. The droplet fluid rises in the central region because of the opposing flow created during the retraction (Figure 11) before the droplet rebounds from the surface. The rebound height of the droplet after the impact appears to be higher on the clean surface than that corresponding to the dusty surface. This situation can also be seen from Figure 15, in which droplet dimensionless impact and rebounding heights are given with dimensionless time for different micro-post array spacings. The maximum rebound height of the droplet becomes small for the dusty surface, therefore, dust on the impacted surface creates a damping effect on the rebounding droplet. However, the influence of micro-post spacing on the droplet rebound height was found to be not considered. Figure 16 depicts the comparison of normalized droplet wetting diameter with the normalized time related to the clean and dusty surfaces obtained from the experiments. The maximum droplet diameter becomes small for the dusty surface. The dust particles on the surface act like retarding sites while preventing droplets from spreading over the surface. Hence, the thickening of the dust layer has an adverse effect on the droplet spreading. The large size particles (such as 15 μm, which is larger than micro-post gap spacing) can block the micro-post array gaps and prevent the small dust particles from settling along with the gap widths. However, the small dust particles (<b) can occupy the gaps of the micro-post arrays. In this case, the influence of micro-post array spacing on the dust settlement becomes the dust particle size and shape-dependent. Figure 17 shows SEM micro-images of the dust residues over the micro-post array surface after droplet impact while Table 2 provides the area ratio, which corresponds to the area of dust removed surface over the cross-sectional area of the spherical droplet before impact. The dust residue is present in the micro-post gaps (Figure 16). The occurrence of a few dust residues can be related to one or all of the following: (a) droplet fluid infusion does not result in the total cloaking of the dust particle surfaces during the impact, which is associated with the large surface area and irregular sharp edges of the dust particles, (b) the surface free energy of dust particle residues can be low presenting spreading and infusion of the droplet fluid over the particle surfaces, (c) locally, texture of the surface allows the dust particle anchoring to the surface, and (d) the large size and high density (heavy) particles may not be picked up by the impacting droplet, particularly at low Weber numbers. Nevertheless, the amount of dust particle residues is considerably small. The ratio of the dust mitigated area changes with Weber number (Table 2). Increasing Weber number enhances the ratio of the dust removal area, i.e., the dust removal area is almost six times the spherical droplet cross-sectional area for We = 21. Increasing micro-post array spacing lowers the ratio of dust mitigated area, which is more pronounced at low Weber numbers. Hence, increasing Weber number increases the droplet inertia force while enhancing droplet spreading diameter over the micro-post array surface.
5. Conclusions
The behavior of droplet impacting over hydrophobized micro-post array surfaces is examined and the effect of micro-post array spacing on droplet impacting dynamics is investigated. The findings reveal that predictions of the droplet wetting diameter are in good agreement with the experimental data. Hydrophobizing of replicated micro-post arrays surfaces results in a contact angle of 153° ± 3° and hysteresis of 3° ± 1°. Nano-size valleys and peaks are created on the coating surface as evident from the AFM line scan. The impacting droplet fluid inflection into nano-size valley sites adds to the droplet pinning over the hydrophobized replicated surface. Complex flow structures have resulted inside the droplet fluid after impact. The structures of fluid rotation are observed in the edge region of the spreading droplet while opposing flow occurs from the droplet outer region towards to central region during the retraction period. As the retraction period progresses, a stagnation zone is created in the central region of the droplet. The stagnation zone extends towards the droplet surface as the rebounding initiates. The maximum droplet diameter reduces as the micro-post array spacing (b) increases. The droplet fluid penetration into large micro-post arrays gap creates a pinning effect on the spreading droplet; in which case the droplet kinetic energy dissipation increases during the spreading cycle. Similarly, the droplet rebound height reduces as the micro-post array spacing increases. Increasing Weber number causes increasing spreading factor, which is more pronounced for small micro-post arrays spacing. Dust can be mitigated from hydrophobized micro-post arrays surfaces through the impacting droplet. Increasing droplet Weber number enhances dust mitigated area such that the dust mitigated area increases almost 6-folds compared to the impacting droplet cross-sectional area for We = 21. Enlarging the micro-post array spacing lowers the dust mitigated area on the surface. Few dust residues are observed in the micro-post arrays gaps.
Author Contributions
A.A.A. performed the experimental, numerical, and analytical works and contributed to the writing of the manuscript. B.S.Y. performed the research work with the collaboration of other coauthors and wrote the manuscript. M.Y. conducted the experimental work and helped with the preparation of the paper. H.A.-Q. partly conducted the experimental work and helped with the preparation of the paper. G.H. conducted the experimental work and helped with the preparation of the paper. J.E.A. conducted the experimental work and helped with the preparation of the paper. All authors have read and agreed to the published version of the manuscript.
Funding
This research received funding from King Fahd University of Petroleum and Minerals (KFUPM), through project # DF 201016, and the King Abdullah City for Atomic and Renewable Energy (K.A.CARE).
Institutional Review Board Statement
Not applicable.
Informed Consent Statement
Not applicable.
Data Availability Statement
The data presented in this study are available on request from the corresponding author.
Acknowledgments
The authors acknowledge the financial support of the Deanship of Scientific Research at King Fahd University of Petroleum and Minerals (KFUPM) through project # DF 201016 and King Abdullah City for Atomic and Renewable Energy (K.A.CARE) to accomplish this work.
Conflicts of Interest
The authors declare no conflict of interest.
Appendix A. Mathematical Formulations of Two-Phase Field Model
The continuity equation becomes:
where is velocity vector in three orthogonal coordinate directions for a cylindrical coordinate system.
The momentum equation can be expressed as:
where: is density, is acceleration vector, is gauge pressure, is surface tension, is curvature, is a unit normal vector at the interface, is Dirac-Delta function, is friction force vector and is time.
The conservative level set equation for tracking the two-phase flow of droplets within ambient air can be expressed as:
where: is the level-set function, is re-initialization parameter, is interface thickness, and is time.
The energy equation can be expressed as:
where: is temperature, is effective specific heat, and k is effective thermal conductivity.
Droplet evaporation into the ambient air can be incorporated in the simulations by adopting the diffusion-convection equation [26]:
where: Cv is the specific heat at constant volume, is airflow velocity, and Df is diffusion coefficient (m2·s−1).
The mass outflux at the droplet interface can be expressed as [27]:
where: is interfacial velocity, is the outward unit vector at the interface while vapor phase is designated by v and liquid phase is by f. Therefore, change of velocity across the interface can be written as [28]:
By combining Equation (A6) with Equation (A7), the shrinking surface velocity at the droplet interface becomes:
The Marangoni shear term can be incorporated at the droplet interface by:
where, is stress tensor (N m−2) and is the surface tension force vector.
The surface tension force term can be expressed as:
where: is interfacial force density, is the surface tension of the droplet, and is tangential stress due to droplet evaporation, is the gradient of surface tension with respect to temperature (N·m−1·K−1)), and is the temperature gradient at the droplet interface.
Appendix B. Formulation of Penetration Height of Impacting Droplet over Micro-Post Array Surfaces
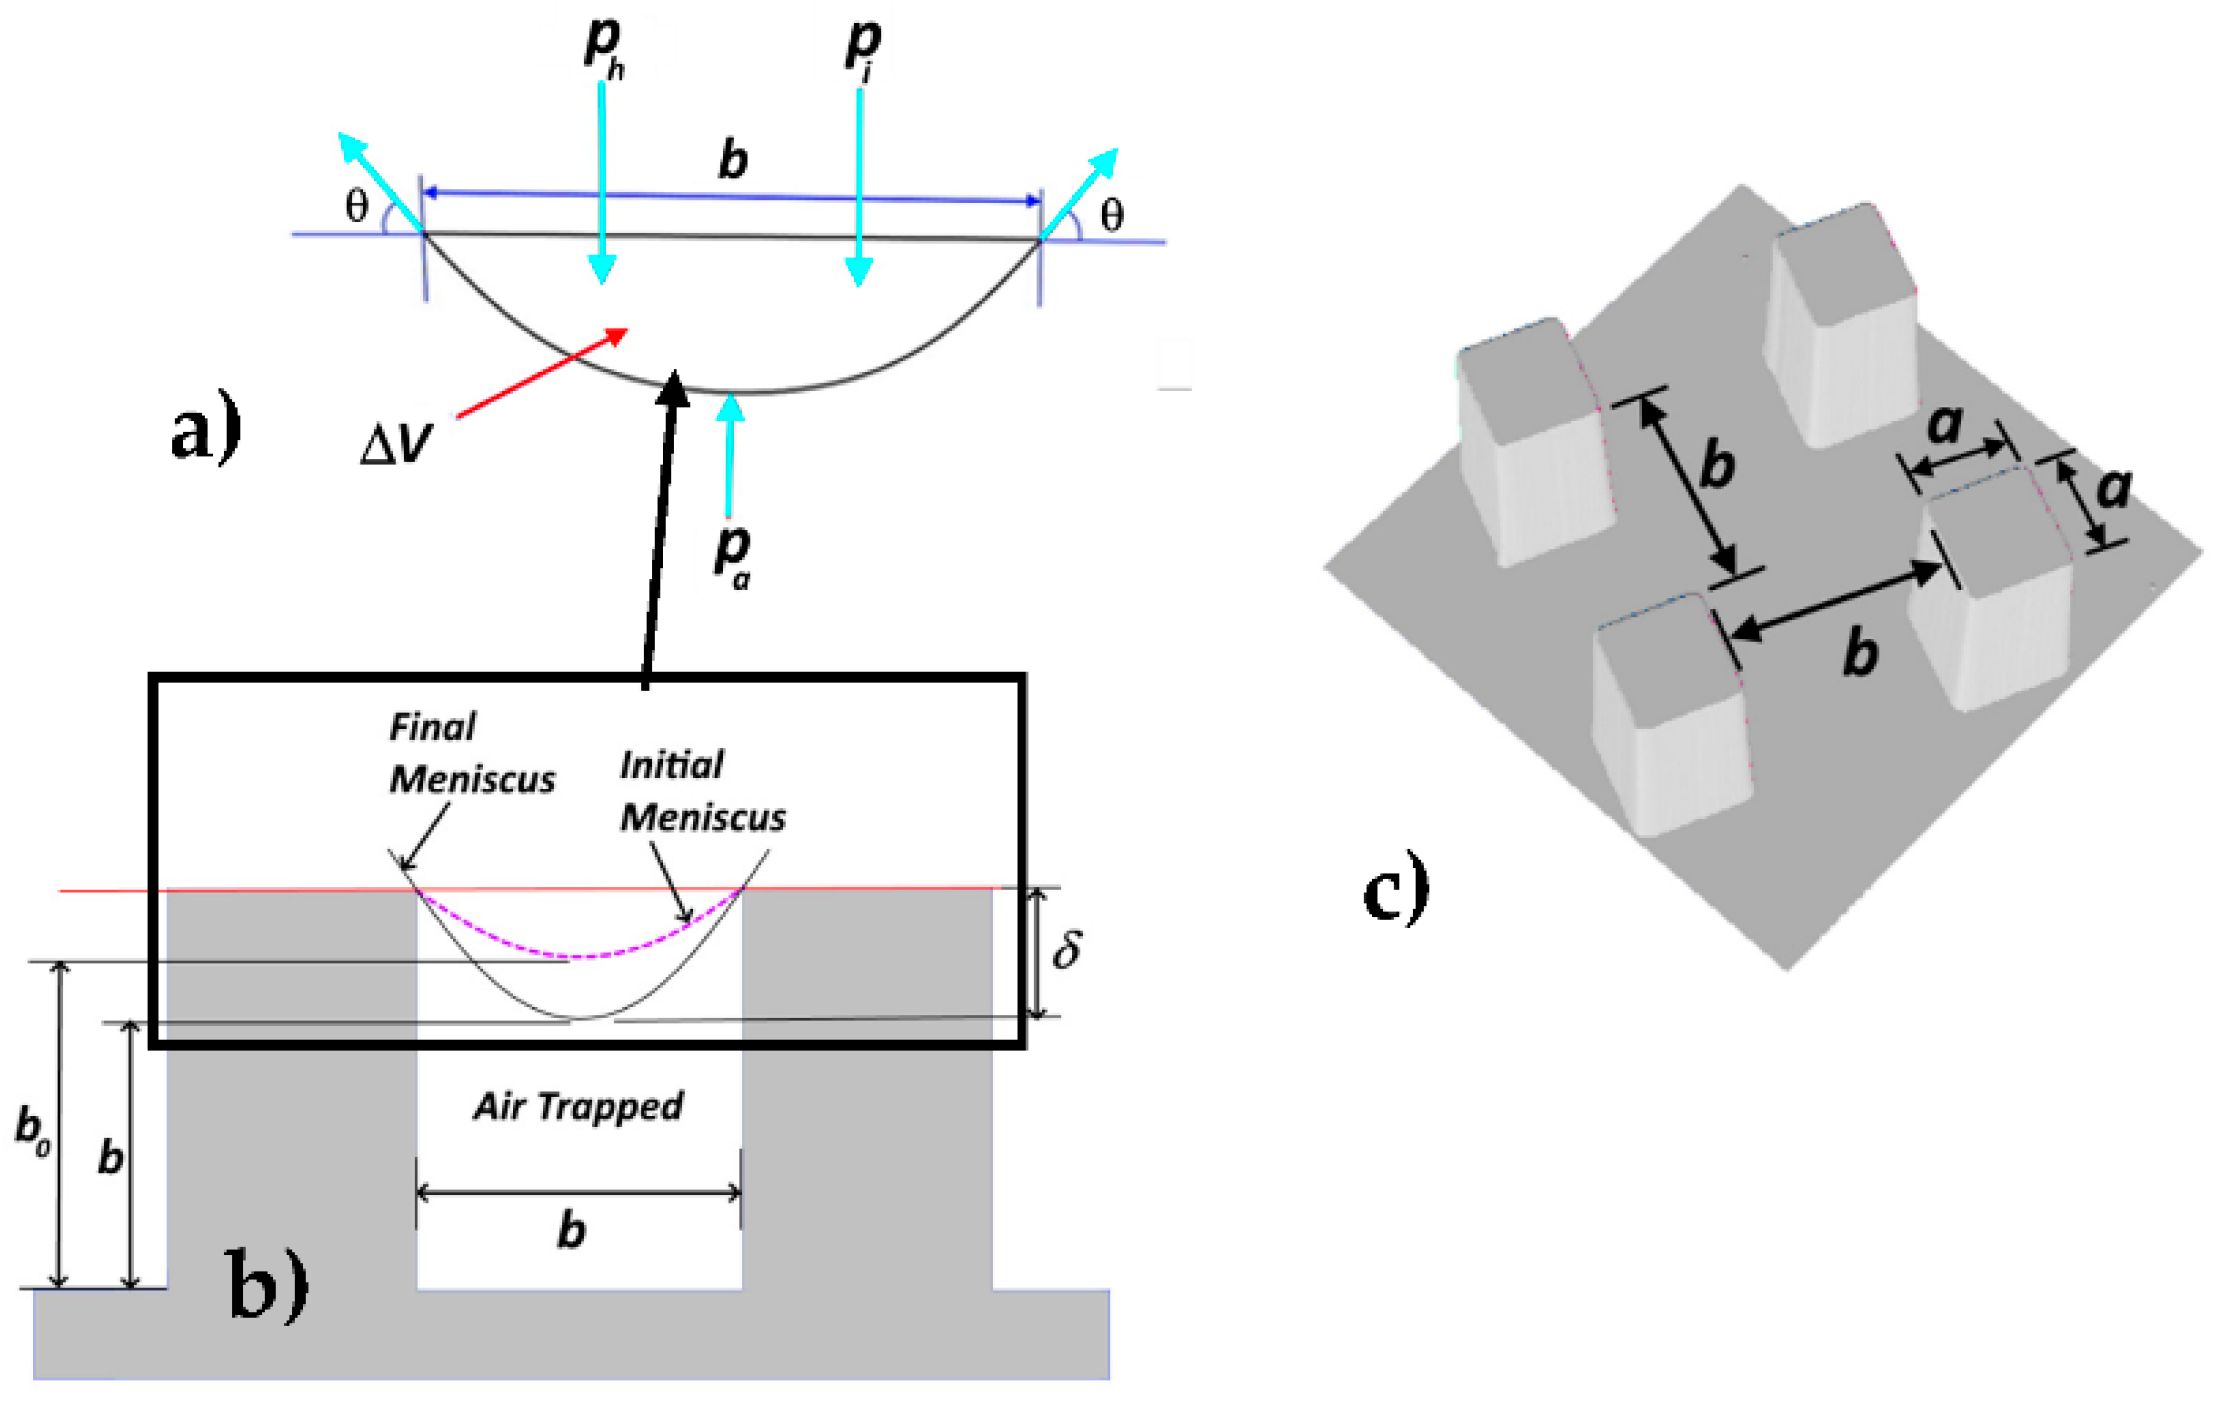
As the droplet impacts on a micro-post array surface, the arc of the droplet meniscus penetrates deep into the micro-post gap spacing due to the increase in effective pressure acting at the droplet interface. Such effective pressure is the result of water hammer, dynamic and capillary pressures. Furthermore, additional pressure is created by the air entrapped in between the droplet interface and pillar base. After considering Figure A1, the micro-post array surface is composed of several micropillars of equal size and spacing. Hence, the volume of the droplet fluid penetrated can be approximated by a half ellipsoid as shown in Figure A1a.
Figure A1.
A schematic view of the micro-post array: (a) forces acting at the droplet meniscus across the micro-post gap, (b) droplet meniscus across the micro-post gap before and after the impact of the droplet and (c) geometric sizes of micro-post arrays.
Figure A1.
A schematic view of the micro-post array: (a) forces acting at the droplet meniscus across the micro-post gap, (b) droplet meniscus across the micro-post gap before and after the impact of the droplet and (c) geometric sizes of micro-post arrays.

The meniscus height across a single micro-post gap spacing is also shown schematically in Figure A1b. The droplet meniscus height formed after impact can be formulated from the balance of forces in the direction of impact. Considering Figure A1a, the vertical force balance can be expressed as:
Here, is the specific weight, . is the droplet spreading thickness, Fγ is the surface tension force, is the volume of inflection, is effective impact pressure onset of impact, is the maximum pressure in the entrapped air and is the speed of sound [29].
Hence, Equation (A11) can be expressed as:
Since , and divide by ρgπb2:
Equation (A13) is a nonlinear algebraic equation that gives the relation between the droplet meniscus height () and the impact characteristics of the droplet. The solution can be obtained iteratively with the aid of general-purpose programming packages such as MATLAB.
References
- Khojasteh, D.; Kazerooni, N.M.; Marengo, M. A review of liquid droplet impacting onto solid spherical particles: A physical pathway to encapsulation mechanisms. J. Ind. Eng. Chem. 2019, 71, 50–64. [Google Scholar] [CrossRef]
- Hamidi, N.; Wijayanti, W.; Fahmi, R. Pressure Effect in Droplet Combustion of Blended Fuel on Ethanol and Kemiri Sunan (Reutealis Trisperma (Blanco) Airy Shaw) Biodiesel. In Proceedings of the IOP Conference Series: Materials Science and Engineering, Malang, Indonesia, 23–25 October 2018; IOP Publishing: Malang, Indonesia, 2019; Volume 494, p. 12052. [Google Scholar]
- Havaić, T.; Đumbir, A.-M.; Gretić, M.; Matijašić, G.; Žižek, K. Droplet impact phenomena in fluidized bed coating process with a wurster insert. Int. J. Chem. Eng. 2018, 2018, 4546230. [Google Scholar] [CrossRef]
- Yilbas, B.S.; Abubakar, A.A.; Ali, H.; Al-Sharafi, A.; Sahin, A.Z.; Sunar, M.; Al-Qahtani, H. Impacting water droplets can alleviate dust from slanted hydrophobic surfaces. Langmuir 2021, 37, 4355–4369. [Google Scholar] [CrossRef]
- Peng, C.-Y.; Tsai, C.-H.D. Universal plasma jet for droplet manipulation on a pdms surface towards wall-less scaffolds. Polymers 2021, 13, 1321. [Google Scholar] [CrossRef]
- Quetzeri-Santiago, M.A.; Castrejón-Pita, A.A.; Castrejón-Pita, J.R. The effect of surface roughness on the contact line and splashing dynamics of impacting droplets. Sci. Rep. 2019, 9, 15030. [Google Scholar] [CrossRef] [Green Version]
- Zhang, Y.-P.; Fan, D.; Bai, X.-Z.; Cui, C.-X.; Chen, J.; Li, R.-L.; Liu, P.-F.; Qu, L.-B. Sorting liquid droplets by surface tension using devices with quasi-superamphiphobic coatings. Polymers 2020, 12, 820. [Google Scholar] [CrossRef] [PubMed] [Green Version]
- Malijevský, A. Does surface roughness amplify wetting? J. Chem. Phys. 2014, 141, 184703. [Google Scholar] [CrossRef] [Green Version]
- Hassan, G.; Yilbas, B.S.; Said, S.A.M.; Al-Aqeeli, N.; Matin, A. Chemo-mechanical characteristics of mud formed from environmental dust particles in humid ambient air. Sci. Rep. 2016, 6, 30253. [Google Scholar] [CrossRef] [Green Version]
- Abubakar, A.A.; Yilbas, B.S.; Al-Qahtani, H.; Alzaydi, A. Environmental dust repelling from hydrophilic/hydrophobic surfaces under sonic excitations. Sci. Rep. 2020, 10, 14346. [Google Scholar]
- Ragulskis, K.; Bubulis, A.; Mažeika, D.; Janutienė, R.K.; Ragulskis, L.M.; Bartkus, A. Vibrational method of cleaning of surfaces from homogeneous waste materials. J. Vibroeng. 2017, 19, 1709–1716. [Google Scholar]
- Yakubu, M.; Yilbas, B.S.; Abubakr, A.A.; Al-Qahtani, H. Droplet rolling and spinning in V-shaped hydrophobic surfaces for environmental dust mitigation. Molecules 2020, 25, 3039. [Google Scholar] [CrossRef]
- Jaszczur, M.; Teneta, J.; Styszko, K.; Hassan, Q.; Burzyńska, P.; Marcinek, E.; Łopian, N. The field experiments and model of the natural dust deposition effects on photovoltaic module efficiency. Environ. Sci. Pollut. Res. 2019, 26, 8402–8417. [Google Scholar] [CrossRef] [PubMed] [Green Version]
- Ghazi, S.; Sayigh, A.; Ip, K. Dust effect on flat surfaces—A review paper. Renew. Sustain. Energy Rev. 2014, 33, 742–751. [Google Scholar] [CrossRef]
- Yong, W.Y.D.; Zhang, Z.; Cristobal, G.; Chin, W.S. One-pot synthesis of surface functionalized spherical silica particles. Colloids Surf. A Physicochem. Eng. Asp. 2014, 460, 151–157. [Google Scholar] [CrossRef]
- Heib, F.; Schmitt, M. Statistical contact angle analyses with the high-precision drop shape analysis (HPDSA) approach: Basic principles and applications. Coatings 2016, 6, 57. [Google Scholar] [CrossRef] [Green Version]
- Tracker Program. Available online: https://physlets.org/tracker (accessed on 15 June 2021).
- Bhattacharya, S.; Charonko, J.J.; Vlachos, P.P. Particle image velocimetry (PIV) uncertainty quantification using moment of correlation (MC) plane. Meas. Sci. Technol. 2018, 29, 115301. [Google Scholar] [CrossRef] [Green Version]
- Hu, J.; Xiong, X.; Xiao, H.; Wan, K. Effects of Contact Angle on the Dynamics of Water Droplet Impingement. In Proceedings of the COMSOL Conference, Boston, MA, USA, 7–9 October 2015. [Google Scholar]
- COMSOL Inc. COMSOL Multiphysics; COMSOL Inc.: Burlington, MA, USA, 2017. [Google Scholar]
- Herring, M.L.; Mardel, J.I.; Fox, B.L. The effect of material selection and manufacturing process on the surface finish of carbon fibre composites. J. Mater. Process. Technol. 2020, 210, 926–940. [Google Scholar] [CrossRef]
- Washburn, E.W. The dynamics of capillary flow. Phys. Rev. 1921, 17, 273. [Google Scholar] [CrossRef]
- Kwak, G.; Lee, M.; Senthil, K.; Yong, K. Impact dynamics of water droplets on chemically modified WOx nanowire arrays. Appl. Phys. Lett. 2009, 95, 153101. [Google Scholar] [CrossRef]
- Engel, O.G. Waterdrop collisions with solid surfaces. J. Res. Natl. Bur. Stand. 1955, 54, 281–298. [Google Scholar] [CrossRef]
- Al-Sharafi, A.; Yilbas, B.S.; Ali, H.; Sahin, A.Z. Flow Field inside a sessile droplet on a hydrophobic surface in relation to self-cleaning applications of dust particles. ASME J. Heat Transfer 2017, 139, 042003. [Google Scholar] [CrossRef]
- George, O.A.; Xiao, J.; Rodrigo, C.S.; Mercadé-Prieto, R.; Sempere, J.; Chen, X.D. Detailed numerical analysis of evaporation of a micrometer water droplet suspended on a glass filament. Chem. Eng. Sci. 2017, 165, 33–47. [Google Scholar] [CrossRef]
- Pan, Z.; Weibel, J.A.; Garimella, S.V. Numerical simulation of evaporating two-phase flow in a high-aspect-ratio microchannel with bends. J. Heat Transfer 2017, 139, 020901. [Google Scholar] [CrossRef] [Green Version]
- Asibor, J.O.; Ighodaro, O. Steady state analysis of nanofuel droplet evaporation. Int. J. Nanosci. Nanotechnol. 2019, 15, 145–155. [Google Scholar]
- Tatekura, Y.; Watanabe, M.; Kobayashi, K.; Sanada, T. Pressure generated at the instant of impact between a liquid droplet and solid surface. R. Soc. Open Sci. 2018, 5, 181101. [Google Scholar] [CrossRef] [Green Version]
Figure 1.
SEM images and AFM line scan of micro-post arrays: (a) SEM image of micro-post arrays on a silicon wafer, (b) SEM image of replicated micro-post arrays on PDMS, (c) SEM image of coated and PDMS replicated micro-post arrays (functional silica nanoparticles are also shown), (d) coating deposited micro-post array and close view of the coated surface, (e) AFM line scan and image of the coating surface, (f) geometric configurations of the micro-post array.

Figure 2.
SEM micrographs of micro-post replication: (a) micro-post on a silicon wafer, (b) copied micro-post by using liquid PDMS, (c) replicated micro-post by using the copied micro-post and liquid PDMS, (d) functionalized silica particles deposited on replicated micro-post.
Figure 2.
SEM micrographs of micro-post replication: (a) micro-post on a silicon wafer, (b) copied micro-post by using liquid PDMS, (c) replicated micro-post by using the copied micro-post and liquid PDMS, (d) functionalized silica particles deposited on replicated micro-post.

Figure 3.
(a) Boundary conditions for impacting droplet over hydrophobized replicated micro-post array surface. (b) Grid used in the simulations and mesh distribution.
Figure 3.
(a) Boundary conditions for impacting droplet over hydrophobized replicated micro-post array surface. (b) Grid used in the simulations and mesh distribution.

Figure 4.
Grid independence solution along with vertical height (X-X’) for: (a) velocity magnitude and (b) pressure variation (gage pressure) at 0.054 s. Droplet volume is 10 μL droplet and impact height is 20 mm.
Figure 4.
Grid independence solution along with vertical height (X-X’) for: (a) velocity magnitude and (b) pressure variation (gage pressure) at 0.054 s. Droplet volume is 10 μL droplet and impact height is 20 mm.

Figure 5.
Variation of the normalized wetting diameter obtained from predictions and experiments during spreading and retraction stages for various micro-post spacings: (a) hydrophobized flat surface , (b) , (c) , (d). Droplet volume is 10 μL and impact height is 20 mm.
Figure 5.
Variation of the normalized wetting diameter obtained from predictions and experiments during spreading and retraction stages for various micro-post spacings: (a) hydrophobized flat surface , (b) , (c) , (d). Droplet volume is 10 μL and impact height is 20 mm.

Figure 6.
Images of water droplets squeezed in between hydrophilic and hydrophobic plates: (a) prior squeezing, (b) squeezed, (c) hydrophilic plate is lifted (red circle shows droplet pinning section on hydrophobic surface), and (d) hydrophilic plate is lifted. No pinch-off droplet fluid is observed on hydrophobic plate.

Figure 7.
Normalized droplet maximum diameter (Dmax/D), D is spherical droplet diameter of the same volume) with Weber number for different micro-post spacings and droplet volumes: (a) 10 μL and (b) 20 μL. The micro-post spacing b = 0 represents the flat hydrophobized surface.
Figure 7.
Normalized droplet maximum diameter (Dmax/D), D is spherical droplet diameter of the same volume) with Weber number for different micro-post spacings and droplet volumes: (a) 10 μL and (b) 20 μL. The micro-post spacing b = 0 represents the flat hydrophobized surface.

Figure 8.
Restitution coefficient with Weber number for different micro-post spacings and droplet volumes: (a) 10 μL and (b) 20 μL. The micro-post spacing b = 0 represents the flat hydrophobized surface.
Figure 8.
Restitution coefficient with Weber number for different micro-post spacings and droplet volumes: (a) 10 μL and (b) 20 μL. The micro-post spacing b = 0 represents the flat hydrophobized surface.

Figure 9.
A 3D view of 10µL droplet impacting on micro-post array surface with at 54 ms after impact from 20 mm height: (a) pressure distribution and (b) velocity magnitude. All length scales are in mm.
Figure 9.
A 3D view of 10µL droplet impacting on micro-post array surface with at 54 ms after impact from 20 mm height: (a) pressure distribution and (b) velocity magnitude. All length scales are in mm.

Figure 10.
Velocity field developed inside droplet fluid during the spreading period for various micro-post arrays size. Droplet volume is 10 µL and impact height is 20 mm. The micro-post spacing b = 0 represents the flat hydrophobized surface.
Figure 10.
Velocity field developed inside droplet fluid during the spreading period for various micro-post arrays size. Droplet volume is 10 µL and impact height is 20 mm. The micro-post spacing b = 0 represents the flat hydrophobized surface.

Figure 11.
Velocity field developed inside droplet fluid during retracting and rebound initiation periods for various micro-post spacings. Droplet volume is 10 µL and impact height is 20 mm. The micro-post spacing b = 0 represents the flat hydrophobized surface.
Figure 11.
Velocity field developed inside droplet fluid during retracting and rebound initiation periods for various micro-post spacings. Droplet volume is 10 µL and impact height is 20 mm. The micro-post spacing b = 0 represents the flat hydrophobized surface.

Figure 12.
Variation of droplet height during impact and rebounding periods for various impact heights and micro-post spacings: (a) flat hydrophobized surface , (b) , (c) , (d). Droplet volume is 10 μL.
Figure 12.
Variation of droplet height during impact and rebounding periods for various impact heights and micro-post spacings: (a) flat hydrophobized surface , (b) , (c) , (d). Droplet volume is 10 μL.

Figure 13.
Variation of droplet wetting diameter during impact and rebounding periods for various impact heights and micro-post spacings: (a) flat hydrophobized surface , (b) , (c) , (d). Droplet volume is 10 μL.
Figure 13.
Variation of droplet wetting diameter during impact and rebounding periods for various impact heights and micro-post spacings: (a) flat hydrophobized surface , (b) , (c) , (d). Droplet volume is 10 μL.

Figure 14.
High-speed camera images of impacting droplets on clean and dusty surfaces for various micro-post spacings and impact and rebounding durations. The micro-post array spacing b = 0 represents flat hydrophobized surface.
Figure 14.
High-speed camera images of impacting droplets on clean and dusty surfaces for various micro-post spacings and impact and rebounding durations. The micro-post array spacing b = 0 represents flat hydrophobized surface.

Figure 15.
Variation of droplet normalized height with normalized time for impacting droplet on clean and dusty surfaces for various micro-post spacings: (a) flat hydrophobized surface , (b) , (c) , (d). Droplet volume is 10 μL.
Figure 15.
Variation of droplet normalized height with normalized time for impacting droplet on clean and dusty surfaces for various micro-post spacings: (a) flat hydrophobized surface , (b) , (c) , (d). Droplet volume is 10 μL.

Figure 16.
Variation of droplet wetting diameter with normalized time for impacting droplet on clean and dusty surfaces for various micro-post spacings: (a) , (b) , (c) flat hydrophobized surface , (d). Droplet volume is 10 μL.
Figure 16.
Variation of droplet wetting diameter with normalized time for impacting droplet on clean and dusty surfaces for various micro-post spacings: (a) , (b) , (c) flat hydrophobized surface , (d). Droplet volume is 10 μL.

Figure 17.
SEM micro-image of dust residues within micro-post spacing. The red circle shows dust particles.
Figure 17.
SEM micro-image of dust residues within micro-post spacing. The red circle shows dust particles.


Table 1.
Fluid properties and micro-post array sizes were adopted in the simulations.
| Property | Name | Air | Water |
|---|---|---|---|
| Density | 6 × 10⁻⁶ T2 − 0.0036 T + 2.1483 | 838.5 + 1.4 T−0.003 T2 + 3.7 × 10⁻⁷ T3 | |
| Dynamic viscosity | 1.77 × 10⁻⁸ T + 12.536 × 10⁻⁶ | 1.38 – 0.021 T + 1.36 × 10⁻⁴ T2 – 4.65 × 10⁻⁷ T3 | |
| Surface tension | - | −0.0206 T + 13.41 | |
| Re-initialization parameter | 0.6 | 0.6 | |
| Interfacial thickness | - | 10 − 50 | |
| Contact angle | - | 130° ± 4° for b = 0 µm | |
| 138° ± 4° for b = 10 µm | |||
| 146° ± 4° for b = 25 µm | |||
| 152° ± 4° for b = 50 µm | |||
| Specific heat capacity | 0.0004 T2 − 0.1704 T + 1023 | 0.0112 T2 – 7.0516 T + 5294.5 | |
| Thermal conductivity | 5.75 × 10⁻⁵ (1 − 2.1 × 10⁻⁶ T2 – 3.17 × 10⁻³ T + 1) | −8.354 × 10⁻⁶ T2 + 6.53 × 10⁻³ T − 0.5981 | |
| Diffusion coefficient | - | 0.0018 T − 0.2913 | |
| b (μm) | Spacing between micro-posts | 0, 10, 25, 50 | |
| a (μm) | Square micro-post width | 10 | |
| h (μm) | Micro-post height | 10 | |
Table 2.
Variation of ratio of dust removed area with We number for 10 µL droplet.
| We | Area Ratio = Cleaned Area/Droplet Cross-Sectional Area | |||
|---|---|---|---|---|
| b = 0 µm | b = 10 µm | b = 25 µm | b = 50 µm | |
| 7.2 | 3.507106 | 2.79177 | 2.236873 | 1.856246 |
| 10.8 | 4.248223 | 3.571959 | 2.793005 | 2.135425 |
| 14.4 | 4.420782 | 3.795227 | 3.061624 | 2.571364 |
| 18.0 | 5.450434 | 4.660953 | 4.135096 | 3.103018 |
| 21.0 | 6.470626 | 5.211640 | 4.171407 | 3.519041 |
Publisher’s Note: MDPI stays neutral with regard to jurisdictional claims in published maps and institutional affiliations. |
© 2021 by the authors. Licensee MDPI, Basel, Switzerland. This article is an open access article distributed under the terms and conditions of the Creative Commons Attribution (CC BY) license (https://creativecommons.org/licenses/by/4.0/).
Share and Cite
MDPI and ACS Style
Abubakar, A.A.; Yilbas, B.S.; Yakubu, M.; Al-Qahtani, H.; Hassan, G.; Adukwu, J.E. Impacting Droplet Can Mitigate Dust from PDMS Micro-Post Array Surfaces. Coatings 2021, 11, 1377. https://doi.org/10.3390/coatings11111377
AMA Style
Abubakar AA, Yilbas BS, Yakubu M, Al-Qahtani H, Hassan G, Adukwu JE. Impacting Droplet Can Mitigate Dust from PDMS Micro-Post Array Surfaces. Coatings. 2021; 11(11):1377. https://doi.org/10.3390/coatings11111377
Chicago/Turabian StyleAbubakar, Abba Abdulhamid, Bekir Sami Yilbas, Mubarak Yakubu, Hussain Al-Qahtani, Ghassan Hassan, and Johnny Ebaika Adukwu. 2021. "Impacting Droplet Can Mitigate Dust from PDMS Micro-Post Array Surfaces" Coatings 11, no. 11: 1377. https://doi.org/10.3390/coatings11111377
Note that from the first issue of 2016, this journal uses article numbers instead of page numbers. See further details here.