Article

Thin SiNC/SiOC Coatings with a Gradient of Refractive Index Deposited from Organosilicon Precursor

by
Hieronim Szymanowski
1,
Katarzyna Olesko
1,
Jacek Kowalski
1,
Mateusz Fijalkowski
2,
Maciej Gazicki-Lipman
1 and
Anna Sobczyk-Guzenda
1,*
1
Institute of Materials Science and Engineering, Lodz University of Technology, Stefanowskiego 1/15 Str., 90-924 Lodz, Poland
2
Institute for Nanomaterials, Advanced Technologies and Innovation, Technical University of Liberec, 2 Studentska St., 461 17 Liberec, Czech Republic
*
Author to whom correspondence should be addressed.
Coatings 2020, 10(8), 794; https://doi.org/10.3390/coatings10080794
Submission received: 13 July 2020 / Revised: 5 August 2020 / Accepted: 11 August 2020 / Published: 17 August 2020
(This article belongs to the Special Issue Functional Ceramic Coatings)

Abstract

:
In this work, optical coatings with a gradient of the refractive index are described. Its aim was to deposit, using the RF PECVD method, films of variable composition (ranging from silicon carbon-oxide to silicon carbon-nitride) for a smooth change of their optical properties enabling a production of the filter with a refractive index gradient. For that purpose, two organosilicon compounds, namely tetramethyldisilazane and hexamethyldisilazane, were selected as precursor compounds. The results reveal better optical properties of the materials obtained from the latter source. Depending on whether deposited in pure oxygen atmosphere or under conditions of pure nitrogen, the refractive index of the coatings amounted to 1.65 and to 2.22, respectively. By using a variable composition N2/O2 gas mixture, coatings of intermediate magnitudes of “n” were acquired. The optical properties were investigated using both UV-Vis absorption spectroscopy and variable angle spectroscopic ellipsometry. The chemical structure of the coatings was studied with the help of Fourier transform infrared and X-ray photoelectron spectroscopies. Finally, atomic force microscopy was applied to examine their surface topography. As the last step, a “cold mirror” type interference filter with a gradient of refractive index was designed and manufactured.

1. Introduction

Due to their wide-ranging applications in optics, interference filters constitute a group of broadly developed and manufactured optical devices [1]. Among others, they are applied as coatings on lenses, camera and projector optics [2], telescope components [3], solar panels [4], and car and aircraft windows [5].
Initially, interference filters were composed of stacks of alternated homogeneous films characterized by the low and high magnitude of refractive index. These systems exhibited numerous shortcomings, one example being an occurrence of secondary harmonic bands in their spectra, substantially lowering optical quality of a filter [6]. Another often encountered problem was poor adhesion between the subsequent layers with the resulting interfacial penetration of water frequently leading to complete filter destruction [7]. This is a reason for which a new generation of interference filters was designed, assuming a continuous periodical (sinusoidal) change of their index of refraction [8]. A gradient inhomogeneous structure of a coating allows one to find a photonic forbidden band similar to that of Bragg’s mirror, but one that is narrower (by a coefficient of π/4) than the width of the quarter-wave band. This is one reason these structures are characterized by better optical properties, with perfectly suppressed secondary and higher harmonic bands [7]. However, one needs to remember that the more complex the coating structure, the higher the difficulty of the technological problems connected with its deposition.
Despite numerous advantages of inhomogeneous interference filters, there is a rather limited number of scientific publications dealing with these devices present in the literature. One of the principal reasons for that is the fact that the manufacture of these filters requires very precise control of their optical parameters, which is extremely difficult (if not impossible) in the case of such conventional deposition techniques as the sol–gel method [9]. The realization of this type of project requires the availability of optical materials of variable magnitude of refractive index, controlled by the continuous (and high-precision) change of their elemental composition. The deposition techniques most often used for the manufacture of optical coatings include co-sputtering [10], co-evaporation [11], ion-assisted deposition [12], and glancing angle deposition [13]. In all these cases, both a precise control of the coating composition and safeguarding of its high optical quality require excessive financial investment.
Among the different materials used for the purpose of manufacturing inhomogeneous optical filters, perhaps silicon and its derivatives are the most popular. In recent years, there have been several articles published dealing with the technology of porous silicon for these applications. The first paper on that subject was published in 1997 by Berger [14]. Later, in 2002, Cunin et al. showed an application potential for the filter in screening biomolecular studies [15]. This type of filter, produced by Chhasatia et al. with the help of a thermal hydrosilylation method, was used in the construction of an insulin detection biosensor [16]. Regrettably, the above-mentioned filters are not transparent to visible light, which substantially limits their applications. It was Zhang et al. who produced antireflective narrow line-width filters with a refractive index gradient using silicon oxide (SiO2) as a low (1.50)-index material and niobium oxide (Nb2O5) as a high (2.14)-index material, applying the glancing angle deposition technique for that purpose [17]. The magnetron sputtering technique is also used to manufacture rugate type optical filters. With the help of the reactive magnetron sputtering method, Bartzsch et al. produced silicon oxynitride (SiON) antireflection filters, wherein index of refraction varied within a relatively narrow range of 1.46 to 1.99 [18].
The application of the RF PECVD technique for that purpose appears to be an interesting and fruitful solution [19,20]. The technique allows one to selectively control the chemical vapor deposition processes by means of appropriate adjustment of energy and intensity of substrate bombarding ions. By using this method, Larouche et al. obtained stable filters with very good optical characteristics, stripped of harmonic reflexes. These filters were made of titanium dioxide/silicon oxide (TiO2/SiO2) coatings with their refractive index varying between 1.5 and 2.35, depending on the TiO2/SiO2 ratio [20]. Rats et al., on the other hand, produced inhomogeneous silicon oxide/silicon nitride (SiO2/Si3N4) types of filters using RF/MW PE CVD technique with silane as a source of silicon and N2, NH3 and N2O gas mixture as a source of nitrogen and oxygen [21]. Lin et al. obtained inhomogeneous optical SiON filters by using a PE CVD method and a helium diluted mixture of nitrogen and nitrogen suboxide. With silane as a source of silicon, the resulting magnitude of refractive index varied between 1.5 and 1.85 [22]. In the majority of works dealing with the deposition of SiON types of coatings with the help of the RF PE CVD method, silane is used as a source of silicon. It is a flammable and explosive gas and working with it requires special safety precautions. Therefore, a precious alternative for this precursor is presented by organosilicon connections. There are several literature positions dealing with a use of this group of compounds in the deposition processes of silicon-containing films [23,24,25]. It should be stressed, however, that these works usually concern either single homogeneous coatings [23] or stacks of a few homogeneous layers [25]. As far as an application of these precursors in the production of “rugate” filters is concerned, there is practically no information available.
The present work reports a process of deposition of silicon carbon-oxynitride (SiONC) coatings of variable composition for the purpose of the construction of a “rugate” optical filter. To do that, the RF PE CVD technique was applied with either hexamethyldisilazane (HMDSN) or tetramethyldisilazane (TMDSN) used as a source of silicon. A mixture of gaseous N2 and O2 of continuously changing composition was used as a working gas. The coatings were characterized in detail with respect to their optical properties as well as their composition, chemical structure and surface morphology. Since better optical properties were characteristic of the films deposited from the HMDSN, this precursor was finally selected as a starting material for the production of a inhomogeneous SiOC/SiONC/SiNC films with the gradient of refraction index. The solution constitutes a subject of national patent procedure with several PL423097 (A1) PL233603 (B1). An application of that system as a “cold mirror” type of rugate interference filter is also described in this work.

2. Materials and Methods

2.1. Materials

Semicon p-type silicon wafers, 525 µm thick, of an <111> orientation, resistivity of 9–12 Ω·cm and dimensions of 15 × 15 × 0.5 mm3 were used as substrates for FTIR (Fourier Transform Infrared Spectroscopy), XPS (X-ray Photoelectron Spectroscopy) and ellipsometric investigations.
Boron-silicon glass slides and fused silica plates of the dimensions 25 × 25 × 0.2 mm3 300–700 were used as substrates for UV-Vis (Ultraviolet-Visible), AFM (Atomic Force Microscopy) and SEM (Scanning Electron Microscopy) studies as well as for preparation of the “cold mirror” type of interference filter.
Prior to deposition, all substrates were subjected to ultrasonic rinsing in 99.8% methanol for 10 min in order to remove surface fat and microparticle contamination.
As a source of silicon:
  • Sigma Aldrich hexamethyldisilazane (HMDSN) with a purity 99% and
  • abcr GmbH tetramethyldisilazane (TMDSN) with a purity 97% were used.
As working gases:
  • Linde Gas Poland, Ltd. oxygen with a purity 99.999% and
  • Linde Gas Poland, Ltd. nitrogen with a purity 99.999% were applied.

2.2. Deposition of the Coatings

In the present work, an RF PE CVD reactor (a schematic representation of which is given in reference [26]) was used for the purpose of deposition of SiNC, SiNOC and SiOC films. The stainless-steel jar-type deposition chamber of this reactor is furnished with the RF electrode, with the counter-electrode being the entire jar. The chamber volume amounts to approximately 50 dm3. Working gases and precursor vapors were introduced to the reactor through separate lines terminated with shower-type distributors. Organosilicon compound container as well as (ca. 40 cm long) vapor supply lines were heated, with the former remaining at 303 K and the latter being subjected to a temperature gradient of 308 hw–413 K, in order to avoid condensation. Precursor flow rate was constant, and amounted to 6 sccm (standard cubic centimeters per minute). Initial pressure was equal 0.5 Pa and the self-bias voltage amounted to −880 V. Both the role and the amount of self-bias voltage were optimized as described in one of our earlier works [26]. The most important deposition process operational parameters are presented in Table 1, below.
The coatings were deposited in the working atmosphere of oxygen and nitrogen with the total pressure being set constant. For that purpose, an especially designed valve system was constructed, allowing for pressure equalization in all the reactor elements. This solution is a subject of national patent procedure of several PL424592 (A1). With the help of that valve system, the reactor pressure was maintained at 20 Pa, independent of the composition of the working gas, which was changed between 100% O2 and 100% N2 at a constant total flow rate of 20 sccm. Each gas flow rate was independently regulated by a separate flow rate controller. Changes in working gas composition were performed step-wise, with the steps being not longer than 5 s, which ensured a smooth flow regulation. In the direction from oxide to nitride, deposition time amounted to 240 s, while that in the opposite direction was equal 60 s. Flow changes of working gas components were controlled with the MONITOR software. The acronyms of the samples used in this work are presented in Table 2, below.

2.3. Optical Properties

Optical properties of the coatings, such as index of refraction (n) and extinction coefficient (k), as well as their thickness, were determined using a J.A. Woollam variable angle spectroscopic ellipsometer (VASE) and the related software. All the measurements were performed in the spectral range of 260–1000 nm for three different angles of incidence (65°, 70°, 75°), with the measurement step equal 5 nm. The measurements were made in the reflectance mode and optical properties of one component coatings, either SiOC or SiNC, were modelled with a Cauchy model layer with Urbach absorption represented by the following mathematical expression:
n ( λ ) = A + B λ 2 + C λ 4
where A, B and C are parameters describing the dispersion of the refractive index n(λ). The extinction coefficient k(λ) was modelled by an exponential absorption tail. Fitting the procedure of A, B, and C parameters gave a mean square error of an order of magnitude of MSE = 20 (mean square error) for all the films examined. For each sample, average values of thickness and refractive index were computed from (at least) three ellipsometric measurements performed at different sites of the sample. Mean thickness values varied within the range of 260–1000 nm.
Gradient optical thin films, i.e., films with refractive index changing along their thickness, were analyzed using a graded layers algorithm supplied with the WVASE32 software by the ellipsometer manufacturer. In the gradient model, the real layer is divided into homogeneous sub-layers whose refractive indices ni change slightly for a particular layer (characteristic jumps of the value of n). The refractive index n profiles were determined taking into account the thickness of the film and the number of sublayers determined for the best fit of the model to the experimental data.
Transmittance of the coatings within the range of 190–1000 nm was studied with the help of ThermoScientific™ Evolution 220 UV-Vis systems. Absorbance spectra, on the other hand, were used to determine the magnitude of optical gap using the Tauc model and the following equation:
α h υ = B ( h υ E g ) m
where:
α—denotes the absorption coefficient,
h—denotes the Planck constant,
υ—denotes photon frequency,
Eg—denotes optical energy band gap,
B—denotes a constant
The value of m coefficient amounted to ½.

2.4. Surface Topography

To determine the surface morphology of the coatings, a Bruker multimode AFM microscope, equipped with a Nanoscope V controller, was used. This enabled a collection of images 10 × 10 μm2 in size. The MicroMash OTESPA type of probe had the following parameters: nominal probe radius of 7 nm, elasticity constant of 26 N/m and resonance sampling frequency of 300 kHz. All data acquisition was performed with the help of Brüker Nanoscope 7.3 software with the images being processed using the Bruker Nanoscope Analysis 1.5 application. Each measurement series was conducted on three different coatings deposited under identical conditions, with the arithmetic mean and standard deviation values being calculated from the results acquired.

2.5. XPS Spectroscopic Analysis of Elemental Composition and Chemical Structure

XPS analysis was conducted with the help of Kratos AXIS Ultra XPS spectrometer equipped with a monochromatic Al Kα source of X-rays of excitation energy of 1486.6 eV. Spectra were collected from an area of 300 × 700 µm2, with the anode power amounting to 150 W. Transfer energy of a semicircular analyzer was equal 20 eV. Due to a non-conductive character of the sample surface, an additional charge neutralizer was applied. All narrow chemical shifts for each element were calibrated with respect to the most intensive spectrum component, i.e., Si (2p) maximum positioned at 101.8 eV and assigned to a Si-N bond. Sample etching was carried out down to different depths at nine different sites of the coating. The following were the etching parameters: beam energy of 4 keV, etching time of 90 s, etching rate of 26.706 × 0.85 nm2/min, surface area etched of 2 × 2 mm2 and surface area analyzed of 200 × 200 µm2.

2.6. FTIR Analysis of Chemical Bonding

FTIR Analysis was carried out with the help of ThermoScientific model Nicolet iS50 FTIR spectrometer, working in absorbance mode and using a MCT/B beam splitter. Spectra were collected within the range of 4000 to 400 cm−1, with a resolution of 4 cm−1. Several scans in a single measurement cycle amounted to 128.

2.7. Design of a “Cold Mirror” Type of a Gradient Interference Filter

The gradient interference system was simulated with the help of the TFCalcTM 3.5 software from Software Spectra. The material database was updated with the optical properties of the layers obtained from HMDS mixed with pure oxygen or nitrogen, which had refractive indices of 1.65 and 2.22, respectively. In the next step, the database was enriched with materials obtained for intermediate mixtures of reactive gases. A complete set of materials served as an input to create the basic elements of a stack formula with a gradual change of optical properties. Such a package can be used for more complex systems by repeating and setting common optical thickness values. Filter design can be further developed and optimized by setting continuous or discrete target values for optical properties of the filter.
In the present work, a basic stack of 10 multiplications was designed without adaptations on the single layer level. Environmental details used for simulation, such as illumination, detector and medium properties, and light incident angle, were aligned with ThermoScientific™ Evolution 220 UV-Vis equipment, which was used to measure the optical properties of a real filter. The filter designed belongs to the category of edge filters. A longpass (LP) filter is an optical interference filter that attenuates shorter wavelengths and transmits (passes) longer wavelengths over the active range of the target spectrum (ultraviolet, visible, or infrared). Such filters are known as the “cold mirror” type. Longpass filters (also referred to as edge filters) have a very sharp slope and are described by the cut-on wavelength at 50 percent of the peak transmission. In the designed filter, its value was set at 290 nm.

2.8. Ihe Cross-Section of the “Cold Mirror” Gradient Optical Filter

For the assessment of the film surface morphology, a Carl Zeiss ULTRAPlus scanning electron microscope (SEM), supported with the SmartSEM software, was used. The microscope was equipped with an FEG-type cathode, allowing observations to be made at low values of accelerating voltage of 0.5–30 kV. Surface charge scattering was performed using a Carl Zeiss Car Charge Compensator mechanism. For the magnification of 60,000 times, an accelerating voltage of 2.5 kV at the distance of 6 mm was applied.

3. Results

3.1. Films of a Constant Magnitude of Refractive Index

3.1.1. Optical Properties

In the case of thin solid films deposited for optical applications, the most significant tests comprise light transmission measurements in the UV-Vis range and ellipsometric examinations. Together, they supply the principal information concerning such optical parameters of the material as levels of light absorption or transmission as well as values of optical gap (Eg), index of refraction (n) and extinction coefficient (k). In addition, they also allow one to assess film thickness (d) and surface roughness (Sr). Most of these parameters can be relatively easily correlated with the structure of the coatings. This is a reason both tests were selected as simple and fast criteria for the selection of an appropriate precursor of gradient films on one hand, and for the optimization of the deposition process on the other.
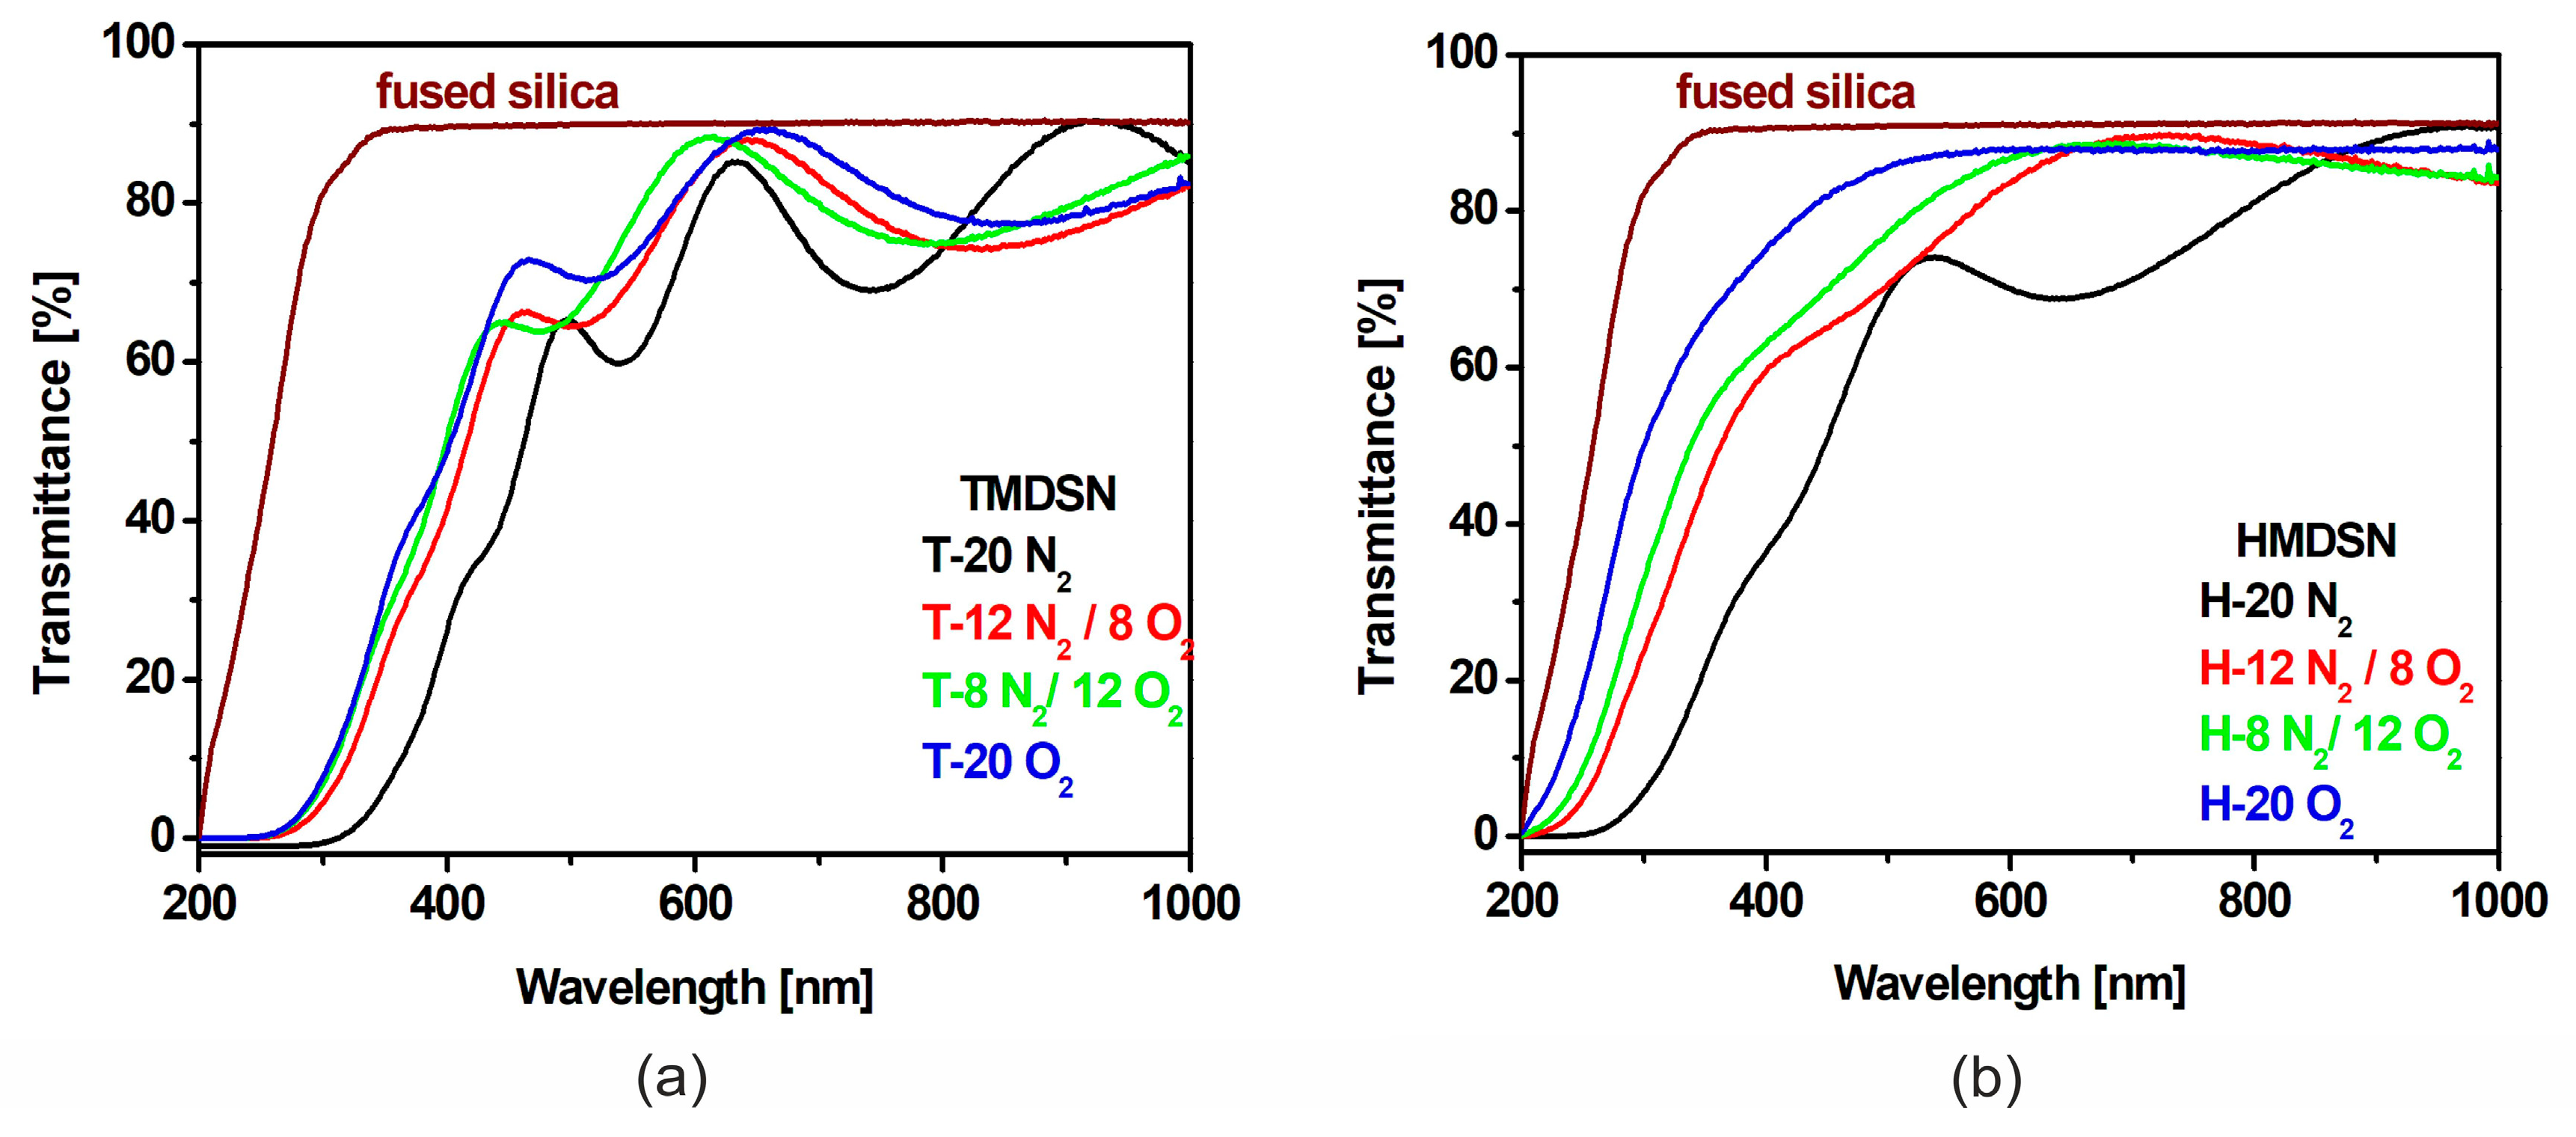
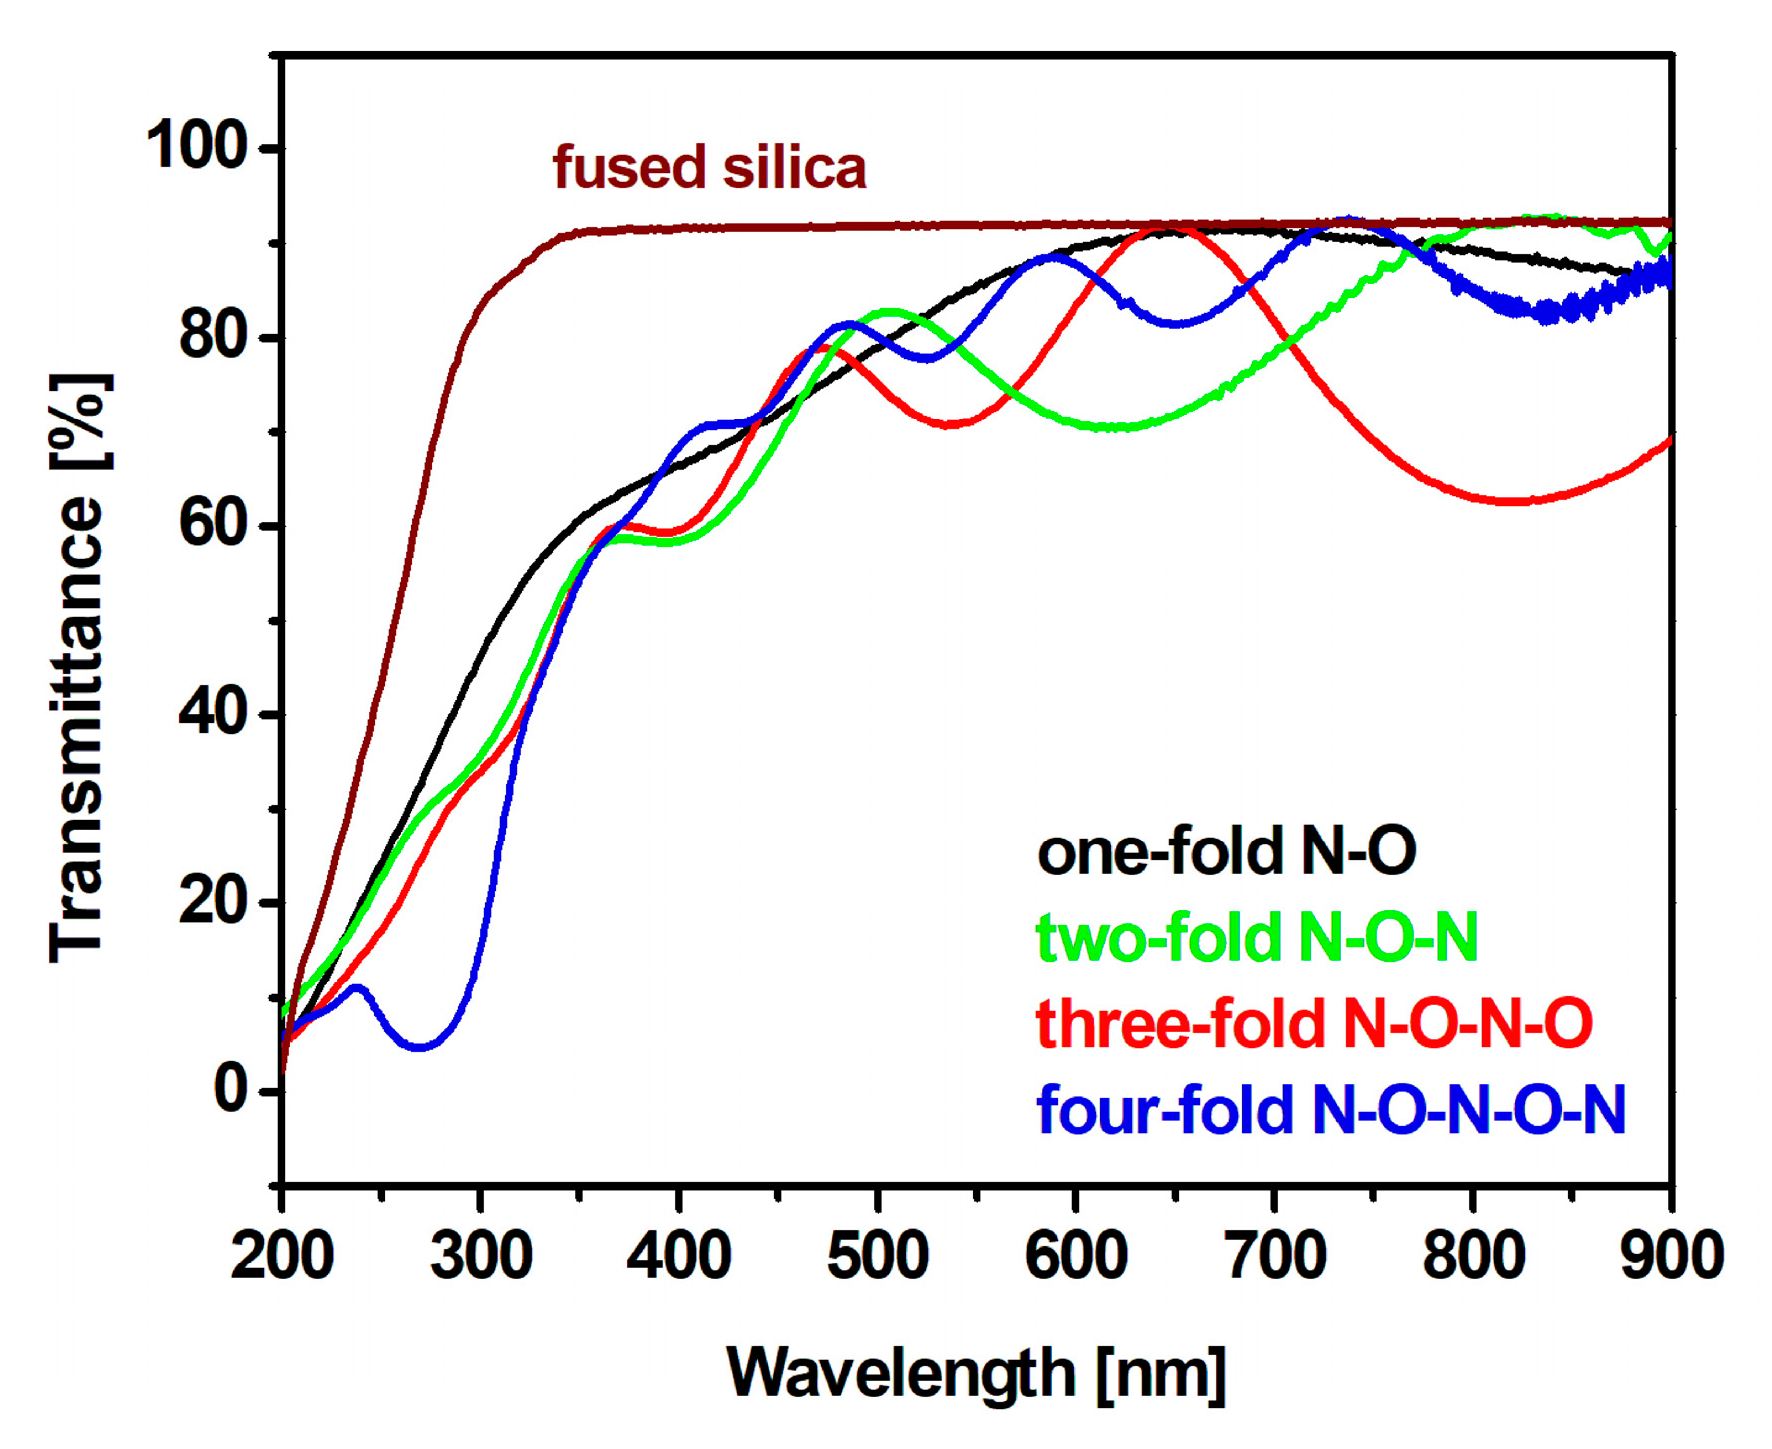
Light transmission measurements were carried out within the wavelength range of 200–1000 nm. The results for the coatings prepared from tetramethyldisilazane and from hexamethyldisilazane are presented in Figure 1, below. These coatings were deposited under conditions of different composition of working gases in order to assess the effect of nitrogen-to-oxygen ratio on their optical parameters. The total flow rate of the gas mixture was constant and amounted to 20 sccm with the actual composition of that mixture being represented by the ratio of respective flow rates also expressed in sccm units.
An analysis of the results shows that all the coatings are characteristic of good optical properties revealed by an appropriate system of interference maxima. Independent of the type of precursor, films deposited under conditions of an excess of nitrogen in the reaction mixture exhibit sharper interference maxima compared to those prepared at the excess of oxygen. This is a consequence of the fact that silicon nitrides and carbonitrides are characterized by higher values of refractive index than those of the respective oxides.
A comparison of the spectra presented in Figure 1 allows one to conclude that the coatings deposited from tetramethyldisilazane are substantially thicker that those obtained from hexamethyldisilazane, since they exhibit a larger number of interference maxima. One should remember that the time of deposition was the same in all cases, and amounted to one minute. The thickness difference is a result of a substantially higher content of carbon incorporated into the coating prepared from TMDSN [26]. An increased content of carbon in the films deposited from this precursor is also revealed by their values of absorption threshold shifted to the infrared direction. The absorption threshold of the films is also dependent on the composition of the gas mixture—the films deposited at the excess of nitrogen are characteristic of a shift towards larger wavelengths (lower energy). In addition, on the contrary, the coatings prepared under conditions of oxygen excess exhibit an absorption threshold shift towards lower wavelengths and higher energy. It is interesting to note, however, that this tendency, generally shown by the films deposited from both precursors, is substantially stronger in the case of the coatings made from HMDSN.
The effect described above finds its confirmation in the magnitudes of the optical gap Eg calculated for the respective coatings. For that purpose, the Tauc formalism was applied to the results of absorption measurements within the wavelength range of 200–1000 nm. The resulting Eg values for the coatings prepared from both precursors at different compositions of the working gas are presented in Table 3.
In general, literature reports reveal higher magnitudes of optical gap of SiO2 coatings than those of silicon nitride [27,28,29]. As seen in Table 2, the Eg value for the films deposited from TMDSN under pure oxygen conditions amounts to 3.11 eV. This result is close enough to the literature data showing the highest values of optical gap being typical for silicon oxides and remaining in the range of 3.5–9.3 eV [30,31]. The coatings made of silicon nitride are characterized by lower magnitudes of optical gap. In our case, the Eg value for the films deposited from TMDSN in pure nitrogen equals 2.93 eV, which remains in agreement with the literature data, where values within the range of 2.4–4.75 eV are reported [32]. One has to remember that the coatings presented in this work contain substantial amounts of carbon in their structure. Therefore, the respective values of silicon carbide should also be considered, and they are still lower than those of silicon nitride. Taking all the above arguments into account, one should state that a supplement of carbon lowers the magnitude of optical gap in both silicon oxide and silicon nitride coatings and the values recorded in this work remain well within the ranges reported in the literature [33,34,35].
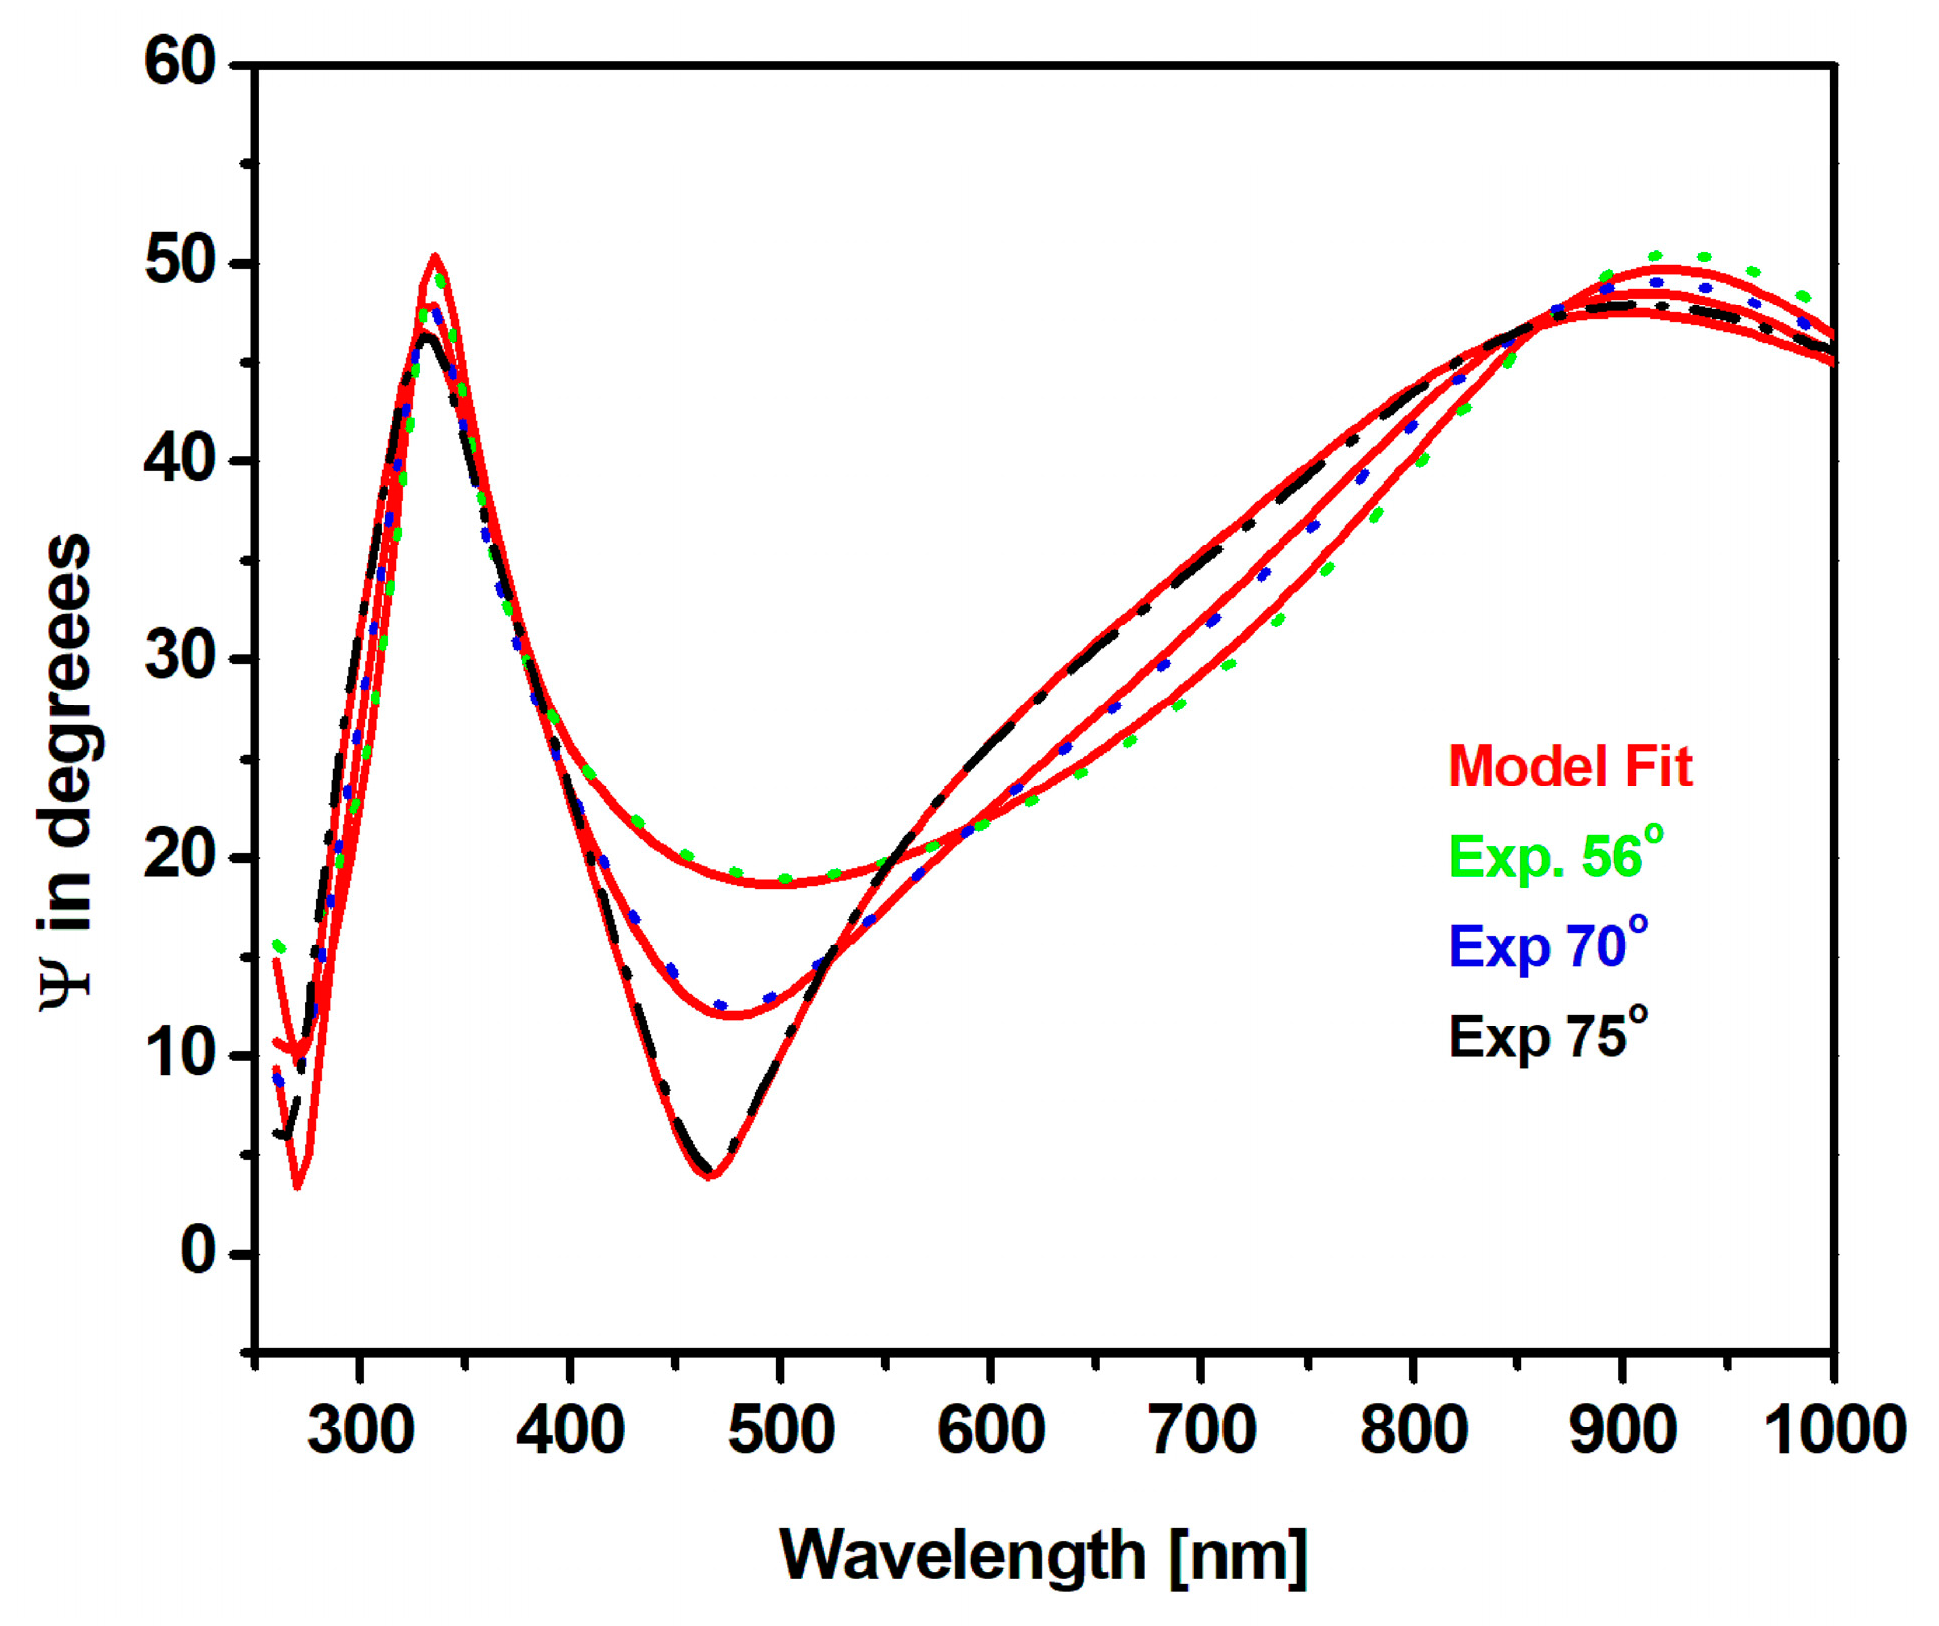
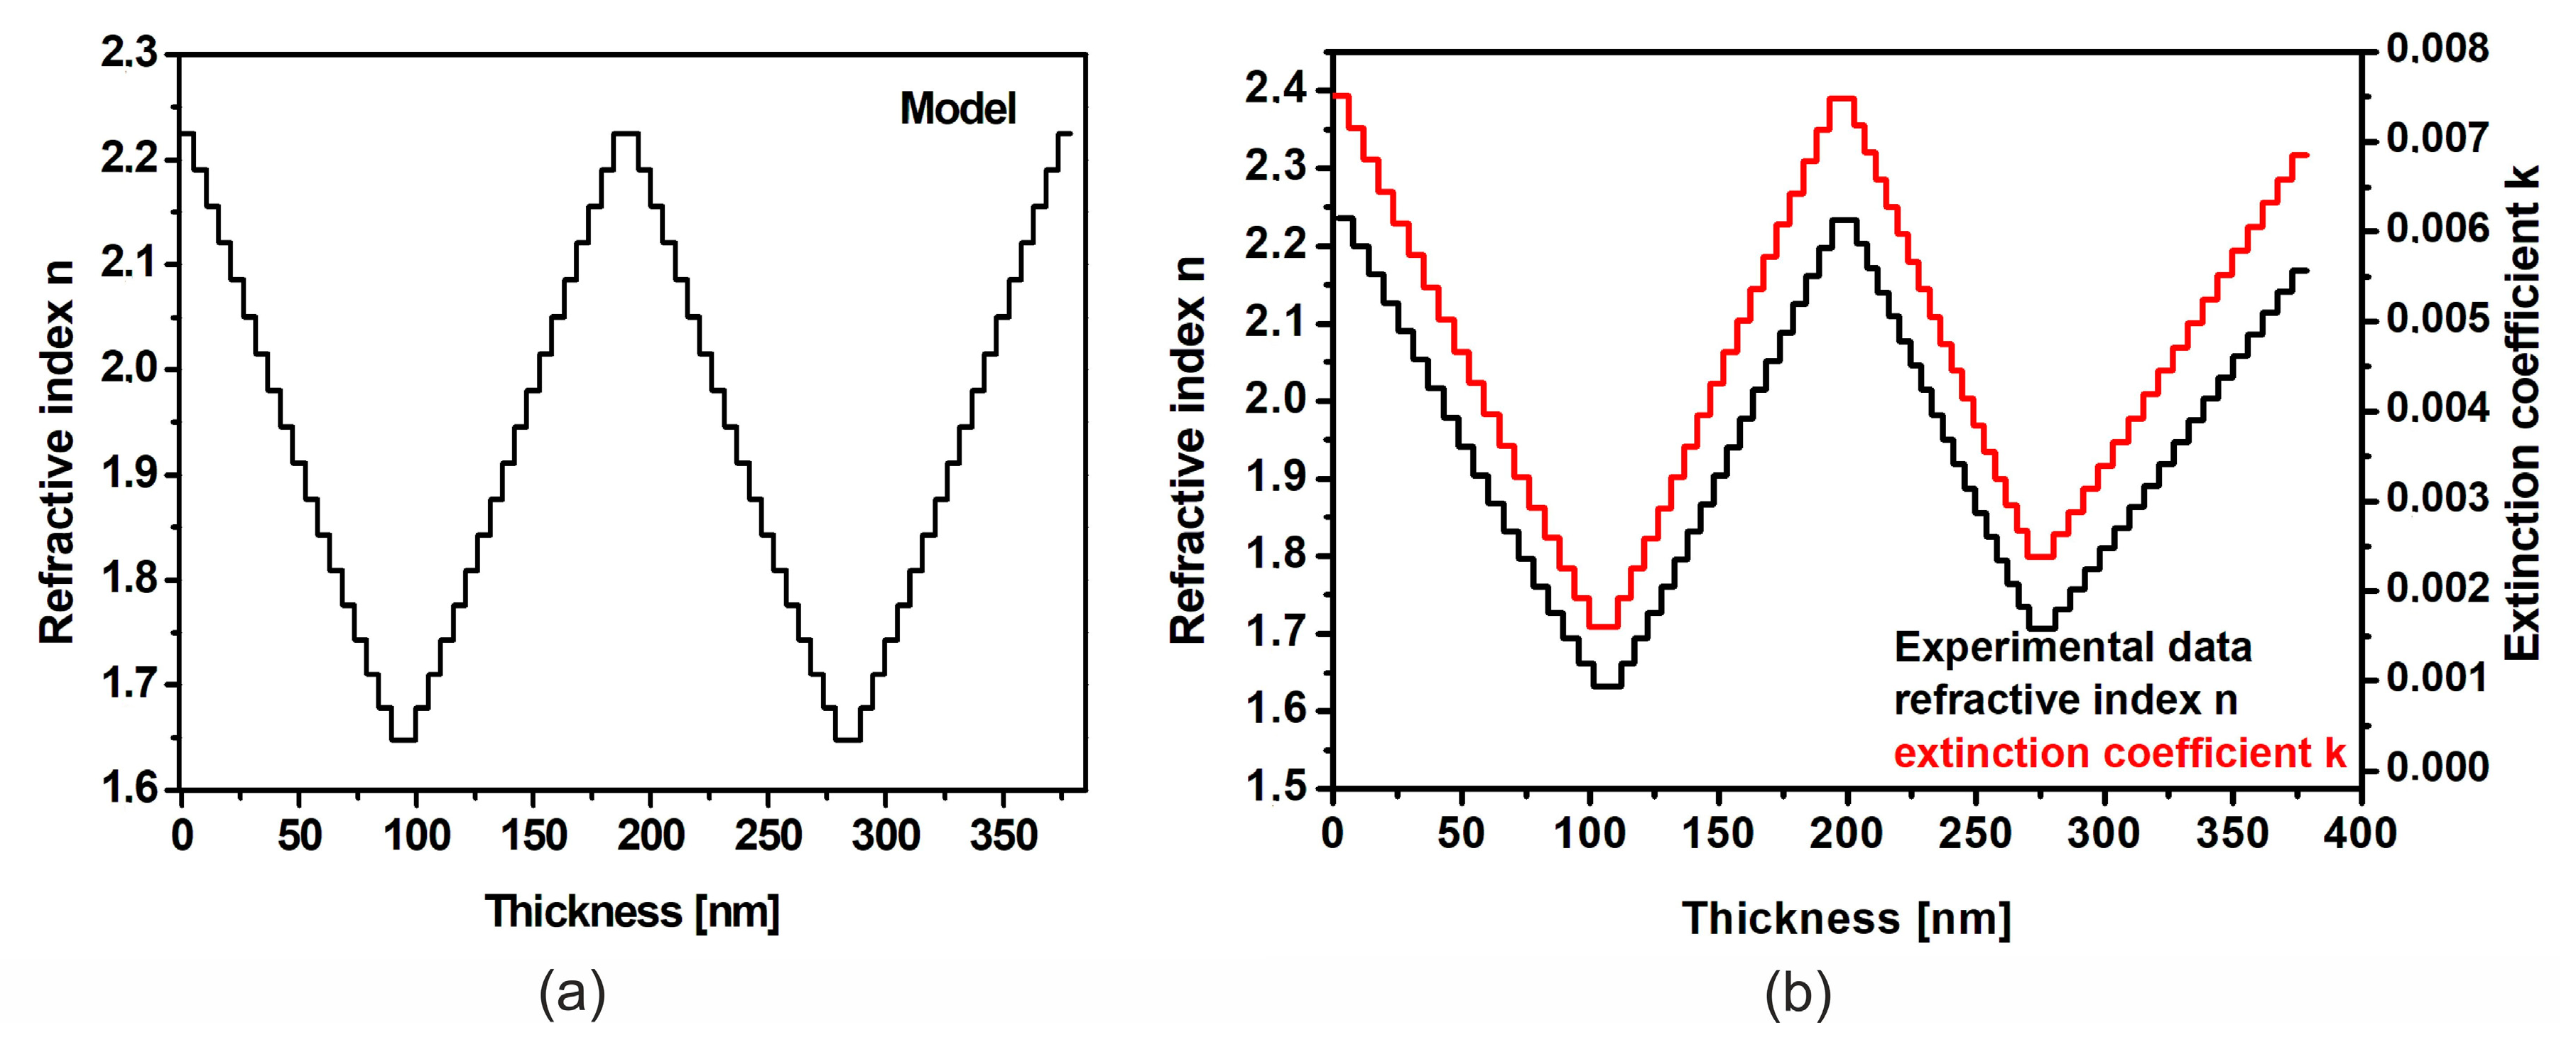
An application of VASE spectroscopic ellipsometry allows one to determine the values of n and k coefficients as well as thickness and surface roughness of the material investigated. The respective data for the coatings deposited from both precursor compounds under different compositions of working gas are presented in Table 2, below. All the VASE measurements were conducted within the spectral range of 200–1000 nm, using three different angles of incidence of 65°, 70° and 75°. These values were selected in such a manner that they comprise the Brewster angle for the coatings produced. As a basis for the calculations, the Cauchy’s model, often used for this type of materials [36,37,
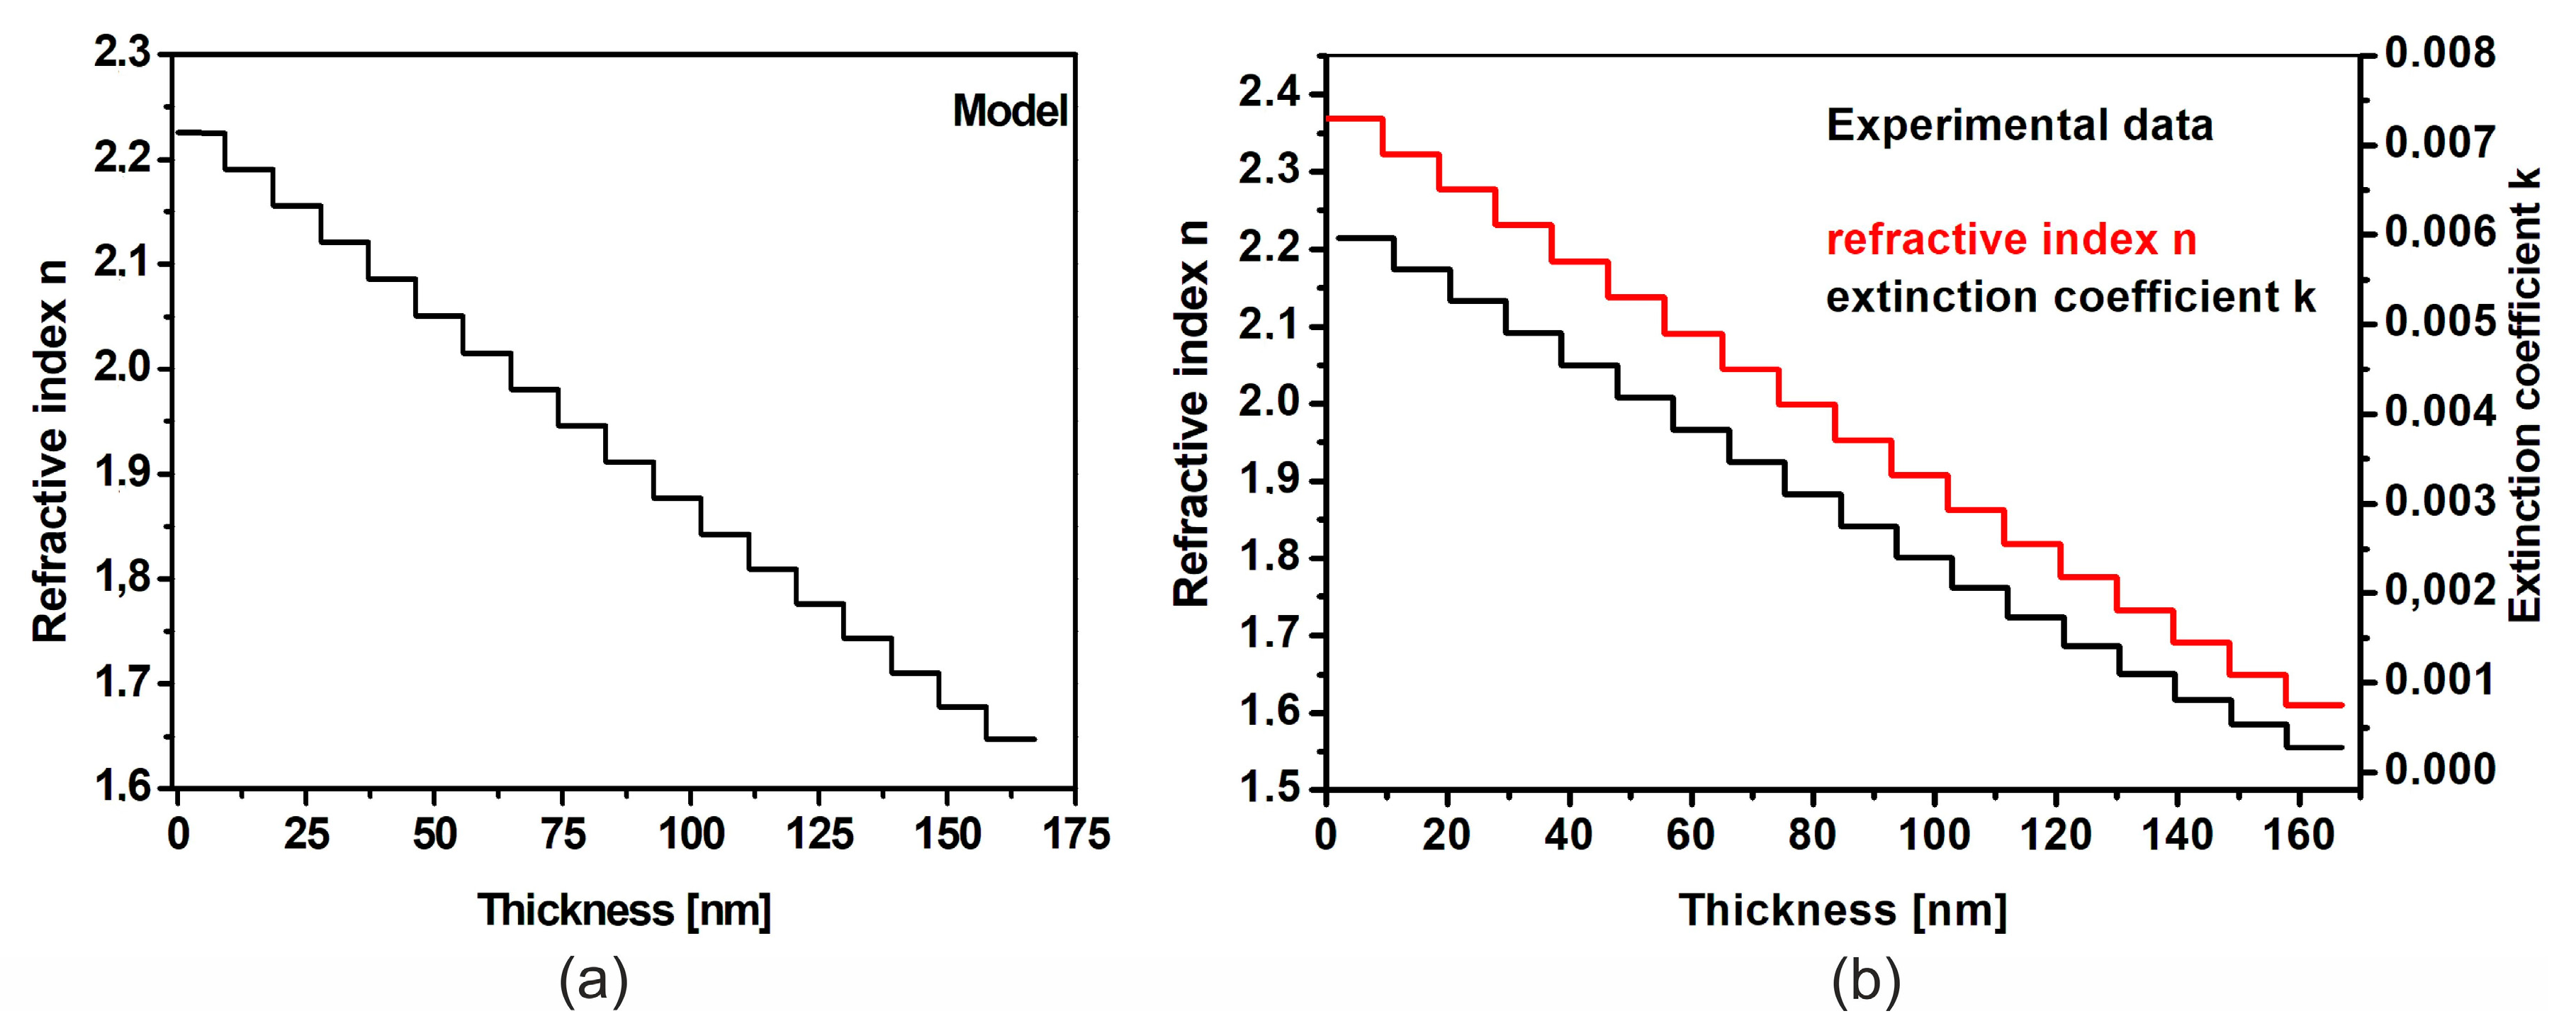
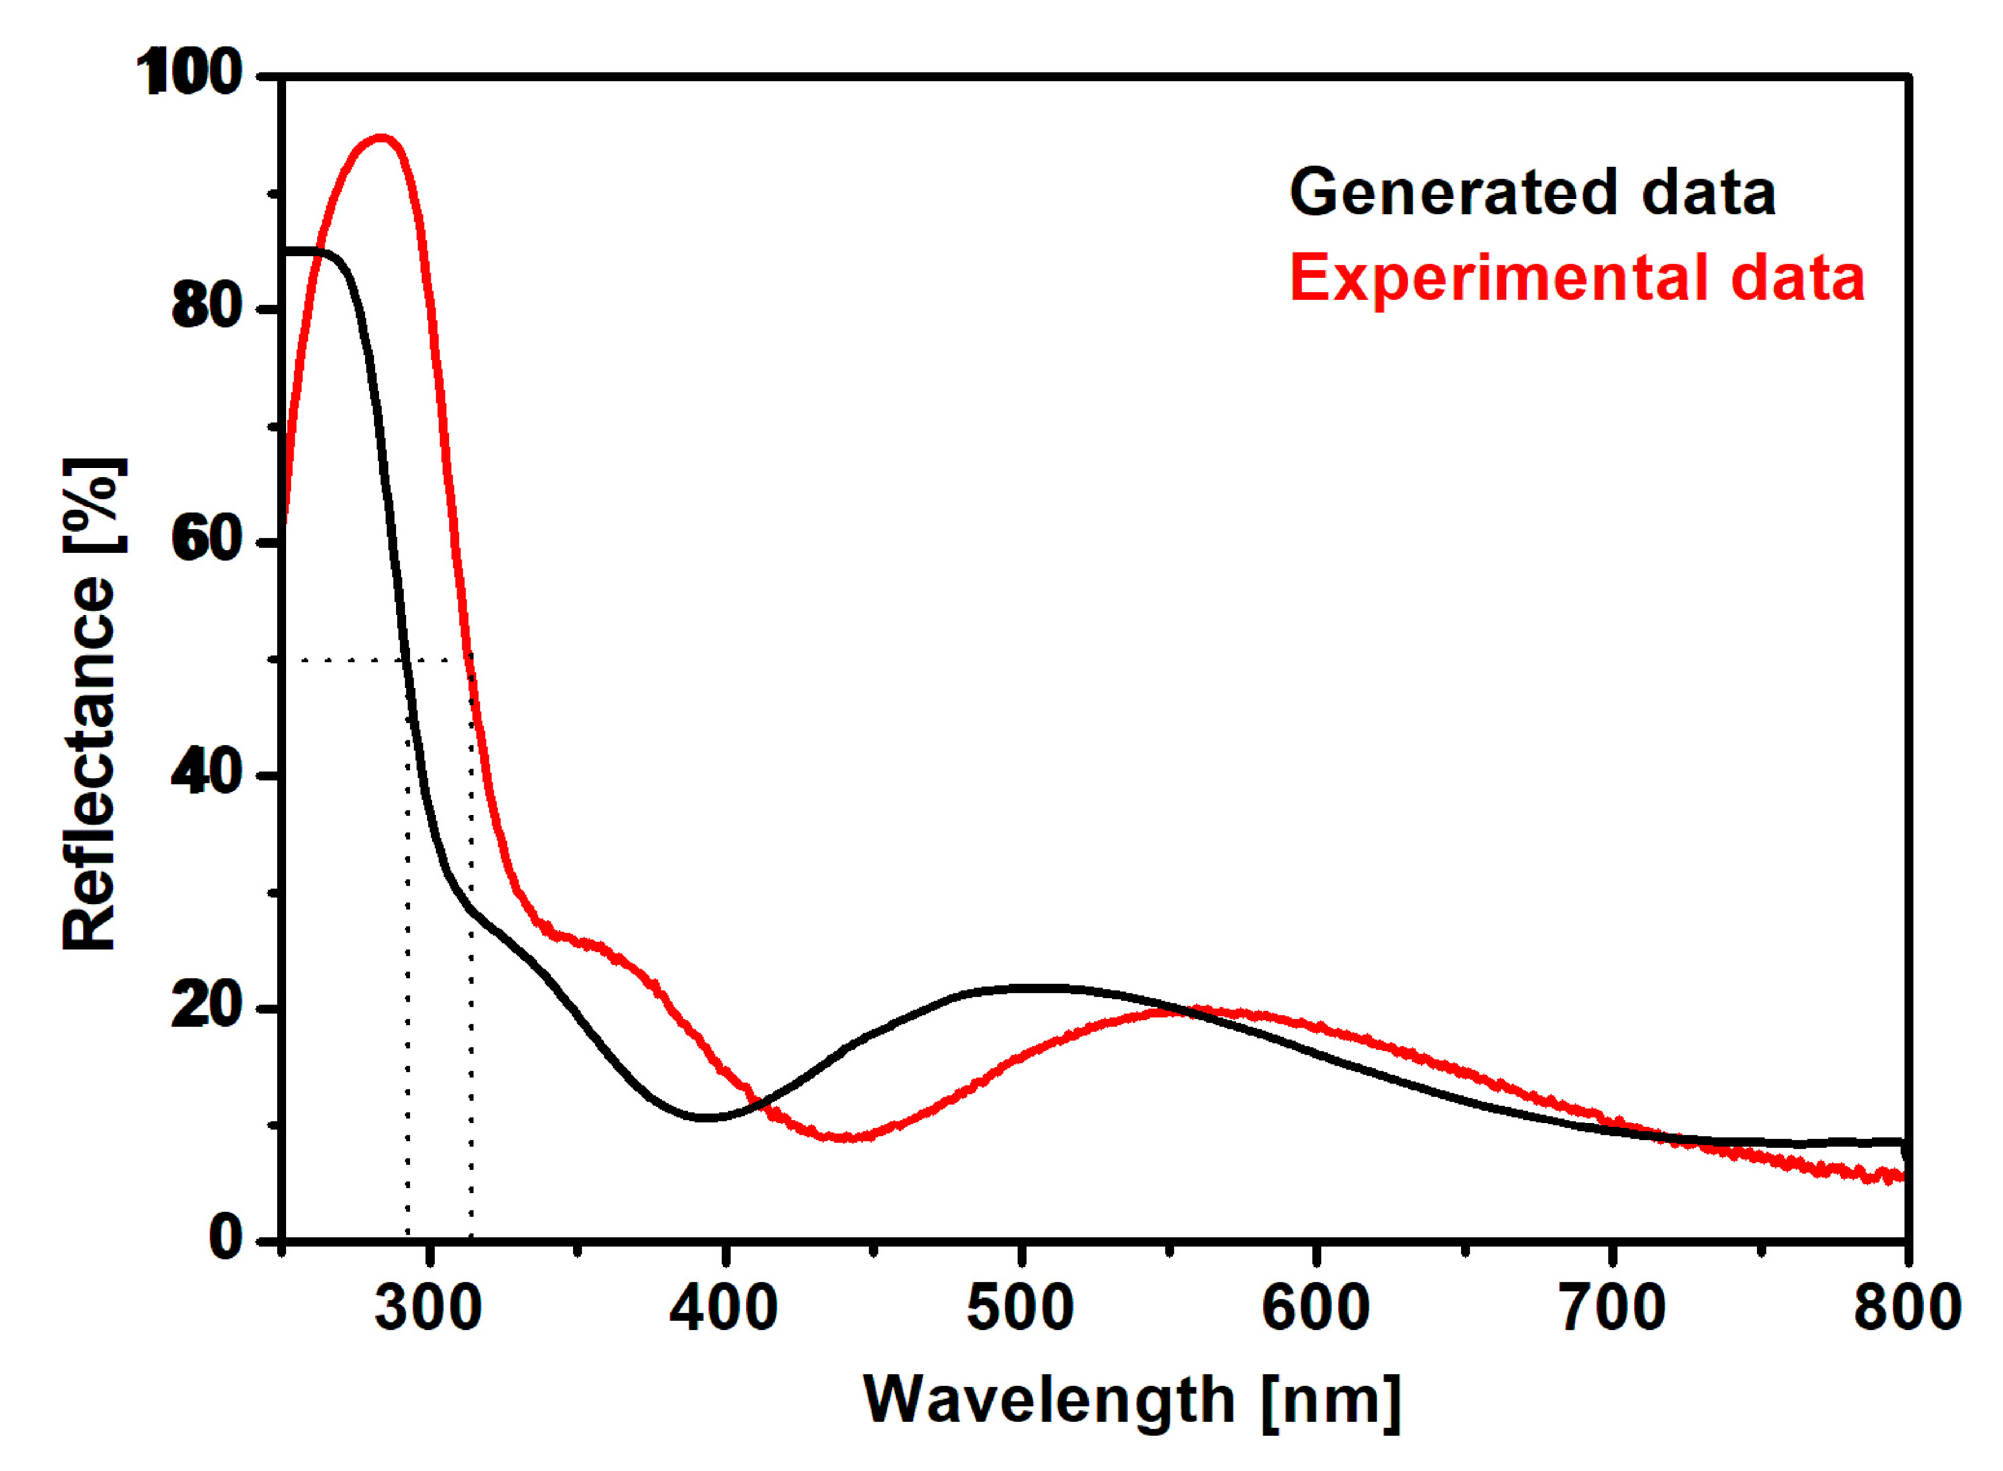
38], was assumed. An example of ψ angle measurement results together with the fitting of the above model for a coating prepared in pure oxygen is presented in Figure 2. When considering the relationship presented, one can observe a slight departure of the model from the experimental data within the 250–280 nm range, resulting from higher absorption in this range. Further studies have shown a responsibility for that absorption of carbon containing chemical moieties. Despite the above difference, the MSE fitting error is small and it amounts to 12.
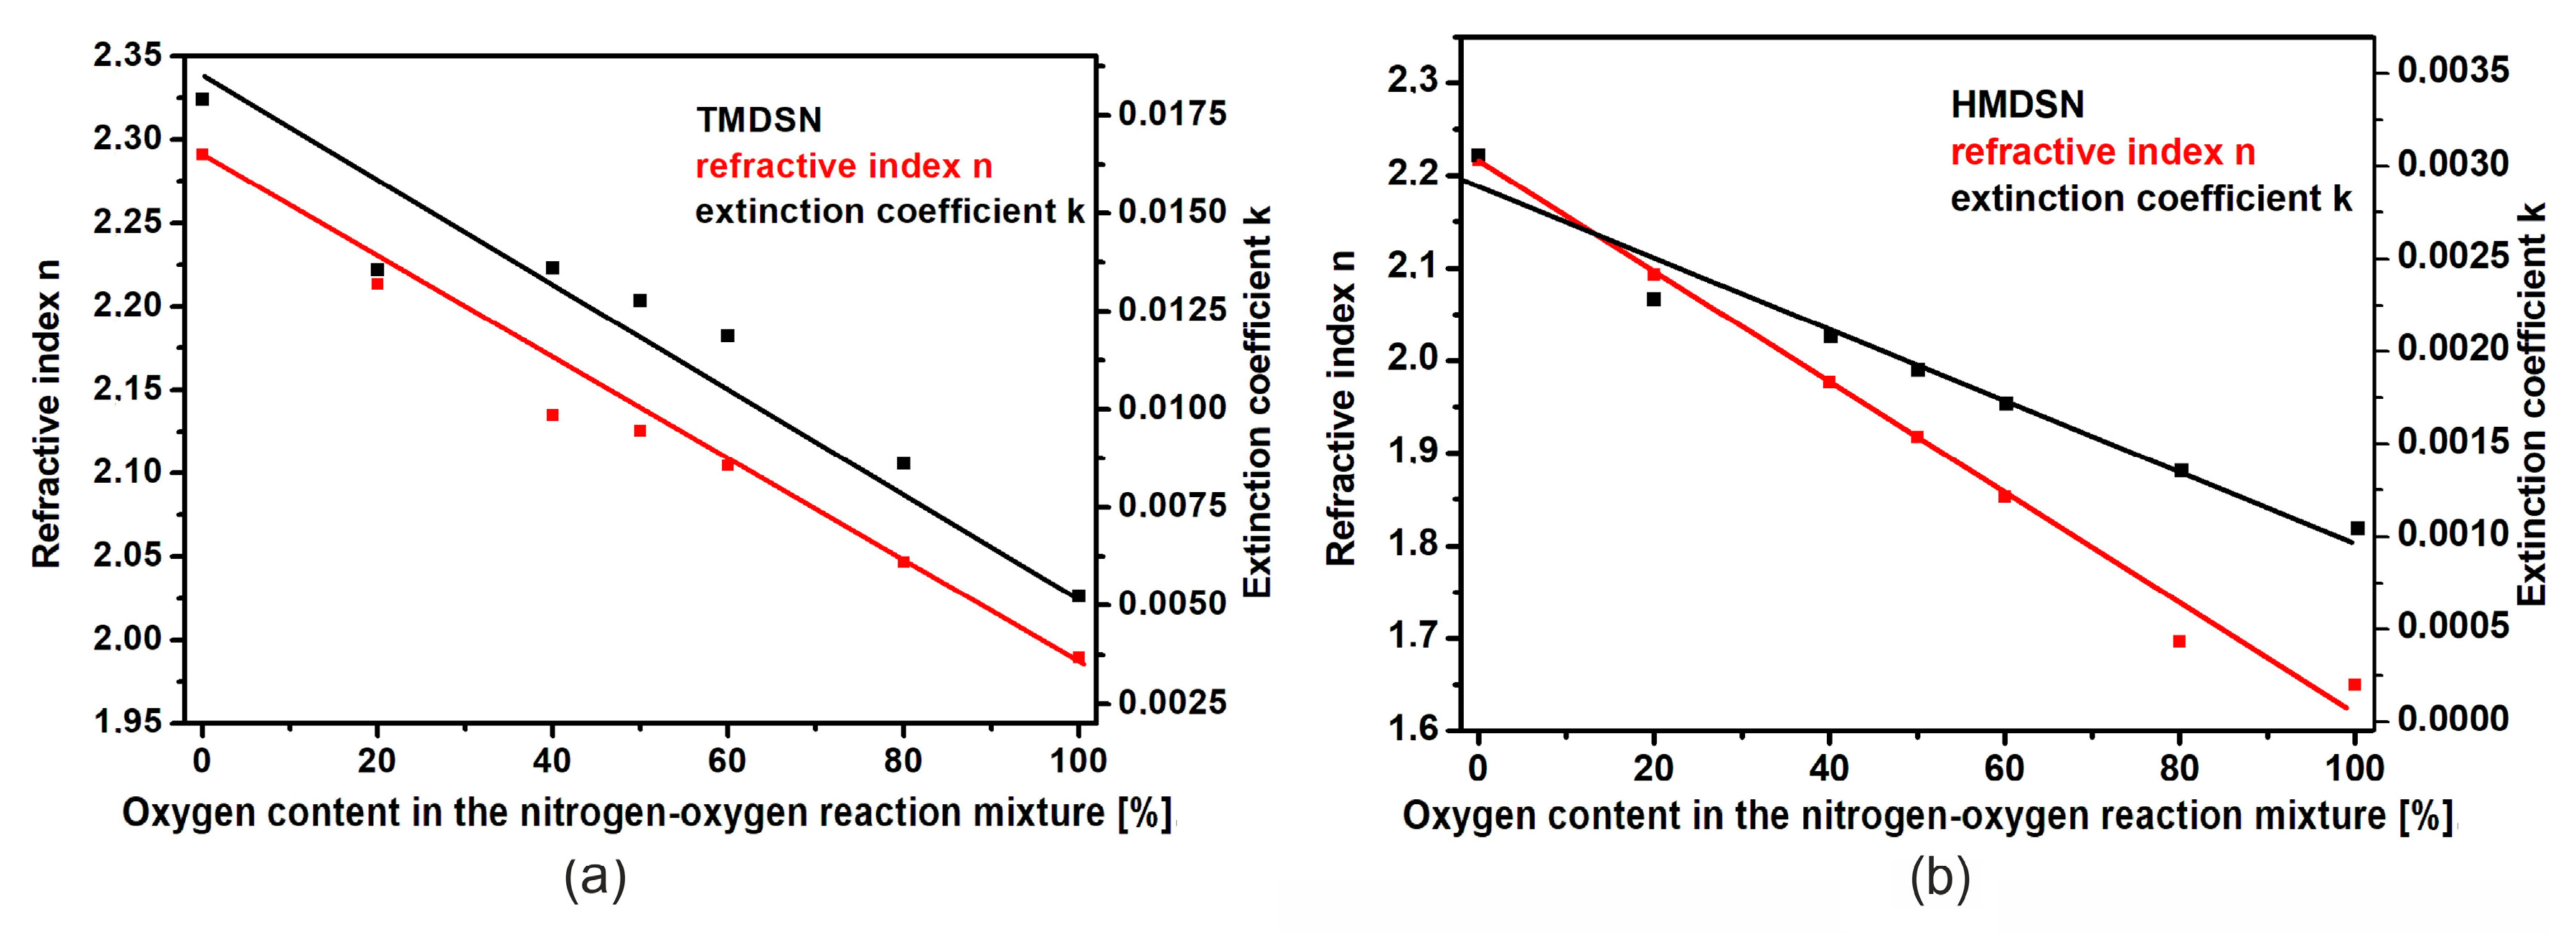
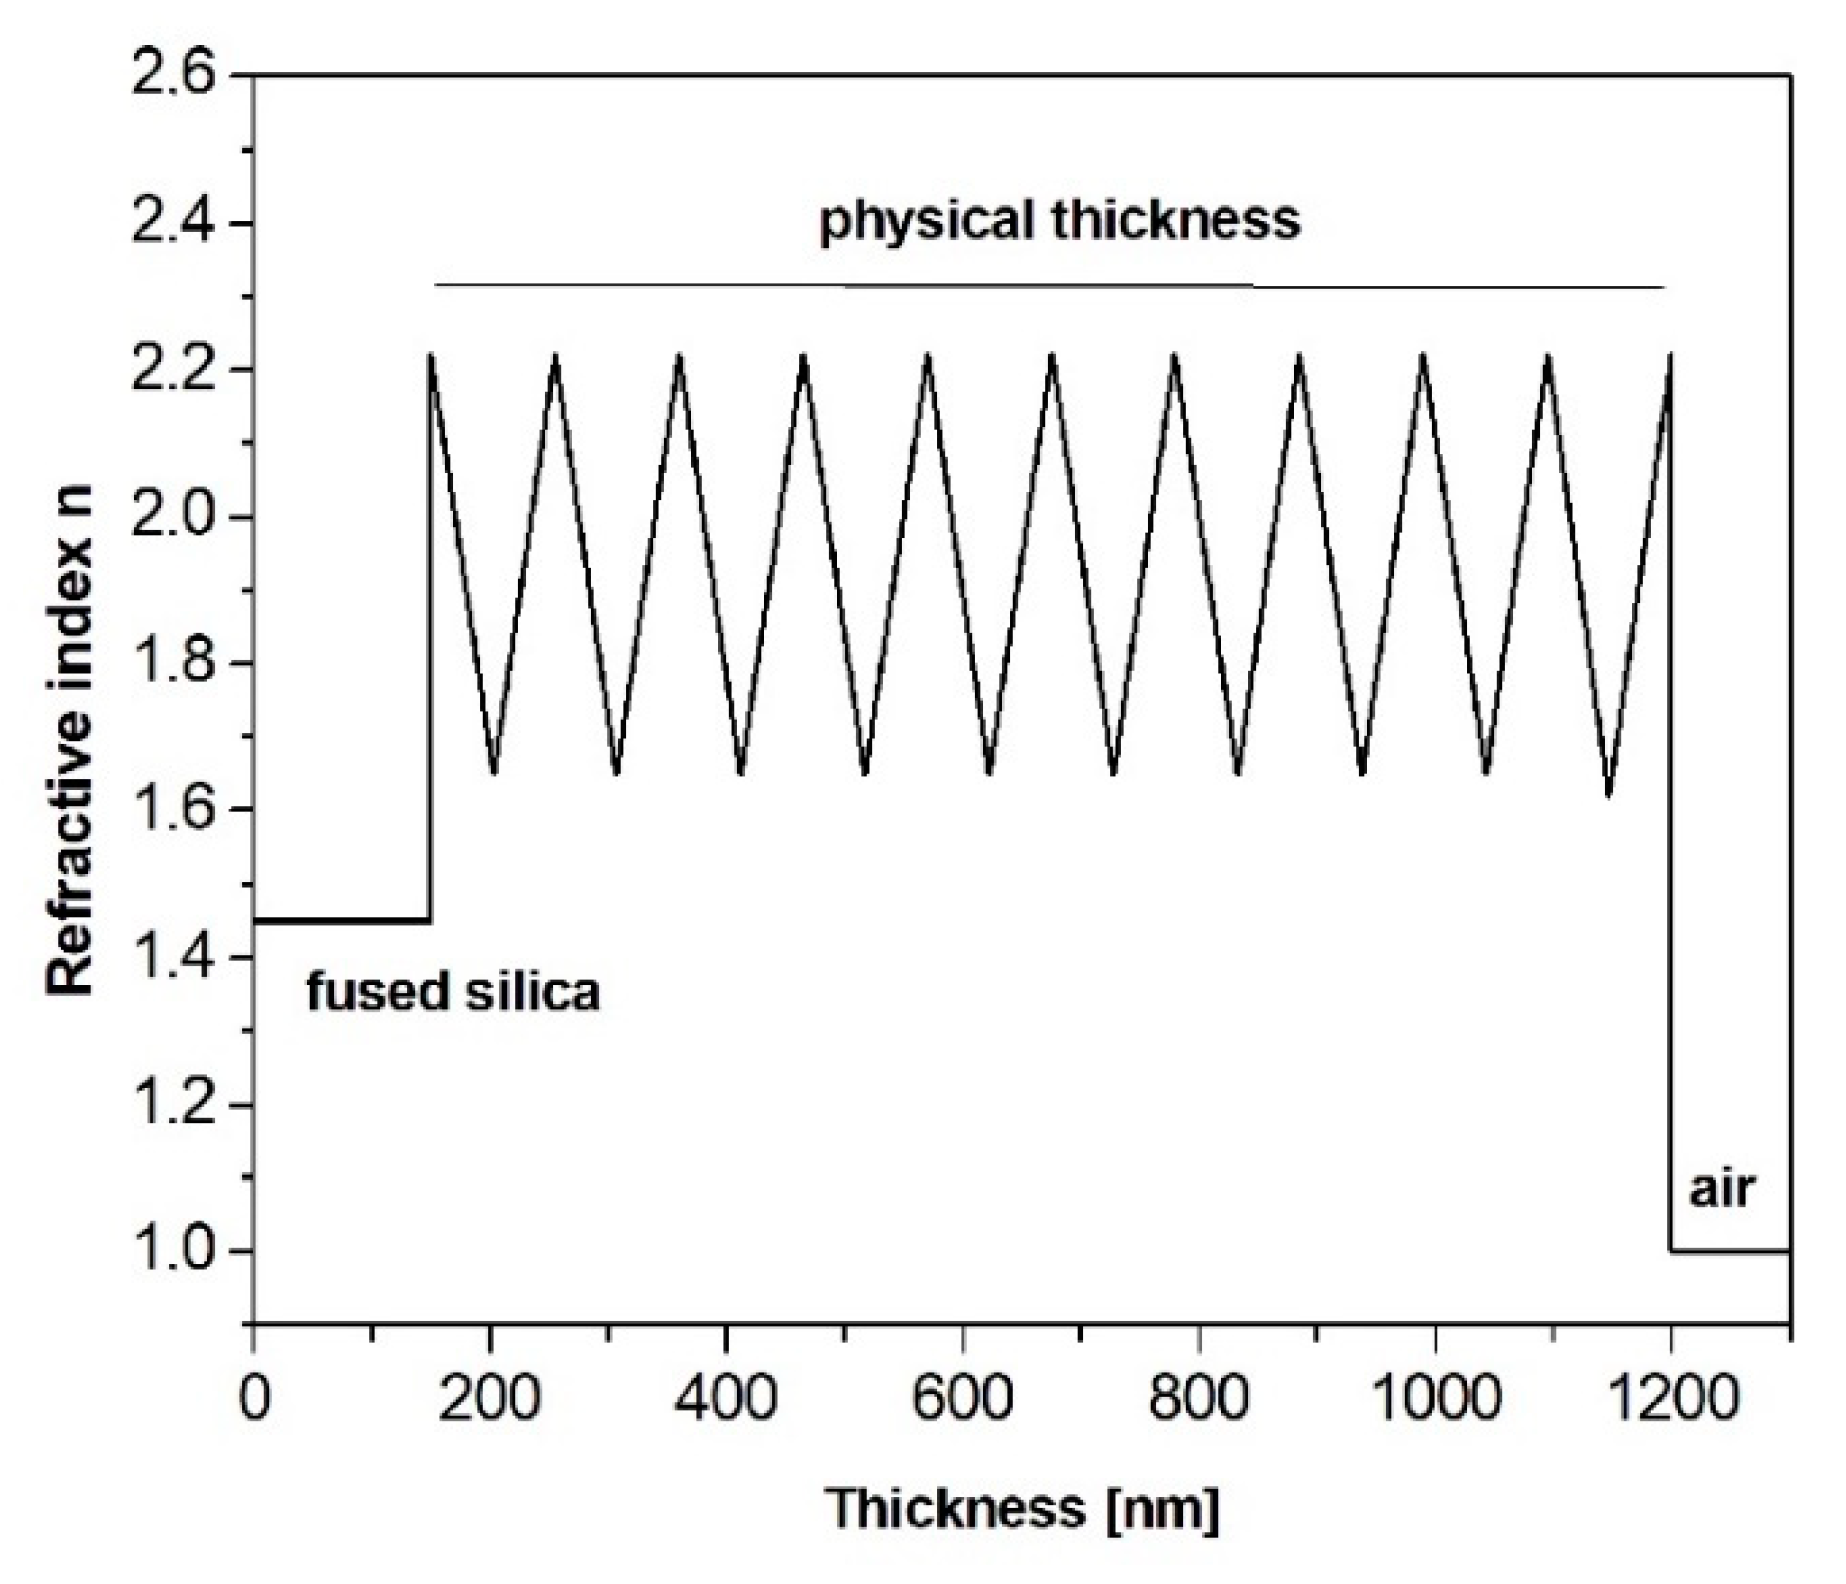
The results acquired from ellipsometric measurements conducted for the coatings deposited from both TMDSN and HMDSN at different oxygen concentrations are presented in Figure 3. They show unambiguously that, by changing the composition of the gaseous reaction mixture, one is able to deposit coatings characterized by low index of refraction when depositing in pure oxygen atmosphere and those of high index of refraction when using a pure nitrogen atmosphere. When, however, a mixture of oxygen and nitrogen is used as the working gas, then depending on their proportions, a coating characterized by a refractive index within the range of 2.31–1.99 for TMDSN precursor and within the range of 2.22–1.65 for HMDSN precursor is obtained. It was thus proven in these studies that, by using a gaseous reaction mixture of a changing composition, coatings of variable optical parameters can be obtained.
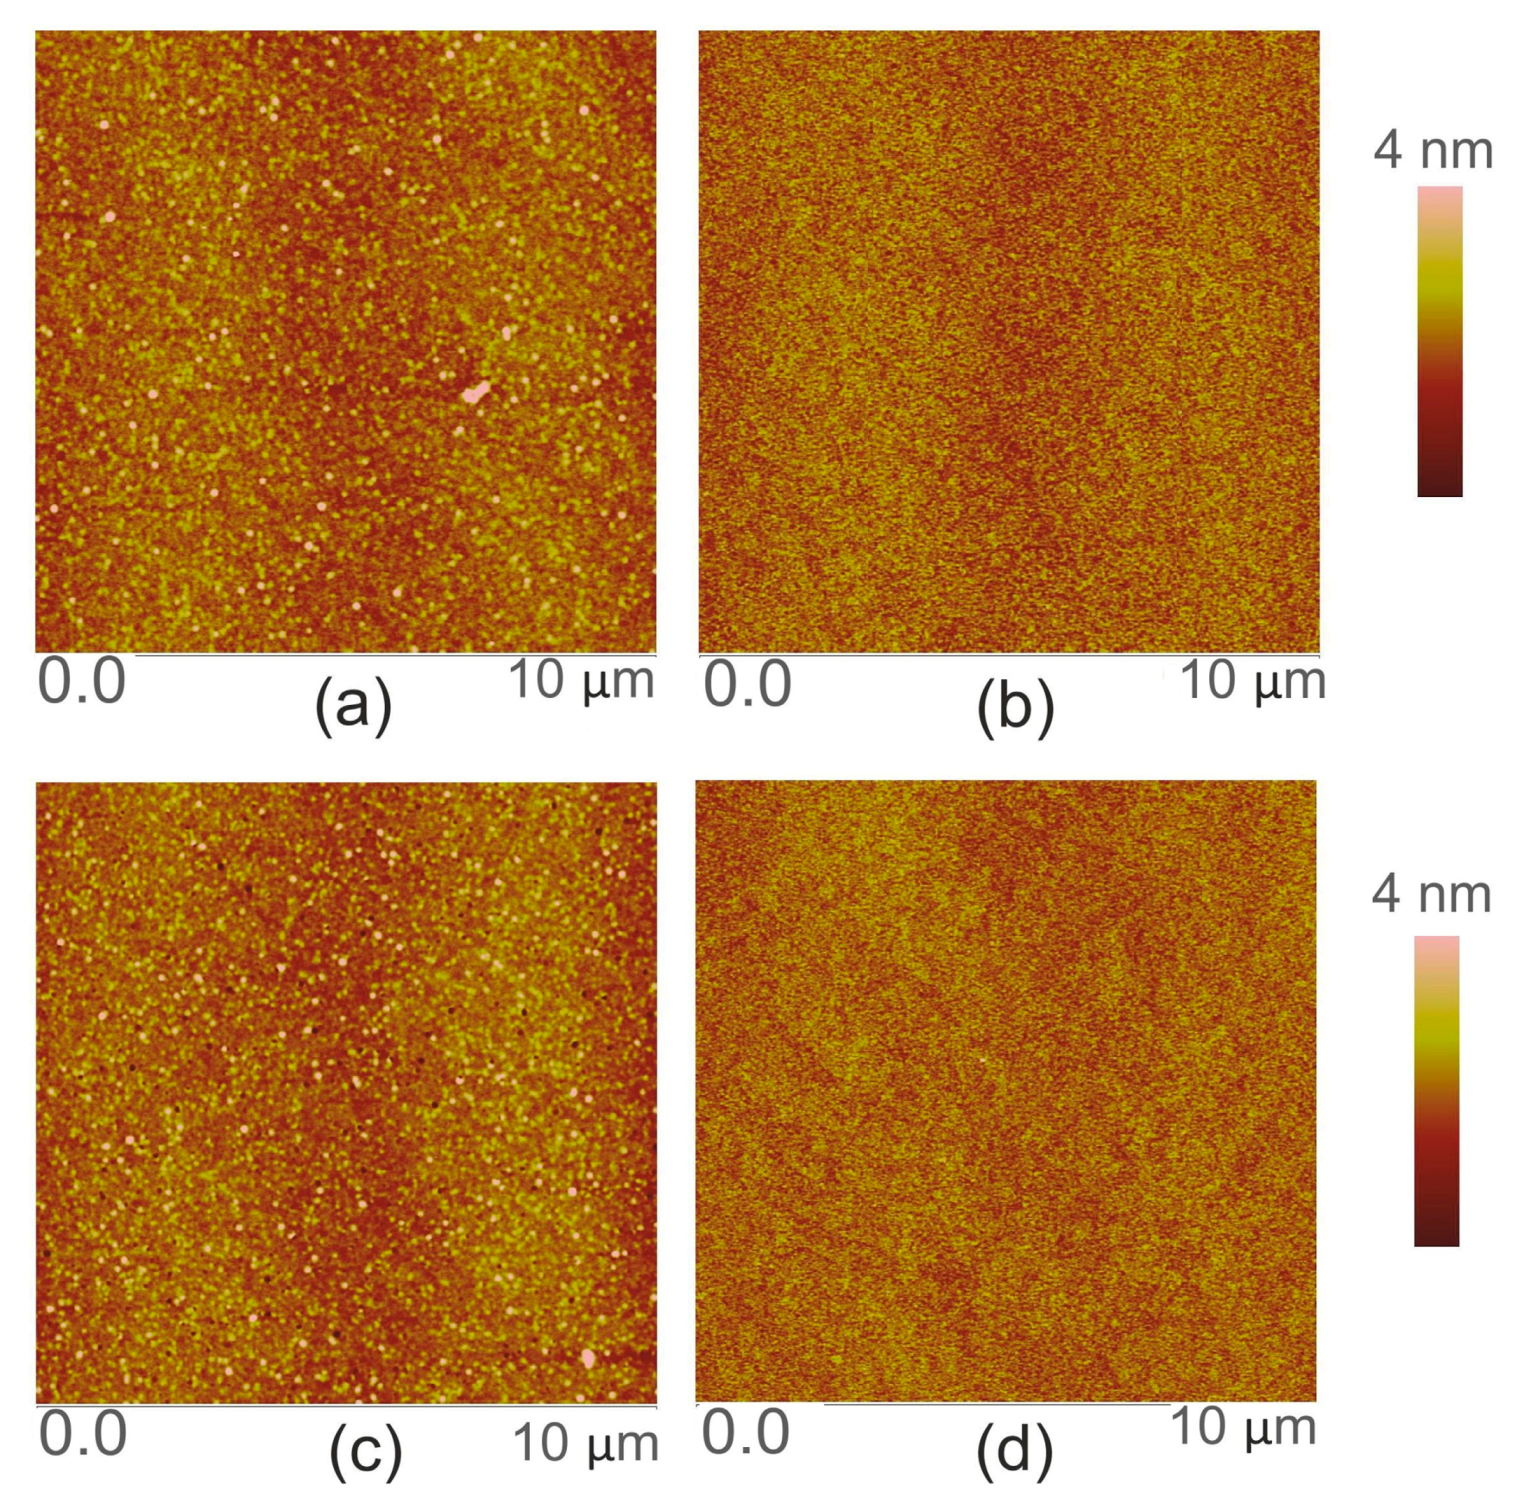
The relationships presented above reveal high magnitudes of extinction coefficient of the coatings. They are still higher in the case of the films obtained under high nitrogen content conditions and lower for those deposited at high oxygen concentrations. In thin solid films, the extinction coefficient k usually depends on two factors. One is light absorption. As revealed by the UV-Vis transmission measurements, the materials under investigation primarily absorb in the 200–400 nm range, with substantially higher absorption exhibited by the coatings produced at higher nitrogen concentrations. This effect is a result of a presence of carbon in these films. Another important phenomenon is surface roughness. The rougher the surface is, the larger the fraction of radiation that undergoes scattering, thus affecting the magnitude of extinction coefficient. Ellipsometric measurements allow one to assess the roughness Sr of a given sample. The results obtained for the coatings under investigation are presented in Table 2 below. As seen in the table, surface roughness of the coatings deposited from TMDSN is far higher than that of the films obtained from HMDSN. This finding has been confirmed by surface topography examination with the help of AFM microscopy.
Ellipsometric measurements also provide data concerning sample thickness. The results presented in Table 2 show that, despite the fact that for all the samples deposition time amounts to 60 s, the coatings deposited from TMDSN are ca. two times thicker than those obtained from HMDSN. In both precursor molecules, there are two atoms of silicon. At the same time, there are four atoms of carbon in TMDSN and six atoms of carbon in HMDSN. The thickness and deposition rate differences result from the deposition mechanism, in which an important role is played by silyl radicals [39]. Due to the differences in bond energy, these radicals are much easier to form by a cleavage of Si-H bonds (E = 298 kJ/mole) than by a decomposition of Si-C bonds (E = 435 kJ/mole) [40]. A presence of the former bonds in a TMSDN molecule substantially enhances deposition, at the same time leading to an unfortunate incorporation of larger amounts of carbon.
From the results presented above, one can conclude that the optical quality of the coatings strongly depends on the composition of the reaction mixture. Those deposited in pure nitrogen atmosphere are characterized by high values of refractive index, amounting to 2.3 and to 2.2 for TMDSN and HMDSN, respectively. For samples deposited in pure oxygen, the same values amount to 1.99 and 1.65. In addition, the coatings deposited from TMDSN are of a lower optical quality than those obtained from HMDSN. An index of refraction of stoichiometric silica equals 1.45 [41]. To design and manufacture optical interference filters, one needs two materials: one of a high (nH) and one of a low (nL) value of refractive index. These two values should considerably differ from one another. In the case of the coatings deposited from TMDSN, that difference amounts to 0.32, and it is equal 0.57 for those obtained from HMDSN. In addition, the films deposited from TMDSN are characterized by higher absorption in the range of 200–400 nm.

3.1.2. Surface Topography Studies

To project surface topography of the coatings, AFM microscopic observations were carried out. Surface images of the samples deposited from both precursor compounds at different compositions of working gas mixture are presented in Figure 4. The images presented reveal a relatively homogeneous structure stripped of large hills and other inequities.
Based on the AFM observations, measurements of surface roughness have been performed, and their results, such as arithmetic mean of the profile departure from the average line (Ra) and mean squared deviation of the surface roughness (Rq), are presented in Table 4 below. As seen in the table, a coating becomes smoother and smoother with an increasing concentration of oxygen. This tendency was observed in all samples, independent of whether TMDSN or HMDSN was used as a precursor compound. In addition, slightly lower values of Ra i Rq parameters were observed in the case of the coatings deposited from HMDSN, which corresponds well with the results of optical roughness measurements performed with the help of ellipsometry.
Taking into account the results of optical measurements as well as those of surface topography, one can conclude that the coatings deposited from HMDSN precursor are characterized by better quality and higher homogeneity. It was due to these reasons that the further studies were confined to the coatings obtained from HMDSN as a precursor more suitable for a successful design and manufacture of an interference optical filter with a gradient of refractive index.

3.1.3. Elemental Composition and Chemical Structure Studies Conducted with the Help of XPS Spectroscopy

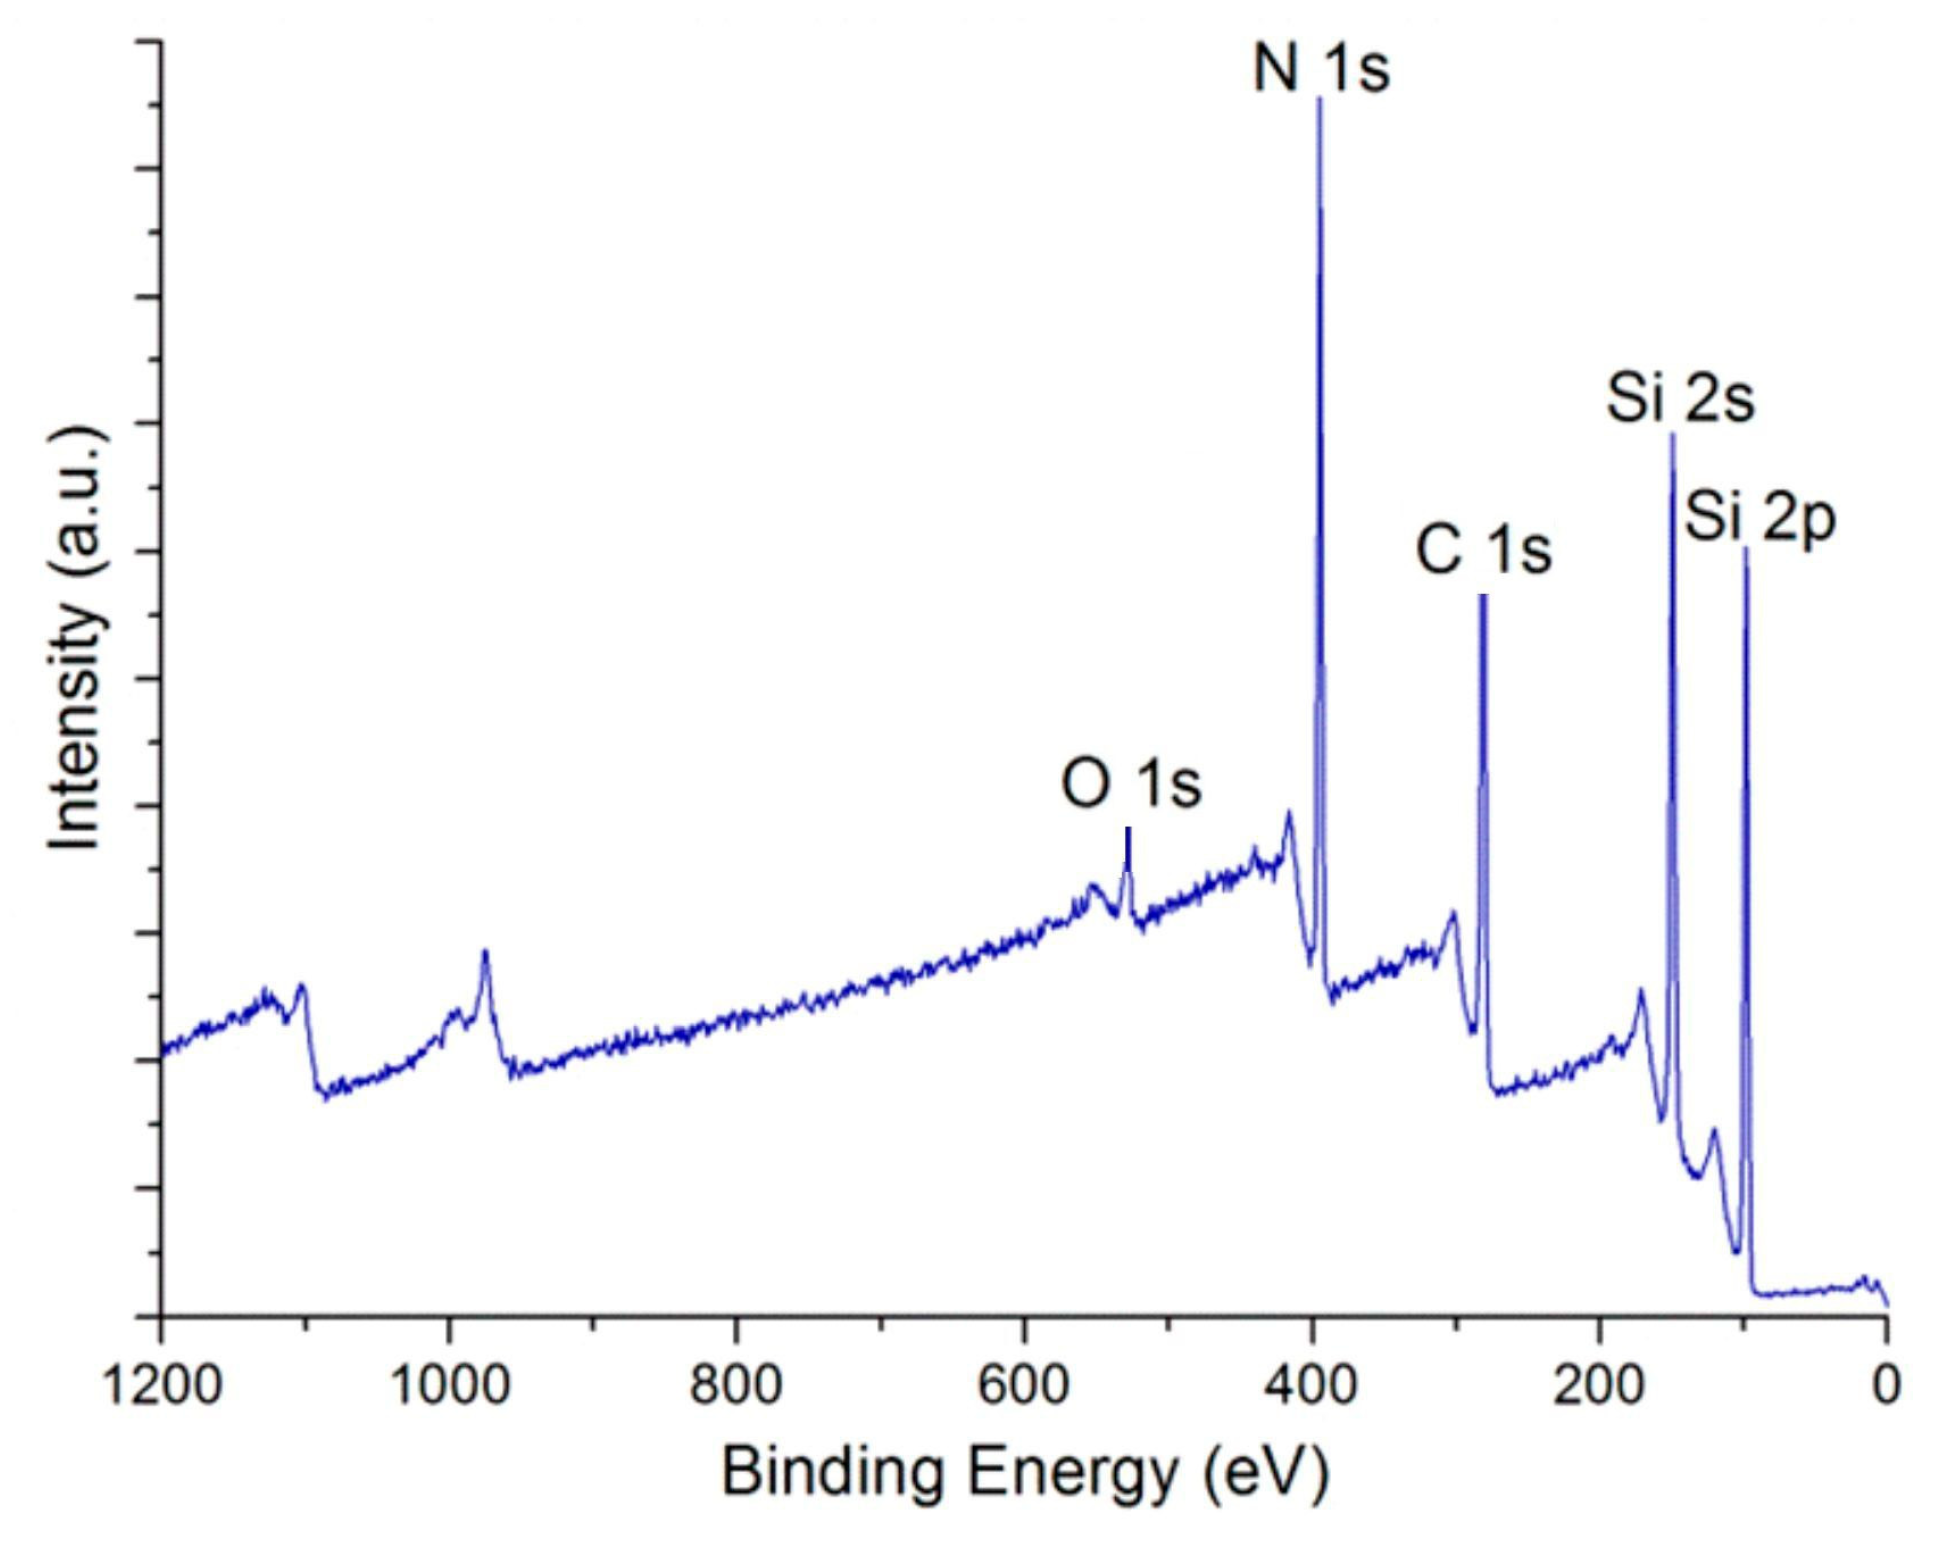
XPS studies allowed for an assessment of qualitative as well as quantitative composition of the coatings deposited under conditions of different composition of the working gas mixture. An example of a wide scan XPS spectrum of a coating deposited in pure nitrogen atmosphere is shown in Figure 5, while Table 5 presents elemental composition of the films compared with that of the HMDSN precursor compound.
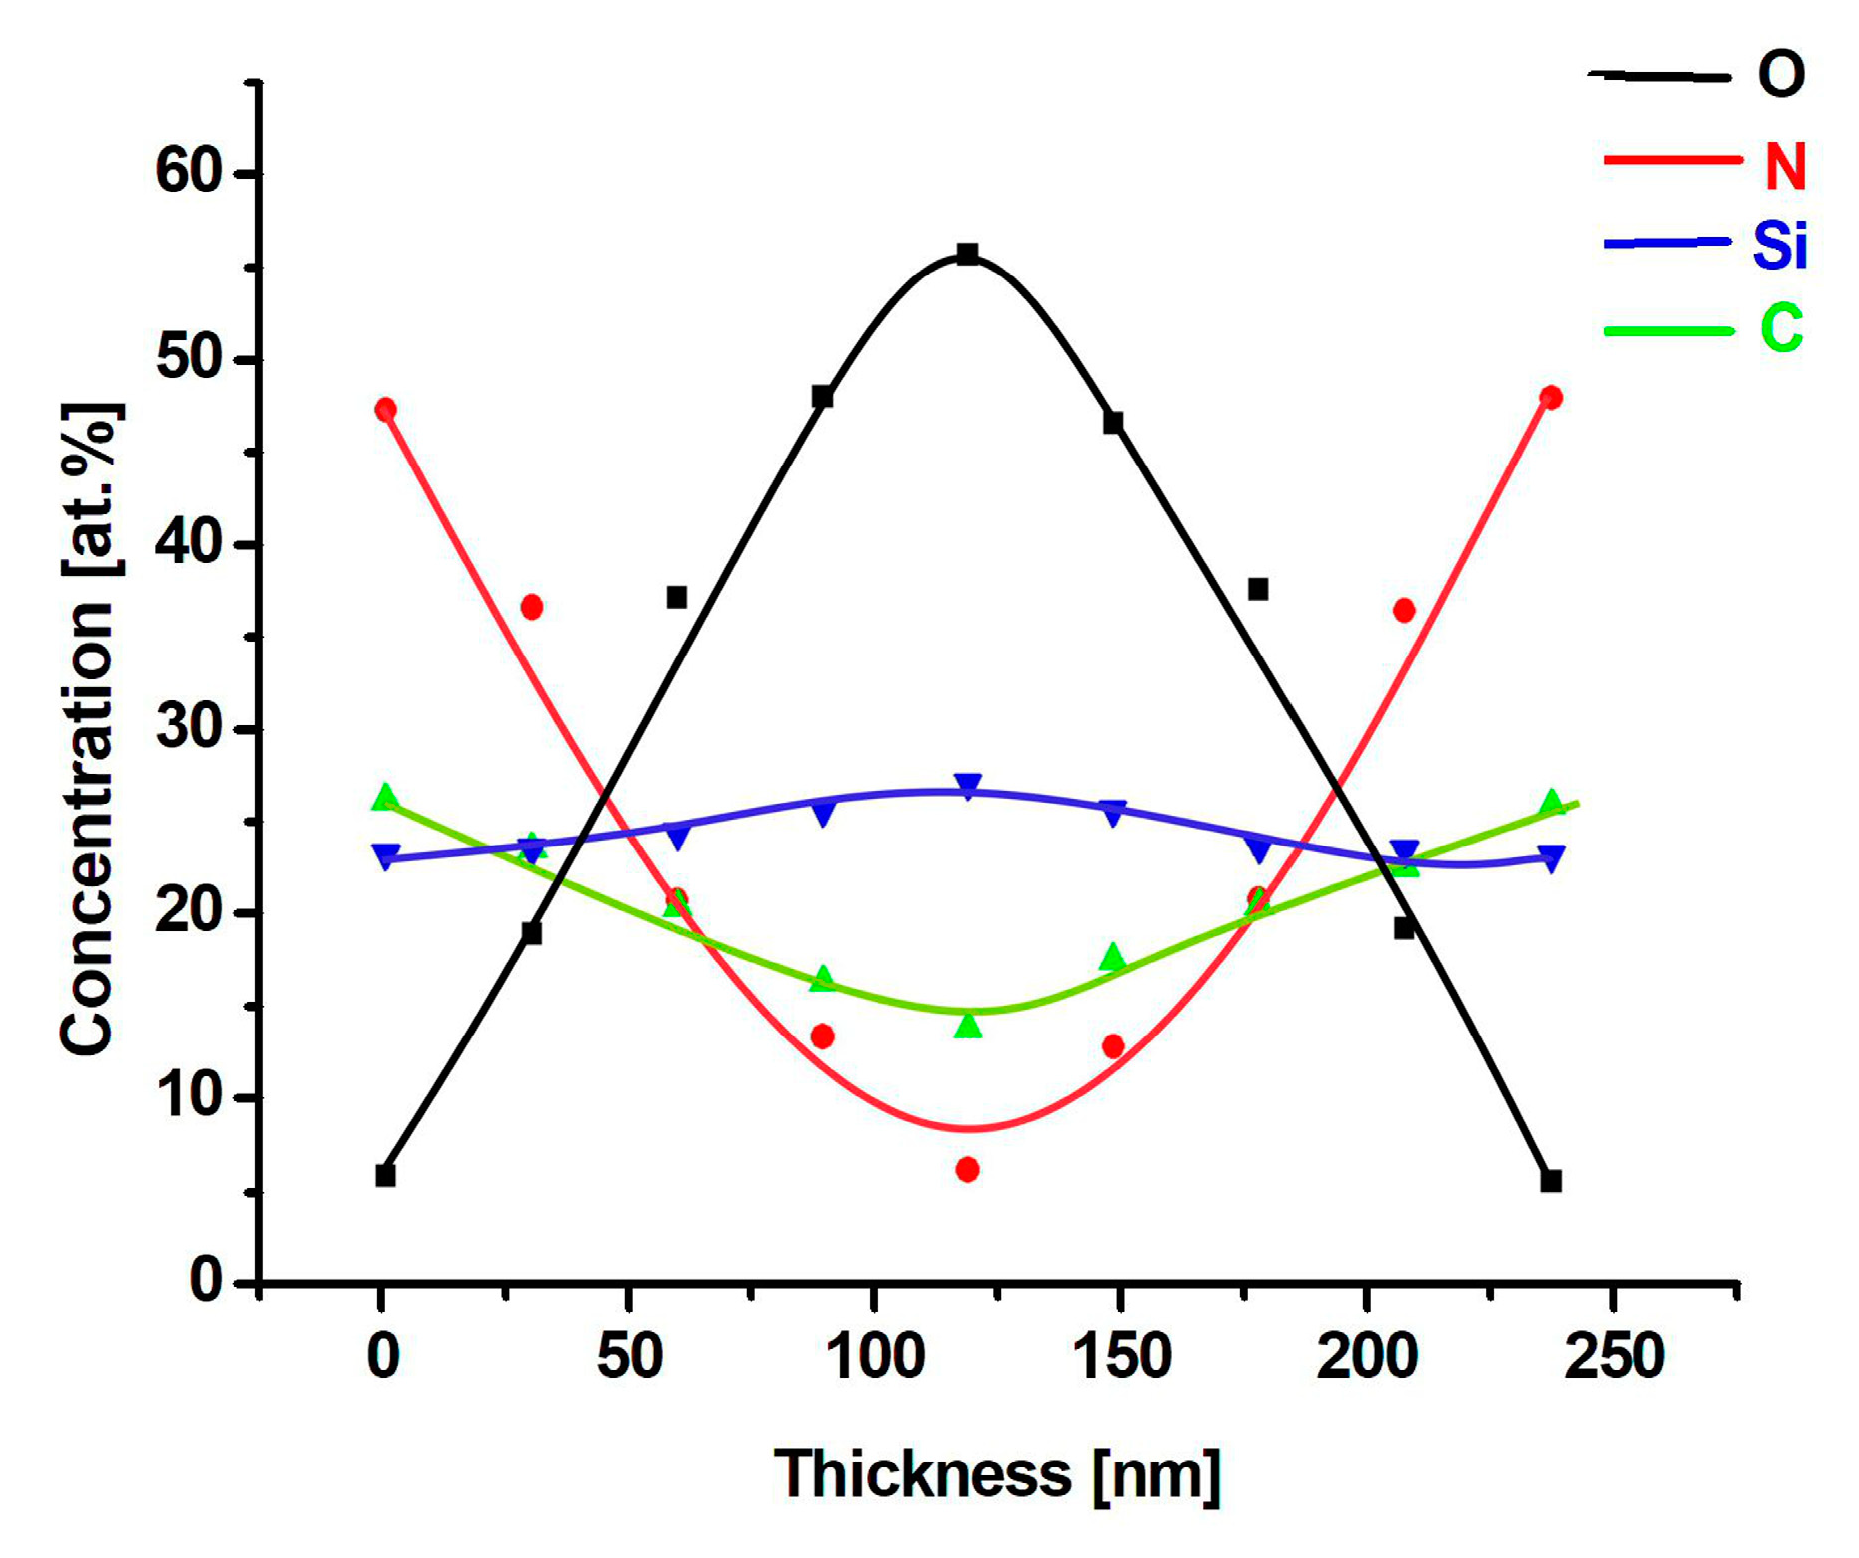
An analysis of the above data reveals a close relationship between the elemental composition of the coatings and the N2/O2 proportion in the working atmosphere. The silicon content remains at a relatively stable level of 22.7–26.4 at.% for all the samples, with a weak increasing tendency with increasing concentration of oxygen in the working gas. A similar result was reported by Chang et al. [42], with a difference being a lack of reactive atmosphere. Both in their studies and in our work, the concentration of silicon in the films remains close to its content in the precursor compound.
The amount of nitrogen in HMDSN equals 11.1 at.%. In the coating deposited in pure nitrogen atmosphere, that content increases to 46 at.%. This result strongly indicates that, under plasma conditions, nitrogen becomes a reactive gas able to form chemical bonds with other elements. In the sample prepared in the 1:1 N2/O2 atmosphere, the content of nitrogen drops down to 20.5 at.%, while the coating deposited under pure oxygen conditions contains 5.8 at.% of nitrogen only. In the latter case, the entire amount of this element very likely originates from the precursor and its presence in the coating may be a result of secondary processes.
Oxygen is characterized by a high affinity towards silicon. This is a reason this element content in a coating deposited under pure nitrogen atmosphere still amounts to ca. 5 at.%. To a large extent, this is supposed to be surface bound element resulting from a reaction of atmospheric oxygen with the coating surface after its exposure to the atmosphere. Following their etching, the oxygen content in the films, revealed by XPS measurements, drops down to 3.4 at.%, and this figure is entirely acceptable. In the coatings deposited under increasing oxygen concentration in the working gas, the content of oxygen increases dramatically to reach a value exceeding 54.4 at.%.
An interesting behavior is shown by carbon. Its content in the films is a subject of substantial variations, depending on the composition of the working gas mixture. Carbon content in the surface layer of a coating deposited under pure nitrogen conditions amounts to 25.8 at.%. When deposited in a mixed nitrogen/oxygen atmosphere, the coating contains 19.9 at.% carbon. Finally, for a coating produced in pure oxygen, C content further decreases to 13.3 at.%. This may be explained by a partial removal, under conditions of precursor fragmentation, of carbon in a form of its oxides CO2 and CO. The larger oxygen concentration in the gas mixture, the more effective is that process. When film deposition is performed in pure nitrogen, no oxides are formed and carbon is removed in a form of simple hydrocarbons, principally methane. However, this process is far less efficient, which explains larger carbon concentrations in the coatings deposited under pure nitrogen conditions. In addition, it has to be noted that the content of carbon in the coatings, independent of whether deposited in the presence of oxygen or in the presence of nitrogen, is much lower that its concentration in the precursor compound. This effect points to a substantial fragmentation of the precursor molecules taking place in plasma, wherein the final content of carbon to a large extent results from secondary reactions.
Similar is the situation of nitrogen in the coatings investigated. In the case of materials deposited under pure nitrogen conditions, its content amounts to 46.5 at.%, and is over four times higher than that of the precursor compound. It convincingly indicates a reactive character of this element, thus forming Si-N bonds under plasma conditions applied. When, however, oxygen is used as the deposition process working atmosphere, the content of nitrogen in the resulting coatings deceases down to 5.8 at.%, a figure that is lower than that of the precursor compound.
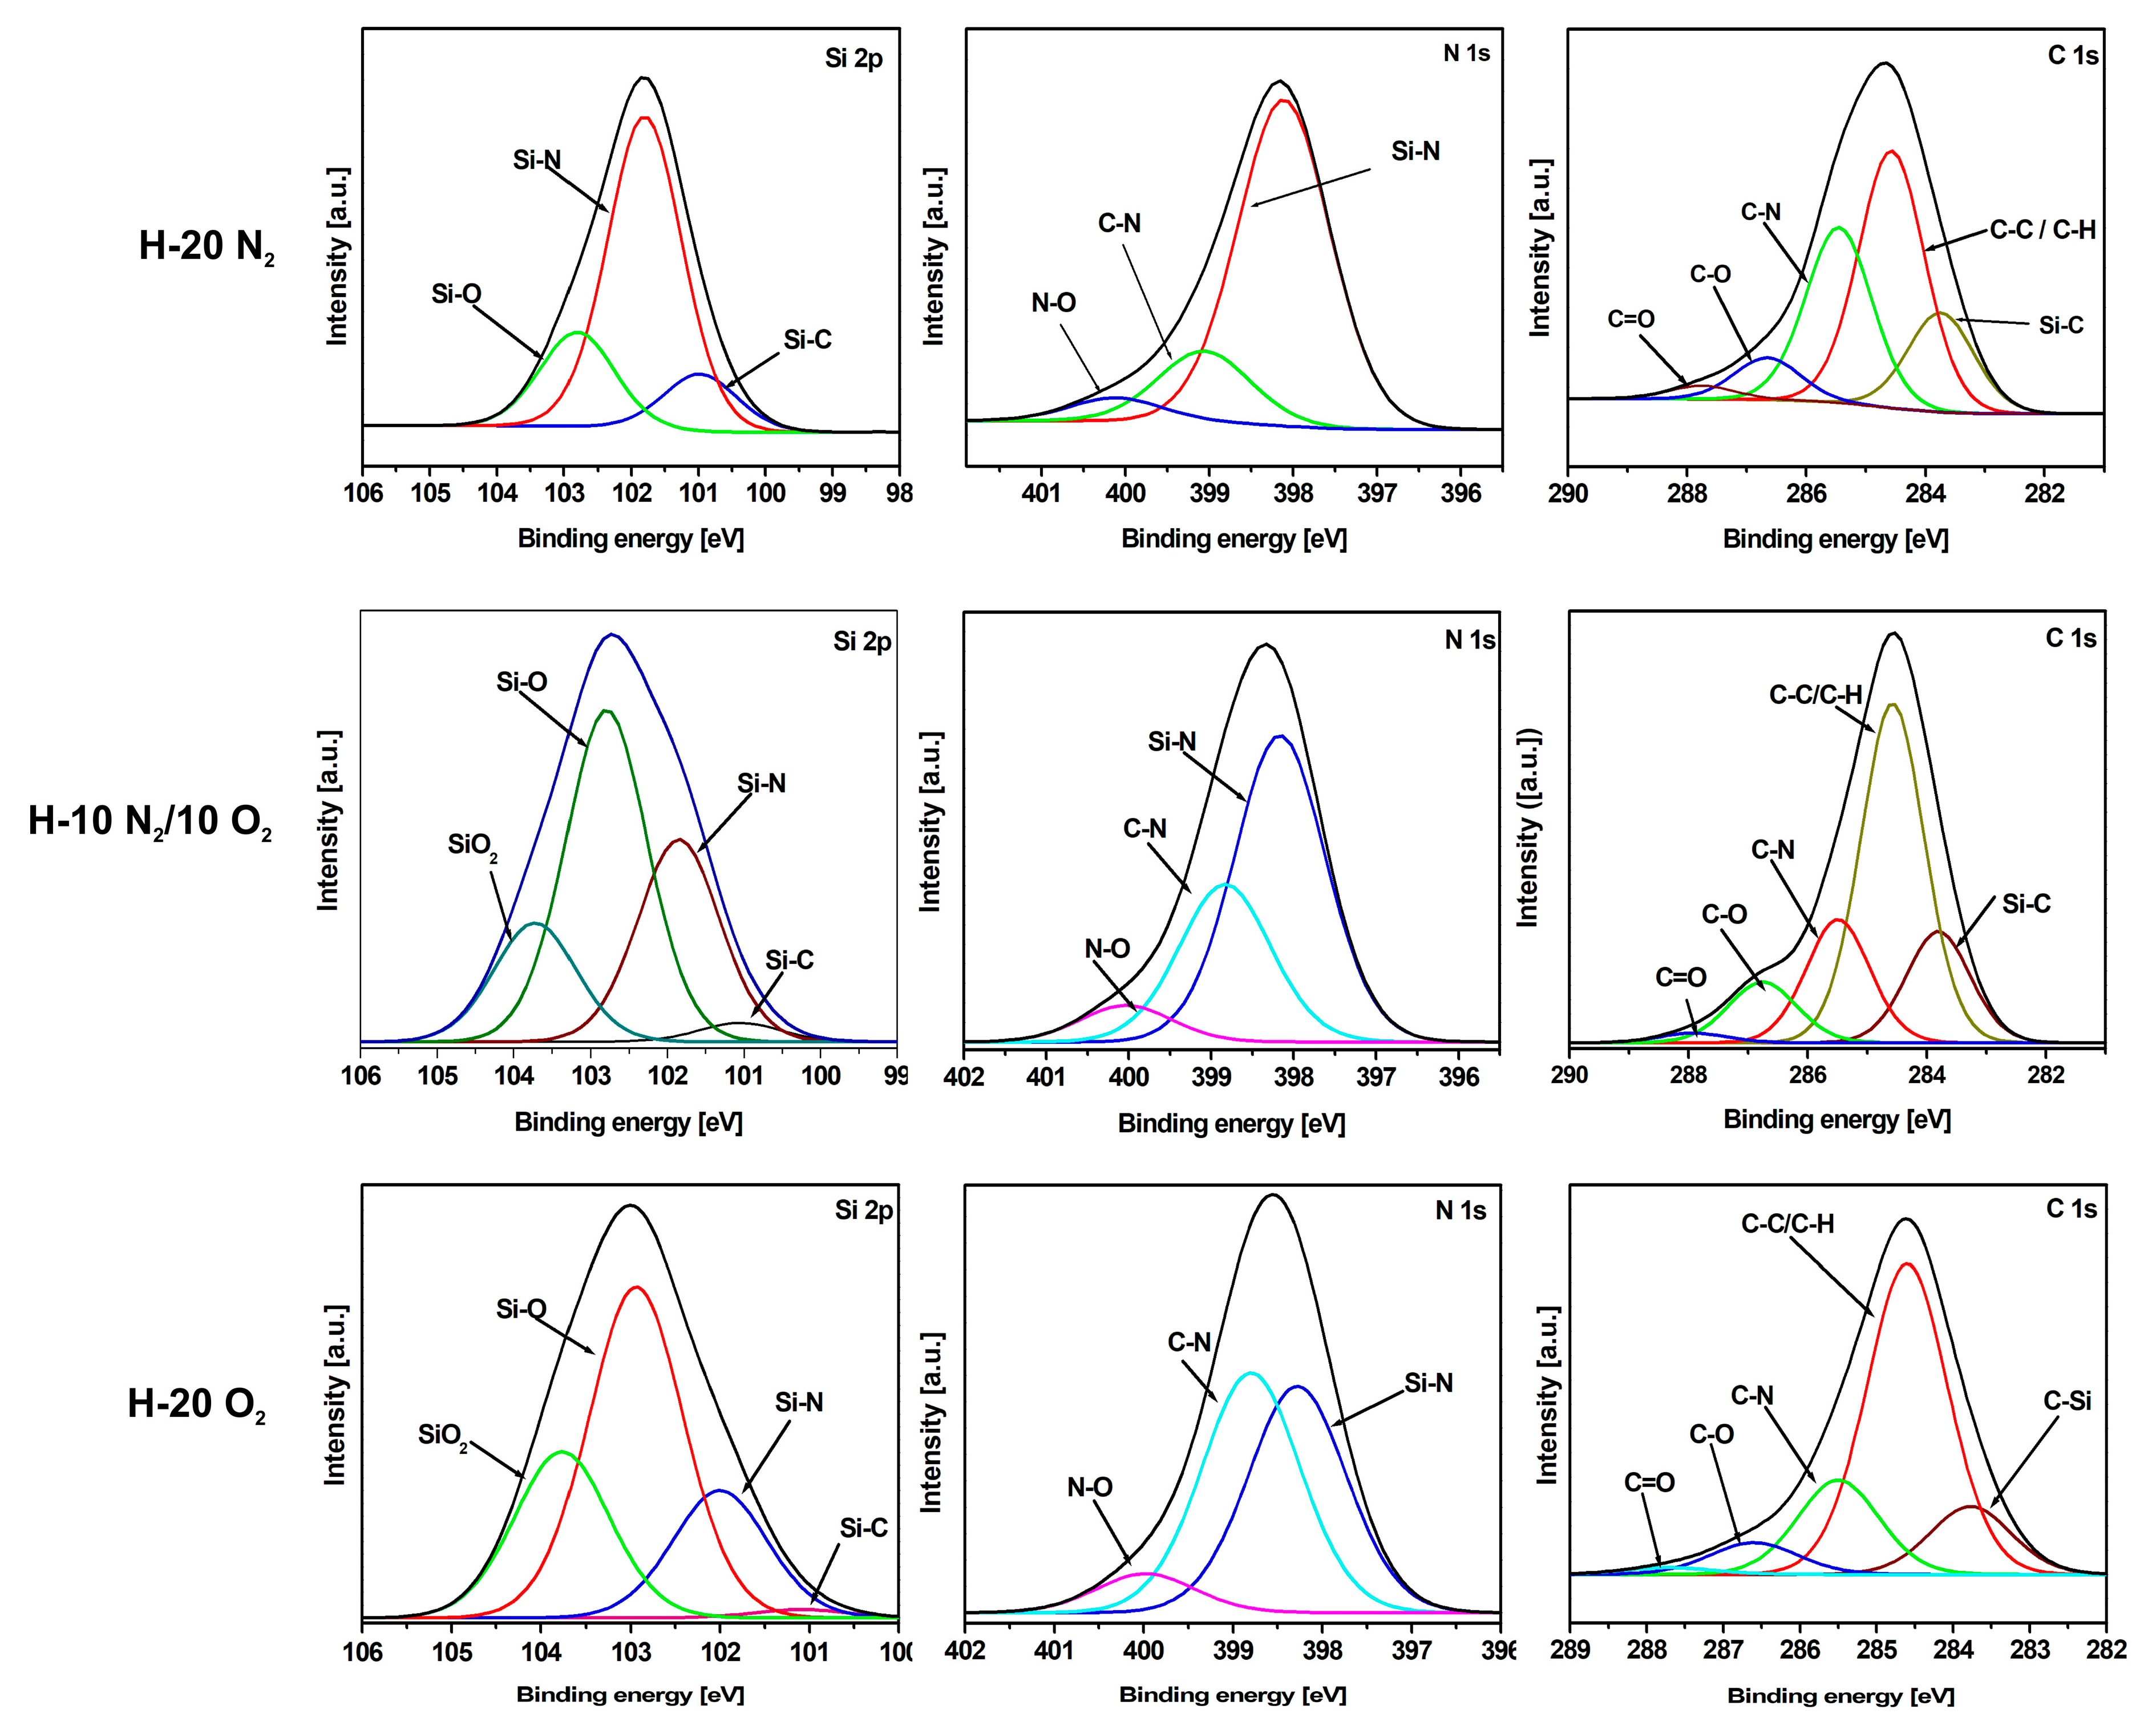
Further characteristics of the coatings chemical structure is based on deconvolution of the Si 2p, N 1s and C 1s XPS spectral bands, therefore enabling a detailed analysis of chemical bonding present in that structure as a function of oxygen content in the working atmosphere. Such an analysis was performed for three different samples: one deposited under pure nitrogen condition (H-20 N2, Figure 6), one obtained in an equimolar nitrogen/oxygen mixture (H-10 O2/10 N2, Figure 6) and one prepared in pure oxygen (H-20 O2, Figure 6).
Deconvolution of the Si 2p band points to a dominant role of a Si–N bond in the samples deposited under pure nitrogen conditions. Si–O bonds are also present, confirming oxygen affinity towards silicon. Finally, the spectrum also indicates the presence of Si–C bonding. In the coatings deposited under mixed N2/O2 atmosphere, the amount of Si–O bonds increases and a band characteristic for SiO2 appears, all that at the expense of decreasing contents of Si–N and Si–C bonds. When deposited under pure oxygen atmosphere, the coatings are characterized by dominant XPS bands corresponding to both Si–O and SiO2 chemical bonding.
Deconvolution process of the XPS N 1s band confirms a dominant role of a Si–N bond in the samples deposited under pure nitrogen conditions. Along an increasing amount of oxygen in the working atmosphere, the content of both C–N and N–O bonds in the coatings also rises. In fact, an increasing amount of N–O bonds, absent in the precursor molecule, points to plasma energetic conditions allowing for a substantial fragmentation of that molecule.
On the basis of XPS results one can state that, with an increasing concentration of oxygen in the working atmosphere, the amount of silicon–oxygen bonding (102.8 eV) in the coatings increases, and that of carbon–nitrogen bonding (399.1 eV) declines. In terms of optical properties of these materials, it indicates a drop of their index of refraction “n”.
Deconvolution of the C 1s XPS band reveals a presence of the following carbon bonds: Si–C (283 eV), C–C (C–H) (284.8 eV), C–N (285.5 eV), as well as C–O (285.5 eV) and C=O (287.8 eV). Here, too, one can observe a decrease of the amount of Si–C and Si–N chemical bonds present in the coatings along an increasing concentration of oxygen in the working gas mixture. A decreasing content of carbon in these films makes an additional proof of carbon removal (in the form of carbon oxides) from an oxygen rich working atmosphere.

3.1.4. Chemical Composition Studies by FTIR Spectroscopy

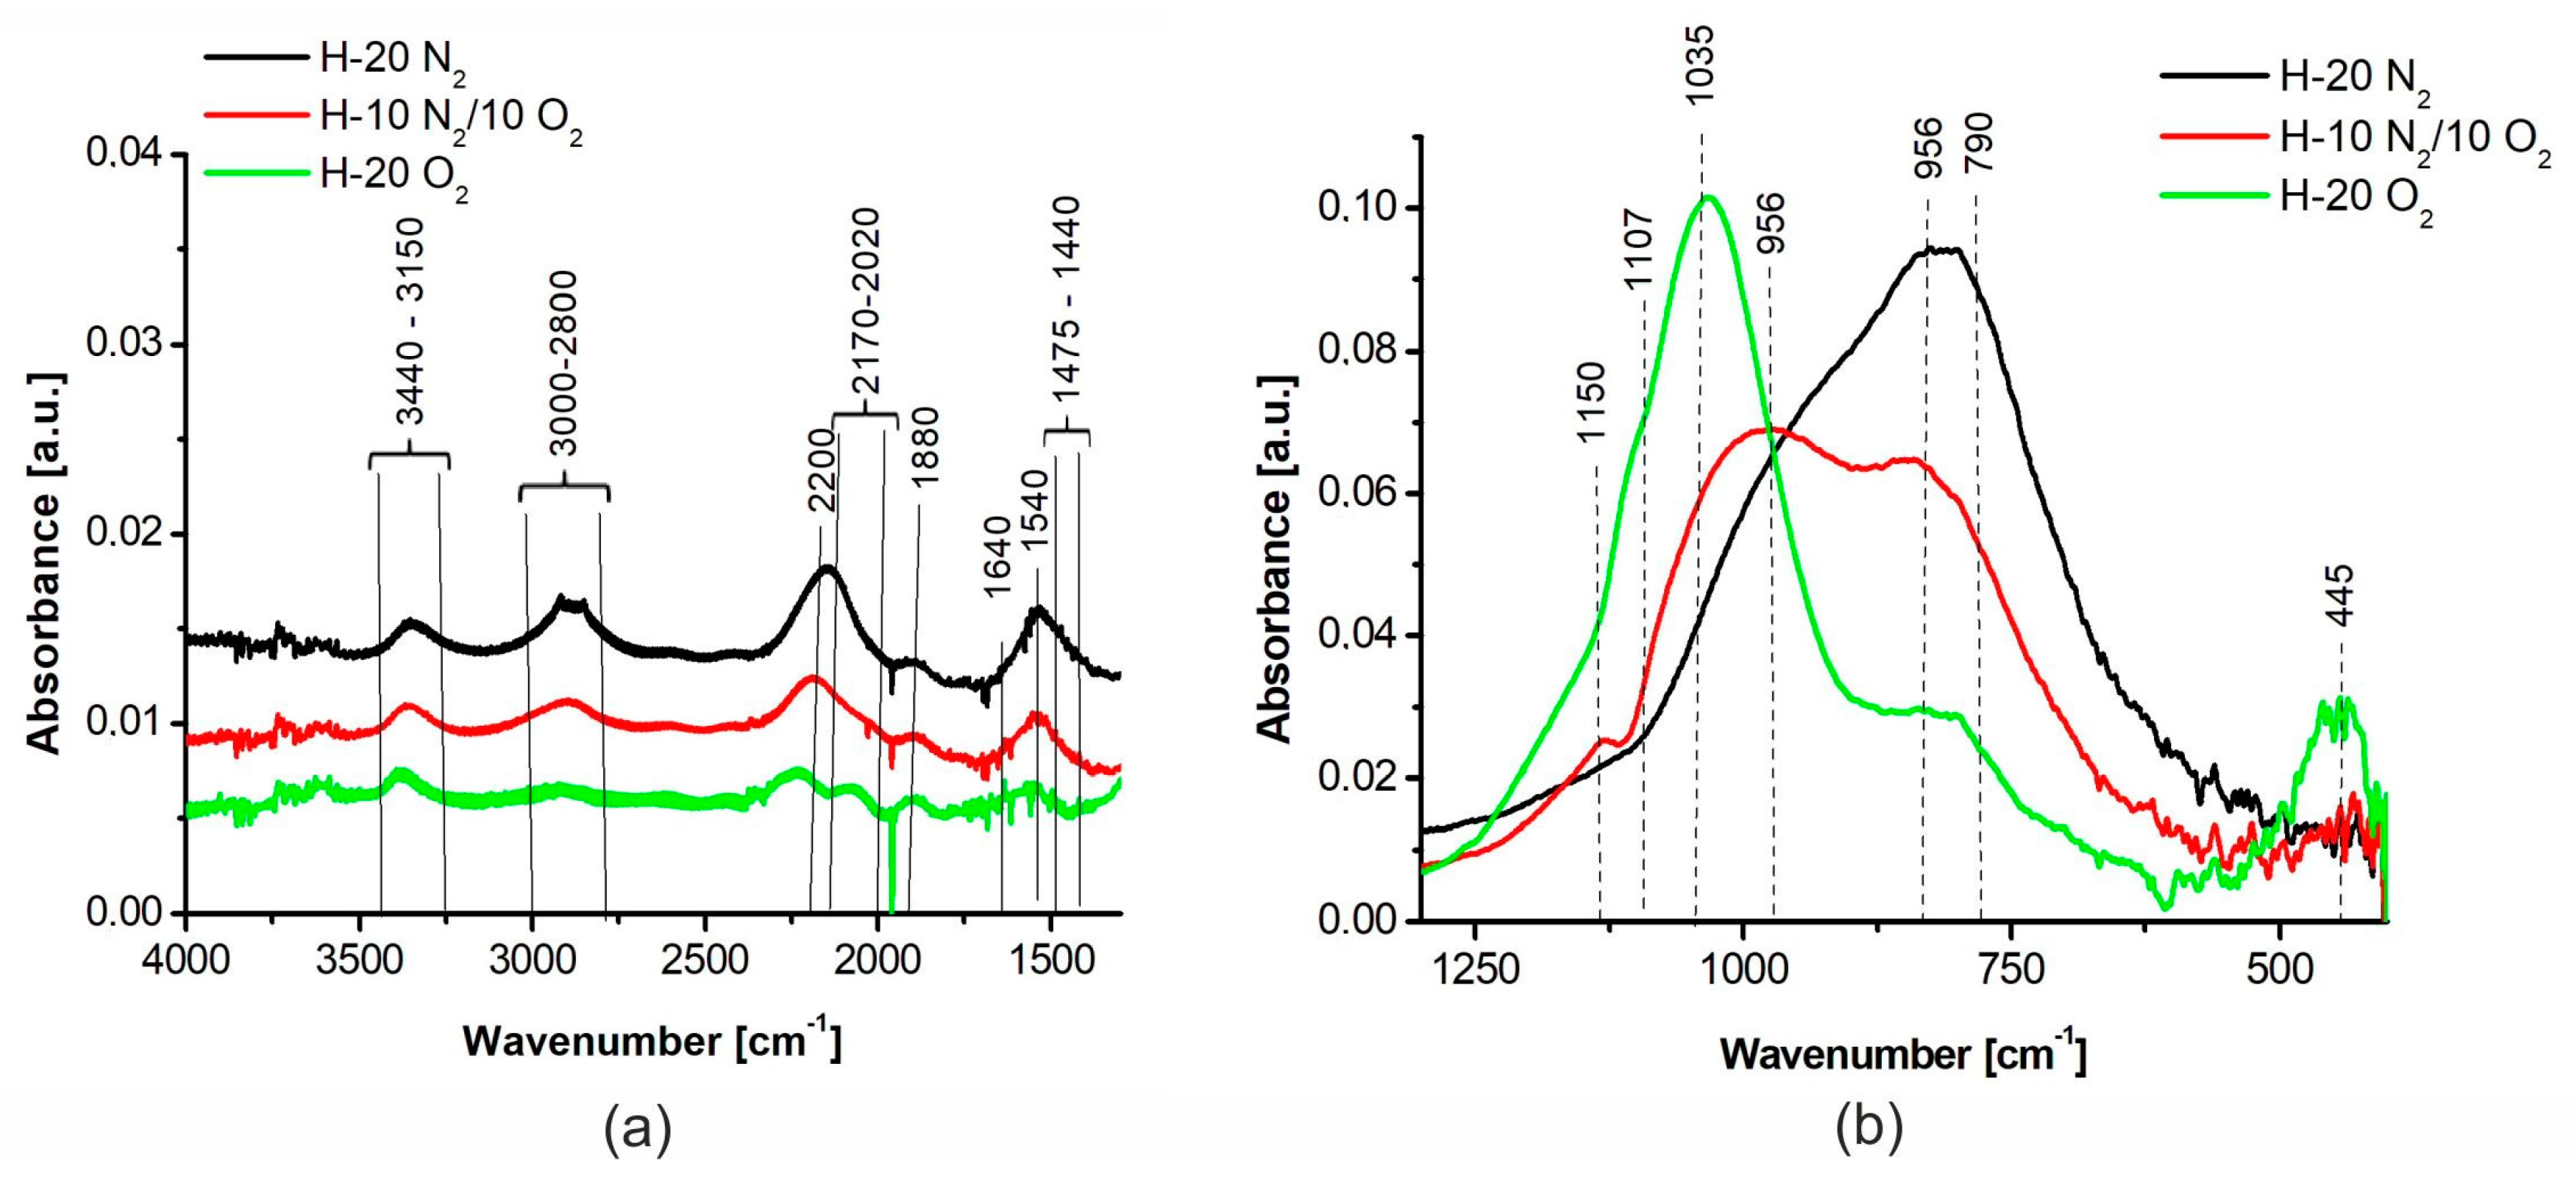
Structural studies were performed on selected samples of SiONC coatings deposited from HMDSN precursor at negative self-bias potential of −880 V and three different compositions of the working atmosphere: pure oxygen, 1:1 oxygen/nitrogen mixture and pure nitrogen. The respective FTIR spectra, recorded within the spectral range of 4000–400 cm−1, are presented in Figure 7. To enhance their clarity, the spectra have been divided into two ranges: 4000–1400 cm−1 (a) and 1300–400 cm−1 (b).
In the spectra presented in Figure 7a, characteristic bands corresponding to the following molecular vibrations can be identified:
  • 3440–3150 cm−1—N–H bond stretching vibrations,
  • 3000–2800 cm−1—symmetric and asymmetric stretching vibrations of C-H bonds belonging to CH2 and CH3 groups,
  • 2200 cm−1—C≡N bond stretching vibrations
  • 2170–2020 cm−1—Si–H bond stretching vibrations,
  • 1880 cm−1—C=O bond stretching vibrations,
  • 1640 cm−1—C=N bond stretching vibrations,
  • 1550 cm−1—N–H group deformation vibrations,
  • 1475–1440 cm−1—deformation vibrations of CH2 and CH3 groups [43,44].
It appears from the FTIR spectra that addition of nitrogen to the working atmosphere results in an enrichment of the coating structure with organic CH3 and CH2 groups originating from the precursor. In addition, a proportional increase of the amount of Si–H bond is also noted. A lowering of the C–H bond content in the films deposited in the oxygen atmosphere is interpreted as a result of a formation of volatile CO2 and H2O oxides in the course of the PE CVD process. These by-products are easily removed from the environment and they do not contribute to the process of deposition. As a result, the coating thickness drops down. In the case of N–H bonds, absorbing within the spectral range of 3440–3150 cm−1, their existence is also observed in the case of the samples deposited under pure nitrogen atmosphere. It is connected to the presence of nitrogen in the precursor molecule. Certainly, the amount N-H bonds in the coating structure increases with an increasing concentration of nitrogen in the reaction mixture. A shift of a 2200 cm−1 band, corresponding to the vibrations of C–N bonds towards higher wavenumbers, is also observed for the coatings deposited under oxygen atmosphere.
Within the spectral range of 1300–400 cm−1, shown in Figure 7b, several bands corresponding to chemical bonds of elements having significant effect on the coating optical properties have been separated. They were subjected to a detailed deconvolution procedure with the resulting surface areas of particular band components presented in Table 6. In the case of the coatings deposited under pure oxygen atmosphere, absorption bands corresponding to the following chemical moieties were selected: Si–O–(CHx) groups, as well as stoichiometric SiO2 and non-stoichiometric SiOx silicon oxide bonds. The strongest band, recorded at 1035 cm−1 and corresponding to stretching vibrations of stoichiometric silicon dioxide Si-O bonds, is accompanied by a substantial maximum at 445 cm−1, resulting from rocking vibrations of that group. A presence of such a large amount of oxygen in the coating is responsible for a low value of its refractive index equal 1.65. An increase of nitrogen content in the working environment results in an increasing number of Si–NH–Si bonds absorbing at 953 cm−1 as well as, typical for ceramic materials, Si–N bonds resonant with the radiation of the wavenumber of 830 cm−1. Additionally, Si–C bonds, typical for silicon carbide, are formed under these conditions. A presence of both these bond structures is responsible for an increase of the coatings refractive index up to 2.2. This means that, by a strict control of nitrogen content in the working N2/O2 atmosphere, one should be able to substantially affect chemical structure of the films and, therefore, to regulate, within a certain range, the magnitude of refractive index n of the resulting coating.

3.2. Coatings Characterized by a Gradient of Refractive Index

3.2.1. Optical Properties

The results presented thus far concerned coatings deposited under different, but constant, proportions of nitrogen to oxygen in the working atmosphere. This also means a constant composition of these coatings. In the present chapter, results obtained for materials deposited under conditions of a variable composition of that atmosphere are reported. The composition of the working gas was changed every 5 s, with the subsequent O2/N2 proportions presented in Table 7. These proportions were selected in such a manner that in every case the total flow rate of the working gas was equal to 20 sccm. Such an arrangement resulted in a step-wise alteration of the coating chemical composition and, consequently, introduced a gradient of refractive index. Several sequences of a coating were produced, from a single nitrogen–oxygen sequence up to the most complex nitrogen–oxygen–nitrogen–oxygen–nitrogen sequence. The single nitrogen–oxygen sequence resulted in a film thickness of approximately 110 nm, while proportionally larger thickness values were acquired for the multiple sequences.
Profiles of refractive index and extinction coefficient for particular coatings were determined with the help of spectroscopic ellipsometry. In the model applied for the calculations, respective values of these optical parameters obtained for different (but constant) compositions of deposition working atmosphere, were used. The resulting profiles for a coating deposited under the working atmosphere changing from 100% nitrogen to 100% oxygen are presented in Figure 8 below.
On the basis of the models proposed, one can judge that the shape of the real profile does not substantially depart from that theoretically assumed. In the model, the magnitude of the refractive index varies in the range of 1.65–2.22, while ellipsometric data show respective values from the 1.65–2.38 range, with the course of changes remaining relatively close to that assumed.
In a similar way to the above data, the results of a two-fold sequence of a gradient coating deposition exhibit a satisfactory fitting of the proposed model. In this case, the refractive index was assumed to vary according to the model change of 2.25–1.65–2.25, while ellipsometric measurements showed that index to follow the 2.38–1.67–2.28 pattern. The difference may indicate the contribution of residual oxygen, lowering the refractive index, in the deposition process.
A similar approach was applied in the case of the coating characterized by a four–fold nitrogen–oxygen–nitrogen–oxygen–nitrogen sequence. The profiles of theoretical and real values of refractive index of that coating are presented in Figure 9. In all instances, a good agreement between the model assumed and the measurement results have been observed, thus pointing to a high stability of the deposition process.
Materials with a gradient of refractive index were also investigated by means of UV-Vis spectroscopy. Figure 10 presents transmission spectra of the coatings deposited with a one-fold, two-fold and fourfold change of the composition of working atmosphere.
It appears from Figure 10 that the effect of optical interference is recorded even in the case of the coatings deposited with a one-fold N–O change of working atmosphere. As far as materials produced with the two-fold N–O–N and four-fold N–O–N–O–N processes are concerned, an evident cutback of absorption at low wavelengths is observed in this case. What is important to note, is the fact that light interference takes place despite a lack of separate layers characterized by different magnitudes of refractive index. In fact, the effect develops from a gradient of refractive index. This finding constitutes proof of application potential of the coatings investigated in the technology of monolayer optical filters with a gradient of refractive index.

3.2.2. Elemental Composition Profiles of the Coatings

XPS studies of the coatings allow one to follow changes of elemental composition of these materials as a function of their thickness. Such elemental composition profiles of a coating deposited with a two-fold N–O–N change of working atmosphere are presented in Figure 11, below.
It appears from the figure that a change of working gas composition, although having a significant impact on the chemical structure of the resulting material, does not affect the concentration of silicon in the coating, which continues to stay at the level of 24–28 at.% along the entire thickness of the sample. In contrast to that, the contents of the remaining elements are subjected to considerable changes. The amount of both nitrogen and oxygen in the coating is fundamentally dependent on the respective gas concentration in the working atmosphere. While being ca. 46 at.% for the best samples deposited under pure nitrogen conditions, the content of nitrogen drops down to 5.8 at.% in the case of a material obtained in pure oxygen. A return to the 100% N2 atmosphere results in the reestablishment of high nitrogen content in the films. One can conclude that the concentration of this element in the coatings varies in a periodic manner, following periodic alterations of the N2/O2 proportion in the working atmosphere. Similar is the behavior of oxygen. In the case of the best samples deposited under pure nitrogen conditions, its amount in the coating totals 2.8 at.%, only to increase up to 54 at.% for samples obtained in pure oxygen. Just as is the case with nitrogen, the concentration of oxygen in the coatings varies in a periodic manner, following periodic alterations of the O2/N2 ratio in the working atmosphere.
The concentration of carbon in the films follows the nitrogen-to-oxygen proportions in the working gas. However, these changes are not so evident, and they result from the periodicity of chemical reactions taking place in the glow discharge. As discussed earlier, the coatings deposited under oxygen-rich conditions are stripped of carbon because of a swift removal of volatile carbon oxides from the reaction mixture.

3.3. “Cold Mirror” Interference Optical Filter with a Gradient of Refractive Index

The effect of optical interference taking place in the coating deposited with the four-fold exchange of the working atmosphere led us to believe that it was possible to design and to construct the entire interference filter with a gradient change of refractive index. The design of a “cold mirror” type filter was accomplished with the use of a TFCalc.TM 3.5 (transmision filter calculation) specialized software. An initial stage of that design comprised the construction of a database containing all the magnitudes of refractive index and extinction coefficient of the respective materials obtained at different compositions of the working atmosphere. It was then assumed that the filter of interest will be of a band type with the absorption threshold set at 300 nm. The calculations showed that it takes a ten-fold exchange of the working gas atmosphere along the nitrogen–oxygen–nitrogen sequence to obtain of desired filter structure. The designed gradient change of refractive index for such a filter is presented below, in Figure 12.
Reflection spectra of the filter model as well as of the real device are presented in Figure 13. It appears from the figure that the optical characteristics of the real filter are not much different from those of the model. According to the design, the 50% reflection level should be observed at the wavelength of 290 nm, while in reality it is recorded at 313 nm. This difference is likely to be a result of deposition rate fluctuations taking place in the course of the changes of the working atmosphere. It may also be a consequence of a moderate temperature increase in the reactor during deposition. In any case, a manufacture of the presented filter constituted a test of both the deposition equipment and the technology developed. This proves the high stability and high repeatability of the process, thus opening a path to depositing much more complex optical coatings.
The coatings with a continuous change of refractive index resulting from gradients of their chemical composition, constitute a subject of studies carried out in numerous laboratories. Some publications deal with the methods using two different sources of material. There are reports of gradient coating deposition from solid SiO2, Ta2O5, or Nb2O5 targets using sputtering techniques. Optical properties of the coatings acquired are good [9,46,47]. However, the deposition technique itself is somewhat problematic, because of different sputtering rates of different targets. Retaining appropriate proportions between particular materials require a continuous control of the magnetron sputtering power. It is also possible to sputter materials with a use of either electron or ion beams, but these techniques are very costly both in the capital investment phase and in the course of operation. Use of two different precursor compounds is also practiced in the PE CVD technologies. In the work cited, HSDSN and TaCl5 were used as sources of low and high refractive index materials, respectively. The gradient coatings were deposited with the help of plasma enhanced technology using oxygen as one of the reactive mixture components [48]. Aggressive chlorine-containing chemicals are obtained as by-products in this technique, which enforces the application of highly (chemically) resistant materials in the construction of deposition equipment.
In the literature, there are reports concerning coatings with a gradient of physical properties based on a single precursor compound. These publications usually deal with silane SiH4 playing the role of that precursor [22,49]. As working gases in these works, mixtures of oxygen and nitrogen of different proportions are applied, with the resulting structure of the PE CVD coatings varying from silicon oxide to silicon nitride through intermediate materials of a SiOxNy composition. Silane, however, is a very volatile, flammable and explosive chemical, and its use requires extra safety precautions. The method of deposition of gradient coatings described in the present work removes the above-mentioned inconveniences. Instead of a hazardous gas, easy to handle liquid organosilicon compounds are used as precursors. As far as literature reports are concerned, thus far there has been none whatsoever that refers to gradient coatings deposited from these precursors.
The optical “cold mirror” filter, whose model and real transmission spectra are presented in Figure 13, has also been investigated with the help of scanning electron microscopy. The SEM image of the manufactured filter cross-section is presented in Figure 14.
In the micrograph presented above, one can identify subsequent “sublayers” present in the optical coating. The thickness of the coating equals ca. 1045 nm. From the design assumptions, that thickness should amount to 1050 nm. That agreement is quite satisfactory, and it proves the quality of the technology developed. That technology, and the method of deposition of single-layer optical coatings with the gradient of refractive index using organosilicon precursor and oxygen-nitrogen mixture as working atmosphere in particular, constitutes a subject of patent application number PL423097 (A1), PL233603 (B1).

4. Conclusions

In the work presented, a novel method of deposition of optical coatings with a gradient of refractive index, using the RF PECVD technology, is introduced. Compared to the existing literature reports, this work is unique in the sense that it presents a successful endeavor to obtain a complex “optical system with a gradient of refractive index by means of the plasma-chemical technique, using a single organometallic precursor and a variable oxygen-to-nitrogen ratio in the working atmosphere. The unquestioned advantage of this work is an elimination, as precursor compounds, of explosive silane and corrosive silicon halogenides and their replacement with safe and easy to handle liquid organosilicon compounds. Two organosilicon precursors, namely TMDSN and HMDSN, were used as precursor compounds. As the reaction atmosphere, a mixture of oxygen and nitrogen was applied. An application of pure components resulted in a formation of SiOC films of low refractive index in the case of oxygen and SiN:C films of high refractive index in the case of nitrogen. The coatings deposited from TMDSN were characterized by refractive index magnitudes of 1.99 and 2.31 for the SiOC and for the SiNC materials, respectively. Similar data for the films obtained from HMDSN amounted to 1.65 and to 2.22. On the basis of the above results, HMDSN was selected as the more promising precursor of the gradient coatings, characterized by both chemical composition and refractive index varying with their thickness. Those gradients were acquired by an application of the variable composition of reaction atmosphere. Sinusoidal alterations of that composition resulted in a deposition of the coatings with sinusoidal changes in their optical properties. The method developed was used to manufacture a “cold mirror” type of interference filter. The filter is characterized by a good agreement between its real parameters and those assumed in the model, which reveals a good stability of the deposition process established.

5. Patents

PL423097 (A1) PL233603 (B1), K. Olesko, A. Sobczyk-Guzenda, H. Szymanowski, S. Owczarek, Method for producing one-layered optical filters with the light refractive index gradient, 23 April 2019.
PL424592 (A1), K. Olesko, A. Sobczyk-Guzenda, A. Nosal, Method for supplying with vapours of the precursor of reactors intended for applying coatings by vacuum methods and the system for supplying with vapours of the precursor of reactors intended for applying coatings by vacuum methods, 26 August 2019.

Author Contributions

Conceptualization, H.S. and A.S.-G., methodology, H.S., K.O., and A.S.-G.; validation, K.O. and A.S.-G.; formal analysis, K.O. and A.S.-G.; investigation, K.O., H.S., M.F., A.S.-G., and J.K.; resources, H.S., K.O., and A.S.-G.; data curation, K.O. and J.K.; writing—original draft preparation, H.S. and A.S.-G.; writing—review and editing, H.S., A.S.-G., and M.G.-L.; visualization, H.S. and A.S.-G.; supervision, H.S. and A.S.-G.; project management, A.S.-G. All authors have read and agreed to the published version of the manuscript.

Funding

The research was founded by the National Science Centre (NCN), Poland, Grant No 2014/13/B/ST8/04293.

Conflicts of Interest

The authors declare no conflict of interest.

References

  1. Ejigu, E.K. Simulating radiation thermometer temperature measurement error from theperformance change of an interferencefilter due to polarization effect. Measurement 2020, 114, 471–477. [Google Scholar] [CrossRef]
  2. Li, H.; Wang, K.; Qian, L. Tunable color filter with non-subwavelength grating at oblique incidence. Optik 2020, 207, 164432. [Google Scholar] [CrossRef]
  3. Hussain, T.; Jie, T.; Fung, W.J.; Nabeel, M.; Xiao, H.D. UV radiation protection for space telescope FPA using cerium. Radiat. Phys. Chem. 2018, 153, 159–163. [Google Scholar] [CrossRef]
  4. Syafiq, A.; Pandey, A.K.; Adzman, N.N.; Rahim, N.A. Advances in approaches and methods for self-cleaning of solar photovoltaic panels. Sol. Energy 2018, 162, 597–619. [Google Scholar] [CrossRef]
  5. Gralewicz, G.; Owczarek, G. Analysis of the selected optical parameters of filters protecting against hazardous infrared radiation. Int. J. Occup. Saf. Ergon. 2016, 22, 305–309. [Google Scholar] [CrossRef]
  6. Macleod, H.A. Thin-Film Optical Filters, 3rd ed.; Institute of Physics Publishing: Bristol, VA, USA, 2001; pp. 1–5. [Google Scholar]
  7. Jun-Chao, Z.; Ming, F.; Yu-Chuan, S.; Yun-Xia, J.; Hong-Bo, H. The synchronization of a fractional order hyperchaotic system based on passive control. Chin. Phys. 2011, 20, 1–4. [Google Scholar]
  8. Vernhes, R.; Zabeida, O.; Klemberg-Sapieha, J.E.; Martinu, L. Single-material inhomogeneous optical filters based on microstructural gradients in plasma-deposited silicon nitride. Appl. Opt. 2004, 43, 97–103. [Google Scholar] [CrossRef]
  9. Leitel, R.; Stenzel, O.; Wilbrandt, S.; Gäbler, D.; Janicki, V.; Kaiser, N. Optical and non-optical characterization of Nb2O5–SiO2 compositional graded-index layers and rugate structures. Thin Solid Film. 2006, 497, 135–141. [Google Scholar] [CrossRef]
  10. Ouellette, M.F.; Lang, R.W.; Yan, K.L.; Bertram, R.W.; Owles, R.S.; Vincent, D. Experimental studies of inhomogeneous coatings for optical applications. J. Vac. Sci. Technol. A 1991, 9, 1188–1992. [Google Scholar] [CrossRef]
  11. Redinger, A.; Mousel, M.; Djemour, R.; Gütay, L.; Valle, N.; Siebentritt, S. Cu2ZnSnSe4 thin film solar cells produced viaco-evaporation and annealing including aSnSe2 capping layer. Prog. Photovolt. Res. Appl. 2014, 22, 51–57. [Google Scholar] [CrossRef]
  12. Donovan, E.P.; van Vechten, D.; Kahn, A.D.F.; Carosella, C.A.; Hubler, G.K. Near infrared rugate filter fabrication by ion beam assisted deposition of Si(1−X)NX films. Appl. Opt. 1989, 28, 2940–2944. [Google Scholar] [CrossRef] [PubMed]
  13. Kaminska, K.; Brown, T.; Beydaghyan, G.; Robbie, K. Vacuum evaporated porous silicon photonic interference filters. Proc. SPIE Int. Soc. Opt. Eng. 2003, 4833, 633–639. [Google Scholar] [CrossRef] [PubMed]
  14. Berger, M.G.; Arens-Fischer, R.; Thönissen, M.; Krüger, M.; Billat, S.; Lüth, H.; Hilbrich, S.; Theiss, W.P. Grosse, Dielectric filters made of PS: Advanced performance by oxidation and new layer structures. Thin Solid Film. 1997, 297, 237–240. [Google Scholar] [CrossRef]
  15. Cunin, F.; Schmedake, T.A.; Link, J.R.; Li, Y.; Koh, J.; Bhatia, S.; Sailor, M. Biomolecular screening with encoded porous-silicon photonic crystals. Nat. Mater. 2002, 1, 39–41. [Google Scholar] [CrossRef] [PubMed]
  16. Chhasatiaa, R.; Sweetman, M.J.; Prieto-Simon, B.; Voelckerd, N.H. Performance optimisation of porous silicon rugate filter biosensor for the detection of insulin. Sens. Actuators B Chem. 2018, 273, 1313–1322. [Google Scholar] [CrossRef]
  17. Zhang, J.; Fang, M.; Jin, Y.; Hongbo, H. Narrow line-width filters based on rugate structure and antireflection coating. Thin Solid Film 2012, 520, 5447–5450. [Google Scholar] [CrossRef]
  18. Bartzsch, H.; Lange, S.; Frach, P.; Goedicke, K. Graded refractive index layer systems for antireflective coatings and rugate filters deposited by reactive pulse magnetron sputtering. Surf. Coat. Technol. 2004, 180, 616–620. [Google Scholar] [CrossRef]
  19. Lim, S.; Ryu, J.H.; Wager, J.F.; Casas, L.M. Inhomogeneous dielectrics grown by plasma-enhanced chemical vapor deposition. Thin Solid Film 1993, 236, 64–66. [Google Scholar] [CrossRef]
  20. Larouche, S.; Szymanowski, H.; Klemberg-Sapieha, J.E.; Martinu, L.; Gujrathi, S.C. Microstructure of plasma- deposited SiO2/TiO2 optical films. J. Vac. Sci. Technol. A 2004, 22, 1200–1207. [Google Scholar] [CrossRef]
  21. Rats, D.; Poitras, D.; Soro, J.M.; Martinu, L.; von Stebut, J. Mechanical properties of plasma-deposited silicon-based inhomogeneous optical coatings. Surf. Coat. Technol. 1999, 111, 220–228. [Google Scholar] [CrossRef]
  22. Lim, S.; Shih, S.; Wager, L.F. Design and fabrication of a double bandstop rugate filter grown by plasma-enhanced chemical vapor deposition. Thin Solid Film 1996, 277, 144–146. [Google Scholar] [CrossRef]
  23. Schäfer, J.; Hnilica, J.; Šperka, J.; Quade, A.; Kudrle, V.; Foest, R.; Vodák, J.; Zajίčková, I. Tetrakis(trimethylsilyloxy)silane for nanostructured SiO2-like films deposited by PECVD at atmospheric pressure. Surf. Coat. Technol. 2016, 295, 112–118. [Google Scholar] [CrossRef] [Green Version]
  24. Mahajan, A.M.; PatilJ, L.S.; Bange, P.; Gautam, D.K. TEOS-PECVD system for high growth rate deposition of SiO2 films. Vacuum 2005, 79, 194–202. [Google Scholar] [CrossRef]
  25. García-Valenzuela, A.; Butterling, M.; Liedke, M.O.; Hirschmann, E.; Trinh, T.T.; Attallah, A.G.; Wagner, A.; Alvarez, R.; Gil-Rostra, J.; Rico, V.; et al. Positron annihilation analysis of nanopores and growth mechanism of oblique angle evaporated TiO2 and SiO2 thin films and multilayers. Microporous Mesoporous Mater. 2020, 295, 109968. [Google Scholar] [CrossRef]
  26. Sobczyk-Guzenda, A.; Oleśko, K.; Gazicki-Lipman, M.; Szymanski, W.; Balcerzak, J.; Wendler, B.; Szymanowski, H. Chemical structure and optical properties of SixNyCz coatings synthesized from two organosilicone precursors with the RF PECVD technique—A comparative study. Mater. Res. Express. 2019, 6, 016410-1-21. [Google Scholar]
  27. Brinkmann, N.; Sommer, D.; Micard, G.; Hahn, G.; Terheiden, B. Electrical, optical and structural investigation of plasma-enhanced chemical-vapor-deposited amorphous silicon oxynitride films for solar cell applications. Sol. Energy Mater. Sol. C 2013, 108, 180–188. [Google Scholar] [CrossRef] [Green Version]
  28. DiStefano, T.H.; Eastman, D.E. The band edge of amorphous SiO2 by photoinjection and photoconductivity measurements. Solid State Commun. 1971, 9, 2259–2261. [Google Scholar] [CrossRef]
  29. Weinberg, Z.A.; Rubloff, G.W.; Bassous, E.; Watson, T. Transmission, photoconductivty, and the experimental band gap of thermally grown SiO2 films. Phys. Rev. B 1979, 19, 3107–3118. [Google Scholar] [CrossRef]
  30. Efimov, A.; Weber, M.J. Handbook of Optical Materials; CRC Press: Boca Raton, FL, USA; London, UK; New York, NY, USA; Washington, DC, USA, 2003; p. 68. [Google Scholar]
  31. Sakamoto, N.; Umezu, I.; Maeda, K. A comparative study on structural and electronic properties of PECVD a-SiOx with a-SiNx. J. Non Cryst. Solids 1995, 187, 287–290. [Google Scholar]
  32. Deshpande, S.V.; Gulari, E.; Brown, S.W.; Rand, S.C. Optical properties of silicon nitride films deposited by hot filament chemical vapor deposition. J. Appl. Phys. 1995, 77, 6534–6541. [Google Scholar] [CrossRef] [Green Version]
  33. Cheng, Y.; Huang, X.; Du, Z.; Xiao, J. Effect of sputtering power on the structure and optical band gap of SiC thin films. Opt. Mater. 2017, 73, 723–728. [Google Scholar] [CrossRef]
  34. Momeni, A.; Pourgolestani, M.; Taheri, M.; Mansour, N. Enhanced red photoluminescence of quartz by silicon nanocrystals thin film deposition. Appl. Surf. Sci. 2018, 434, 674–680. [Google Scholar] [CrossRef]
  35. Khatami, Z.; Wilson, P.R.J.; Wojcik, J.; Mascher, P. The influence of carbon on the structure and photoluminescence of amorphous silicon carbonitride thin films. Thin Solid Film 2017, 622, 1–10. [Google Scholar] [CrossRef]
  36. Tompkins, H.G.; Hilfiker, J.N. Spectroscopic Ellipsometry: Practical Application to Thin Film Characterization; Momentum Press: New York, NY, USA, 2015. [Google Scholar]
  37. Jaglarz, J.; Dulian, P.; Karasinski, P. Thermo-optical properties of porous silica thin films produced by sol-gel metod. Mater. Chem. Phys. 2020, 243, 122603. [Google Scholar] [CrossRef]
  38. Gómez-Varela, A.I.; Castro, Y.; Durán, A.; de Beule, P.A.A.; Flores-Arias, M.T.; Bao-Varela, C. Synthesis and characterization of erbium-doped SiO2-TiO2 thin films prepared by sol-gel and dip-coating techniques onto commercial glass substrates as a route for obtaining active GRadient-INdex materials. Thin Solid Film 2015, 583, 115–121. [Google Scholar]
  39. Blaszczyk-Lezak, I.; Wrobel, A.M.; Aoki, T.; Nakanishi, Y.; Kucinska, I.; Tracz, A. Remote nitrogen microwave plasma chemical vapor deposition from a tetramethyldisilazane precursor. 1. Growth mechanism, structure, and surface morphology of silicon carbonitride films. Thin Solid Film 2006, 497, 24–34. [Google Scholar] [CrossRef]
  40. Cottrell, T.L. The Strengths of Chemical Bonds, 2nd ed.; Butterworth: London, UK, 1958. [Google Scholar]
  41. Gracia, F.; Yubero, F.; Holgado, J.P.; Espinos, J.P.; Gonzalez-Elipe, A.R.; Girardeau, T. SiO2/TiO2 thin films with variable refractive index prepared by ion beaminduced and plasma enhanced chemical vapor deposition. Thin Solid Film 2006, 500, 19–26. [Google Scholar] [CrossRef]
  42. Chang, W.; Chang, C.; Leu, J. Optical properties of plasma-enhanced chemical vapor deposited SiCxNy films by using silazane precursors. Thin Solid Film 2017, 636, 671–679. [Google Scholar] [CrossRef]
  43. Lambert, J.B.; Shurvell, H.F.; Graham Cooks, R. Introduction to Organic Spectroscopy, 1st ed.; Macmillan: New York, NY, USA, 1987; pp. 174–177. ISBN 0023673001. [Google Scholar]
  44. Silverstein, R.M.; Bassler, G.C.; Morrill, T.C. Spectrometric Identification of Organic Compounds, 5th ed.; Wiley: New York, NY, USA, 1991; pp. 72–118, ASIN B00CIFTXXK. [Google Scholar]
  45. 45. Anderson, D.R. Analysis Silicones; Lee Smith, A., Ed.; Wiley-Interscience: New York, NY, USA, 1974; Chapter 10; ISBN 10: 0471800104. [Google Scholar]
  46. Juškevičius, K.; Audronis, M.; Subačius, A.; Kičas, S.; Tolenis, T.; Buzelis, R.; Drazdys, R.; Gaspariūnas, M.; Kovalevskij, V.; Matthews., A.; et al. Fabrication of Nb2O5/SiO2 mixed oxides by reactive magnetron co-sputtering. Thin Solid Film 2015, 589, 95–104. [Google Scholar]
  47. Liu, H.; Chen, S.; Ma, P.; Pu, Y.; Qiao, Z.; Zhang, Z.; Wei, Y.; Liu, Z. Ion beam sputtering mixture films with tailored refractive indices. Opt. Laser Technol. 2014, 55, 21–25. [Google Scholar] [CrossRef]
  48. Bauer, S.; Klippe, L.; Rothhaar, U.; Kuhr, M. Optical multilayers for ultra-narrow bandpass filters fabricated by PICVD. Thin Solid Film 2003, 442, 189–193. [Google Scholar] [CrossRef]
  49. Linkens, D.A.; Abbod, M.F.; Metcalfe, J.; Nichols, B. Modeling and fabrication of optical interference rugate filters. ISA Trans. 2001, 40, 3–16. [Google Scholar] [CrossRef]
Figure 1. UV-Vis transmission spectra of the coatings deposited from TMDSN (a) and HMDSN (b) at different N2/O2 proportions of the working gas mixture.
Coatings 10 00794 g001
Figure 2. Experimental and calculated values of tan Ψ for the coating obtained from HMDSN under pure oxygen conditions.
Coatings 10 00794 g002
Figure 3. Dependence of optical parameters of the coatings deposited from TMDSN (a) and from HMDSN (b) on the composition of working gas mixture (oxygen–nitrogen).
Coatings 10 00794 g003
Figure 4. Surface topography of the coatings: T-20 N2 (a), T-20 O2 (b), H-20 N2 (c), and H-20 O2 (d).
Coatings 10 00794 g004
Figure 5. An example of a wide scan XPS spectrum of the H-20 N2 coating.
Coatings 10 00794 g005
Figure 6. The Si 2p, N 1s and C 1s XPS narrow scans of films deposited from HMDSN precursor at different working gas compositions.
Coatings 10 00794 g006
Figure 7. FTIR spectra of the coatings deposited at three different compositions of the working atmosphere and recorded within the range of 4000–1400 cm−1 (a), and 1300–400 cm−1 (b).
Coatings 10 00794 g007
Figure 8. Profiles of refractive index and extinction coefficient of a SiONC coating, deposited under conditions of variable nitrogen-to-oxygen proportions in the working atmosphere, as a function of the film thickness: theoretical model (a) and the real profile recorded by ellipsometric measurements (b).
Coatings 10 00794 g008
Figure 9. Model (a) and real profiles of refractive index and extinction coefficient changes (b) for a coating deposited in a N2–O2–N2–O2–N2 sequence.
Coatings 10 00794 g009
Figure 10. UV-Vis transmission spectra of the coatings deposited with a one-fold N–O, two-fold N–O–N and fourfold N–O–N–O–N change of working atmosphere.
Coatings 10 00794 g010
Figure 11. Elemental composition in-depth profiles of a coating deposited with a two-fold N–O–N change of working atmosphere.
Coatings 10 00794 g011
Figure 12. A model gradient change of refractive index of the “cold mirror” interference filter.
Coatings 10 00794 g012
Figure 13. Reflection spectra of the “cold mirror” type of interference filter: theoretical model, and real device.
Coatings 10 00794 g013
Figure 14. SEM image of the cross-section of the optical interference filter manufactured.
Coatings 10 00794 g014
Table 1. The settings of deposition parameters.
Parameter
Initial pressure0.5 Pa
Working pressure20 Pa
Self-bias voltage−880 V
Temperature of organosilicon compound303 K
Precursor flow rate6 sccm
Total flow rate of working gases20 sccm
Table 2. The acronyms of the samples used in this work.
Gas CompositionTetramethyldisilazaneHexamethyldisilazane
20 sccm N2T-20 N2H-20 N2
12 sccmN2/8 sccm O2T-12 N2/8 O2H-12 N2/8 O2
10 sccmN2/10 sccm O2T-10 N2/10 O2H-10 N2/10 O2
8 sccmN2/12 sccm O2T-8 N2/12 O2H-8 N2/12 O2
20 sccm O2T-20 O2H-20 O2
Table 3. The magnitudes of optical gap Eg, index of refraction n, roughness Sr and thickness d of the coatings deposited from different organosilicon precursor compounds under conditions of three different compositions of N2/O2 working gas.
Gas CompositionTMDSNHMDSN
Eg [eV]nSr [nm]d [nm]Eg [eV]nSr [nm]d [nm]
20 sccm N22.932.314.18309.82.712.222.83171.9
10 sccm O2/10 sccm N23.062.133.50277.22.911.921.75143.0
20 sccm O23.111.993.21247.92.951.650.26136.0
Table 4. Ra i Rq surface roughness parameters of the coatings deposited from different organosilicon precursors at different N2/O2 composition of the working gas mixture.
Gas CompositionTMDSNHMDSN
Ra [nm]Rq [nm]Ra [nm]Rq [nm]
20 sccm N20.3400.5010.2990.439
10 sccm O2/10 sccm N20.2790.3890.2560.289
20 sccm O20.1870.2410.1560.203
Table 5. Elemental composition of the films deposited from HMDSN at different composition of the working gas mixture as well as that of the HMDSN precursor compound.
Gas CompositionSi [at.%]N [at.%]C [at.%]O [at.%]
20 sccm N222.7 ± 0.246.5 ± 0.125.8 ± 0.15.0 ± 0.2
10 sccm O2/10 sccm N223.9 ± 0.320.5 ± 0.219.9 ± 0.135.7 ± 0.2
20 sccm O226.4 ± 0.25.8 ± 0.113.3 ± 0.254.4 ± 0.3
HMDSN22.211.166.670.00
Table 6. Surface areas of particular components of a broad IR absorption band recorded at 1300–700 cm−1 for selected coatings deposited from HMDSN (key: s—stretching vibrations; r—rocking vibrations).
Type of BondWavenumber [cm−1]Area [a.u.]
H-20 N2H-10 N2/10 O2H-20 O2
Si–O–(CHx)x (s) [45]11500.61.53.0
Si–O (s) [43,45]1107--0.8
Si–O (s) in SiO2 [43,45]1035-5.112.1
Si–NH–Si (s) [45]95610.93.30.7
Si–N (s) [45]83013.29.20,1
Si–C (s) [43,45]7903.12.00.2
Si–O (r) [43,45]445-0.10.6
Table 7. Oxygen/nitrogen proportions applied in subsequent steps of a deposition of a gradient refractive index coating.
Flow rate O2 [sccm]048121620
Flow rate N2 [sccm]201612840

