Structure and Properties of AlCrN Coatings Deposited Using Cathodic Arc Evaporation


Faculty of Mechanical Engineering, Koszalin University of Technology, 75-453 Koszalin, Poland
*
Author to whom correspondence should be addressed.
Coatings 2020, 10(8), 793; https://doi.org/10.3390/coatings10080793
Submission received: 10 July 2020
/
Revised: 5 August 2020
/
Accepted: 13 August 2020
/
Published: 15 August 2020
(This article belongs to the Special Issue Coatings Deposited by Cathodic Arc and Magnetron Sputtering Process)
Abstract
:Al–Cr–N coatings were formed at various nitrogen pressures, substrate bias voltages and substrate temperatures using cathodic arc evaporation. The relationship between technological parameters and properties of the coatings was investigated. The phase and chemical composition of the coatings, roughness, hardness, adhesion and thermal stability were analyzed by X-ray diffraction (XRD), scanning electron microscope (SEM), Energy-dispersive X-ray spectroscopy (EDX), micro-indenter, Rockwell, scratch tester and thermomechanical methods. The corrosion resistance of selected coatings was also investigated. XRD analysis indicates that the coatings crystallize in a cubic structure and show preferential orientation (200) CrN. With the increase of nitrogen pressure, the preferential orientation changes to (111). EDX analysis shows that as nitrogen pressure increases, the Al/(Al + Cr) rate decreases. Microscopic observations indicate that the number of macroparticles reduces as nitrogen pressure increases. As a result, the surface roughness parameter Ra of the coatings decreases. The effects of deposition temperature, nitrogen pressure and substrate bias voltage on the mechanical and tribological properties of the coatings were investigated. It was found that the above parameters influence the mechanical properties in different ways. The hardness and adhesion of coatings formed at higher temperatures was lower. Coatings formed under a higher nitrogen pressure or substrate bias voltage were characterized by higher hardness and better wear resistance.
1. Introduction
Chromium nitride coatings have found wide industrial applications due to their good mechanical and tribological properties and corrosion resistance [1,2]. However, their relatively low hardness as compared to the other coatings of transition metal nitrides reduces the area of their application—especially in tribology, in which the hardness is crucial. Additionally, for high-temperature applications, the thermal coating’s stability determines the lifetime [3].
An addition to the two-component Cr–N coatings, metallic and nonmetal elements can provide improvement in their properties, including increased hardness [4,5,6,7].
The coatings were deposited on separate Al and Cr cathodes [6,8] and from alloy cathodes with the composition Al1-xCrxN, where x = 0.2 [9], 0.3 [7,10], 0.5 [11]. Another composition of cathodes was also used [4,5,7,12,13,14,15]. It was found that the hardness, oxidation resistance and tribological properties of AlCrN coatings improved with an increase of Al content, up to 70–75%—as long as a face-centered cubic structure dominates [4,15]. This results in an increase in resistance to oxidation compared to the CrN, TiN and TiAlN coatings and hardness stability up to temperature of 800 °C [2]. With the concentration of aluminum increase in the AlCrN coating AlN hexagonal phase (h-AlN) is formed. The presence of h-AlN in the coating reduces its mechanical properties [16]. h-AlN phase is more stable than the cubic phase, thus transformation c-AlN → h-AlN occurs spontaneously. Under the operating conditions of coated tools at elevated temperature there may be a phase transformation and mechanical properties of the coating can be deteriorated.
The properties of CrAlN coatings can be changed by selecting appropriate coating deposition parameters, including nitrogen pressure [9,14], AlCr-cathode composition [4,15] and substrate bias voltage [5,7,14]. It has been shown that the microstructure and mechanical properties are strongly related to the cathode composition [4,14] and the pressure of the reactive gas [11]. It was found that the application of the negative bias voltage to the substrate significantly affected the mechanical properties and the structure of the coatings [7]. Reiter et al. [4] indicates that with an increase of Al content to about 70% in the coating, the hardness increases to about 30% and then decreases. An improved abrasion resistance compared to conventional TiN and TiAlN is also observed [4]. However, Aihua et al. [12] states that CrAlN and AlTiN coatings with high aluminum concentration, deposited by cathodic arc evaporation, do not show higher wear resistance compared to TiN and TiAlN.
The AlCrN coating exhibits excellent toughness at a high temperature and wear resistance under extreme conditions of mechanical stress and is used for tools for working gears, cylinders, stamps and forms. This coating is also dedicated to the treatment of hard-to-cut materials [17].
AlCrN coatings can be formed using various methods including magnetron sputtering from separate targets Al and Cr [6,7,18], HIPIMS [11] and cathodic evaporation [4,5,7,9,13,19]. Among the plasma-vacuum technologies, cathodic arc evaporation (CAE) is used more often. It is characterized by a high degree of plasma ionization and particle energy, which results in a high density of coatings and its good mechanical properties, including hardness and adhesion. The disadvantage of the method is a large number of surface defects, macroparticles and craters. Using the magnetron sputtering process, it is possible to obtain smooth coating surfaces. The low degree of plasma ionization results in a low coating density and, as a result, inferior mechanical properties compared to CAE [20].
The goal of this work was to determine the effect of AlCrN deposition parameters on the structural and mechanical properties including thermal stability determined by the thermomechanical analysis (TMA).
The coatings were deposited by cathodic arc evaporation on HS6-5-2 steel substrates. A variable parameters during the coating deposition were: the substrate bias voltage, nitrogen pressure and substrate temperature. The coating structure, deposition rate, chemical composition, hardness, adhesion and wear were studied.
2. Materials and Methods
2.1. Coating Deposition
AlCrN coatings were deposited using cathodic arc evaporation method in semi-industrial TINA 900 M system (Vakuumtechnik Dresden GmbH, Germany) equipped in arc sources with AlCr (50:50) alloy cathode with 99.995% purity. HS6-5-2 steel flat discs with 32 mm in diameter and cylindrical rods with 3 mm in diameter and 30 mm in length (for thermal stability testing) were applied as the substrates. Before deposition they were ground and polished to roughness parameter Ra about 0.02 µm. They were then ultrasonically cleaned in an alkaline bath to remove organic contaminations, rinsed in deionized water and dried in warm air. The substrates were placed on a rotating holder within the vacuum chamber at a distance of 18 cm from the arc sources. The planetary rotation about 2 rpm was applied. The vacuum chamber was evacuated to pressure of 1 mPa. The next step prior to forming the coatings was an ion-etching of the substrate surface to remove surface oxides and to improve the adhesion of the coatings on the substrate. Ion etching using argon and chromium ions was carried out in an argon environment. In order to improve the adhesion of coatings on the substrate surface, a thin chromium layer with thickness of about 0.2 µm was deposited.
The AlCrN deposition process was carried out using the arc current of 80 A. The coatings were prepared at substrate bias voltage (UB) −100 V and nitrogen pressure in the chamber ranged from 1 to 5 Pa. The deposition parameters are summarized in Table 1.
Additionally, the coatings were deposited using other technological parameters: substrate temperature of 450 °C, substrate bias voltage ranging from 0 to −300 V. These coatings were not studied systematically.
The gas pressure and gas flow (argon, nitrogen) were controlled, respectively, using a Baratron type capacity gauge (MKS Instruments, Inc., Austin, TX, USA) and MKS flow controller (MKS Instruments, Inc., Austin, TX, USA).
2.2. Characterization Methods
X’Pert Panalytical device with CuKα radiation was applied to register the X-ray diffraction (XRD, Malvern Panalytical Ltd., Malvern, UK). The measurements were performed with a glancing angle (ω = 3°) and Bragg–Brentano geometry in the range of 2 theta angles between 30° and 120°. The grain size was calculated using Scherrer’s formula [21]. Due to instrumental peak broadening, 0.2° for silicon standard, the Warren–Biscoe correction method was used [21].
Microstructure and surface morphology was measured by scanning electron microscopy (JEOL JSM-5500LV, JEOL Ltd., Tokyo, Japan). The Energy Dispersive X-ray Spectroscopy (EDS) and Wavelength-dispersive X-ray spectroscopy (WDS, thermo Fisher Scientific, Waltham, MA, USA) were applied to analyze the chemical composition of the coatings. Oxford Link ISIS 300 (Link Analytical/Oxford Instruments, High Wycombe, UK) and Noran Instruments IBEX systems (NORAN instruments, Inc., Middleton, WI, USA) were used, respectively.
Coating thickness was determined using spherical abrasion test. Hardness measurements were performed using Fischerscope® HM2000 microtester (Fischer Technology Inc., Windsor, CT, USA) equipped in WIN-HCU® software. Microhardness was determined with the fixed penetration depth of 0.3 µm, lower than 10% of coating thickness. It enables the correct measurement of coating hardness. Due to high roughness of the coating surface the procedure described by Romero et al. [5] including the coating surface polishing by fine-grained diamond powder (2 μm) was used. After this operation, significantly reducing the surface roughness of the coating (to Ra~0.05 µm), the hardness was determined with a much smaller measurement uncertainty was applied. The hardness value was an average of 20 measurements.
Adhesion was assessed by Revetest scratch tester (CSM Instruments, Peseux, Switzerland) equipped with diamond indenter Rockwell type C with a tip radius of 0.2 mm. The indenter was moved with a sliding speed of 10 mm/min. Simultaneously, normal force increased linearly from 0 to 100 N. Lc1 critical load was determined as the load at which the first cracks in the coating appear and Lc2 critical load was defined as the load at which the total delamination of the coating from the substrate was observed. These loads were determined by observation using an optical microscope as the mean of at least three measurements. Adhesion was also evaluated using the Daimler–Benz test with a six-mode scale of adhesion quality [22]. According to this scale assigned to specific damage to the coating, HF1 to HF4 refer to relatively good adhesion with only few cracks or delamination close to contact with the Rockwell indenter. Notations HF5 and HF6 indicate poor adhesion with extensive spalling of the coating.
The surface roughness of the coatings was determined using contact profilometer Hommel Tester T8000 (Hommelwerke GmbH, Schwenningen, Germany). The test was performed five times for each sample.
The friction and wear of the coatings and counter-samples were determined by the ball-disk test. The test parameters are listed in Table 2.
The wear rate kv was evaluated from the equation: kv = V/(s·L), where V is volume of the removed coating material, s is the sliding distance and L is the normal load [23]. To calculate the wear rate five randomly selected cross-sectional wear profiles were selected.
Corrosion resistance investigations were carried out using the potentiodynamic test to determine the corrosion potential Ecorr, which is an indicator of the corrosion resistance of the material. The higher the corrosion potential, the more resistant the material to corrosion. The second parameter analyzed was the corrosive current density icorr, which is directly proportional to the speed of the corrosion process. Based on the obtained potentiodynamic curves, the corrosion potential (Ecorr), the corrosion current density (icorr), the coefficients ba and bc being the slopes of the anode and cathode straight sections of Tafel and the value of polarization resistance (Rp) were determined using the Tafel method [24].
The corrosion susceptibility of the substrate–coating system was checked using the potentiodynamic method on the Atlas 0531 device (Atlas-Sollich, Rebiechowo/Gdansk, Poland). The tests were carried out in a three-electrode electrochemical cell according to the following assumptions:
- Reference electrode: calomel electrode Hg/Hg2Cl2/KCl; (SCE);
- Counter electrode: platinum electrode;
- Sample exposed surface: 0.292 cm2;
- Ambient temperature: 25 ± 1 °C;
- Electrolyte: 3.5% aqueous NaCl solution;
- Sample stabilization: measurement of the stationary potential in an open circuit during 1 h to obtain three reproducible results;
- Potential increase rate: 0.167 mV/s;
- Potential range: reference sample: −0.750 V ÷ −0.300 V, substrate–coating: −0.500 V ÷ 1.100 V.
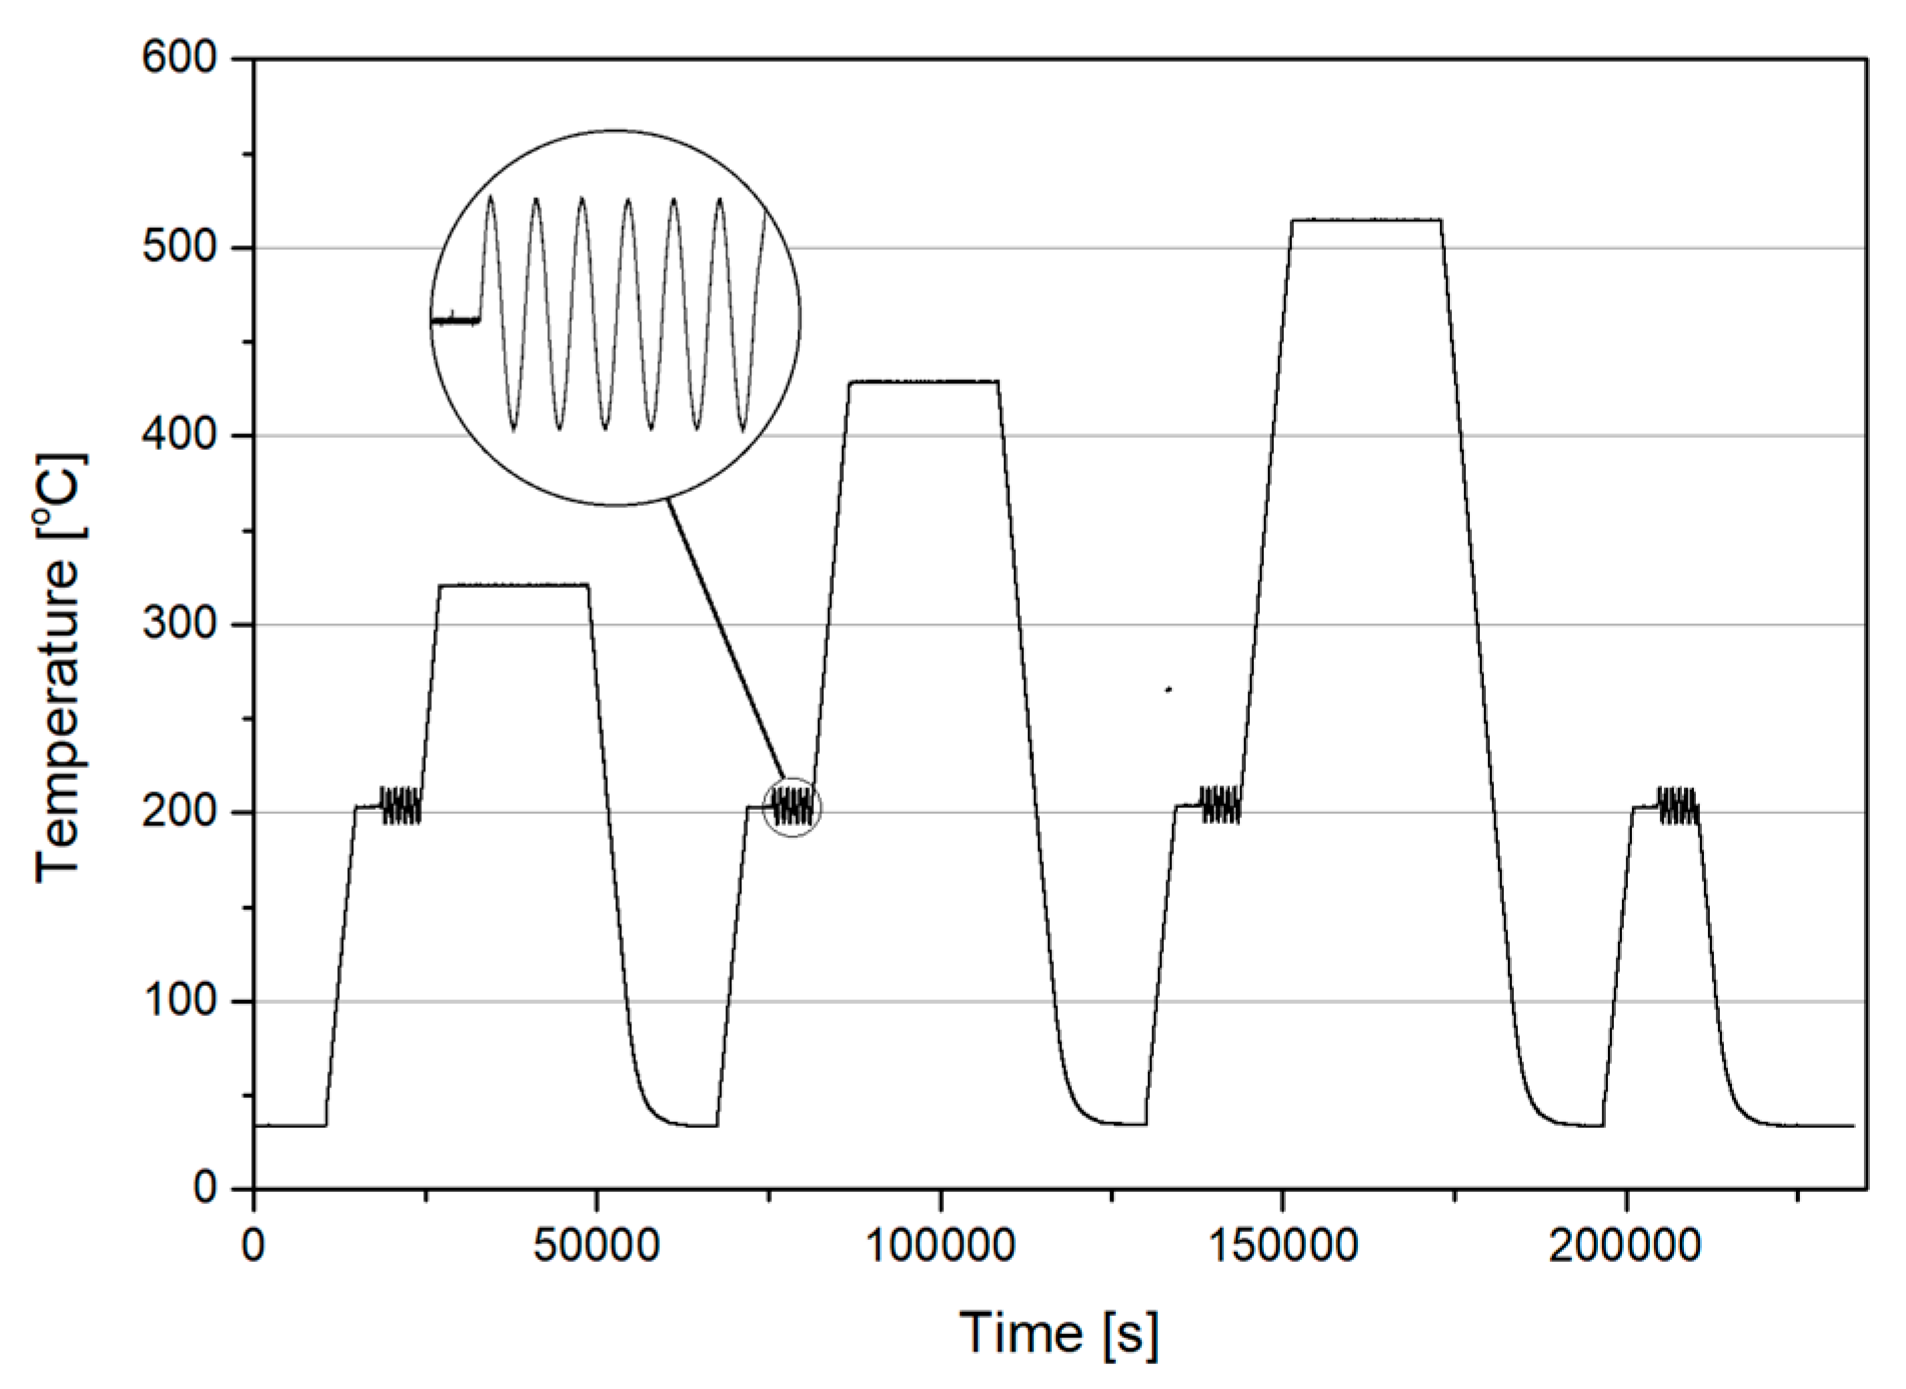
The tests of thermal stability of AlCrN coatings were conducted by modification of thermomechanical analysis known as DL TMA (dynamic load thermomechanical analysis) [25]. For thin-coating–substrate systems the object of measurements are the deformations of the cylindrical substrate occurring under the influence of temperature-dependent thermomechanical loads of the substrate by the deposited coating [26]. The source of these phenomena is the variable state of stress in the system due to thermal activation of a number of phenomena in the coating [27,28]. The substrate deformation is measured with a compensating dilatometer using temperature modulation [29]. The linear deformations of the substrate during heating are measured according to the thermogram shown in Figure 1.
The samples were annealed successively at temperature Ta = 320, 430, and 520 °C for 3 h in the argon atmosphere. A characteristic feature of the testing method applied is that at the temperature of 200 °C. An isothermal heating sequence was used with a sinusoidal temperature modulation with an amplitude of ±10 °C and a period of 6 min. The rate of linear temperature changes was 5 °C/min.
The value of substrate linear expansion during heating depends both on the substrate material properties and the coating material applied, the adhesion of the coating to the substrate and the current value of stresses occurring in the tested coating [28,30].
The applied metrological solution allows identification of the thermal stability of the thermomechanical loads of the substrate by determining changes in the values of two quantities: -at temperature above 150 °C—the effective coefficient of the substrate deformation—αDL, -at temperature of 20 °C of the fixed increase in the elongation of the substrate ΔLs after consecutive isothermal heating of the sample of the system successively at temperatures Ta = 320, 430, and 520 °C according to the thermogram in Figure 1.
The αDL coefficient is a value depending on the current thermomechanical load of the substrate and is measured under temperature modulation conditions that is calculated from the equation:
where: <AL>—the average amplitude of the cyclic changes in the elongation of the substrate temperature, <AT>—the average amplitude of the cyclic changes of the temperature modulation, L0—the substrate length at temperature 200 °C.
The proper measurement resolution for the measured values of substrate deformations is obtained by using temperature modulation [31]. Thermal stability of the thermomechanical interactions between the substrate and the coating was defined by determining the relative changes of substrate expansion coefficient αDL after subsequent heating cycles, measured at a temperature of 200 °C after annealing at temperature Ta = 320, 430, and 520 °C (Figure 1) which is calculated using formula:
where: αDLa—expansion coefficient of the coating–substrate system after annealing in selected temperature mentioned above, αDLd—expansion coefficient of the coating–substrate system after coating deposition.
The values of fixed increments ΔLs after a given isothermal heating can also be used to describe the thermomechanical loads of the substrate of the examined system. For systems in which the compressive stress resides in the coating at 20 °C, the substrate is stretched under the influence of the deposited coating. As a consequence of thermal activation in the coating of a number of processes [2,13,14,27,28], the state of stress in the system changes, whose metrological effect is the recorded change in the substrate length ΔLs related to the substrate length immediately after the adhesive coating is deposited. For a system where compressive stresses occur in the coating, a positive value of ΔLs after a given isothermal heating means an increase in compressive stress, while a negative value means a decrease in compressive stress. Changes in the absolute values of length increments ΔLs can be a quantitative measure of the thermal stability of the AlCrN coatings tested.
A consequence of the change in the stress state in the system is the increase in the length ΔLs of the substrate of the tested coating–substrate system after a given annealing. It is mainly caused by the thermal activation of a number of structural and chemical processes in the coating. They are treated as a source of changes in the dynamic load on the substrate by the deposited coating. Hence, the value of ΔLs measured at 20 °C was adopted as a measure of the thermal stability of the coating structure. Modulated dilatometry enables the measurement of changes in the substrate length with the resolution appropriate for these changes, while maintaining specific metrological conditions.
3. Results
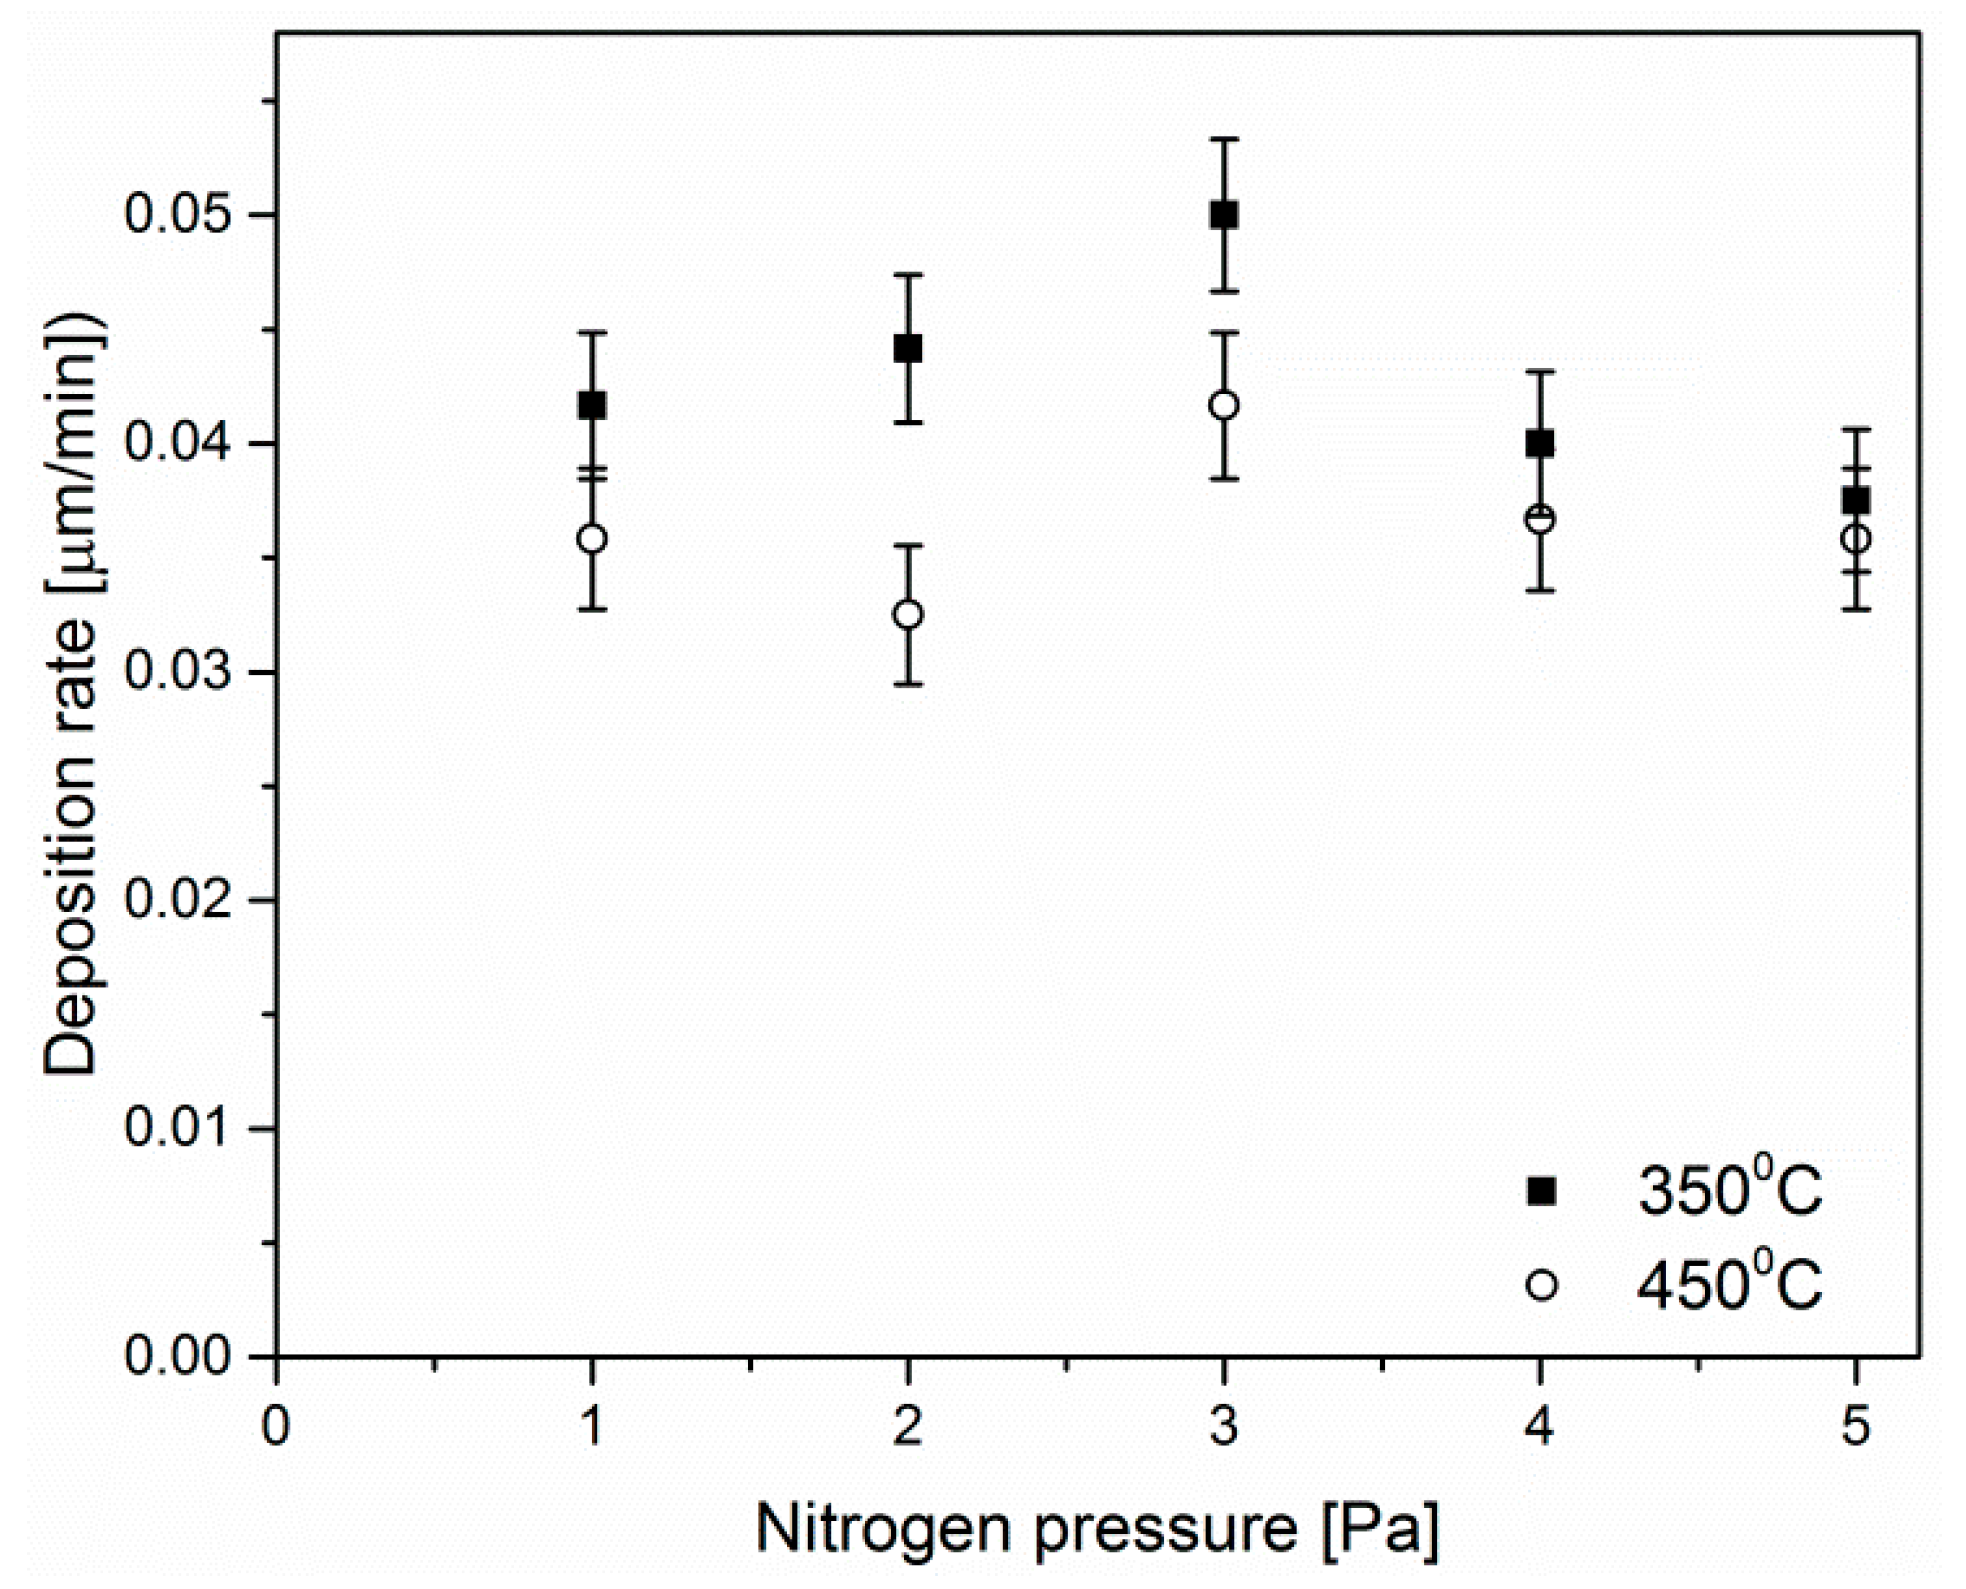
The thickness of the coatings deposited at temperature 350 °C was in the range of 4.5 to 6.0 µm with maximum thickness for coating deposited in nitrogen pressure 3 Pa. The coatings deposited at higher substrate temperature, 450 °C, characterize by about 20% lower thickness ranged from 3.9 to 5 µm. For this substrate temperature the maximum thickness for coating deposited in nitrogen pressure 3 Pa was also observed. Due to the fact that deposition time of all coatings was the same, the deposition rates (Figure 2) are relevant.
3.1. Phase and Chemical Composition
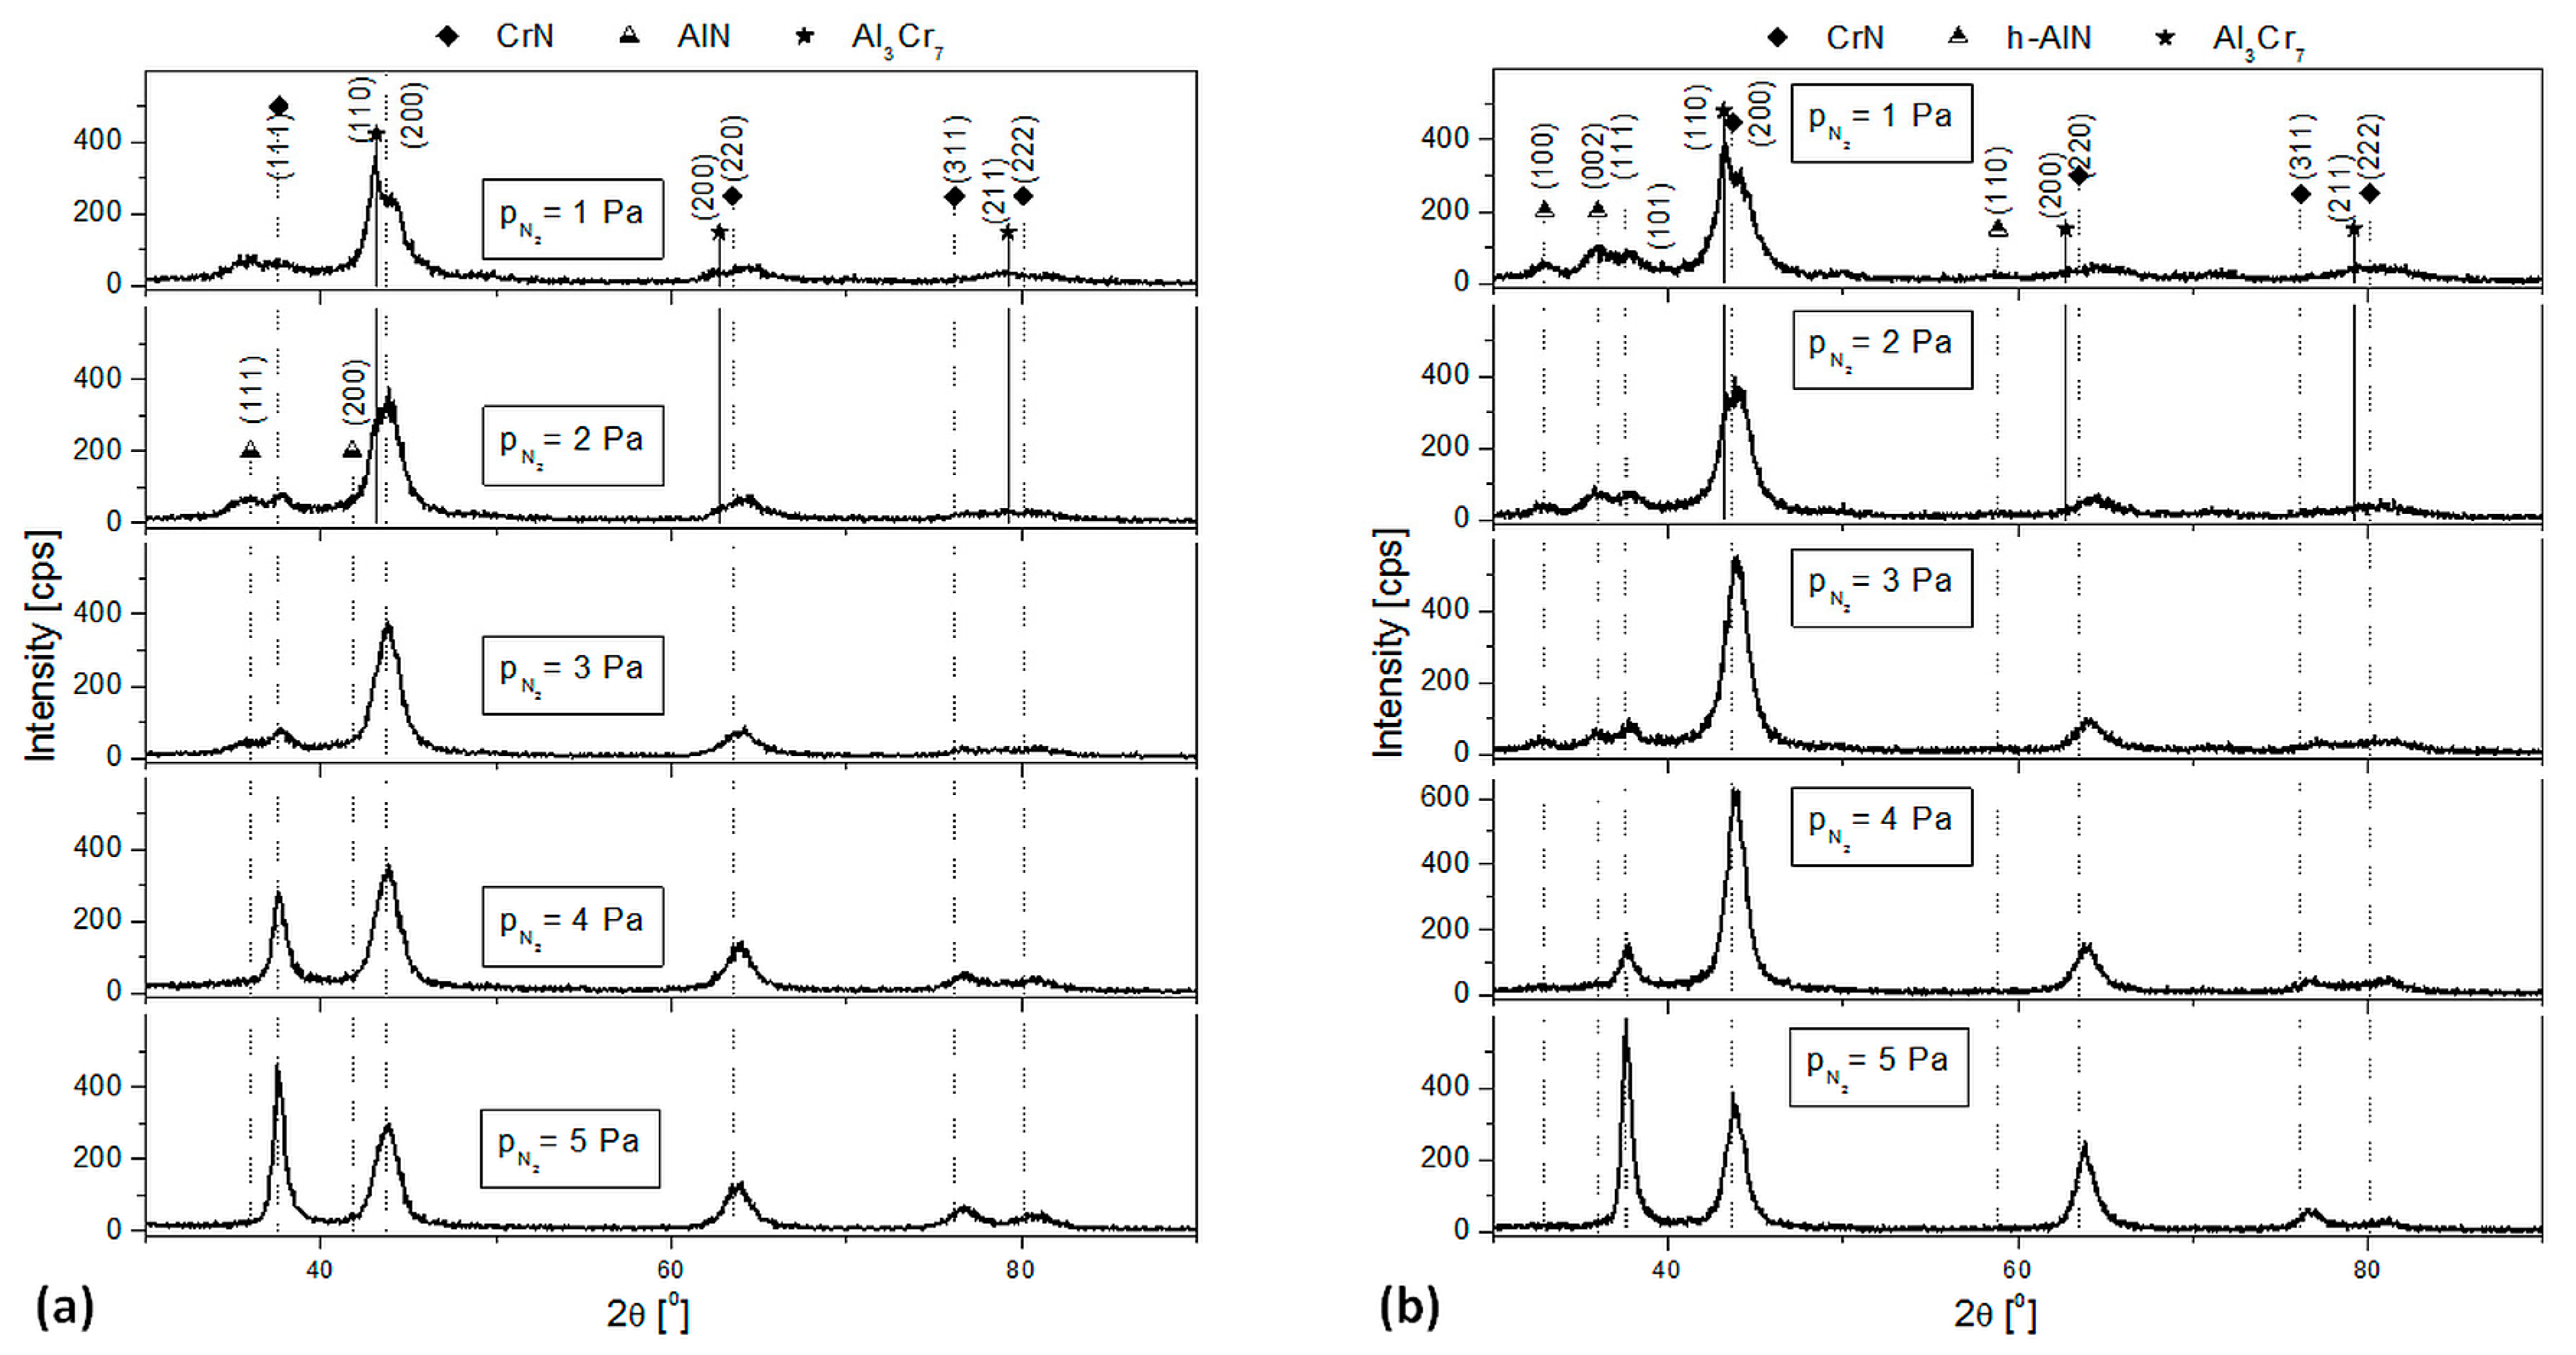
The typical XRD diffraction patterns of AlCrN coatings deposited at temperature of 350 and 450 °C, negative substrate bias voltage 100 V and nitrogen pressure ranged from 1 to 5 Pa are shown in Figure 3. The coatings crystallized in cubic CrN and AlN structure with main (111), (200) and (220) planes. The (311) and (222) planes with smaller intensity are also visible. In coating deposited at pressure of 1 Pa three phases can be identified: cubic CrN (ICDD 11-0065), cubic AlN (ICDD 46-1200) and Al3Cr7 (ICDD 03-065-6108). For nitrogen pressure higher than 2 Pa Al3Cr7 phase decays. In coatings deposited at nitrogen pressure ranged from 3 to 5 Pa only CrN phase is observed.
The peak positions of AlCrN coatings agree with the powder diffraction pattern of CrN. The intensity of the diffraction lines differs from the standard and depends on the nitrogen pressure during deposition. The preferred (200) CrN orientation is recognized in each coating. The peak positions are shifted to the higher angle. It can be explained by difference in lattice parameter for CrN (0.4140 nm) and AlN (0.4045 nm). This shift can be related to relaxation of residual stress, as well as the formation of the h-AlN phase [4]. Peak positions of AlCrN coating exist at higher angle compared to AlN. It can suggest that the investigated coatings form the solid solution CrN and AlN phases.
The coatings show preferential orientation in (111) and (200) planes. Such oriented coatings should be dense and adhesive to the substrate [32].
Careful observations of the diffraction lines in Figure 3a indicate that the lattice constant for coatings formed at 350 °C increases from 0.4129 nm (3 Pa) to 0.432 nm (5 Pa). Simultaneously, the crystallite size in the coating, calculated from the plane (200), increases from 58 nm to 61 nm, respectively. The position of this diffraction line is shifted towards higher angles related to the standard (42.638°) by about 0.2°. For coatings formed at 450 °C (Figure 3b), the position of the diffraction line (200) is shifted towards higher angles by approximately 0.3°. The lattice constant increases from 0.4118 nm (3 Pa) to 0.4125 nm (5 Pa), and the size of the crystallites increases from 64 nm to 76 nm, respectively. This means that in coatings formed at higher temperature, crystallites reach dimensions about 15% higher than crystallites present in the coatings formed at 350 °C. Similar increase in lattice parameter with nitrogen was observed by Tang et al. [11].
An increase in substrate bias voltage results in change of coating structure, Figure 4. For these coatings, a shift of the diffraction line (200) towards higher angles of about 0.3° is also visible. An increase in the crystallite size to about 64 nm (UB = −150 V) is observed. It is associated with higher energy of bombarding ions, increasing temperature of the coating/substrate.
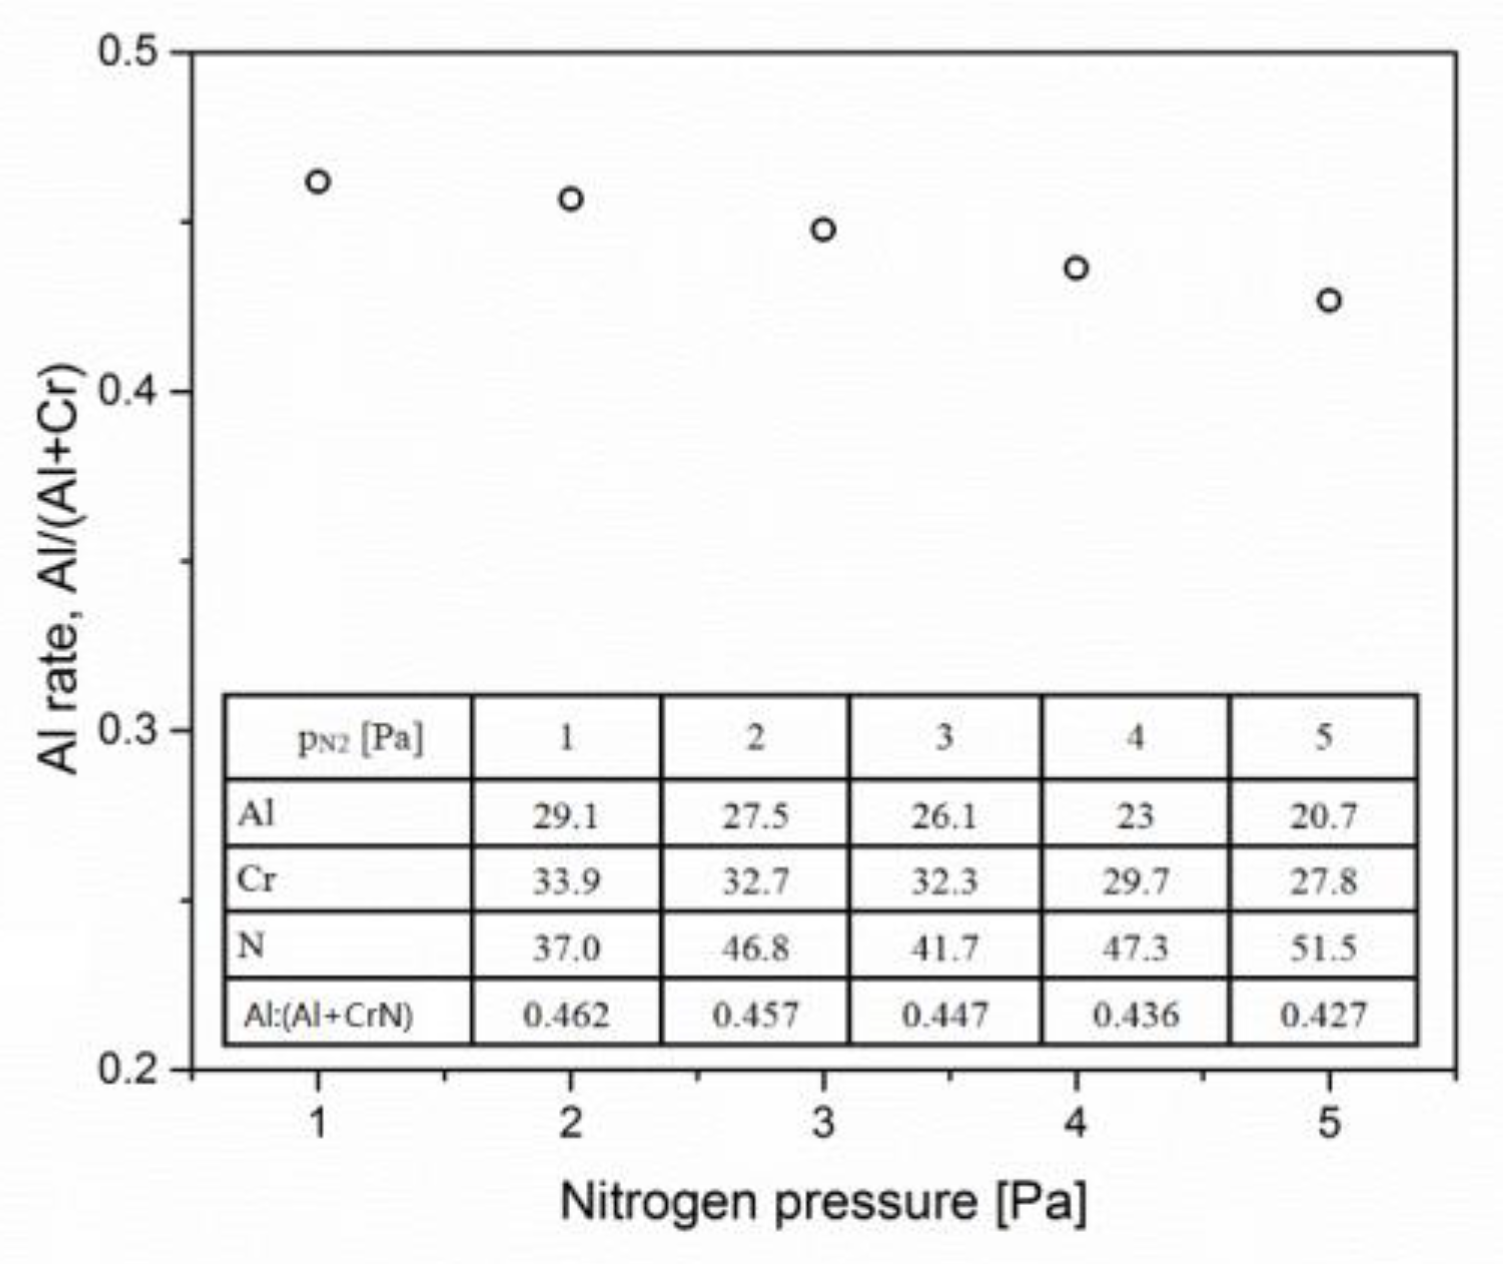
EDS measurement results confirm the presence of nitrogen, aluminum and chromium in the coatings. It should be also noted that in all the coatings about 0.5 at.% of oxygen was recorded. Analysis of the chemical composition of the coatings deposited at 350 °C with a negative substrate bias voltage of 100 V (Figure 5) indicates that increase in nitrogen pressure from 1 Pa to 5 results in increase of nitrogen concentration in the coatings from about 37 to 51 at.%. Simultaneously, the decrease of aluminum and chromium concentration in the coatings is observed.
EDS analysis is not very precise for light elements such as oxygen, nitrogen and carbon, and therefore the ratio of aluminum to chromium in the coating was calculated. This ratio is different from the composition of the cathode (50:50) and generally indicates loss of aluminum in the coating.
3.2. Surface Morphology
The disadvantage of an applied method of coating deposition, cathodic arc evaporation, is a large amount of macroparticles on the coating surface. During the arc process, the droplets emitted from the target arc spots may agglomerate to form macroparticles before reaching the coating surface [32]. On the surface of the coatings a large number of loosely adhered macroparticles with different sizes is observed, Figure 6. Craters at locations of removed macroparticles are also visible. The shape of the macroparticles is mainly spherical. Their size ranges from tenths of a micrometer to several micrometers, while most macroparticles, about 50–60%, are characterized by dimensions up to 1 µm, and a few reach dimensions even up to 10 µm. This effect was confirmed for TiAlN coating deposited by arc ion plating [32].
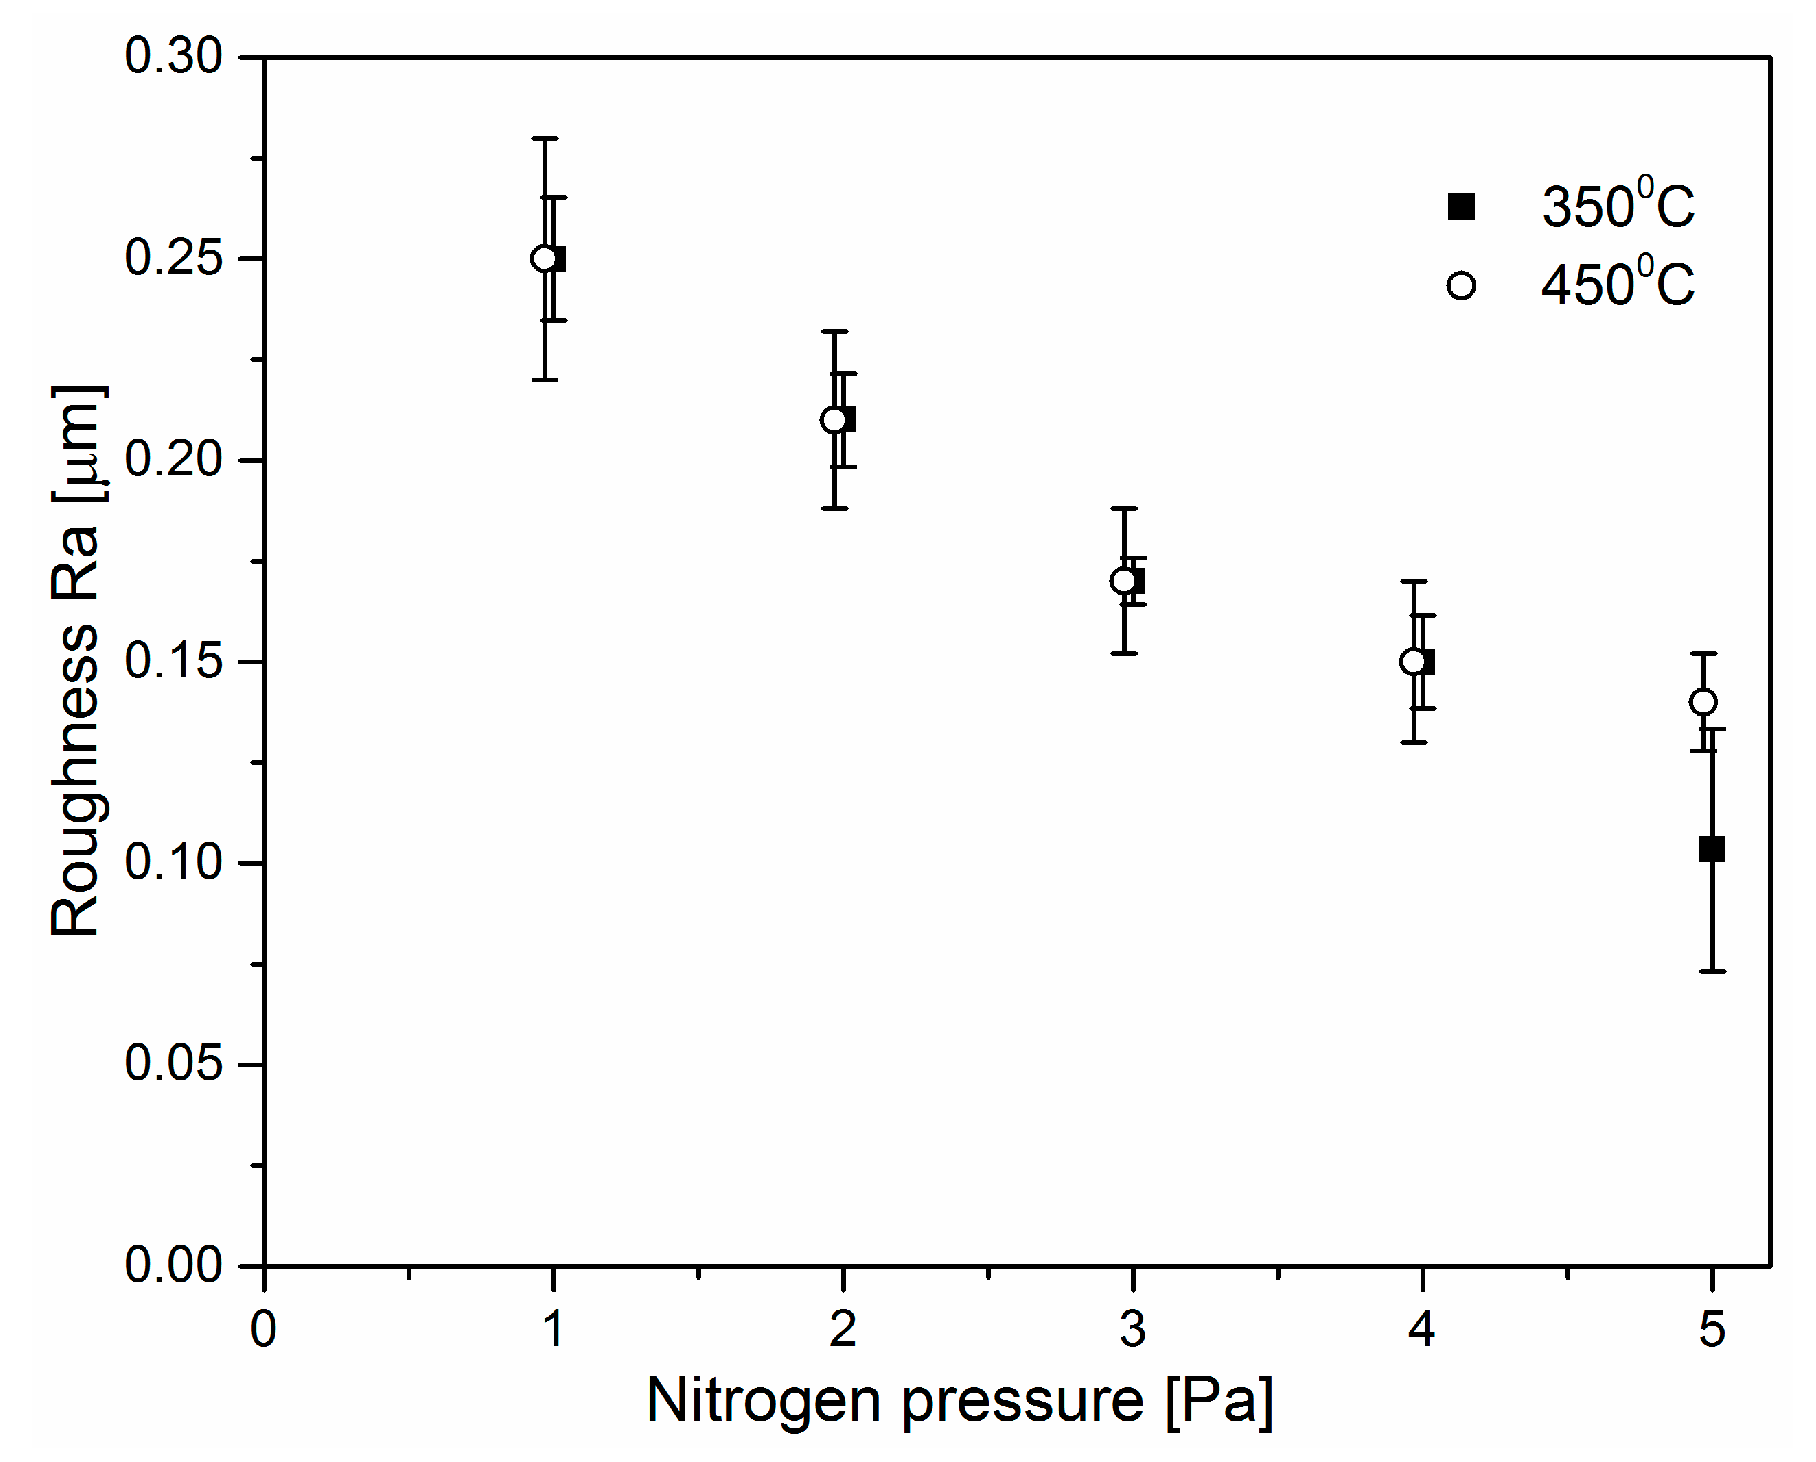
The number of macroparticles decreases with increasing nitrogen pressure during the growth of the coatings. As a result, the roughness parameter Ra decreases (Figure 7). The relatively high Ra value is consistent with the results presented by Reiter et al. [13] on AlCrN coatings deposited using cathodic arc evaporation and Cai et al. [32] on AlTiN coatings.
The investigations of the coatings formed at the nitrogen pressure of 5 Pa and at different substrate bias voltages indicate that with increase of substrate bias voltage the deposition rate of the coating, as well as the surface roughness parameter Ra (arithmetic mean deviation of roughness profile) decrease, Figure 8.
3.3. Hardness
The coatings were deposited on the substrates heated to temperature of 350 °C using a nitrogen pressure from 1 to 5 Pa. In Figure 9 an increase in the hardness of the coatings deposited at higher nitrogen pressures is visible.
Not only hardness, but also deformation relative to yielding (H/E) and resistance to the plastic deformation (H3/E2) ratios [33,34] can be significant indicators for tribological applications. The H/E rate indicates the possible wear of the coating due to its hardness and allows a probable evaluation of the tribological properties of the materials. Better resistance of the coating on the deformation relative to yielding is connected with higher H/E ratio. The higher H3/E2 ratio the higher resistance to plastic deformation. The H/E and H3/E2 ratios are the lowest for the coating deposited under nitrogen pressure of 1 Pa and are 0.068 and 0.074, respectively. They increase with nitrogen pressure during coating deposition and they reach the highest values for the AlCrN coating deposited under nitrogen pressure of 5 Pa, 0.94 and 0.231, respectively.
The substrate bias voltage has a significant effect on the growth and physical properties of the CrAlN coatings formed using cathodic arc evaporation. An increase in hardness with the negative substrate bias voltage is observed, Figure 10.
3.4. Adhesion
One of the most important feature of the coating–substrate system is adhesion. In recent years the scratch test is commonly applied because of the measurable (numeric) test result. Critical load Lc2 related to delamination of coatings formed in different nitrogen pressure and at the substrate bias voltage −100 V is high—about 90 and 80 N for coatings deposited at 350 °C and about 450 °C, respectively, Figure 11. Critical load is almost independent of the nitrogen pressure. Similar results of Lc are also reported in Ref [14,32].
It is assumed that Lc1 critical load is considered to be a resistance to crack initiation. For all coatings, both deposited at 350 and 450 °C Lc1 ranges from 23 to 35 N. For thin coatings the Lc1 value as high as possible is beneficial. Then the cracking of the coating occurs for higher loads. Zhang et al. [35] show that both high Lc1 and difference (Lc2−Lc1) are necessary for high toughness of the coating. They proposed new parameter—CPRS (scratch crack propagation resistance) to evaluation of the film toughness: CPRs = Lc1·(Lc2−Lc1). Based on the equation, it was found that for coatings deposited at 350 °C the average value is about 1900 N2 and is the highest for coating deposited at nitrogen pressure 2 Pa. Average value of CPRS for coatings deposited at 450 °C is about 30% lower and is about 1350 N2. In this set of coatings the highest value is for coating deposited at nitrogen pressure 3 Pa. Above results are consistent with data shown in Figure 11.
The findings of Wang et al. [14] indicate that adhesion strength of AlCrN coatings is similar. Lc2 ranges from 60 to 85 N and Lc1 from 30 to 40 N, depending on the substrate bias voltage and nitrogen pressure. Similar values are presented by Cai et al. [32] for Al–Ti–N coatings deposited using arc ion plating.
The Daimler–Benz adhesion test is extremely quick and easy-to-apply test. The results of the test for coatings deposited at 350 and 450 °C presenting the highest scratch crack propagation resistance (CPRS) are shown in Figure 12. The radial cracks extending out from the indent and spalling of the coatings are visible on coating deposited at 350 °C (Figure 12a) and 450 °C (Figure 12b). Additionally, in Figure 12b the other type of coating damages, the cracks around indentation, are apparent. These cracks show cohesive microspallations along the length. AlCrN coating deposited at 450 °C shows significantly more delamination. The results indicate that the coating adhesion can be classified as HF 2 to HF 3 for coating presented in Figure 12a and HF 3 to HF 4 for coating deposited at higher temperature (Figure 12b). Due to lower hardness of AlCrN coatings deposited at 450 °C pilling up around the indentation after the Daimler–Benz (DB) test forms. For this reason large tensile stresses may occur in its surrounding, which results in cracks around the indentation.
The hard coatings of good cohesion should exhibit—at most—small lines extending radially from the center of the indent to the outside. The indent crater should be also uncracked. In hard coating–substrate systems with good adhesion, there should be no delamination of the coating in the crater or surrounding area.
3.5. Wear
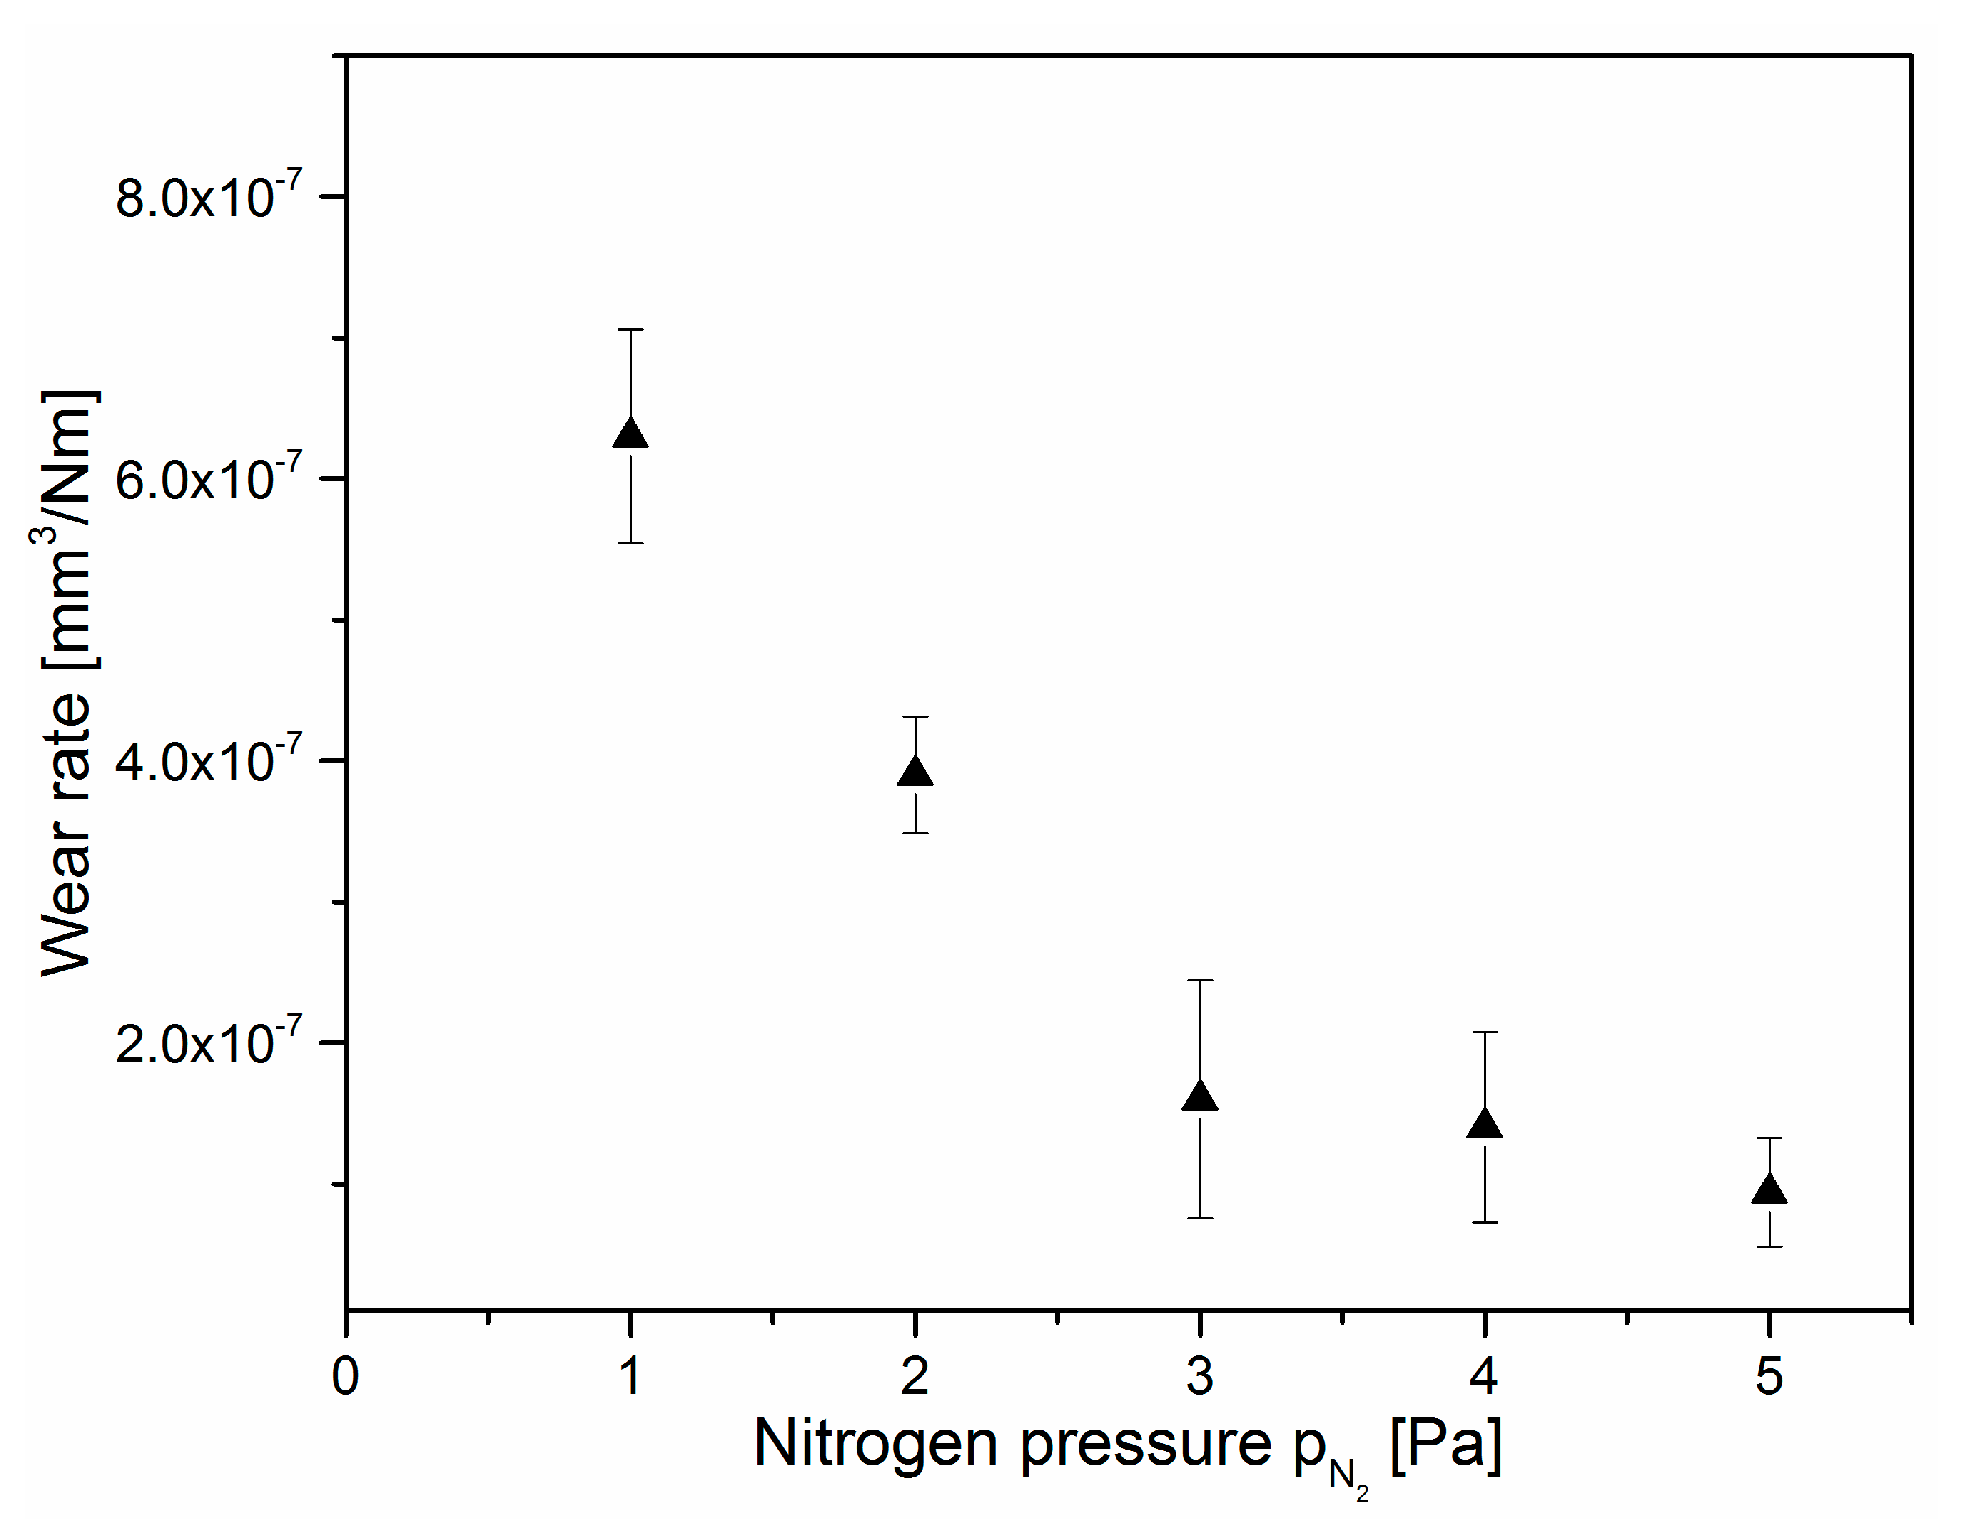
Figure 13 shows the wear rate of the coatings deposited at substrate temperature of 350 °C, substrate bias voltage UB = −100 V and different nitrogen pressure. Many parameters affect the wear rate of the coatings. These are the type of applied counterpart, normal load, sliding speed, test temperature, humidity, etc. Due to them, all the coatings were investigated under the same conditions. It is evident that the increase in nitrogen pressure during coating formation has a positive effect on their antiwear properties.
The wear is independent of coefficient of friction ranging from 0.62 ± 0.02 to 0.68 ± 0.03 against Al2O3 ball without clear trend. The wear rate of coatings formed under an atmosphere of nitrogen at 1 Pa is 6.3 × 10⁻⁷ mm3/Nm decreases approximately 6-fold to 9.4 × 10⁻⁸ mm3/Nm (PN2 = 5 Pa). It can be connected with significantly softer coating-hardness about 16 GPa and its higher roughness. The coatings deposited at higher nitrogen pressure are characterized simultaneously by higher hardness and lower roughness. This is probably the reason for the decreasing coating wear rate.
The wear rate of Al2O3 counterpart is about two levels of magnitude lower than for coatings investigated. It is about 6 × 10⁻⁹ mm3/Nm for the coating formed under nitrogen pressure of 1 Pa and decreases with increasing pressure to about 7 × 10⁻¹⁰ mm3/Nm (PN2 = 5 Pa). The images of selected counterparts wear are presented in Figure 14. They show abrasive wear. The wear diameter of the counterpart cooperating with the coating formed at a nitrogen pressure of 1 Pa is about 480 µm and decreases to about 290 µm for the coating deposited at 5 Pa. Normal load, sliding distance and speed, as well as the circular track of 22-mm diameter against Al2O3 counterpart in the ball-on-disc test were the same.
3.6. Corrosion
The potentiodynamic tests showed that all AlCrN coatings significantly improve the corrosion resistance of HS6-5-2 steel, Figure 15. The change of nitrogen pressure in the coating process do not result in significant changes in the corrosion properties of the steel–coating system. Similar values of both corrosion potential and corrosion current density were registered. The best corrosion properties were obtained for the coating deposited at nitrogen pressure of 3 Pa. The corrosion potential Ecorr was −0.010 V and the corrosion current density icorr 0.044 µA/cm2. However, it should be noted that the differences are small. All calculated parameters are presented in Table 3.
AlCrN coatings were also compared with CrN coating deposited at nitrogen pressure PN2 = 3 Pa and other parameters the same as for AlCrN coatings. The samples showed almost identical anti-corrosion properties, the difference in the corrosion potential is 0.003 V, while in the corrosion current density 0.011 µA/cm2 in favor for CrN coating. There is also a noticeable difference in the course of the corrosion process. AlCrN samples show “noise” in the recording of anode current density, which was not recorded in the sample with the CrN coating applied. Current density fluctuations can, most likely, be attributed to alternating passivation and transpassivation processes occurring on the surface or in the vicinity of the microdroplets of Al. In addition, in the case of AlCrN coatings, a passive state was recorded in the potential range from 0.130 to 0.630 V, which does not occur in the CrN coating.
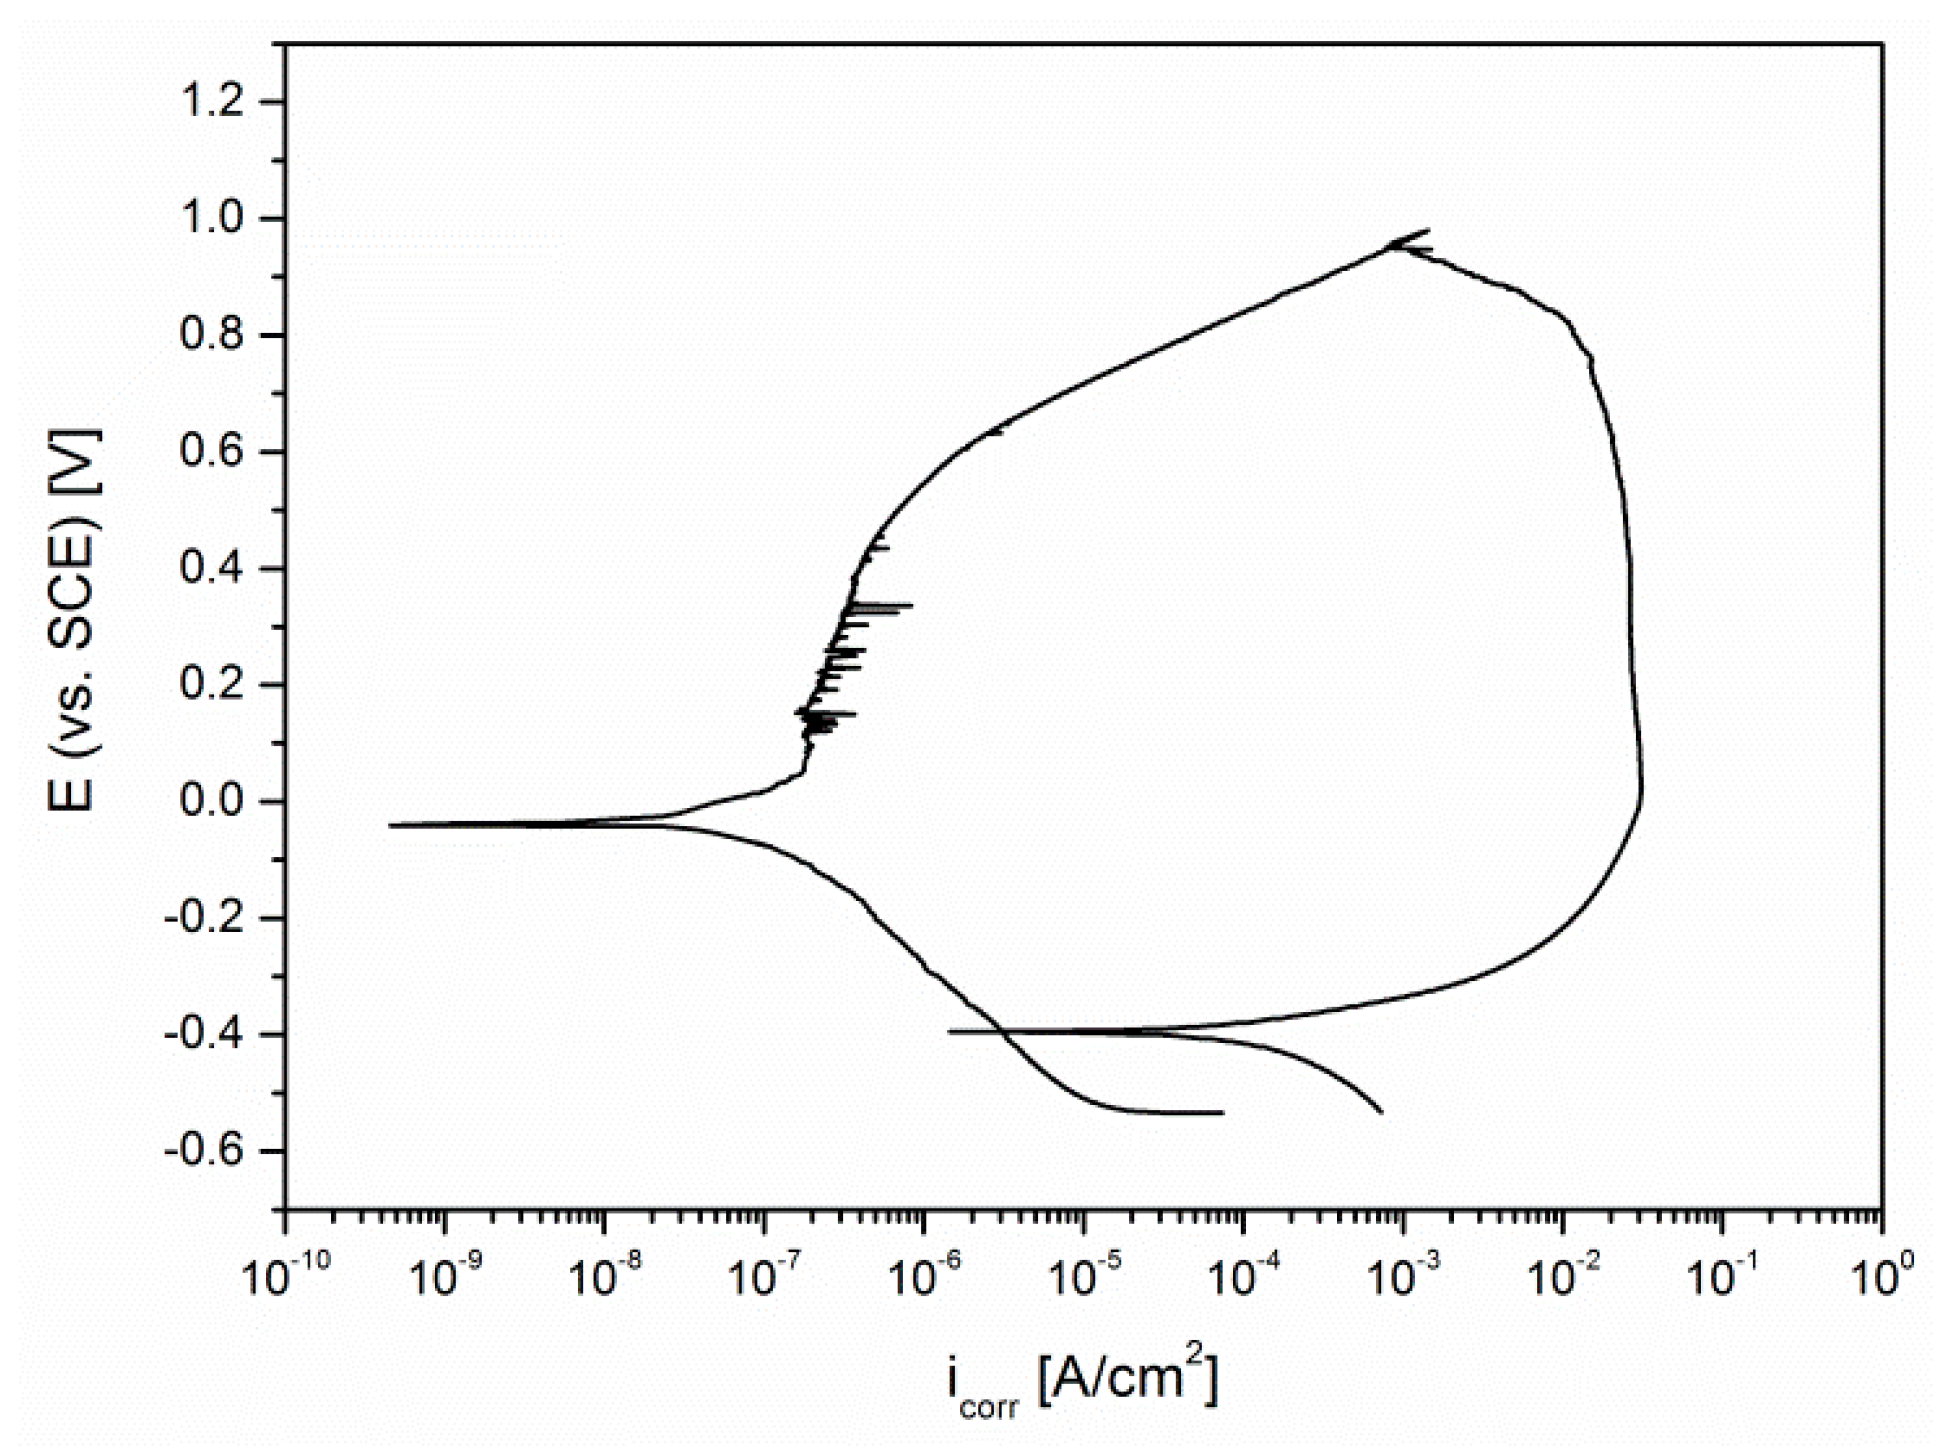
In order to determine the resistance of the applied coatings to pitting corrosion, potentiodynamic cyclic tests were carried out, in which the sample was subjected to 12 h of stabilization in a corrosive environment. An example of a curve is shown in Figure 16. In all cases, similar curve runs and hysteresis loops were observed, which indicates a lack of pitting corrosion resistance.
3.7. Thermal Stability
The thermal stability of AlCrN coatings formed at different nitrogen pressure in the vacuum chamber was investigated by controlled annealing according to the thermogram shown in Figure 1. In Figure 17 is presented comparison of relative variations of the α coefficient at 200 °C for each coating, calculated according to Equations (1) and (2) after subsequent annealing at temperature Ta = 320, 430, and 520 °C.
As described above in applied method positive values of ΔαDL changes mean that the given annealing caused an increase in thermomechanical loads of the substrate through the coating, which is a consequence of the increase in the compressive stress in the coating. It relates for coating deposited at nitrogen pressure of 1 Pa annealed and 320 °C. With regard to the suitability of the analyzed coating–substrate system. This indicates the improvement of thermomechanical coupling conditions between these elements of the system. In the conditions of operation at elevated temperature. It may result in increased durability of these coatings. Negative values of ΔαDL changes mean loss of compressive stress value, which leads to deterioration of thermomechanical interaction conditions between the substrate and the coating. Which in turn affects the deterioration of the service life of the tested system. Such phenomena were recorded when coatings were deposited at nitrogen pressure P = 2, 3, and 4 Pa. The coating–substrate system deposited at PN2 = 4 Pa shows the most favorable stability. The obtained results of thermal stability tests of the coatings are qualitatively consistent with the test results of the temperature evolution of the stress in the AlCrN [36] and TiN coatings [37,38] deposited on a silicon substrate. In general, it can be assumed that the rule is used to interpret the results: the more negative value of the ΔαDL changes, the less favorable operational lifetime forecast of the given system is.
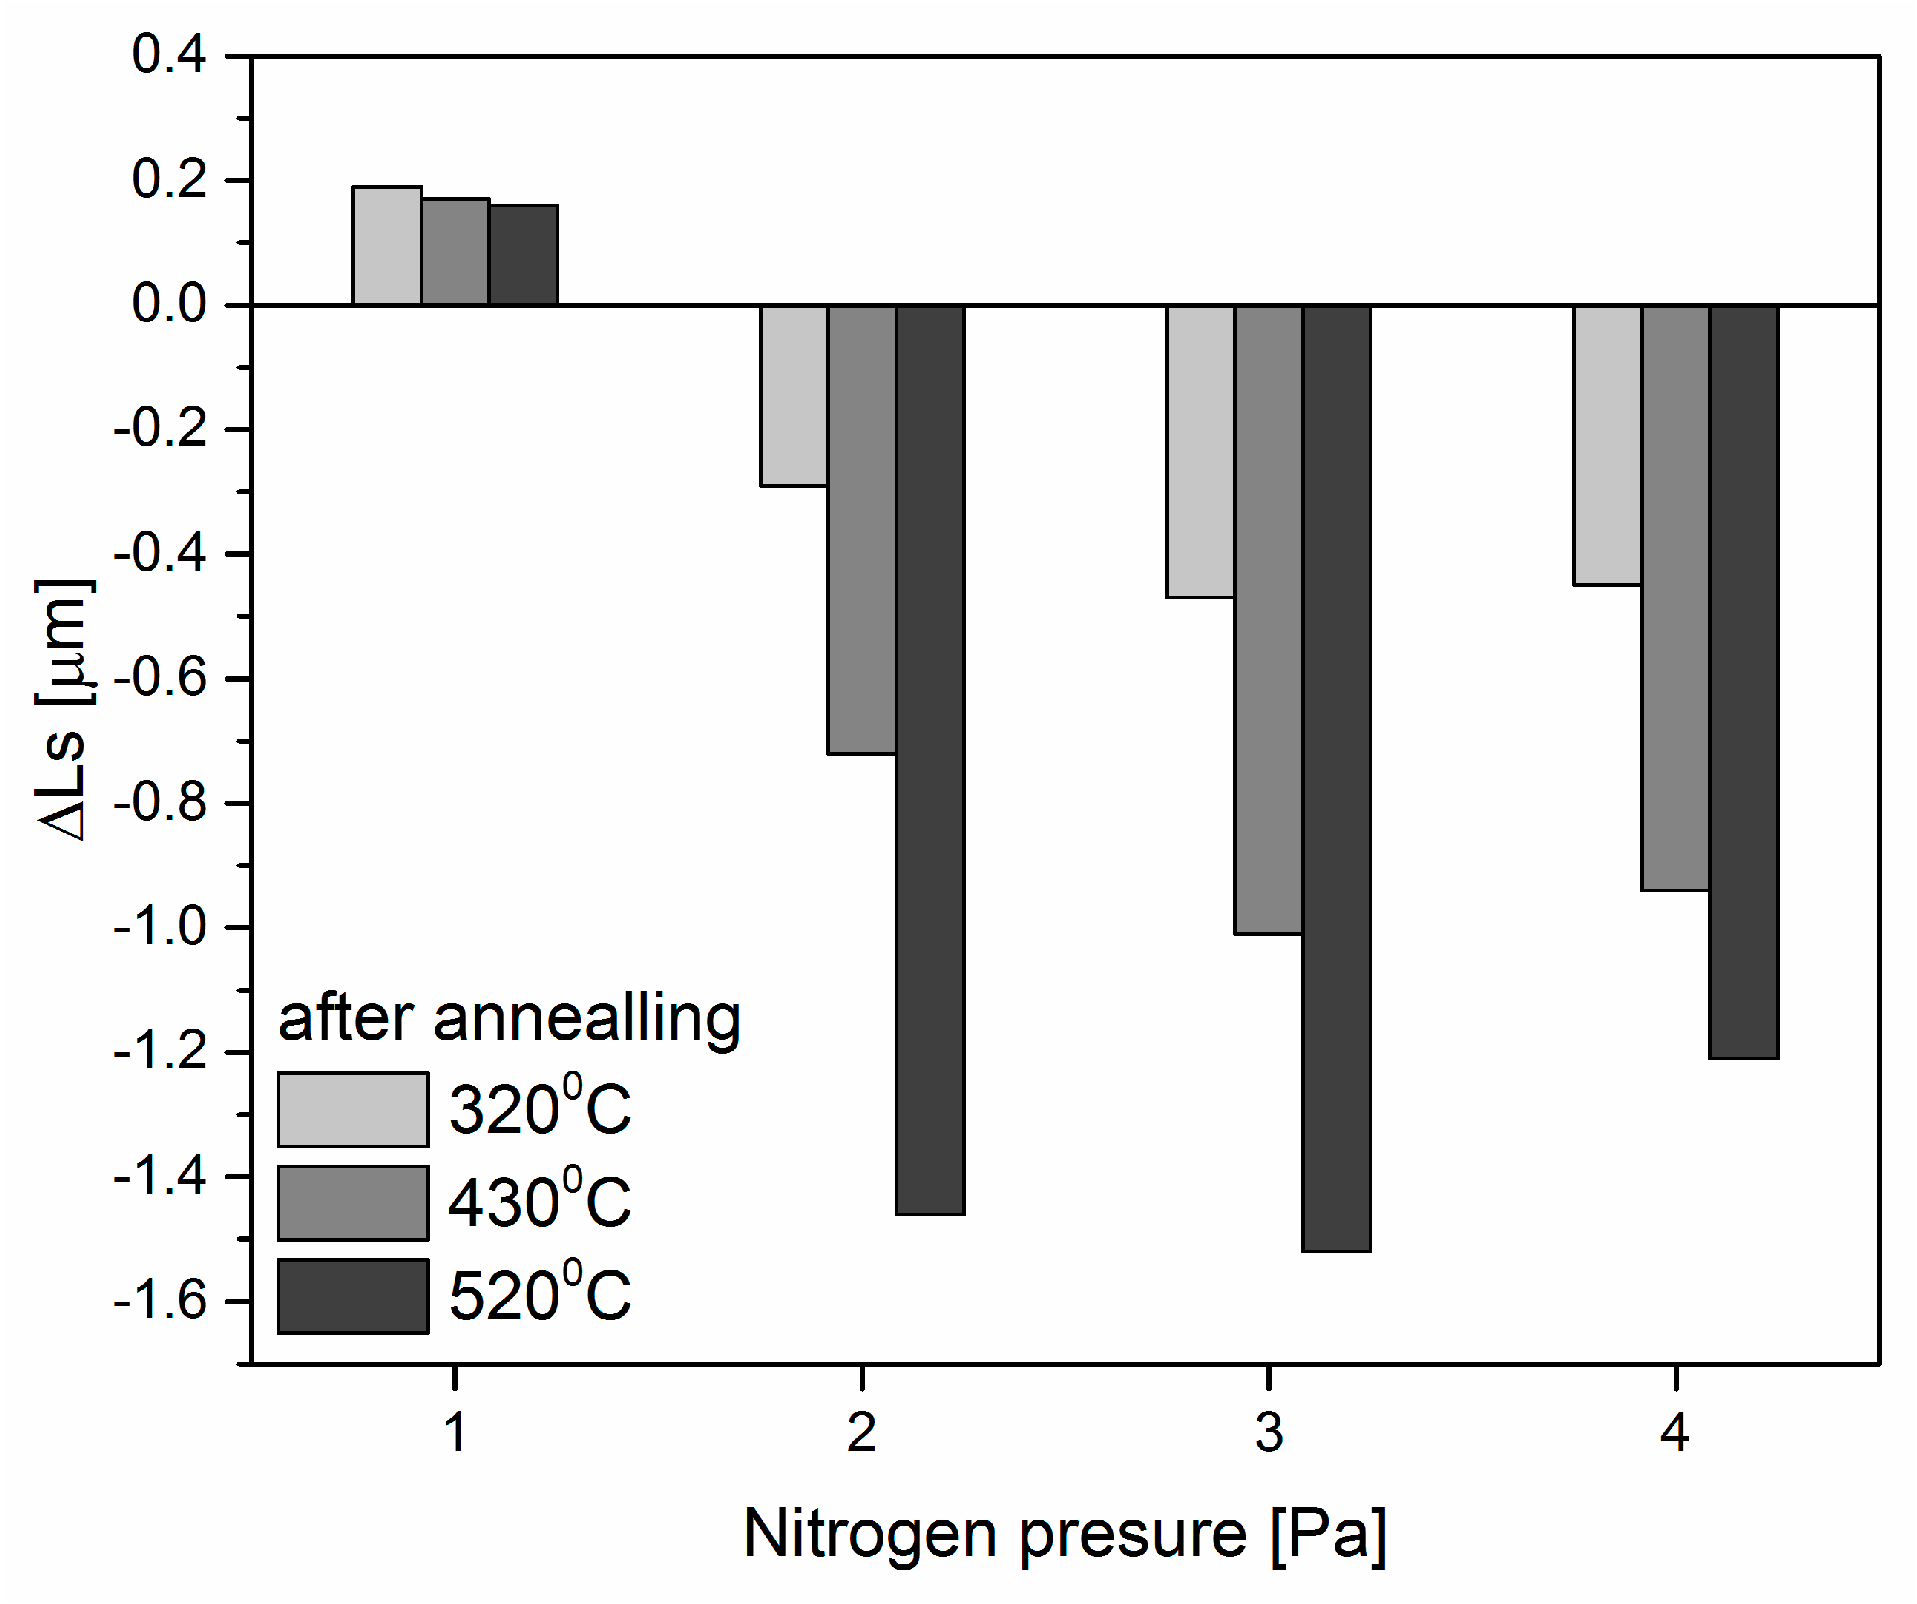
In Figure 18 the results of the thermal stability tests of AlCrN coatings by registering the ΔLs values are shown. The results of measurements of ΔLs substrate length change after their subsequent annealing were applied. ΔLs measurements are performed at 20 °C after each annealing. The coatings show compressive stresses. In this case, the analysis of the system service life based on ΔLs changes after the next annealing is carried out according to the rule: if after the given annealing a positive change of ΔLs occurred, the consequence of this annealing is the increase of compressive stresses and creation of conditions for increasing the service life of the tested system. The negative changes of ΔLs index after the annealing are the loss of compressive stresses in the coating, if the adhesion of the coating to the substrate has not changed. The qualitative compliance of the thermal stability of the tested systems, determined by the ΔαDL coefficients measured at 200 °C, was registered.
4. Discussion
4.1. Effect of Deposition Temperature
The lower deposition rate for coatings deposited at higher temperature (Figure 2) may be explained by:
- So-called “target poisoning” [39]. When the nitride of the cathode material formed on the cathode has a higher melting point than the cathode, it can reduce the number of particles emitted from the arc spots;
- Other kinetics of the coating formation process. At higher substrate temperatures, the incident particles become more mobile, which can lead to easier resputtering.
The coatings formed at the temperature of 450 °C show a different phase composition, especially at lower nitrogen pressure, than the coatings formed at the temperature of 350 °C. Thus, the h-AlN phase is formed. As mentioned above, the crystallite size of the coatings deposited at the higher temperature (450 °C) is about 10–25% greater than that of the coatings deposited at 350 °C. This results in less hardness of these coatings. This effect is consistent with the Hall–Petch relation [40]:
where: H—coating hardness, H0, kHP—constants, Λ—grain size.
In this relation for greater crystallite size the hardness is smaller. The relatively low hardness of the coatings deposited at the nitrogen pressure of 1 Pa may be associated with the presence of α-Cr phase, Figure 9. In a mixture of α-Cr and Cr2N hexagonal phases Cr phase is significantly softer. The increase in nitrogen pressure promotes the formation of CrN cubic phase [41]. Smaller hardness of the coatings deposited at higher temperature at lower nitrogen pressure is probably connected with phase composition. The coatings with h-AlN phase present significantly lower hardness [9].
AlCrN coatings characterized by a relatively low hardness of 10–20 GPa and increasing with negative substrate bias voltage increase were described by Wang et al. [18]. They indicate that low hardness may be caused by grains of relatively large size and the large number of defects resulting in a loose structure of the coating. Similar in hardness with nitrogen was observed by Tang et al. [11].
4.2. Effect of Nitrogen Pressure
The results of deposition rate, Figure 2 are consistent with the data presented elsewhere [5,14,19]. Cai et al. [32] indicate other relationship—increasing the deposition rate in nitrogen pressure from 0.7 to 1.2 Pa and decreasing from 1.2 to 1.7 Pa. Smaller thickness of the coatings deposited at a higher nitrogen pressure may result from the greater dissipation of ions due to collisions with gas particles [42].
With an increase in the nitrogen pressure during deposition process Al rate decreases, Figure 5. This may be related to the lower atomic mass of aluminum, which may result in greater dispersion of aluminum ions in comparison with chromium in collisions with nitrogen ions and leads to its lower condensation on the substrate. This effect was presented previously [10].
The findings of Xu et al. [43] indicate that H3/E2 ratio for Al0.68Cr0.32 N is about 0.09. The investigations of Cr–Al–N coatings deposited using multi-arc ion plating conducted by Wang et al. [14] indicate that H/E and H3/E2 ratios range from about 0.08 to 0.09 and from 0.20 to 0.23 GPa, respectively dependent on substrate bias voltage. Similar investigations on magnetron sputtered coatings show lower H/E and H3/E2 ratios [18]. They range from 0.05 to 0.07 and from 0.02 to 0.12 GPa, respectively.
The wear rate of the coatings decreases from 6.3 × 10⁻⁷ mm3/Nm (pN2 = 1 Pa) to 9.4 × 10⁻⁸ mm3/Nm (pN2 = 5 Pa). It can be connected with increasing hardness of the coatings. The course of changes in the wear rate with nitrogen pressure is similar to coatings formed from the AlCr cathode (80:20) [9]. Pulugurtha et al. [8] investigating CrAlN coatings deposited by AC reactive magnetron sputtering found similar phenomena. The increase in nitrogen flow rate in the vacuum chamber during their formation causes a decrease in the wear volume of the tested coating.
4.3. Effect of Substrate Bias Voltage
The smaller thickness of the coatings deposited at higher substrate bias voltage may result from the resputtering of the coating at which weakly bound particles are removed from the surface by high energy particles. As a result a change in the morphology and/or chemical composition of the coatings can be observed.
The energy of ions bombarding the substrate largely determines the nucleation and the growth of the coating as well as its quality. The changes the microstructure and properties of the coating, dependent on the parameters of the coating deposition, i.e., substrate bias voltage, the substrate temperature and the nitrogen pressure can be expected. The increase in ion energy (higher substrate bias voltage) contributes to the fine grain structure [14] with high hardness coatings (in some cases double the harder than the columnar structure). Additional features are as follows: a non-porous coating of high ductility and high adhesion to the substrate [44]. A small value of the substrate bias voltage favors the columnar structure formation of higher surface roughness [39]. It can be seen that for small substrate bias voltage the roughness parameter Ra of AlCrN coatings formed at PN2 = 5 Pa and substrate temperature of 350 °C (Figure 4) is the largest, (0.17 ± 0.03) µm and decreases to (0.06 ± 0.02) µm with increasing negative substrate bias voltage to about −300 V. A similar effect of reduction of the surface coating roughness with the substrate bias voltage increase was presented previously for AlCrN coating [5,13] and CrN [44,45,46].
It is probably connected with more dense and fine grained structure of the coatings deposited at higher negative voltage. This effect was earlier confirmed by Sabitzer et al. [7]. Due to reduction in the grain size the contribution of grain boundary fraction in the coating increases. In this case additional barriers for the lattice dislocation motion appear and it improves the strength of the coating [18]. The opposite effect is shown by Wang et al. [14] with an increase in the negative substrate bias voltage the hardness of the coating decreases. Such differing literature data may be related to different compositions of AlCrN coatings and probably the formation of other chromium (aluminum) nitride phases in the coatings.
5. Conclusions
The CrAlN coatings were deposited form cathode Al50Cr50 on HS6-5-2 steel substrates using cathodic arc evaporation. The effect of technological parameters: substrate temperature, nitrogen pressure, substrate bias voltage on chemical and phase composition and mechanical properties of the coatings were investigated. The above results allow to conclude as follows:
- The highest deposition rate was observed for coatings deposited at nitrogen pressure of three pascals independent of substrate temperature. The deposition rate was higher for coatings deposited at lower substrate temperature. The deposition rate decreased with negative substrate bias voltage increase. This was connected with coating resputtering phenomenon due to higher energy of bombarding ions;
- The roughness parameter Ra of the decreased with nitrogen pressure during deposition. The roughness Ra was similar for coatings deposited at substrate temperature 350 and 450 °C. This was probably connected with the number of surface defects;
- The hardness of the coatings deposited in both temperatures 350 and 450 °C increased with nitrogen pressure. Coatings deposited at higher temperature were characterized by lower hardness;
- The coatings were characterized by very good adhesion to the substrate. The critical force Lc2 was about 90 N;
- The wear resistance of investigated coatings was dependent on nitrogen pressure during deposition. The coatings deposited at the highest nitrogen pressure showed the best wear resistance. Poor antiwear properties were observed for coatings formed at low nitrogen pressure;
- AlCrN coatings significantly improved the corrosion resistance of HS6-5-2 steel. The change of nitrogen pressure in deposition process did not significantly affect the course of the corrosion process; the differences in the obtained parameters were small. The best anti-corrosion properties were registered for the coating deposited at nitrogen pressure of three pascals. None of the coatings showed resistance to pitting corrosion. In all cases, hysteresis loops were observed in cyclic measurements;
- The results of thermomechanical tests of thermal stability of AlCrN coatings deposited with different nitrogen pressures in the technological chamber show that coatings deposited at nitrogen pressure of one pascal revealed the most favorable service life—provided that their operating temperature does not exceed 320 °C. In the group of coatings deposited at higher pressures and substrate polarization UB = −100 V, the coatings deposited at a pressure of four pascals were particularly distinguished. They presented the most favorable thermal stability; the above coating properties were confirmed by the qualitative compliance of the two parameters αDL and ΔLs.
Author Contributions
Conceptualization, B.W. and A.G.; methodology, B.W.; software, D.M.; validation, B.W. and A.G.; formal analysis, B.W., A.G., P.M., E.D., and D.M.; resources, A.G.; data curation, B.W. and A.G.; writing—original draft preparation, B.W.; writing—review and editing, E.D. and A.G.; visualization, B.W. and E.D.; supervision, A.G. and P.M.; project administration, P.M.; funding acquisition, P.M. All authors have read and agreed to the published version of the manuscript.
Funding
This research was funded by the National Center for Research and Development, Poland, Grant Number Biostrateg3/344303/14/NCBR/2018. The APC was funded by Biostrateg3/344303/14/NCBR/2018
Conflicts of Interest
The authors declare no conflict of interest.
References
- Mayrhofer, P.H.; HWillmann, H.; Mitterer, C. Oxidation kinetics of sputtered Cr–N hard coatings. Surf. Coat. Technol. 2001, 146, 222–228. [Google Scholar] [CrossRef]
- Chim, Y.C.; Ding, Z.Z.; Zeng, X.T.; Zhang, S. Oxidation resistance of TiN. CrN. TiAlN and CrAlN coatings deposited by lateral rotating cathode arc. Thin Solid Films 2002, 517, 4845–4849. [Google Scholar] [CrossRef]
- Mitterer, C.; Mayrhofer, P.H.; Musil, J. Thermal stability of PVD hard coatings. Vacuum 2003, 71, 279–284. [Google Scholar] [CrossRef]
- Reiter, A.E.; Derflinger, V.H.; Hanselmann, B.; Bachmann, T.; Sartory, B. Investigation of the properties of Al1-xCrxN coatings prepared by cathodic arc evaporation. Surf. Coat. Technol. 2005, 200, 2114–2122. [Google Scholar] [CrossRef]
- Romero, J.; Gómez, M.A.; Esteve, J.; Montalà, F.; Carreras, L.; Grifol, M.; Lousa, A. CrAlN coatings deposited by cathodic arc evaporation at different substrate bias. Thin Solid Films 2006, 515, 113–117. [Google Scholar] [CrossRef]
- Benlatreche, Y.; Nouveau, C.; Aknouch, H.; Imhoff, L.; Martin, N.; Gavoille, J.; Rousselot, C.; Rauch, J.Y.; Pilloud, D. Physical and mechanical properties of CrAlN and CrSiN ternary systems for wood machining applications. Plasma Phys. Polym. 2009, 6, S113–S119. [Google Scholar] [CrossRef] [Green Version]
- Sabitzer, C.; Paulitsch, J.; Kolozsvári, S.; Rachbauer, R.; Mayrhofer, P.H. Influence of bias potential and layer arrangement on structure and mechanical properties of arc evaporated Al–Cr–N coatings. Vacuum 2014, 106, 49–52. [Google Scholar] [CrossRef]
- Pulugurtha, S.R.; Bhat, D.G.; Gordon, M.H.; Shultz, J.; MJoshi, S.V.S.; Govindarajan, S. Mechanical and tribological properties of compositionally graded CrAlN films deposited by AC reactive magnetron sputtering. Surf. Coat. Technol. 2007, 202, 1160–1166. [Google Scholar] [CrossRef]
- Gilewicz, A.; Jedrzejewski, R.; Myslinski, P.; Warcholinski, B. Structure, morphology and mechanical properties of AlCrN coatings deposited by cathodic arc evaporation. J. Mater. Eng. Perform. 2019, 28, 1522–1531. [Google Scholar] [CrossRef] [Green Version]
- Birol, Y.; İsler, D. Response to thermal cycling of CAPVD (Al,Cr)N-coated hot work tool steel. Surf. Coat. Technol. 2010, 205, 275–280. [Google Scholar] [CrossRef]
- Tang, J.F.; Lin, C.Y.; Yang, F.C.; Chang, C.L. Influence of nitrogen content and bias voltage on residual stress and the tribological and mechanical properties of CrAlN films. Coatings 2020, 10, 546. [Google Scholar] [CrossRef]
- Aihua, L.; Jianxin, D.; Haibing, C.; Yangyang, C.; Jun, Z. Friction and wear properties of TiN, TiAlN, AlTiN and CrAlN PVD nitride coatings. Int. J. Refract. Met. Hard Mater. 2012, 31, 82–88. [Google Scholar] [CrossRef]
- Reiter, A.E.; Mitterer, C.; de Figueiredo, M.R.; Franz, R. Abrasive and adhesive wear behavior of arc-evaporated Al1-xCrxN hard coatings. Tribol. Lett. 2010, 37, 605–611. [Google Scholar] [CrossRef]
- Wang, L.; Zhang, S.; Chen, Z.; Li, J.; Li, M. Influence of deposition parameters on hard Cr–Al–N coatings deposited by multi-arc ion plating. Appl. Surf. Sci. 2012, 258, 3629–3636. [Google Scholar] [CrossRef]
- Lin, J.; Mishra, B.; Moore, J.J.; Sproul, W.D. Microstructure, mechanical and tribological properties of Cr1–xAlxN films deposited by pulsed-closed field unbalanced magnetron sputtering (P-CFUBMS). Surf. Coat. Technol. 2006, 201, 4329–4334. [Google Scholar] [CrossRef]
- Forsén, R.; Johansson, M.P.; Odén, M.; Ghafoor, N. Effects of Ti alloying of AlCrN coatings on thermal stability and oxidation resistance. Thin Solid Films 2013, 534, 394–402. [Google Scholar] [CrossRef] [Green Version]
- Endrino, J.L.; Fox-Rabinovich, G.S.; Gey, C. Hard AlTiN, AlCrN PVD coatings for machining of austenitic stainless steel. Surf. Coat. Technol. 2006, 200, 6840–6845. [Google Scholar] [CrossRef]
- Wang, Y.X.; Zhang, S.; Lee, J.W.; Lew, W.S.; Li, B. Influence of bias voltage on the hardness and toughness of CrAlN coatings via magnetron sputtering. Surf. Coat. Technol. 2012, 206, 5103–5107. [Google Scholar] [CrossRef]
- Vetter, J.; Lugscheider, E.; Guerreiro, S.S. (Cr:Al) N coatings deposited by the cathodic vacuum are evaporation. Surf. Coat. Technol. 1998, 98, 1233–1239. [Google Scholar] [CrossRef]
- Fuentes, G.G.; Rodriguez, R.; Avelar-Batista, J.C.; Housden, J.; Montal’a, F.; Carreras, L.J.; Cristobal, A.A.; Damborenea, J.J.; Tate, T.J. Recent advances in the chromium nitride PVD process for forming and machining surface protection. J. Mater. Proc. Technol. 2005, 167, 415–421. [Google Scholar] [CrossRef]
- Cullity, B.D. Elements of X-ray Diffraction, 2nd ed.; Addison-Wesley Publishing Company Inc: London, UK, 1978. [Google Scholar]
- Vidakis, S.; Antoniadis, A.; Bilalis, N. The VDI 3198 indentation test evaluation of a reliable qualitative control for layered compounds. J. Mater. Process. Technol. 2003, 143, 481–485. [Google Scholar] [CrossRef]
- Archard, F. Contact and rubbing of flat surface. J. Appl. Phys. 1953, 24, 981–988. [Google Scholar] [CrossRef]
- McCafferty, E. Validation of corrosion rates measured by the Tafel extrapolation method. Corros. Sci. 2005, 47, 3202–3215. [Google Scholar] [CrossRef]
- Wiedemann, H.; Riesen, R.; Boller, A. Elasticity characterization of materials during thermal treatment by thermal mechanical analysis. In Materials Characterization by Thermomechanical Analysis; Riga, A., Neag, M., Eds.; ASTM International: West Conshohocken, PA, USA, 1991; pp. 84–99. [Google Scholar]
- Myśliński, P. Investigation of the thermal stability of hard coatings by Modulated Temperature Dilatometry. Vacuum 2009, 83, 757–760. [Google Scholar] [CrossRef]
- Karlsson, L.; Hörling, A.; Johansson, M.P.; Hultman, L.; Ramanath, G. The influence of thermal annealing on residual stresses and mechanical propiertes of arc-evaporated TiCxN1-x (x = 0, 0.15 and 0.45) thin films. Acta Mater. 2002, 50, 5103–5114. [Google Scholar] [CrossRef]
- Hultman, L.; Engström, C.; Birch, J.; Johannsson, M.P.; Oden, M. Review of the thermal and mechanical stability of TiN-based thin films. Z. Metallkd. 1999, 90, 803–813. [Google Scholar]
- Price, D.M. Modulated-temperature thermomechanical analysis. Thermochim. Acta 2000, 357, 23–29. [Google Scholar] [CrossRef]
- Hultman, L. Thermal stability of nitride thin films. Vacuum 2000, 57, 1–30. [Google Scholar] [CrossRef]
- Kraftmakher, Y. Modulation calorimetry and related techniques. Phys. Rep. 2002, 356, 1–117. [Google Scholar] [CrossRef]
- Cai, F.; Zhang, S.; Li, J.; Chen, Z.; Li, M.; Wang, L. Effect of nitrogen partial pressure on Al–Ti–N films deposited by arc ion plating. Appl. Surf. Sci. 2011, 258, 1819–1825. [Google Scholar] [CrossRef]
- Leyland, A.; Matthews, A. On the significance of the H/E ratio in wear control: A nanocomposite coating approach to optimized tribological behaviour. Wear 2000, 246, 1–11. [Google Scholar] [CrossRef]
- Musil, J.; Kunc, F.; Zeman, H.; Polakova, H. Relationships between hardness, Young’s modulus and elastic recovery in hard nanocomposite coatings. Surf. Coat. Technol. 2002, 54, 304–313. [Google Scholar] [CrossRef]
- Zhang, S.; Sun, D.; Fu, Y.; Du, H. Effect of sputtering target power on microstructure and mechanical properties of nanocomposite nc-TiN/a-SiN thin films. Thin Solid Films 2004, 447, 462–467. [Google Scholar] [CrossRef]
- Tritremmel, C. Comparison of magnetron sputtering and arc evaporation by Al–Cr–N hard coating. Diploma Thesis, Montanuniversität Leoben, Leoben, Austria, 2007. [Google Scholar]
- Bielawski, M.; Seo, D. Residual stress development in UMS TiN coatings. Surf. Coat. Technol. 2005, 200, 1476–1482. [Google Scholar] [CrossRef]
- Bielawski, M. Residual stress control in TiN/Si coatings deposited by unbalance magnetron sputtering. Surf. Coat. Technol. 2006, 200, 3987–3995. [Google Scholar] [CrossRef]
- Wan, X.S.; Zhao, S.S.; Yang, Y.; Gong, J.; Sun, C. Effects of nitrogen pressure and pulse bias voltage on the properties of Cr-N coatings deposited by arc ion plating. Surf. Coat. Technol. 2010, 204, 1800–1810. [Google Scholar] [CrossRef]
- Taha, A.S.; Hammad, F.H. Application of the Hall-Petch relation to microhardness measurements on Al, Cu, Al–MD 105, and Al–Cu Alloys. Phys. Status Solidi 1990, 119, 455–462. [Google Scholar] [CrossRef]
- Rebholz, C.; Ziegele, H.; Leyland, A.; Matthew, A. Structure, mechanical and tribological properties of nitrogen-containing chromium coatings prepared by reactive magnetron sputtering. Surf. Coat. Technol. 1999, 115, 222–229. [Google Scholar] [CrossRef]
- Choi, S.A.; Kim, S.W.; Lee, S.M.; Kim, H.T.; Oh, Y.S. Effect of working pressure and substrate bias on phase formation and microstructure of Cr–Al–N coatings. J. Korean Ceram. Soc. 2017, 54, 511–517. [Google Scholar] [CrossRef] [Green Version]
- Xu, Y.X.; Riedl, H.; Holec, D.; Chen, L.; Du, Y.; Mayrhofer, P. Thermal stability and oxidation resistance of sputtered Ti–Al–Cr–N hard coatings. Surf. Coat. Technol. 2017, 324, 48–56. [Google Scholar] [CrossRef]
- Oden, M.; Almer, J.; Hakansson, G. The effects of bias voltage and annealing on the microstructure and residual stress of arc-evaporated Cr–N coatings. Surf. Coat. Technol. 1999, 120, 272–276. [Google Scholar] [CrossRef]
- Wang, D.Y.; Weng, K.W. Deposition of CrN coatings by current-modulating cathodic arc evaporation. Surf. Coat. Technol. 2001, 137, 31–37. [Google Scholar] [CrossRef]
- Lin, J.; Sproul, W.D.; Moore, J.J.; Wu, Z.L.; Lee, S.L. Effect of negative substrate bias voltage on the structure and properties of CrN films deposited by modulated pulsed power (MPP) magnetron sputtering. J. Phys. D Appl. Phys. 2011, 44, 425305. [Google Scholar] [CrossRef]
Figure 1.
Thermogram to thermal stability diagnostics.

Figure 2.
Deposition rates of AlCrN coatings formed at 350 and 450 °C.

Figure 3.
XRD diffraction patterns for AlCrN coatings deposited at negative substrate bias voltage 100 V, various nitrogen pressure and temperatures. (a) 350 °C; (b) 450 °C.
Figure 3.
XRD diffraction patterns for AlCrN coatings deposited at negative substrate bias voltage 100 V, various nitrogen pressure and temperatures. (a) 350 °C; (b) 450 °C.

Figure 4.
XRD diffraction patterns for AlCrN coatings deposited at temperature of 350 °C, nitrogen pressure of 3 Pa and various negative substrate bias voltages.
Figure 4.
XRD diffraction patterns for AlCrN coatings deposited at temperature of 350 °C, nitrogen pressure of 3 Pa and various negative substrate bias voltages.

Figure 5.
Al rate in AlCrN coatings deposited at temperature of 350 °C, negative substrate bias voltage 100 V and various nitrogen pressure. Insert—chemical composition (at.%) of coatings investigated.
Figure 5.
Al rate in AlCrN coatings deposited at temperature of 350 °C, negative substrate bias voltage 100 V and various nitrogen pressure. Insert—chemical composition (at.%) of coatings investigated.

Figure 6.
SEM images of AlCrN coatings deposited at 350 °C and different nitrogen pressure. (a) 1 Pa; (b) 2 Pa; (c) 3 Pa; (d) 4 Pa; (e) 5 Pa.
Figure 6.
SEM images of AlCrN coatings deposited at 350 °C and different nitrogen pressure. (a) 1 Pa; (b) 2 Pa; (c) 3 Pa; (d) 4 Pa; (e) 5 Pa.

Figure 7.
Roughness parameter (Ra) of AlCrN coatings.

Figure 8.
Deposition rate and roughness parameter (Ra) of AlCrN coatings deposited at substrate temperature of 350 °C and nitrogen pressure 5 Pa at different substrate bias voltages.
Figure 8.
Deposition rate and roughness parameter (Ra) of AlCrN coatings deposited at substrate temperature of 350 °C and nitrogen pressure 5 Pa at different substrate bias voltages.

Figure 9.
Hardness of AlCrN coatings formed at various nitrogen pressure.

Figure 10.
Hardness of AlCrN coatings deposited at temperature of 450 °C and nitrogen pressure of 3 Pa dependent on negative substrate bias voltage.
Figure 10.
Hardness of AlCrN coatings deposited at temperature of 450 °C and nitrogen pressure of 3 Pa dependent on negative substrate bias voltage.

Figure 11.
Critical load (Lc2) of the coatings deposited using different nitrogen pressure and substrate bias voltage UB = −100 V.
Figure 11.
Critical load (Lc2) of the coatings deposited using different nitrogen pressure and substrate bias voltage UB = −100 V.

Figure 12.
Micrographs of Rockwell indents in Daimler–Benz adhesion test for coatings, characterized by the highest scratch crack propagation resistance, deposited at: (a) 350 °C and 2 Pa and (b) 450 °C and 3 Pa.
Figure 12.
Micrographs of Rockwell indents in Daimler–Benz adhesion test for coatings, characterized by the highest scratch crack propagation resistance, deposited at: (a) 350 °C and 2 Pa and (b) 450 °C and 3 Pa.

Figure 13.
Wear rate of the coatings deposited using substrate temperature of 350 °C, substrate bias voltage UB = −100 V and different nitrogen pressure.
Figure 13.
Wear rate of the coatings deposited using substrate temperature of 350 °C, substrate bias voltage UB = −100 V and different nitrogen pressure.

Figure 14.
Wear of the counterpart–Al2O3 ball after a dry sliding wear test against coatings deposited at substrate temperature of 350 °C, UB = −100 V and nitrogen pressure. (a) 1 Pa; (b) 3 Pa; (c) 5 Pa.
Figure 14.
Wear of the counterpart–Al2O3 ball after a dry sliding wear test against coatings deposited at substrate temperature of 350 °C, UB = −100 V and nitrogen pressure. (a) 1 Pa; (b) 3 Pa; (c) 5 Pa.

Figure 15.
List of polarization curves for investigated coatings.

Figure 16.
Measurement of pitting corrosion resistance for a coating formed at nitrogen pressure of 5 Pa on a steel HS6-5-2 substrate.
Figure 16.
Measurement of pitting corrosion resistance for a coating formed at nitrogen pressure of 5 Pa on a steel HS6-5-2 substrate.

Figure 17.
Result of thermal stability testing of AlCrN coatings formed at different nitrogen pressure in the technological chamber. Determined by means of relative changes in αDL coefficient at 200 °C.
Figure 17.
Result of thermal stability testing of AlCrN coatings formed at different nitrogen pressure in the technological chamber. Determined by means of relative changes in αDL coefficient at 200 °C.

Figure 18.
Changes in ΔLs index after annealing of tested AlCrN coating–substrate systems. ΔLs index was calculated from investigated system length measurements performed at 20 °C.
Figure 18.
Changes in ΔLs index after annealing of tested AlCrN coating–substrate systems. ΔLs index was calculated from investigated system length measurements performed at 20 °C.


Table 1.
Basic technological parameters for synthesizing AlCrN coatings.
| Parameter | Ion Etching | Adhesive Layer | AlCrN Coating |
|---|---|---|---|
| AlCr cathode current | – | – | 80 A |
| Cr cathode current | 80 A | 80 A | – |
| Argon pressure | 0.5 Pa | 0.5 Pa | – |
| Nitrogen pressure | – | – | 1–5 Pa |
| Voltage | −600 V | −100 V | −100 V |
| Deposition time | 10 min | 6 min | 120 min |
| Temperature | 350 °C | 350 °C | 350 °C |
Table 2.
Parameters applied in ball-on-disc test.
| Parameter | Value |
|---|---|
| Normal load | 20 N |
| Sliding speed | 0.2 m/s |
| Diameter of the track | 22 mm |
| Distance | 2000 m |
| Temperature | Room temperature |
| Humidity | About 40% |
| Counterpart type | Al2O3 ball |
| Counterpart diameter | 10 mm |
Table 3.
Summary of all calculated parameters of the potentiodynamic corrosion tests.
| Sample | Ecorr (V) | icorr (A/cm2) | Rp (kΩ·cm2) | ba (V) | bc (V) | |
|---|---|---|---|---|---|---|
| HS6-5-2 steel | −0.702 | 2.8 | 13 | 0.080 | 0.380 | |
| CrN | 0.002 | 0.053 | 256.01 | 0.036 | 0.229 | |
| AlCrN | PN2 = 3 Pa | −0.010 | 0.044 | 439 | 0.061 | 0.169 |
| PN2 = 4 Pa | −0.014 | 0.103 | 419.32 | 0.170 | 0.235 | |
| PN2 = 5 Pa | −0.007 | 0.065 | 339 | 0.070 | 0.188 | |
© 2020 by the authors. Licensee MDPI, Basel, Switzerland. This article is an open access article distributed under the terms and conditions of the Creative Commons Attribution (CC BY) license (http://creativecommons.org/licenses/by/4.0/).
Share and Cite
MDPI and ACS Style
Warcholinski, B.; Gilewicz, A.; Myslinski, P.; Dobruchowska, E.; Murzynski, D. Structure and Properties of AlCrN Coatings Deposited Using Cathodic Arc Evaporation. Coatings 2020, 10, 793. https://doi.org/10.3390/coatings10080793
AMA Style
Warcholinski B, Gilewicz A, Myslinski P, Dobruchowska E, Murzynski D. Structure and Properties of AlCrN Coatings Deposited Using Cathodic Arc Evaporation. Coatings. 2020; 10(8):793. https://doi.org/10.3390/coatings10080793
Chicago/Turabian StyleWarcholinski, Bogdan, Adam Gilewicz, Piotr Myslinski, Ewa Dobruchowska, and Dawid Murzynski. 2020. "Structure and Properties of AlCrN Coatings Deposited Using Cathodic Arc Evaporation" Coatings 10, no. 8: 793. https://doi.org/10.3390/coatings10080793
Note that from the first issue of 2016, this journal uses article numbers instead of page numbers. See further details here.