
Spatio-Temporal Analysis of Heatwaves Characteristics in Greece from 1950 to 2020
by
 , ,
, ,
Elissavet Galanaki
*, 
Chris Giannaros
,
Vassiliki Kotroni
 ,
,
Kostas Lagouvardos
and
Georgios Papavasileiou

National Observatory of Athens, Lofos Koufou, 15236 Penteli, Greece
*
Author to whom correspondence should be addressed.
Climate 2023, 11(1), 5; https://doi.org/10.3390/cli11010005
Submission received: 20 November 2022
/
Revised: 16 December 2022
/
Accepted: 23 December 2022
/
Published: 25 December 2022
Abstract
:Heatwave events are of major concern in the global context, since they can significantly impact ecosystems, economies and societies. For this reason, more detailed analyses of the characteristics and trends of heatwaves represent a priority that cannot be neglected. In this study, the interannual and decadal variability of seven indices of heatwaves were investigated during the warmest period of the year (June–August) by using an enhanced resolution reanalysis model (ERA5-Land) over a 71-year period (1950–2020) for the area of Greece. Heatwaves were defined as periods where two thresholds, based on a modified version of the Excess Heat Factor index (EHF) and the 95th percentile of the maximum daily temperature, were exceeded for at least three consecutive days. Greece experiences almost yearly 0.7 heatwaves on average during the whole period of study, while this value has increased by ~80% since 1990. Trend analysis revealed that heatwaves have become more frequent, longer, and more intense since 1950. The percentage of the land area that experiences at least one heatwave per year was almost doubled in the examined period. An increasing trend in the number of heatwaves that occurred in June was identified.
1. Introduction
Climate change and the associated increasing global surface temperatures have become a major concern studied by the scientific community worldwide over the last decades. Many studies have reported that the average global temperature has increased by about 1 °C since 1880 and, interestingly, this rate of warming is more than twice since 1981 [1]. Climate change future projections have shown that global warming is expected to induce a temperature rise between 1.5 °C to 4.5 °C until the end of the century [2]. A direct consequence of the rising global surface temperature is the increase in the frequency and severity of extreme weather events such as heatwaves [2,3]. Consequently, projections show that over the next century, heatwaves and warm spells (unseasonal warm periods characterized by lower temperatures compared to heatwaves) will become more frequent and intense, while their duration and geographic extent will increase (e.g., [4,5,6]). These changes could contribute to the burden of continuous thermal stress for a period of days leading to heat-related illnesses (i.e., heat stroke), premature deaths, and inability to sustain physical activities (e.g., [6,7]), particularly in vulnerable populations such as elderly people [8], and people living in areas with a higher population density [9,10,11]. Indeed, heatwaves are considered to be the deadliest weather disaster in many parts of the world (e.g., [12,13]). Besides, heatwaves have been related to serious impacts in economic losses for agriculture (e.g [9,14,15,16]) and risks to the environment (i.e., bushfire, biodiversity, streamflow; e.g., [9,17,18]).
Τhe Mediterranean region is considered to be one of the most sensitive areas worldwide with regards to climate change (e.g., [19]). Temperature increases at a faster pace in the Mediterranean [20], and future warming rates are expected to be 50% higher in summer compared to global warming [21]. It is estimated that for every 1 °C increase in the apparent temperature in Mediterranean cities, a 3% increase in mortality is expected [22]. Thus, the need to study heatwaves becomes more urgent.
In Greece, several studies have analyzed the heatwaves by focusing on a particular region of the country (e.g., [23,24,25]), or in a limited number of cities across the country (e.g., [26,27]). Indeed, most studies have focused only on the capital of Greece, Athens (e.g., [23,25]). In particular, Athens is characterized by the frequent occurrence of heatwaves (~1–2 heatwaves per year [23,28]) that have significantly increased since 1990 [23,29]. It has also been reported that heatwaves last longer, occur earlier, and are more intense in the last decades (e.g., [23,25,28,29,30]), attributed to the associated pronounced increase in the summer air temperature in the area (e.g., [27,29,30]). Moreover, the days associated with high discomfort levels have shown a prominent increase (e.g., [23,25,31,32]) and have led to a longer summer over the years [31], indicating an increase in heat-related risk.
Similar results were found from limited studies that have examined the climatology of heatwaves over several areas of Greece. Indeed, Kuglitsch et al. [27], using ~20 stations over Greece, found a slight increase in heatwave indices (mean heatwave intensity, heatwave length, and heatwave number) from 1969 to 2006. Tolika [26] found that the warm spells have become more frequent in 14 stations in the Greek region over the period from 1958 to 2018, and showed that the longer-lasting warm spells have a lower frequency. Finally, Founda et al. [33] reported that the period of occurrence of extreme heat events has elongated over the year, using 10 stations in Greece from 1960 to 2010.
Adopting the significance of changes in heatwaves with respect to the thermal stress in the Greek population, the aim of this study is to explore and quantify the contemporary variability and trend of the heatwave characteristics, and other indices related to the human body’s thermal sensation. The present study, compared to the existing literature,
(a) focuses on changes in several heatwave indices (i.e., heatwave intensity, duration, peak temperature), not only to the number of heatwaves, and
(b) provides a heatwave climatology over all regions in Greece that is not restricted to specific towns.
2. Materials and Methods
2.1. ERA5 and ERA5-Land Re-Analysis Datasets
The ERA5 is a state-of-the-art global atmospheric reanalysis dataset produced by the European Centre for Medium-Range Weather Forecast’s (ECMWF), covering the period from January 1950 to the present. It is based on the Integrated Forecasting System (IFS) and is the result of the assimilation of observations (meteorological and satellite) through a four-dimensional variational analysis (4D-Var). 4D-Var has a higher accuracy compared to the previously used three-dimensional variational scheme it can assimilate asynchronous observations, however it requires the development of an adjoint model (computationally expensive). More details about the 4D-Var can be found in [34] and [35]. The ERA5 provides an extensive number of atmospheric, land, and oceanic variables on an hourly step. The horizontal resolution of the dataset is ~30 km, while the vertical resolution compromises 137 levels from the surface up to a height of 80 km. This dataset, and more specifically the temperature at 850 hPa, was used for the computation of hot hours per year.
The ERA5-Land provides a detailed view of the evolution of land variables [36]. It has been produced by implementing a series of improvements regarding the land component with respect to the climate reanalysis model of ECMWF ERA5. The available data span from 1950 until the present in an hourly step, with an enhanced resolution of 0.1° × 0.1° (~10 km) compared to ERA5 climate reanalysis.
The atmospheric forcing built for ERA5-Land is derived from ERA5 near-surface parameters and flux fields. The variables air temperature, humidity, and pressure are corrected for the altitude differences between ERA5 and ERA5-Land grids. The land surface model version used in ERA5-Land is the Carbon Hydrology-Tiled ECMWF Scheme for Surface Exchanges over Land (CHTESSEL; [37]).
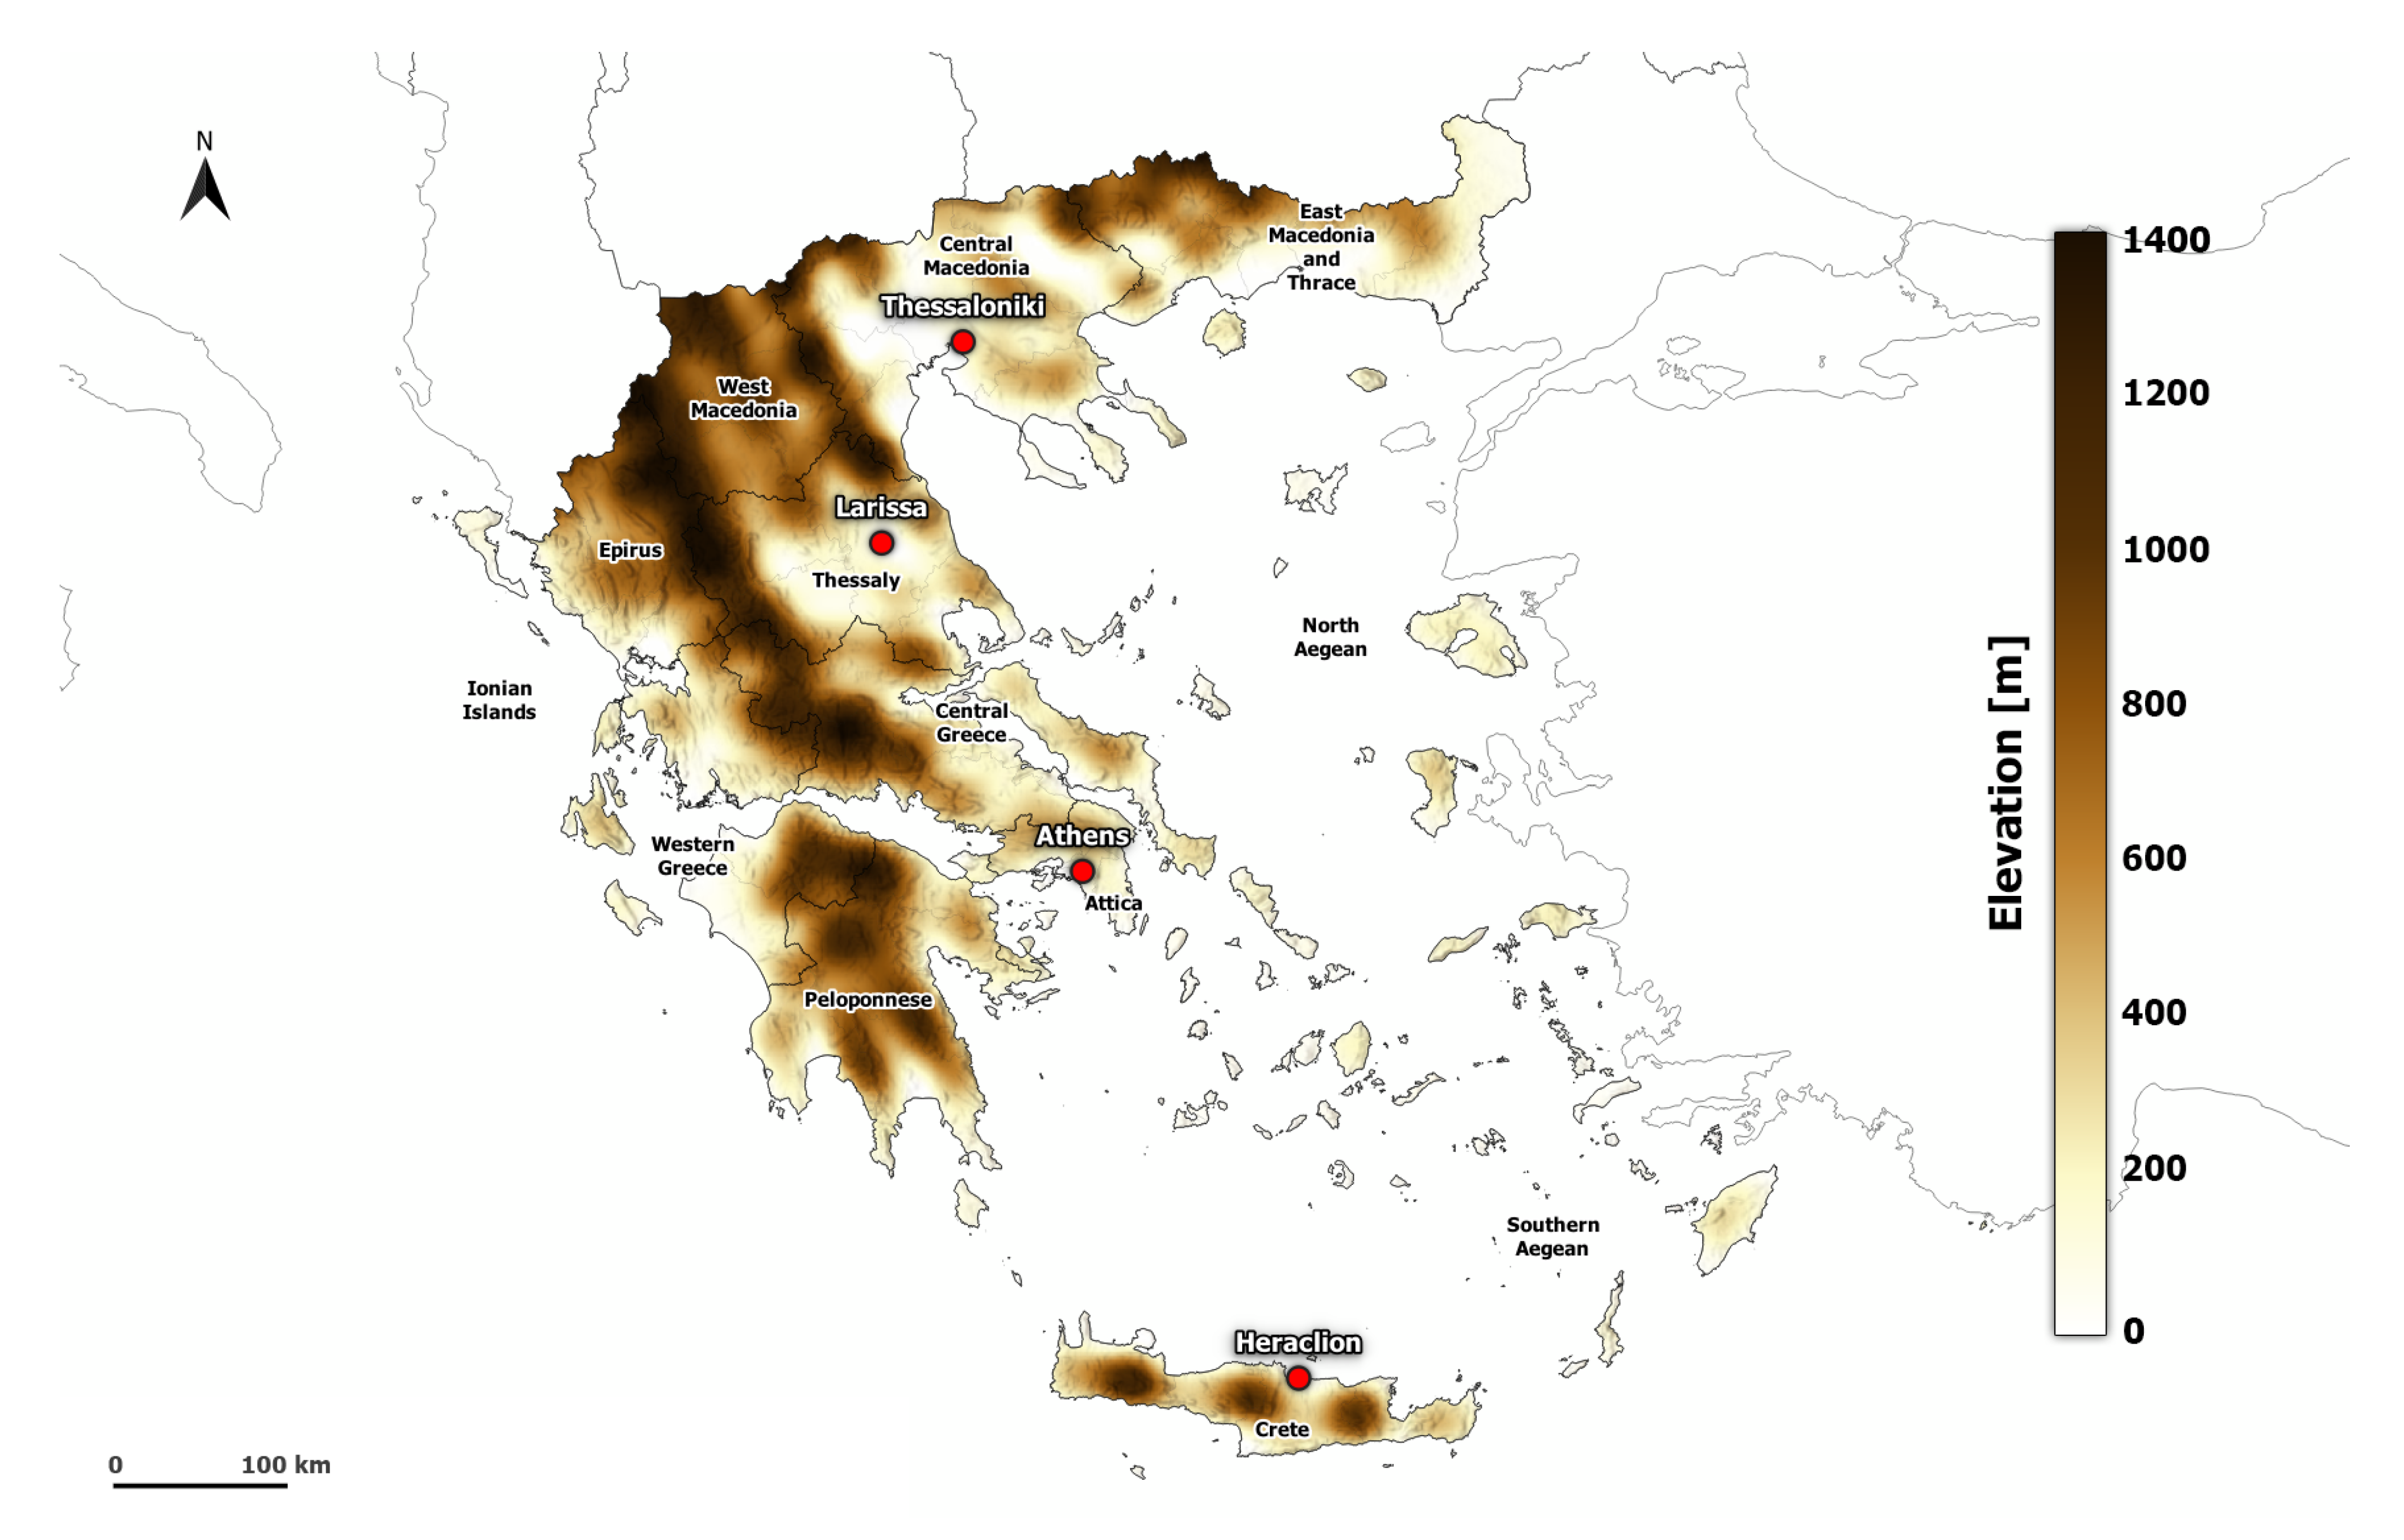
For the computation of averages and trends of heatwaves, time series of hourly 2 m dewpoint temperature, 2 m temperature, and 10 m wind speed for the region of Greece (18 E–29 E and 34 N–42 N; Figure 1) were extracted from the ERA5-Land dataset, which is available to download from https://cds.climate.copernicus.eu/ (accessed on 12 October 2021) [38]. The three variables were calculated from the vertical interpolation of the corresponding values between the Earth’s surface and the lowest model level (level 137, 10 m above the surface).
2.2. Methods
Despite the numerous efforts to provide a robust heatwave definition, the scientific community lacks consensus on a formal, standardized definition, as heatwaves are dependent on the local climatology (e.g., [13,39]). Generally, a heatwave is defined as a period of excessively high near-surface air temperature relative to those normally expected (e.g., [8,26]). Depending on the sector of interest and the data availability, a heatwave can be defined by climatological values of certain meteorological parameters (i.e., maximum, minimum, or mean daily temperature, humidity; e.g., [23,40]) or the use of human bioclimatic - biometeorological indices (e.g., [25,41]). The duration of a heatwave used in the literature varies from a minimum of two (e.g., [42]) to six days (e.g., [43]). Intensity thresholds can be defined either by absolute (i.e., maximum temperature above 37 °C; e.g., [24]) or relative approaches (i.e., daily temperature above the 80, 90, or 95th percentile of the local climate; e.g., [44,45]). The methods based on relative approaches have the advantage of possible comparison among regions with different climates [46]. Furthermore, a large number of studies have analyzed percentile thresholds computed from 5, 15, or 31-day windows centered on each calendar day, creating a relatively smooth cycle of percentile thresholds for each calendar day (e.g., [47,48]).
In this study, the identification and determination of heatwaves are based on two different threshold criteria:
(a) the 95th percentile of the maximum daily temperature, and
(b) a modified version of the Excess Heat Factor index (EHF; [49]).
If both of these thresholds were exceeded for at least three days to a specific grid point, this period was considered as a heatwave. More precisely, the 95th percentile of the maximum daily temperature was computed based on the selected reference period (here we used 1981–2010 period) for each region.
The EHF provides an estimate of the accumulated heat excess based on two separate indices:
(a) heat excess: modified Significance Excess Heat Index (EHIsig), a comparison of the three-day average daily mean temperature (computed as the average the maximum and the minimum temperature occurred in the 24-h period) with the 90th percentile mean temperature (T90) of the selected reference period in a specific location. This component determines if a particular day is unusually warm (positive values) compared to the local climate.
where Ti is the daily mean temperature.
EHIsig,i = (Ti + Ti+1 + Ti+2)/3 – T90
The 90th percentile value is defined from 31-day windows centered on each calendar day. Thus, for each day, a percentile value is computed from a distribution of 930 values (30 years × 31 days) on each calendar day.
(b) heat stress—Acclimatization Excess Heat Index (EHIaccl); a measure of the human acclimatization to their local environmental climate. This index compares the three-day average daily mean temperature with the average temperature over the preceding 30 days.
EHIaccl,i = (Ti + Ti+1 + Ti+2)/3 − (Ti–1 + ... + Ti–30)/30
Thus, the EHF is computed by the multiplication of these previous indices as shown in the following formula:
where the expression “max(1, EHIaccli)” implies that the EHIsigi is amplified only when EHIaccli is greater than 1. Consequently, a heatwave episode is present if the EHF is positive for at least three consecutive days.
EHFi = EHIsig,i ∙ max(1, EHIaccl,i)
For this study, we used the mean apparent temperature (AT), an index of human discomfort, instead of mean air temperature, computed by this formula [50]:
where Ta is the 2m temperature (°C), u10 is the wind speed at 10 m above the ground (ms−1) and e is the vapour pressure (hPa). The vapor pressure is estimated according to Alduchov and Eskridge [51]:
while the relative humidity (RH) is computed by the formula [52]:
AT = −2.7 + 1.047· Ta + 2.0· e − 0.65· u10
e = (RH/100)·6.105·e (17.27·T )/( 237.7 + T)
RH = 100 ((112 − 0.1T + Td) / (112 + 0.9T))8
In order to characterize the severity and the persistence of the heatwaves, we calculated a range of indices for heatwaves such as the frequency, the maximum temperature, the annual number and the duration. Additionally, we computed indices related to the human comfort such as the combined hot days and tropical nights, and the exceedance of AT threshold following the approach of previous studies (e.g., [43,53]). The analysis of the heatwave characteristics is represented in Table 1. For the needs of this study, average values of heatwave intensity (HWI), heatwave peak temperature (HWA), and heatwave duration (HWD) were calculated only for years where at least one heatwave occurred, whereas averages of heatwave day frequency (HWF), heatwave number (HWN), combined hot days and tropical nights (CHT), and exceedance of AT threshold (AT41C) were calculated across the whole time period.
It must be noted that for the computation of CHT, we used the 25 °C lower limit threshold instead of 20 °C, which is often used, as these nighttime temperatures are very common in the area during summer [43]. In addition, the threshold of 41 °C at the AT41C index was based on the scale of AT, presented by Overcenco and Pantea [54], where AT above 41 °C is related to intense and dangerous discomfort (e.g., heat exhaustion, heatstroke).
For the needs of the trend analysis, the Theil–Sen method [55] and the Mann–Kendall non-parametric test [56] were used for the estimation of the slope of the trend and the computation of the statistical significance at the 95% confidence level. The Mann–Kendall non-parametric test (confirmation of positive or negative trend) was selected, as it does not require a normally distributed dataset, nor it is affected by several factors such as missing data, outliers, or length of the time series.
3. Results
3.1. Climatology of heatwave indices
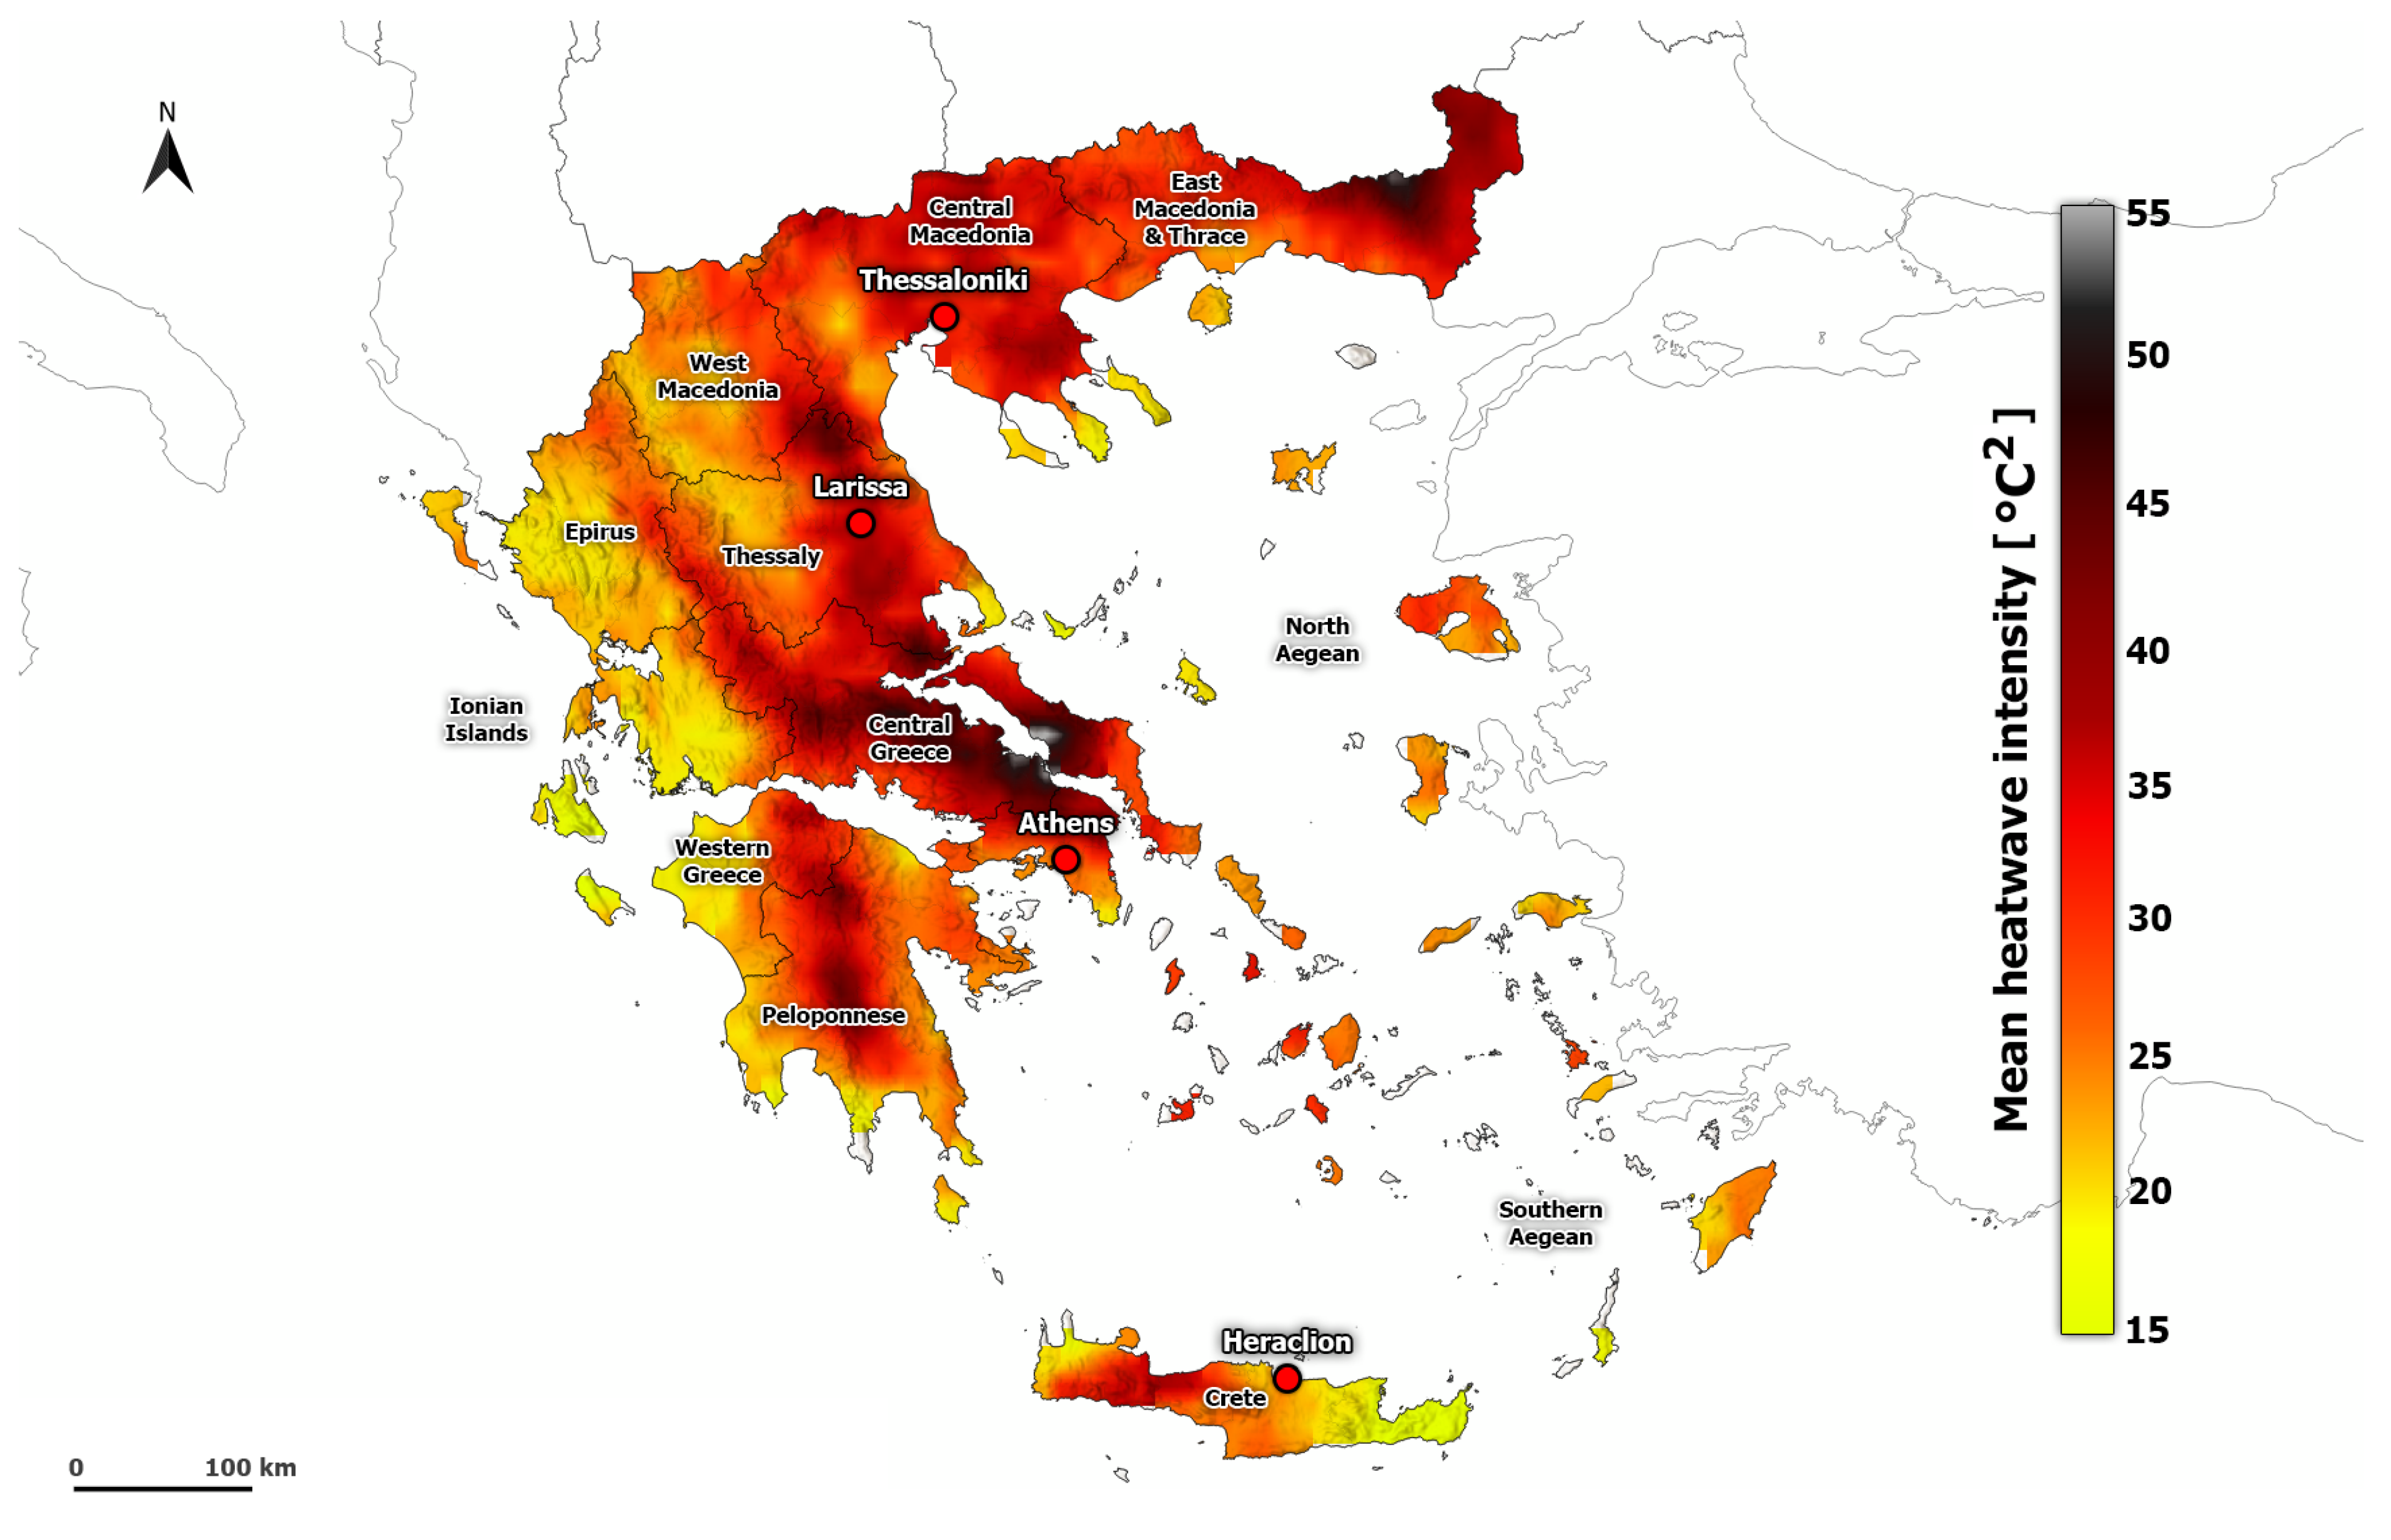
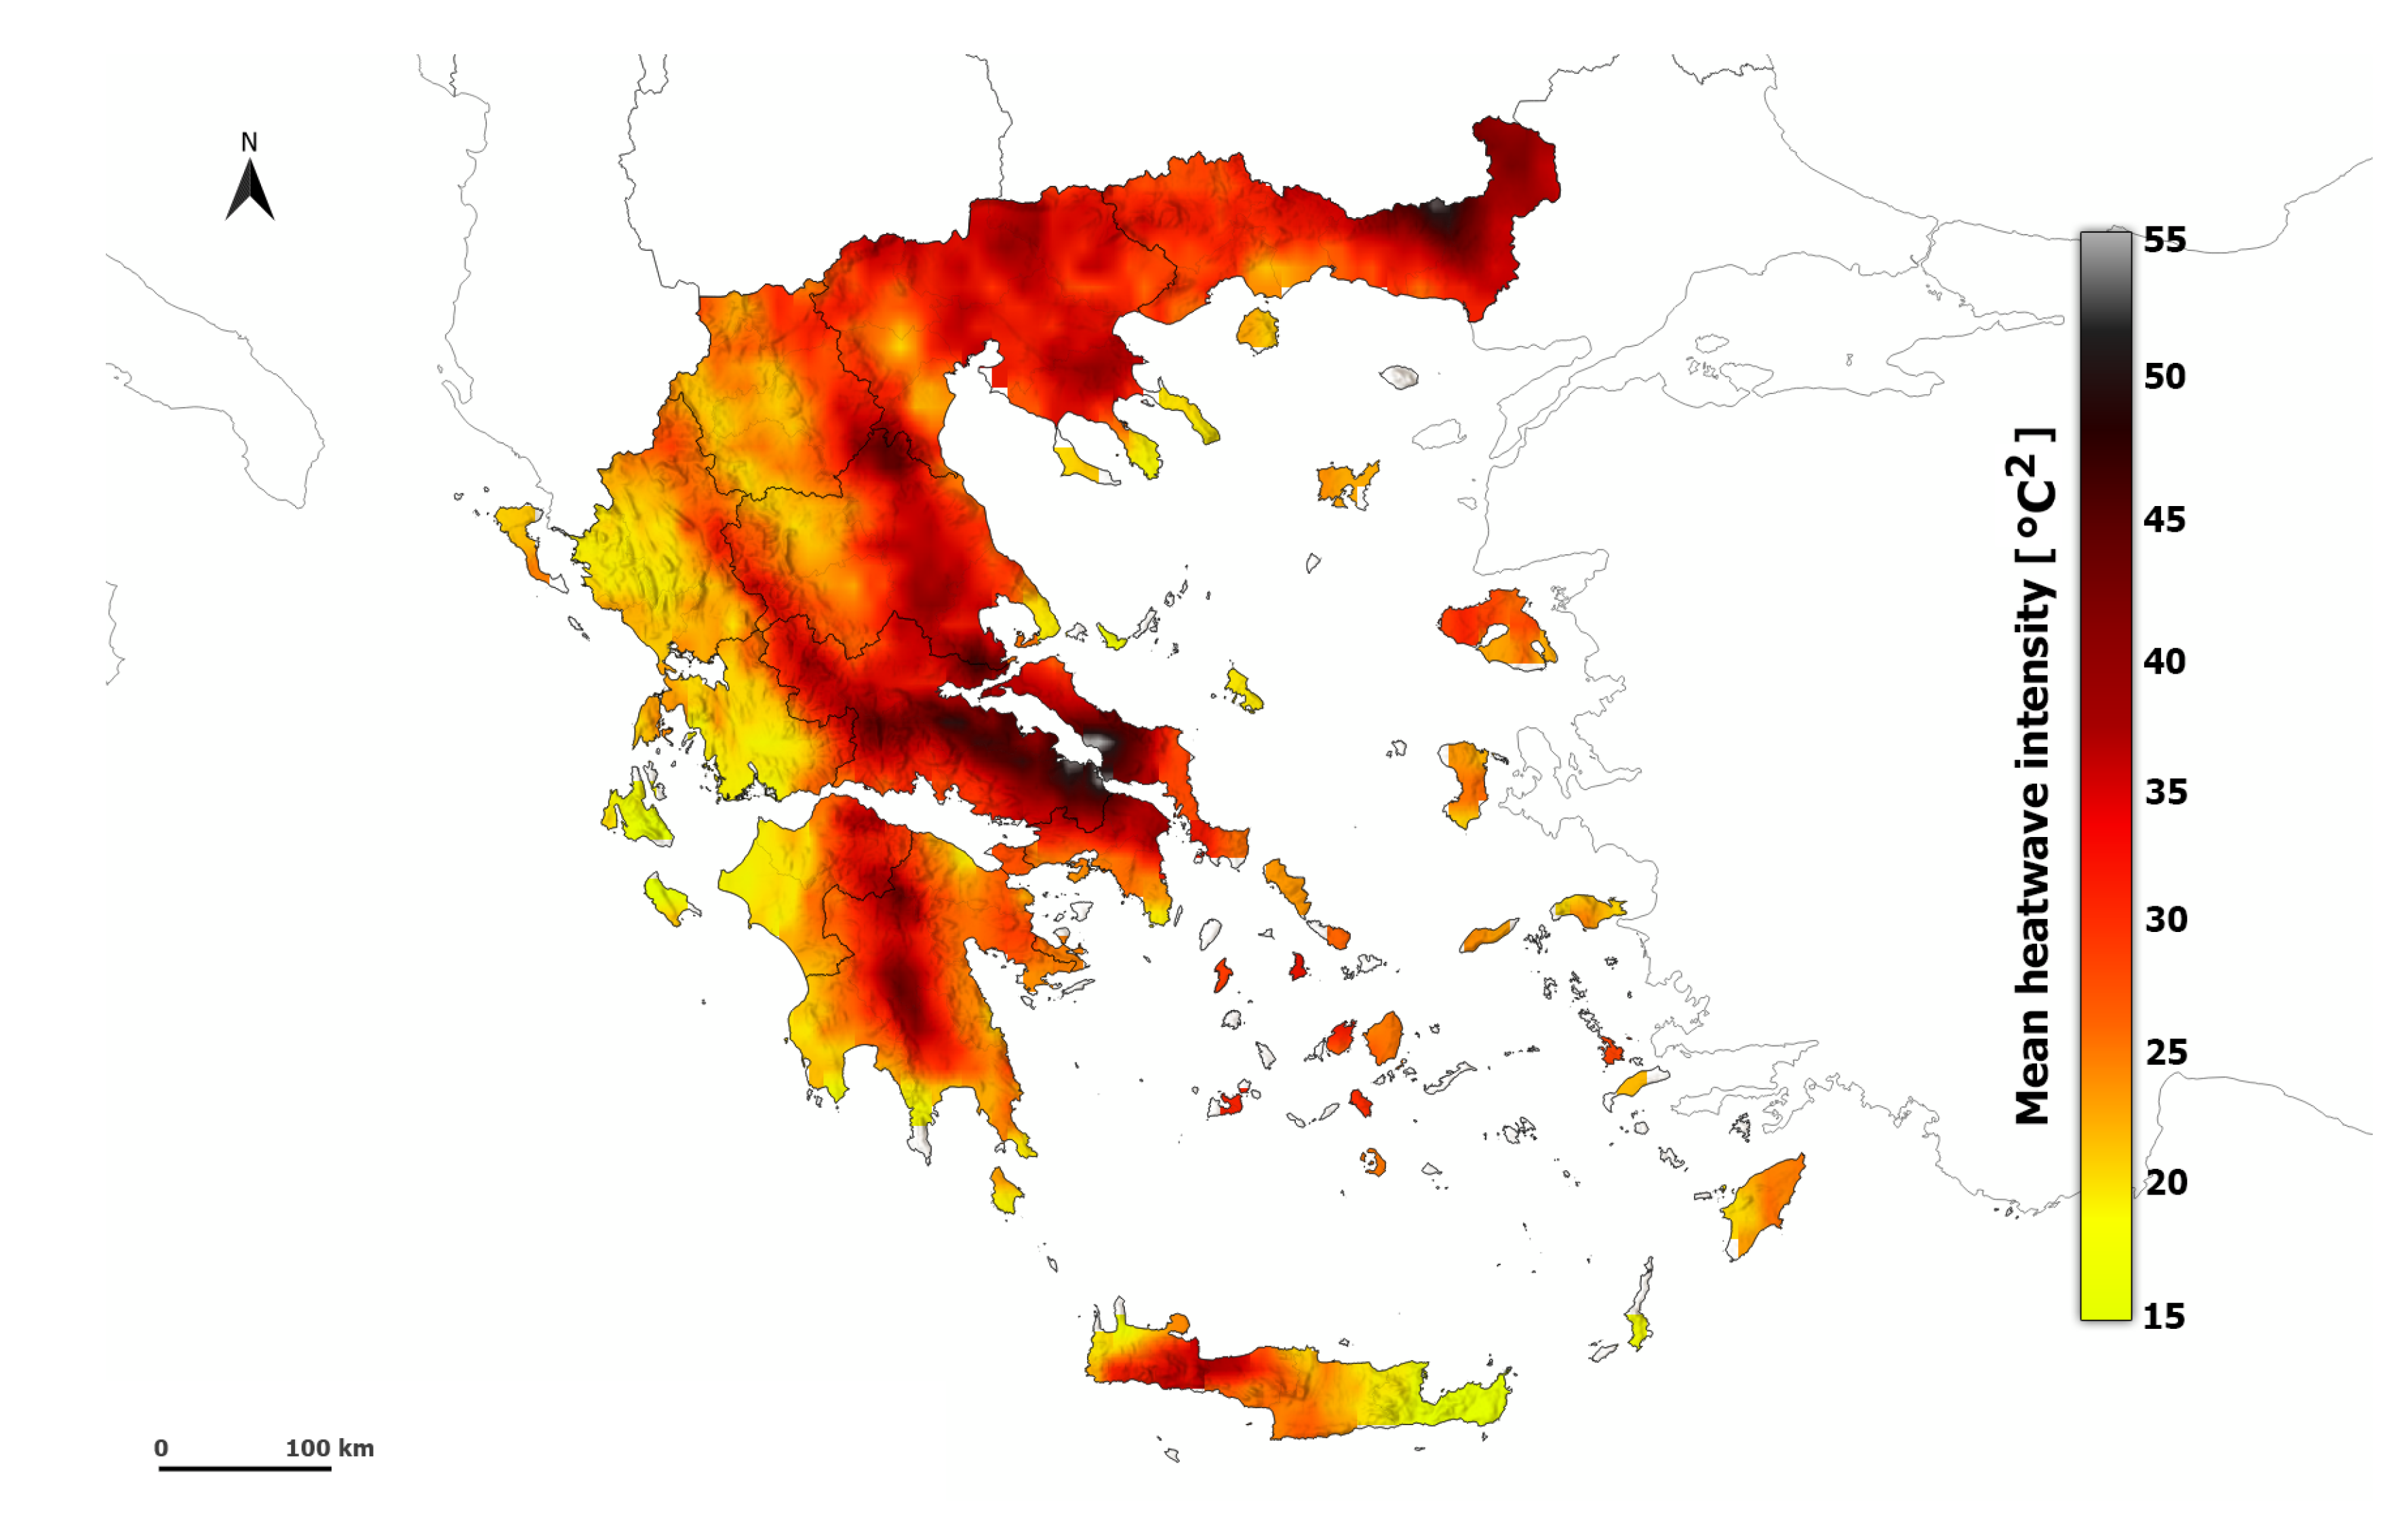
Figure 2 shows the spatial distribution of the averaged HWI in summer for the period 1950-2020. As was expected, the HWI presents larger values across the country’s mainland compared to the islands. The HWI hot spots are located in Attica, the eastern parts of Central Greece, Central Thessaly, and the eastern parts of Eastern Macedonia and Thrace. Similar spatial distribution is observed when we use as an intensity index either the computation of the heatwave magnitude index [26], which refers to the average conditions of all heatwaves of the year (the sum of EHF on heatwave days, divided by the number of heatwave days) or the computation of the maximum EHF per heatwave [26] (not shown). It should be noted that the highest values of HWA are found in Attica, Central Greece, Thessaly, and Central Macedonia, while the lowest are in the mountainous areas, where HWA ranges from 21 °C to 36 °C (Figure S1). It is worth mentioning that the spatial distribution of HWA is in agreement with studies focusing on temperature and extreme temperature indices (e.g., [57,58,59]).
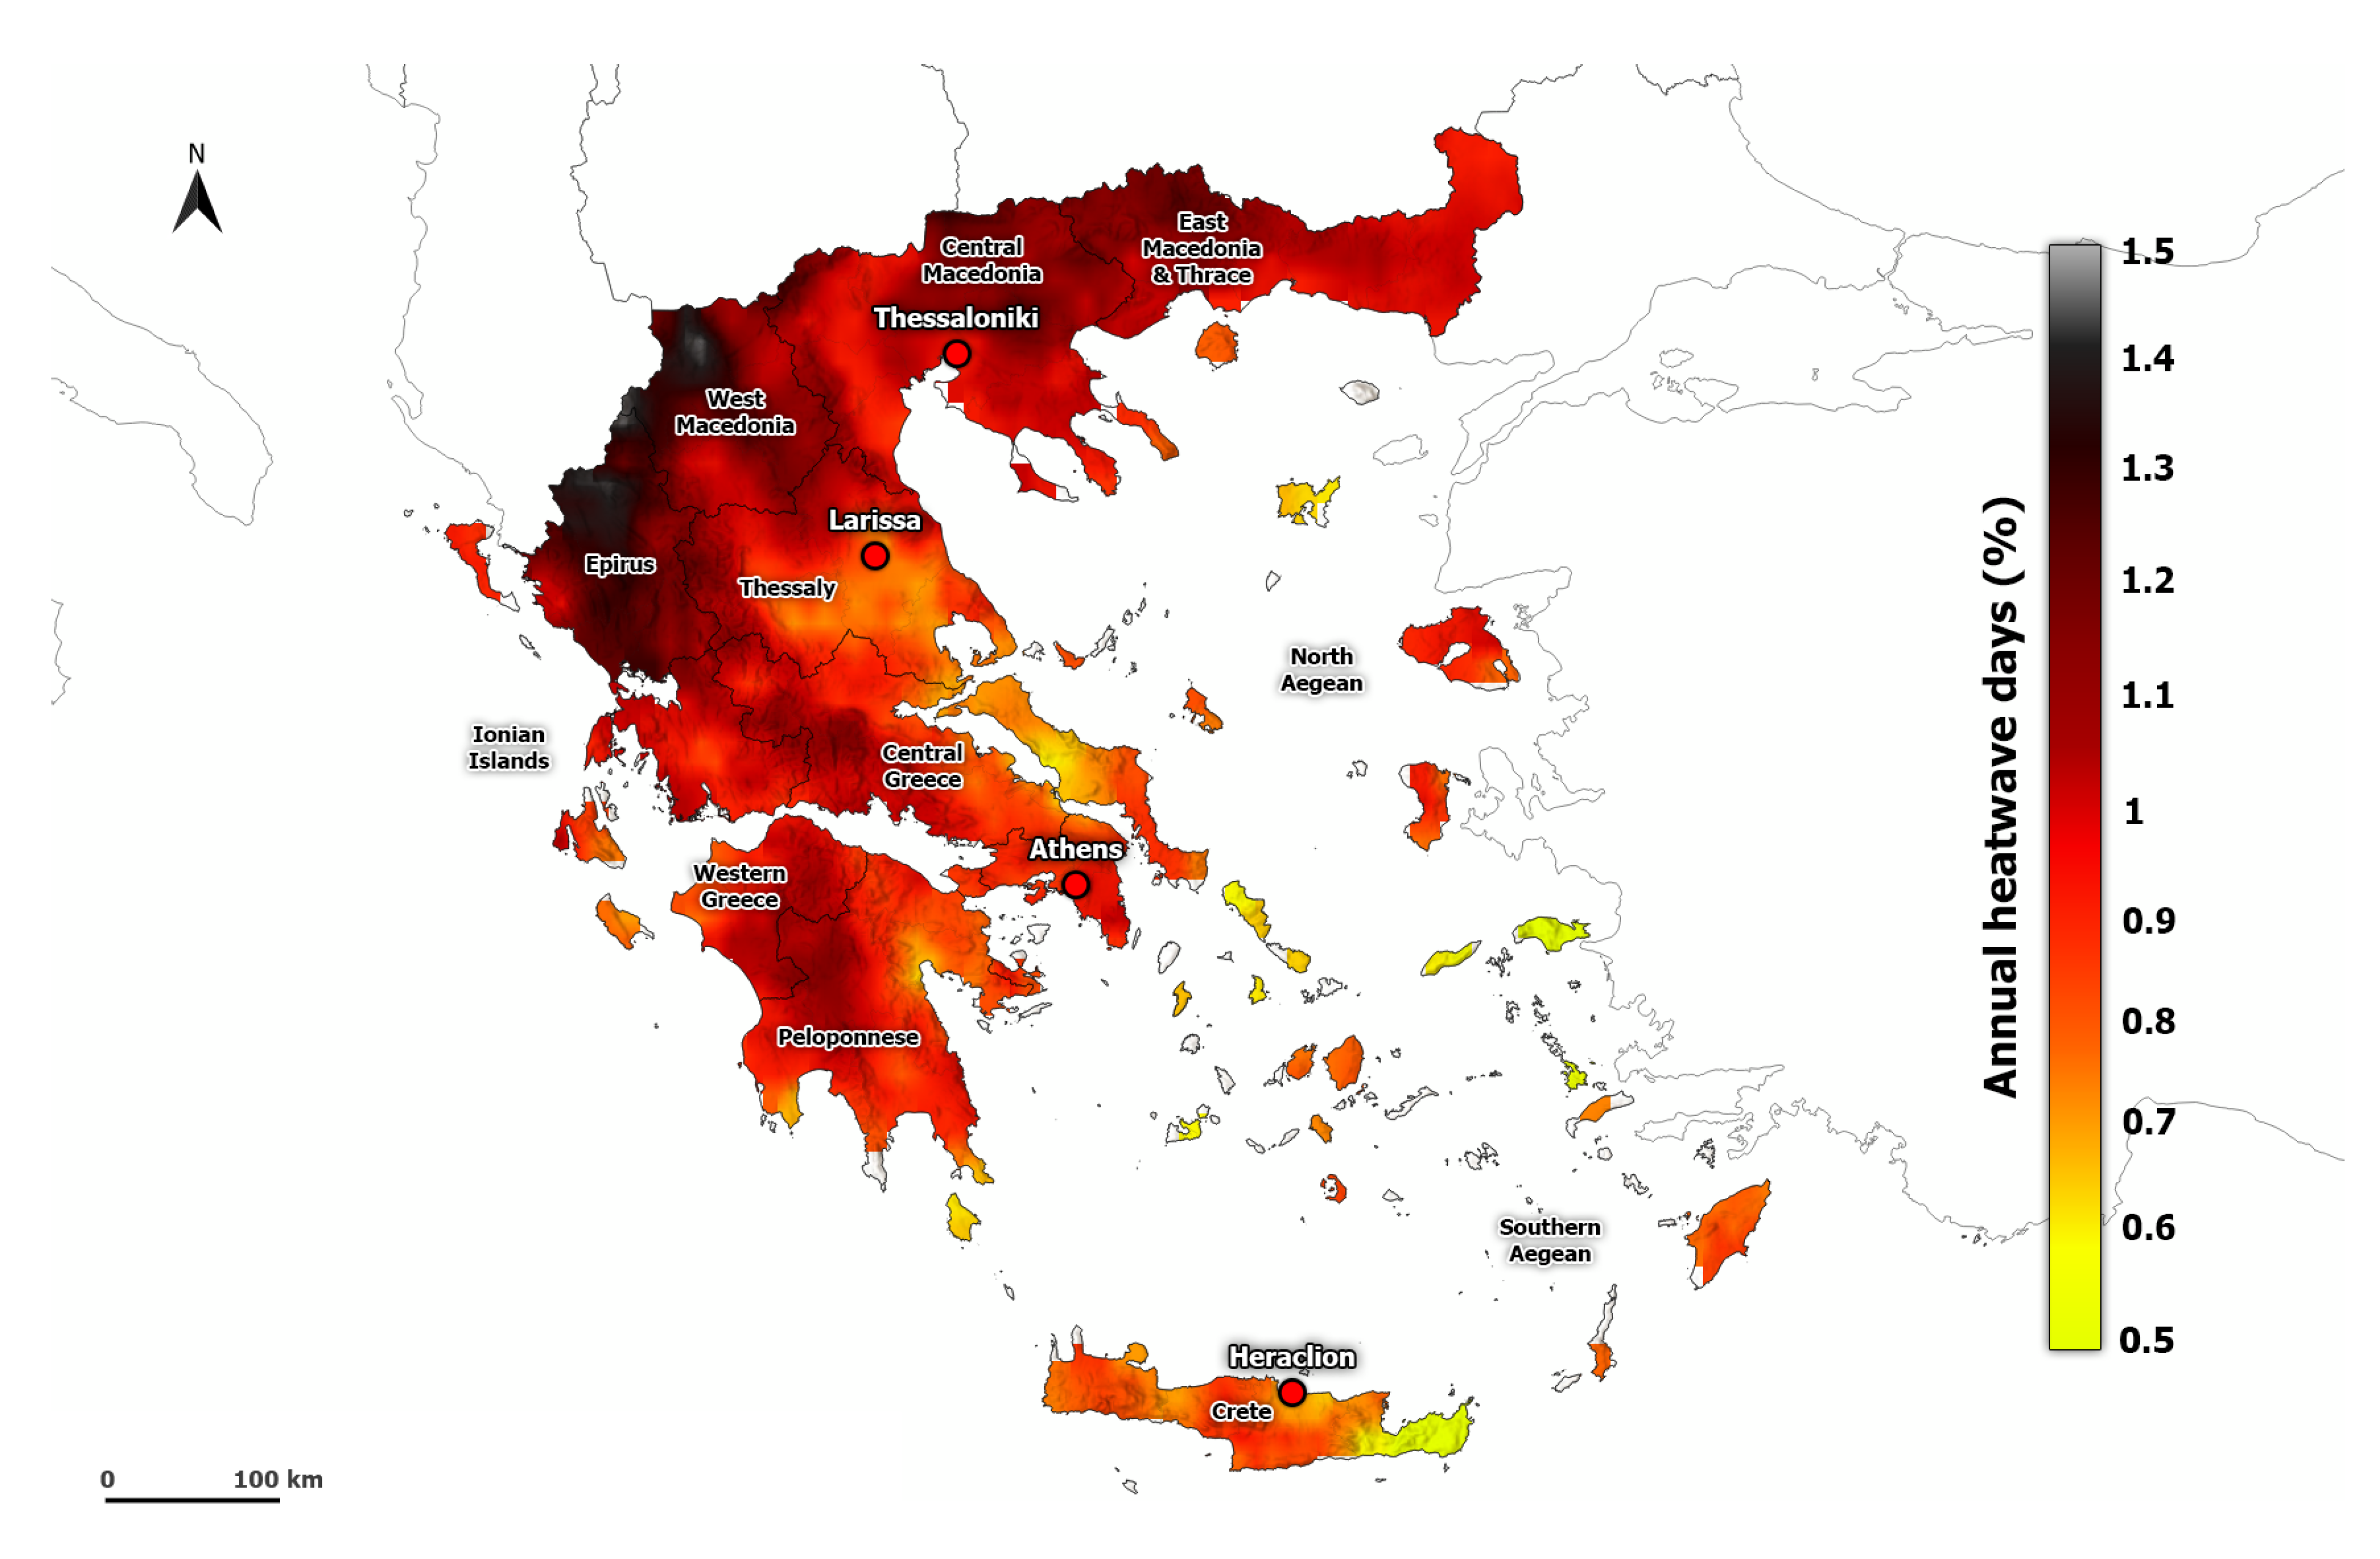
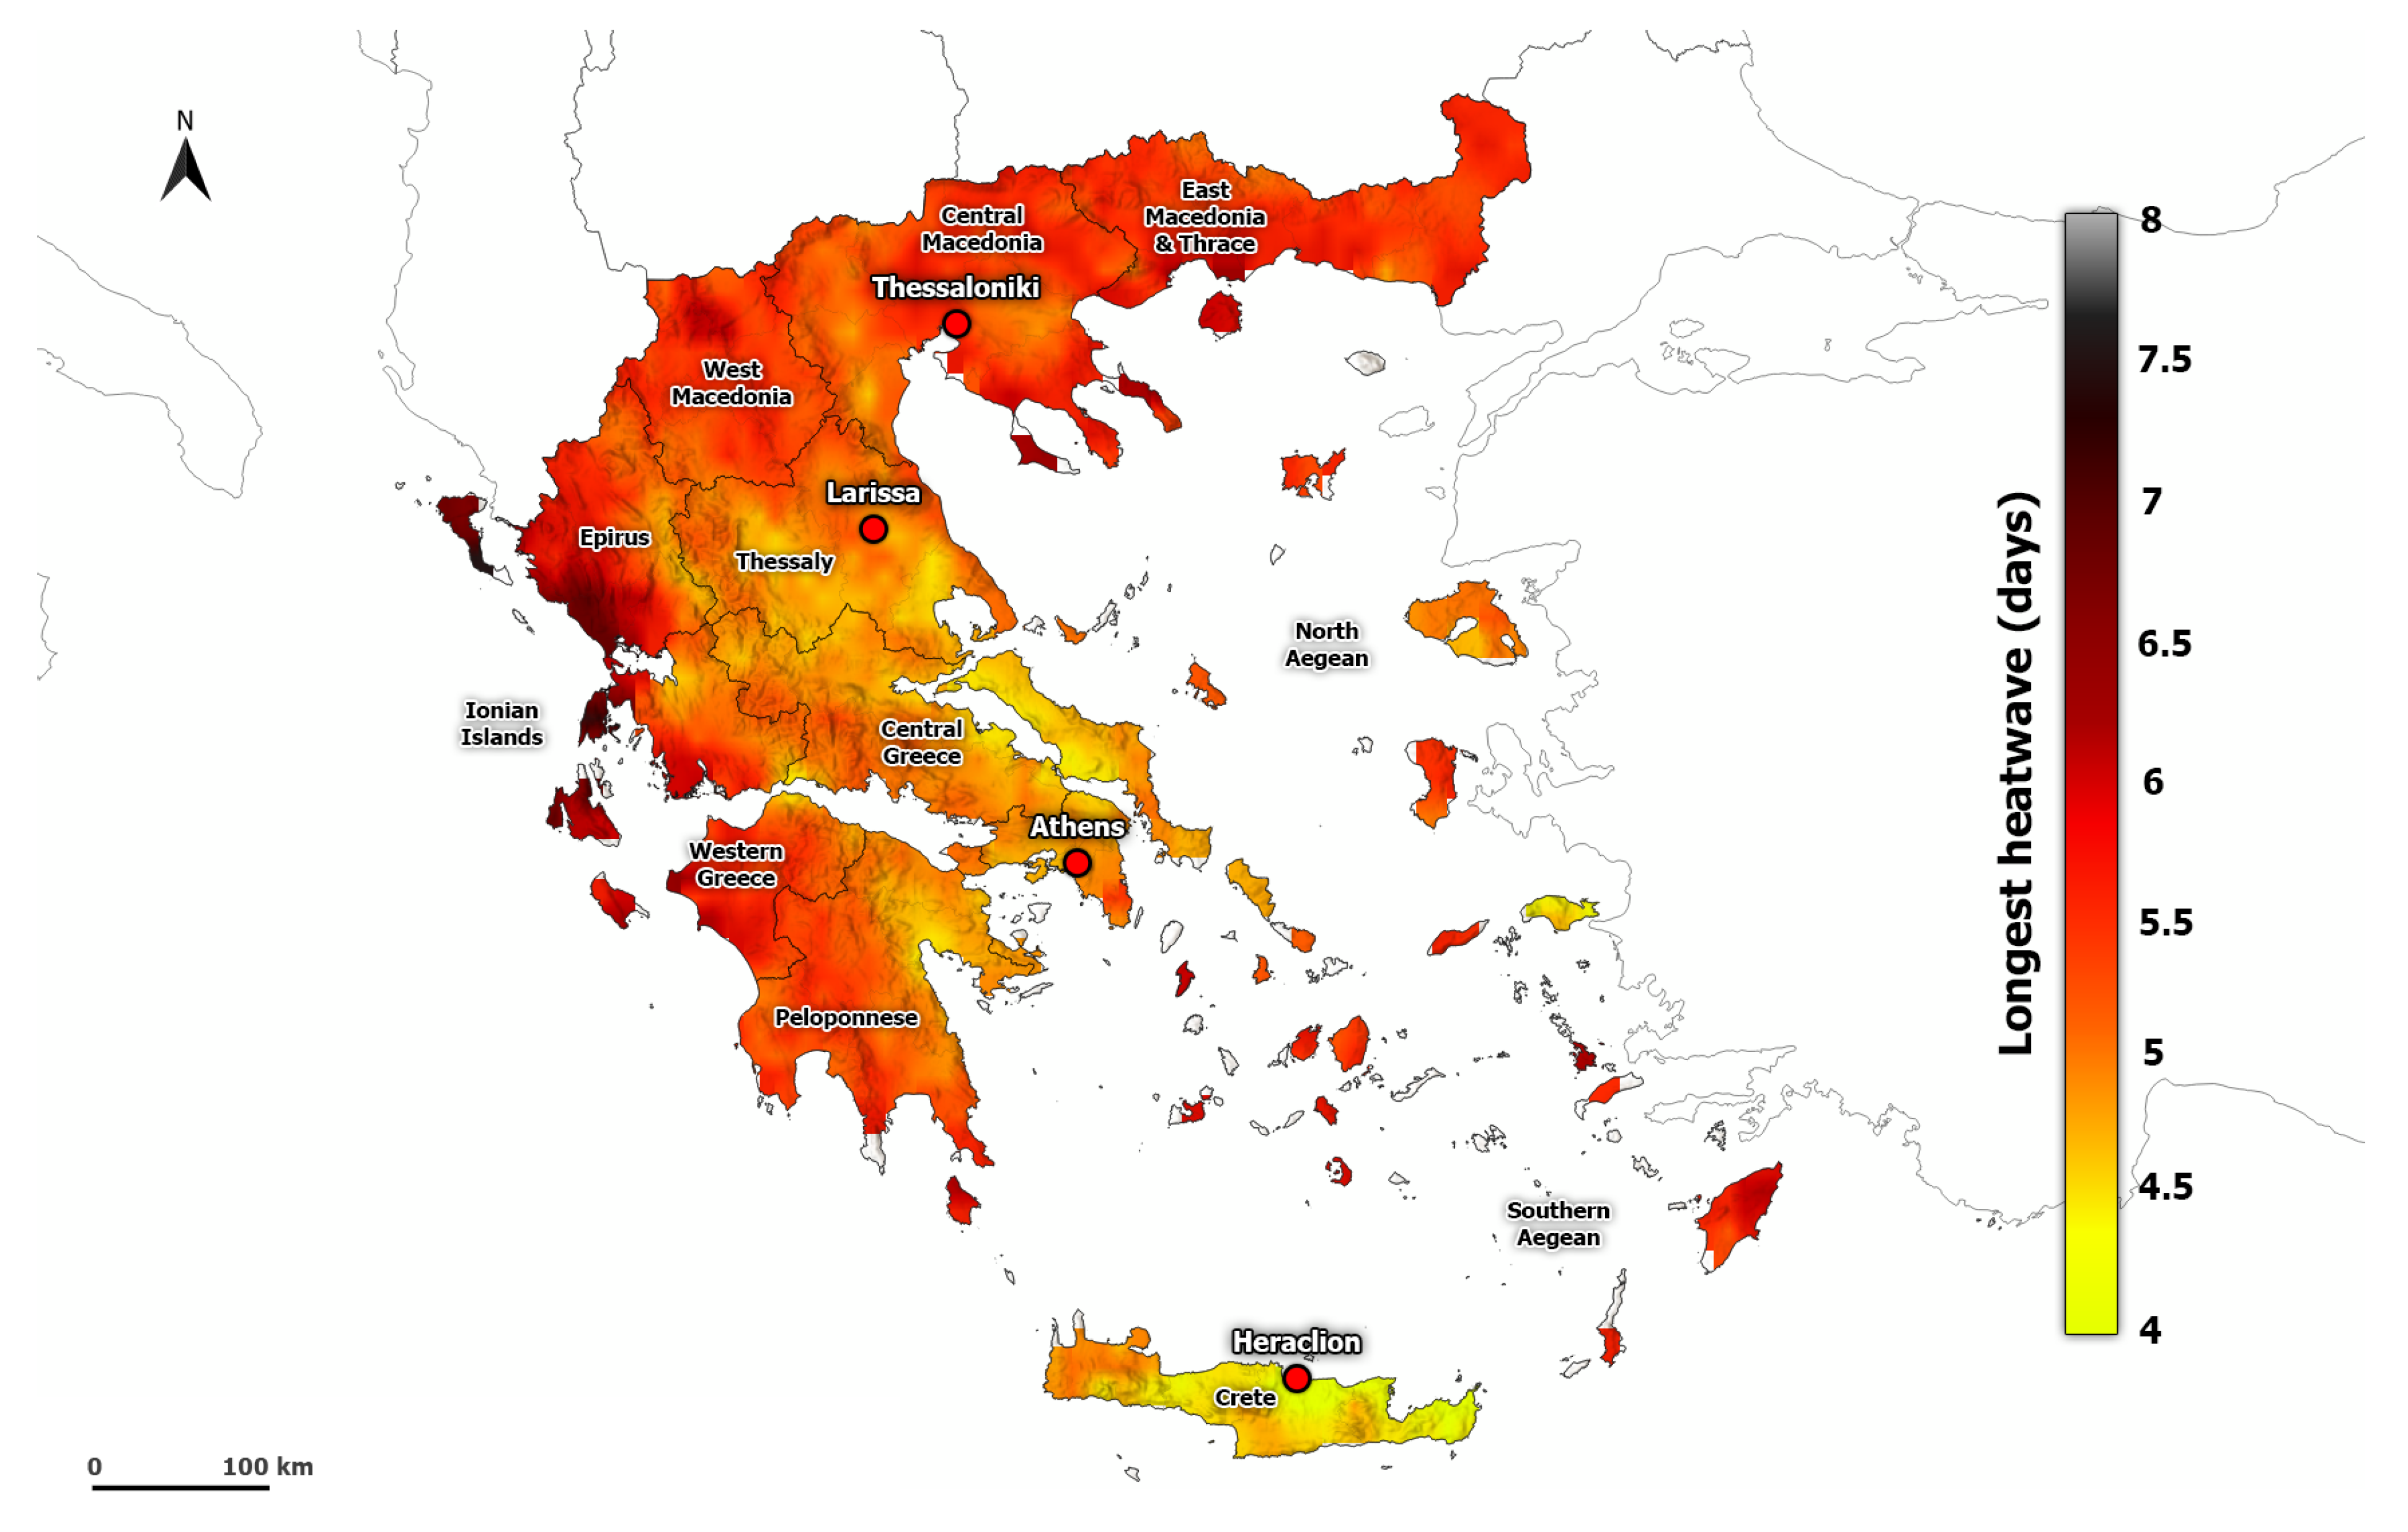
The spatial distribution of the averaged HWF and HWN in summer follows the same pattern (Figure 3 and Figure S2). The HWN ranges from 0.30 to 1.16 heatwaves per summer, and HWF from 0.35 to 1.44 % days per year. Lower values of heatwave events are found in the islands of Greece. The HWF and HWN hot spots are located mainly in the mountainous areas in Epirus, central Peloponnese, and Western Macedonia. The higher number of heatwave events in these areas, compared to the lower values found in the large cities of Greece (e.g., Athens, Thessaloniki), is related to the combined effect of the lower 90th percentile threshold of AT and the increasing temperature due to climate change. Indeed, a higher frequency of heatwaves in mountainous areas than in the lowlands has also been reported in other areas such as Romania [60] and Iran [61]. It must be noted that the calculated frequency of the heatwaves is strongly related to the heatwave criteria. The use of a fixed temperature threshold leads to a lower HWF in mountainous areas (e.g., [62]), while the percentile temperature threshold allows studying heatwaves in mountainous regions [63]. It is noteworthy that in some mountainous regions, such as Epirus and Western Macedonia, the HWI is lower (Figure 2), thus the heatwaves in these areas tend to be more frequent and mild. Furthermore, the mean HWD is almost 5.23 days per summer, while the longest heatwaves are found in Western Greece and the Ionian islands (Figure 4).
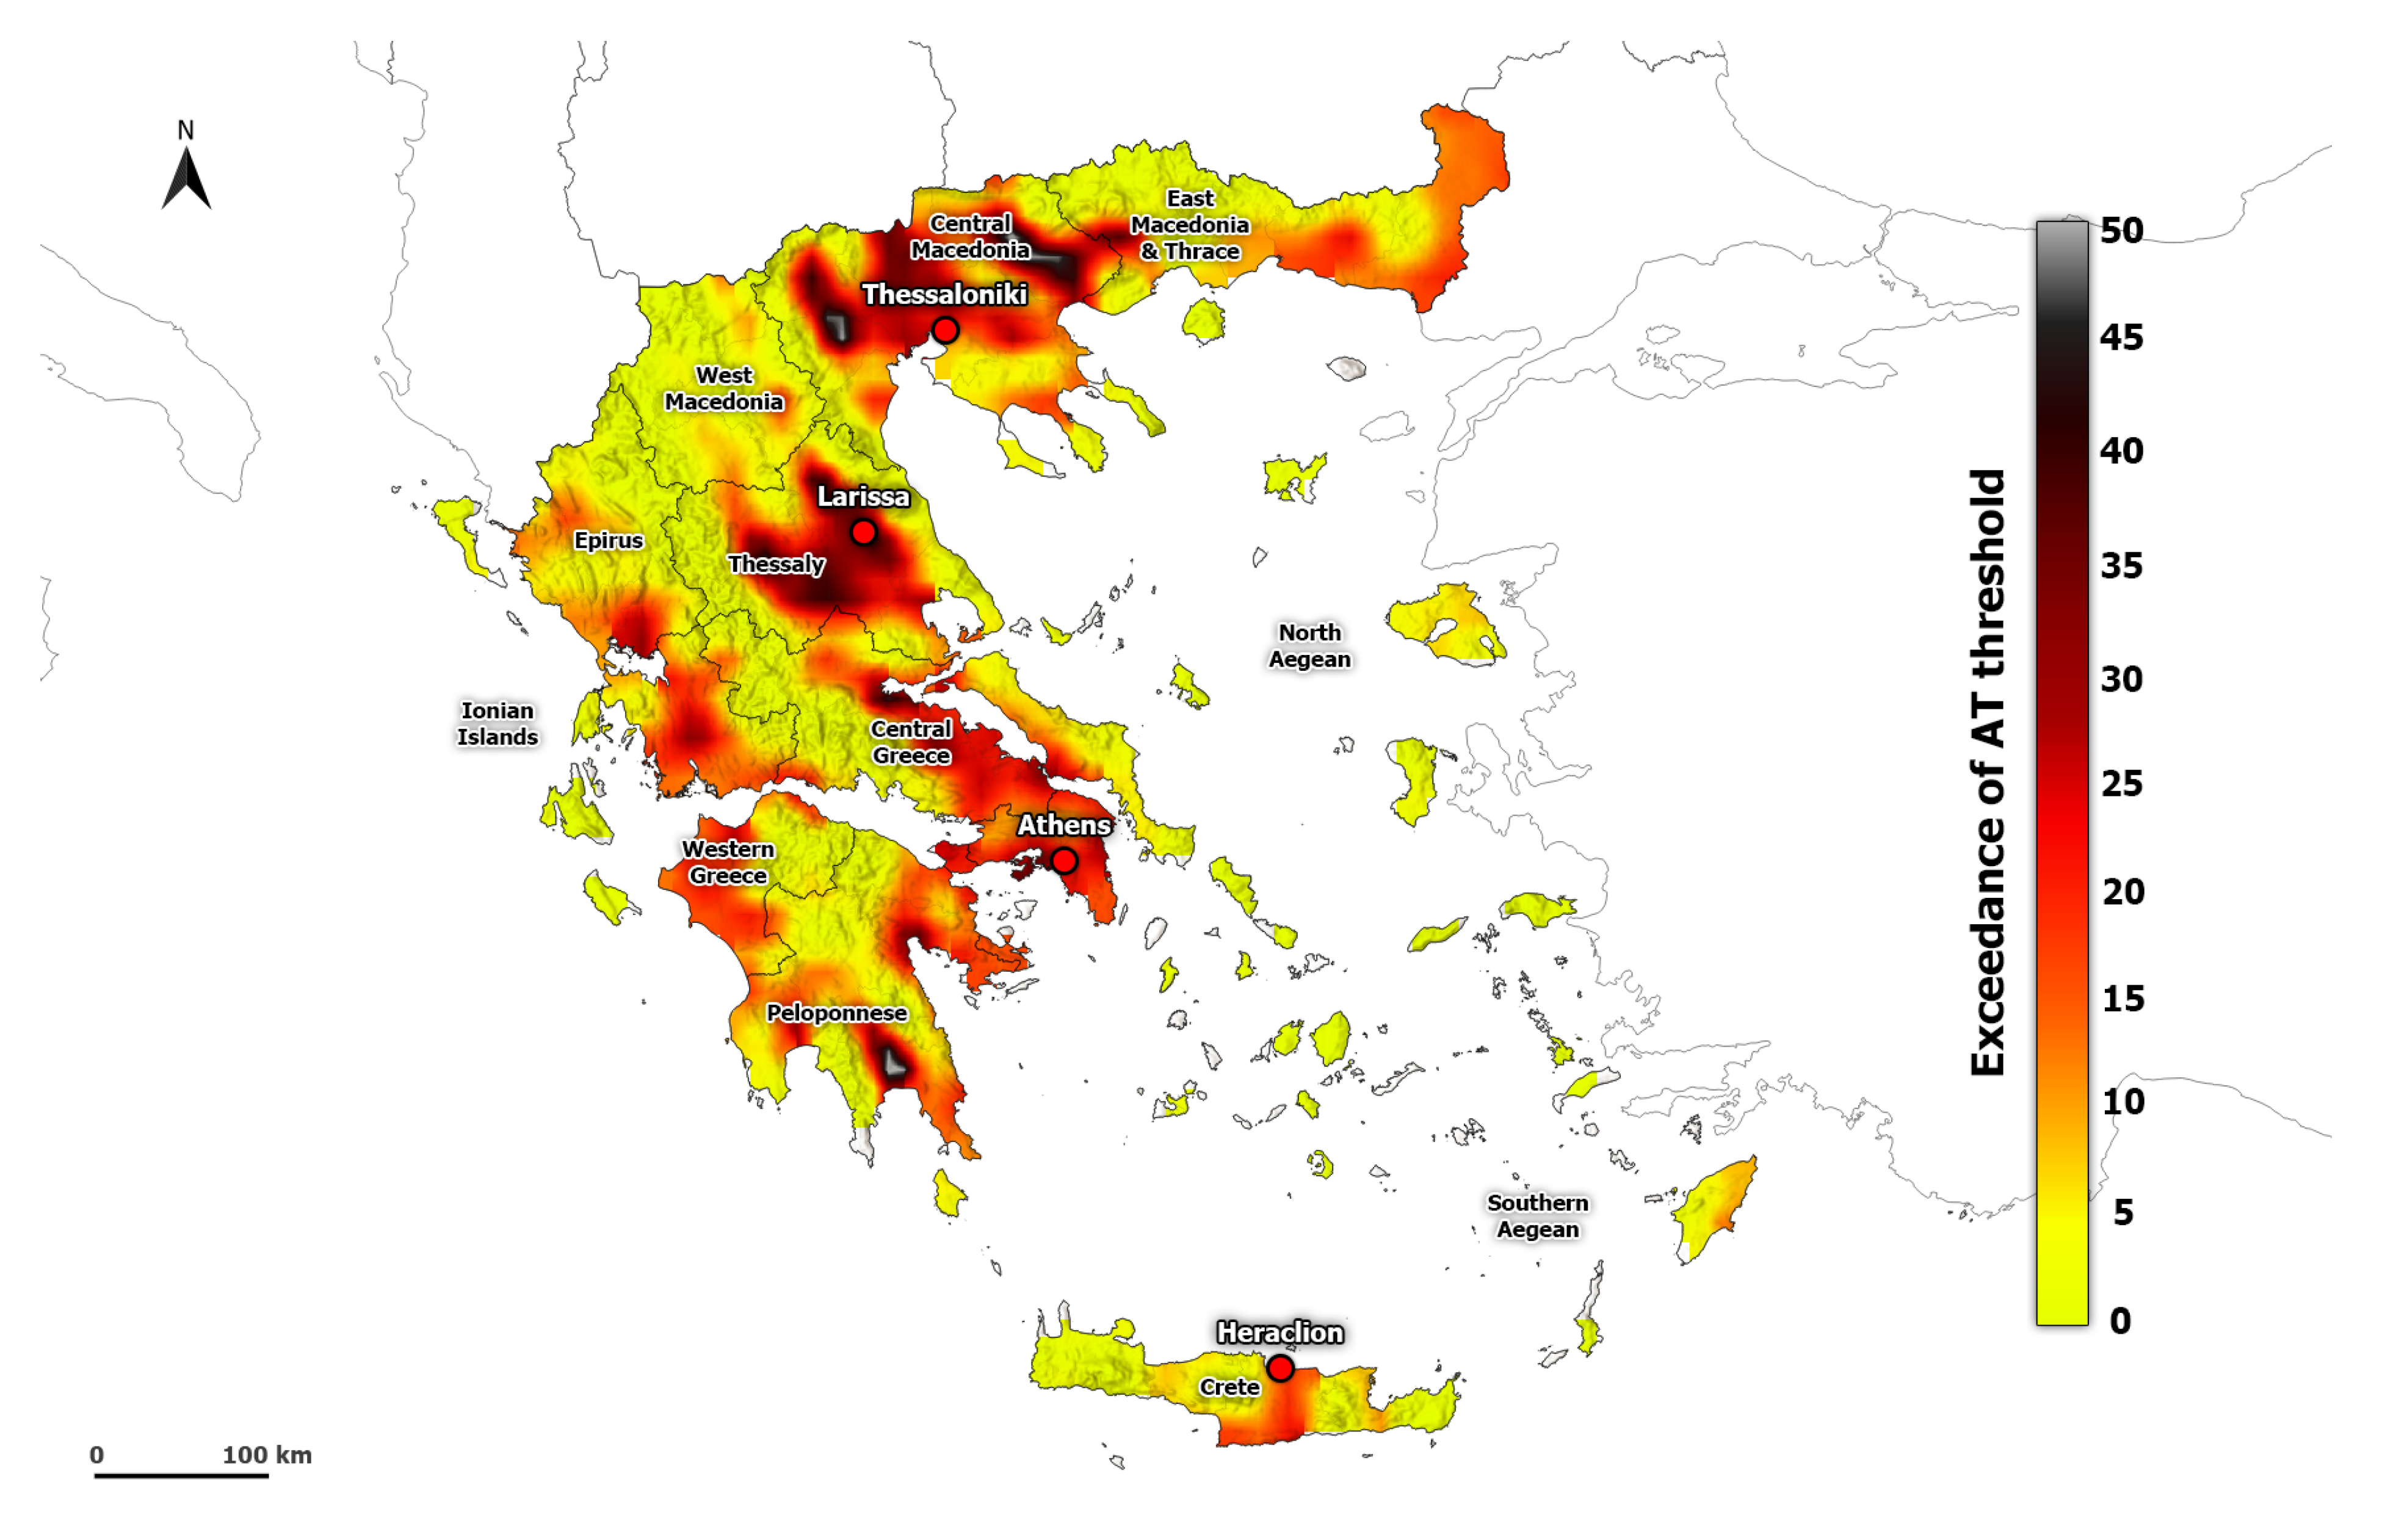
As was expected, the indices AT41C and CHT present higher values in areas where the largest cities of Greece are located, such as Attica, Central Macedonia, and Thessaly (Figure 5 and Figure S3). The higher values in these indices are associated with the factors that modulate the urban climate. The urban structure and composition affect the local climate by changing the surface energy budget, increasing the anthropogenic heat release, and reducing evaporative cooling. Indeed, the thermal stress is more pronounced in urban areas, leading to higher mortality rates in urban areas compared to the natural ones (e.g., [11,64,65]).
3.2. Trend analysis of heatwave indices
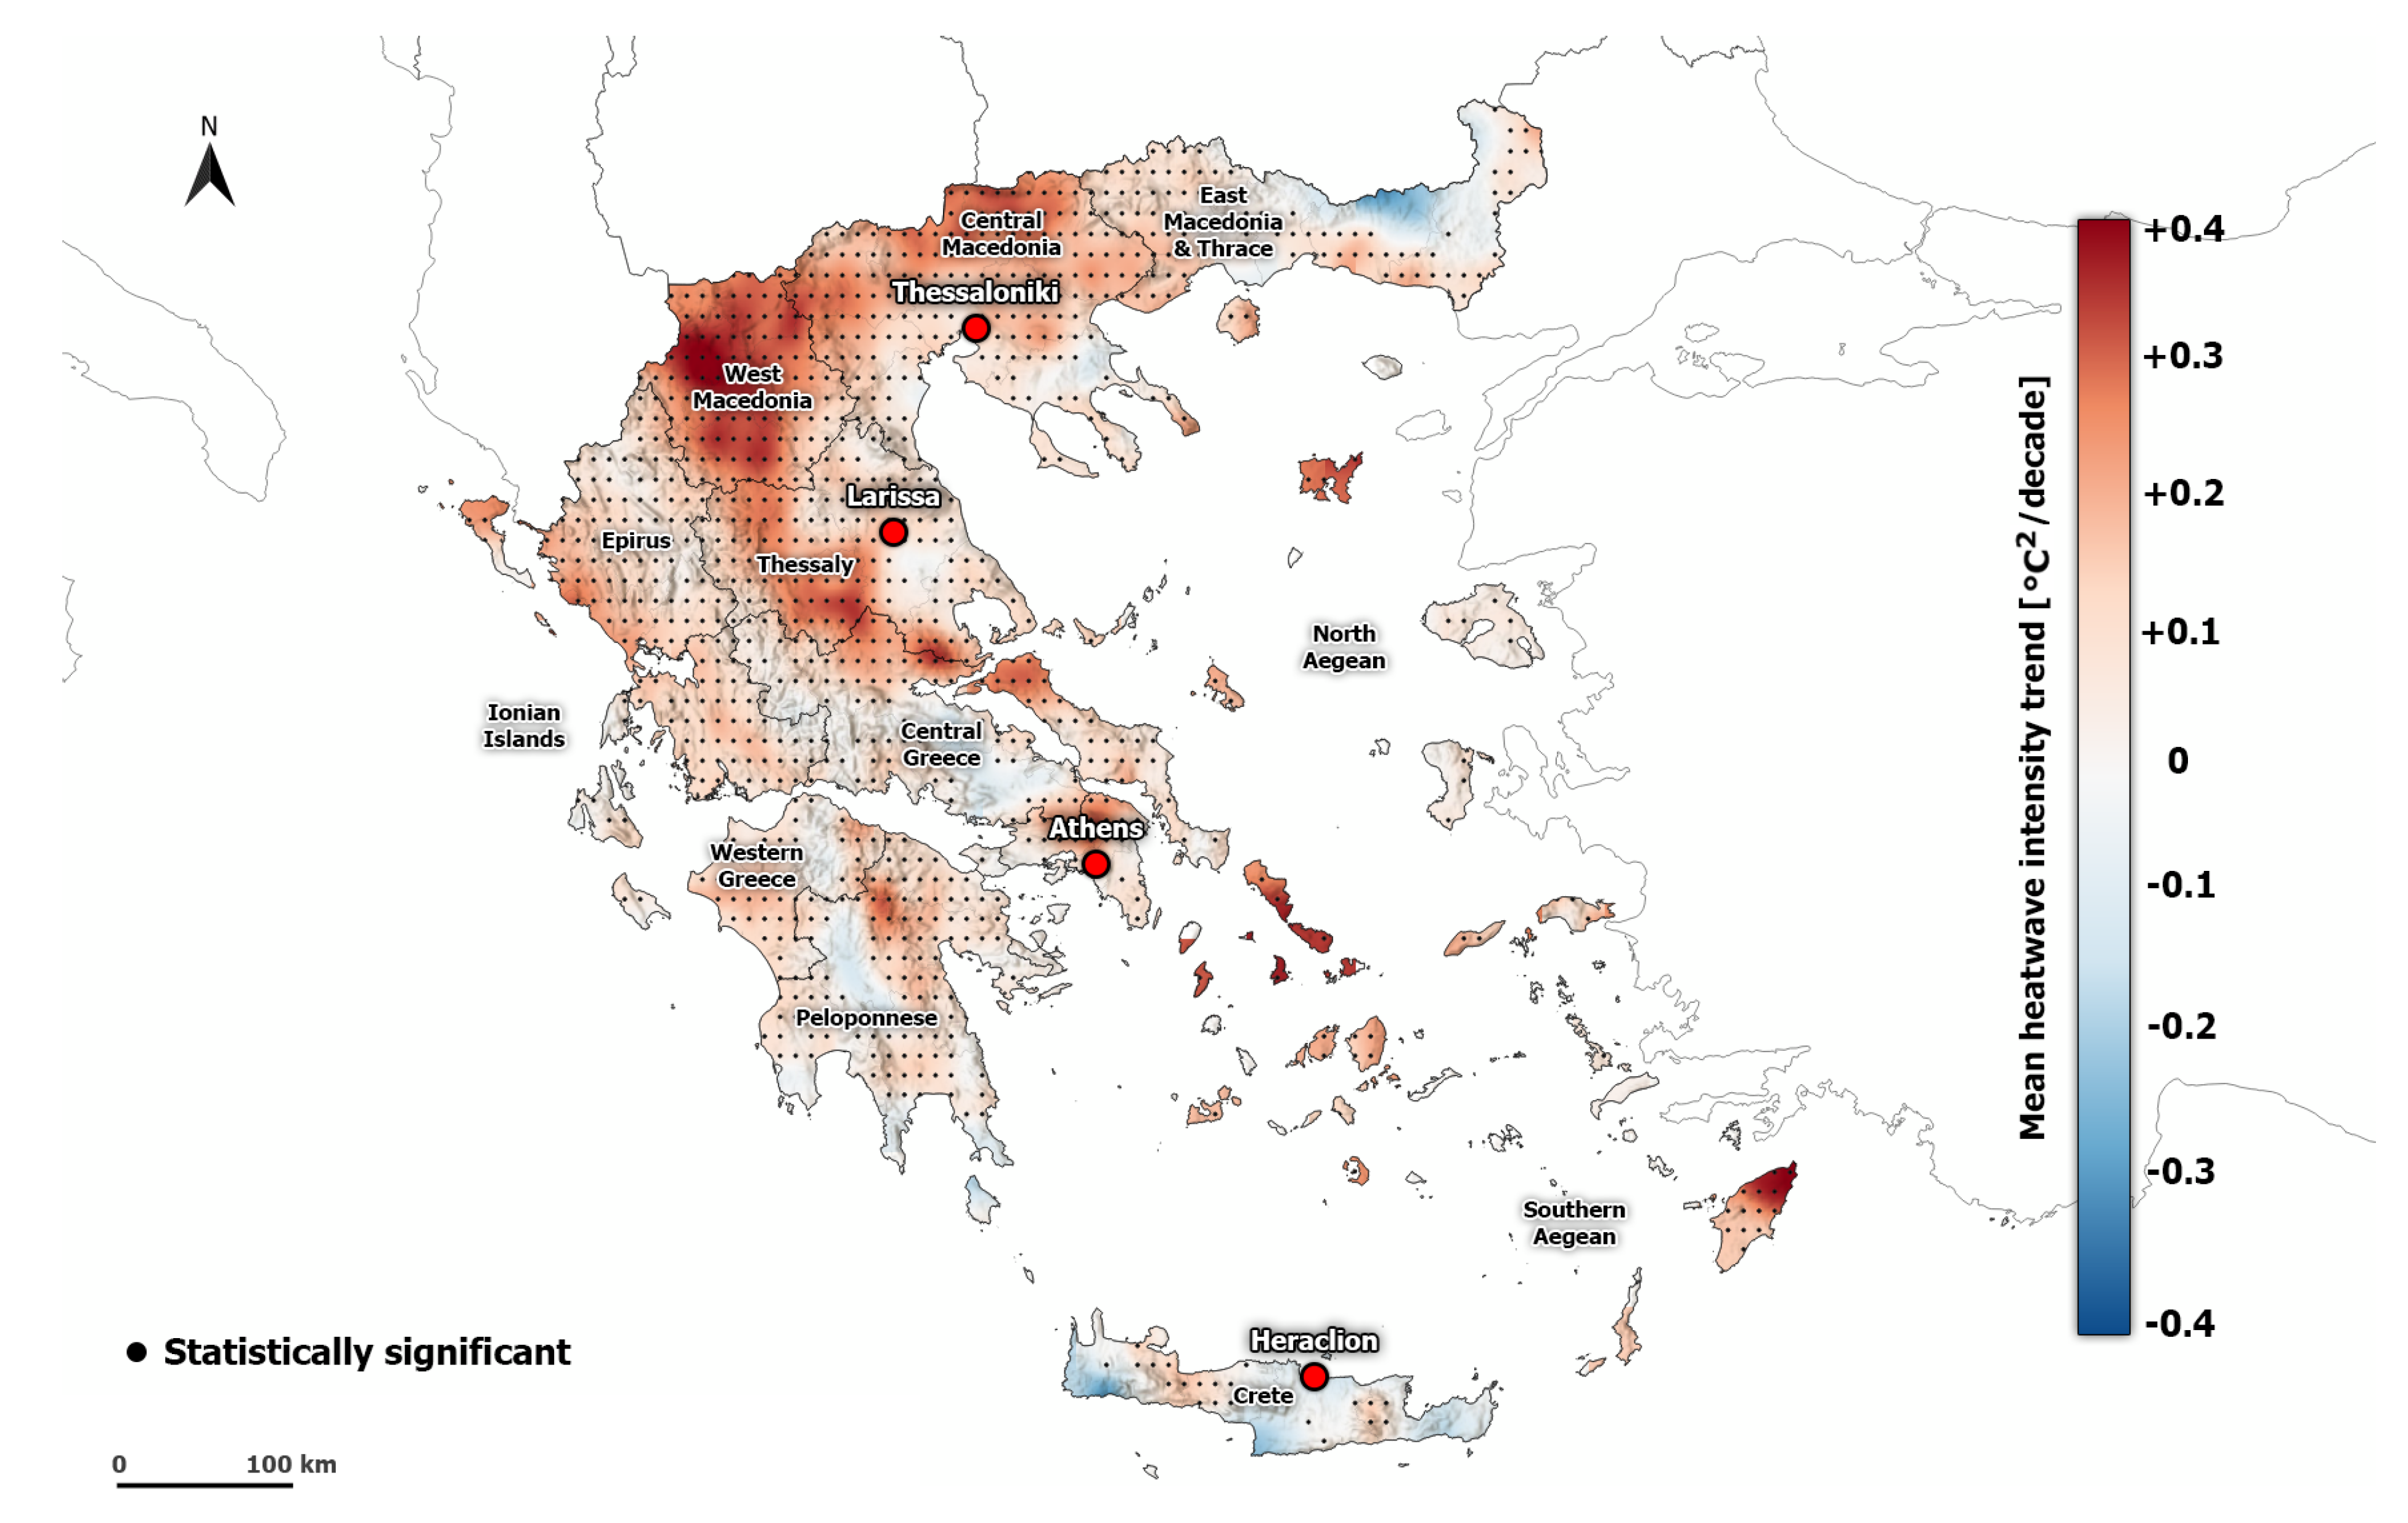
Mean HWI and HWA values present an increasing trend in summer for the period 1950–2020 (Figure 6 and Figure S4). Indeed, HWA increases with an average rate of 0.07 °C per decade, while the HWI increases with an average rate of 0.16 °C2 per decade (Table 2). The maximum values are found in the areas of Epirus, West Macedonia, Attica, and Central Macedonia. In a few areas, such as the island of Crete and Peloponnese, the trend of HWI and HWA is decreasing, but the values are not statistically significant. These results confirm previous studies that highlighted an overall warming trend in Greece (e.g., [30,66]).
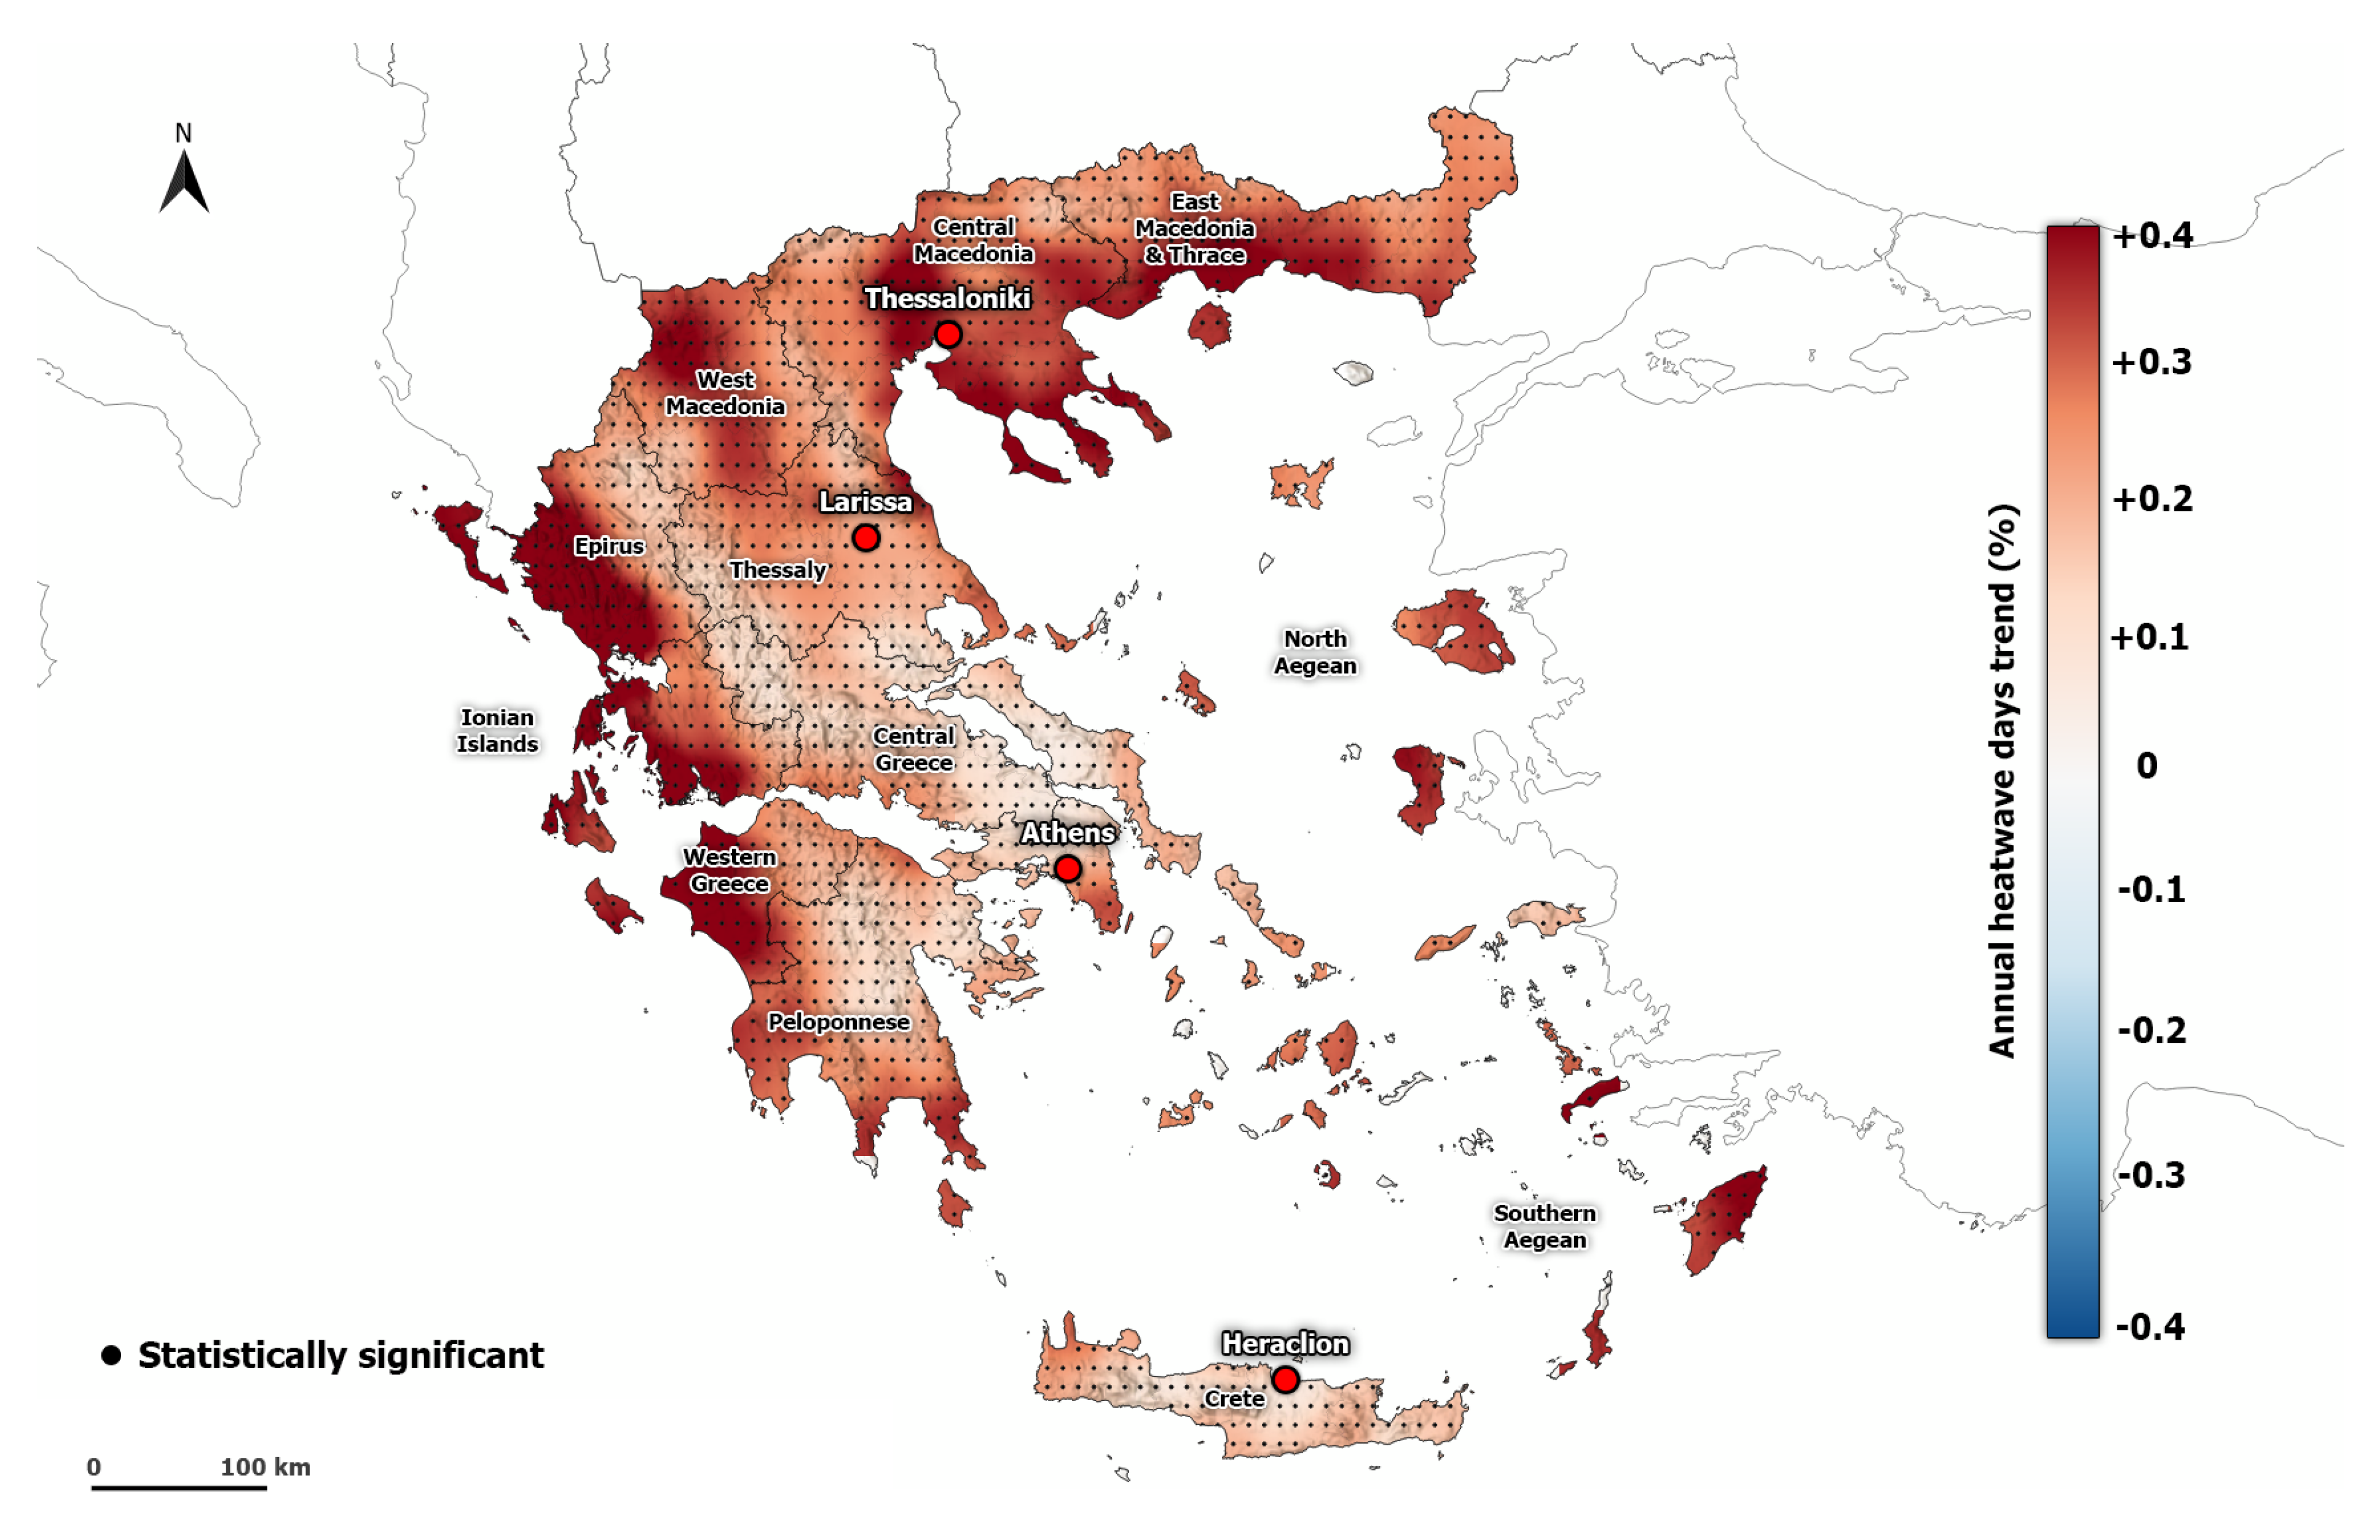
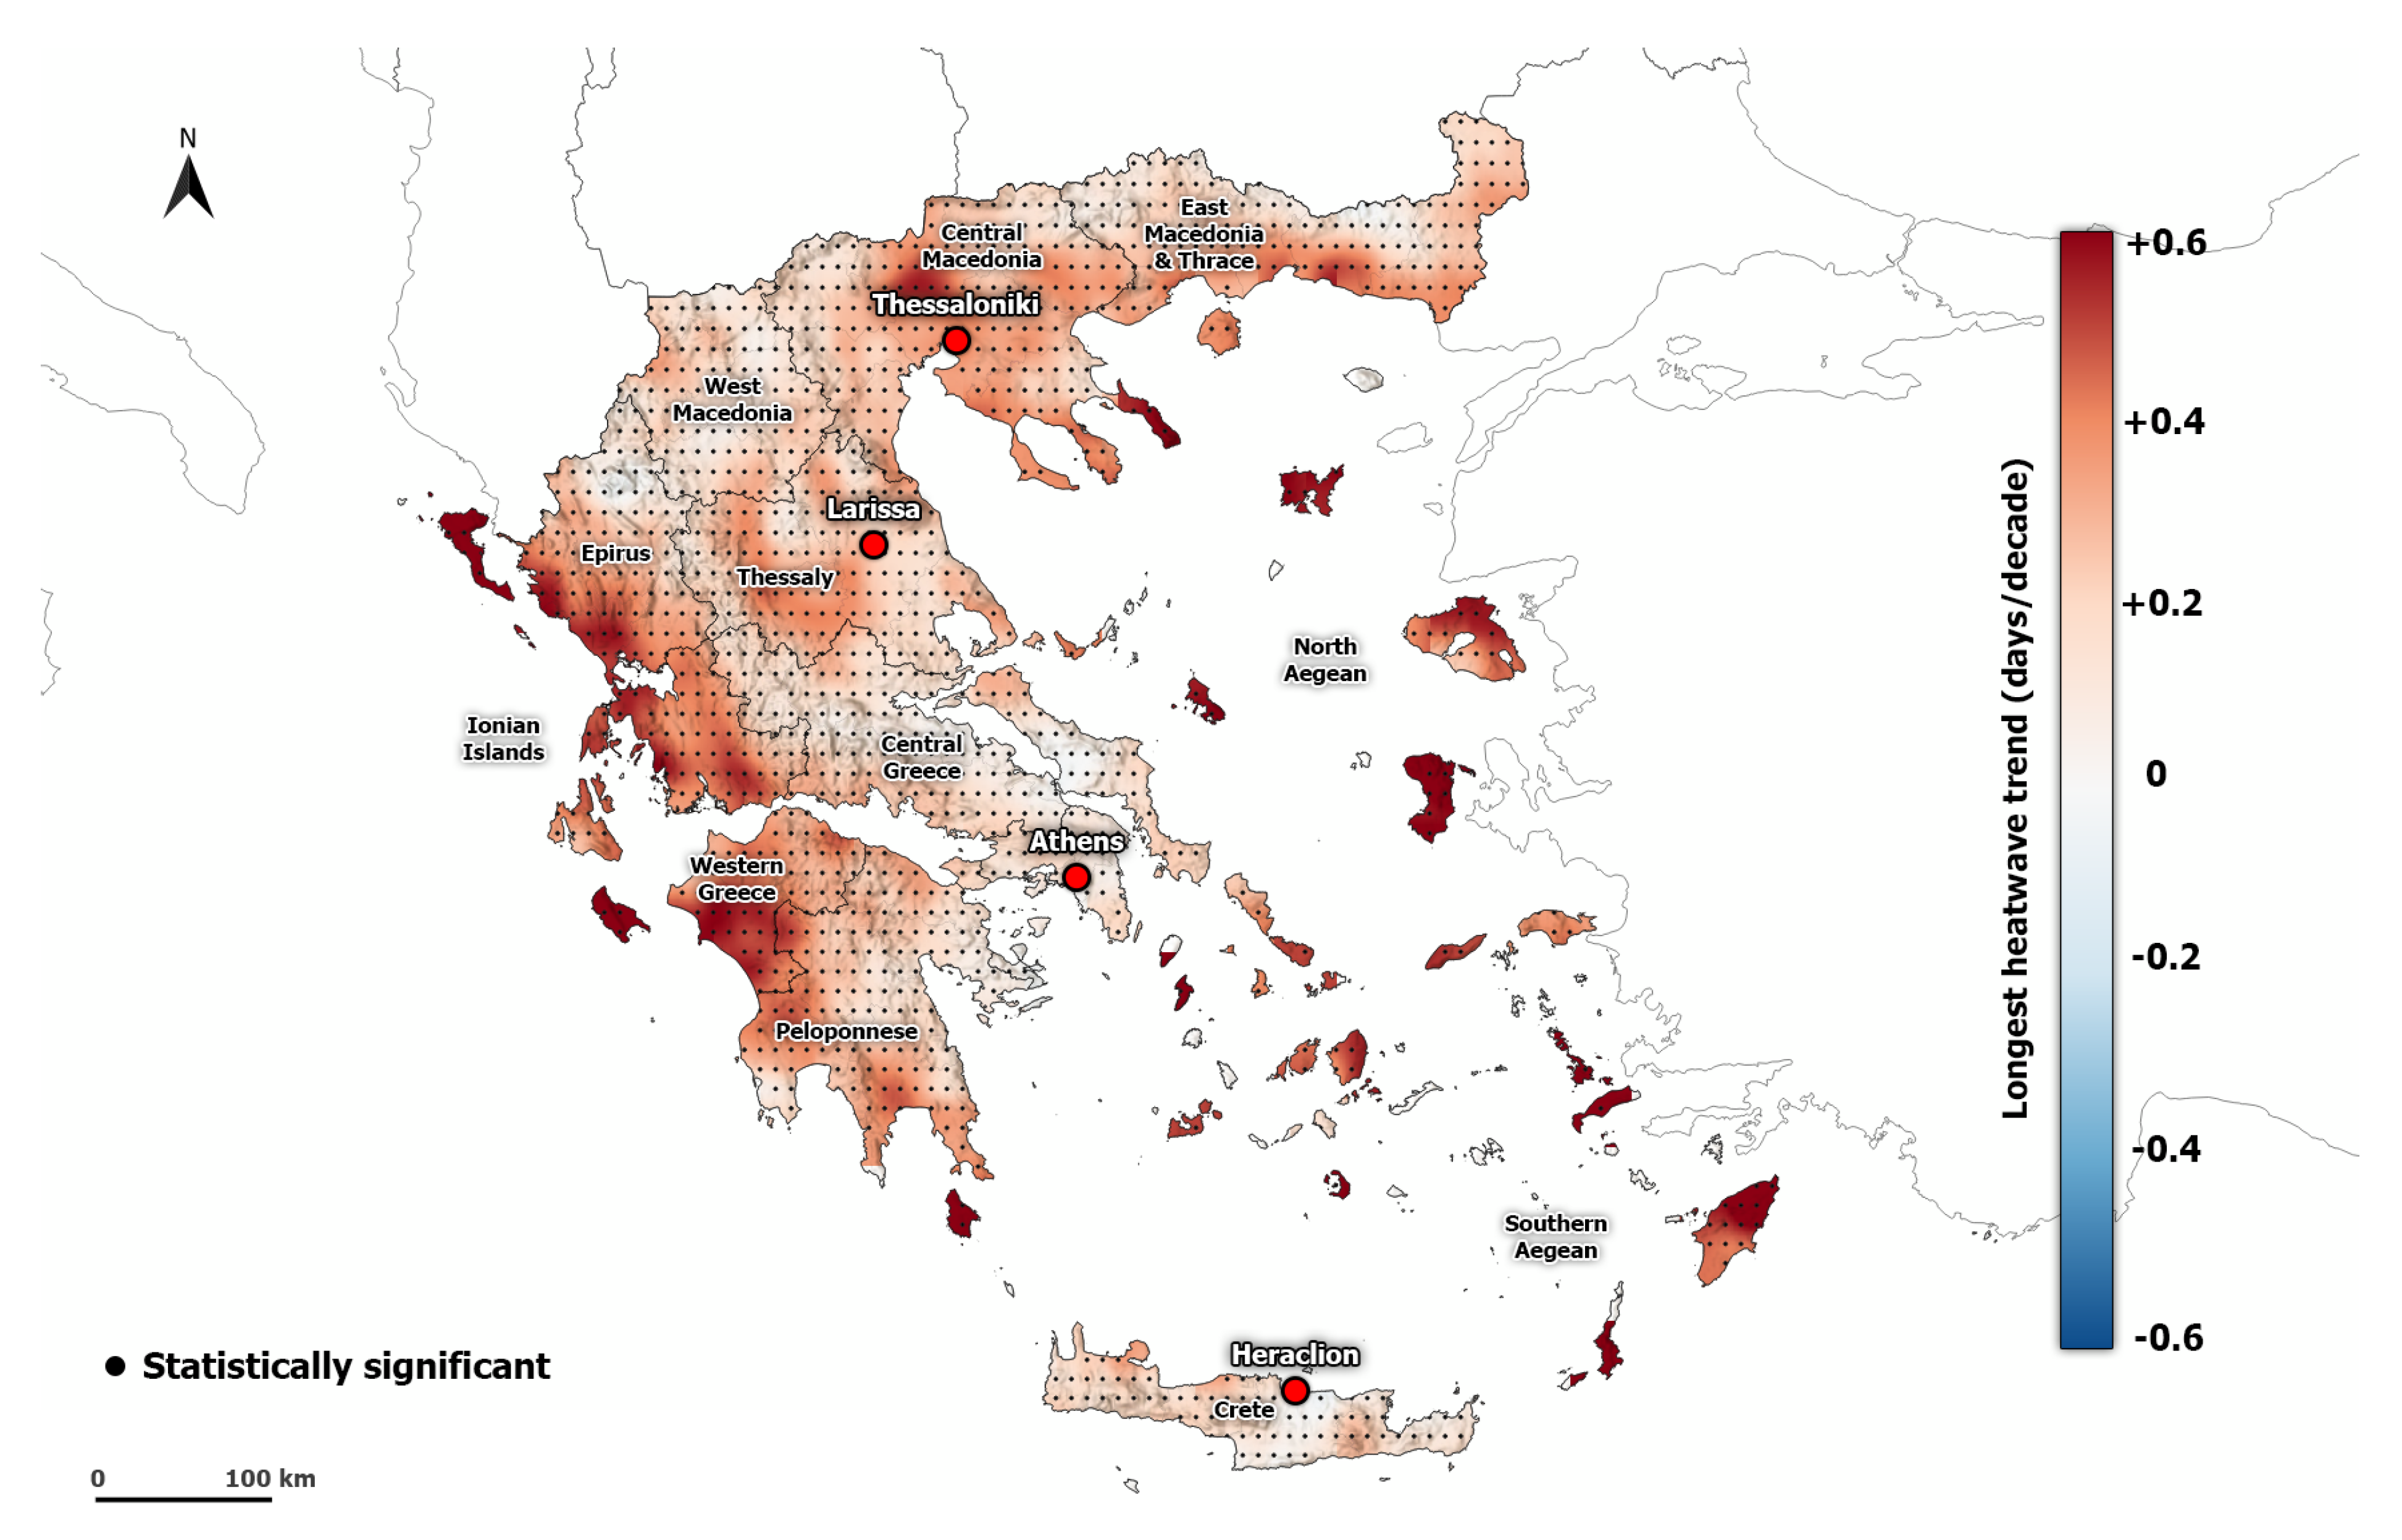
Figure 7 and Figure S5 show the spatial distribution of the trend of HWF and HWN in summer for the period 1950-2020. There is an overall increasing trend in the whole region of Greece which ranges from 0.05 to 0.59 % per decade, and 0.02 to 0.36 heatwaves per decade for HWF and HFN, respectively. The greater values are found in Central Macedonia, Epirus, and West Greece. In the same regions, an increasing trend in HWD is also found (Figure 8). Almost neutral to slightly negative values in the HWD trend are found in the area of Attica and West Macedonia. Overall, an average trend of 0.28 days per decade occurred in Greece (Table 2).
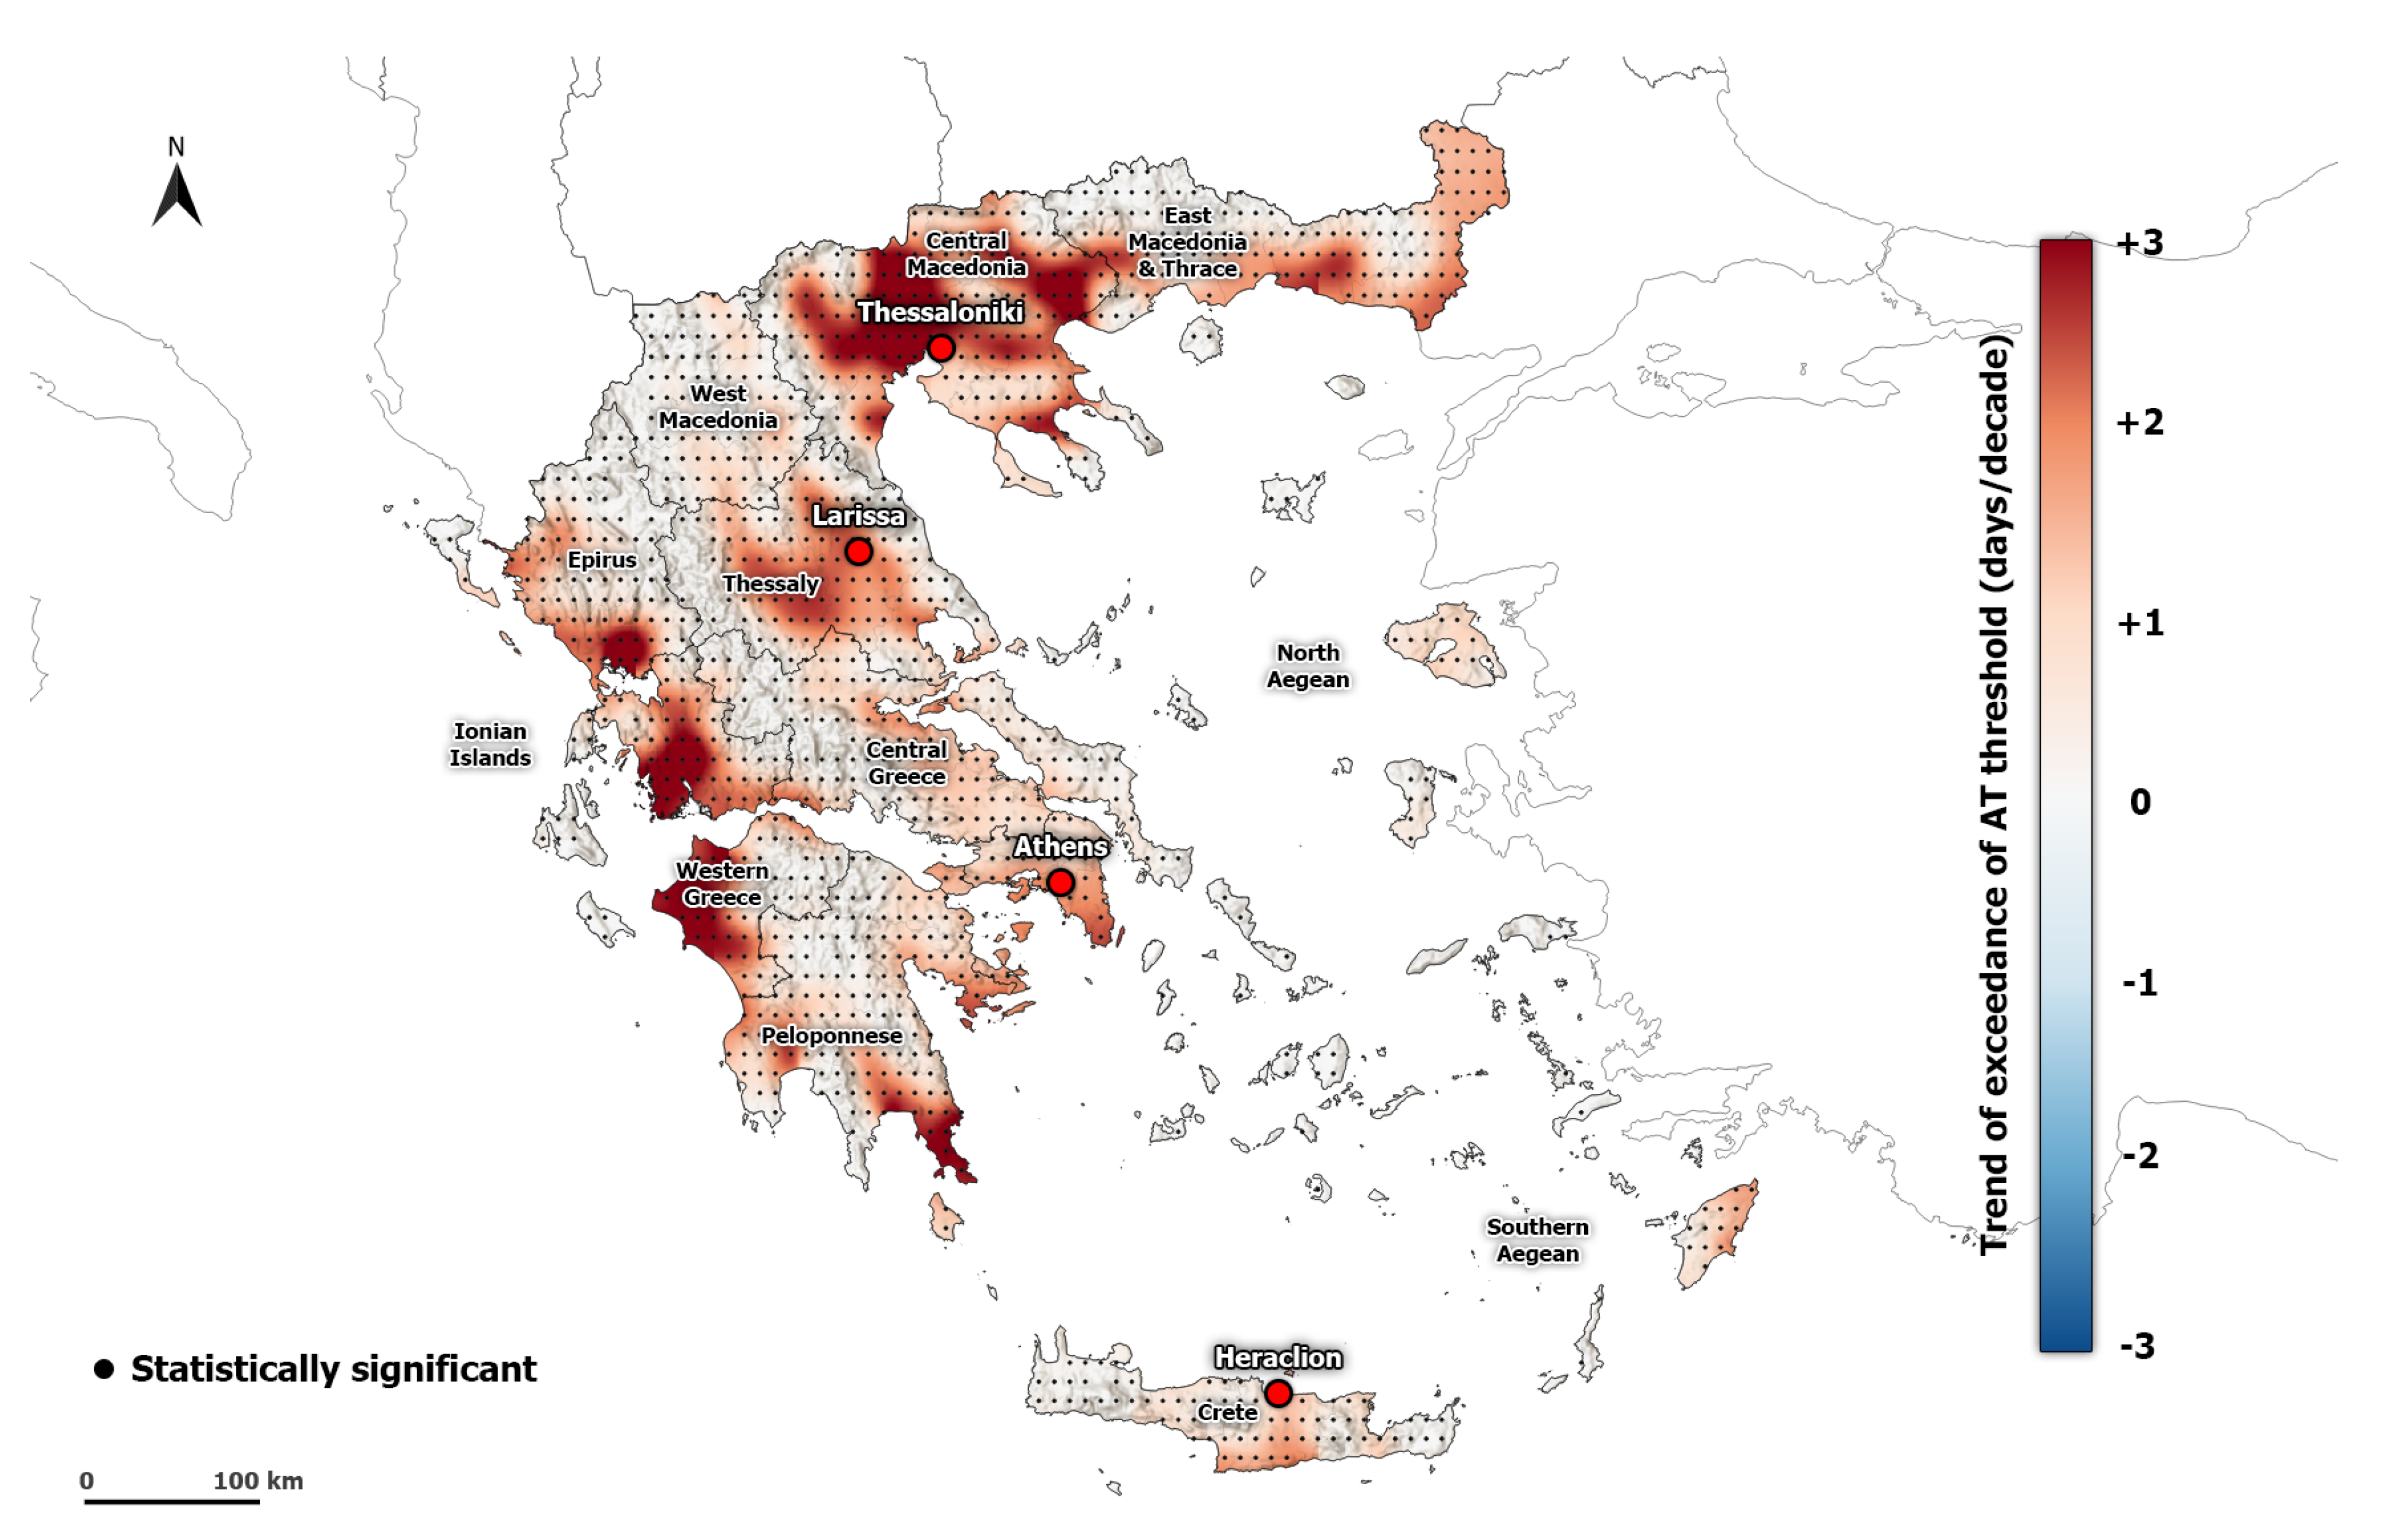
The spatial distribution of the trend of AT41C and CHT, in summer for the period 1950–2020, follows a similar pattern (Figure 9 and Figure S6). The values of both indices are slightly positive in the greater part of Greece. The hot spots are found in the areas of Central Macedonia, Thessaly, West Greece, and Attica, where trend values of CHT and AT41C reach 4.07 and 1.67 days per decade, respectively. The hot spot regions are in line with Giannaros et al. [67] who studied the trend of a thermal index (physiologically equivalent temperature) in the Euro-Mediterranean region for the period 1987 to 2016. Additionally, previous studies that have examined the temporal evolution of thermal stress with various indices, such as predicted mean vote index, physiologically equivalent temperature, heat index, and humidity index, in the area of Athens reported an increase in heat-related risk throughout the years and an increase of the heat stress levels in the recent decades [25,31,32,68]. This higher increasing trend in heat stress indices in the main cities is related to the changing characteristics of the urban environment throughout the years. Indeed, the size, shape, and higher population densities of a city can increase the need for energy consumption, and thus exacerbate the urban heat island effect and the associated high temperatures occurring during a heatwave event [69,70,71,72,73].
3.3. Geographical extend of areas affected by heatwaves
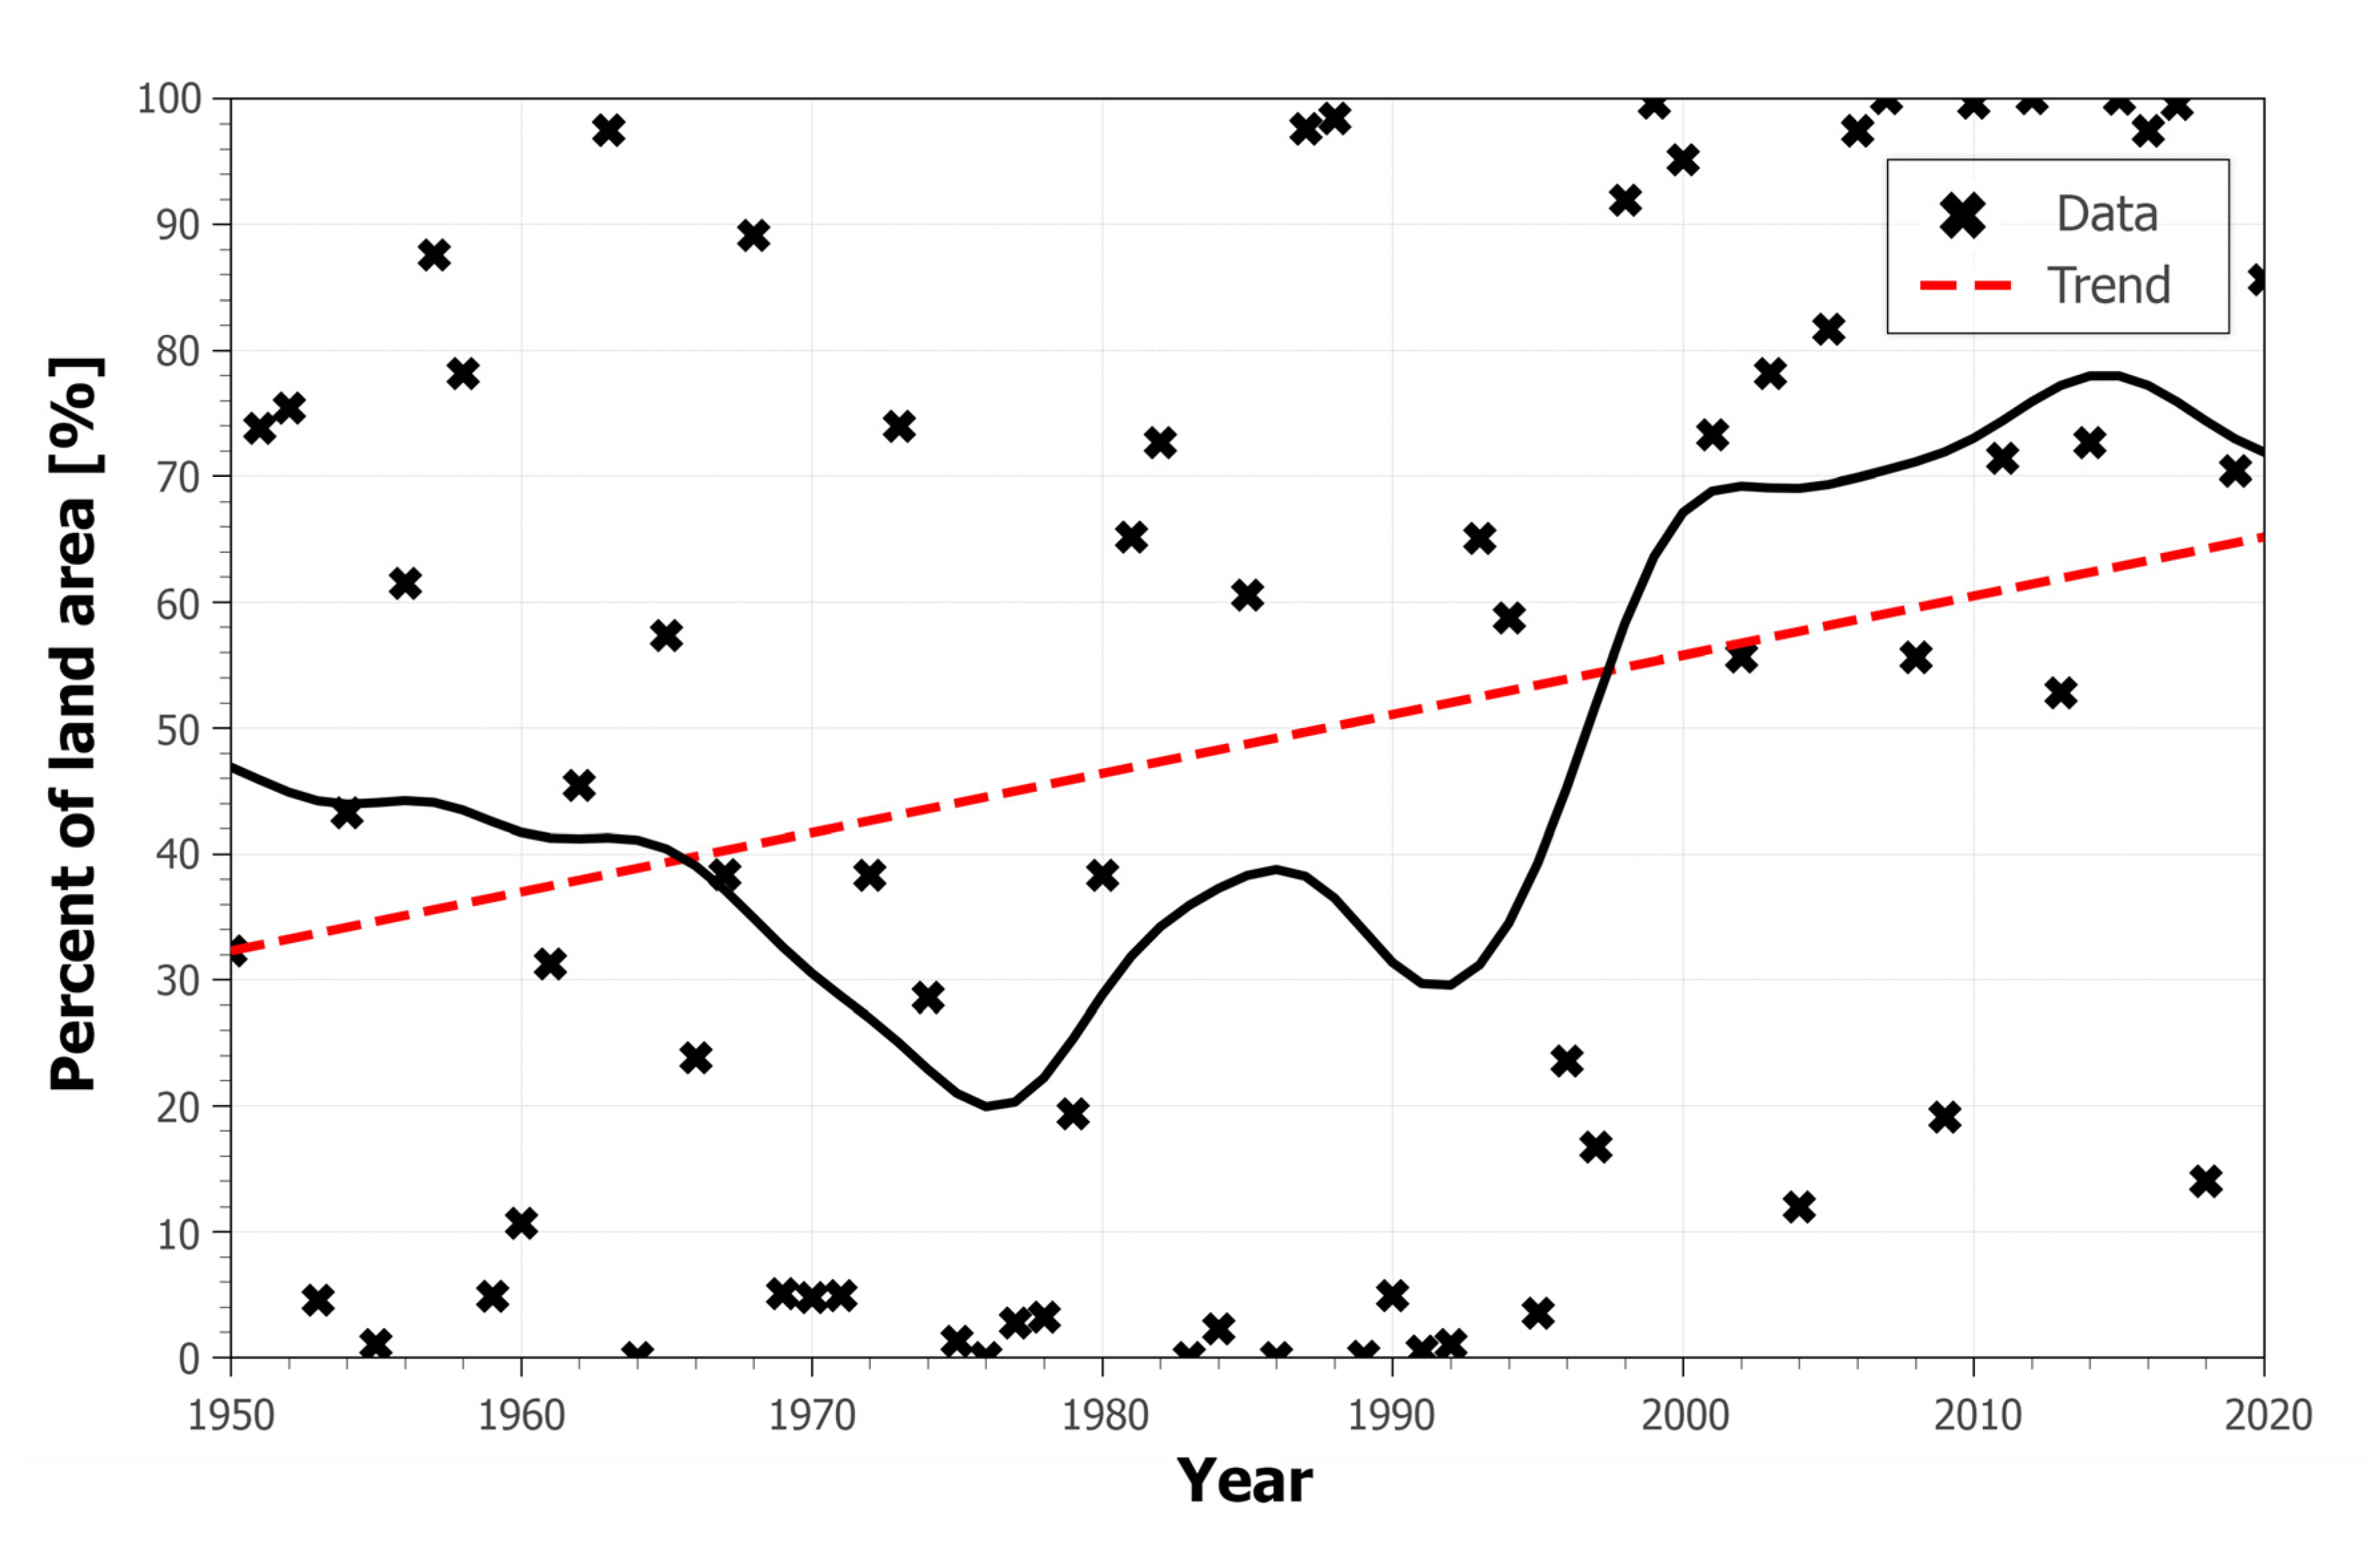
Figure 10 shows the percentage of the land area of Greece that experiences at least one heatwave per year (asterisks) along with a nine-year weighted average (thick black line) and the trend line. Thus, the percentage of land points where a heatwave occurred presents large fluctuations in the examined period, where it can reach up to 100% of the land points in precise years such as 1999, 2007, and 2012. Indeed, these years were associated with extreme temperature conditions. The year 1999 was related to a northward shift of the exit of the jet stream compared to its climatological location, resulting in large positive anomalies in temperature all through the summer months [30,59]. Summer 2007 was an abnormally warm summer for many areas of the Balkan Peninsula, where record-breaking temperatures have been observed [26,74,75,76,77]. It was associated with the dominance of strong anticyclonic conditions, an anomalous displacement of the axis of the jet stream, and a prolonged drought period [78]. It is estimated that the summer of 2007 has similarities with summers that will be occurring in the future in the Mediterranean area [26,78]. The year 2012 is considered one of the warmest years all over the world according to the World Meteorological Organization [26], where a high frequency of heat extremes occurred in Greece [77,78]. This was associated with consecutive heatwaves corresponding to +3 standard deviations in the daily maximum air temperature in Athens, compared to the reference period of 1971–2000 [24] and increased exposure time to excessive heat [68]. Furthermore, these years are related to the warmest types of the spatial synoptic classification, namely dry tropical and moist tropical [79], as is evident by the relevant data provided for Greek sites which are available online at http://sheridan.geog.kent.edu/ssc3.html (accessed on 10 December 2022).
Furthermore, it is noteworthy that the mean percent of land points that experience a heatwave was 37% before 1990, while it increased to 62% after it, which means that there is an expansion in the areas that experience unusually high temperatures after 1990. Indeed, the trend value of the percent of land points related to heatwaves is 4.7% per decade. This is consistent with studies in the increase of heatwave land coverage over the 20th century (e.g., [80,81,82]). Robinson et al. [80] showed that the land points experiencing heat extremes associated with three and four standard deviations above the climatological mean monthly temperature have showed an almost 90-fold and 1000-fold increase, respectively, over 2011−2020 compared to 1951−1980. Similar results were presented by Coumou and Robinson [81], who reported that moderate extreme events (i.e., 1- and 2-sigma events) can be detected in 40% and 15% of the global land surface (mainly concentrated in the Mediterranean area) over 2011−2020, compared to 1980 where they were first detected in only a few areas. Besides, Hansen et al. [82] found that extremely hot summers occurred in about 10% of the global land area, compared to less than 1% over the period 1951 to 1980. Furthermore, Zampieri et al. [83] found that the land area associated with moderate and extreme heatwave occurrence has almost tripled in the decade 2001–2010, compared to that computed in the beginning of the 20th century.
3.4. Monthly distribution of days meeting the heatwave criterion
Changes in the lengthening of the season of hot weather have recently received attention from the scientific community. Implications of these changes can have cascading effects, such as increase of cooling demand, increase of the high-risk fire period, and earlier onset and later closing of the touristic period, which must be taken into account by local authorities and stakeholders.
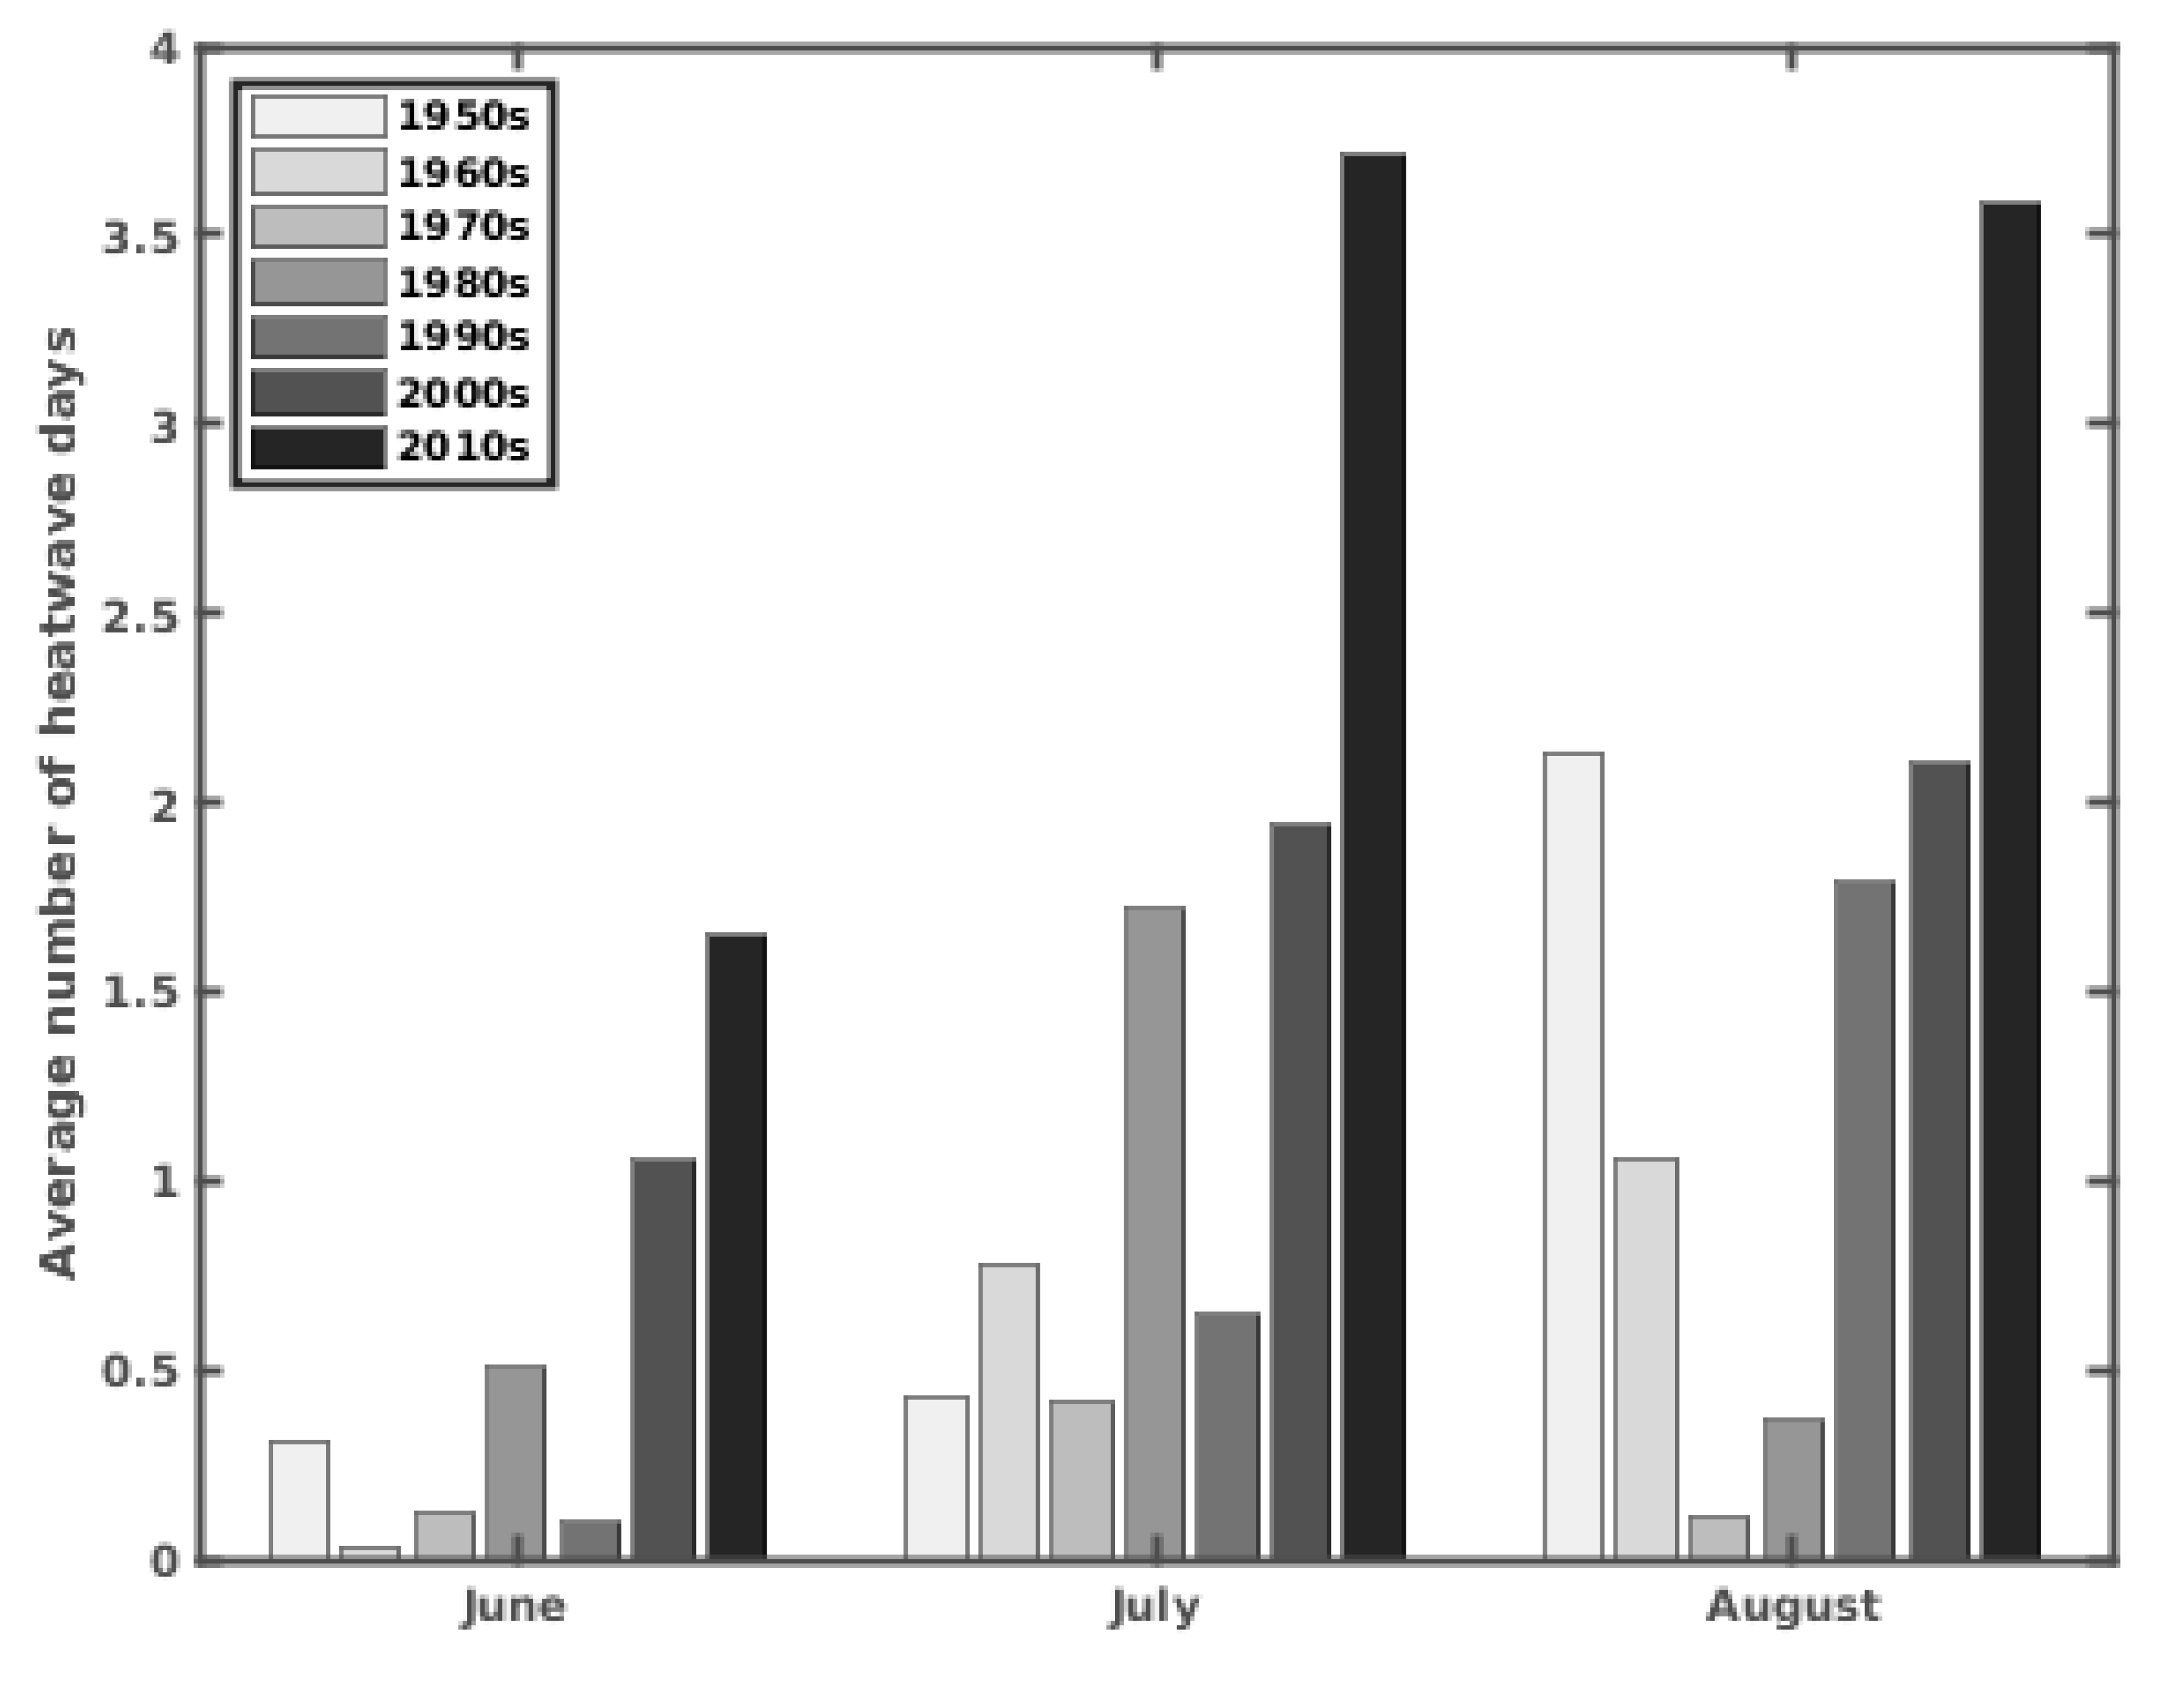
The average monthly variation of heatwave days (days that meet the heatwave criteria) per decade is shown in Figure 11. As shown, the heatwave days were observed mainly in July and August until the 2000s. In the last two decades the overall temporal occurrence of heatwaves has changed, as the number of heatwaves in June showed a prominent increase. This is associated with the expansion of the period of occurrence of heatwaves events, as a consequence of the earlier date shift of their first occurrence reported in previous studies (e.g., [28,33,84,85]). Indeed, Christidis et al. [85] found a noticeable increase in the growing season length from 1950 to 1999 on a global scale due to earlier onset, attributable to anthropogenic global warming. In addition, Founda et al. [33] reported a statistically significant trend in the lengthening of the season of very hot days (Tmax > 37 °C) in Athens (Greece) since the mid-1970s. Similar results were found by Papanastasiou et al. [28] who noticed that the heatwave days were spread across the whole summer over the period 1990A–2010 in Athens. Overall, a strong increasing trend of the heatwave days is noticed during all months, and the trend value reaches 0.25, 0.43 and 0.26 heatwave days per decade for June, July, and August, respectively. It is noteworthy that in the last decade an rapidly increasing trend in the average number of heatwave days in July and August occurred, where the average number in heatwave days almost doubled.
3.5. Analysis of heatwave characteristics in selected cities
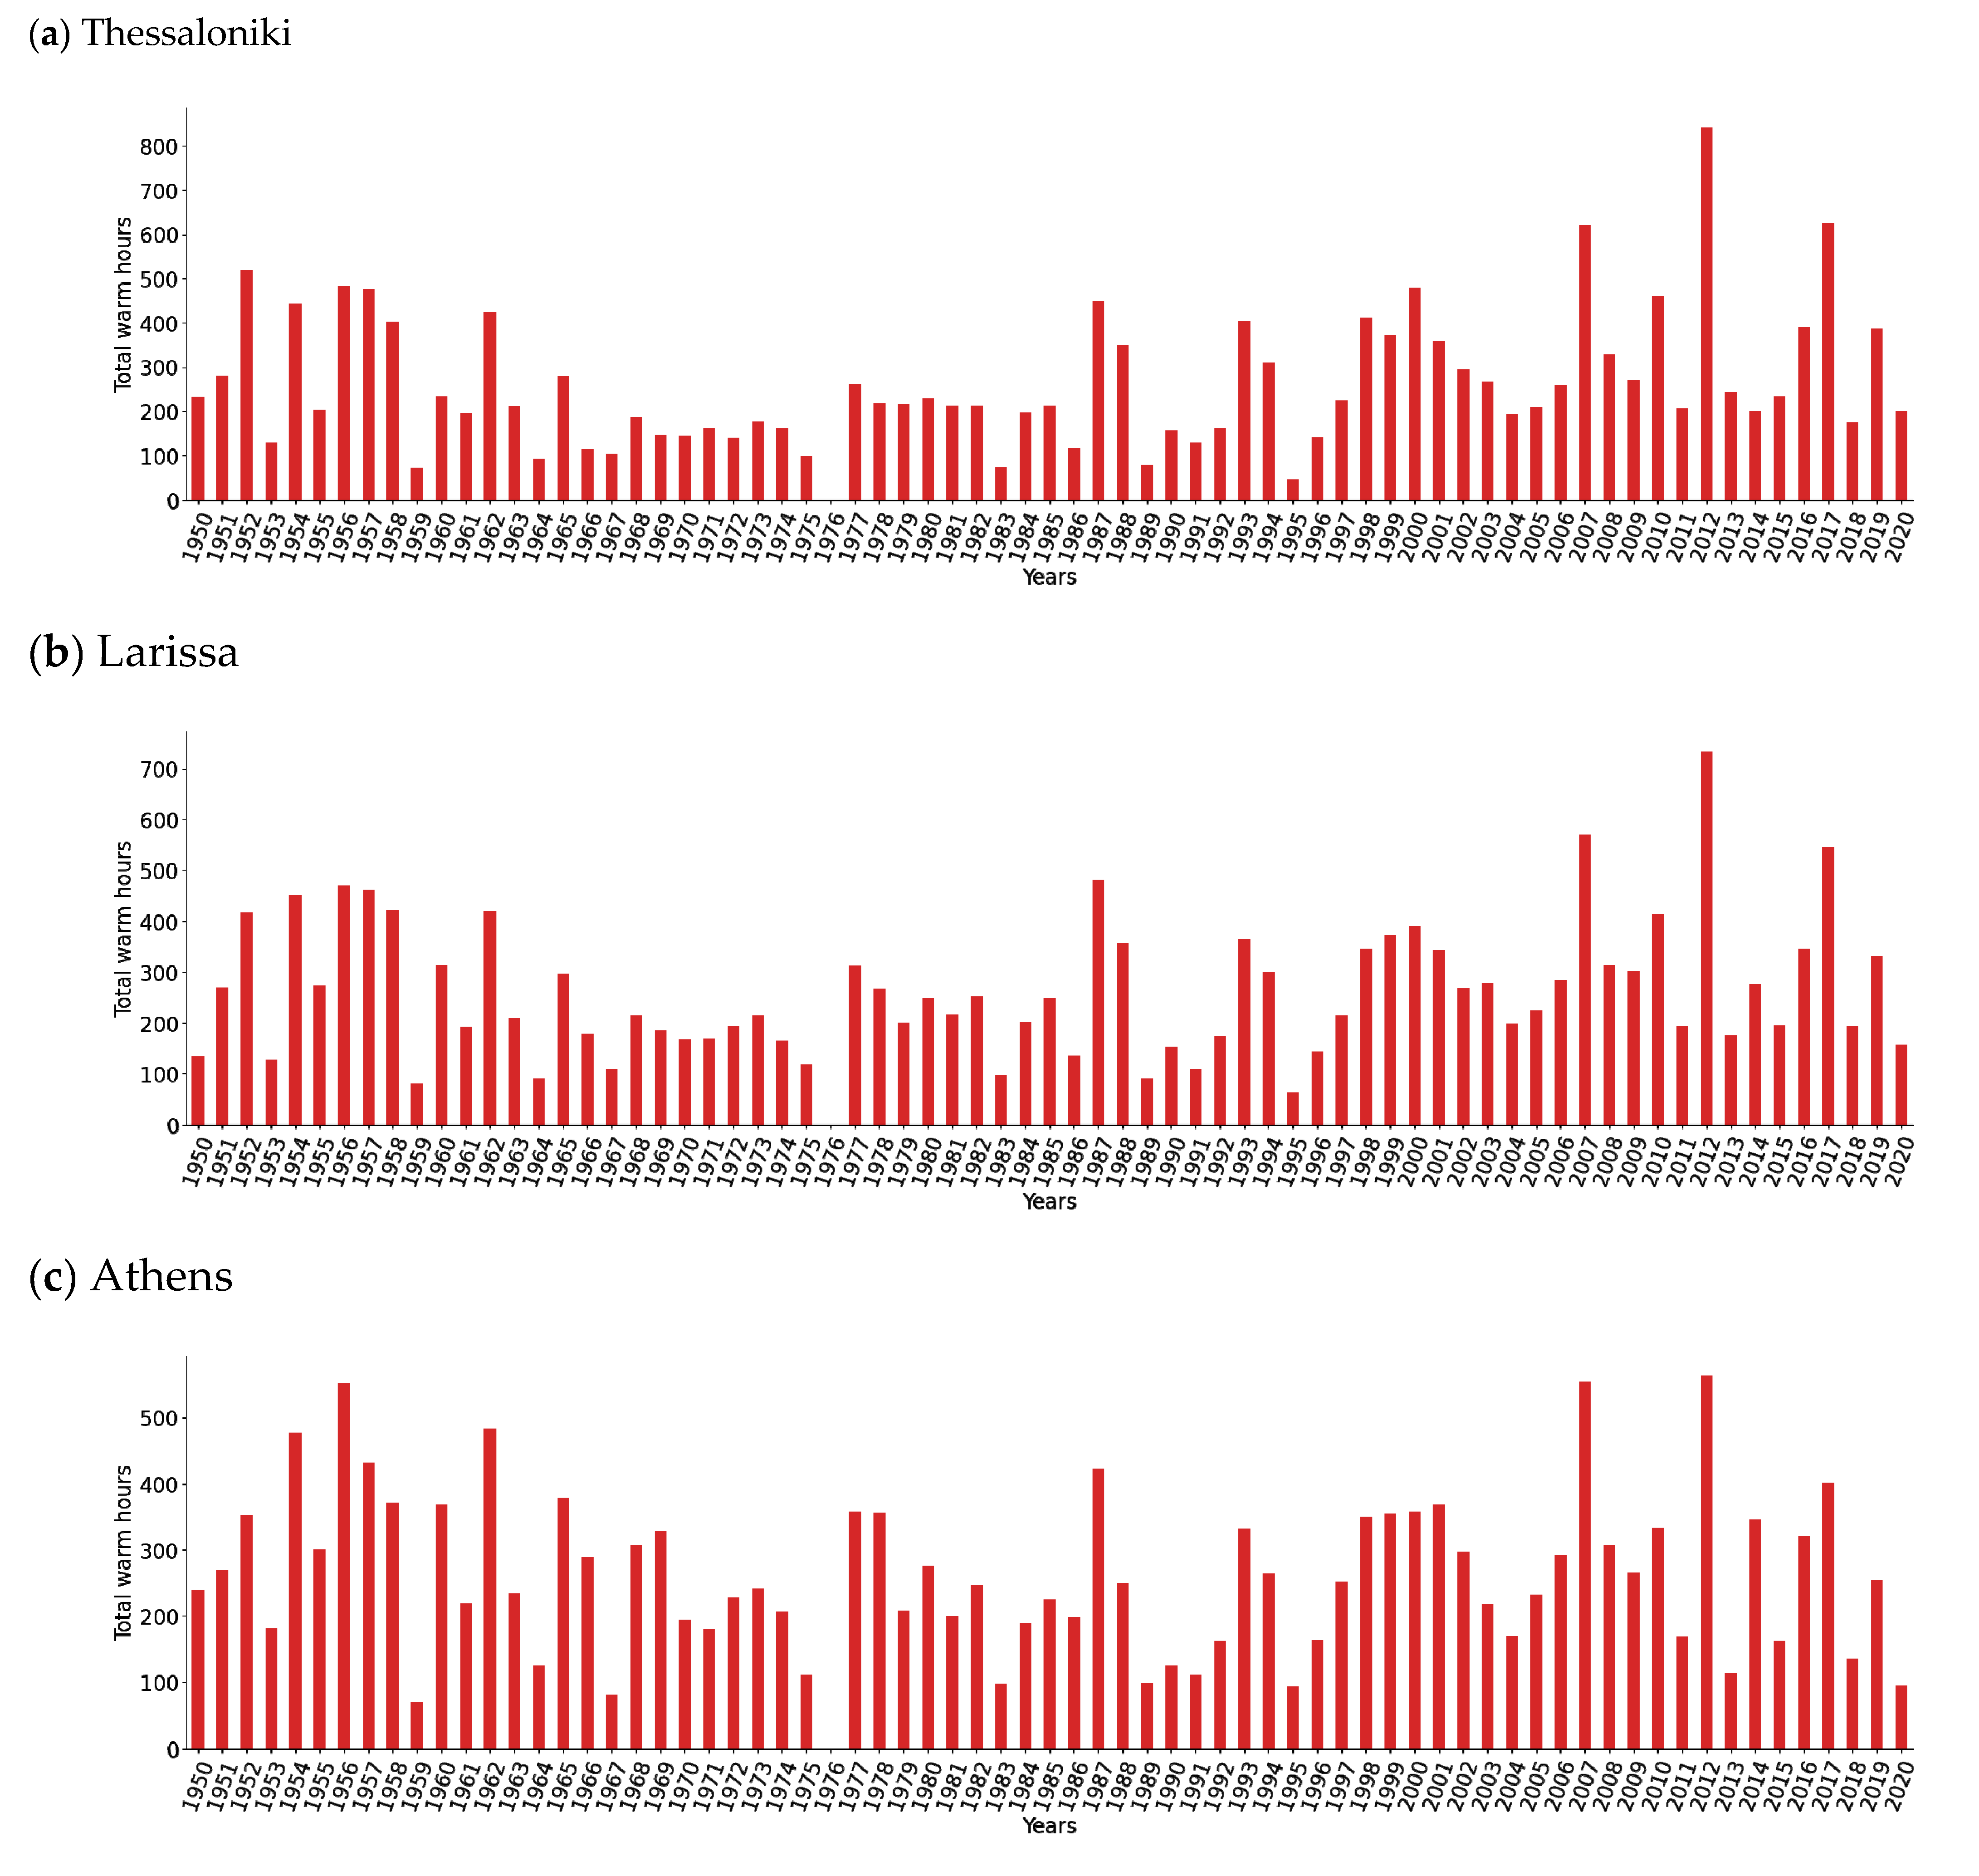
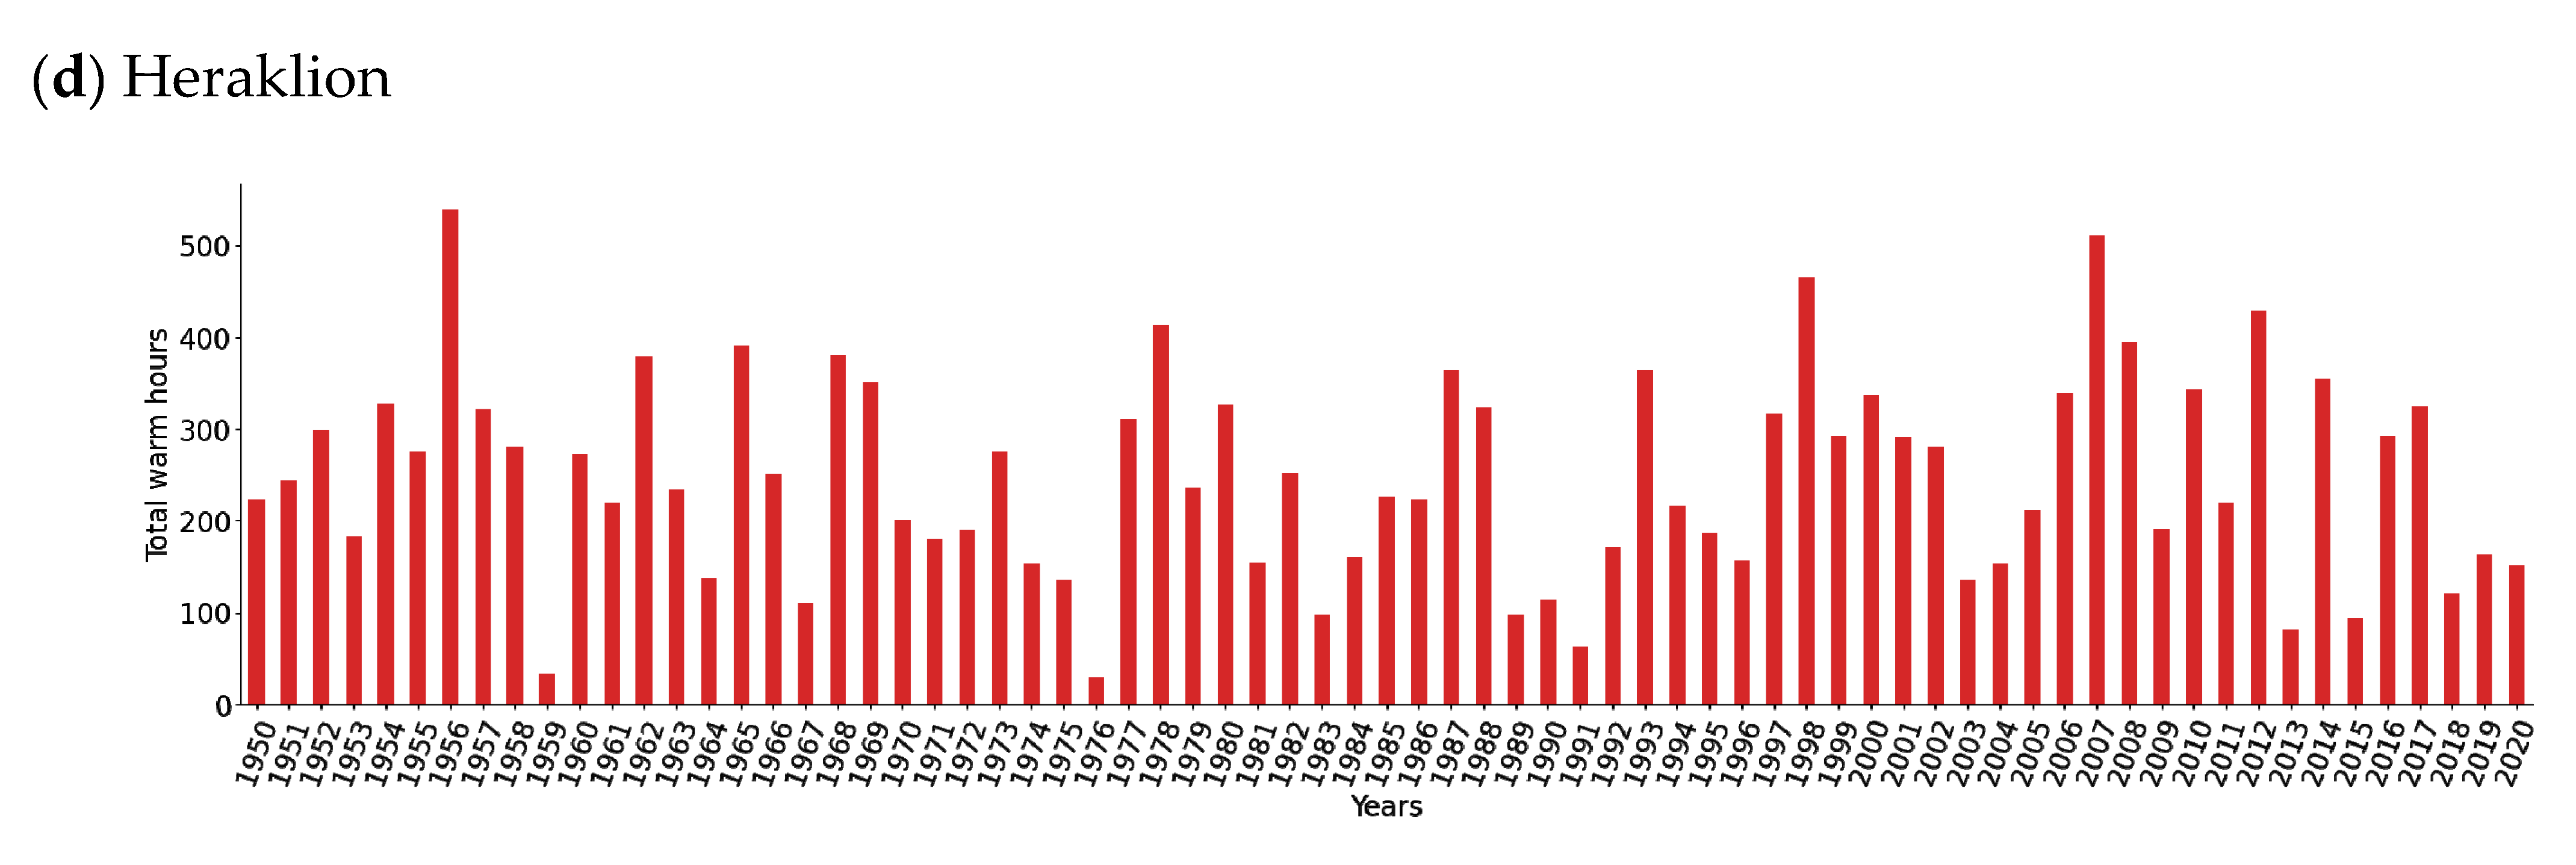
In this section, a temporal analysis of the heatwave characteristics is presented for four cities of Greece: Thessaloniki, Larissa, Athens, and Heraklion. Before, the study of heatwaves characteristics, we performed an analysis based on warm hours per year computed from ERA5 data. With precision, we assessed and ranked the warmest summer periods from a synoptic point of view, by applying a warm hour metric on hourly ERA5 reanalysis data during 1950-2020 and for the summer period (June-August). A warm hour was defined as the hour that the temperature at 850 hPa pressure level in a given location exceeds the 90th percentile of the multi-year climatology (to reduce the day-to-day variability we smooth the 90th percentile of the climatology by applying a gaussian filter).
In Thessaloniki (Northern continental Greece), we found that the hottest summer period was 2012 with more than 700 warm hours, followed by 2007 and 2017 with more than 500 warm hours (Figure 12a). Additionally, in Larissa (Central continental Greece) we found that 2012 was also the hottest summer period, with more than 650 warm hours followed by 2007 (Figure 12b). On the other hand, in Athens (Southern continental Greece), the hottest years were 1956, with more than 500 warm hours and 2007, with more than 450 warm hours (Figure 12c). Finally, in Heraklion (Southern Greece), the warmest year was 1956, with more than 500 warm hours followed by 2007, with more than 400 warm hours (Figure 12d). This analysis shows that high latitude areas experience longer temperature deviations compared to the southern parts of the country, even though the temperatures are not as high as in the south. These longer temperature extremes across the higher latitudes compared to the lower latitudes are primarily attributed to the meridional temperature differences in the 90th percentile of the multi-year climatology, with lower values in the north compared to the south. Thus, given the relatively homogeneous air masses that cover the country during a heatwave event, the exceedance of the local 90th percentile across the higher latitudes is longer compared to the lower latitudes.
Furthermore, it should be noted that despite the ranking differences, we are still able to identify the global warming footprint in this part of the globe, where apart from Heraklion, some of the hottest summer periods have been observed in the last 15 years.
3.5.1. Thessaloniki
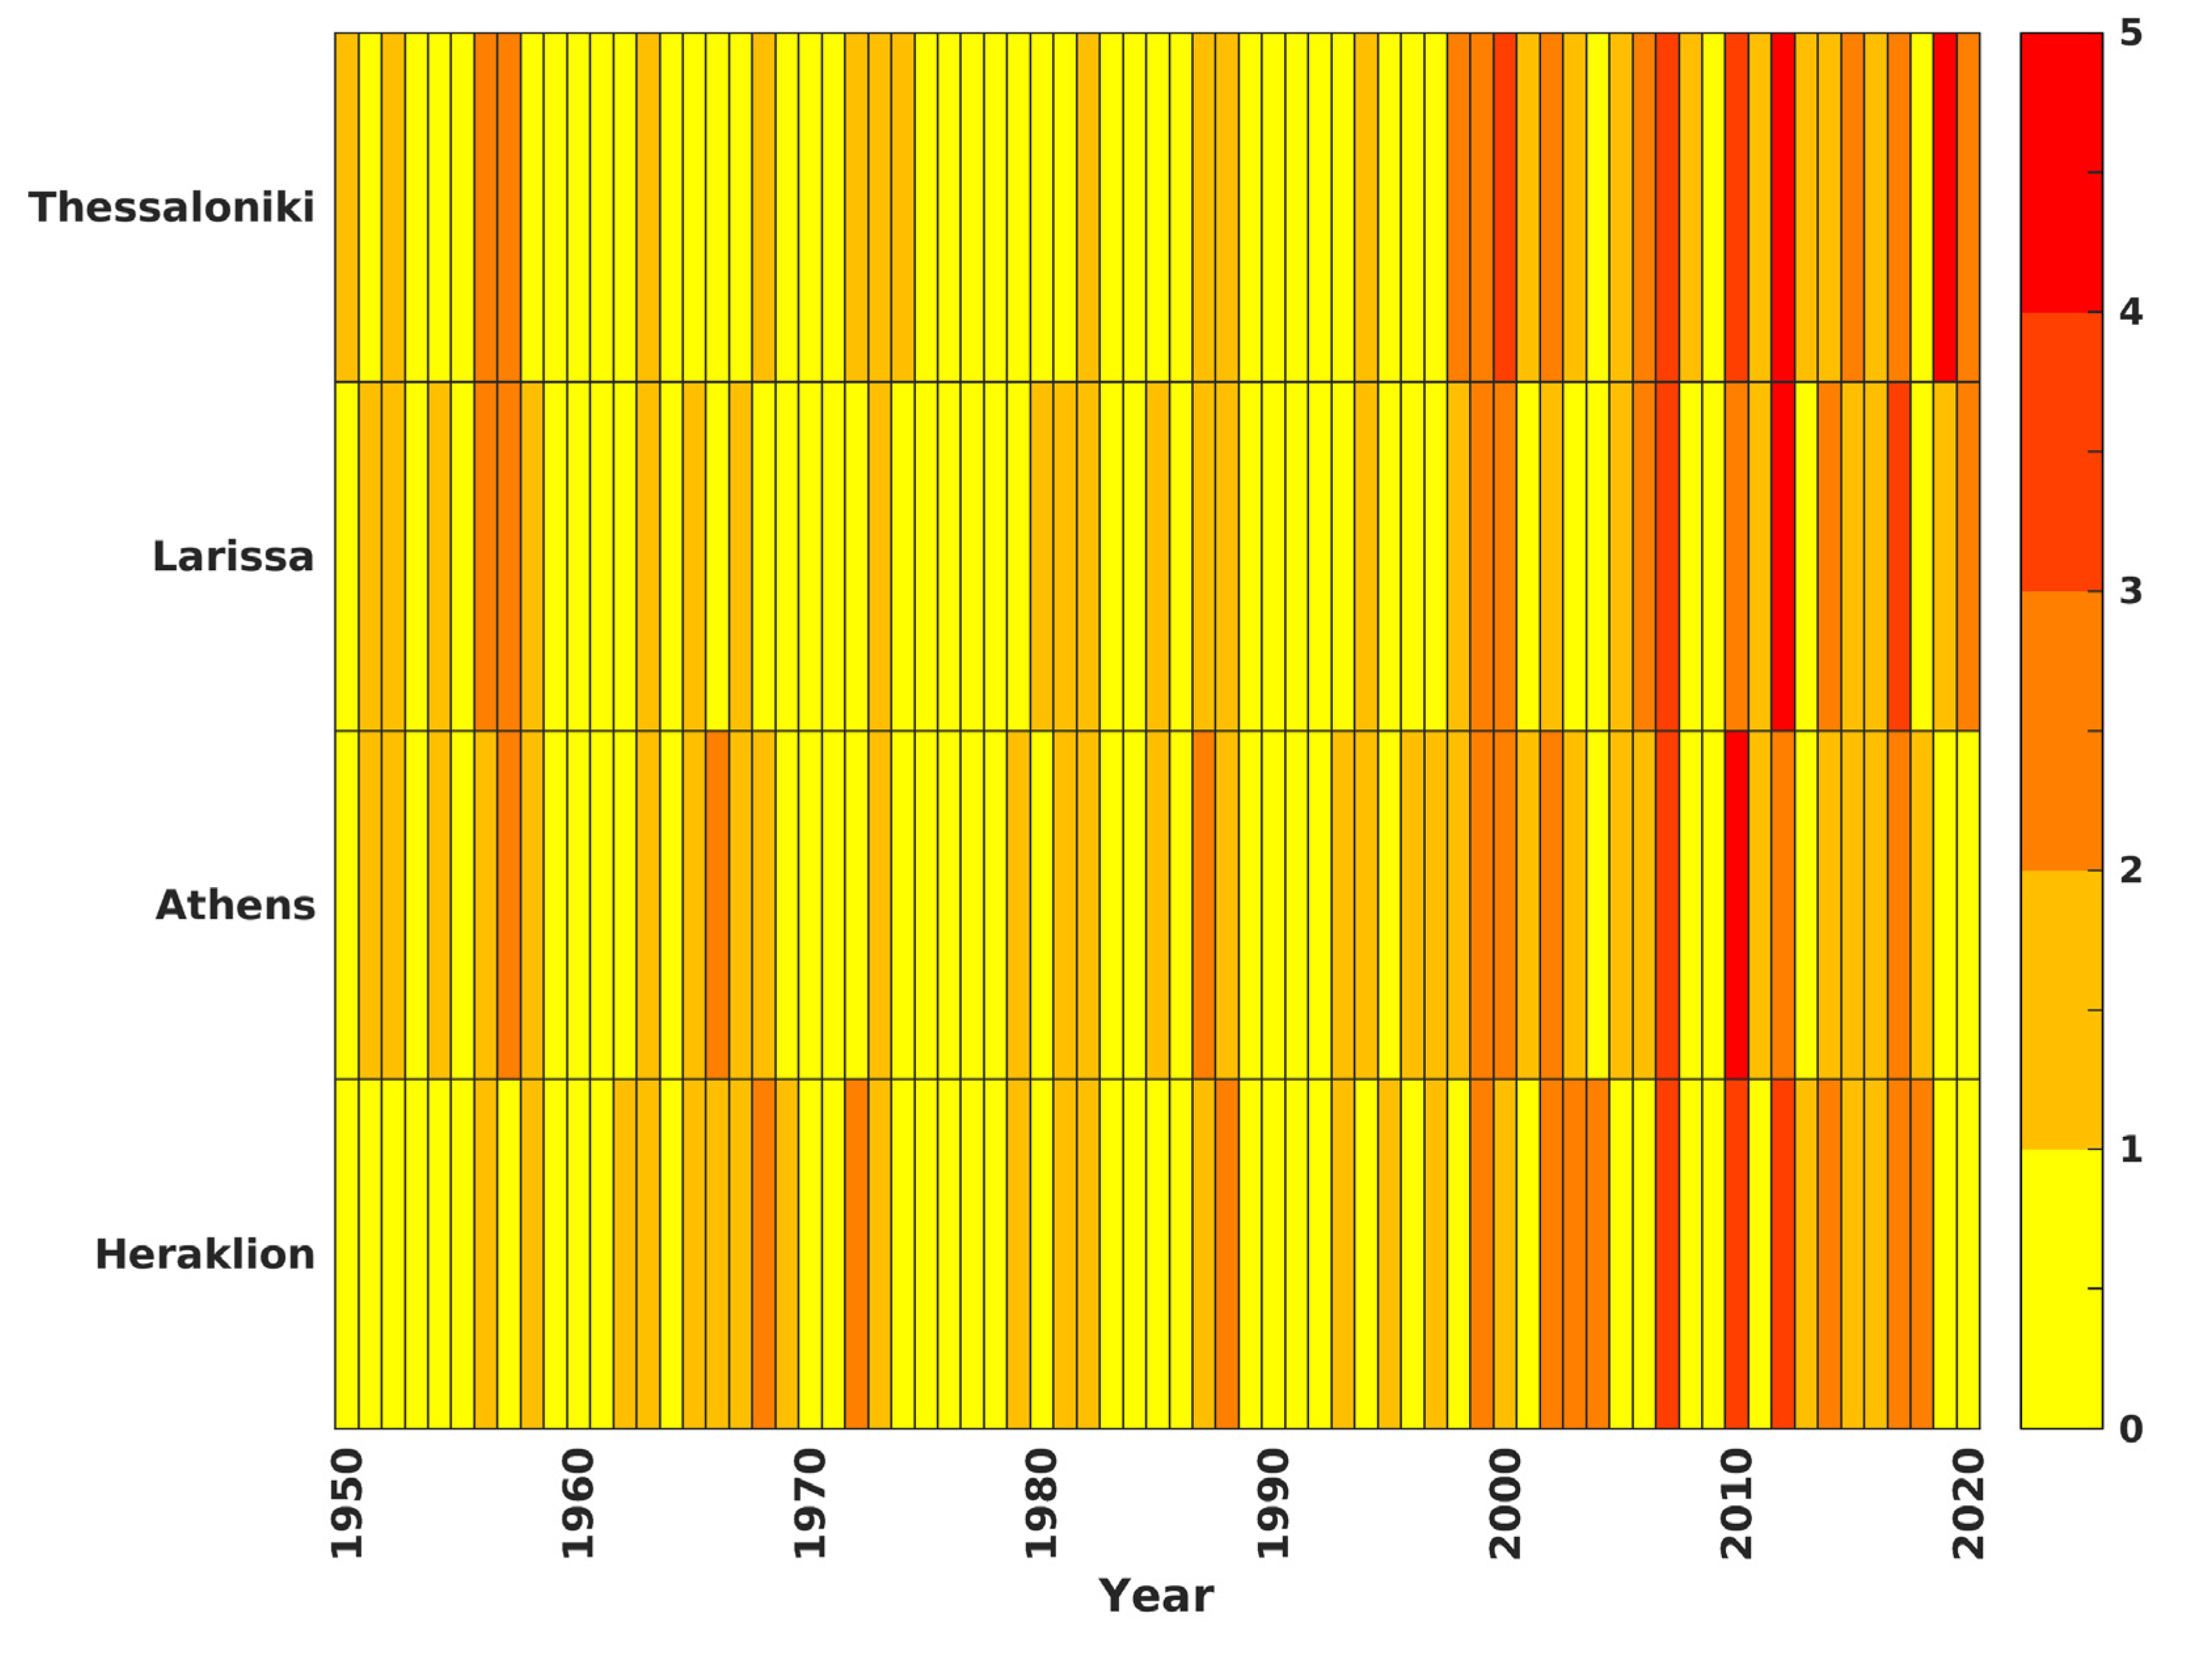
The city of Thessaloniki has experienced 56 heatwaves over the period 1950–2020, while 75% of them were observed during the period 1990-2020 (Figure 13). The average HWN is 0.76, while it has increased by 72% in the last three decades. The HWN presents a statistically significant increasing trend, with 0.3 heatwaves per decade and the maximum value occurring in 2012 (Figure 13). The study of the frequency of heatwave days per month showed that 23% occurred in June, 39% occurred in July and 38% occurred in August (not shown). The HWD also presents an increasing trend that is statistically significant (0.4 days per decade; Figure S7). The HWD ranges from 3 to 12 days, while the longest event occurred in 2017. The averaged HWI is related to a positive trend (1.56 oC2 per decade; Figure S8), whereas the three most intense events occurred in 1987, 1988 and 2016. Thessaloniki presents a higher number of ATC41C compared to other selected cities, with values reaching 65 days (Figure S9). The trend ATC41C is positive and statistically significant (3.8 days per decade). The 59% of heatwave days related to ATC41C occurred in the last three decades.
These findings confirm the previous study of Kuglitsch et al. [27] who showed increasing and statistically significant trends in the indices: heatwave intensity, heatwave number, and heatwave length (0-0.5 oC/decade, 0-0.5 days/decade, 0-0.1 days/decade), in the period 1960–2006. Our results are also in agreement with Tolika [26], who found a statistically positive trend in the EHF days (+0.58 days/year) over the period 1958–2012, and highlighted that the maximum number of positive EHF days was found for 2012.
3.5.2. Larissa
The total heatwaves events that occurred in Larissa was 46 throughout the period of study. The average HWN is 0.6 events per year, while 63% of them were observed during the period 1990-2020 (Figure 13). The HWN present an increasing trend (0.16 heatwaves per decade), which is statistically significant over the period 1950-2020 (Figure 13), while the year that the maximum values of the HWN occurred is 2012. The months associated with the larger number of heatwave days are July and August (~83% of the days; not shown). The averaged HWD ranges from 3 to 11 days (Figure S7). The most prolonged event lasted 11 days and occurred in 2012. The HWD are increasing by 0.18 days per decade. The most intense heatwave events occurred in 1987 and 1988, when the HWI reach up to ~227 oC2 (Figure S8). The AT41C present a high increasing trend (2.34 days per decade) throughout the period of study, while 53% of heatwave days occur from 1990 to 2020 (Figure S9). The AT41C ranges from 7 to 57 days. The averaged AT41C were by 31% higher than for Athens. The AT41C present a high increasing trend (2.34 days per decade) throughout the period of study, while 53% days occur from 1990 to 2020 (Figure S9).
It is noteworthy that these results are in accordance with Kuglitsch et al. [27] who found that the trends of heatwave intensity, heatwave number, and heatwave length are positive (0–0.5 oC/decade, 0–0.5 days/decade, 0-0.1 days/decade), although not statistically significant, over the period 1960-2006. In addition, Tolika [26] showed that there is a positive trend in the EHF days (+0.44 days/year; statistically significant) over the period 1958–2012. Besides, Tolika [26] also found that the maximum number of days associated with positive EHF values are in the year 2012.
3.5.3. Athens
For the area of Athens, 51 heatwaves were identified for the period 1950–2020, and 61% of the events occurred after 1990 (Figure 13). Thus, while the average number of heatwaves is 0.7 per year from 1950 to 2020, the average number of heatwaves is 1.1 and 1.3 heatwaves per year in the 2000s and 2010s, respectively. The increasing trend of the number of heatwaves is 0.1 heatwaves per decade (statistically significant), while it accelerated after 1990. The highest number of heatwaves was observed in 2007 and 2010 when three and four heatwave events occurred.
The frequency of heatwave days per month indicated that 18.5% occurred in June, 41.9% occurred in July and 39.6% occurred in August (not shown). The HWD ranged between 3 to 10 days, while only one heatwave was detected with a 10-day duration, followed by two and three heatwaves with a 9 and 8-day duration (Figure S7). The maximum decadal average HWD was observed in the 2010s with almost 6 days duration. The HWI ranged from 1.6 °C2 to 96.3 °C2 (Figure S8). The most intense heatwave was detected in 1987, while the second in 2007, both associated with prominent consequences to the population (e.g., [86,87,88]). It must be mentioned that 10 out of the 15 top ranked heatwaves based on HWI occurred after 1980. The overall trend of AT41C is 1.8 days per decade, whereas a small decrease is observed in the values of AT41C in the 1970s, while greater values occurred from 1990 and after (Figure S9).
These results are in accordance with previous studies that examined the heatwave occurrence in Greece (e.g., [23,25,28]). Indeed, Katavoutas and Founda [23] found 46 heatwave events from 1960 to 2017, with an average number of 0.8 HWs per year and HWD ranging from 3 to 11 days. They also pointed out that the HWF increased markedly after the mid-1980s. Papanastasiou et al. [28] pointed out that there is a prominent increase in the intensity, the duration, the number of heatwaves, and the daily maximum temperature since the 1990s in Athens, while the highest number of heatwave events for the analyzed period was observed in 2007. In addition, Founda and Giannakopoulos [78] reported a pronounced increase in HWF after 1998. Matzarakis and Nastos [25], using PET to identify heatwaves in Athens for the period 1955-2001, showed that the trends of the number and the maximum duration of heatwaves are 0.26 heatwaves per year and 1.33 days per year since 1983, respectively. Founda [29], reviewing scientific studies extending from the middle of the 19th century to 2010, concluded that the most intense heatwaves that occurred in Athens were those of the summer of 1987 and 2007.
3.5.4. Heraklion
The city of Heraklion has experienced 49 heatwaves over the period 1950-2020, and 61% of them occurred in the last three decades (Figure 13). Indeed, the average number of events per year was 0.5 before and 1 after 1990. The trend of HWN is 0.14 heatwaves per decade and is statistically significant throughout the period of study, while the years that the maximum values of HWN occurred are 2007, 2010 and 2012. The ~77% of the heatwave days occurred in July and August (not shown). The HWD presents a stable neutral trend, while the averaged HWD is 4.4 days (Figure S7). The longest event lasted 11 days and occurred in 2010. The average value of HWI is ~21 oC2, and while it presents a slightly decreasing trend, it is not statistically significant (Figure S8). The most intense heatwave in terms of HWI occurred in 1969. The temporal evolution of AT41C presents a significant increasing trend during the period of study (Figure S9). The 54% of days associated with AT41C occurred during the period 1990 to 2020.
The results are in agreement with Kuglitsch et al. [27], who reported a decreasing trend in heatwave intensity (not statistically significant) and increasing trends in the heatwave number and heatwave length (0–0.5 days/decade, 0–0.1 days/decade), although not statistically significant, over the period 1960-2006. In addition, Tolika [26] found an increasing trend in the days associated with positive EHF values (+0.41 days/year; statistically significant) for the period 1958 to 2012. The difference in the magnitude of the trend value between Tolika [26] and our study is related to the different definitions used in these two studies. Tolika [26] defined heatwaves as consecutive days of positive EHF values without taking into account a severity threshold [13]. In that way, the number of heatwave days is significantly greater per year.
4. Discussion and Concluding Remarks
In this paper, a climatological and trend analysis of heatwaves in Greece (18 E–29 E and 34 N–42 N) was performed. For this purpose, we analyzed the ERA5-Land reanalyzes dataset over the period 1950–2020, with an enhanced resolution of 0.1° × 0.1°. A heatwave was identified as a period of at least three consecutive days where a) the daily maximum temperature was above the 95th percentile of the climatological maximum daily temperature and b) the modified version of EHF was positive.
Analysis of the summer patterns of heatwaves over the area revealed that Greece experiences almost 0.7 heatwaves per summer from 1950 to 2020, which increased to 1.1 heatwaves per summer from 1990 to 2020. The duration of the detected heatwaves ranges from 3.7 to 7.5 days, while the HWI and the HWA can reach up to 56.2 °C2 and 35.7 °C, respectively. Furthermore, the trend analysis of the heatwaves revealed an overall positive trend for the period 1950 -2020 for all indices. The heatwave hot spots are located in Attica, in the west part of Central Greece, Central Thessaly, and in the west area of Eastern Macedonia and Thrace. It is worth mentioning that over the mountainous areas of Greece, heatwaves are more frequent but have lower intensities than over the other areas. The heatwaves associated with longest duration were found in Western Greece and the Ionian islands. The indices related to heat stress (CHT and AT41C) present higher values and increasing trends in areas where the main cities of Greece are located. These findings for Greece are in accordance with the results reported in other studies in Europe (e.g., [11,42,58,60]).
The analysis also showed that the surface of Greece that experiences at least one heatwave per year has almost doubled after 1990, in agreement with other studies focusing on the expansion of the spatial extend of the areas affected by heat extremes (e.g., [80,83]). Indeed, the mean percent of land points that experience a heatwave was 37% before 1990, while it increased to 62% after it. Besides the spatial expansion of the areas affected by heatwaves, an increasing trend in the number of heatwaves days that occurred in June was shown in Greece over the examined period.
In addition to addressing the heatwaves climatology and trends at a country level, a similar analysis was performed focusing on the four major cities of Greece in terms of population spanning from north to south of Greece, namely Thessaloniki, Larissa, Athens and Heraklion. The synoptic analysis of warm hours per year in ERA5 data for these four cities reveals meridional differences in both intensity and duration. It is noteworthy that during the most recent 30-year period (after 1990) the heatwave number per year is higher and ranges from 1.18 to 1.77. The months associated with the maximum number of heatwaves were July and August. It must be noted that the heatwave characteristics in the city of Heraklion are different from the general pattern observed in the rest of the cities (i.e., lower values in the number of heatwaves and in the number of summer days AT exceeding 41 °C, and decreasing trend in the highest mean AT per summer). This pattern may be attributed to the coastal location of the city. Indeed, Founda et al. [33] highlighted that coastal stations such as Heraklion did not present an earlier shift of the date of the first occurrence of hot days (days when daily maximum temperature exceeds 35 °C) compared to other examined stations.
The work presented here on conditions and characteristics of heatwaves is a necessary contribution to the next steps of the implementation of adaptation measures associated with heat-related health risks in Greece. Further research should focus to a thorough understanding in the exposure and vulnerability to heat. It has already been shown that high temperatures associated with heatwaves could lead to increased mortality in several European countries (e.g [8,14,22]). It is in the author’s prospects to build a successful heat warning system involving the human cost of extreme heat events in Greece, in order to reduce the risks of the associated socio-economic threats through the effective implementation of preparedness adaptation plans from local authorities.
Supplementary Materials
The following supporting information can be downloaded at: https://www.mdpi.com/article/10.3390/cli11010005/s1, Figure S1: Spatial distribution of averaged HWA (°C) based on all heatwave events calculated from ERA5-Land during the period 1950–2020; Figure S2: Spatial distribution of averaged HWN (heatwaves) based on all heatwave events calculated from ERA5-Land during the period 1950–2020; Figure S3: Spatial distribution of averaged CHT (days) based on all heatwave events calculated from ERA5-Land during the period 1950–2020; Figure S4: Spatial distribution of summer HWA trend (°C per decade) calculated from ERA5-Land during the period 1950–2020. Dots indicate significant trends at the 95% level; Figure S5: Spatial distribution of summer HWN trend (heatwaves per decade) calculated from ERA5-Land during the period 1950–2020. Dots indicate significant trends at the 95% level; Figure S6: Spatial distribution of summer CHT trend (days per decade) calculated from ERA5-Land during the period 1950–2020. Dots indicate significant trends at the 95% level; Figure S7. Temporal evolution of HWD (days) for selected cities calculated from ERA5-Land during the period 1950–2020 (circle marker), plotted together trend line (dashed line); Figure S8. Temporal evolution of HWI (°C2) for selected cities calculated from ERA5-Land during the period 1950–2020 (circle marker), plotted together trend line (dashed line); Figure S9. Heatmap of the temporal evolution of AT41C (days) for selected cities calculated from ERA5-Land during the period 1950–2020.
Author Contributions
Conceptualization, E.G., C.G., V.K., K.L. and G.P.; Data curation, E.G., C.G., V.K., K.L. and G.P.; Formal analysis, E.G. and C.G.; Investigation, E.G., C.G., V.K. and K.L.; Methodology, E.G., C.G., V.K., K.L. and G.P.; Project administration, V.K. and K.L.; Resources, V.K. and K.L.; Software, E.G., V.K. and K.L.; Supervision, V.K. and K.L.; Validation, E.G., C.G. and G.P.; Visualization, E.G. and G.P.; Writing—original draft, E.G., C.G. and G.P.; Writing—review & editing, E.G., C.G., V.K. and K.L. All authors have read and agreed to the published version of the manuscript. The authors confirm the copyright of the figures and tables in the manuscript.
Funding
This work has been co-funded by project EXCLIMATE-GR (Grant Agreement: G-2111-63060) financed by the European Climate Foundation. Also, it has been co-financed by the European Regional Development Fund of the European Union and Greek national funds through the Operational Program Competitiveness, Entrepreneurship and Innovation 2014-2020, under the call RESEARCH – CREATE – INNOVATE (Adapt2CC, project code: T2EDK- 02881).
Data Availability Statement
The raw ERA5-Land data required to reproduce these findings are available to download from https://cds.climate.copernicus.eu/ (accessed on 12 October 2021). The datasets generated during the current study are available from the corresponding author upon reasonable request.
Acknowledgments
We would like to thank George Kyros for assistance in the preparation of some figures. The results contain modified Copernicus Climate Change Service information 2021. Neither the European Commission nor ECMWF is responsible for any use that may be made of the Copernicus information or data it contains. Muñoz-Sabater et al. (2021) was downloaded from the Copernicus Climate Change Service (C3S) Climate Data Store.
Conflicts of Interest
The authors declare no conflict of interest.
References
- Muller, R.; Rohde, R.; Jacobsen, R.; Muller, E.; Wickham, C. A New Estimate of the Average Earth Surface Land Temperature Spanning 1753 to 2011. Geoinformatics Geostat. Overv. 2013, 1, 1–7. [Google Scholar] [CrossRef]
- Contribution of Working Groups I, II and III to the Fourth Assess-Ment Report of the Intergovernmental Panel on Climate Change. IPCC Climate Change 2007: Synthesis Report; IPCC: Geneva, Switzerland, 2007. [Google Scholar]
- Jacob, D.; Petersen, J.; Eggert, B.; Alias, A.; Christensen, O.B.; Bouwer, L.M.; Braun, A.; Colette, A.; Déqué, M.; Georgievski, G.; et al. EURO-CORDEX: New High-Resolution Climate Change Projections for European Impact Research. Reg. Environ. Chang. 2014, 14, 563–578. [Google Scholar] [CrossRef]
- Zittis, G.; Hadjinicolaou, P.; Almazroui, M.; Bucchignani, E.; Driouech, F.; El Rhaz, K.; Kurnaz, L.; Nikulin, G.; Ntoumos, A.; Ozturk, T.; et al. Business-as-Usual Will Lead to Super and Ultra-Extreme Heatwaves in the Middle East and North Africa. npj Clim. Atmos. Sci. 2021, 4, 20. [Google Scholar] [CrossRef]
- Fischer, E.M.; Schär, C. Consistent Geographical Patterns of Changes in High-Impact European Heatwaves. Nat. Geosci. 2010, 3, 398–403. [Google Scholar] [CrossRef]
- Meehl, G.; Tebaldi, C. More Intense, More Frequent, and Longer Lasting Heat Waves in the 21st Century. Science 2004, 305, 994–997. [Google Scholar] [CrossRef] [Green Version]
- Xu, Z.; FitzGerald, G.; Guo, Y.; Jalaludin, B.; Tong, S. Impact of Heatwave on Mortality under Different Heatwave Definitions: A Systematic Review and Meta-Analysis. Environ. Int. 2016, 89–90, 193–203. [Google Scholar] [CrossRef] [PubMed]
- D’Ippoliti, D.; Michelozzi, P.; Marino, C.; De’Donato, F.; Menne, B.; Katsouyanni, K.; Kirchmayer, U.; Analitis, A.; Medina-Ramón, M.; Paldy, A.; et al. The Impact of Heat Waves on Mortality in 9 European Cities: Results from the EuroHEAT Project. Environ. Health A Glob. Access Sci. Source 2010, 9, 37. [Google Scholar] [CrossRef] [Green Version]
- Zinzi, M.; Santamouris, M. Introducing Urban Overheating-Progress on Mitigation Science and Engineering Applications. Climate 2019, 7, 15. [Google Scholar] [CrossRef] [Green Version]
- Papanastasiou, D.K.; Melas, D.; Kambezidis, H.D. Air Quality and Thermal Comfort Levels under Extreme Hot Weather. Atmos. Res. 2015, 152, 4–13. [Google Scholar] [CrossRef]
- Lemonsu, A.; Viguié, V.; Daniel, M.; Masson, V. Vulnerability to Heat Waves: Impact of Urban Expansion Scenarios on Urban Heat Island and Heat Stress in Paris (France). Urban Clim. 2015, 14, 586–605. [Google Scholar] [CrossRef]
- Anderson, G.B.; Bell, M.L. Heat Waves in the United States: Mortality Risk during Heat Waves and Effect Modification by Heat Wave Characteristics in 43 U.S. Communities. Environ. Health Perspect. 2011, 119, 210–218. [Google Scholar] [CrossRef] [PubMed] [Green Version]
- Nairn, J.R.; Fawcett, R.J.B. The Excess Heat Factor: A Metric for Heatwave Intensity and Its Use in Classifying Heatwave Severity. Int. J. Environ. Res. Public Health 2014, 12, 227–253. [Google Scholar] [CrossRef] [Green Version]
- Royé, D.; Codesido, R.; Tobías, A.; Taracido, M. Heat Wave Intensity and Daily Mortality in Four of the Largest Cities of Spain. Environ. Res. 2020, 182, 109027. [Google Scholar] [CrossRef] [PubMed]
- Zander, K.K.; Botzen, W.J.W.; Oppermann, E.; Kjellstrom, T.; Garnett, S.T. Heat Stress Causes Substantial Labour Productivity Loss in Australia. Nat. Clim. Chang. 2015, 5, 647–651. [Google Scholar] [CrossRef]
- Guo, M.; Li, J.; Xu, J.; Wang, X.; He, H.; Wu, L. CO2 Emissions from the 2010 Russian Wildfires Using GOSAT Data. Environ. Pollut. 2017, 226, 60–68. [Google Scholar] [CrossRef] [PubMed]
- Giannaros, T.M.; Papavasileiou, G.; Lagouvardos, K.; Kotroni, V.; Dafis, S.; Karagiannidis, A.; Dragozi, E. Meteorological Analysis of the 2021 Extreme Wildfires in Greece: Lessons Learned and Implications for Early Warning of the Potential for Pyroconvection. Atmosphere 2022, 13, 475. [Google Scholar] [CrossRef]
- Cordner, S.M.; Woodford, N.; Bassed, R. Forensic Aspects of the 2009 Victorian Bushfires Disaster. Forensic Sci. Int. 2011, 205, 2–7. [Google Scholar] [CrossRef] [PubMed]
- Giorgi, F. Climate Change Hot-Spots. Geophys. Res. Lett. 2006, 33. [Google Scholar] [CrossRef]
- Seneviratne, S.I.; Donat, M.G.; Pitman, A.J.; Knutti, R.; Wilby, R.L. Allowable CO2 Emissions Based on Regional and Impact-Related Climate Targets. Nature 2016, 529, 477–483. [Google Scholar] [CrossRef] [Green Version]
- Lionello, P.; Scarascia, L. The Relation between Climate Change in the Mediterranean Region and Global Warming. Reg. Environ. Chang. 2018, 18, 1481–1493. [Google Scholar] [CrossRef]
- Baccini, M.; Biggeri, A.; Accetta, G.; Kosatsky, T.; Katsouyanni, K.; Analitis, A.; Anderson, H.R.; Bisanti, L.; D’Iippoliti, D.; Danova, J.; et al. Heat Effects on Mortality in 15 European Cities. Epidemiology 2008, 19, 711–719. [Google Scholar] [CrossRef] [PubMed]
- Katavoutas, G.; Founda, D. Response of Urban Heat Stress to Heatwaves in Athens (1960-2017). Atmosphere 2019, 10, 483. [Google Scholar] [CrossRef] [Green Version]
- Founda, D.; Santamouris, M. Synergies between Urban Heat Island and Heat Waves in Athens (Greece), during an Extremely Hot Summer (2012). Sci. Rep. 2017, 7, 10973. [Google Scholar] [CrossRef] [PubMed] [Green Version]
- Matzarakis, A.; Nastos, P.T. Human-Biometeorological Assessment of Heat Waves in Athens. Theor. Appl. Climatol. 2011, 105, 99–106. [Google Scholar] [CrossRef]
- Tolika, K. Assessing Heatwaves over Greece Using the Excess Heat Factor (EHF). Climate 2019, 7, 9. [Google Scholar] [CrossRef] [Green Version]
- Kuglitsch, F.G.; Toreti, A.; Xoplaki, E.; Della-Marta, P.M.; Zerefos, C.S.; Trke, M.; Luterbacher, J. Heat Wave Changes in the Eastern Mediterranean since 1960. Geophys. Res. Lett. 2010, 37. [Google Scholar] [CrossRef] [Green Version]
- Papanastasiou, D.K.; Melas, D.; Kambezidis, H.D. Heat Waves Characteristics and Their Relation to Air Quality in Athens. Glob. Nest J. 2014, 16, 919–928. [Google Scholar] [CrossRef] [Green Version]
- Founda, D. Evolution of the Air Temperature in Athens and Evidence of Climatic Change: A Review. Adv. Build. Energy Res. 2011, 5, 7–41. [Google Scholar] [CrossRef]
- Founda, D.; Papadopoulos, K.H.; Petrakis, M.; Giannakopoulos, C.; Good, P. Analysis of Mean, Maximum, and Minimum Temperature in Athens from 1897 to 2001 with Emphasis on the Last Decade: Trends, Warm Events, and Cold Events. Glob. Planet. Chang. 2004, 44, 27–38. [Google Scholar] [CrossRef]
- Bartzokas, A.; Lolis, C.J.; Kassomenos, P.A.; McGregor, G.R. Climatic Characteristics of Summer Human Thermal Discomfort in Athens and Its Connection to Atmospheric Circulation. Nat. Hazards Earth Syst. Sci. 2013, 13, 3271–3279. [Google Scholar] [CrossRef]
- Nastos, P.T.; Matzarakis, A. Human Bioclimatic Conditions, Trends, and Variability in the Athens University Campus, Greece. Adv. Meteorol. 2013, 2013, 976510. [Google Scholar] [CrossRef] [Green Version]
- Founda, D.; Varotsos, K.V.; Pierros, F.; Giannakopoulos, C. Observed and Projected Shifts in Hot Extremes’ Season in the Eastern Mediterranean. Glob. Planet. Chang. 2019, 175, 190–200. [Google Scholar] [CrossRef]
- Hersbach, H.; Bell, B.; Berrisford, P.; Hirahara, S.; Horányi, A.; Muñoz-Sabater, J.; Nicolas, J.; Peubey, C.; Radu, R.; Schepers, D.; et al. The ERA5 Global Reanalysis. Q. J. R. Meteorol. Soc. 2020, 146, 1999–2049. [Google Scholar] [CrossRef]
- Bonavita, M.; Hólm, E.; Isaksen, L.; Fisher, M. The Evolution of the ECMWF Hybrid Data Assimilation System. Q. J. R. Meteorol. Soc. 2016, 142, 287–303. [Google Scholar] [CrossRef]
- Muñoz Sabater, J. ERA5-Land Hourly Data from 1981 to Present. Copernicus Climate Change Service (C3S) Climate Data Store (CDS). Earth Syst. Sci. Data 2021, 13, 4349–4383. [Google Scholar]
- Boussetta, S.; Balsamo, G.; Beljaars, A.; Panareda, A.A.; Calvet, J.C.; Jacobs, C.; Van Den Hurk, B.; Viterbo, P.; Lafont, S.; Dutra, E.; et al. Natural Land Carbon Dioxide Exchanges in the ECMWF Integrated Forecasting System: Implementation and Offline Validation. J. Geophys. Res. Atmos. 2013, 118, 5923–5946. [Google Scholar] [CrossRef]
- Muñoz Sabater, J. ERA5-Land Hourly Data from 1950 to 1980.Copernicus Climate Change Service (C3S) Climate Data Store (CDS). Available online: 10.24381/cds.e2161bac (accessed on 12 October 2022).
- Smith, T.T.; Zaitchik, B.F.; Gohlke, J.M. Heat Waves in the United States: Definitions, Patterns and Trends. Clim. Chang. 2013, 118, 811–825. [Google Scholar] [CrossRef] [Green Version]
- Russo, S.; Sillmann, J.; Fischer, E.M. Top Ten European Heatwaves since 1950 and Their Occurrence in the Coming Decades. Environ. Res. Lett. 2015, 10, 124003. [Google Scholar] [CrossRef]
- Rennie, J.J.; Palecki, M.A.; Heuser, S.P.; Diamond, H.J. Developing and Validating Heat Exposure Products Using the U.S. Climate Reference Network. J. Appl. Meteorol. Climatol. 2021, 60, 543–558. [Google Scholar] [CrossRef]
- Morabito, M.; Crisci, A.; Messeri, A.; Messeri, G.; Betti, G.; Orlandini, S.; Raschi, A.; Maracchi, G. Increasing Heatwave Hazards in the Southeastern European Union Capitals. Atmosphere 2017, 8, 115. [Google Scholar] [CrossRef] [Green Version]
- Zittis, G.; Hadjinicolaou, P.; Fnais, M.; Lelieveld, J. Projected Changes in Heat Wave Characteristics in the Eastern Mediterranean and the Middle East. Reg. Environ. Chang. 2016, 16, 1863–1876. [Google Scholar] [CrossRef]
- Hamdi, Y.; Charron, C.; Ouarda, T.B.M.J. A Non-Stationary Heat Spell Frequency, Intensity, and Duration Model for France, Integrating Teleconnection Patterns and Climate Change. Atmosphere 2021, 12, 1387. [Google Scholar] [CrossRef]
- Giannaros, C.; Melas, D.; Giannaros, T.M. On the Short-Term Simulation of Heat Waves in the Southeast Mediterranean: Sensitivity of the WRF Model to Various Physics Schemes. Atmos. Res. 2019, 218, 99–116. [Google Scholar] [CrossRef]
- Piticar, A.; Cheval, S.; Frighenciu, M. A Review of Recent Studies on Heat Wave Definitions, Mechanisms, Changes, and Impact on Mortality. Forum Geogr. 2019, 18, 96–114. [Google Scholar] [CrossRef]
- Smid, M.; Russo, S.; Costa, A.C.; Granell, C.; Pebesma, E. Ranking European Capitals by Exposure to Heat Waves and Cold Waves. Urban Clim. 2019, 27, 388–402. [Google Scholar] [CrossRef]
- Pereira, S.C.; Marta-Almeida, M.; Carvalho, A.C.; Rocha, A. Heat Wave and Cold Spell Changes in Iberia for a Future Climate Scenario. Int. J. Climatol. 2017, 37, 5192–5205. [Google Scholar] [CrossRef] [Green Version]
- Langlois, N.; Herbst, J.; Mason, K.; Nairn, J.; Byard, R.W. Using the Excess Heat Factor (EHF) to Predict the Risk of Heat Related Deaths. J. Forensic Leg. Med. 2013, 20, 408–411. [Google Scholar] [CrossRef]
- Steadman, R. A Universal Scale of Apparent Temperature. J. Clim. Appl. Meteorol. 1984, 23, 1674–1687. [Google Scholar] [CrossRef]
- Alduchov, O.; Eskridge, R. Improved Magnus Form Approximation of Saturation Vapor Pressure. J. Appl. Meteorol. 1996, 35, 601–609. [Google Scholar] [CrossRef]
- Lee, D.; Brenner, T. Perceived Temperature in the Course of Climate Change: An Analysis of Global Heat Index from 1979 to 2013. Earth Syst. Sci. Data 2015, 7, 193–202. [Google Scholar] [CrossRef] [Green Version]
- Trancoso, R.; Syktus, J.; Toombs, N.; Ahrens, D.; Wong, K.K.H.; Pozza, R.D. Heatwaves Intensification in Australia: A Consistent Trajectory across Past, Present and Future. Sci. Total Environ. 2020, 742, 140521. [Google Scholar] [CrossRef] [PubMed]
- Overcenco, A.V.; Pantea, V. Public Health Management in R.Moldova in Conditions of EU Association View Project. J. Hyg. Public Health 2012, 62, 29–37. [Google Scholar]
- Theil, H. A Rank-Invariant Method of Linear and Polynomial Regression Analysis. In Henri Theil’s Contributions to Economics and Econometrics: Econometric Theory and Methodology; Raj, B., Koerts, J., Eds.; Springer Netherlands: Dordrecht, The Netherlands, 1992; pp. 345–381. ISBN 978-94-011-2546-8. [Google Scholar]
- Kendall, M.G. Rank Correlation Methods; Griffin: London, UK, 1975; ISBN1 0852641990. ISBN2 9780852641996. [Google Scholar]
- Flaounas, E.; Drobinski, P.; Vrac, M.; Bastin, S.; Lebeaupin-Brossier, C.; Stéfanon, M.; Borga, M.; Calvet, J.C. Precipitation and Temperature Space-Time Variability and Extremes in the Mediterranean Region: Evaluation of Dynamical and Statistical Downscaling Methods. Clim. Dyn. 2013, 40, 2687–2705. [Google Scholar] [CrossRef]
- Efthymiadis, D.; Goodess, C.M.; Jones, P.D. Trends in Mediterranean Gridded Temperature Extremes and Large-Scale Circulation Influences. Nat. Hazards Earth Syst. Sci. 2011, 11, 2199–2214. [Google Scholar] [CrossRef]
- Xoplaki, E.; González-Rouco, J.F.; Gyalistras, D.; Luterbacher, J.; Rickli, R.; Wanner, H. Interannual Summer Air Temperature Variability over Greece and Its Connection to the Large-Scale Atmospheric Circulation and Mediterranean SSTs 1950-1999. Clim. Dyn. 2003, 20, 537–554. [Google Scholar] [CrossRef]
- Croitoru, A.E.; Piticar, A.; Ciupertea, A.F.; Roşca, C.F. Changes in Heat Waves Indices in Romania over the Period 1961–2015. Glob. Planet. Chang. 2016, 146, 109–121. [Google Scholar] [CrossRef]
- Abbasnia, M.; Tavousi, T.; Khosravi, M.; Toros, H. Spatial-Temporal Analysis of Heat Waves in Iran over the Last Three Decades. Nat. Environ. Chang. 2016, 2, 25–33. [Google Scholar]
- Wibig, J. Heat Waves in Poland in the Period 1951-2015: Trends, Patterns and Driving Factors. Meteorol. Hydrol. Water Manag. 2018, 6, 37–45. [Google Scholar] [CrossRef]
- Lukasová, V.; Škvareninová, J.; Bičárová, S.; Sitárová, Z.; Hlavatá, H.; Borsányi, P.; Škvarenina, J. Regional and Altitudinal Aspects in Summer Heatwave Intensification in the Western Carpathians. Theor. Appl. Climatol. 2021, 146, 1111–1125. [Google Scholar] [CrossRef]
- Schatz, J.; Kucharik, C.J. Urban Climate Effects on Extreme Temperatures in Madison, Wisconsin, USA. Environ. Res. Lett. 2015, 10, 094024. [Google Scholar] [CrossRef] [Green Version]
- Gabriel, K.M.A.; Endlicher, W.R. Urban and Rural Mortality Rates during Heat Waves in Berlin and Brandenburg, Germany. Environ. Pollut. 2011, 159, 2044–2050. [Google Scholar] [CrossRef] [PubMed]
- Kostopoulou, E.; Giannakopoulos, C.; Hatzaki, M.; Karali, A.; Hadjinicolaou, P.; Lelieveld, J.; Lange, M.A. Spatio-Temporal Patterns of Recent and Future Climate Extremes in the Eastern Mediterranean and Middle East Region. Nat. Hazards Earth Syst. Sci. 2014, 14, 1565–1577. [Google Scholar] [CrossRef] [Green Version]
- Giannaros, T.M.; Kotroni, V.; Lagouvardos, K.; Matzarakis, A. Climatology and Trends of the Euro-Mediterranean Thermal Bioclimate. Int. J. Climatol. 2018, 38, 3290–3308. [Google Scholar] [CrossRef]
- Katavoutas, G.; Founda, D. Intensification of Thermal Risk in Mediterranean Climates: Evidence from the Comparison of Rational and Simple Indices. Int. J. Biometeorol. 2019, 63, 1251–1264. [Google Scholar] [CrossRef]
- Giannaros, C.; Nenes, A.; Giannaros, T.M.; Kourtidis, K.; Melas, D. A Comprehensive Approach for the Simulation of the Urban Heat Island Effect with the WRF/SLUCM Modeling System: The Case of Athens (Greece). Atmos. Res. 2018, 201, 86–101. [Google Scholar] [CrossRef]
- Li, D.; Bou-Zeid, E. Synergistic Interactions between Urban Heat Islands and Heat Waves: The Impact in Cities Is Larger than the Sum of Its Parts. J. Appl. Meteorol. Climatol. 2013, 52, 2051–2064. [Google Scholar] [CrossRef] [Green Version]
- Basara, J.B.; Basara, H.G.; Illston, B.G.; Crawford, K.C. The Impact of the Urban Heat Island during an Intense Heat Wave in Oklahoma City. Adv. Meteorol. 2010, 2010, 230365. [Google Scholar] [CrossRef] [Green Version]
- Hamin, E.M.; Gurran, N. Urban Form and Climate Change: Balancing Adaptation and Mitigation in the U.S. and Australia. Habitat Int. 2009, 33, 238–245. [Google Scholar] [CrossRef] [Green Version]
- Oke, T.R. City Size and the Urban Heat Island. Atmos. Environ. 1967, 7, 769–779. [Google Scholar] [CrossRef]
- Retalis, A.; Paronis, D.; Lagouvardos, K.; Kotroni, V. The Heat Wave of June 2007 in Athens, Greece—Part 1: Study of Satellite Derived Land Surface Temperature. Atmos. Res. 2010, 98, 458–467. [Google Scholar] [CrossRef]
- Kotroni, V.; Lagouvardos, K.; Retalis, A. The Heat Wave of June 2007 in Athens, Greece—Part 2: Modeling Study and Sensitivity Experiments. Atmos. Res. 2011, 100, 1–11. [Google Scholar] [CrossRef]
- Emmanouil, G.; Vlachogiannis, D.; Sfetsos, A. Exploring the Ability of the WRF-ARW Atmospheric Model to Simulate Different Meteorological Conditions in Greece. Atmos. Res. 2021, 247, 105226. [Google Scholar] [CrossRef]
- Theoharatos, G.; Pantavou, K.; Mavrakis, A.; Spanou, A.; Katavoutas, G.; Efstathiou, P.; Mpekas, P.; Asimakopoulos, D. Heat Waves Observed in 2007 in Athens, Greece: Synoptic Conditions, Bioclimatological Assessment, Air Quality Levels and Health Effects. Environ. Res. 2010, 110, 152–161. [Google Scholar] [CrossRef] [PubMed]
- Founda, D.; Giannakopoulos, C. The Exceptionally Hot Summer of 2007 in Athens, Greece—A Typical Summer in the Future Climate? Glob. Planet. Chang. 2009, 67, 227–236. [Google Scholar] [CrossRef]
- Sheridan, S.C.; Kalkstein, L.S. Progress in Heat Watch-Warning System Technology. Bull. Am. Meteorol. Soc. 2004, 85, 1931–1941. [Google Scholar] [CrossRef]
- Robinson, A.; Lehmann, J.; Barriopedro, D.; Rahmstorf, S.; Coumou, D. Increasing Heat and Rainfall Extremes Now Far Outside the Historical Climate. npj Clim. Atmos. Sci. 2021, 4, 45. [Google Scholar] [CrossRef]
- Coumou, D.; Robinson, A. Historic and Future Increase in the Global Land Area Affected by Monthly Heat Extremes. Environ. Res. Lett. 2013, 8, 034018. [Google Scholar] [CrossRef]
- Hansen, J.; Sato, M.; Ruedy, R. Perception of Climate Change. Earth Atmos. Planet. Sci. 2012, 109, 14726. [Google Scholar] [CrossRef] [Green Version]
- Zampieri, M.; Russo, S.; di Sabatino, S.; Michetti, M.; Scoccimarro, E.; Gualdi, S. Global Assessment of Heat Wave Magnitudes from 1901 to 2010 and Implications for the River Discharge of the Alps. Sci. Total Environ. 2016, 571, 1330–1339. [Google Scholar] [CrossRef]
- Wibig, J. Hot Days and Heat Waves in Poland in the Period 1951-2019 and the Circulation Factors Favoring the Most Extreme of Them. Atmosphere 2021, 12, 340. [Google Scholar] [CrossRef]
- Christidis, N.; Stott, P.A.; Brown, S.; Karoly, D.J.; Caesar, J. Human Contribution to the Lengthening of the Growing Season during 1950-99. J. Clim. 2007, 20, 5441–5454. [Google Scholar] [CrossRef]
- Katavoutas, G.; Theoharatos, G.; Flocas, H.A.; Asimakopoulos, D.N. Measuring the Effects of Heat Wave Episodes on the Human Body’s Thermal Balance. Int. J. Biometeorol. 2009, 53, 177–187. [Google Scholar] [CrossRef] [PubMed]
- Tolika, K.; Maheras, P.; Tegoulias, I. Extreme Temperatures in Greece during 2007: Could This Be a “Return to the Future”? Geophys. Res. Lett. 2009, 36, 1–5. [Google Scholar] [CrossRef]
- Matzarakis, A.; Mayer, H. The Extreme Heat Wave in Athens in July 1987 from the Point of View of Human Biometeorology. Atmos. Environ. Part B Urban Atmos. 1991, 25, 203–211. [Google Scholar] [CrossRef]
Figure 1.
Elevation map of the study area along with the divisions of Greece.

Figure 2.
Spatial distribution of averaged HWI (°C2) based on all heatwave events calculated from ERA5-Land during the period 1950–2020.
Figure 2.
Spatial distribution of averaged HWI (°C2) based on all heatwave events calculated from ERA5-Land during the period 1950–2020.


Figure 3.
Spatial distribution of averaged HWF (%) based on all heatwave events calculated from ERA5-Land during the period 1950–2020.
Figure 3.
Spatial distribution of averaged HWF (%) based on all heatwave events calculated from ERA5-Land during the period 1950–2020.

Figure 4.
Spatial distribution of averaged HWD (days) based on all heatwave events calculated from ERA5-Land during the period 1950–2020.
Figure 4.
Spatial distribution of averaged HWD (days) based on all heatwave events calculated from ERA5-Land during the period 1950–2020.

Figure 5.
Spatial distribution of averaged AT41C (days) based on all heatwave events calculated from ERA5-Land during the period 1950–2020.
Figure 5.
Spatial distribution of averaged AT41C (days) based on all heatwave events calculated from ERA5-Land during the period 1950–2020.

Figure 6.
Spatial distribution of summer HWI trend (°C2 per decade) calculated from ERA5-Land during the period 1950–2020. Dots indicate significant trends at the 95% level.
Figure 6.
Spatial distribution of summer HWI trend (°C2 per decade) calculated from ERA5-Land during the period 1950–2020. Dots indicate significant trends at the 95% level.

Figure 7.
Spatial distribution of summer HWF trend (% per decade) calculated from ERA5-Land during the period 1950–2020. Dots indicate significant trends at the 95% level.
Figure 7.
Spatial distribution of summer HWF trend (% per decade) calculated from ERA5-Land during the period 1950–2020. Dots indicate significant trends at the 95% level.

Figure 8.
Spatial distribution of summer HWD trend (days per decade) calculated from ERA5-Land during the period 1950–2020. Dots indicate significant trends at the 95% level.
Figure 8.
Spatial distribution of summer HWD trend (days per decade) calculated from ERA5-Land during the period 1950–2020. Dots indicate significant trends at the 95% level.

Figure 9.
Spatial distribution of summer AT41C trend (days per decade) calculated from ERA5-Land during the period 1950–2020. Dots indicate significant trends at the 95% level.
Figure 9.
Spatial distribution of summer AT41C trend (days per decade) calculated from ERA5-Land during the period 1950–2020. Dots indicate significant trends at the 95% level.

Figure 10.
The annual values of the percent of land area of Greece that experiences at least one heatwave per year (black star) calculated from ERA5-Land during the period 1950–2020, plotted together with a 9-year Gaussian low-pass filter (black thick line) and trend line calculated at the 95% significant level (red line).

Figure 11.
Average numbers of summer heatwave days per decade for Greece calculated from ERA5-Land during the period 1950–2020.
Figure 11.
Average numbers of summer heatwave days per decade for Greece calculated from ERA5-Land during the period 1950–2020.

Figure 12.
Temporal evolution of warm hours per year calculated from ERA5 (850-hPa temperature) during the period 1950–2020 for four selected cities (a) Thessaloniki, (b) Larissa, (c) Athens, (d) Heraklion.
Figure 12.
Temporal evolution of warm hours per year calculated from ERA5 (850-hPa temperature) during the period 1950–2020 for four selected cities (a) Thessaloniki, (b) Larissa, (c) Athens, (d) Heraklion.


Figure 13.
Heatmap of the temporal evolution of HWN (heatwaves) for selected cities calculated from ERA5-Land during the period 1950–2020. The color bar indicates the number of heatwaves per year.
Figure 13.
Heatmap of the temporal evolution of HWN (heatwaves) for selected cities calculated from ERA5-Land during the period 1950–2020. The color bar indicates the number of heatwaves per year.


Table 1.
Definition of heatwave indices.
| Index | Abbreviation | Definition | Unit |
|---|---|---|---|
| Heatwave intensity | HWI | Sum of EHF on heatwave days | °C2 |
| Heatwave peak temperature | HWA | Highest mean AT per summer | °C |
| Heatwave day frequency | HWF | Number of days meeting the heatwave criterion relative to the number of days in a year | % |
| Heatwave number | HWN | Number of heatwaves per summer | heatwaves |
| Heatwave duration | HWD | Duration of the longest heatwave per summer | days |
| Combined hot days and tropical nights | CHT | Number of summer days with Tmax exceeding 35°C and Tmin exceeding 25°C | days |
| Exceedance of AT threshold | AT41C | Number of summer days AT exceeding 41°C | days |
Table 2.
Trends and R2 over Greece for the period 1950-2020. Bold values indicate significance at the 95% confidence level.
Table 2.
Trends and R2 over Greece for the period 1950-2020. Bold values indicate significance at the 95% confidence level.
| Index | Trend value | R2 |
|---|---|---|
| HWI | 0.16 °C2 per decade | 0.69 |
| HWN | 0.28 days per decade | 0.61 |
| HWD | 0.26 % per decade | 0.62 |
| AT41C | 1.03 days per decade | 0.54 |
Disclaimer/Publisher’s Note: The statements, opinions and data contained in all publications are solely those of the individual author(s) and contributor(s) and not of MDPI and/or the editor(s). MDPI and/or the editor(s) disclaim responsibility for any injury to people or property resulting from any ideas, methods, instructions or products referred to in the content. |
© 2022 by the authors. Licensee MDPI, Basel, Switzerland. This article is an open access article distributed under the terms and conditions of the Creative Commons Attribution (CC BY) license (https://creativecommons.org/licenses/by/4.0/).
Share and Cite
MDPI and ACS Style
Galanaki, E.; Giannaros, C.; Kotroni, V.; Lagouvardos, K.; Papavasileiou, G. Spatio-Temporal Analysis of Heatwaves Characteristics in Greece from 1950 to 2020. Climate 2023, 11, 5. https://doi.org/10.3390/cli11010005
AMA Style
Galanaki E, Giannaros C, Kotroni V, Lagouvardos K, Papavasileiou G. Spatio-Temporal Analysis of Heatwaves Characteristics in Greece from 1950 to 2020. Climate. 2023; 11(1):5. https://doi.org/10.3390/cli11010005
Chicago/Turabian StyleGalanaki, Elissavet, Chris Giannaros, Vassiliki Kotroni, Kostas Lagouvardos, and Georgios Papavasileiou. 2023. "Spatio-Temporal Analysis of Heatwaves Characteristics in Greece from 1950 to 2020" Climate 11, no. 1: 5. https://doi.org/10.3390/cli11010005
Note that from the first issue of 2016, this journal uses article numbers instead of page numbers. See further details here.