Article

Development of a New Analytical Method for Determination of Veterinary Drug Oxyclozanide by Electrochemical Sensor and Its Application to Pharmaceutical Formulation

1
Department of Analytical Chemistry, Faculty of Pharmacy, Afyonkarahisar University of Health Sciences, Afyonkarahisar 03200, Turkey
2
Department of Chemistry, Faculty of Art & Science, Bilecik Şeyh Edebali University, Bilecik 11210, Turkey
*
Author to whom correspondence should be addressed.
Chemosensors 2020, 8(2), 25; https://doi.org/10.3390/chemosensors8020025
Submission received: 25 February 2020 / Revised: 22 March 2020 / Accepted: 26 March 2020 / Published: 30 March 2020

Abstract

:
A novel highly selective, sensitive and simple analytical technique was recommended for the investigation of anthelmintic veterinary drug oxyclozanide based on square wave anodic stripping voltammetry (SWASV) by using a carbon paste electrode (CPE). According to the cyclic voltammetric data, the oxidation and electron transfer processes of oxyclozanide were found as irreversible and adsorption-controlled, respectively. The voltammetric anodic peak response was characterized with respect to pH, accumulation potential, accumulation time, frequency and pulse amplitude, etc. Under these optimized experimental conditions, the anodic peak density of oxyclozanide was linear to oxyclozanide concentrations in the range from 0.058 to 4.00 mg/L. The described electrochemical method was successfully carried out for the oxyclozanide in pharmaceutical formulation and tap water with mean percentage recovery of 101.5 % and 102.2 %, respectively. The results of pharmaceutical formulation studies were statistically compared to the high-performance liquid chromatographic method.

Graphical Abstract

1. Introduction

Pharmaceuticals are necessary for human and animal health. They are an important class of emerging contaminants in the environment because, after usage, these compounds and their metabolites are widespread in the environment by several mechanisms. Many drug residues have been detected in the environmental areas such as surface water, groundwater, sewage sludge and manure [1,2]. Therefore, it is very important to the enhancement of some efficient, appropriate and accurate detection methods for these pharmaceuticals in environmental samples.
Oxyclozanide is an anthelmintic drug introduced over 50 years ago and its IUPAC name is [2,3,5-trichloro-N-(3,5-dichloro-2-hydroxyphenyl)-6-hydroxybenzamide] [3]. Helminths are the most important group of parasitic infections in livestock and can be classified into three major types; cestodes, trematodes and nematodes [4]. The chemical structure of oxyclozanide is shown in Figure 1. It has been widely used to control parasitic flatworms called flukes in livestock fields, primarily for ruminants such as goat, cattle and sheep [5]. Oxyclozanide is also used to treat infections caused by F. gigantic and F. hepatica [6].
Very few papers, most of them are spectrophotometric and chromatographic analytical methods, have been reported in the literature for the determination of oxyclozanide in veterinary medicinal products and biological fluids such as liquid chromatography [7], high-performance liquid chromatography (HPLC) [8,9], high-performance thin-layer chromatography [10], HPLC–tandem mass spectrometry [11], liquid chromatography coupled with tandem mass spectrometry [12] and spectrophotometry [13]. These methods are widely used in routine analysis since they are good in sensitivity, stability and repeatability. However, the disadvantage of these methods is that they are time-consuming, expensive, require a large sample volume and need a large number of organic solvents with extraction and separation procedures [14,15]. Electroanalytical techniques are selective, rapid, sensitive and easy methods; they also have low detection and determination limits. So, they have been widely used to analyze organic molecules as pharmaceuticals and pesticides in food, environmental or biological samples and commercial formulations [16,17,18,19,20]. Carbon electrodes, which have great advantages, such as low cost, lightness, large specific surface area, light weight, oxidation resistance, high corrosion resistance and extraordinary porous structure, have a dominant position in the analysis of drugs, pesticides and numerous organic molecules [21]. Therefore, the carbon paste electrode (CPE) can be one of the most suitable indicator electrodes for the determination of oxyclozanide.
To our knowledge, there are no published procedures regarding the electrochemical properties of oxyclozanide and it is available for determining by electrochemical methods. This manuscript reports the development of a new analytical method for the sensitive detection of the oxyclozanide based on a voltammetric technique using a carbon paste electrode (CPE). The principal purpose of this work is the development of a highly sensitive and selectivity electroanalytical technique for the detection of oxyclozanide and to implement the methodology for its quantitative determination in environmental samples and pharmaceutical formulation.

2. Materials and Methods

2.1. Apparatus

The cyclic and square wave stripping voltammetric measurements were carried out by using a Vertex.One/Ivium electrochemical analyzer (Potentiostat/galvanostat, Eindhoven, The Netherlands) controlled with software. The electrochemical cell consisted of three electrodes: the CPE as a working electrode, an Ag/AgCl (3 M NaCl) as a reference electrode and a platinum counter electrode. The pH of the solution was measured using the HANNA model HI 8521 digital pH-meter.
HPLC analyses were performed as indicated by Jo et al. [8]. The HPLC system (Shimadzu UFLCXR HPLC System, Shimadzu Corp., Kyoto, Japan) consisted of a SIL-20A XR autosampler, C18 column and a model of the SPD-M20A diode array detector. The mobile phase consisting of a mixture of 0.1% phosphoric acid/acetonitrile (6:4 v/v) was degassed by sonication before use. Detection of oxyclozanide was carried out at a wavelength of UV-300 nm. The flow rate was 1.0 mL/min and injected volume was 50.0 μL. Each treatment consisted of three replicates.
Mixed graphite powder (<150 µm) and paraffin oil in the ratio 70:30 (w/w) were used to prepare CPE and the obtained carbon paste was packed into the end of the BASi-MF 2010 electrode (3 mm diameter). The procedure for cleaning the electrode surface was done with distilled water. In addition, when not cleaned with pure water, polishing was applied to the electrode surface before the measurements.

2.2. Chemicals and Reagents

Oxyclozanide was purchased from Sigma-Aldrich as an analytical standard. Stock oxyclozanide solution of 500 mg/L oxyclozanide was prepared by dissolving the required weight in acetonitrile and storing it in the dark under refrigeration. Further required dilutions for working solutions were performed with acetonitrile. Veterinary drug formulation containing oxyclozanide, Okzan® (Ceva, Istanbul, Turkey), was purchased from local retail outlets and analyzed by the proposed electrochemical method and by a high-performance liquid chromatography (HPLC) comparative method. The Britton–Robinson buffer (BR, 0.04 M) solutions were used as supporting electrolytes and were prepared from a mixture of H3BO3, H3PO4 and CH3COOH with the appropriate amount of NaOH or HCl solutions to obtain the desired pH. Salts used for buffer solutions, solvents and other chemicals were analytical grade reagents (Merck, Darmstadt, Germany). Throughout all the experiments, doubly distilled water was used.

2.3. Analytical Procedures

The voltammetric response of 6 mg/L oxyclozanide at CPE was investigated in 0.04 M BR buffer and HCl solutions with different pH. For analytical applications, pH 2.0 BR buffer was selected at optimum value. Optimization of SWSV experimental parameters include pulse amplitude (ΔE), frequency (f), accumulation time (tacc), accumulation potential (Eacc) and staircase step potential (ΔEs) are very important because they significantly affect the peak current. So, instrumental conditions were optimized and the calibration curves for oxyclozanide were performed by the standard addition method. The selectivity of the CPE in this paper was evaluated in the presence of different interfering molecules like gentamicin, florfenicol, levamisole and oxfendazole.
To prepare the pharmaceutical sample solution, five Okzan tablets, each containing 750 mg of oxyclozanide were triturated to fine homogeneous powder in mortar. Then, it was accurately weighed and finally dissolved in acetonitrile. These commercial formulations were diluted quantitatively with acetonitrile to obtain a suitable concentration for the analysis.

3. Results and Discussion

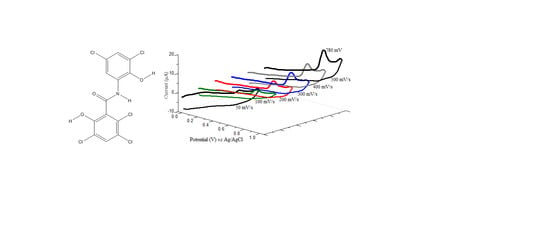
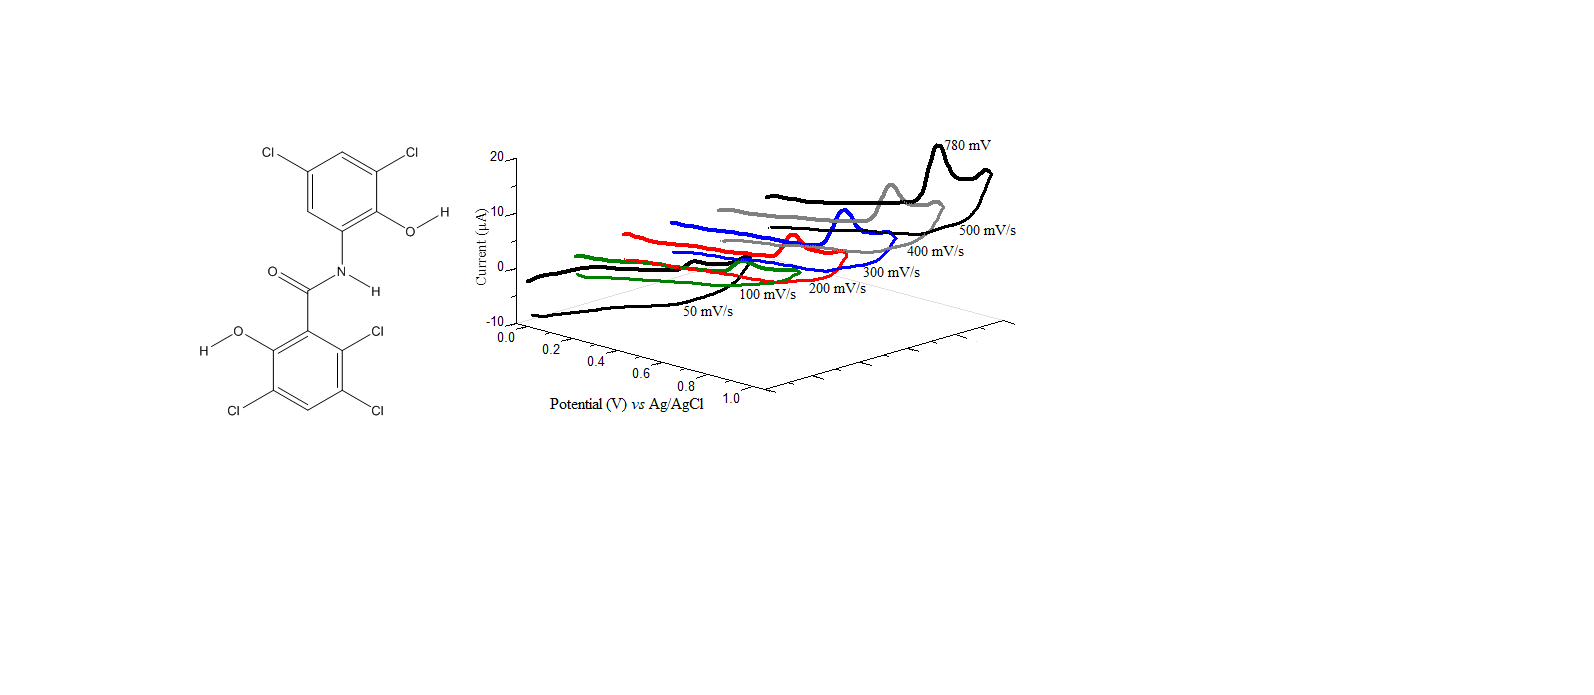
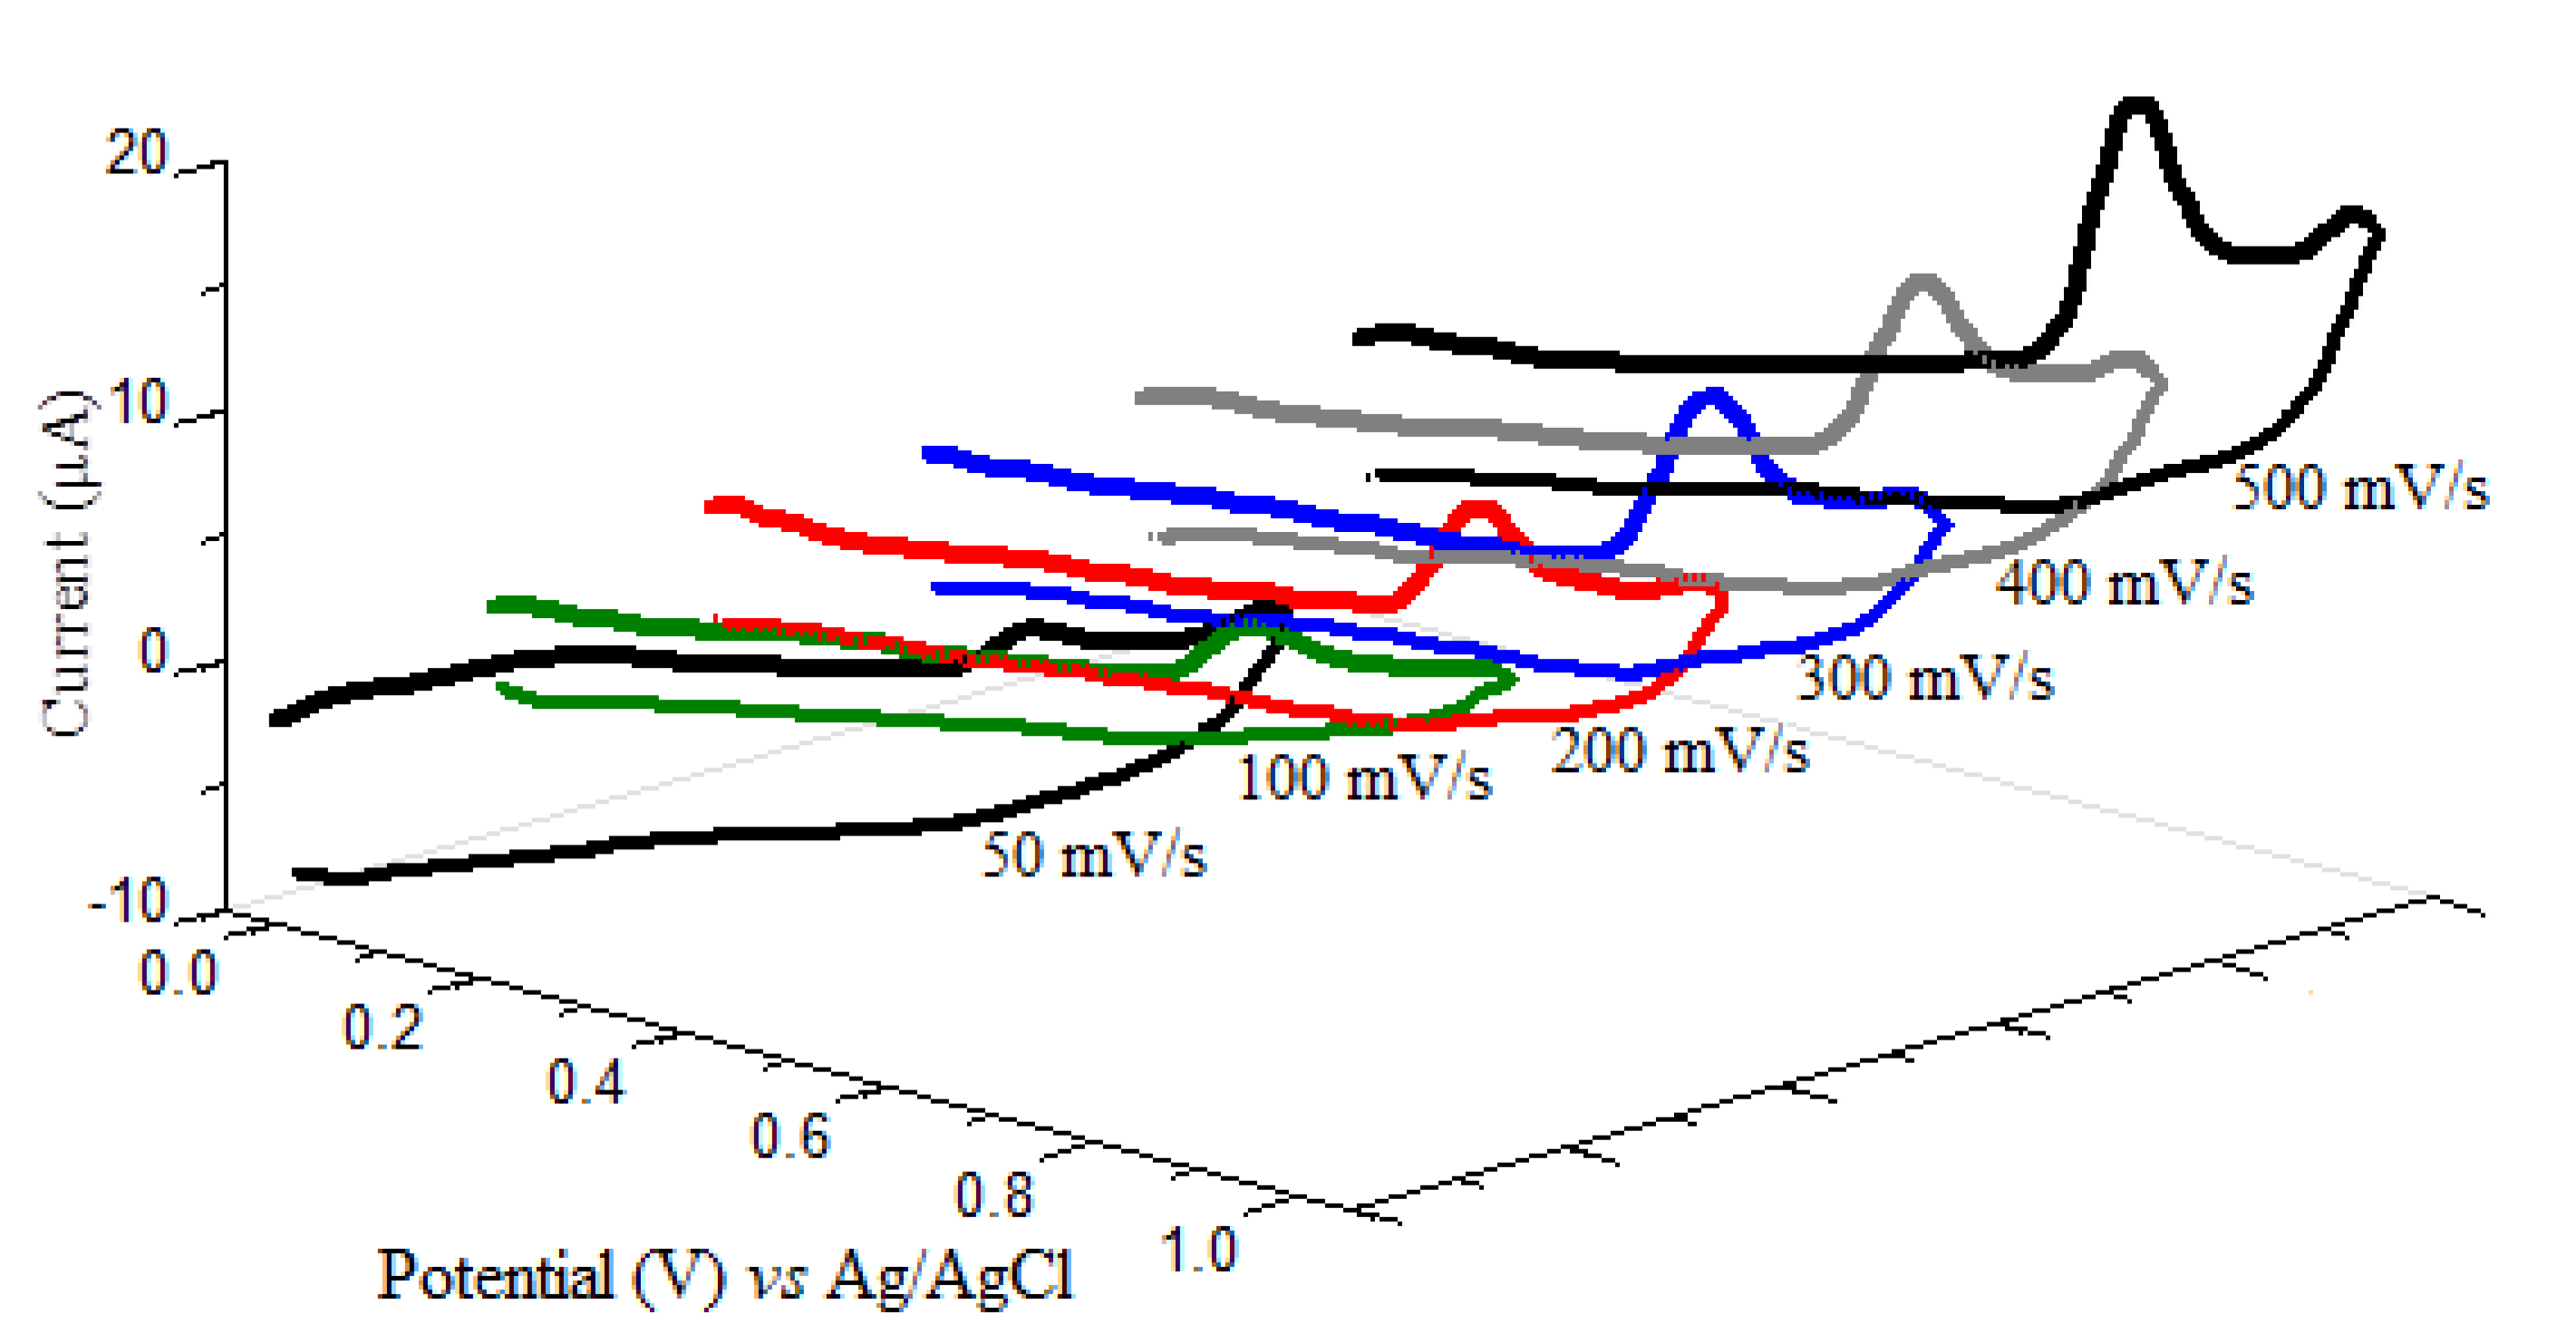
3.1. Cyclic Voltammetry

The electrochemical oxidation behavior of oxyclozanide at CPE was studied by using cyclic voltammetry at different sweep rates in a range from 50 to 500 mV/s in BR buffer solution of pH 2.0. The cyclic voltammograms were obtained in the potential range of 0.00–1000 mV on CPE. As shown in Figure 2, oxyclozanide showed an anodic peak at nearly +780 mV by a scan rate of 500 mV/s in BR buffers at pH 2.0. However, since no peak is obtained in the reversed scan as a cathodic direction, it can be concluded that the oxyclozanide oxidation process has an irreversible electrochemical process. Otherwise, with increasing scan rates, the peak potentials of oxyclozanide shifted to more positive values shows the irreversibility of the oxidation process [22].
To define whether the oxidation reaction of oxyclozanide on CPE was adsorption- or diffusion-controlled, the dependency of the peak current (Ip) on the scan rate (ν) was investigated in the range 50–500 mV/s. The linear relation between the oxidation peak current of oxyclozanide and the square root of the scan rate is described by the following equation (Equation (1)) confirming that the electrochemical oxidation of oxyclozanide at CPE is controlled by diffusion [23].
Ip (µA) = 14.184 ν1/2 − 2.941; (r = 0.9898)
According to the scan rates by cyclic voltammetry, the plot of the logarithm for the peak currents (log Ip) versus the logarithm of the scan rate (log ν) was linear, with a slope of 1.13, in close agreement with the theoretical value as 1.0, can be taken for the irreversible electrochemical process, for an adsorption-controlled process [24]. The linear equation was found as follows:
log Ip (µA) = 1.133 log (ν) (V s−1) − 1.390 (r = 0.9946)
According to the results, the electrode process of the oxyclozanide is mixed adsorption-controlled with diffusion at the CPE surface [25].

3.2. Square Wave Anodic Stripping Voltammetry

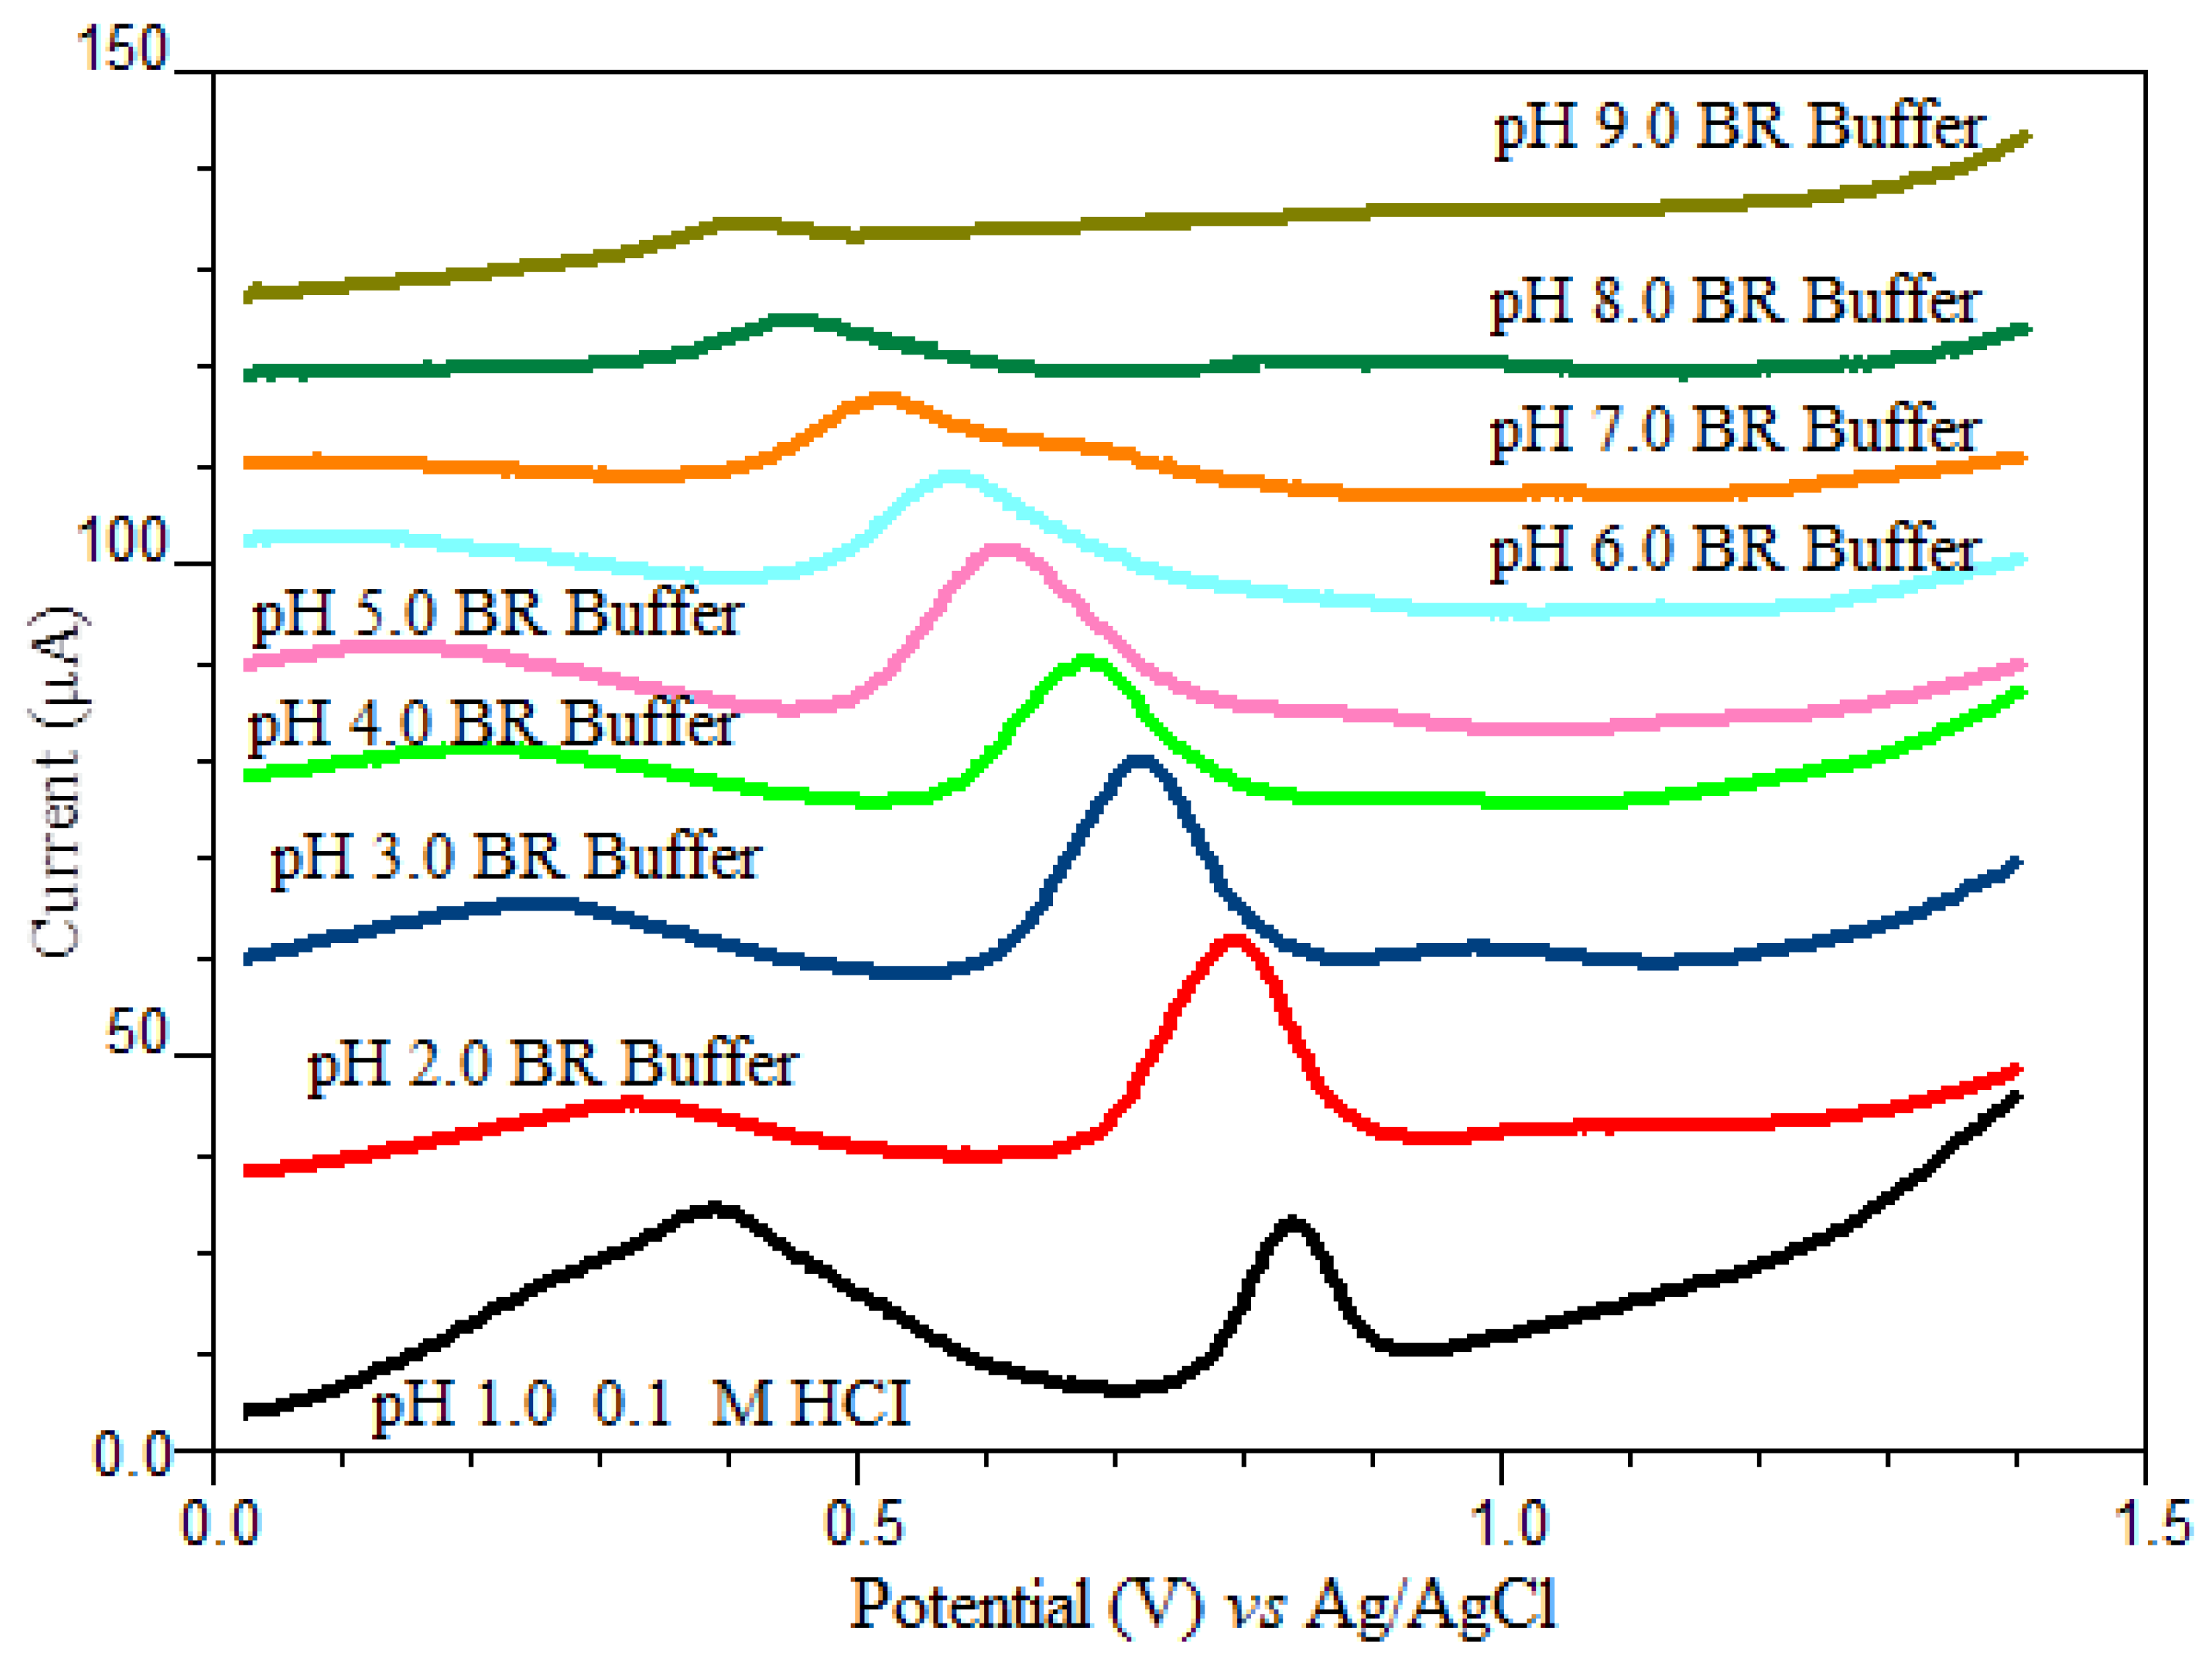
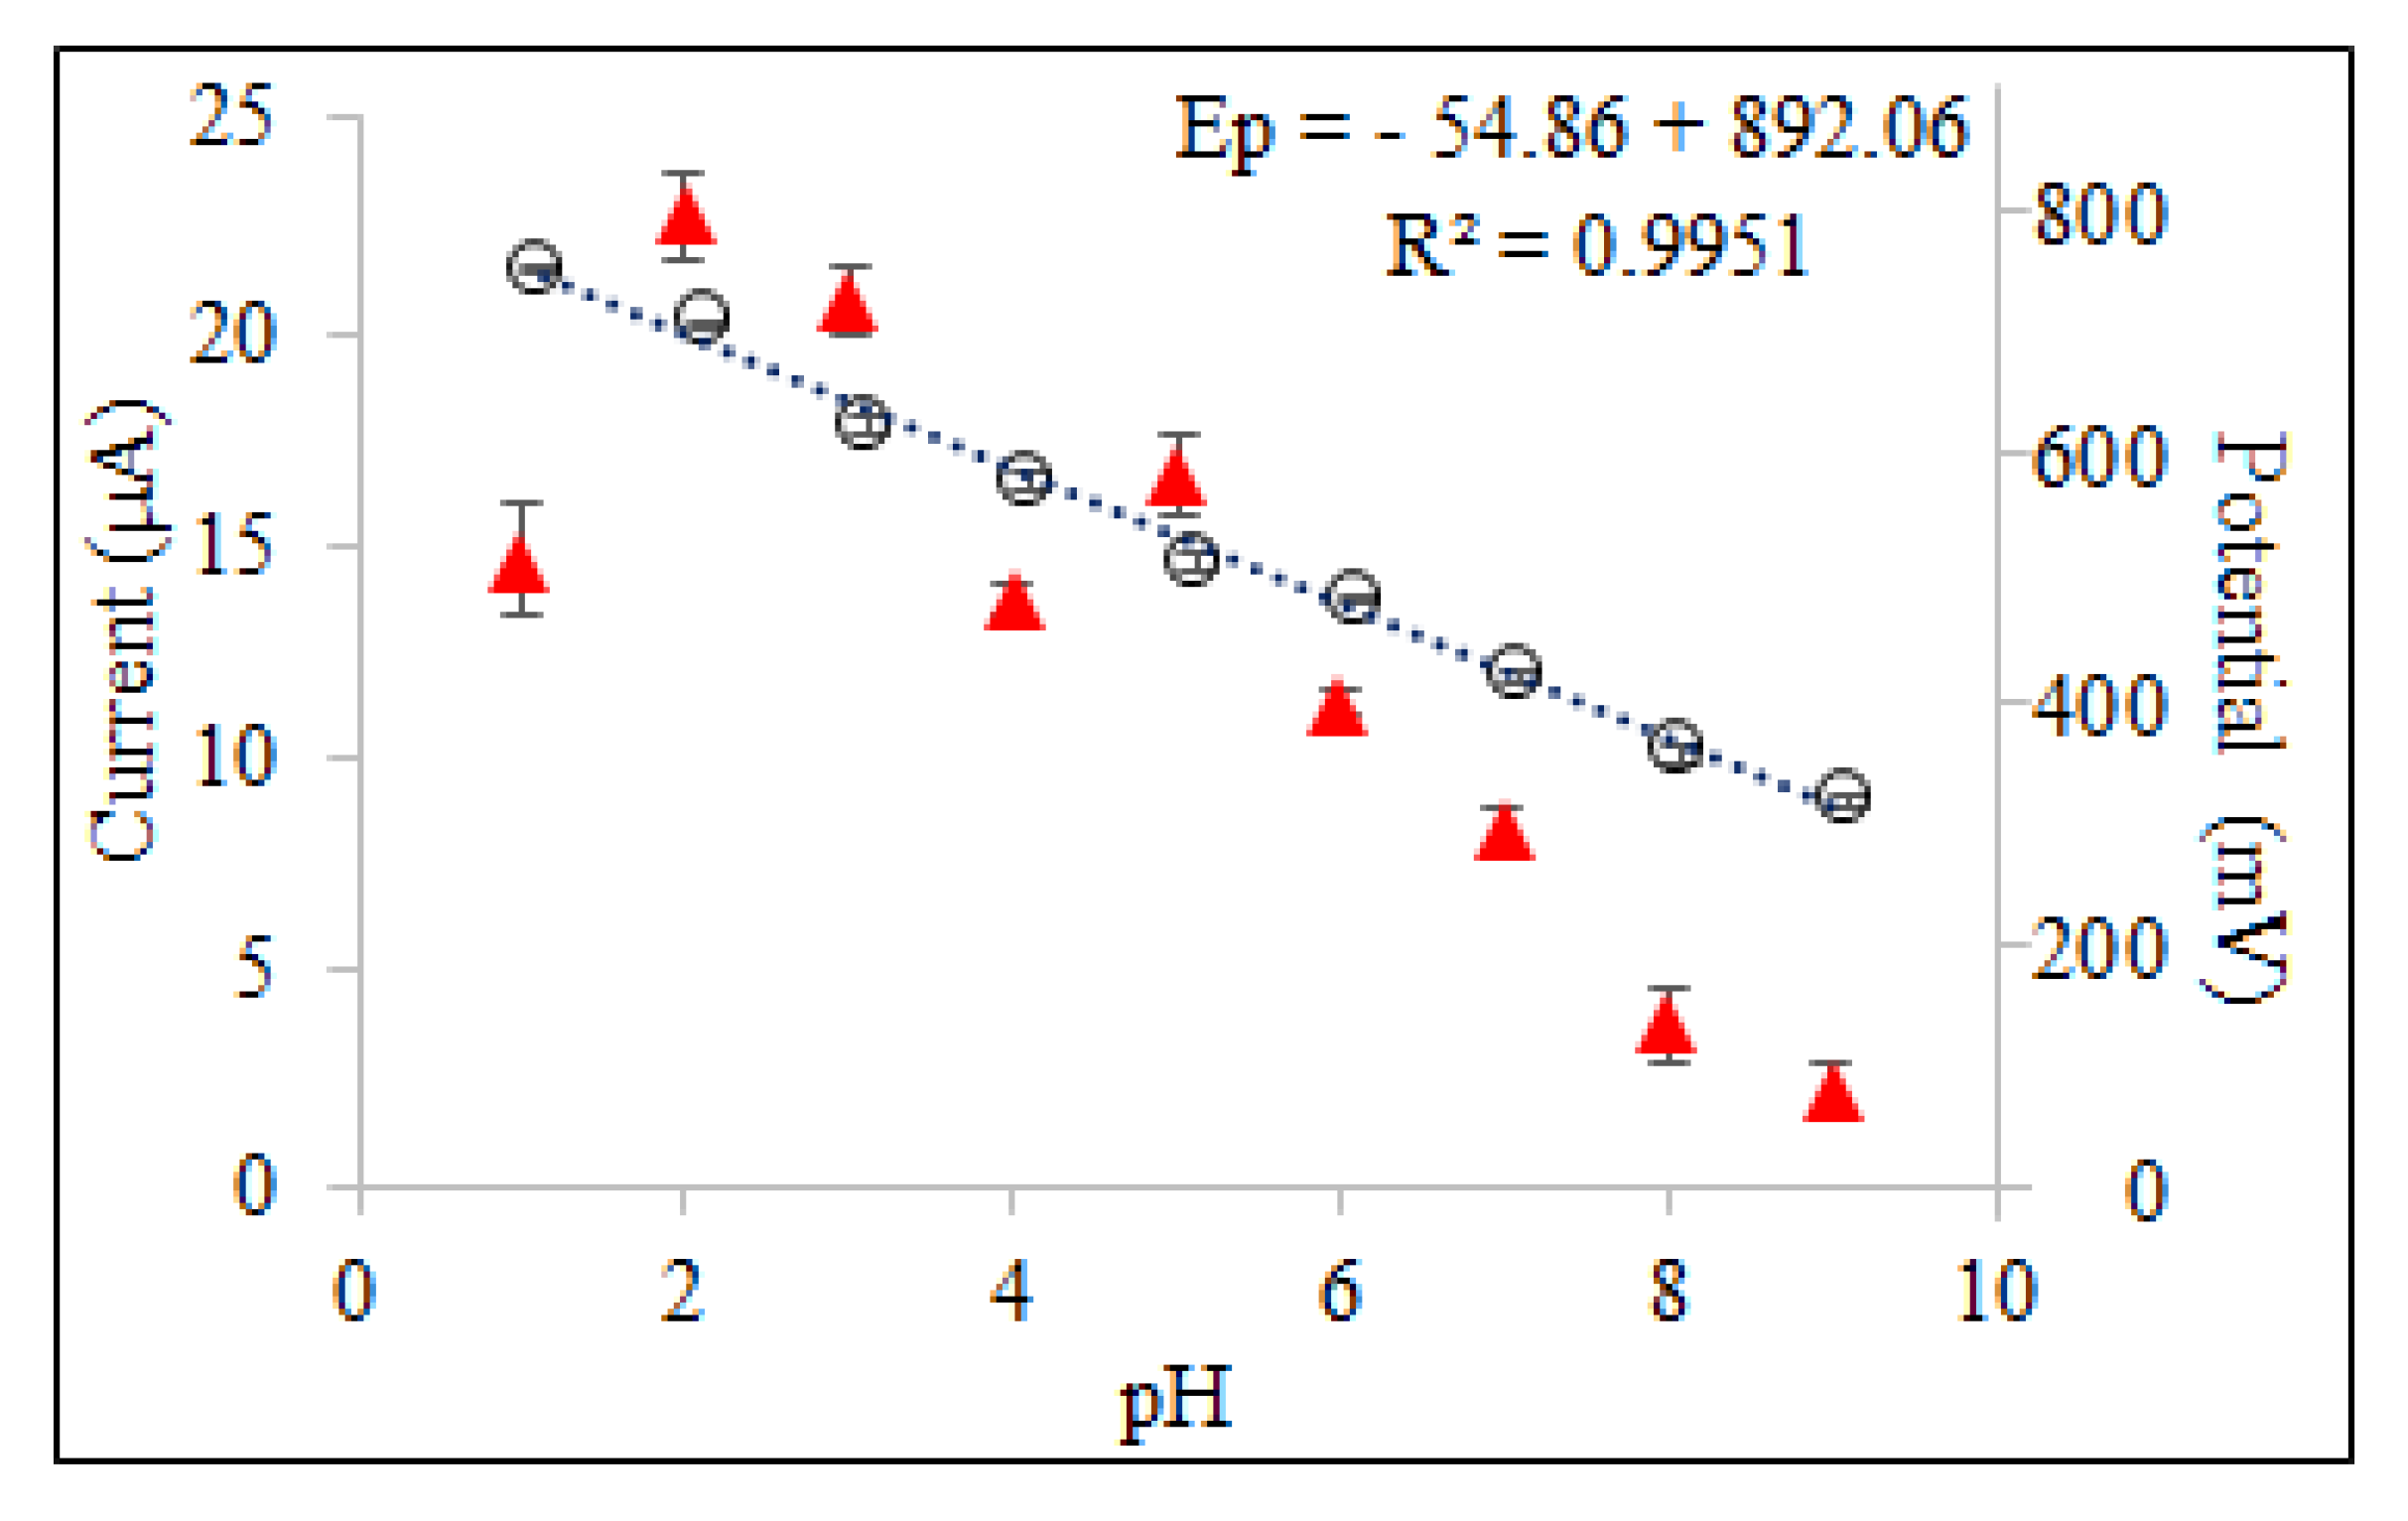
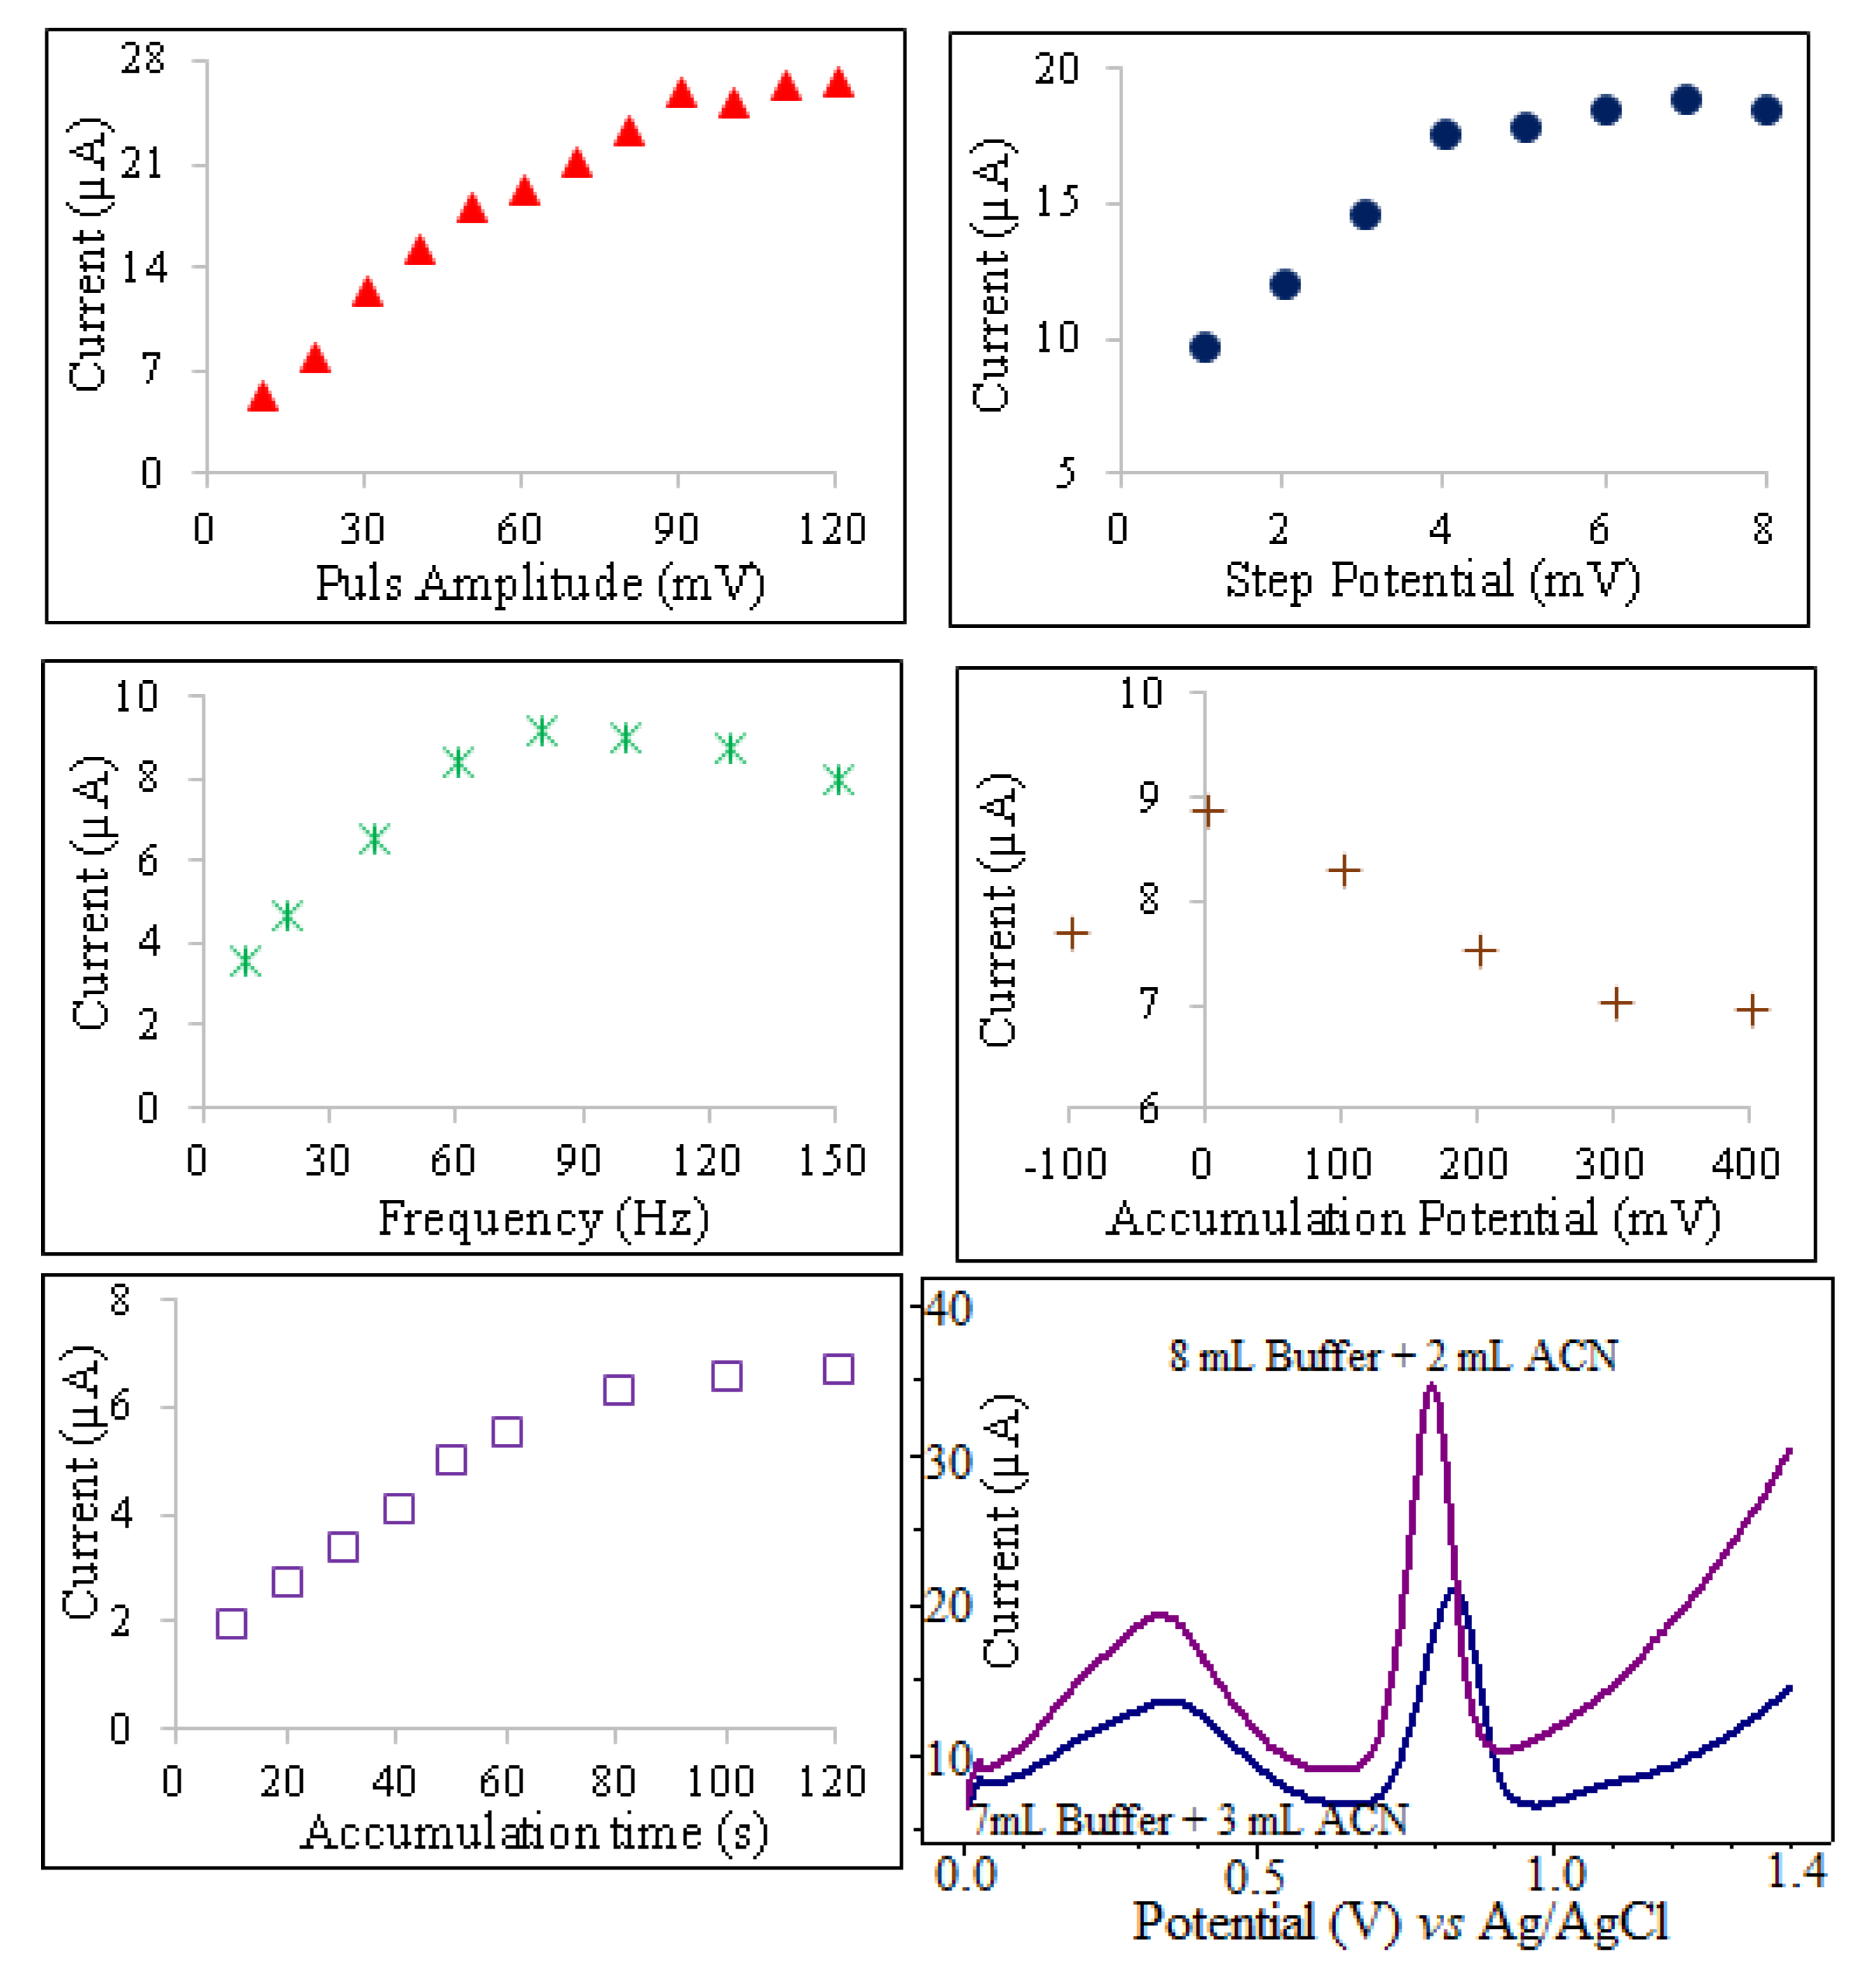
3.2.1. Influence of pH and Square Wave Parameters

The pH of the electrolyte solution is one of the experimental factors that strongly influenced the shape of the voltammogram. In order to obtain the best peak definition, peak current magnitude and repeatability, electrochemical measurements were performed in a pH range of 2.0–9.0 in BR buffer solution and 0.1 M HCl solution as supporting electrolyte using SWSV at CPE. Since oxyclozanide is slightly soluble in the aqueous medium, a certain amount of acetonitrile (20%) is added to the supporting electrolyte medium in all experimental studies. As shown in Figure 3, oxyclozanide exhibited in all cases a single oxidation peak, and the potential of oxidation peak shifted negatively by increasing the solution pH for oxyclozanide with the linear regression equation Ep (mV) = −54.875 pH + 892.06 (r = 0.999), suggesting that protons were involved in the reaction [26]. Based on this equation, the slope value for oxyclozanide is 54.88 mV per pH, which is very close to the theoretical value of 59 mV/pH unit. The result indicates that the electrochemical oxidation of oxyclozanide at CPE should be an equal number of protons and electrons in the electrode reaction [27,28].
When the effect of pH on the peak current of oxyclozanide was investigated in the range of pH 2.0–9.0 of a Britton–Robinson universal buffer and 0.1 M HCl solution, it can be seen that the highest peak current value was obtained in pH 2.0 BR buffer solution (Figure 4) which was selected to carry out the quantitative determination of the oxyclozanide.
The peak current of oxyclozanide in square wave stripping voltammetry is dependent on several instrumental parameters including, frequency (ƒ), pulse amplitude (ΔE), step potential (ΔEs), accumulation time (tacc) and accumulation potential (Eacc). To optimize the frequency for oxyclozanide determination, the effect of varying frequencies on the anodic peak of 3.0 mg/L oxyclozanide in pH 2.0 BR buffer solutions were studied using SWSV in the range of 10–150 Hz. The oxidation peak current of oxyclozanide increased with changed frequency until 80 Hz and then decreased slowly at higher frequencies. Thus, the optimum frequency was chosen to be 80 Hz because of the obtained high peak current to noise ratio for all voltammetric experiments. For irreversible electrochemical reactions, the relationship between the peak potential and the frequency is defined by the following equation [29]:
Δ E p Δ log f = 2.3 R T a n F
In Equation (3), α is the transfer coefficient and n is the number of electrons involved in the redox reaction. Therefore, the number of electrons transferred in the oxidation reaction is calculated with the aid of this equation. The following equation represents the relationship between the peak potential and frequency.
Ep (mV) = 166.17 log f + 546.42; (r = 0.988)
Using this equation, a value 0.355 was calculated for αn. For irreversible reactions, if the value is assumed to be 0.5, the numbers of electrons transferred in the oxidation reaction should be equal to 1.0.
The influence of accumulation time ranging from 10 to 120 s on the oxidation of oxyclozanide at CPE is shown in Figure 5. The anodic peak current increased gradually as accumulation time increased from 10 to 80 s. However, the accumulation time beyond 80 s the peak current of oxyclozanide tends to be almost stable. So, the optimal accumulation time of 80 s was used in further voltammetric experiments.
The variation of peak current with accumulation potential was studied over the range −0.1 to +0.4 V for 3 mg/L oxyclozanide at pH 2 for an accumulation time of 80 s using SWSV. As shown in Figure 5, the peak current value of oxyclozanide was maximal for an accumulation potential of 0.0 V. Therefore, the optimal accumulation potential of 0.0 V was used in further experiments. The influence of step potential and pulse amplitude has an important effect on peak current. To evaluate the analytical performance, the pulse amplitude effect was studied in the range from 10 to 120 mV. At a pulse amplitude of 90 mV, the peak current of oxyclozanide is found to be much sharp and well defined. The effect of the wave pulse amplitude on the anodic peak current of oxyclozanide was also investigated over the range from 1 to 8 mV, and 4 mV was optimal pulse amplitude for oxyclozanide determination.

3.2.2. Quantitative Study

Based on the adsorption behavior of oxyclozanide onto the CPE, square wave adsorptive anodic stripping voltammetry technique, a linear calibration curve was established for oxyclozanide in the bulk form. Using the obtained optimized parameters, the anodic peak presents a linear relationship from 0.058 to 4.00 mg/L of oxyclozanide (Figure 6), following the regression equation:
Ip (µA) = (65.52 C (mg/L) ± 2.06) + (13.64 ± 2.60) r = 0.9975; (0.1 mg/L up to 4.0 mg/L)
The limit of detection (LOD) and limit of quantification (LOQ) of the developed SWSV for the analysis of oxyclozanide was calculated by using 3sb/m and 10sb/m criteria, respectively. In these equations, sb is the standard deviation of peak current at 0.20 mg/L oxyclozanide (10 repeated measurements) and m is the slope of related calibration plot [30]. Under optimum experimental conditions, LOD and LOQ were calculated as 17.42 µg/L and 58.07 µg/L, respectively. The high slope and correlation coefficients indicate that the proposed method is very sensitive for the analysis of oxyclozanide on CPE in pH 2.0 BR buffer solution. The calibration data and the corresponding validation parameters are summarized in Table 1.

3.2.3. Interference Study

The selectivity performance of the proposed SWASV for the determination of oxyclozanide was evaluated in the presence of commonly used veterinary drugs and some cationic species. Possible interactions with compounds such as gentamicin, florfenicol, levamisole and oxfendazole were investigated in determining the amount of oxyclozanide using a square wave stripping voltammetric method. Especially, the combination of oxyclozanide between oxfendazole or levamisole has recently been introduced in the market. The effect of some ionic species, widely found in surface water and soil, was investigated on the determination of oxyclozanide by SWSV. To perform the interference studies different interfering ions such as Cu2+, Zn2+, Ba2+, Pb2+ and Fe3+ were used. Interaction species concentrations were used as 5 and 10 times the amount of oxyclozanide by mass. The effect of interference species was calculated as a percentage by using reference peak current of oxyclozanide in the presence and absence of the interfering species. It can be seen that 10 times the oxyclozanide concentration of ions and compounds did not interfere with the electrochemical responses of oxyclozanide. Only a serious effect (86.99 %) was observed in the presence of a relatively higher concentration of oxfendazole since it exhibited an oxidation peak at about 1270 mV in pH 2 BR buffer solutions. As shown in Table 2, the sufficiently good recoveries were obtained for the ions or molecules because they do not form a complex with the oxyclozanide.

3.2.4. Application to Pharmaceutical Formulation and Tap Water

In order to interpret the accuracy and validity of the developed methodology, a commercially available pharmaceutical tablet sample containing oxyclozanide (Okzan® tablets, Istanbul, Turkey) was analyzed. The results of pharmaceutical formulation analyses are given in Table 3. The results of SWSV were compared with the high-performance liquid chromatography (HPLC) method. Variance ratio F-test and Student’s t-distribution test were used for statistical analysis. There was no significant difference between SWSV and HPLC in the results of the statistical analysis according to the accuracy and precision between the performances of both methods.
The proposed electroanalytical procedure was successfully carried out to analyze oxyclozanide in tap water by the standard addition method. For tap water samples spiked with 0.25 mg/L and 0.50 mg/L oxyclozanide level, recovery rates were obtained as 102.2% ± 1.5% and 104.5% ± 1.3% at a 95% confidence level, respectively, based on four repetitive measurements. Thus, it seems that the developed voltammetric method can apply to the analysis of oxyclozanide in water samples.
The proposed SWASV electrochemical method with high recoveries and low relative standard deviations shows that the determination of oxyclozanide can be carried out in natural and real samples by the high accuracy and precision on CPE in pH 2.0 BR buffer solution.

4. Conclusions

A novel analytical method for the detection of oxyclozanide was developed and is based on square wave stripping voltammetry. The electro-oxidation behavior of oxyclozanide was an irreversible process and adsorptive on the surface of CPE. The anodic peak current of oxyclozanide was proportional to the concentrations in the range 0.058 to 4.00 mg/L with a detection limit of 0.017 mg/L and a correlation coefficient of 0.9975. The results of the research indicated that the proposed novel electroanalytical procedure could be successfully applied to the detection of oxyclozanide in pharmaceutical formulation and tap water samples with excellent selectivity, sensitivity, stability, and reproducibility.

Author Contributions

Conceptualization, methodology, validation, electrochemical analysis, resources, data analysis, writing—original draft preparation, writing—review and editing, visualization, E.D., H.S. All authors have read and agreed to the published version of the manuscript.

Funding

This research received no specific grant from any funding agency.

Conflicts of Interest

The authors declare no conflict of interest.

References

  1. Klatte, S.; Schaefer, H.; Hempel, M. Pharmaceuticals in the environment—A short review on options to minimize the exposure of humans, animals and ecosystems. Sustain. Chem. Pharm. 2017, 5, 61–66. [Google Scholar] [CrossRef]
  2. Rather, J.A.; Jain, R. Stripping voltammetric detection of nephrotoxic drug cefitizoxime in wastewater. Anal. Chem. Res. 2015, 4, 13–19. [Google Scholar] [CrossRef] [Green Version]
  3. Lanusse, C.E.; Virkel, G.L.; Alvarez, L.I. Anticestodal and Antitrematodal Drugs. In Veterinary Pharmacology and Therapeutics, 9th ed.; Riviere, J.E., Papich, M.G., Adams, H.R., Eds.; Wiley-Blackwell: Hoboken, NJ, USA, 2009; pp. 1081–1101. [Google Scholar]
  4. Kinsella, B.; Lehotay, S.J.; Mastovska, K.; Lightfield, A.R.; Furey, A.; Danaher, M. New method for the analysis of flukicide and other anthelmintic residues in bovine milk and liver using liquid chromatography-tandem mass spectrometry. Anal. Chim. Acta. 2009, 637, 196–207. [Google Scholar] [CrossRef]
  5. Rajamuthiah, R.; Fuchs, B.B.; Conery, A.L.; Kim, W.; Jayamani, E.; Kwon, B.; Ausubel, F.M.; Mylonakis, E. Repurposing salicylanilide anthelmintic drugs to combat drug resistant Staphylococcus aureus. PLoS ONE 2015, 10, e0124595. [Google Scholar] [CrossRef] [PubMed] [Green Version]
  6. Zhang, J.L.; Si, H.F.; Zhou, X.Z.; Shang, X.F.; Li, B.; Zhang, J.Y. High prevalence of fasciolosis and evaluation of the efficacy of anthelmintics against Fasciola hepatica in buffaloes in Guangxi, China. Int. J. Parasitol. Parasites Wildl. 2019, 8, 82–87. [Google Scholar] [CrossRef] [PubMed]
  7. Khan, A.R.; Akhtar, M.J.; Mahmood, R.; Ahmed, S.M.; Malook, S.; Iqbal, M. LC assay method for oxfendazole and oxyclozanide in pharmaceutical preparation. J. Pharm. Biomed. 2000, 22, 111–114. [Google Scholar] [CrossRef]
  8. Jo, K.; Cho, H.J.; Yi, H.; Cho, S.M.; Park, J.A.; Kwon, C.H.; Park, H.R.; Kwon, K.S.; Shin, H.C. Determination of oxyclozanide in beef and milk using high-performance liquid chromatography system with UV detector. Lab Anim. Res. 2011, 27, 37–40. [Google Scholar] [CrossRef] [PubMed] [Green Version]
  9. Mohamed, A.O.; Ramadan, N.K.; Shawky, S.E.; Salem, M.Y. Simultaneous determination of oxyclozanide and levamisole by spectrophotometric and chromatographic methods. J. Appl. Pharm. Sci. 2014, 4, 36–45. [Google Scholar]
  10. Patel, M.B.; Patel, R.K.; Patel, S.G.; Patel, A.J. Development and validation of HPTLC method for simultaneous estimation of levamisole hydrochloride and oxyclozanide in its bulk and pharmaceutical dosage form. Austin Chromatogr. 2017, 4, 1045. [Google Scholar]
  11. Li, S.P.; Huang, X.H.; Wang, W.; Yan, C.Y.; Kong, X.K. Simultaneous determination of phenolic and salicylanilide anthelmintics multi-residues in cattle and ovine tissues by HPLC MS/MS. Chin. J. Anal. Chem. 2014, 42, 423–428. [Google Scholar]
  12. Sakamoto, M.; Takebe, K.; Sasamoto, T.; Kusano, T.; Hayashi, H.; Kanai, S.; Kanda, M.; Nagayama, T. Determination of bithionol, nitroxynil, oxyclozanide, and tribromsalan in milk with liquid choromatography coupled with tandem mass spectrometry. J. AOAC Int. 2010, 93, 1340–1346. [Google Scholar] [CrossRef] [Green Version]
  13. Dinç, E.; Onur, F. Comparative study of the ratio spectra derivative spectrophotometry, derivative spectrophotometry and Vierordt’s method applied to the analysis of oxfendazole and oxyclozanide in a veterinary formulation. Analusis 1997, 25, 55–59. [Google Scholar]
  14. Cai, Z.Q.; Zhu, Y.X.; Zhang, Y. Simultaneous determination of dissolved anthracene and pyrene in aqueous solution by synchronous fluorimetry. Spectrochim. Acta 2008, 69, 130–133. [Google Scholar] [CrossRef] [PubMed]
  15. Mailu, S.N.; Waryo, T.T.; Ndangili, P.M.; Ngece, F.R.; Baleg, A.A.; Baker, P.G.; Iwuoha, E.I. Determination of anthracene on ag-au alloy nanoparticles/overoxidized-polypyrrole composite modified glassy carbon electrodes. Sensors 2010, 10, 9449–9465. [Google Scholar] [CrossRef] [PubMed]
  16. Demir, E.; İnam, O.; İnam, R.; Aboul-Enein, H.Y. Voltammetric determination of ophthalmic drug dexamethasone using poly-glycine multi walled carbon nanotubes modified paste electrode. Curr. Anal. Chem. 2018, 14, 83–89. [Google Scholar] [CrossRef]
  17. Elfiky, M.; Salahuddin, N.; Hassanein, A.; Matsuda, A.; Hattori, T. Detection of antibiotic Ofloxacin drug in urine using electrochemical sensor based on synergistic effect of different morphological carbon materials. Microchem. J. 2019, 146, 170–177. [Google Scholar] [CrossRef]
  18. Falone, M.F.; Salamanca-Neto, C.A.R.; Moraes, J.T.; Sartori, E.R. Electrochemical evaluation and voltammetric determination of laxative drug bisacodly on boron-doped diamond electrode. Measurement 2019, 137, 464–469. [Google Scholar] [CrossRef]
  19. Silva, R.O.; Silva, E.A.; Fiorucci, A.R.; Ferreira, V.S. Electrochemically activated multi-walled carbon nanotubes modified screen-printed electrode for voltammetric determination of sulfentrazone. J. Electroanal. Chem. 2019, 835, 220–226. [Google Scholar] [CrossRef]
  20. Lu, J.; Sun, Y.; Waterhouse, G.I.N.; Xu, Z. A voltammetric sensor based on the use of reduced graphene oxide and hollow gold nanoparticles for the quantification of methyl parathion and parathion in agricultural products. Adv. Polym. Technol. 2018, 37, 3629–3638. [Google Scholar] [CrossRef]
  21. Cheng, Y.; Hao, Z.; Haoab, C.; Dengab, Y.; Liab, X.; Li, K.; Zhao, Y. A review of modification of carbon electrode material in capacitive deionization. RSC Adv. 2019, 9, 24401–24419. [Google Scholar] [CrossRef]
  22. Shetti, N.P.; Malode, S.J.; Nandibewoor, S.T. Electrochemical behavior of an antiviral drug acyclovir at fullerene-C60-modified glassy carbon electrode. Bioelectrochemistry 2012, 88, 76–83. [Google Scholar] [CrossRef] [PubMed]
  23. Brycht, M.; Kaczmarska, K.; Uslu, B.; Ozkan, S.A.; Skrzypek, S. Sensitive determination of anticancer drug imatinib in spikes human urine samples by differential pulse voltammetry on anodically pretreated boron-doped diamond electrode. Diam. Relat. Mater. 2016, 68, 13–22. [Google Scholar] [CrossRef]
  24. Acar, E.T.; Atun, G. Sensitive determination of nicotine on polyNiTSPc electrodeposited glassy carbon electrode: Investigation of reaction mechanism. Electroanalysis 2018, 30, 2994–3002. [Google Scholar] [CrossRef]
  25. Demir, E.; İnam, R.; Ozkan, S.A.; Uslu, B. Electrochemical behavior of tadalafil on TiO2 nanoparticles-MWCNT composite paste electrode and its determination in pharmaceutical dosage forms and human serum samples using anodic stripping square wave voltammetry. J. Solid State Electrochem. 2014, 18, 2709–2720. [Google Scholar] [CrossRef]
  26. Li, L.; Zheng, H.; Guo, L.; Qu, L.; Yu, L. A sensitive and selective molecularly imprinted electrochemical sensor based on Pd-Cu bimetallic alloy functionalized graphene for detection of amaranth in soft drink. Talanta 2019, 197, 68–76. [Google Scholar] [CrossRef]
  27. Yalikun, N.; Mamat, X.; Li, Y.; Hu, X.; Wagberg, T.; Dong, Y.; Hu, G. Synthesis of an iron-nitrogen co-doped ordered mesoporous carbon-silicon nanocomposite as an enhanced electrochemical sensor for sensitive and selective determination of chloramphenicol. Colloids Surf. B Biointerfaces 2018, 172, 98–104. [Google Scholar] [CrossRef]
  28. Sabbaghi, N.; Noroozifar, M. Nanoraspberry-like copper/ reduced graphene oxide as new modifier for simultaneous determination of benzenediols isomers and nitrite. Anal. Chim. Acta 2019, 1056, 16–25. [Google Scholar] [CrossRef]
  29. Lovric, M.; Komorsky-Lovric, S. Square-wave voltammetry of an adsorbed reactant. J. Electroanal. Chem. Interfacial. Electrochem. 1988, 248, 239–253. [Google Scholar] [CrossRef]
  30. Currie, L.A. International recommendations offered on analytical detection and quantification concepts and nomenclature. Anal. Chim. Acta 1999, 391, 103–134. [Google Scholar] [CrossRef]
Figure 1. Molecular structure of oxyclozanide.
Chemosensors 08 00025 g001
Figure 2. Cyclic voltammograms of 10 mg/L oxyclozanide in pH 2.0 Britton–Robinson (BR) buffer at carbon paste electrode (CPE) at different scan rates.
Chemosensors 08 00025 g002
Figure 3. SWSV voltammograms of 6.0 mg/L oxyclozanide in HCl solution and Britton–Robinson buffer at different pH values (tacc = 60 s and Eacc = 0 V).
Chemosensors 08 00025 g003
Figure 4. Effect of pH on peak potentials and peak currents obtained for 6.0 mg/L oxyclozanide in 0.1 M HCl and BR buffer using SWSV at CPE (tacc = 60 s and Eacc = 0 V).
Chemosensors 08 00025 g004
Figure 5. The effects of experimental parameters on the SWSV determination of 3 mg/L oxyclozanide in pH 2.0 BR buffer solution.
Chemosensors 08 00025 g005
Figure 6. SWSV voltammograms for the calibration graph of oxyclozanide in BR buffer at pH 2.0. (f = 80 Hz, tacc = 80 s, Eacc = 0.0 mV, ΔE = 90 mV and ΔEs = 4 mV).
Chemosensors 08 00025 g006
Table 1. Analytical performance data for the determination of oxyclozanide by SWSV using CPE at pH 2 BR buffer solution.
ParametersPerformance Data
Peak potential (mV)780
Linearity range (mg/L)0.058 – 4.00
Slope (µA L/mg)65.52 ± 2.06
Intercept (µA)13.64 ± 2.60
Correlation coefficient0.995
Limit of determination (LOD) (µg/L)17.42
Limit of quantification (LOQ) (µg/L)58.07
Repeatability of peak current (RSD %)*2.08
Repeatability of peak potential (RSD %)*4.53
* 0.20 mg/L oxyclozanide (n = 10 repeated measurements).
Table 2. Effect of interfering species on the determination of oxyclozanide anthelmintic drug (N = 3).

Interfering Species
Mass Ratio of 1:1Mass Ratio of 1:5Mass Ratio of 1:10
Recoveries %
X ± t s N
Recoveries %
X ± t s N
Recoveries %
X ± t s N
Gentamicin97.56 ± 1.8896.20 ± 3.8995.74 ± 2.95
Florfenicol99.74 ± 2.8595.65 ± 1.5190.33 ± 1.64
Levamisole102.92 ± 1.7298.66 ± 3.5894.25 ± 3.01
Oxfendazole98.35 ± 1.3593.65 ± 2.1986.99 ± 2.44
Cu (II)104.68 ± 2.01104.20 ± 2.73103.48 ± 3.74
Zn (II)98.15 ± 2.1596.41 ± 2.7591.63 ± 2.95
Pb (II)102.33 ± 1.60102.29 ± 2.8595.96 ± 2.02
Ba (II)100.50 ± 2.42100.25 ± 1.76100.15 ± 1.38
Fe (III)102.25 ± 0.5998.36 ± 2.8994.57 ± 2.28
Table 3. Results obtained for oxyclozanide in pharmaceutical formulations Okzan® by using SWSV and HPLC.
SWSV (N = 3)HPLC (N = 3)
Labeled claim (mg)750.0750.0
Amount found (mg ± mg) X ± t s N 761.1 ± 25.6757.7 ± 12.9
RSD (%)3.400.69
Bias (%)+1.50+1.02
Student t-test0.51 × (2.78)
Variance ratio F-test3.92 × (19.0)
The figures in parenthesis are the tabulated values of t and F at a 95 % confidence level.

