
Polarity-Dependent Twisted Intramolecular Charge Transfer in Diethylamino Coumarin Revealed by Ultrafast Spectroscopy

Department of Chemistry, Oregon State University, 153 Gilbert Hall, Corvallis, OR 97331, USA
*
Author to whom correspondence should be addressed.
†
These authors contributed equally to this work.
‡
Web: https://fanglab.oregonstate.edu/ .
Chemosensors 2022, 10(10), 411; https://doi.org/10.3390/chemosensors10100411
Submission received: 8 September 2022
/
Revised: 4 October 2022
/
Accepted: 8 October 2022
/
Published: 11 October 2022
(This article belongs to the Special Issue Optical Chemical Sensors and Spectroscopy)
Abstract
:Twisting intramolecular charge transfer (TICT) is a common nonradiative relaxation pathway for a molecule with a flexible substituent, effectively reducing the fluorescence quantum yield (FQY) by swift twisting motions. In this work, we investigate coumarin 481 (C481) that contains a diethylamino group in solution by femtosecond transient absorption (fs-TA), femtosecond stimulated Raman spectroscopy (FSRS), and theoretical calculations, aided by coumarin 153 with conformational locking of the alkyl arms as a control sample. In different solvents with decreasing polarity, the transition energy barrier between the fluorescent state and TICT state increases, leading to an increase of the FQY. Correlating the fluorescence decay time constant with solvent polarity and viscosity parameters, the multivariable linear regression analysis indicates that the chromophore’s nonradiative relaxation pathway is affected by both hydrogen (H)-bond donating and accepting capabilities as well as dipolarity of the solvent. Results from the ground- and excited-state FSRS shed important light on structural dynamics of C481 undergoing prompt light-induced intramolecular charge transfer from the diethylamino group toward –C=O and –CF3 groups, while the excited-state C=O stretch marker band tracks initial solvation and vibrational cooling dynamics in aprotic and protic solvents (regardless of polarity) as well as H-bonding dynamics in the fluorescent state for C481 in high-polarity protic solvents like methanol. The uncovered mechanistic insights into the molecular origin for the fluorogenicity of C481 as an environment-polarity sensor substantiate the generality of ultrafast TICT state formation of flexible molecules in solution, and the site-dependent substituent(s) as an effective route to modulate the fluorescence properties for such compact, engineerable, and versatile chemosensors.

1. Introduction
Conformational twisting around a chemical bond is an important mechanism in regulating fluorescence and has profound impacts on the applications of chemical and biological imaging and sensing, and optoelectronics, among a wide range of fluorescence-based methodologies and advances. For example, super-resolution microscopy using photoswitchable fluorescent proteins crucially involves Z–E or cis–trans isomerization of the protein core chromophore, p-HBDI, around the methine bridge C=C bond [1,2]. The two different conformations along with the protonation state change jointly lead to the fluorescence on- and off-responses that are necessary for photoswitching. A more common consequence of structural twisting motions is that photoexcited molecules can be dynamically deactivated in a nonradiative manner. Twisted intramolecular charge transfer (TICT) has thus been proposed as the main cause for fluorescence quenching in many flexible molecules [3,4,5,6]. This holistic understanding has facilitated a myriad of practical advances either by directly harnessing the unique sensitivity of TICT to environmental factors such as polarity and viscosity to make pertinent sensors [7,8], or effectively suppressing TICT to make brighter fluorophores such as aggregation-induced emission dyes or fluorescent bioprobes [9,10].
At the theoretical front, the TICT process is usually accompanied by the presence of a corresponding energy state termed TICT state with a twisted structure in addition to the directly excited electronic state that is the fluorescent state (FS, emissive) with a largely planar structure [3,11]. In most cases, the TICT state is non-emissive due to the extremely tiny downward transition oscillator strength. An exception is the 4-(dimethylamino)benzonitrile (DMABN) which shows dual emission bands resulting from the directly excited and TICT states as widely accepted [12,13]. Compared to TICT induced by the rotation of large groups like aromatic rings, it is intriguing that a small group like amine can induce TICT and drastically quench fluorescence. In recent years, considerable work has been devoted to the mechanistic understanding of TICT in such systems [3,6,13]. Besides the inquiry about effects of an amine structure on TICT, the high sensitivity of fluorescence quantum yield (FQY) to environmental polarity has been discovered but remains underexplored for these amine-containing molecules [14,15]. In protic polar solvents, these molecules usually display low FQYs which are attributed to the facile TICT-state formation due to rotation of the amine group along the covalent C–N (backbone-amine) bond. In contrast, in low-polarity solvents TICT tends to be suppressed, which gives rise to a high FQY. Kinetically, these experimental observations suggest that the FS-to-TICT transition state is more polar than the FS.
However, quantifying solvent polarity and thus correctly connecting to the TICT efficiency is not a trivial task. Recently, we reported a novel polarity sensor, p-NMe2-m-HBDI:BF2, engineered from the green fluorescent protein (GFP) chromophore that contains a dimethylamine group at the original phenolic hydroxy site [8]. We developed an analytical linear regression approach that quantitatively correlates the twisting rate constant to solvent polarity indicators weighing hydrogen (H)-bonding and dipolar interactions as well as solvent viscosity [8,16]. It was found that the fluorogenicity is governed by the “specific” H-bonding interactions instead of “nonspecific” electric dipolar interactions between the chromophore and solvent. This finding intrigued us to study whether this is a common mechanism for amine-containing TICT-capable molecules and how significant the solvent viscosity contribution could be. In this work, we investigate the fluorogenicity of diethylaminocoumarin (C481) based on the popular and widely used coumarin scaffolds [17,18,19], exhibiting up to 20-fold FQY enhancement from polar to nonpolar organic solvents. With the FQY results from steady-state fluorescence spectroscopy and transient electronic dynamics data from femtosecond transient absorption (fs-TA), we quantitatively demonstrated that both H-bonding and dipolar interactions between the chromophore and solvent affect TICT state properties in C481. We further implemented wavelength-tunable femtosecond stimulated Raman spectroscopy (FSRS) [20,21] to provide structural insights into the excited-state relaxation dynamics and important role of solvent polarity in TICT systems.
2. Materials and Methods
2.1. Chemicals and Steady-State Electronic Spectroscopy
The 7-diethylamino-4-(trifluoromethyl)coumarin (C481, CAS RN: 41934-47-8) with >97% purity (NMR) was purchased from Apollo Scientific Ltd. (Bredbury, UK). The control sample 2,3,6,7-Tetrahydro-9-(trifluoromethyl)-1H,5H,11H-[1]benzopyrano [6,7,8-ij]quinolizin-11-one (C153, CAS RN: 53518-18-6) with 99% purity (HPLC) was purchased from MilliporeSigma (Sigma-Aldrich, St Louis, MO, USA) without further purification. See Scheme 1 for a direct comparison between these two chromophores. The solvent 2,2,2-trifluoroethanol (TFE) was purchased from TCI America, Inc. and used as received. A Thermo Scientific Evolution 201 UV/Visible spectrophotometer (Waltham, MA, USA) and a Shimadzu RF-6000 spectrofluorophotometer (Pleasanton, CA, USA) were used to collect steady-state electronic absorption and fluorescence spectra, respectively. The sample solution was housed in a 5-mm-pathlength four-sided quartz cuvette.
2.2. Fluorescence Quantum Yield (FQY) Measurements
The FQYs of C481 and C153 in various solvents were measured using the relative approach as described in the literature [22,23,24]. C153 in ethanol (EtOH) was used as the standard. Five sample concentrations (optical density or OD of ~0.02, 0.04, 0.06, 0.08, and 0.1 per 5 mm to minimize the inner-filter effect) in each solvent were measured to obtain the absorption and emission spectra, providing input for the FQY calculation on the basis of Equation (1):
where is the integrated fluorescence intensity within an appropriate spectral range, is the absorption factor calculated by the quantity of (1–10−A) (i.e., A is the absorbance at the excitation wavelength), is the refractive index of the solvent, is the quantum yield. The subscripts and stand for the sample to be measured and known standard, respectively. The range of adjusted values of five selected sample concentrations in 14 solvents is from 0.996 to 0.999, substantiating the linear model accuracy for deriving the FQYs for solvated chromophores like C481 in this work.
2.3. Femtosecond Transient Absorption (fs-TA) Spectroscopy with Global Analysis
The detailed description of our home-built fs-TA setup can be found in our previous publications [25,26,27]. Briefly, the main laser source was provided by a Legend Elite USP-1K-HE regenerative amplifier system (Coherent, Inc., Santa Clara, CA, USA) that delivers ~3.5 W average power, 35 fs pulse duration, 800 nm pulses at 1 kHz repetition rate. In this work, 400 nm pump with 0.3–0.5 mW average power was used to excite all samples. Given the typical laser focal spot diameter of ~0.2 mm in our setup [28], the average pump fluence was ~1.3 W/cm2 or 2.6 × 10¹⁵ photons/cm2/pulse with the 400 nm pump. The polarizations of pump and probe pulses were set at the magic angle (54.7°) configuration to eliminate anisotropic effects. Sample solution was housed in a 1-mm-pathlength quartz cuvette (Spectrosil 1-Q-1, Starna Cells, Inc., Atascadero, CA, USA) with concentration in the OD range of 0.3–0.5 per mm, being constantly stirred by a minuscule steel bar made from staples during spectral data collection. The TA spectral data were calibrated by a HG-1 Mercury Argon calibration light source (Ocean Optics/Ocean Insight, Inc., Orlando, FL, USA) and processed in Igor Pro software (WaveMetrics, Inc., Lake Oswego, OR, USA). The subsequent global analysis was performed using the open-source Glotaran program [29]. Evolution-associated and decay-associated difference spectra (EADS and DADS) [30,31] with pertinent lifetimes were retrieved from fs-TA spectra for a quantitative analysis (multivariable linear regression, see below for details) of the polarity-dependent fluorogenicity of C481 in solution. In particular for our experiments, the 400 nm pump was temporally compressed by a Brewster angle dispersing prism pair (06SB10, transmission range of 185 nm to 2.1 μm, Newport, Inc., Irvine, CA, USA). The spectral dispersion of the probe was corrected by a chirped mirror pair (DCM-12, 400−700 nm, Laser Quantum, Inc., part of Novanta Photonics, Stockport, UK). The cross-correlation time between the pump and probe pulses was measured to be <100 fs [27]. A time window from −2 to 900 ps was scanned for all samples (Figure S1) except for C481 in two solvents, dichloromethane and chloroform, where a longer delay of 3.6 ns was scanned in another fs-TA setup (see Figure S1 caption) with a translational stage setup of quadruple pathlength. The coherent artifact that appears around time zero does not pose severe fitting problems because of the more intense sample signals (i.e., the prominent stimulated emission band from C481) and hence is kept as is (see black traces with some fast wiggles as the fastest component from global analysis, Figure S2) without further processing or in-depth discussion, also due to the focus of this work on the origin of C481 fluorogenicity (insensitive to the coherent artifact around time zero) as a polarity sensor.
2.4. Femtosecond Stimulated Raman Spectroscopy (FSRS)
The detailed description of our home-built wavelength-tunable FSRS setup can be found in our previous publications [25,31,32]. In this work, 400 nm actinic pump (0.3–0.4 mW) was used for photoexcitation of the chromophores in solution. Excited-state FSRS (ES-FSRS) spectra were collected for C481 in methanol (MeOH) and dimethyl sulfoxide (DMSO) with 620 nm Raman pump, and in toluene with 540 nm Raman pump, with an average power of 3–4 mW. To improve the signal-to-noise ratio by resonance Raman enhancement with respect to specific electronic states [21,33], the ground-state FSRS (GS-FSRS, without the actinic pump) spectra were additionally collected with 540 nm Raman pump in MeOH and DMSO as well as 498 nm Raman pump in toluene. All FSRS spectra were collected on the anti-Stokes side (Raman probe is on the higher energy side of Raman pump) [21,34] with parallel polarizations of all the incident laser pulses to increase the signal-to-noise ratio. The pulse duration (full width at half maximum) of our tunable narrowband Raman pump was measured to be ~2 ps [32]. Since the FSRS spectral line shapes could be affected by the relative time delay between the Raman pump and probe pulses [35,36,37], we experimentally optimized the GS-FSRS line shape of the solvent standard to be mostly absorptive (not dispersive) across the detection window before performing the subsequent sample measurements. The ES-FSRS spectra are presented at all the time delay points after the one-to-one subtraction of GS-FSRS spectrum (collected periodically throughout the experiment), so the resultant difference spectrum at each time delay includes ideally the “pure” excited-state Raman peaks and sometimes ground-state bleaching peaks (depending upon the resonance enhancement conditions of the pertinent electronic states) [21,33,38]. The sample solution for FSRS was housed and constantly stirred by a minuscule steel bar in a 1-mm-pathlength quartz cuvette with an OD of ~1.5 per mm. All the spectral data collection was performed at room temperature (22 °C) and under standard atmosphere (1 atm).
2.5. Computational Methods
All the ground- and excited-state calculations were performed with density functional theory (DFT) using Gaussian 16 program [39]. The ground (S0) and excited (S1) singlet state geometries, Raman mode frequencies, and dihedral angle scans were calculated using DFT and time-dependent (TD-)DFT methods, respectively, at the B3LYP level of theory with 6-311G+(d,p) basis sets. The inclusion of dispersion corrections is more relevant for the chromophore in polar solvents to better describe the solvation and entropy effects for the solute-solvent complex, while addressing the over-repulsive nature of the B3LYP potential [40,41]. The solvent effect was accounted for by the implicit integral equation formalism variant polarizable continuum model (IEFPCM) to reduce computational costs and focus on the main electronic effects induced by the solvent on the solute (chromophores). For corroboration, we also used TD-DFT to calculate the absorption peak energy of C481 plus one explicit solvent molecule [42,43] with implicit solvent (IEFPCM) in MeOH [44]. The results show that the S0–S1 energy gap does shrink to some extent due to the inclusion of one explicit MeOH molecule at the C=O end of the chromophore (i.e., 405 to 411 nm), while the experimental value is 402 nm (i.e., a better match to the implicit model). Moreover, since we intended to emphasize the general trend from systematic DFT and TD-DFT calculations of C481 across various solvents, instead of a quantitative match between the experimental and calculated values (e.g., absorption and emission peak energies, excited-state twisting barrier heights), we did not include one or more explicit solvent molecules at various locations within the first solvation shell of C481 in this work. We expect that future studies by theoreticians with advanced computational methods could deepen our understanding of these H-bonding systems with intriguing fluorescence properties.
3. Results and Discussion
3.1. Polarity-Dependent Fluorogenicity of Diethylaminocoumarin in Solvents
Diethylaminocoumarin (C481) in solvents exhibits marked fluorogenicity [18,45]. In polar protic solvents, C481 has small FQYs as low as 0.043 in methanol (water was not measured due to the extremely low solubility [14]). In the much less polar solvents, C481 shows high FQYs up to 0.876 in chloroform, representing a ~20-fold increase from the FQY in methanol (Table 1). This general trend has also been observed previously for amine-containing fluorogens [8], implying the same origin of their fluorogenicity. However, C481 differs from previous fluorogens in the medium-polarity region (i.e., polar aprotic solvents such as DMSO). In these solvents, FQYs of C481 remain low and only show a slight increase with respect to those in polar alcohols (Table 1), in accord with a previous report measuring FQYs of C481 in more solvents with finely tuned solvent polarity parameters [18]. As a result, the FQY of C481 displays a plateau-like correlation with the empirical polarity parameter () [46] in the medium to high polarity region (Figure 1). This pattern is in contrast to our recently reported fluorogen derived from the GFP chromophore whose FQY shows a largely linear relationship with . These systematic results and comparisons between two fluorogens across 11+ solvents indicate that the single parameter is inadequate to accurately describe the solute-solvent interactions, and the fluorogen framework also plays a non-negligible role in these interactions besides the rotatable amine group. In addition, energy gap law could be used to explain the fluorescence quenching behavior [47]. The high sensitivity of FQY to solvent polarity for C481 can be preferentially attributed to TICT for which the diethylamino (–NEt2) group twists toward a dark TICT state. Direct experimental evidence stems from the rigid analogue coumarin 153 (C153) as a control sample, which cannot rotate around the C–N bond due to the conformational locking of the alkyl arms and thus leads to generally larger FQYs than C481 with the additional conformational flexibility (Figure 1). Moreover, C153 exhibits much less FQY variations when compared to C481 in different solvents, albeit a negative correlation between FQY and remains discernable. However, this much weaker polarity sensitivity (about 2.5-fold difference from polar to non-polar solvents) likely arises from very different mechanisms beyond the scope of this work, which we will report in a separate study in order to remain focused here. Nevertheless, the pronounced fluorogenicity with up to ~20-fold FQY increase from polar to nonpolar solvents infers that twisting of the –NEt2 group is the dominant nonradiative pathway for C481 in solution.
Notably, the plots of FQY against solvent polarity () exhibit a similar trend for C481 and C153 (both chromophores show lower FQYs in higher polarity solvents), while in several high polarity solvents, the FQYs of C153 are much larger than C481 (Figure 1). This result indicates that different amino substituents dictate the fluorogenicity of coumarin molecules [14], and in particular, the diethylamino group of C481 can significantly suppress the FQY in polar solvents regardless of their protic or aprotic nature [18,45].
3.2. Elucidation of Solute-Solvent Interactions Affecting TICT Efficiency by Femtosecond Transient Absorption (fs-TA) Spectroscopy
To unravel molecular origin for the solvent-polarity-dependent FQY of C481, we employed fs-TA spectroscopy to track the chromophore’s excited-state electronic dynamics in various solvents, aided by the probe-dependent fits and global analysis [30,31]. In all solvents, C481 exhibits a dominant stimulated emission (SE) band that red-shifts on ultrafast timescales (up to the experimental detection time window of ~1 ns for the majority of TA measurements, see Figure 2a–c and Figure S1), and the SE peak position is corroborated by steady-state fluorescence peak positions (Figure 2d). We performed a series of fs-TA measurements for C481 in 14 solvents with varying polarities to establish the commonly conserved electronic features as SE peak redshift and intensity decay on the sub-nanosecond (sub-ns) to ns timescales, while the continuous redshift of SE band maximum from the first, second, to third EADS is reflective of a typical solvation process (Figure S2, also see below) [31,33,48,49]. One notable exception is C481 in chloroform, which displays two EADS with 1.7 and 30 picosecond (ps) lifetimes prior to the fluorescent state (FS) lifetime of 5.1 ns (Figure S2n), in accord with the previously reported fast component on the ps timescale for tracking the C481 fluorescence dynamics in chloroform [19].
In particular, we selected three representative solvents with different characteristics for an in-depth comparison: polar protic (MeOH), polar aprotic (DMSO), and largely nonpolar aprotic (Toluene) solvents with decreasing polarity. The least-squares fitting results (Figure 2e) show that four components are necessary to adequately fit the SE peak dynamics of C481 in solution. The first 80–300 fs component tracks initial molecular relaxation out of the Franck–Condon region [25,33,50], while two ps components are associated with the continuous rise of SE peak intensity magnitude till reaching its maximal value at a time delay beyond ~10 ps, followed by an intensity decay process. These two ps-timescale components accompany the apparent SE redshift progress (highlighted by orange tilted arrows in Figure 2a–c) due to ultrafast solvation of the photoexcited chromophore that can stabilize the electronic excited state (typically S1 for organic dyes) [31,51,52,53]. Notably, the SE peak redshift magnitudes (MeOH > DMSO > Toluene) are consistent with the solvent-dependent change of Stokes shift values (i.e., 5340 > 4910 > 3660 cm−1, see Table 1), indicating that solvation processes on the ps to tens of ps timescales are an integral part of the excited-state relaxation pathway leading to steady-state fluorescence from a stabilized FS. On the much longer timescale, the ns time constant reflects the fluorescence decay out of the energy-stabilized FS [54], especially since the magic-angle TA measurements effectively eliminated the anisotropy due to molecular reorientations (i.e., rotational motions) [24,27,55,56]. The increase of FS lifetime clearly correlates with the decrease of solvent polarity (see Figure 2f–h for FS lifetimes of 0.44, 0.72, and 5.7 ns in MeOH, DMSO, and Toluene, respectively), in accord with the decay time constants retrieved from the probe-dependent SE peak dynamics (Figure 2e), all with small uncertainties of <5% based on the retrieved values from least-squares fits in Igor Pro (e.g., Figure 2e) and Glotaran (e.g., Figure 2f–h). These consistent results indicate that nonradiative decay pathways (typically more efficient with smaller time constants than the radiative pathway) [24,50,57,58] become dominant in high polarity solvents and thus decrease the apparent FS lifetime as well as the FQY (Table 1).
For a robust comparison between the solvent-dependent excited-state decay pathways, the FS lifetime of C481 in each solvent was systematically obtained by global analysis of the fs-TA spectra across 14 solvents (Figure S2), which shows a general trend of larger values with smaller solvent polarity. The FS lifetime is intrinsically governed by both radiative and nonradiative pathways, and the following equations can be readily used to quantify the contribution of each pathway on the basis of experimental observables:
where is the FQY of chromophore, and are the FS decay time constant (apparent fluorescence lifetime, in typical unit of ns) and rate constant, respectively, while and are rate constants of the radiative and nonradiative decay pathways, respectively, all with the unit of s−1.
Since C481 demonstrates ~20-fold FQY variation across the solvents used whereas the sidechain-twist-inhibited C153 (see Scheme 1) only shows ~2.5-fold variation (Figure 1), we consider that the aforementioned TICT state (see Section 1) likely plays a key role in the substituent-induced fluorescence modulation (i.e., the diethylamino group in C481 dictates its significant fluorogenicity). We note that the specific TICT features are not apparent in fs-TA spectra due to the associated transition oscillator strength being minuscule (see theoretical calculations below and Figure 3), but the related rate constants can be deduced from the experimental FS lifetime, typically when the FS→TICT transition dominates the nonradiative energy relaxation pathway. Through the comparisons of vs. and vs. , a similar linear trend (Figure 2i,j) reveals that is largely invariant with respect to solvent polarity, corroborated by numerical values in Table S1, so the change of dominates the change of (see Equation (5)). In other words, is an alternative way to represent the trend in , which becomes more quantitatively reliable when FQY is low and . The weak yet noticeable linear trend (R2 ≈ 0.6) between and is reminiscent of the Arrhenius equation, suggesting that the FS→TICT activation energy barrier is dependent on solvent polarity (i.e., a lower polarity corresponds to a higher barrier and a smaller , hence higher FQY from the FS).
To substantiate the presence and characteristics of the TICT state, we performed DFT calculations on C481 in various solvents with a main focus on the twisting of the –NEt2 group in the excited state by scanning the twisting coordinate, which was defined as the dihedral angle (θ) between the coumarin backbone and one arm of the –NEt2 group (see Scheme 1 left panel). Two local energy minima were found in all solvents: one can be identified as a bright FS (largely flat –NEt2 geometry, θ ≈ 5–7°) with a notable oscillator strength (e.g., 0.51, 0.47, and 0.36 in MeOH, DMSO, and Toluene, respectively, see Figure S3), while the other lower-energy state shows a perpendicular –NEt2 geometry (θ ≈ 90° with respect to the benzopyrone moiety) with zero oscillator strength, confirming its dark state nature as a TICT state (Figure 3) [8,42,50]. For both FS and TICT states, the HOMO-LUMO transition mainly constitutes the transition between S0 and S1. In the FS state, such a transition exhibits ππ* character with minor intramolecular charger transfer (ICT) from the electron donor (–NEt2 group) to acceptor (–C=O and –CF3 groups) sites [11,45,50]. In the TICT state, the vertical transition becomes nπ* character with a significant ICT from the donor (–NEt2 group) to acceptor sites (both the benzene ring and the second six-membered heterocycle). Such a pattern of transition character change is conserved in three representative solvents (Figure S3), suggesting a common FS→TICT transition pathway in all the solvents studied. Meantime, the calculated dipole moment for the TICT state of C481 in MeOH is ~6.78 Debye, larger than that in Toluene (~5.62 Debye), which signifies more charge-stabilizing effects in high-polarity solvents. In combination with the solvent polarity and FQY, this result suggests that a large dipole moment of the TICT state may be correlated with the solvatochromism and fluorogenicity of C481 by modifying the energetics between higher-lying FS and lower-lying TICT states [8], with the reduced energy gap between TICT and ground state playing an additional role for efficient energy dissipation (see “IC” in Figure 3) [19], which can be further investigated by our recently developed Kamlet–Taft-like analysis of time-resolved spectral data (see below).
Although the FS and TICT energy calculations with a typical –NEt2 dihedral angle twist provide useful insights for the photoexcited C481 in solution, there are some deviations from experimental observations. For instance, the calculations predict slightly decreased energy barriers along the twisting coordinate as the solvent polarity decreases (e.g., from MeOH, DMSO, to Toluene in Figure S3), which contradicts the experimental trend (i.e., barrier height increases from MeOH, DMSO, to Toluene) as indicated by the increasing FQYs (Table 1 and Figure 1). Such deviations likely arise from a less than quantitative description of CT process in the excited state using the TD-DFT/B3LYP/6-311G+(d,p) level of theory and basis sets [59,60] and the lack of consideration of specific solute-solvent H-bonding and/or halogen-bonding interactions in an implicit solvent model (see Section 2.5 above, only an implicit polarizable continuum model was used to treat solvation, since the inclusion of one explicit solvent molecule such as MeOH does not yield noticeable better results for the calculated absorption peak energy of C481 in MeOH) [8,13,42,50]. Nevertheless, the intrinsic nature of the light-induced ICT state in C481 with a rotatable –NEt2 group has been well demonstrated in the literature [14,18,19], including a recent report studying the molecular rotation of –NEt2 group of C481 in methanol-in-oil reverse micelles with several spectroscopic techniques [61]. We deem other reaction coordinates very unlikely because C153 (the control sample, see Figure 1) exhibits consistently higher FQYs than C481 (especially in medium to high polarity solvents) when twisting of the –NEt2 group is effectively inhibited by cycloalkyl-locking in C153. Our experimental results thus provide unambiguous evidence for differences between the transition state and FS in their H-bonding capabilities and dipole moment. The computational aspect of insights into the exact transition state with deeper knowledge is not our focus in this article which covers the comprehensive characterization of a polarity sensor using a wide range of experimental techniques and analytical methods. We hope that such an insightful experimental work could inspire and intrigue more theoreticians to perform pertinent calculations with their expertise in the future.
To disentangle the contributing interactions by solvent molecules to the observed fluorogenicity of solute molecules, we have developed a quantitative method in our recent works [8,16] that effectively correlates the chromophore-twisting rate (like a molecular rotor that undergoes efficient nonradiative relaxation [50,58]) with solvent properties including both electronic (specific and nonspecific) and steric effects. In essence, a linear relationship can be established between the logarithmic twist rate constant, , and multiple solvent parameters (, H-bond donating capability; , H-bond accepting capability; , dipolarity) [46,62]:
where is the intercept of linear regression (i.e., original rate constant without chromophore-solvent interactions), , , are the coefficients for electrostatic parameters , , , respectively, while is a reaction rate dependence factor () on viscosity () [8,63,64]. By sampling a sufficient number of solvents (14 in this work) with various characteristics, while we note that as the dominant nonradiative pathway (see Figure 3) [8], the individual contribution from each solvent parameter can be statistically extracted through the multivariable linear regression (Table S2). We thereby obtained , and all the parameters are statistically significant because the associated p-values are smaller than 0.05 at the 95% confidence level. The positive signs for electrostatic coefficients (, , ) indicate that the H-bonding and dipolar interactions between the chromophore and solvent promote twisting of the –NEt2 group and TICT state formation, consistent with our general observation that the FQY of C481 drops with increased solvent polarity (see Table 1 and Figure 1). In accord with transition state theory, these experimentally retrieved positive coefficients suggest that the transition state (likely with a twisted conformation, see “TS” in Figure 3) has stronger H-bond donating and accepting capabilities and a larger dipole moment than the FS, resulting in a reduced excited-state activation energy barrier toward TICT state in high-polarity solvents. The notable dependence on dipole moment of the solvent ( parameter) differentiates C481 from our recently reported dimethylamino-containing fluorogen with a GFP-chromophore-like two-ring-locked backbone, p-NMe2-m-HBDI:BF2 [8], wherein the dimethylamino group twisting rate lacks the dependence and is predominantly dictated by H-bonding interactions with the solvent. In fact, the larger coefficient of (3.1) than of and ( 1.2, 1.7) indicates the dominance of dipolar interaction over H-bonding interactions in generating the fluorogenicity of C481 (Table S2). These quantitative-analysis-based mechanistic insights highlight the important role of the fluorophore scaffolds in determining the magnitudes of H-bonding strength and dipole moment for FS and transition state in the electronic excited state for such amine-containing molecules.
We note that the analysis for C481 also reveals the correlation of to viscosity (see Table 2 for a summary of Tables S2 and S3), which differs from p-NMe2-m-HBDI:BF2 as well [8]. For the latter fluorogen, we reason that the –NMe2 group is too small to induce significant intermolecular frictions with the solvent molecules and therefore is much less sensitive to viscosity than to electronic effects in the low-viscosity regime. This factor might account for the non-negligible correlation to viscosity for C481 due to the larger size of –NEt2 group, which is a symmetric free rotor with characteristic electrostatic interactions with solvent [19]. However, we could not exclude that the apparent correlation is biased due to the limited solvent sampling (i.e., more solvents with much higher viscosity can be included in future comparative studies, or in other confined environments with controllable viscosity [61]) and the larger p-value (0.03, despite being less than 0.05) than those in association with the other parameters (<0.001, see Table S2) [19,46].
An alternative analysis is to replace from time-resolved TA data with ( from steady-state FQY data (see Equation (5)), provided that does not vary much across different solvents, which can be estimated by the Strickler–Berg equation [65] (mostly accurate for a strongly allowed transition, see Equation (7) below for a simplified version [66,67]) in calculating the radiative decay rate [11,65] and experimentally validated by Table S1. In particular, and represent the observed vertical emission and absorption peak energies (in eV units, which can be converted from peak wavelengths in Table 1) and is the transition oscillator strength of the emitting state that can be taken from the TD-DFT calculation results (see Section 2.5 above, and some representative values in Figure S3):
For example, using the observed vertical transition peak energies from Table 1 and the calculated emission oscillator strengths from Figure S3 for C481 in MeOH (= 0.510), in DMSO ( = 0.471), and in Toluene ( = 0.364), the values can be estimated as ~1.02, 0.98, and 1.01 × 10⁸ s−1, respectively, largely matching the experimentally derived values in Table S1. This way can be treated as a constant and Equation (6) can thus be rewritten as:
The multivariate linear regression analysis yields , supporting the same conclusion as analysis of as shown in Table S2. The similarity of coefficients for and validates that does not vary much across the 14 solvents used and also indicates that is a good indicator (readily obtainable from steady-state electronic spectroscopy) for the nonradiative decay rate when performing the pertinent systematic analysis of an organic chromophore in solution. Moreover, we conducted the aforementioned multivariable analysis without an explicit solvent viscosity parameter, and obtained ; . All the electrostatic polarity parameters still contribute significantly to (p-value < 0.05) but with smaller coefficients, likely owing to the absence of a “counterbalancing” viscosity factor that would hinder the chromophore molecular twisting motions (hence and ) and TICT state formation in solution.
For comparison, we also performed linear regression using the original Kamlet–Taft equation to focus on solvent polarity (without the viscosity component, see Table 2) and listed the results for steady-state absorption and emission peaks in Table S3. All the retrieved coefficients for solvent polarity parameters are negative, indicating increased H-bond accepting and donating capabilities as well as dipole moment in the excited state (except for the absorption peak from the electronic ground state of C481 that lacks the H-bond donating capability, which is expected). This finding is consistent with the light-induced prompt arrival at the planar emissive ICT state near the Franck–Condon region for such 7-aminocoumarins [14]. As mentioned above, the numerical values for the retrieved electrostatic parameter coefficients (, , ) show a notable decrease in magnitude without considering solvent viscosity (see Tables S2 and S3), which substantiates the necessity of a more inclusive analysis (e.g., Equations (6) and (8)) to delineate the intrinsic impact of electrostatic and steric effects of solvent molecules exerted on solute molecules, for a deeper understanding of the C481 fluorogenicity in solution.
Notably, our results demonstrate that the solvent H-bond accepting parameter () makes an appreciable contribution to the –NEt2 group twisting rate (and hence ) while C481 does not have any explicit H-bond donating moieties for such interactions (Scheme 1) [19]. We surmise that this correlation may arise from the halogen bonding interactions between the solvent and –CF3 group (as an electron-withdrawing group at the strategic position 4 of 7-aminocoumarins [14]) of C481. The halogen bond can be strengthened by increasing the electron donating capability or Lewis basicity of the halogen bond acceptor, e.g., the solvent molecule(s). Therefore, the halogen bond accepting capability of the solvent may be numerically in line with the parameter although it is originally used to describe the H-bond accepting capability [11,68,69]. We note that the –CF3 group at 4-position of 7-aminocoumarins has been considered indispensable for the most dramatic response to solvent polarity change [14]; owing to the promotion of ICT and stabilization of TICT state (see below), the halogen-bonding interaction of the –CF3 group (with an increasing electron density in the excited state, see Figure 3) to solvent can thus be considered synergistic for the fluorogenicity of C481.
3.3. FSRS Reveals Structural Dynamics of C481 in the Excited State
The aforementioned systematic fs-TA measurements of C481 in 14 solvents, in combination with several multivariable linear regression approaches, statistical analysis, and DFT calculations, have enabled a quantitative understanding of how the chromophore-solvent interactions energetically affect the FS→TICT transition with a dynamic interplay of and leading to solvent-dependent FQYs. However, it remains unclear how the chromophore structurally interacts with the solvent during these ultrafast ICT and TICT processes. We employed the powerful tunable FSRS technique in our lab [21,25,34,70,71] to capture the signature vibrational modes to shed light on the structural changes during these charge transfer processes, starting from time zero of photoexcitation [5,33,72]. Such a structural dynamics inquiry uniquely positions our study in the molecular “movie” realm of an environment-polarity sensor, with a main focus on the electronic and structural origin of fluorogenicity on the intrinsic fluorescence timescale (typically ns): the limitation of temporal resolution in FSRS for studying extremely short-lived species or impulsively excited wavepackets [73,74] due to the use of a ps Raman pump, fs Raman probe, and a preceding actinic pump with data collection directly in the mixed time-spectral domain (i.e., the system continues to evolve during the vibrational free induction decay while the FSRS signal continues to be accumulated [20,21,75]) thus does not affect data analysis and conclusions in this work. In the broader fields, ultrafast Raman or FSRS technique with wavelength-tunable laser pulses has been implemented to probe and track the C–C stretching modes in photoexcited conjugated materials [76], the C=C stretches in a light-driven molecular motor [77], the C=C stretches during formation of a charge-transfer state en route to singlet fission in crystalline pentacene [78], a ring-breathing mode at ~992 cm−1 (during the vibrational energy transfer from solute chromophore to solvent MeOH) following the intermolecular H-bonding-controlled intersystem crossing of benzophenone in solution [79], both ground and excited state peaks in a model system (cresyl violet) by controlling the time delay between Raman pump and probe pulses [37], the lowest triplet state of 2-phenylthiophene with Raman-pump-wavelength-dependent measurements and aided by excited-state resonance Raman calculations [80], the torsion-angle-dependent vibrational modes in conjugated phenyl and thiophene oligomers aided by higher-level coupled cluster calculations [81], the rhodamine vibrational modes (also including impulsive vibrational spectra) in a thiophene-containing donor-π-acceptor system for effective photosensitizers [82], and a ~1350 cm−1 marker band during the internal ligand photolysis and amino acid binding in heme proteins like cytochrome c and neuroglobin [83]. Such a rich and diverse research landscape portrays an exciting and bright future of ultrafast Raman spectroscopy in delineating more currently hidden yet highly functional excited-state processes in biomolecular systems and novel materials.
We performed both ground- and excited-state FSRS measurements on the anti-Stokes side (bluer Raman probe than Raman pump) with pre-resonance conditions for C481 in three representative solvents (Figure 4a–d): MeOH (Figure 4b), DMSO (Figure 4c), and Toluene (Figure 4d) with different H-bonding and dipolar properties to elucidate their effects on vibrational signatures of the photosensitive chromophore in the ground state and during excited-state relaxation in solution. For ground-state FSRS (see experimental methods in Section 2.4), the 540 nm (for MeOH and DMSO) and 498 nm (for Toluene) Raman pump wavelengths and the bluer Raman probe are pre-resonant with the respective ground-state absorption bands (Figure 2d) and thus generate enhanced Raman peak intensities with non-dispersive line shapes [84,85]. In comparison, the redder Raman pump wavelengths in excited-state FSRS (620 nm for MeOH and DMSO; 540 nm for Toluene) are in pre-resonance with the respective stimulated emission bands (Figure 2a–c), hence enhancing excited-state FSRS peak intensities without notable dispersive line shapes, and meanwhile are largely free from ground-state bleaching due to the very weak, off-resonance ground-state peaks (see upper panels in Figure 4b-d, and more discussions below). In the electronic ground state (S0), most modes of C481 are similar in frequency in all three solvents (Figure 4a), reflecting their weak sensitivity to the chromophore-solvent interactions, corroborated by ground-state DFT calculations (Figure S4). Interestingly, the mode at 1714–1737 cm−1 that is assigned to the C=O stretch coupled with a nearby C=C stretch (see Scheme 1 for C481 chemical structure and Table S4 for Raman mode assignments) exhibits pronounced frequency sensitivity to solvent, corroborated by a linear relationship between the mode frequency and solvent polarity using the scale (Figure 4a inset). This observation infers strong interactions between the C=O site (singular in C481) and solvent molecules. The observed frequency shift is likely caused by both H-bonding and dipolar interactions because the frequency does not linearly correlate with the solvent parameter or alone. Notably, the aforementioned solvatochromic (Kamlet–Taft) analysis shows the and dependence for the absorption of C481 (Table S3), indicating their influence primarily on the electronic ground state (i.e., where the absorption transition originates from). These correlating results reveal a ground-state configuration where the C481 carbonyl interacts with nearby solvent molecules via dipolar and H-bonding (H-bond accepting for the carbonyl group, hence H-bond donating for the solvent) interactions [86] and dominates the chromophore energetics in solution.
Upon photoexcitation, this localized C=O/C=C stretch mode drastically red-shifts by over 55 cm−1 in three representative solvents (see Figure 4b–d and Table S5), indicative of a pronounced ICT from the electron donor –NEt2 group to the –C=O group across the C481 molecular framework. The apparent discrepancy between the observed Raman frequency redshift (through FSRS experiments) and electron density increase at the –C=O moiety (through TD-DFT calculations) might be due to the anti-bonding character of the C=O bond as seen from the calculated electron density distributions of HOMO and LUMO with a node (Figure 3) [72]. The broad and largely featureless spectral baselines drawn for the excited-state FSRS spectra at representative time delay points across the detection window for C481 in MeOH, DMSO, and Toluene (upper panels, Figure S5) enable the “pure” transient Raman peaks to be retrieved (lower panels, Figure S5) with characteristic peak frequency shift patterns probing the ICT process on ultrafast timescales (see below). Moreover, an alternative way to automatize baselines and avoid fixed-pattern-noise used the “spectral watermarking” (with a special chopper blade) of a broadband source [87] instead of a narrowband Raman pump (see Section 2.4 above).
In the excited state, the C=O peak intensity dynamics exhibit a biexponential or triexponential decay: ~30 ps (66%) and 400 ps (34% amplitude weight) in MeOH, 500 fs (26%), 10 ps (6%), and 420 ps (68%) in DMSO, and 25 ps (36%) and 4.7 ns (64%) in Toluene (Figure 4e). Interestingly, the intermediate time constant on the tens of ps timescale (ca. 10–30 ps) corresponds to the SE peak rise in fs-TA spectra (Figure 2e) albeit a C=O stretch mode intensity decay in FSRS spectra (Figure 4e), which indicates a similar electronic transition process in relation to ultrafast solvation and the different factors contributing to the observed signal intensity (e.g., the electric polarizability decrease dominates the betterment of dynamic resonance conditions due to the SE peak redshift, resulting in the apparent FSRS peak decay) [33,85]. Meanwhile, the similar last decay time constants to those in fs-TA (e.g., 0.4 and 5.1 ns in MeOH and Toluene, respectively) indicates that this C=O stretch marker band is associated with a largely planar chromophore structure, benefits from pre-resonance enhancement due to the relative position of the Raman pump at the red edge of SE band (see Figure 2a–c), and thus tracks the FS dynamics [5,27]. The vibrational intensity dynamics (Figure 4e) corroborate the fs-TA results (Figure 2e) that high-polarity solvents promote nonradiative decay pathways of C481, leading to the shortened fluorescence lifetimes.
Notably, unlike the intensity dynamics, the FSRS peak frequency dynamics are not affected by resonance conditions [21,33], which can shed some important light on the electric dipole moment of solute in correlation with the TICT state formation. Due to different peak evolution patterns in the three solvents studied, a clear trend of frequency variation with solvent polarity in the excited state is not as obvious as the ground state. However, a different frequency ordering (e.g., the mode frequency is bluer in DMSO than that in toluene, Figure 4f) can still be discerned. In comparison to the ground state, this result suggests that –C=O may not be the only site that strongly interacts with the solvent. In fact, the aforementioned calculations show that the –CF3 group on the pyran ring of C481 gains significant electron density in the excited state (LUMO) due to ICT, in sharp contrast to the ground state (HOMO) where –CF3 group has no electron density (see Figure 3 and Figure S3). This mechanistic insight also explains the correlation results from Kamlet–Taft analysis of emission (Table S3) and multivariable analysis of fluorogenicity (Table S2), both involving the C481 excited state, which exhibit an unexpected dependence on (solvent H-bond accepting capability) even though the solute has no traditional H-bond donating capability (i.e., the sole –C=O group of C481 can only accept an H-bond). Therefore, as elaborated on the potential halogen bond in Section 3.2 above, we tentatively attribute this additional dependence to halogen bonding between –CF3 and solvent, which becomes more plausible due to the light-induced increase of electron density at the –CF3 moiety. Nevertheless, after the prompt frequency redshift upon electronic excitation (i.e., S0→S1) and ICT from the –NEt2 group toward –C=O and –CF3 moieties, the similar excited-state frequency blueshift for the C=O stretch marker band of C481 in DMSO (ca. 1667 to 1673 cm−1) and Toluene (ca. 1657 to 1666 cm−1, see Figure 4f) commonly tracks the chromophore solvation and vibrational cooling events in these aprotic solvents [33,36,88]. The larger blueshift magnitude of C481 in toluene implies more vibrational cooling in the FS due to a higher FS-to-TICT transition energy barrier (Figure 3) than that in DMSO, in accord with the higher FQY of C481 in toluene (Table 1).
In contrast, the excited-state C=O stretching mode in MeOH displays an initial blueshift (ca. 1658 to 1663 cm−1) and a subsequent redshift (ca. 1663 to 1652 cm−1). Besides the reddest C=O frequencies among three solvents (Figure 4f), the pronounced frequency redshift after ~2 ps substantiates the specific H-bonding interactions between C481 and the protic solvent (MeOH) molecules, likely re-establishing an extended H-bonding network involving the –C=O group on the 21 and 735 ps timescales [89,90], which can be categorized as the establishment of a dynamic equilibrium between the free ICT state and H-bonded ICT state [13]. The longer time constant from the mode frequency dynamics (735 ps) than that from the mode intensity dynamics (400 ps) indicates that the FSRS peak intensity is more intimately related to the electronic dynamics due to the dynamic resonance conditions [21,33,85], whereas the FSRS peak frequency can track more subtle molecular evolution like the H-bonding dynamics within the FS that may contribute to further fluorescence quenching via H-bonds and/or a reduced energy gap between S1 and S0 [11,13,47,91].
4. Conclusions
In summary, the photosensitive 7-diethylaminocoumarin C481 exhibits a significant dependence of FQY (denoted as ) on solvent polarity (~20-fold FQY increase from high- to low-polarity solvents) and the diethylamino group was proven to play a significant role for the C481 fluorogenicity in direct comparison with the cycloalkyl-locked C153 in the same solvents. Based on the fs-TA spectral analysis of C481 across 14 solvents, the fluorescent state (FS) lifetimes due to an interplay between radiative and nonradiative decay pathways were dissected via a series of multivariable linear regression analyses (Table 2), demonstrating a strong correlation with solvent polarity and to a lesser extent, solvent viscosity in the solvents used herein at room temperature. Importantly, systematic analysis of the ratio of both from steady-state FQY measurements (using ) and time-resolved TA results (using ) reveals that the radiative pathway is largely insensitive to solvent polarity, whereas the nonradiative pathway is highly sensitive to solvent polarity due to both specific and non-specific solute-solvent interactions. Quantum calculations for C481 in three representative solvents (MeOH, DMSO, and Toluene) corroborate the existence of a –NEt2-flat FS and –NEt2-twisted TICT state in the electronic excited state (S1), and the variation of FS→TICT transition state energy barriers in solvents with different polarities. Moreover, we performed Kamlet–Taft solvatochromic analysis of steady-state absorption and emission peaks of C481 in various solvents, further supporting that the H-bonding (both donating and accepting) capabilities and dipolarity of the solvent all contribute to the nonradiative decay pathway of the photoexcited C481. Deeper structural dynamics insights into the FS→TICT transition and the “receiving” end(s) of ICT processes were obtained from the C=O stretch marker band, particularly with distinct frequency shift patterns in protic and aprotic solvents, from the excited-state FSRS data of C481 following actinic 400 nm excitation. These correlated experimental and theoretical investigations of a diethylamino-substituted coumarin unveil the fundamental working mechanism of the chromophore fluorogenicity “in action”, which can enable future rational design with molecular precision of environment-polarity sensors for broader sensing, switching, and imaging applications across energy, materials, and biological disciplines.
Supplementary Materials
The following supporting information can be downloaded at: https://www.mdpi.com/article/10.3390/chemosensors10100411/s1, Figure S1: Semilogarithmic contour plots of fs-TA spectra for coumarin 481 (C481) in 14 solvents after 400 nm excitation; Figure S2: Global analysis of fs-TA spectra for C481 in 14 different solvents after 400 nm excitation; Figure S3: Calculated HOMO and LUMO electron density distributions with energies for FS and TICT states of C481 in three representative solvents with decreasing polarity (MeOH > DMSO > Toluene); Figure S4: The experimental and calculated ground state (S0) Raman spectra of C481 in various solvents with decreasing polarity (MeOH > DMSO > Toluene) as retrieved from the GS-FSRS measurements and DFT-B3LYP calculations; Figure S5: Representative FSRS traces with spectral baselines of C481 in MeOH, DMSO, and Toluene after 400 nm excitation; Table S1: Photophysical properties of C481 in various solvents; Table S2: Multivariable regression of nonradiative decay rate constant and ratio of nonradiative over radiative decay rate constants for C481 in solution; Table S3: Kamlet-Taft analysis for absorption and emission peaks of C481; Table S4: Ground state Raman mode assignments for C481 in various solvents; Table S5: Ground (GS, S0) and excited state (ES, S1) Raman marker band for C481 in three solvents with decreasing polarity; Table S6: Quantum (TD-DFT) calculation results with dispersion correction and an explicit solvent molecule for C481 in MeOH; and Supplementary References [92,93,94,95].
Author Contributions
Conceptualization, C.C. and C.F.; methodology, C.C. and C.F.; software, J.L. and C.C.; validation, C.C. and C.F.; formal analysis, J.L.; investigation, J.L. and C.C.; resources, C.F.; data curation, J.L. and C.C.; writing—original draft preparation, J.L. and C.C.; writing—review and editing, C.F.; visualization, J.L. and C.F.; supervision, C.F.; project administration, C.F.; funding acquisition, C.F. All authors have read and agreed to the published version of the manuscript.
Funding
This research was funded by U.S. National Science Foundation (NSF) grant CHE-2003550 to C.F. We acknowledge the Dr. Sheng Chung Fang Scholarship to J.L. (Summer 2022) and the Wei Family Private Foundation Scholarship to J.L. (2020-present).
Institutional Review Board Statement
Not applicable.
Informed Consent Statement
Not applicable.
Data Availability Statement
All data needed to evaluate the conclusions in the paper are present in the paper and the Supplementary Materials.
Conflicts of Interest
The authors declare no conflict of interest.
References
- Zhou, X.X.; Lin, M.Z. Photoswitchable fluorescent proteins: Ten years of colorful chemistry and exciting applications. Curr. Opin. Chem. Biol. 2013, 17, 682–690. [Google Scholar] [CrossRef] [PubMed] [Green Version]
- Shcherbakova, D.M.; Sengupta, P.; Lippincott-Schwartz, J.; Verkhusha, V.V. Photocontrollable fluorescent proteins for superresolution imaging. Annu. Rev. Biophys. 2014, 43, 303–329. [Google Scholar] [CrossRef] [PubMed] [Green Version]
- Grabowski, Z.R.; Rotkiewicz, K.; Rettig, W. Structural changes accompanying intramolecular electron transfer: Focus on twisted intramolecular charge-transfer states and structures. Chem. Rev. 2003, 103, 3899–4032. [Google Scholar] [CrossRef] [PubMed]
- Sasaki, S.; Drummen, G.P.C.; Konishi, G.-I. Recent advances in twisted intramolecular charge transfer (TICT) fluorescence and related phenomena in materials chemistry. J. Mater. Chem. C 2016, 4, 2731–2743. [Google Scholar] [CrossRef] [Green Version]
- Taylor, M.A.; Zhu, L.; Rozanov, N.D.; Stout, K.T.; Chen, C.; Fang, C. Delayed vibrational modulation of the solvated GFP chromophore into a conical intersection. Phys. Chem. Chem. Phys. 2019, 21, 9728–9739. [Google Scholar] [CrossRef] [PubMed]
- Wang, C.; Chi, W.; Qiao, Q.; Tan, D.; Xu, Z.; Liu, X. Twisted intramolecular charge transfer (TICT) and twists beyond TICT: From mechanisms to rational designs of bright and sensitive fluorophores. Chem. Soc. Rev. 2021, 50, 12656–12678. [Google Scholar] [CrossRef] [PubMed]
- Liu, X.; Chi, W.; Qiao, Q.; Kokate, S.V.; Cabrera, E.P.; Xu, Z.; Liu, X.; Chang, Y.-T. Molecular mechanism of viscosity sensitivity in BODIPY rotors and application to motion-based fluorescent sensors. ACS Sens. 2020, 5, 731–739. [Google Scholar] [CrossRef]
- Chen, C.; Boulanger, S.A.; Sokolov, A.I.; Baranov, M.S.; Fang, C. A novel dialkylamino GFP chromophore as an environment-polarity sensor reveals the role of twisted intramolecular charge transfer. Chemosensors 2021, 9, 234. [Google Scholar] [CrossRef]
- Grimm, J.B.; English, B.P.; Chen, J.; Slaughter, J.P.; Zhang, Z.; Revyakin, A.; Patel, R.; Macklin, J.J.; Normanno, D.; Singer, R.H.; et al. A general method to improve fluorophores for live-cell and single-molecule microscopy. Nat. Methods 2015, 12, 244–250. [Google Scholar] [CrossRef]
- Mei, J.; Leung, N.L.C.; Kwok, R.T.K.; Lam, J.W.Y.; Tang, B.Z. Aggregation-induced emission: Together we shine, united we soar! Chem. Rev. 2015, 115, 11718–11940. [Google Scholar] [CrossRef]
- Boulanger, S.A.; Chen, C.; Tang, L.; Zhu, L.; Baleeva, N.S.; Myasnyanko, I.N.; Baranov, M.S.; Fang, C. Shedding light on ultrafast ring-twisting pathways of halogenated GFP chromophores from the excited to ground state. Phys. Chem. Chem. Phys. 2021, 23, 14636–14648. [Google Scholar] [CrossRef] [PubMed]
- Rappoport, D.; Furche, F. Photoinduced intramolecular charge transfer in 4-(dimethyl)aminobenzonitrile—A theoretical perspective. J. Am. Chem. Soc. 2004, 126, 1277–1284. [Google Scholar] [CrossRef] [PubMed]
- Chipem, F.A.S.; Mishra, A.; Krishnamoorthy, G. The role of hydrogen bonding in excited state intramolecular charge transfer. Phys. Chem. Chem. Phys. 2012, 14, 8775–8790. [Google Scholar] [CrossRef] [PubMed]
- Jones, G.; Jackson, W.R.; Choi, C.Y.; Bergmark, W.R. Solvent effects on emission yield and lifetime for coumarin laser dyes. Requirements for a rotatory decay mechanism. J. Phys. Chem. 1985, 89, 294–300. [Google Scholar] [CrossRef]
- Jones, G., II; Feng, Z.; Bergmark, W.R. Photophysical properties of (dimethylamino)anthraquinones: Radiationless transitions in solvent and polyelectrolyte media. J. Phys. Chem. 1994, 98, 4511–4516. [Google Scholar] [CrossRef]
- Chen, C.; Tachibana, S.R.; Baleeva, N.S.; Myasnyanko, I.N.; Bogdanov, A.M.; Gavrikov, A.S.; Mishin, A.S.; Malyshevskaya, K.K.; Baranov, M.S.; Fang, C. Developing bright green fluorescent protein (GFP)-like fluorogens for live-cell imaging with nonpolar protein–chromophore interactions. Chem. Eur. J. 2021, 27, 8946–8950. [Google Scholar] [CrossRef]
- Rechthaler, K.; Köhler, G. Excited state properties and deactivation pathways of 7-aminocoumarins. Chem. Phys. 1994, 189, 99–116. [Google Scholar] [CrossRef]
- Nad, S.; Kumbhakar, M.; Pal, H. Photophysical properties of coumarin-152 and coumarin-481 dyes: Unusual behavior in nonpolar and in higher polarity solvents. J. Phys. Chem. A 2003, 107, 4808–4816. [Google Scholar] [CrossRef]
- Das, K.; Jain, B.; Patel, H.S. Hydrogen bonding properties of coumarin 151, 500, and 35: The effect of substitution at the 7-amino position. J. Phys. Chem. A 2006, 110, 1698–1704. [Google Scholar] [CrossRef]
- Dietze, D.R.; Mathies, R.A. Femtosecond stimulated Raman spectroscopy. ChemPhysChem 2016, 17, 1224–1251. [Google Scholar] [CrossRef]
- Fang, C.; Tang, L.; Oscar, B.G.; Chen, C. Capturing structural snapshots during photochemical reactions with ultrafast Raman spectroscopy: From materials transformation to biosensor responses. J. Phys. Chem. Lett. 2018, 9, 3253–3263. [Google Scholar] [CrossRef] [PubMed]
- Rurack, K.; Spieles, M. Fluorescence quantum yields of a series of red and near-infrared dyes emitting at 600–1000 nm. Anal. Chem. 2011, 83, 1232–1242. [Google Scholar] [CrossRef] [PubMed]
- Würth, C.; Grabolle, M.; Pauli, J.; Spieles, M.; Resch-Genger, U. Relative and absolute determination of fluorescence quantum yields of transparent samples. Nat. Protoc. 2013, 8, 1535–1550. [Google Scholar] [CrossRef] [PubMed]
- Krueger, T.D.; Boulanger, S.A.; Zhu, L.; Tang, L.; Fang, C. Discovering a rotational barrier within a charge-transfer state of a photoexcited chromophore in solution. Struct. Dyn. 2020, 7, 024901. [Google Scholar] [CrossRef] [PubMed] [Green Version]
- Liu, W.; Wang, Y.; Tang, L.; Oscar, B.G.; Zhu, L.; Fang, C. Panoramic portrait of primary molecular events preceding excited state proton transfer in water. Chem. Sci. 2016, 7, 5484–5494. [Google Scholar] [CrossRef] [Green Version]
- Tang, L.; Zhu, L.; Taylor, M.A.; Wang, Y.; Remington, S.J.; Fang, C. Excited state structural evolution of a GFP single-site mutant tracked by tunable femtosecond-stimulated Raman spectroscopy. Molecules 2018, 23, 2226. [Google Scholar] [CrossRef] [Green Version]
- Chen, C.; Zhu, L.; Baranov, M.S.; Tang, L.; Baleeva, N.S.; Smirnov, A.Y.; Yampolsky, I.V.; Solntsev, K.M.; Fang, C. Photoinduced proton transfer of GFP-inspired fluorescent superphotoacids: Principles and design. J. Phys. Chem. B 2019, 123, 3804–3821. [Google Scholar] [CrossRef]
- Hong, M.J.; Zhu, L.; Chen, C.; Tang, L.; Lin, Y.-H.; Li, W.; Johnson, R.; Chattopadhyay, S.; Snaith, H.J.; Fang, C.; et al. Time-resolved changes in dielectric constant of metal halide perovskites under illumination. J. Am. Chem. Soc. 2020, 142, 19799–19803. [Google Scholar] [CrossRef]
- Snellenburg, J.J.; Laptenok, S.P.; Seger, R.; Mullen, K.M.; van Stokkum, I.H.M. Glotaran: A Java-based graphical user interface for the R-package TIMP. J. Stat. Softw. 2012, 49, 1–22. [Google Scholar] [CrossRef] [Green Version]
- Van Stokkum, I.H.M.; Larsen, D.S.; van Grondelle, R. Global and target analysis of time-resolved spectra. Biochim. Biophys. Acta 2004, 1657, 82–104. [Google Scholar] [CrossRef]
- Chen, C.; Liu, W.; Baranov, M.S.; Baleeva, N.S.; Yampolsky, I.V.; Zhu, L.; Wang, Y.; Shamir, A.; Solntsev, K.M.; Fang, C. Unveiling structural motions of a highly fluorescent superphotoacid by locking and fluorinating the GFP chromophore in solution. J. Phys. Chem. Lett. 2017, 8, 5921–5928. [Google Scholar] [CrossRef] [PubMed] [Green Version]
- Zhu, L.; Liu, W.; Fang, C. A versatile femtosecond stimulated Raman spectroscopy setup with tunable pulses in the visible to near infrared. Appl. Phys. Lett. 2014, 105, 041106. [Google Scholar]
- Fang, C.; Tang, L.; Chen, C. Unveiling coupled electronic and vibrational motions of chromophores in condensed phases. J. Chem. Phys. 2019, 151, 200901. [Google Scholar] [CrossRef] [PubMed]
- Liu, W.; Tang, L.; Oscar, B.G.; Wang, Y.; Chen, C.; Fang, C. Tracking ultrafast vibrational cooling during excited state proton transfer reaction with anti-Stokes and Stokes femtosecond stimulated Raman spectroscopy. J. Phys. Chem. Lett. 2017, 8, 997–1003. [Google Scholar] [CrossRef] [PubMed]
- Yoon, S.; McCamant, D.W.; Kukura, P.; Mathies, R.A.; Zhang, D.; Lee, S.-Y. Dependence of line shapes in femtosecond broadband stimulated Raman spectroscopy on pump-probe time delay. J. Chem. Phys. 2005, 122, 024505. [Google Scholar] [CrossRef] [Green Version]
- Weigel, A.; Dobryakov, A.; Klaumünzer, B.; Sajadi, M.; Saalfrank, P.; Ernsting, N.P. Femtosecond stimulated Raman spectroscopy of flavin after optical excitation. J. Phys. Chem. B 2011, 115, 3656–3680. [Google Scholar] [CrossRef]
- Batignani, G.; Ferrante, C.; Scopigno, T. Accessing excited state molecular vibrations by femtosecond stimulated Raman spectroscopy. J. Phys. Chem. Lett. 2020, 11, 7805–7813. [Google Scholar] [CrossRef]
- Kukura, P.; McCamant, D.W.; Mathies, R.A. Femtosecond stimulated Raman spectroscopy. Annu. Rev. Phys. Chem. 2007, 58, 461–488. [Google Scholar] [CrossRef]
- Frisch, M.J.; Trucks, G.W.; Schlegel, H.B.; Scuseria, G.E.; Robb, M.A.; Cheeseman, J.R.; Scalmani, G.; Barone, V.; Petersson, G.A.; Nakatsuji, H.; et al. Gaussian 16, Revision C.01; Gaussian, Inc.: Wallingford, CT, USA, 2016. [Google Scholar]
- Grimme, S.; Antony, J.; Ehrlich, S.; Krieg, H. A consistent and accurate ab initio parametrization of density functional dispersion correction (DFT-D) for the 94 elements H-Pu. J. Chem. Phys. 2010, 132, 154104. [Google Scholar] [CrossRef] [Green Version]
- Korth, M.; Pitoňák, M.; Řezáč, J.; Hobza, P. A transferable H-bonding correction for semiempirical quantum-chemical methods. J. Chem. Theory Comput. 2010, 6, 344–352. [Google Scholar] [CrossRef]
- Tang, L.; Fang, C. Nitration of tyrosine channels photoenergy through a conical intersection in water. J. Phys. Chem. B 2019, 123, 4915–4928. [Google Scholar] [CrossRef] [PubMed]
- Zhang, J.; Zhang, H.; Wu, T.; Wang, Q.; van der Spoel, D. Comparison of implicit and explicit solvent models for the calculation of solvation free energy in organic solvents. J. Chem. Theory Comput. 2017, 13, 1034–1043. [Google Scholar] [CrossRef] [PubMed]
- Mennucci, B. Hydrogen bond versus polar effects: An ab initio analysis on n → π* absorption spectra and N nuclear shieldings of diazines in solution. J. Am. Chem. Soc. 2002, 124, 1506–1515. [Google Scholar] [CrossRef]
- Dahiya, P.; Kumbhakar, M.; Mukherjee, T.; Pal, H. Effect of protic solvents on twisted intramolecular charge transfer state formation in coumarin-152 and coumarin-481 dyes. Chem. Phys. Lett. 2005, 414, 148–154. [Google Scholar] [CrossRef]
- Reichardt, C. Solvatochromic dyes as solvent polarity indicators. Chem. Rev. 1994, 94, 2319–2358. [Google Scholar] [CrossRef]
- Doroshenko, A.O.; Bilokin, M.D.; Pivovarenko, V.G. New fluorescent dye of dibenzalcyclopentanone series possessing increased solvatochromism and “energy gap law” regulated fluorescence quenching in polar solvents. J. Photochem. Photobiol. A Chem. 2004, 163, 95–102. [Google Scholar] [CrossRef]
- Castner, E.W.; Bagchi, B.; Maroncelli, M.; Webb, S.P.; Ruggiero, A.J.; Fleming, G.R. The dynamics of polar solvation. Ber. Bunsen-Ges. Phys. Chem. 1988, 92, 363–372. [Google Scholar] [CrossRef]
- Horng, M.L.; Gardecki, J.A.; Papazyan, A.; Maroncelli, M. Subpicosecond measurements of polar solvation dynamics: Coumarin 153 revisited. J. Phys. Chem. 1995, 99, 17311–17337. [Google Scholar] [CrossRef]
- Kumpulainen, T.; Lang, B.; Rosspeintner, A.; Vauthey, E. Ultrafast elementary photochemical processes of organic molecules in liquid solution. Chem. Rev. 2017, 117, 10826–10939. [Google Scholar] [CrossRef]
- Maroncelli, M.; Fleming, G.R. Picosecond solvation dynamics of coumarin 153: The importance of molecular aspects of solvation. J. Chem. Phys. 1987, 86, 6221–6239. [Google Scholar] [CrossRef] [Green Version]
- Pérez-Lustres, J.L.; Rodriguez-Prieto, F.; Mosquera, M.; Senyushkina, T.A.; Ernsting, N.P.; Kovalenko, S.A. Ultrafast proton transfer to solvent: Molecularity and intermediates from solvation- and diffusion-controlled regimes. J. Am. Chem. Soc. 2007, 129, 5408–5418. [Google Scholar] [CrossRef] [PubMed]
- Tang, L.; Zhu, L.; Wang, Y.; Fang, C. Uncovering the hidden excited state toward fluorescence of an intracellular pH indicator. J. Phys. Chem. Lett. 2018, 9, 4969–4975. [Google Scholar] [CrossRef] [PubMed]
- Verma, P.; Pal, H. Unusual H-type aggregation of coumarin-481 dye in polar organic solvents. J. Phys. Chem. A 2013, 117, 12409–12418. [Google Scholar] [CrossRef] [PubMed]
- Berera, R.; van Grondelle, R.; Kennis, J.M. Ultrafast transient absorption spectroscopy: Principles and application to photosynthetic systems. Photosynth. Res. 2009, 101, 105–118. [Google Scholar] [CrossRef] [PubMed] [Green Version]
- Krueger, T.D.; Solaris, J.; Tang, L.; Zhu, L.; Webber, C.; Van Court, R.C.; Robinson, S.C.; Ostroverkhova, O.; Fang, C. Illuminating excited-state intramolecular proton transfer of a fungi-derived red pigment for sustainable functional materials. J. Phys. Chem. C 2022, 126, 459–477. [Google Scholar] [CrossRef]
- Webber, N.M.; Litvinenko, K.L.; Meech, S.R. Radiationless relaxation in a synthetic analogue of the green fluorescent protein chromophore. J. Phys. Chem. B 2001, 105, 8036–8039. [Google Scholar] [CrossRef] [Green Version]
- Amdursky, N.; Erez, Y.; Huppert, D. Molecular rotors: What lies behind the high sensitivity of the thioflavin-T fluorescent marker. Acc. Chem. Res. 2012, 45, 1548–1557. [Google Scholar] [CrossRef]
- Iikura, H.; Tsuneda, T.; Yanai, T.; Hirao, K. A long-range correction scheme for generalized-gradient-approximation exchange functionals. J. Chem. Phys. 2001, 115, 3540–3544. [Google Scholar] [CrossRef]
- Rohrdanz, M.A.; Martins, K.M.; Herbert, J.M. A long-range-corrected density functional that performs well for both ground-state properties and time-dependent density functional theory excitation energies, including charge-transfer excited states. J. Chem. Phys. 2009, 130, 054112. [Google Scholar] [CrossRef] [Green Version]
- Shabbir, A.; Jang, T.; Lee, G.; Pang, Y. Intramolecular charge transfer of coumarin dyes confined in methanol-in-oil reverse micelles. J. Mol. Liq. 2022, 346, 118313. [Google Scholar] [CrossRef]
- Kamlet, M.J.; Abboud, J.-L.M.; Abraham, M.H.; Taft, R.W. Linear solvation energy relationships. 23. A comprehensive collection of the solvatochromic parameters, π*, α, and β, and some methods for simplifying the generalized solvatochromic equation. J. Org. Chem. 1983, 48, 2877–2887. [Google Scholar] [CrossRef]
- Rettig, W.; Fritz, R.; Braun, D. Combination of pressure and temperature dependent measurements: A simple access to intrinsic thermal activation energies. J. Phys. Chem. A 1997, 101, 6830–6835. [Google Scholar] [CrossRef]
- Litvinenko, K.L.; Webber, N.M.; Meech, S.R. Internal conversion in the chromophore of the green fluorescent protein: Temperature dependence and isoviscosity analysis. J. Phys. Chem. A 2003, 107, 2616–2623. [Google Scholar] [CrossRef]
- Strickler, S.J.; Berg, R.A. Relationship between absorption intensity and fluorescence lifetime of molecules. J. Chem. Phys. 1962, 37, 814–822. [Google Scholar] [CrossRef] [Green Version]
- Shi, J.; Aguilar Suarez, L.E.; Yoon, S.-J.; Varghese, S.; Serpa, C.; Park, S.Y.; Lüer, L.; Roca-Sanjuán, D.; Milián-Medina, B.; Gierschner, J. Solid state luminescence enhancement in π-conjugated materials: Unraveling the mechanism beyond the framework of AIE/AIEE. J. Phys. Chem. C 2017, 121, 23166–23183. [Google Scholar] [CrossRef]
- Shi, J.; Izquierdo, M.A.; Oh, S.; Park, S.Y.; Milián-Medina, B.; Roca-Sanjuán, D.; Gierschner, J. Inverted energy gap law for the nonradiative decay in fluorescent floppy molecules: Larger fluorescence quantum yields for smaller energy gaps. Org. Chem. Front. 2019, 6, 1948–1954. [Google Scholar] [CrossRef]
- Erdélyi, M. Halogen bonding in solution. Chem. Soc. Rev. 2012, 41, 3547–3557. [Google Scholar] [CrossRef]
- Cavallo, G.; Metrangolo, P.; Milani, R.; Pilati, T.; Priimagi, A.; Resnati, G.; Terraneo, G. The halogen bond. Chem. Rev. 2016, 116, 2478–2601. [Google Scholar] [CrossRef] [Green Version]
- Liu, W.; Han, F.; Smith, C.; Fang, C. Ultrafast conformational dynamics of pyranine during excited state proton transfer in aqueous solution revealed by femtosecond stimulated Raman spectroscopy. J. Phys. Chem. B 2012, 116, 10535–10550. [Google Scholar] [CrossRef]
- Chen, C.; Zhu, L.; Fang, C. Femtosecond stimulated Raman line shapes: Dependence on resonance conditions of pump and probe pulses. Chin. J. Chem. Phys. 2018, 31, 492–502. [Google Scholar] [CrossRef] [Green Version]
- Tang, L.; Zhu, L.; Ener, M.E.; Gao, H.; Wang, Y.; Groves, J.T.; Spiro, T.G.; Fang, C. Photoinduced charge flow inside an iron porphyrazine complex. Chem. Commun. 2019, 55, 13606–13609. [Google Scholar] [CrossRef]
- Mukamel, S.; Biggs, J.D. Communication: Comment on the effective temporal and spectral resolution of impulsive stimulated Raman signals. J. Chem. Phys. 2011, 134, 161101. [Google Scholar] [CrossRef] [PubMed]
- Fumero, G.; Batignani, G.; Dorfman, K.E.; Mukamel, S.; Scopigno, T. On the resolution limit of femtosecond stimulated Raman spectroscopy: Modelling fifth-order signals with overlapping pulses. ChemPhysChem 2015, 16, 3438–3443. [Google Scholar] [CrossRef] [PubMed]
- Kukura, P.; McCamant, D.W.; Yoon, S.; Wandschneider, D.B.; Mathies, R.A. Structural observation of the primary isomerization in vision with femtosecond-stimulated Raman. Science 2005, 310, 1006–1009. [Google Scholar] [CrossRef] [PubMed] [Green Version]
- Zhou, J.; Yu, W.; Bragg, A.E. Structural relaxation of photoexcited quaterthiophenes probed with vibrational specificity. J. Phys. Chem. Lett. 2015, 6, 3496–3502. [Google Scholar] [CrossRef] [PubMed]
- Hall, C.R.; Conyard, J.; Heisler, I.A.; Jones, G.; Frost, J.; Browne, W.R.; Feringa, B.L.; Meech, S.R. Ultrafast dynamics in light-driven molecular rotary motors probed by femtosecond stimulated Raman spectroscopy. J. Am. Chem. Soc. 2017, 139, 7408–7414. [Google Scholar] [CrossRef] [PubMed] [Green Version]
- Hart, S.M.; Silva, W.R.; Frontiera, R.R. Femtosecond stimulated Raman evidence for charge-transfer character in pentacene singlet fission. Chem. Sci. 2018, 9, 1242–1250. [Google Scholar] [CrossRef] [PubMed] [Green Version]
- Venkatraman, R.K.; Kayal, S.; Barak, A.; Orr-Ewing, A.J.; Umapathy, S. Intermolecular hydrogen bonding controlled intersystem crossing rates of benzophenone. J. Phys. Chem. Lett. 2018, 9, 1642–1648. [Google Scholar] [CrossRef] [Green Version]
- Barclay, M.S.; Caricato, M.; Elles, C.G. Femtosecond stimulated Raman scattering from triplet electronic states: Experimental and theoretical study of resonance enhancements. J. Phys. Chem. A 2019, 123, 7720–7732. [Google Scholar] [CrossRef]
- Barclay, M.S.; Elles, C.G.; Caricato, M. On the discrepancy between experimental and calculated Raman intensities for conjugated phenyl and thiophene derivatives. J. Phys. Chem. A 2020, 124, 4678–4689. [Google Scholar] [CrossRef]
- Piontkowski, Z.; McCamant, D.W. Excited-state planarization in donor–bridge dye sensitizers: Phenylene versus thiophene bridges. J. Am. Chem. Soc. 2018, 140, 11046–11057. [Google Scholar] [CrossRef] [PubMed]
- Ferrante, C.; Batignani, G.; Pontecorvo, E.; Montemiglio, L.C.; Vos, M.H.; Scopigno, T. Ultrafast dynamics and vibrational relaxation in six-coordinate heme proteins revealed by femtosecond stimulated Raman spectroscopy. J. Am. Chem. Soc. 2020, 142, 2285–2292. [Google Scholar] [CrossRef] [PubMed]
- Umapathy, S.; Mallick, B.; Lakshmanna, A. Mode-dependent dispersion in Raman line shapes: Observation and implications from ultrafast Raman loss spectroscopy. J. Chem. Phys. 2010, 133, 024505. [Google Scholar] [CrossRef] [PubMed]
- Oscar, B.G.; Chen, C.; Liu, W.; Zhu, L.; Fang, C. Dynamic Raman line shapes on an evolving excited-state landscape: Insights from tunable femtosecond stimulated Raman spectroscopy. J. Phys. Chem. A 2017, 121, 5428–5441. [Google Scholar] [CrossRef]
- Weaver, J.B.; Kozuch, J.; Kirsh, J.M.; Boxer, S.G. Nitrile infrared intensities characterize electric fields and hydrogen bonding in protic, aprotic, and protein environments. J. Am. Chem. Soc. 2022, 144, 7562–7567. [Google Scholar] [CrossRef]
- Kloz, M.; Weißenborn, J.; Polívka, T.; Frank, H.A.; Kennis, J.T.M. Spectral watermarking in femtosecond stimulated Raman spectroscopy: Resolving the nature of the carotenoid S* state. Phys. Chem. Chem. Phys. 2016, 18, 14619–14628. [Google Scholar] [CrossRef] [Green Version]
- Tang, L.; Wang, Y.; Zhu, L.; Lee, C.; Fang, C. Correlated molecular structural motions for photoprotection after deep-UV irradiation. J. Phys. Chem. Lett. 2018, 9, 2311–2319. [Google Scholar] [CrossRef]
- Bakker, H.J. Structural dynamics of aqueous salt solutions. Chem. Rev. 2008, 108, 1456–1473. [Google Scholar] [CrossRef]
- Siwick, B.J.; Cox, M.J.; Bakker, H.J. Long-range proton transfer in aqueous acid-base reactions. J. Phys. Chem. B 2008, 112, 378–389. [Google Scholar] [CrossRef]
- Huang, G.-J.; Ho, J.-H.; Prabhakar, C.; Liu, Y.-H.; Peng, S.-M.; Yang, J.-S. Site-selective hydrogen-bonding-induced fluorescence quenching of highly solvatofluorochromic GFP-like chromophores. Org. Lett. 2012, 14, 5034–5037. [Google Scholar] [CrossRef]
- Chen, C.; Tutol, J.N.; Tang, L.; Zhu, L.; Ong, W.S.Y.; Dodani, S.C.; Fang, C. Excitation ratiometric chloride sensing in a standalone yellow fluorescent protein is powered by the interplay between proton transfer and conformational reorganization. Chem. Sci. 2021, 12, 11382–11393. [Google Scholar] [CrossRef] [PubMed]
- Boulanger, S.A.; Chen, C.; Myasnyanko, I.N.; Sokolov, A.I.; Baranov, M.S.; Fang, C. Excited-state dynamics of a meta-dimethylamino locked GFP chromophore as a fluorescence turn-on water sensor. Photochem. Photobiol. 2022, 98, 311–324. [Google Scholar] [CrossRef] [PubMed]
- Jones, G.; Jackson, W.R.; Halpern, A.M. Medium effects on fluorescence quantum yields and lifetimes for coumarin laser dyes. Chem. Phys. Lett. 1980, 72, 391–395. [Google Scholar] [CrossRef]
- Nibbering, E.T.J.; Fidder, H.; Pines, E. Ultrafast chemistry: Using time-resolved vibrational spectroscopy for interrogation of structural dynamics. Annu. Rev. Phys. Chem. 2005, 56, 337–367. [Google Scholar] [CrossRef] [PubMed]
Scheme 1.
Structures of C481 and C153 with their different molecular compositions highlighted in red. The dihedral angle for the diethylamino group twisting motion is denoted by (a, b, c, d) on the pertinent atoms of C481.
Scheme 1.
Structures of C481 and C153 with their different molecular compositions highlighted in red. The dihedral angle for the diethylamino group twisting motion is denoted by (a, b, c, d) on the pertinent atoms of C481.

Figure 1.
FQY comparison between C481 (squares) and C153 (circles) in various solvents (color-coded) being measured for both chromophores. The notable jump of FQY values from DMF to DCM can be correlated with time-resolved spectral data and insights (see below).
Figure 1.
FQY comparison between C481 (squares) and C153 (circles) in various solvents (color-coded) being measured for both chromophores. The notable jump of FQY values from DMF to DCM can be correlated with time-resolved spectral data and insights (see below).

Figure 2.
Steady-state and excited-state electronic spectroscopy of C481 in various solvents. Semilogarithmic contour plots of fs-TA spectra for C481 in (a) MeOH, (b) DMSO, and (c) Toluene after 400 nm excitation. The color bar is shown in the milli-optical density (mOD) unit. Orange arrows highlight the stimulated emission (SE) signal intensity magnitude increase and peak redshift. The Raman pump wavelengths for excited-state FSRS measurements are denoted by vertical dashed gray lines. (d) Steady-state absorption (Abs., solid) and emission (Em., dashed) spectra of C481 in three solvents: MeOH (black), DMSO (blue), and Toluene (red). The Raman pump wavelengths for ground-state FSRS measurements are denoted by vertical gray arrows at 498 nm for C481 in Toluene and 540 nm for C481 in MeOH and DMSO. (e) Probe-dependent TA signal at the SE peak region (data points) with multi-exponential least-squares fits (solid lines) that are color-coded with three solvents. The retrieved time constants are listed by their associated dynamic components. The evolution-associated difference spectra (EADS) of fs-TA spectra of C481 in (f) MeOH, (g) DMSO, and (h) Toluene with the retrieved lifetimes color-coded and listed below each panel. FS: fluorescent state. The base 10 logarithmic plots of (i) nonradiative rate constants and (j) ratios of over (i.e., ) against the solvent polarity parameter (color-coded for 14 solvents). The adjusted R2 values are listed in the insets to reflect the quality of linear correlation.

Figure 3.
Schematic of potential energy surfaces of C481 in solution as a function of the diethylamino group twisting angle. The calculated frontier molecular orbitals in S0 (HOMO, H) and S1 (LUMO, L) for C481 with electronic density maps are shown in FS and TICT states, through a transition state (TS). Radiative () and nonradiative ( = ) rate constants are denoted by their associated processes. Ex., excitation (blue solid arrow upward); Fl., fluorescence (green wavy line downward); IC, internal conversion (black dashed line downward, a nonradiative transition).

Figure 4.
Vibrational signatures delineate the non-equilibrium structural dynamics of photoexcited chromophore C481 in various solvents. (a) Ground-state FSRS of C481 in MeOH (black), DMSO (blue), and Toluene (red) with a linear correlation between the C=O stretching mode frequency and solvent polarity displayed in the inset. Pronounced vibrational mode frequencies are listed by the respective peaks (color-coded with three solvents, see Table S4 for mode assignments). Semilogarithmic contour plots for the excited state (ES, top; after 400 nm excitation) and the separately collected ground state (GS, bottom) FSRS spectra on the anti-Stokes side for C481 in (b) MeOH, (c) DMSO, and (d) Toluene. The C=O stretch marker band frequencies and shift trend from GS to ES are highlighted by solid and dashed arrows. Excited-state Raman (e) intensity dynamics and (f) peak frequency shift of C481 in MeOH (black triangles), DMSO (blue squares), and Toluene (red circles) are overlaid with the least-squares multiexponential fits (color-coded solid lines). The retrieved time constants are denoted by the respective arrows. In panel e, the initial time constant has a (+) or (−) sign to denote an intensity rise or decay component, and the negative intensity data points are scaled to normalize the associated least-squares fits (color-coded solid traces) at the peak magnitude region for a better comparison of the fit quality and trend of C481 in three solvents.


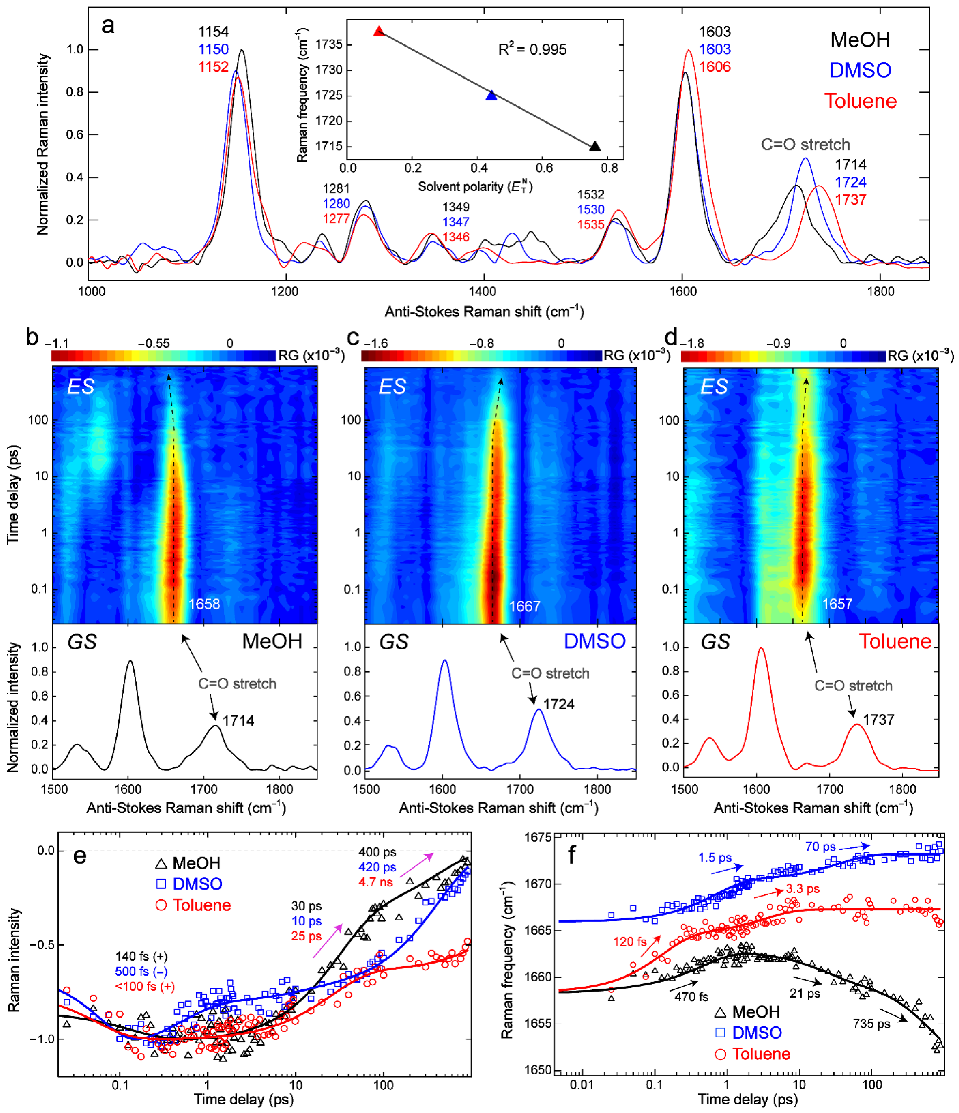
Table 1.
Solvatochromism and FQYs of C481 in 14 solvents with different polarities (solvents with significantly higher FQYs are highlighted by light gray shades) *.
Table 1.
Solvatochromism and FQYs of C481 in 14 solvents with different polarities (solvents with significantly higher FQYs are highlighted by light gray shades) *.
| Solvent | λabs/λem (nm) | Stokes Shift (cm−1) | FQY (%) | |
|---|---|---|---|---|
| TFE | 0.898 | 414/515 | 4740 | 6.3 |
| MeOH | 0.762 | 402/512 | 5340 | 4.3 |
| EtOH | 0.654 | 401/504 | 5100 | 8.6 |
| 1-PrOH | 0.617 | 402/500 | 4880 | 15.0 |
| 2-PrOH | 0.546 | 400/496 | 4840 | 18.4 |
| ACN | 0.460 | 399/495 | 4860 | 8.2 |
| DMSO | 0.444 | 406/507 | 4910 | 7.1 |
| DMF | 0.386 | 403/498 | 4730 | 7.2 |
| Acetone | 0.355 | 398/490 | 4720 | 14.1 |
| DCM | 0.309 | 400/474 | 3900 | 85.3 |
| CHCl3 | 0.259 | 399/464 | 3510 | 87.6 |
| EtOAc | 0.228 | 393/474 | 4350 | 76.0 |
| Dioxane | 0.164 | 389/465 | 4200 | 84.0 |
| Toluene | 0.099 | 390/455 | 3660 | 85.0 |
* The common solvent names of acetone ((CH3)2CO), dioxane (C4H8O2), and toluene (C7H8) are capitalized to be visually consistent with the other abbreviated solvent names in this work (text, figures, and tables).
Table 2.
Multivariable analysis of the solvatochromism and fluorogenicity of C481.
| Coefficients | ||||
|---|---|---|---|---|
| absorption * | −0.72 | − | −1.91 | − |
| emission * | −1.26 | −1.28 | −3.24 | − |
| † | 1.24 | 1.71 | 3.09 | 0.98 |
| † | 1.36 | 1.87 | 3.40 | 0.99 |
* The units of coefficients and pertinent energy values (see Table S3) are 103 cm−1. Note that the viscosity factor is not included in the conventional Kamlet-Taft analysis for the solvatochromism (color) of C481. The intercept for the linear regression analysis can be found in Table S3. † The pertinent coefficients for polarity (electrostatics) and viscosity (sterics) as well as FQY () are unitless, while the nonradiative decay rate constant has the unit of s−1. The associated Equations (6) and (8) involve the solvent viscosity term while the retrieved near-unity coefficient indicates a strong twisting component of C481 (i.e., diethylamino moiety) that becomes hindered in solvents with increasing viscosity (see Figure 2i, Tables S1 and S2). The intercept for the linear regression analysis can be found in Table S2.
Publisher’s Note: MDPI stays neutral with regard to jurisdictional claims in published maps and institutional affiliations. |
© 2022 by the authors. Licensee MDPI, Basel, Switzerland. This article is an open access article distributed under the terms and conditions of the Creative Commons Attribution (CC BY) license (https://creativecommons.org/licenses/by/4.0/).
Share and Cite
MDPI and ACS Style
Liu, J.; Chen, C.; Fang, C. Polarity-Dependent Twisted Intramolecular Charge Transfer in Diethylamino Coumarin Revealed by Ultrafast Spectroscopy. Chemosensors 2022, 10, 411. https://doi.org/10.3390/chemosensors10100411
AMA Style
Liu J, Chen C, Fang C. Polarity-Dependent Twisted Intramolecular Charge Transfer in Diethylamino Coumarin Revealed by Ultrafast Spectroscopy. Chemosensors. 2022; 10(10):411. https://doi.org/10.3390/chemosensors10100411
Chicago/Turabian StyleLiu, Jiawei, Cheng Chen, and Chong Fang. 2022. "Polarity-Dependent Twisted Intramolecular Charge Transfer in Diethylamino Coumarin Revealed by Ultrafast Spectroscopy" Chemosensors 10, no. 10: 411. https://doi.org/10.3390/chemosensors10100411
Note that from the first issue of 2016, this journal uses article numbers instead of page numbers. See further details here.