
Beyond the Black Box—Practical Considerations on the Use of Chemometrics Combined with Sensing Technologies in Food Science Applications


1
School of Agriculture and Food Sciences, The University of Queensland, St. Lucia, Brisbane, QLD 4072, Australia
2
Queensland Alliance for Agriculture and Food Innovation (QAAFI), Centre for Nutrition and Food Sciences, The University of Queensland, St. Lucia, Brisbane, QLD 4072, Australia
*
Author to whom correspondence should be addressed.
Chemosensors 2022, 10(8), 323; https://doi.org/10.3390/chemosensors10080323
Submission received: 26 June 2022
/
Revised: 22 July 2022
/
Accepted: 9 August 2022
/
Published: 11 August 2022
(This article belongs to the Section Applied Chemical Sensors)
Abstract
:An increase in interest in the use of sensing technologies (e.g., electrochemistry, fluorescence, thermal, surface plasmon resonance, piezo, reflectometry, chemo or bioluminescence, and optics) as analytical methods to be implemented in a wide range of fields, including agriculture and food has been witnessed in recent years. Most of these applications have been evaluated and developed targeting a wide range of samples (e.g., raw materials, commodities, soils, water, food ingredients, natural products). Sensing technologies must be integrated with different data analytical techniques (e.g., pattern recognition, modelling techniques, calibration development) to develop a target application. The increasing availability of modern and inexpensive sensors, together with access to easy-to-use software is determining a steady growth in the number of applications and uses of these technologies. This short review underlined and briefly discussed practical considerations that support the robust development and implementation of applications that combine the use of sensing technologies with chemometrics.
1. Introduction
Food safety and security have become important public concerns worldwide as low-quality foods have been connected to issues such as food fraud, contamination and security, which are causing human distress, mortality and economic liabilities [1,2,3,4,5,6,7,8]. Hence, the food industry requires modern analytical tools to guarantee the safety of foods for consumers, respond to any issues associated with safety as well as to comply with quality control guidelines or standards imposed by governments and food authorities [1,2,3,4,5].
These issues have determined a constant development of rapid screening techniques that can be used in both the field and laboratory, to evaluate not only the composition and quality of foods but also to guarantee their safety [9,10,11]. Most of the available sensing techniques have become relatively inexpensive, easy to operate, requiring in most of the applications little or no sample preparation, allowing the incorporation of these techniques in processing analytics (e.g., at line or in line applications) [12,13].
It has been described by several experts and researchers in the field that the ideal sensing technique must be accurate, objective, cost effective as well as providing a quick turnaround and reproducible outcomes, and depending on the application, continuous operation [14,15,16,17,18]. Knowing these advantages, up to now, sensing technologies have not been extensively used by the food industry due to the lack of training and knowledge about their capability as analytical methods [14,15,16,17,18].
A wide range of sensors can be defined as a group of devices created using a single or series of instruments and are being applied in modern food analytics using chemical and physical principles such as electrochemistry, fluorescence, thermal, surface plasmon resonance, piezo, reflectometry, chemo or bioluminescence, and optics (e.g., infrared sensors) [19,20,21,22,23,24,25]. For example, a chemical sensor refers describes a small appliance that can deliver instantaneous information about the chemicals and other compounds present in a sample or system (e.g., food, commodity, natural ingredients) that can be used throughout the different steps of the supply and value chain, including process, storage and market (e.g., on-line) of food ingredients and products [19,20,21,22,23,24,25].
Current developments in sensing technologies have allowed the expansion of novel applications in a wide range of fields, including food sciences [19,20,21,22,23,24,25]. These include the ability of instrument miniaturization, the use of low sample volumes, improvements in sample integrity over sample destruction or pre-processing (e.g., non-destructive analysis), advances in chemical recognition, ease of manufacture, by the utilization of molecularly imprinted polymers (MIPS), potential of automation including remote sensing and process analytics (e.g., at/in/on-line) [19,20,21,22,23,24,25]. These developments have paved the way to improve many low costs and autonomous sensors that can be economically produced and deployed in a wide range of agriculture and food applications [19,20,21,22,23,24,25].
An important advantage of the utilization of sensing technologies is that they can continuously collect and report data, providing with meaningful information and knowledge about the sample as well as the whole system under analysis (e.g., chemical changes during manufacturing, storage and transport of food ingredients and products) [19,20,21,22,23,24,25]. The incorporation of these technologies has resulted in an unprecedented number of real-time measurements that can be implemented during the process, storage and market of food and food ingredients, allowing for a better understanding of the production system, including the supply and value chains [19,20,21,22,23,24,25].
Most of the routine analytical methods applied have been developed in what can be described as univariate in nature, since most of these applications only focused on the assessment of the effects or responses of a single variable at a time [26,27]. The steady growth of sensing technology has changed this, as these techniques enabled the collection of a large amount of data (many variables in a single measurement or in a continuous measurement). Nevertheless, the application and utilization of sensing technologies have encountered new challenges. For example, the problem of how the collected data can generate useful information that can be later utilised to better evaluate, manage, or monitor the product, such as the composition and safety of food ingredients and foods [26]. Some of these challenges have been resolved through the incorporation of advanced data analytical techniques, that allows to accurately interpret the data collected, delivering efficient management systems that can be applied along the food supply and value chains [26]. Most of the advanced analytical techniques used to analyse and interpret the data generated for the different sensors are grouped under the family of chemometrics [26,27].
Chemometric tools are powerful mathematical and statistical techniques that, combined with sensing technologies, allow for the extraction of valuable data and convert them into useful information [27,28,29,30,31,32,33]. The main development in chemometrics occurred around the 1960s, where this tool was incorporated by a few research groups in the field of chemistry, (more specifically in analytical, instrumental, and organic chemistry) [27,28,29,30,31,32,33]. Chemometrics was then applied to better analyse, interpret, and understand the increasing amount of data because of the introduction of modern instrumentation. More specifically these techniques provide multiple responses such as peaks, and wavelengths for each of the samples analysed, where data analytics have an important role during the analysis [27,28,29,30,31,32,33]. Until the incorporation of modern analytical instrumentation, analysis of data arises from the use of the so called traditional routine analytical methods founded on the utilization of univariate statistical analysis [27,28,29,30,31,32,33]. Nowadays, research and practice has shown that the sample and its relationships in a given dataset (system) rather the measurement of a single component, is more important to better understand the whole system, if we strive to better understand its complexity and their interactions [27,28,29,30,31,32,33].
The incorporation of instrumental techniques (e.g., LC-MS, GC, MS, infrared and Raman spectroscopy) has boosted the utilization of multivariate data analysis in routine analysis [27,28,29,30,31,32,33]. In the same way, sensing technologies with their intrinsic characteristics that the system under analysis is interrogated by combination of the sensor through the utilization of chemometric in an intimate relationship with the sample that has allowed for a better understanding of the whole systems (e.g., monitor changes in composition, process) [27,28,29,30,31,32,33].
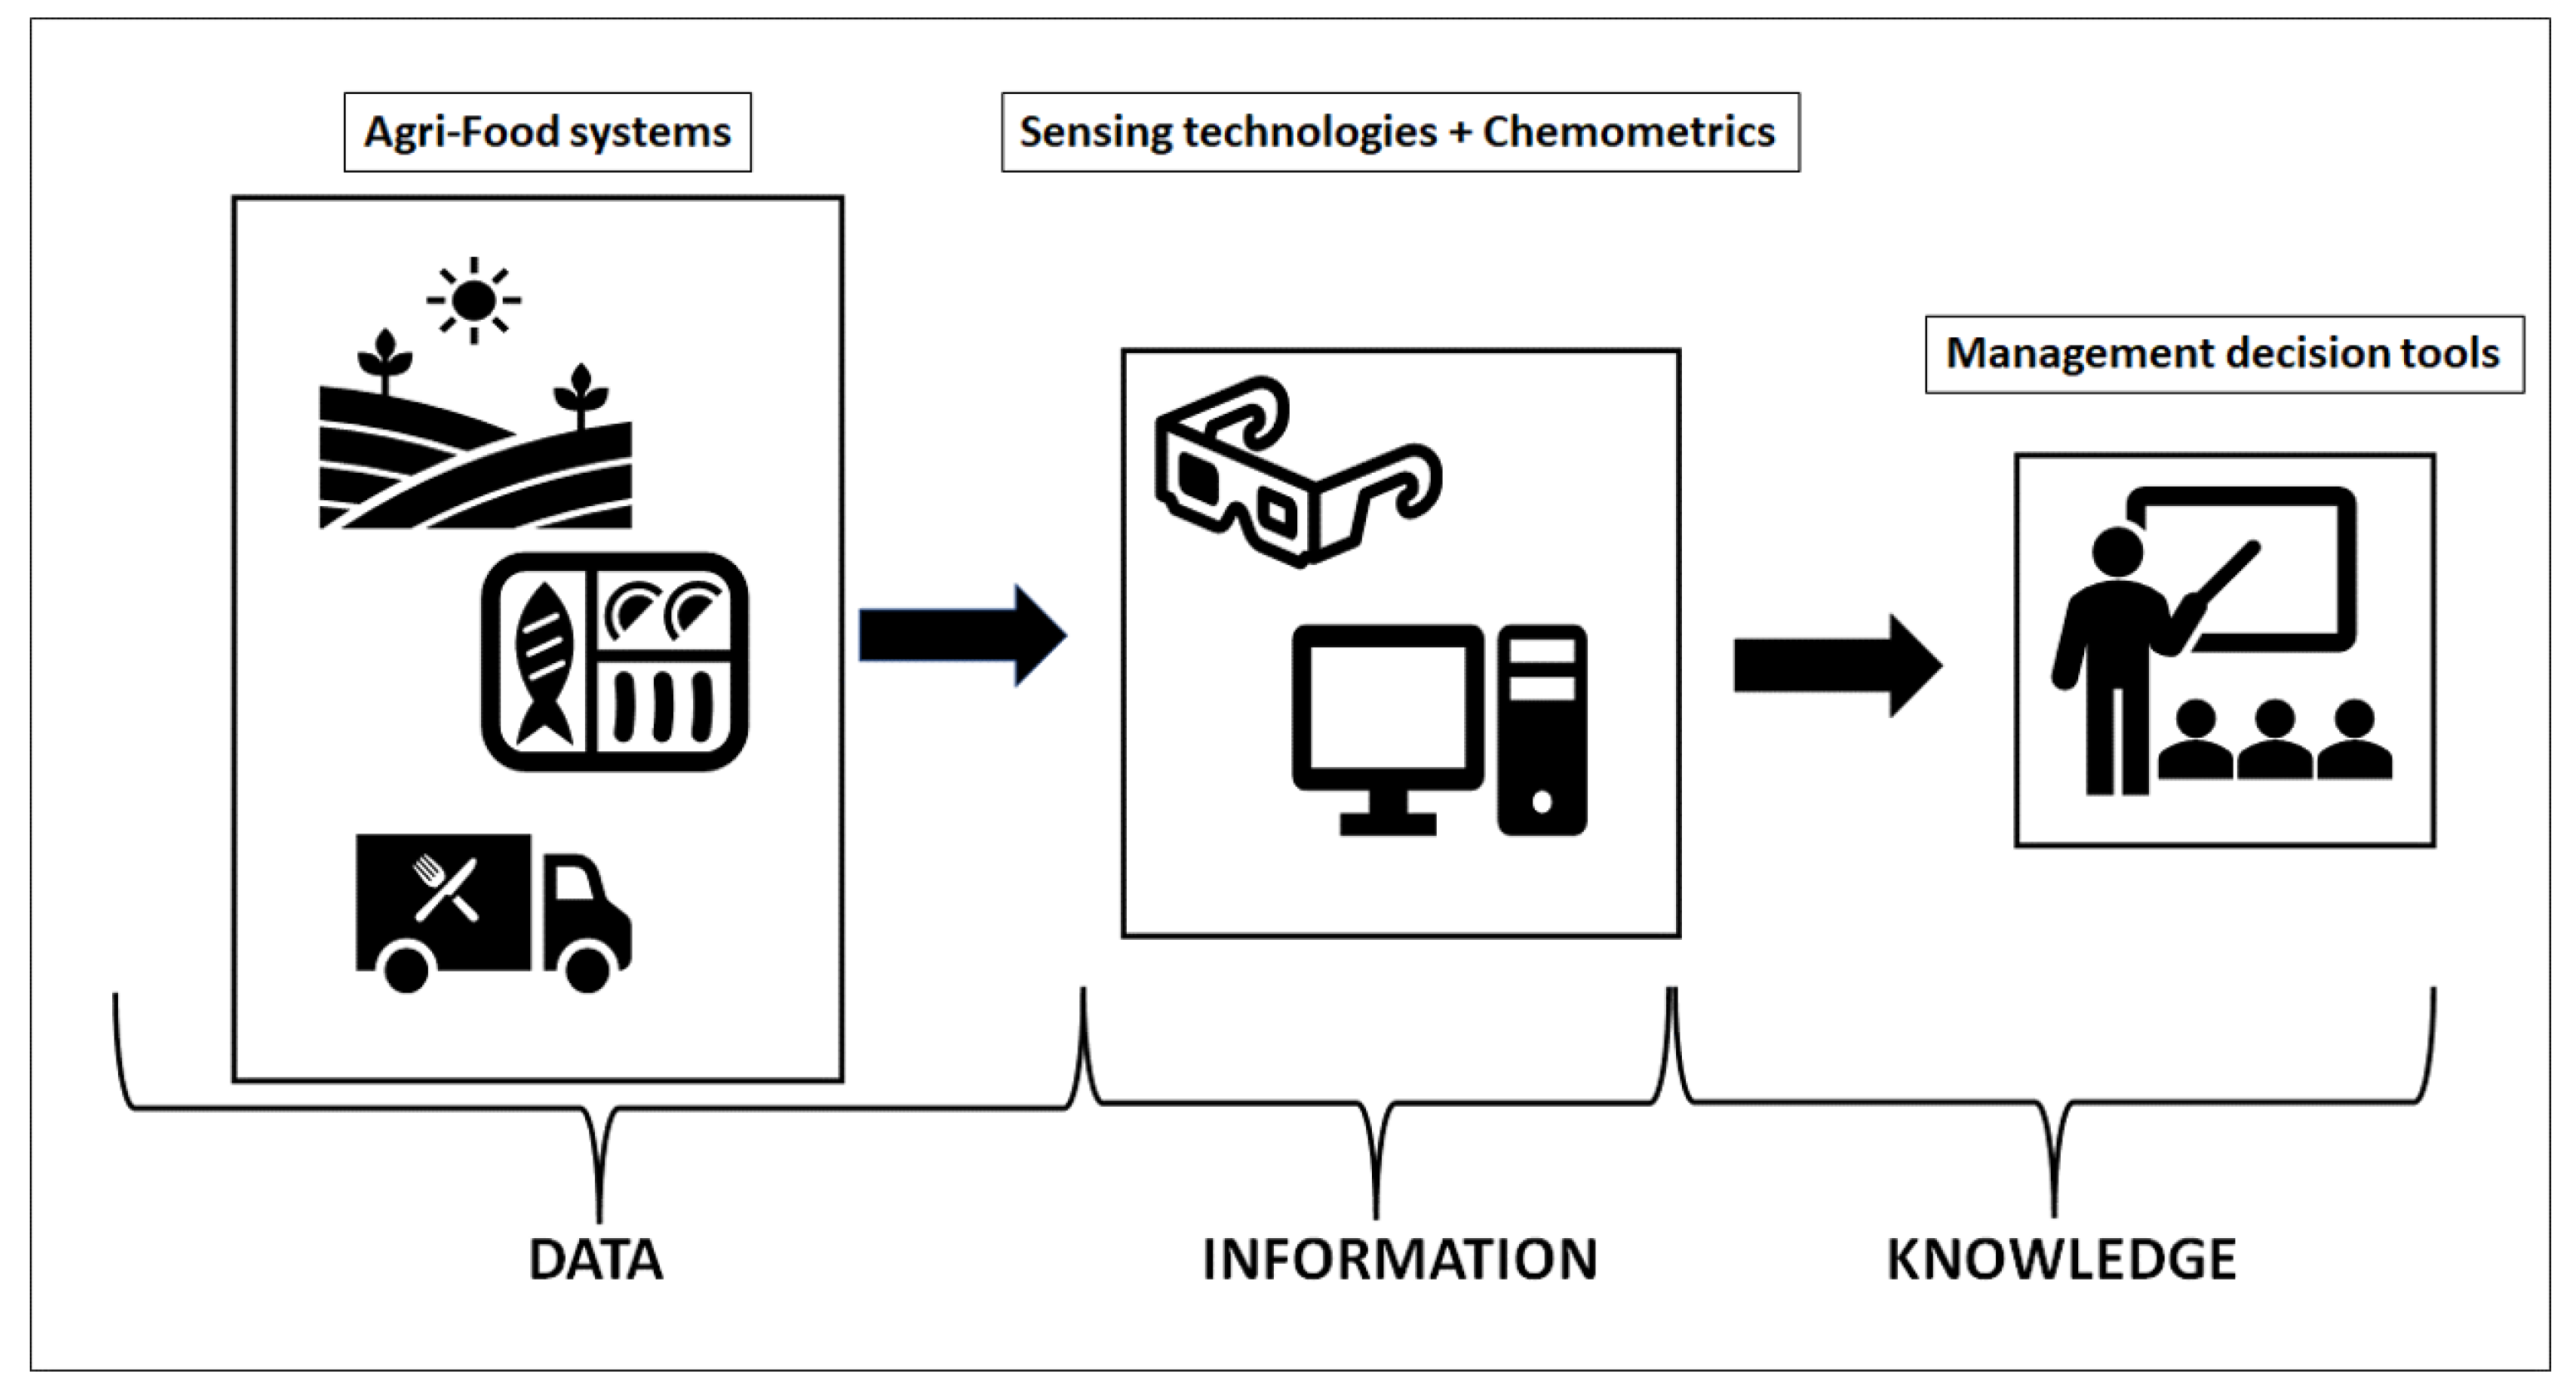
Obtaining meaningful information from data is a key aspect to consider in the application and utilization of sensing technologies. Figure 1 shows how sensing technologies can be combined with chemometrics to develop a given application from data to information generation.
This short review underlines and briefly discusses practical considerations that support the robust development and implementation of applications that combine the use of sensing technologies with chemometrics.
2. Exploratory Analysis
Before the use of any data mining or chemometric method, the quality of the input data must be evaluated. Issues related with the signal to noise ratio of the raw signal, instrument or sensor performance, among other factors or variables, are important to be considered prior data analysis. During or after data collection using any sensing device, a preliminary exploratory analysis should be performed to determine the reproducibility of the measurements, detect trends in the data collected, evaluate process consistency and reliability or to evaluate deviations to the process through the identification of uncharacteristic samples (e.g., outlier detection). The universally and most utilized tool for this purpose is principal component analysis (PCA). This technique is used to reduce the dimensionality of large datasets by creating new variables (e.g., scores and loadings) [34]. With the introduction of PCA, trends, and changes in the matrix due to process, treatments, etc., can be easily analysed and visualised with this technique. Overall, this technique reduces the information which originated from a larger number of variables to a smaller number of non-dependent (orthogonal) factors or components [34,35]. The analysis and interpretation of a given PCA is based on the analysis of both the scores and loadings or eigenvectors. The scores provide the information about the samples (e.g., trends, patterns in the dataset), while the loadings or eigenvectors provide information about the contributions of each of the variables used in the analysis. Techniques other than PCA have been also utilised, such as clustering analysis, which also reduces the dimensionality of a given dataset, allowing for the identification of clusters or groups of samples. In addition to data reduction techniques, other approaches such as linear discriminant analysis (LDA), partial least squares discriminant analysis (PLS-DA) and k-nearest neighbors (k-NN) provide with the means for an exploratory analysis of the data, aiding with different options to visualise trends, groups, or clusters of samples in a dataset [36,37].
3. Experimental Design and Sample Selection
Regardless of the application or the utilization of given sensing technology, one of the very important steps mostly underestimated or not considered are experimental design and sample selection [38,39,40,41]. The strategy or method used to select samples from a population intended to be used to develop a calibration or model should be considered before the application of any sensing technologies. Therefore, both the sample size (number of samples) as well as the proper sampling method should be known apriori where guidelines from the field of experimental design (DoE) must be follow. Some basic steps should be considered, and they included the selection of samples to be involved in the calibration or training set, determination of the property to be predicted together with the most appropriate method to measure the property of interest (e.g., chemical composition), the collection of the signal by the sensor (e.g., signal to noise ratio, limit of detection), pre-processing of the data, the development and validation of the model [38,39,40,41]. It is important that in the selection of samples to be used during the calibration, careful attention must be taken where all causes of variability in the dataset (e.g., physical and chemical characteristics or properties of the sample) must be evaluated and considered [38,39,40,41]. A simple method commonly used to select samples based on the variability of the dataset, is the use of a scatter plot obtained from the utilization of PCA. The visualization and inspection of trends or clusters using principal component scores allows for a better interpretation of the distribution of samples, allowing for a comprehensive selection of samples that can be included in the calibration set. For example, samples which are located at the edges or boundaries of the PCA score plot can be selected as they indicate an extreme range in variability due to composition or other characteristics [38,39,40,41]. It is generally accepted that samples selected to develop a calibration model must be obtained from samples which have similar characteristics and properties to those that will be analysed in the future [38,39,40,41]. These samples should be also exposed to similar handling conditions [e.g., drying method, grinding (e.g., particle size), homogenisation, storage (e.g., effect of temperature and time of storage)] to be implemented or applied to the future samples. Similarly, to the handling conditions, samples with the widest range of physical and chemical properties will be highly recommended. Hence, it is important to emphasize that collecting extreme samples that cover the tail of the distribution is a must in calibration development [38,39,40,41]. Overall, it has been demonstrated that sample selection and DoE improves the robustness of the models [38,39,40,41].
4. Variable Pre-Processing
The direct interpretation of the data collected using a sensor without any processing is not the best recommended approach to follow when data mining tools are to be used [42,43,44,45]. One reason for this is that the data can be influenced by day-to-day variations in the collection of the information, changes in the instrument performance that might cause baseline effects, drifts, non-linearities, or other specific issues associated with the signal to noise ratio. These issues can be also magnified if different sensors are to be combined where each of the variables can be collected from different units of scale [42,43,44,45]. Therefore, as stated above, variable pre-processing is a very important step before using chemometrics. Usually, the variables can be standardised using the ratio between each variable over the standard deviation (1/STD) [42,43,44,45]. In this way, variables will have the same influence (weight) in the model. However, an important aspect to consider is that the interpretation of the calibration results such as loadings or coefficient of regression will be also affected by the pre-processing technique utilised. Depending on the sensor utilised (e.g., optical sensor, electronic noses) different data processing techniques or methods have been proposed and utilised in practice. For example, processing of the signal using derivatives (e.g., first, second), smoothing techniques, multiple scatter corrections (e.g., optical sensors), peak alignment, baseline corrections, Savitzky-Golay (S-G) filter, wavelet filtering, Fourier transformation and data normalization are some of the most used pre-processing methods [42,43,44,45].
5. Calibration or Model Development
In most of the applications using sensing technologies, the central objective in the utilization of chemometrics is the development of the so-called calibration model. Calibration is the process of correlating, modeling or relating the measured instrument responses (e.g., peaks, transmittance, absorbance, emission, retention time, peak area) with the concentration of the analyte. A multivariate calibration approach is usually applied and include the use of principal component regression (PCR), partial least-square regression (PLS), classical least squares (CLS) and multiple linear regression (MLR) [46,47,48,49,50]. In most of the applications, PLS regression is the most widely used algorithm in calibration development. During the development of a calibration using PLS regression, latent variables (or factors) are created simultaneously with the calibration model. Each of the latent variable is a linear combination of the original measurement or variables (e.g., wavelengths, signals) rotated to provide the best possible correlation with the information supplied by the property variable (reference method) [46,47,48,49,50,51]. In addition to the linear models presented above, the use of non-linear methods such as support vector machines (SVM), artificial neural networks (ANN), and self-organizing maps (SOM) have been also considered and utilised [46,47,48,49,50,51].
6. Validation
Once a model is developed, it must be validated. This is considered a very important step in calibration development. Most of the available literature in the field of sensing technologies have used cross validation as the preferred method to validate the models developed. However, the validation should be conducted using an independent dataset. An independent dataset should be created using samples that are similar to those analysed or utilized during the calibration, have a similar range in concentration. Samples from different batches, experiments, harvest conditions or process, should be considered. In proof of concept and research studies the availability of independent samples to be selected as training and validation are rare and costly. Therefore, the use of cross validation can be justified.
In most cases, common terminologies used in this step are the so-called training dataset and test or validation datasets. There is nothing wrong with the utilization of this terminology, however, it can lead to misunderstandings arising from the fact that this terminology does not necessarily make a distinction between internal and external validations. It will be better to describe the calibration dataset, as the data exclusively used during the calibration development, while the external validation dataset refers to an independent dataset not included in the calibration development. In this context, internal validation should be considered as part of the calibration dataset.
As discussed above, the most widely used internal validation method is cross-validation with all the different combinations such as leave-one-out, k-fold cross-validation, segment cross-validation, and random subsampling, among others. The availability and definition of this cross-validation method used will depend upon the software used. The leave-one-out cross validation technique has been widely implemented in the field when the number of samples is limited, or when preliminary studies reported. The use of cross-validation has been considered to provide overoptimistic results. The overuse of cross-validation can produce models that can be considered overfitted since the robustness of a given model will be assessed using the same samples that have been employed during the calibration development. Other than the issues associated with overfitting, the overuse of cross-validation can produce and report over-optimistic model performance. In recent years, other internal validation approaches have been implemented such as bootstrapping, and it has been recommended as this method shown to provide an unbiased estimate of predictive accuracy with low variance [52,53]. Another method that can be used is resampling. In this case, a sub-set of samples can be drawn from the dataset where one sub-set is used as a calibration and the other one as validation.
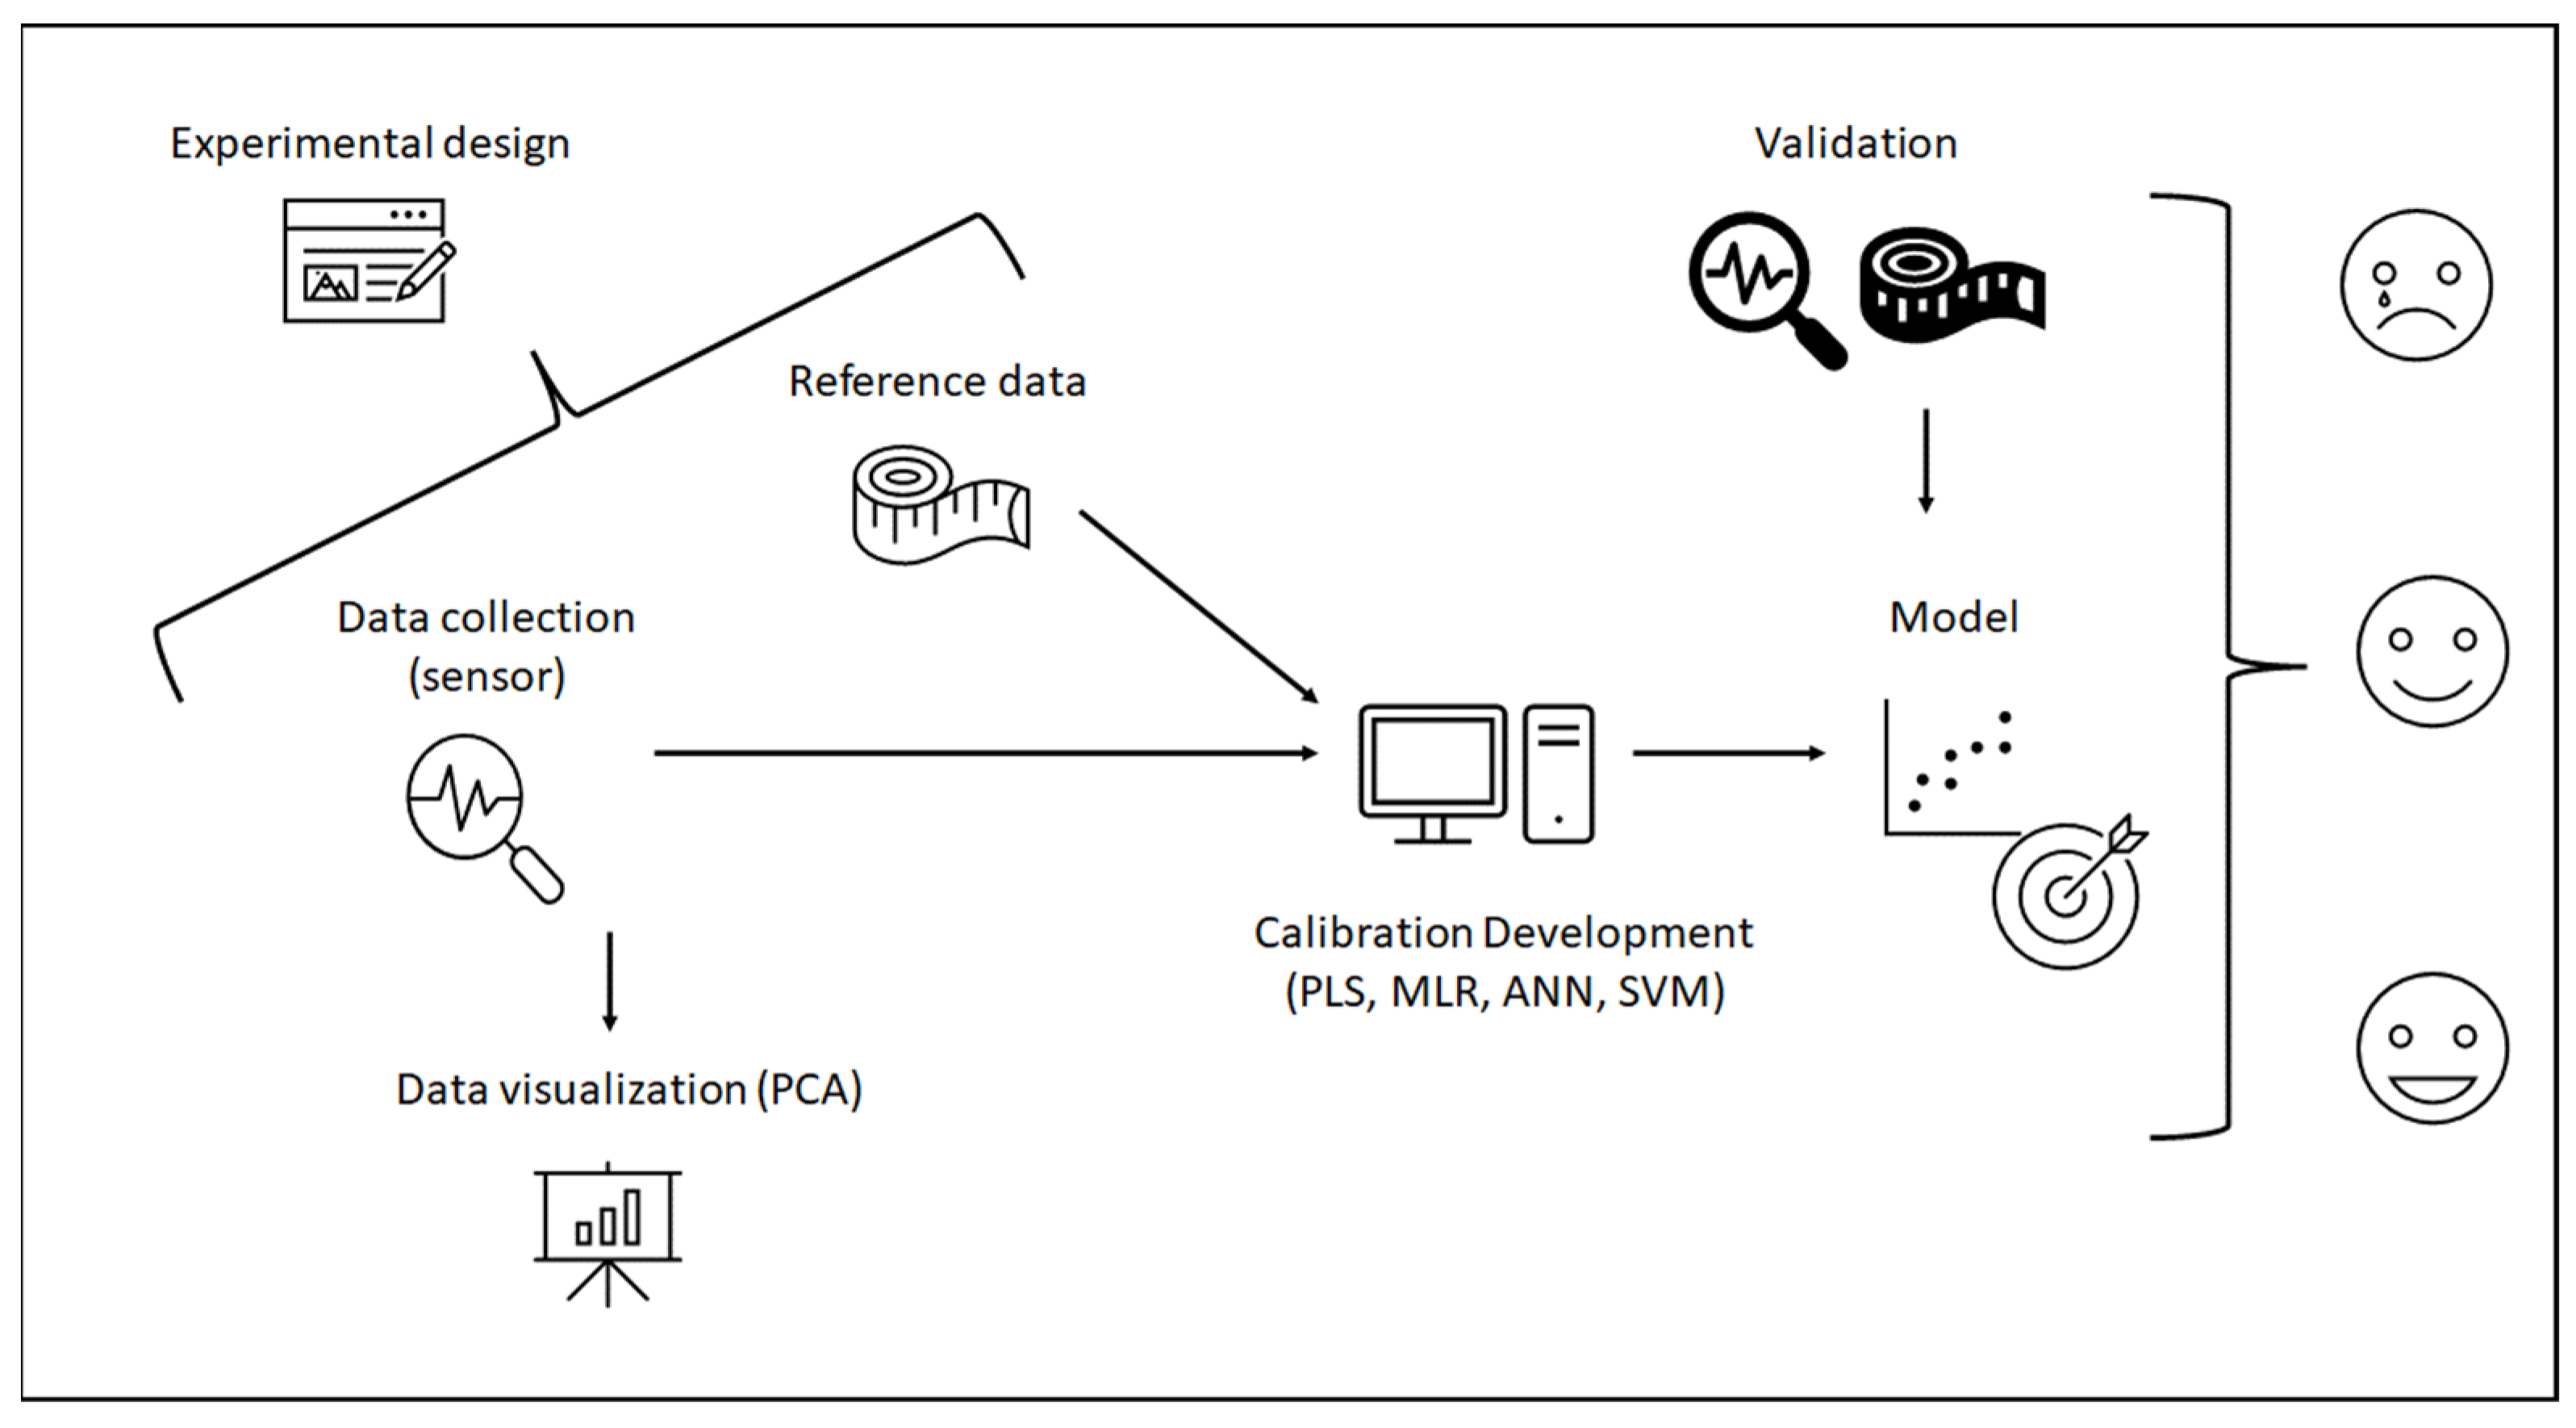
In summary, the validation of a calibration or classification model will be achieved if the dataset used to validate the model belong to a similar population (e.g., range in composition; similar sample characteristics and properties). The samples selected to be included in the validation set should span the whole variability, selected, and uniformly distributed throughout the range in composition, as well as from the same sensor. Figure 2 represents the main steps during the calibration and validation process.
7. The Importance of Understanding the Reference Method
It is of fundamental importance in calibration development to know and understand the variables that might influence the reference method, such as how it is conducted, the use of replicates, the standard error of the reference method, the limit of detection and quantification, etc. Testing the performance of the calibration model to quantitatively predict a specific analyte or chemical parameters (e.g., protein content in grains, ethanol in wine) is usually achieved by assessing how close the predicted value is with the one obtained using the reference method. An understanding of the figures of merit of the reference method is required to better identify and understand the limitations of the calibration model. It is imperative to know the standard error of the reference method or to determine it experimentally for the specific set of samples analysed and used in the calibration. Although, the reference method becomes the judge and jury of a given calibration model, the standard error of the reference or laboratory method, used to judge the robustness of the calibration, is not well known. This is of critical importance for the routine implementation of the calibration model to analyse new samples.
8. Outliers
Outliers can originate from mistakes during file transfer, interface errors, sensor malfunctions, drifts, noise, bad or incorrect sampling, or an inadequate use of the sensor. All these items contribute to the numerous sources of error that can explain the presence of outliers in a given dataset. Even a given sample (or group of samples) can be considered as an outlier if it deviates from the expected or observed trend in the dataset or if the predicted values are different in relation to the expected predicted values (reference), or both. As discussed above, during calibration development, any trend in the dataset as well as the presence of outliers can be visualised using PCA, among others. Unless the origin of the outlier is known, it is recommended that the outlier samples must be kept throughout the early stages of the exploratory analysis and calibration. Until further investigation into the origin of the outlier samples, only the samples that highly influence the regression model should be removed. In practice, an excessive trimming of outlier samples from any given exploratory analysis of model should be avoided if the causes are unknown.
9. Overfitting
The selection of the optimal number of components, latent variables or factors used by the model is very important to avoid either the overfitting or underfitting of the model. Therefore, in the process of optimization, a delicate balance is required. For example, if too many latent variables or factors are used, they might add too much redundancy (increase in the number of independent variables), determining that the model becomes overfitted [54,55,56,57,58,59]. Conversely, the utilization of few components tends to determine that the model becomes underfitted, where the model will not be robust enough to capture the variability in the dataset [54,55,56,57,58,59]. This “fitting” effect is greatly dependent among other factors, on the number of samples employed to develop the calibration model. In many applications, the utilization or incorporation of more samples results in more accurate predictions [54,55,56,57,58,59]. It is important to highlight that the utilization of chemometrics tools without a proper interpretation and understanding are prone to overfitting (over-parameterization) determining a potential increase in the risk of false or misleading results [54,55,56,57,58,59]. Overfitting can be reduced during exploratory applications of sensing technologies using different approaches such as rank optimization (e.g., based on pragmatic cross-validation), or using double cross-validation (cross-model validation) [54,55,56,57,58,59,60]. None of these approaches are considered ideal, and only when representative, and independent date sets are used in validation, some of these issues can be avoided [54,55,56,57,58,59,60].
10. Summary and Future Perspectives
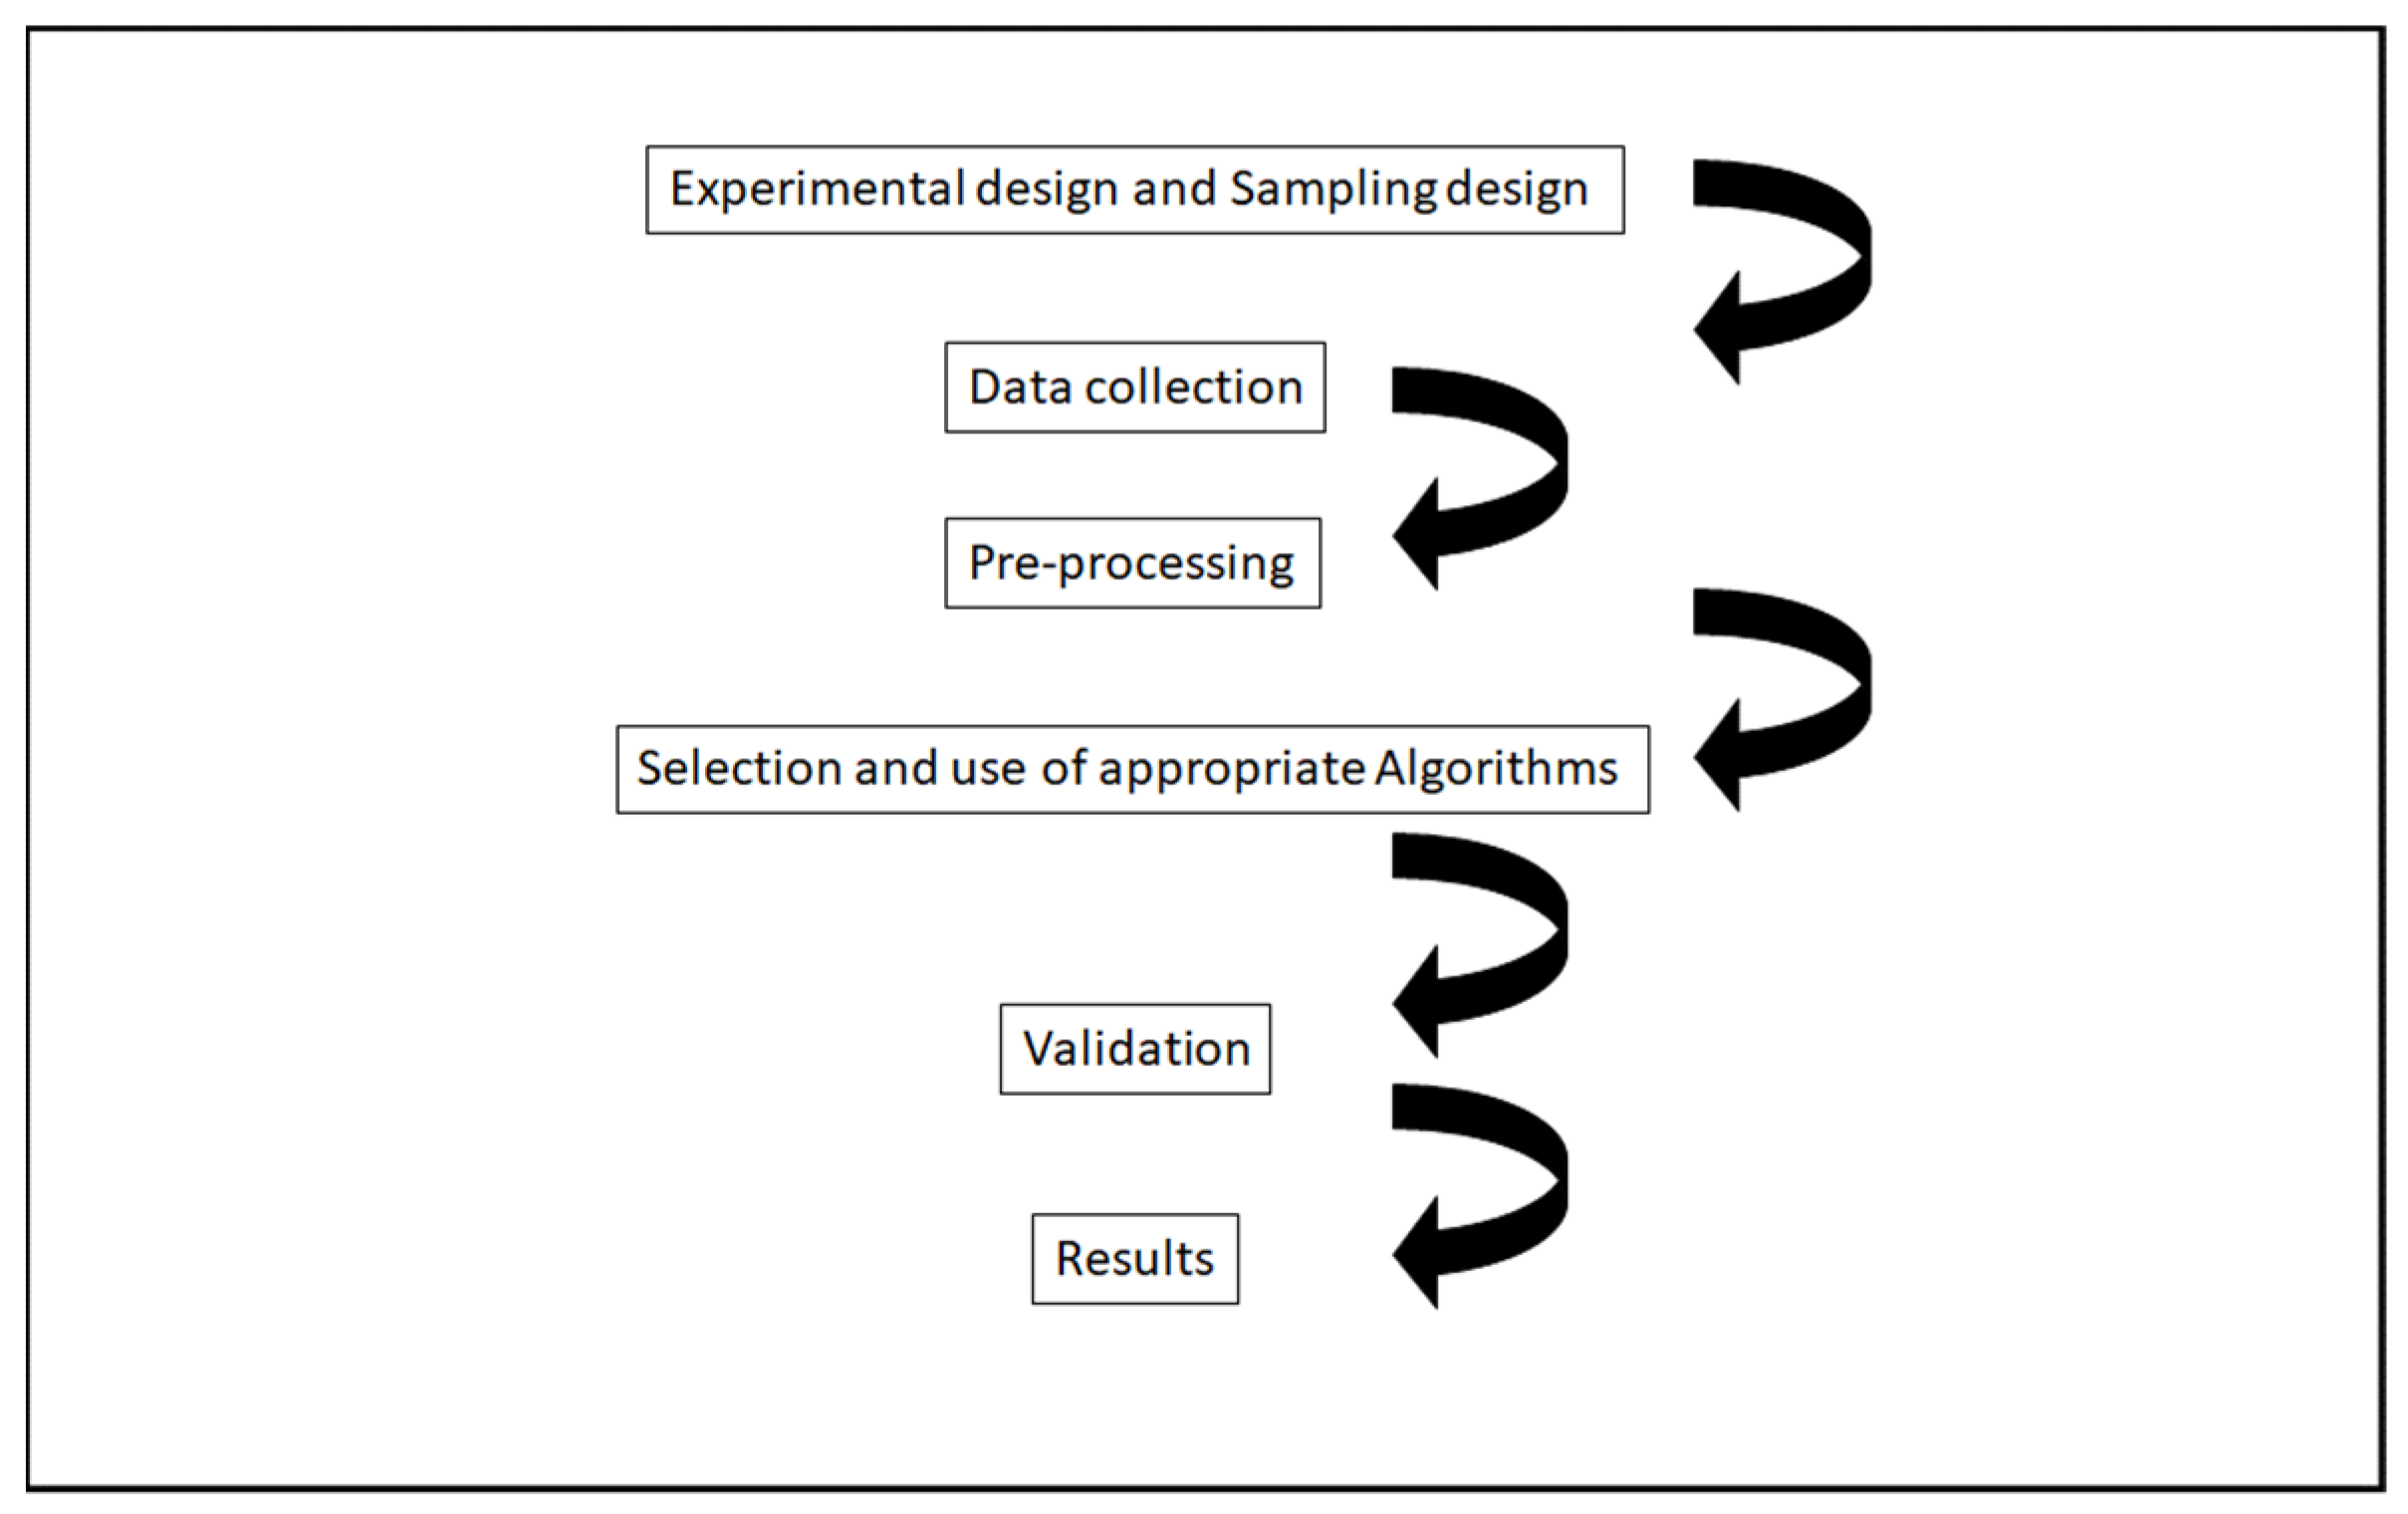
The integration of chemometrics with sensing technologies has become essential to target food composition, to monitor the process of foods, the assessment of the origin and safety of foods, among others. Figure 3 summarises the steps to follow during the implementation of sensing technologies with chemometrics. The utilization of chemometrics can be judged by non-experts in the field as a purely mathematical or statistical exercise. Nevertheless, combining chemometrics with sensing technologies is a complex process that requires insights into how the system works, the sampling protocol used, the characteristics and properties of the sample or system analysed (e.g., physical and chemical properties, variability, origin, variable pre-processing method), and the origin of the signal (e.g., sensor characteristics, sample collection mode, noise, drift). Other important key steps in the application of chemometrics (e.g., variable pre-processing, selection of samples for calibration and validation, choosing linear and non-linear algorithms, identification and removing of outlier samples) should be also considered and evaluated. In summary, the development of a method based on the combination of chemometrics with any sensing technology requires a basic understanding of the different factors and variables that contribute to explain the system complexity.
The increasing utilization of sensing technologies has contributed to the development of efficient and reliable applications that have been implemented in the field of analytical chemistry, process analytical technologies (PAT), traceability of food ingredients, natural products, and environment applications. These approaches are becoming the ideal set of methodologies to be incorporated into the supply and value chains targeting sustainability, food safety and security.
Although several research articles have been published describing the utilization of sensing technologies combined with chemometrics, most of them have only reported feasibility or potential applications. In many cases small datasets (e.g., few samples) where only cross-validation rather than an independent validation set was used to report the performance of the models. As important to the number of samples used to develop a given application, validation, and identification of outliers, knowing the effect of the reference laboratory method (e.g., standard error of the laboratory method) must be considered to interpret the results obtained.
In the application of sensing technologies to develop quantitative methods, the reference data (e.g., chemical analysis) used to evaluate the performance of the calibrations must be known. Therefore, prior to assessing the accuracy of calibration or model, the error associated with the reference method should be investigated. In addition, the interpretation of the main variables used by the model such as loadings, the significance of coefficients of regression, and inter-correlations among measured variables with the chemical or property measured is often ignored.
The utilization and implementation of sensing technologies have proven the importance of incorporating information and knowledge from many fields (e.g., analytical chemistry, data analytics, computer sciences, mathematics, biology, and chemistry). The combination of sensing technologies with chemometrics toward the development of a given application has proven and fostered a unique environment for multidisciplinary approaches. Fostering close collaborations between researchers from different fields is of critical importance for the successful application and development of these technologies in real applications.
Developments in sensing technologies also require an appropriate level of training. This training is not solely related to the practical aspects of the use of a given sensor or how to use a given software. The development (e.g., sample selection, variable pre-processing, selection of the appropriate algorithm, reference method, etc.) and interpretation (e.g., loadings, coefficient of regression, standard error, validation) of a model are critical aspects requiring a high level of expertise. The applications and implementations in sensing technology require the understanding of how the amalgamation of sensors with chemometrics work beyond the simple analysis of a single statistical parameter.
Author Contributions
B.D., review and editing original draft; D.C. writing, review, editing, conceptualization, supervision. All authors have read and agreed to the published version of the manuscript.
Funding
This research received no external funding.
Institutional Review Board Statement
Not applicable.
Informed Consent Statement
The authors declare their Consent to Participate in this article.
Data Availability Statement
Data sharing not applicable.
Conflicts of Interest
The authors declare no conflict of interest.
References
- Vigneshvar, S.; Sudhakumari, C.C.; Senthilkumaran, B.; Prakash, H. Recent advances in biosensor technology for potential applications—An overview. Front. Bioeng. Biotechnol. 2016, 4, 11. [Google Scholar] [CrossRef] [PubMed] [Green Version]
- Esteban, M.; Ariño-Blasco, M.C.; Díaz-Cruz, J.M. Chemometrics in Electrochemistry. In Comprehensive Chemometrics; Elsevier: Amsterdam, The Netherlands, 2020; pp. 1–31. [Google Scholar]
- Yeni, F.; Acar, S.; Polat, Ö.G.; Soyer, Y.; Alpas, H. Rapid and standardized methods for detection of foodborne pathogens and mycotoxins on fresh produce. Food Control 2014, 40, 359–367. [Google Scholar] [CrossRef]
- Bahadır, E.B.; Sezgintürk, M.K. Applications of commercial biosensors in clinical, food, environmental, and biothreat/biowarfare analyses. Anal. Biochem. 2015, 120, 478107. [Google Scholar] [CrossRef] [PubMed]
- Wu, M.Y.-C.; Hsu, M.-Y.; Chen, S.-J.; Hwang, D.-K.; Yen, T.-H.; Cheng, C.-M. Point-of-care detection devices for food safety monitoring: Proactive disease prevention. Trends Biotechnol. 2017, 35, 288–300. [Google Scholar] [CrossRef] [PubMed]
- Perumal, V.; Hashim, U. Advances in biosensors: Principle, architecture and applications. J. Appl. Biomed. 2014, 12, 1–15. [Google Scholar] [CrossRef]
- Chapman, J.; Power, A.; Kiran, K.; Chandra, S. New twists in the plot: Recent advances in electrochemical genosensors for disease screening. J. Electrochem. Soc. 2017, 164, B665–B673. [Google Scholar] [CrossRef]
- Korotkaya, E. Biosensors: Design, classification, and applications in the food industry. Foods Raw Mater. 2014, 2, 161–171. [Google Scholar] [CrossRef]
- McGrath, T.F.; Elliott, C.T.; Fodey, T.L. Biosensors for the analysis of microbiological and chemical contaminants in food. Anal. Bioanal. Chem. 2012, 403, 75–92. [Google Scholar] [CrossRef]
- Pilolli, R.; Monaci, L.; Visconti, A. Advances in biosensor development based on integrating nanotechnology and applied to food-allergen management. TRAC Trends Anal. Chem. 2013, 26, 4712. [Google Scholar] [CrossRef]
- Xu, Y.; Zhong, P.; Jiang, A.; Shen, X.; Li, X.; Xu, Z.; Shen, Y.; Sun, Y.; Lei, H. Raman spectroscopy coupled with chemometrics for food authentication: A review. TrAC Trends Anal. Chem. 2020, 131, 116017. [Google Scholar] [CrossRef]
- Nychas, G.-J.E.; Panagou, E.Z.; Mohareb, F. Novel approaches for food safety management and communication. Curr. Opin. Food Sci. 2016, 20, 1213. [Google Scholar] [CrossRef] [Green Version]
- Eisen, K.; Eifert, T.; Herwig, C.; Maiwald, M. Current and future requirements to industrial analytical infrastructure—Part 1: Process analytical laboratories. Anal. Bioanal. Chem. 2020, 412, 2027–2035. [Google Scholar] [CrossRef] [PubMed] [Green Version]
- Eifert, T.; Eisen, K.; Maiwald, M.; Herwig, C. Current and future requirements to industrial analytical infrastructure—Part 2: Smart sensors. Anal. Bioanal. Chem. 2020, 412, 2037–2045. [Google Scholar] [CrossRef] [Green Version]
- Sorak, D.; Herberholz, L.; Iwascek, S.; Altinpinar, S.; Pfeifer, F.; Siesler, H.W. New developments and applications of handheld Raman, mid-infrared, and near infrared spectrometers. App. Spectrosc. Rev. 2012, 47, 83–115. [Google Scholar] [CrossRef]
- Justino, C.I.L.; Freitas, A.C.; Pereira, R.; Duarte, A.C.; Rocha Santos, T.A.P. Recent developments in recognition elements for chemical sensors and biosensors. TRAC Trends Anal. Chem. 2015, 68, 2–17. [Google Scholar] [CrossRef]
- Ahearn, M.C.; Armbruster, W.; Young, R. Big Data’s Potential to Improve Food Supply Chain Environmental Sustainability and Food Safety. Int. Food Agribus. Manag. Rev. 2016, 19, 155–171. [Google Scholar]
- Cortes, V.; Blasco, J.; Aleixos, N.; Cubero, S.; Talensa, P. Monitoring strategies for quality control of agricultural products using visible and near-infrared spectroscopy: A review. Trends Food Sci. Technol. 2019, 85, 138–148. [Google Scholar] [CrossRef]
- Walsh, K.; McGlone, V.; Han, D. The uses of near infra-red spectroscopy in postharvest decision support: A review. Postharvest Biol. Technol. 2020, 163, 111139. [Google Scholar] [CrossRef]
- Sekhon, B. Nanotechnology in agri-food production: An overview. Nanotechnol. Sci. Appl. 2014, 7, 31–53. [Google Scholar] [CrossRef] [Green Version]
- Deisingh, A.K.; Stone, D.C.; Thompson, M. Applications of electronic noses and tongues in food analysis. Int. J. Food Sci. Technol. 2004, 39, 587–604. [Google Scholar] [CrossRef]
- Karoui, R.; Downey, G.; Blecker, C. Mid-Infrared Spectroscopy Coupled with Chemometrics: A Tool for the Analysis of Intact Food Systems and the Exploration of Their Molecular Structure−Quality Relationships—A Review. Chem. Rev. 2010, 110, 6144–6168. [Google Scholar] [CrossRef] [PubMed]
- Manley, M. Near-infrared spectroscopy and hyperspectral imaging: Non-destructive analysis of biological materials. Chem. Soc. Rev. 2014, 43, 8200–8214. [Google Scholar] [CrossRef] [PubMed] [Green Version]
- Beć, K.B.; Huck, C.W. Breakthrough Potential in Near-Infrared Spectroscopy: Spectra Simulation. A Review of Recent Developments. Front. Chem. 2019, 7, 48. [Google Scholar] [CrossRef] [PubMed] [Green Version]
- Cozzolino, D. Recent trends on the use of infrared spectroscopy to trace and authenticate natural and agricultural food products. App. Spectrosc. Rev. 2012, 47, 518–530. [Google Scholar] [CrossRef]
- Cozzolino, D. The role of vibrational spectroscopy as tool to assess economical motivated fraud and counterfeit issues in agricultural products and foods. Anal. Methods 2015, 7, 9390–9400. [Google Scholar] [CrossRef]
- Truong, V.K.; Dupont, M.; Elbourne, A.; Gangadoo, S.; Rajapaksha Pathirannahalage, P.; Cheeseman, S.; Chapman, J.; Cozzolino, D. From academia to reality check: A theoretical framework on the use of chemometric. Foods 2019, 8, 164. [Google Scholar] [CrossRef] [Green Version]
- Wold, S. Chemometrics; what do we mean with it, and what do we want from it? Chemom. Intell. Lab. Syst. 1995, 30, 109–115. [Google Scholar] [CrossRef]
- Siebert, K.J. Chemometrics in brewing: A review. J. Am. Soc. Brew. Chem. 2001, 59, 147–156. [Google Scholar] [CrossRef]
- Brereton, R.G. Applied Chemometrics for Scientist; John Wiley & Sons Ltd.: Chichester, UK, 2008. [Google Scholar]
- Brereton, R.G. Introduction to multivariate calibration in analytical chemistry. Analyst 2000, 125, 2125–2154. [Google Scholar] [CrossRef]
- Naes, T.; Isaksson, T.; Fearn, T.; Davies, T. A User-Friendly Guide to Multivariate Calibration and Classification; NIR Publications: Chichester, UK, 2002. [Google Scholar]
- Martens, H.; Naes, T. Multivariate Calibration; John Wiley and Sons Ltd., Co.: New York, NY, USA, 1996. [Google Scholar]
- Esbensen, K.H. Multivariate Data Analysis in Practice; CAMO Process AS: Oslo, Norway, 2002. [Google Scholar]
- Brereton, R.G. Pattern recognition in chemometrics. Chemom. Intell. Lab. Syst. 2015, 149, 90–96. [Google Scholar] [CrossRef]
- Cozzolino, D.; Power, A.; Chapman, J. Interpreting and Reporting Principal Component Analysis in Food Science Analysis and Beyond. Food Anal. Methods 2019, 12, 2469–2473. [Google Scholar] [CrossRef]
- Szymanska, E. Modern data science for analytical chemical data e A comprehensive review. Anal. Chim. Acta 2018, 1028, 1–10. [Google Scholar] [CrossRef]
- Kumar, N.; Bansal, A.; Sarma, G.S.; Rawal, R.K. Chemometrics tools used in analytical chemistry: An overview. Talanta 2014, 123, 186–199. [Google Scholar] [CrossRef] [PubMed]
- Esbensen, K.H.; Wagner, C. Theory of sampling (TOS) versus measurement uncertainty (MU)—A call for integration. Trends Anal. Chem. 2014, 57, 93–106. [Google Scholar] [CrossRef]
- Wagner, C.; Esbensen, K.H. Theory of Sampling: Four Critical Success Factors Before Analysis. J. AOAC Int. 2015, 98, 2. [Google Scholar] [CrossRef] [PubMed]
- Esbensen, K.H.; Swarbrick, B. Sampling for spectroscopic analysis: Consequences for multivariate calibration. Spectrosc. Eur. 2019, 3, 22–28. [Google Scholar]
- Cozzolino, D. The sample, the spectra and the maths—The critical pillars in the development of robust and sound vibrational spectroscopy applications. Molecules 2020, 25, 3674. [Google Scholar] [CrossRef]
- Engel, J.; Gerretzen, J.; Szymańska, E.; Jansen, J.J.; Downey, G.; Blanchet, L.; Buydens, L.M. Breaking with trends in pre-processing? TrAC Trends Anal. Chem. 2013, 50, 96–106. [Google Scholar] [CrossRef]
- Mehmood, T.; Hovde, K.; Snipen, L.; Saeo, S. A review of variable selection methods in partial least squares regression. Chemom. Intell. Lab. Syst. 2012, 118, 62–69. [Google Scholar] [CrossRef]
- Rinnan, Å.; van den Berg, F.; Engelsen, S.B. Review of the most common pre-processing techniques for near-infrared spectra. TrAC Trends Anal. Chem. 2009, 28, 1201–1222. [Google Scholar] [CrossRef]
- Duckworth, J. Mathematical data processing. In Near Infrared Spectroscopy in Agriculture; Roberts, C.A., Workman, J., Reeves, J.B., Eds.; American Society of Agronomy; Crop Science Society of America; Soil Science Society of America: Madison, WI, USA, 2004; pp. 115–132. [Google Scholar]
- Skov, T.; Honore, A.H.; Jensen, H.M.; Naes, T.; Engelsen, S.B. Chemometrics in foodomics: Handling data structures from multiple analytical platforms. Trends Anal. Chem. 2014, 60, 71–79. [Google Scholar] [CrossRef]
- Bureau, S.; Cozzolino, D.; Clark, C.J. Contributions of Fourier-transform mid infrared (FT-MIR) spectroscopy to the study of fruit and vegetables: A review. Postharvest Biol. Technol. 2018, 148, 1–14. [Google Scholar] [CrossRef]
- Agelet, L.; Hurburgh, C.H., Jr. A Tutorial on Near Infrared Spectroscopy and its’ Calibration. Crit. Rev. Anal. Chem. 2010, 40, 246–260. [Google Scholar] [CrossRef]
- Badertscher, M.; Pretsch, E. Bad results from good data. Trends Anal. Chem. 2006, 25, 1131–1138. [Google Scholar] [CrossRef]
- Brereton, R.G.; Jansen, J.; Lopes, J.; Marini, F.; Pomerantsev, A.; Rodionova, O.; Tauler, R. Chemometrics in analytical chemistry—Part II: Modeling, validation, and applications. Anal. Bioanal. Chem. 2018, 410, 6691–6704. [Google Scholar] [CrossRef]
- Szymańska, E.; Gerretzen, J.; Engel, J.; Geurts, B.; Blanchet, L.; Buydens, L.M. Chemometrics and qualitative analysis have a vibrant relationship. TrAC Trends Anal. Chem. 2015, 69, 34–51. [Google Scholar] [CrossRef]
- Efron, B. Bootstrap methods: Another look at the jackknife. Ann. Stat. 1979, 71, 1–26. [Google Scholar] [CrossRef]
- Efron, B. Jackknife-after-bootstrap standard errors and influence functions. J. R. Stat. Soc. B 1992, 54, 83–127. [Google Scholar] [CrossRef]
- Westad, F.; Marini, F. Validation of chemometric models—A tutorial. Anal. Chim. Acta 2015, 893, 14–24. [Google Scholar] [CrossRef]
- Oliveri, P.; Malegori, C.; Simonetti, R.; Casale, M. The impact of signal pre-processing on the final interpretation of analytical outcomes e A tutorial. Anal. Chim. Acta 2019, 1058, 9–17. [Google Scholar] [CrossRef]
- Alewijn, M.; van der Voet, H.; van Ruth, S. Validation of multivariate classification methods using analytical fingerprints—Concept and case study on organic feed for laying hens. J. Food Compos. Anal. 2016, 51, 15–23. [Google Scholar] [CrossRef] [Green Version]
- Perez-Guaita, D.; Kuligowski, J.; Lendl, B.; Wood, B.R.; Quint, G. Assessment of discriminant models in infrared imaging using constrained repeated random sampling-Cross validation. Anal. Chim. Acta 2018, 1033, 156–164. [Google Scholar] [CrossRef] [PubMed]
- Kjeldhal, K.; Bro, R. Some common misunderstanding in chemometrics. J. Chemom. 2010, 24, 558–564. [Google Scholar] [CrossRef]
- Hawkins, D.M. The problem of overfitting. J. Chem. Inform. Comput. Sci. 2004, 44, 1–12. [Google Scholar] [CrossRef]
Figure 1.
The combination of sensing technologies with chemometrics—moving from data to information and knowledge.
Figure 1.
The combination of sensing technologies with chemometrics—moving from data to information and knowledge.

Figure 2.
Calibration and validation steps in a nutshell.

Figure 3.
An stepwise process from experimental design to the practical application of sensing technologies combined with chemometrics.
Figure 3.
An stepwise process from experimental design to the practical application of sensing technologies combined with chemometrics.

Publisher’s Note: MDPI stays neutral with regard to jurisdictional claims in published maps and institutional affiliations. |
© 2022 by the authors. Licensee MDPI, Basel, Switzerland. This article is an open access article distributed under the terms and conditions of the Creative Commons Attribution (CC BY) license (https://creativecommons.org/licenses/by/4.0/).
Share and Cite
MDPI and ACS Style
Dayananda, B.; Cozzolino, D. Beyond the Black Box—Practical Considerations on the Use of Chemometrics Combined with Sensing Technologies in Food Science Applications. Chemosensors 2022, 10, 323. https://doi.org/10.3390/chemosensors10080323
AMA Style
Dayananda B, Cozzolino D. Beyond the Black Box—Practical Considerations on the Use of Chemometrics Combined with Sensing Technologies in Food Science Applications. Chemosensors. 2022; 10(8):323. https://doi.org/10.3390/chemosensors10080323
Chicago/Turabian StyleDayananda, Buddhi, and Daniel Cozzolino. 2022. "Beyond the Black Box—Practical Considerations on the Use of Chemometrics Combined with Sensing Technologies in Food Science Applications" Chemosensors 10, no. 8: 323. https://doi.org/10.3390/chemosensors10080323
Note that from the first issue of 2016, this journal uses article numbers instead of page numbers. See further details here.