Preliminary Equipment Design for On-Board Hydrogen Production by Steam Reforming in Palladium Membrane Reactors


Department of Chemical, Energy and Mechanical Technology, Rey Juan Carlos University, C/Tulipán s/n, 28933 Móstoles, Spain
*
Author to whom correspondence should be addressed.
ChemEngineering 2019, 3(1), 6; https://doi.org/10.3390/chemengineering3010006
Submission received: 31 October 2018
/
Revised: 17 December 2018
/
Accepted: 7 January 2019
/
Published: 15 January 2019
(This article belongs to the Special Issue Membrane and Membrane Reactors Operations in Chemical Engineering)
Abstract
:Hydrogen, as an energy carrier, can take the main role in the transition to a new energy model based on renewable sources. However, its application in the transport sector is limited by its difficult storage and the lack of infrastructure for its distribution. On-board H2 production is proposed as a possible solution to these problems, especially in the case of considering renewable feedstocks such as bio-ethanol or bio-methane. This work addresses a first approach for analyzing the viability of these alternatives by using Pd-membrane reactors in polymer electrolyte membrane fuel cell (PEM-FC) vehicles. It has been demonstrated that the use of Pd-based membrane reactors enhances hydrogen productivity and provides enough pure hydrogen to feed the PEM-FC requirements in one single step. Both alternatives seem to be feasible, although the methane-based on-board hydrogen production offers some additional advantages. For this case, it is possible to generate 1.82 kmol h−1 of pure H2 to feed the PEM-FC while minimizing the CO2 emissions to 71 g CO2/100 km. This value would be under the future emissions limits proposed by the European Union (EU) for year 2020. In this case, the operating conditions of the on-board reformer are T = 650 °C, Pret = 10 bar and H2O/CH4 = 2.25, requiring 1 kg of catalyst load and a membrane area of 1.76 m2.
Keywords:
hydrogen; on-board; steam reforming; ethanol; methane; membrane reactor; palladium; modeling1. Introduction
The current energy model, mainly based on fossil fuels, presents two main drawbacks (i) limitation of reservoirs, which are getting scarcer and, consequently, increasing the price; and (ii) generation of CO2 emissions during their combustion, definitively contributing to global warming [1]. Under this situation, especially critical in big cities, it is clear there is a need for a new and sustainable energy model, based on renewable energies, capable of facing the increasing energy demand associated with the exponential growth of the global population and, simultaneously helping the reduction of pollutant emissions [2]. This modification of the energy model will not be immediate nor focused on a unique energy source, so a progressive transition in the short-middle term is necessary to achieve a completely stable and safe energy grid while fossil fuels gradually cease [3]. Most perspectives establish hydrogen as the key for this transition due to its high performance and absence of CO2 emissions during its combustion. It is considered a clean energy carrier because it allows both storage of diverse primary energy sources, renewable ones in an ideal situation, and transformation into different forms of energy, i.e., electrical energy in fuel cells [1]. In this manner, a hydrogen-based energy model could combine at the same time traditional fossil fuels with other renewable sources, while minimizing the environmental impact [4]. However, the lack of highly efficient storage devices and distribution infrastructures is slowing down its real penetration into the system, especially with regard to the transport sector [5,6]. Development of on-board hydrogen production systems would be a great solution to overcome these limitations, generating the H2 just inside the vehicle from other compounds and, thus, minimizing its difficult storage and transport [7]. However, this application needs to be carefully addressed, especially in terms of dimensions and weight of the on-board H2 production unit due to the space restrictions in an average vehicle and optimization of power requirements. Considering the reduction of CO2 emissions as one of the main reasons to use hydrogen in transport, renewable sources need to be pursued for its production, preferably being also easily stored and distributed [8]. Bio-ethanol [9] and bio-methane [10] could accomplish reasonably these requirements. However, it is important to note that the purity of these compounds could affect the associated H2 production process and storage requirements. In fact, bio-ethanol is usually accompanied by a significant amount of water, while bio-methane could be together with 20%–40% carbon dioxide. Both alternatives have been widely studied due to the use of mature techniques, i.e., steam-reforming [11,12,13,14], although only few of them address on-board production for their future application to the transport sector [15]. Among them, only some laboratory-scaled works or modeling studies using small fuel cells of 1–5 kW can be found [15], producing hydrogen via steam reforming, although it is really rare to find the combination of dimensioning the production unit with the polymer electrolyte membrane fuel cells (PEM-FC) requirements in real conditions required for most of typical vehicles (in terms of power and available space). Therefore, the viability of this strategy to power bigger fuel cells, as most of prototypes demand, needs to be properly addressed. Moreover, requirements of H2 purity are especially important as the PEM-FC (widely proposed for H2-vehicles) can be easily poisoned with trace amounts of CO [16], and available space inside a typical vehicle for a purification unit is very limited.
In this context, the use of membrane reactors, which combine both chemical reaction and separation steps in a single device, appears as a very attractive alternative for efficient process intensification [17,18]. Selective permeation of hydrogen through an adequate membrane shifts the equilibrium, enhancing the chemical reaction and, thus, improving both conversion and global efficiency while a high-purity product is simultaneously obtained in the permeate side [4,17,18]. Over recent years, multiple experimental and modeling works with membrane reactors can be found in the literature for diverse processes, mainly steam reforming [19], auto-thermal reforming [20], and water gas shift [21]. Most of them present a multi-tubular structure in which the catalyst is placed as a fixed-bed [22] or fluidized-bed [23,24] and the tubes are made of H2-selective material, usually Pd or Pd-based alloys with high perm-selectivity and good thermal resistance [25]. However, the study of these systems for direct H2 production on-board is still scarce [15].
In this context, the present work analyzes the use of membrane reactors for ultra-pure H2 production on-board, capable to power a typical PEM-FC, feeding directly previously purified bio-ethanol or bio-methane in the vehicle. The most convenient operating conditions were studied through modeling to enhance the H2 production, maximizing the permeation rate and, thus, the chemical reaction displacement, while assuring both thermal and mechanical stability. The reactor design (catalyst load and membrane area) was performed while taking into account main limitations of available space in vehicles. Finally, some considerations about energy integration, economy, and environmental impact were also addressed.
2. Experimental Details
2.1. Process Design for Hydrogen Production On-Board
The process design was focused on the hydrogen requirements of the considered fuel cell, in this case a PEM-FC type. According to the Technology Road Map published for fuel cells and H2 transition [26], the recommended power energy for utility vehicles goes from 80 to 120 kW with higher heating value efficiencies (HHV) up to 60% (ratio between fuel cell power and high heating value of the gases fed to the anode). Considering the minimum value of this range (80 kW) and typical efficiencies, the on-board production system would need to supply around 1.70 kmol·h−1 of pure H2, which was taken as the target value for this work.
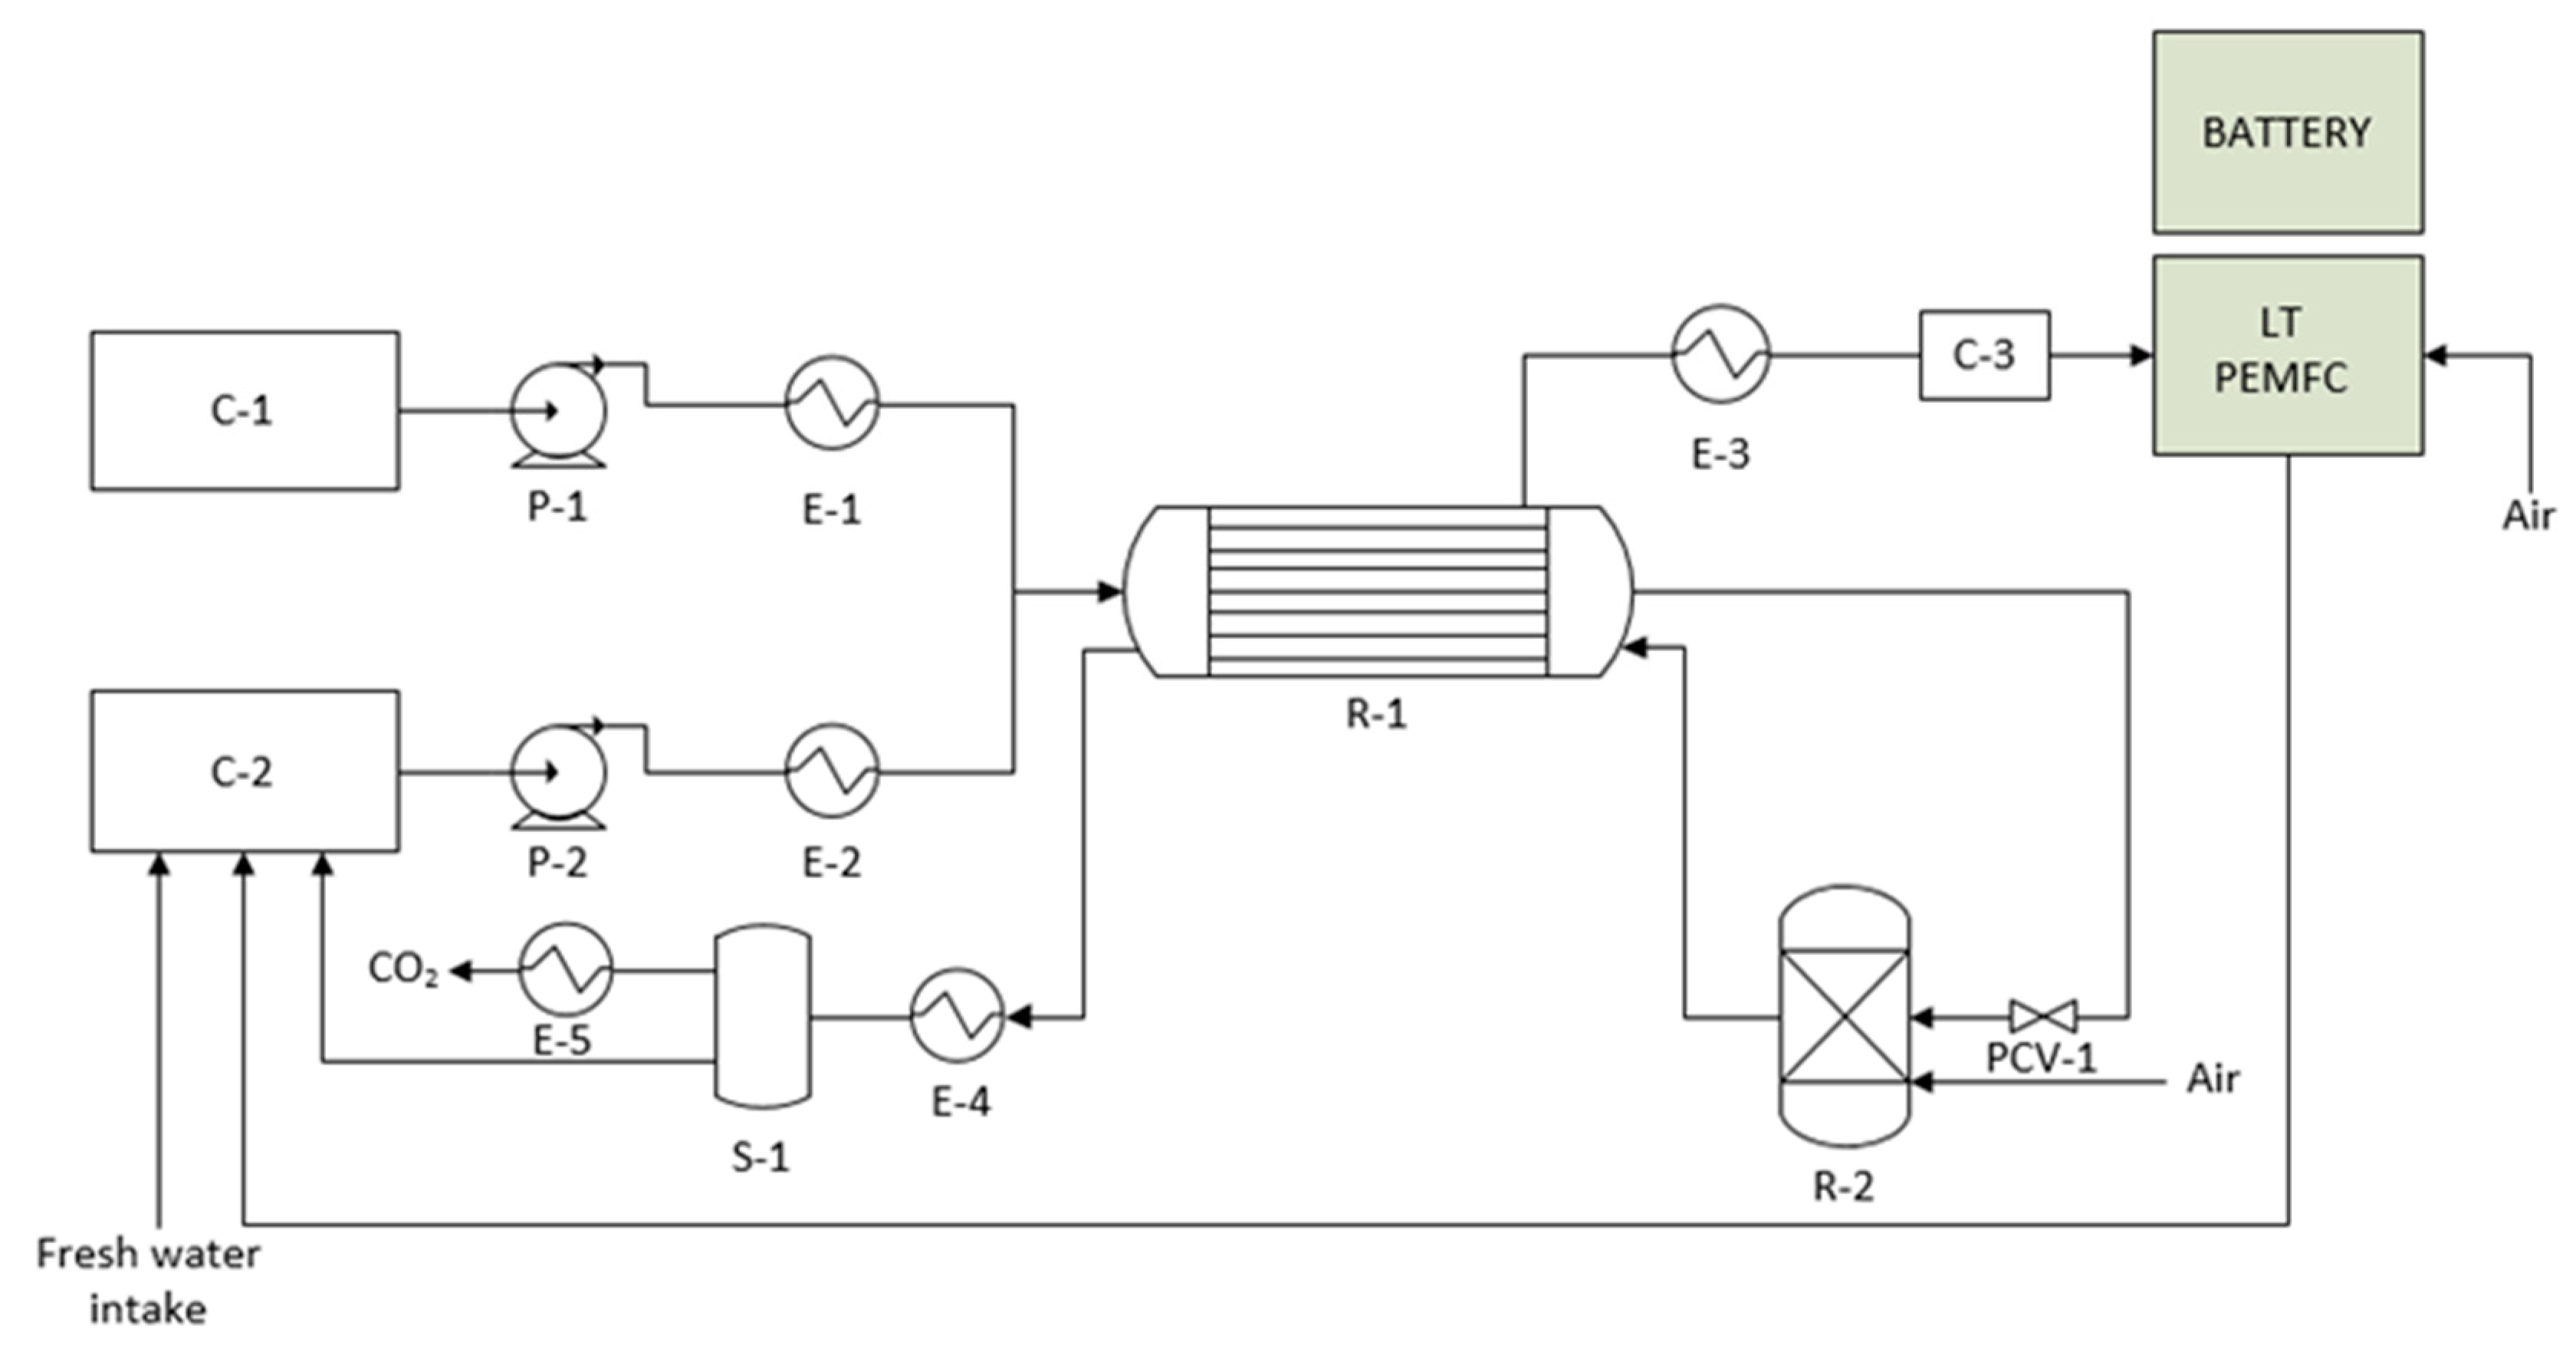
Figure 1 presents a block diagram for the entire process designed in the present work. Two main deposits contain the main reactants of the process: fuel (ethanol or methane from previous bio-production processes) and water. Here, it is important to note that a previous purification and conditioning of fuels were considered, feeding the vehicle with pure compounds for easier comparison between both alternatives. Inside the vehicle, the reactants are pre-treated to reach the operating conditions prior to entering the membrane reactor. Basically, this pre-treatment consists of pumping and heating the reactants (vaporizing in case of liquids) until reaching the operating conditions. Then, H2 is produced in the membrane reactor unit (R-1), being simultaneously separated through a palladium membrane to feed the fuel cell (low-temperature polymer electrolyte membrane fuel cell, LT-PEMFC). The H2 flux needs to be cooled and stabilized in a buffer to enlarge the PEM-FC life cycle. The retentate coming from R-1 is fed to a combustor, where the non-converted reactants (bio-ethanol or bio-methane), CO, and non-permeated H2 are burnt to provide the required energy for both pre-treatment units and R-1. Water is separated from CO2 by condensation and then returned to the intake deposit.
2.2. Membrane Reactor Modeling
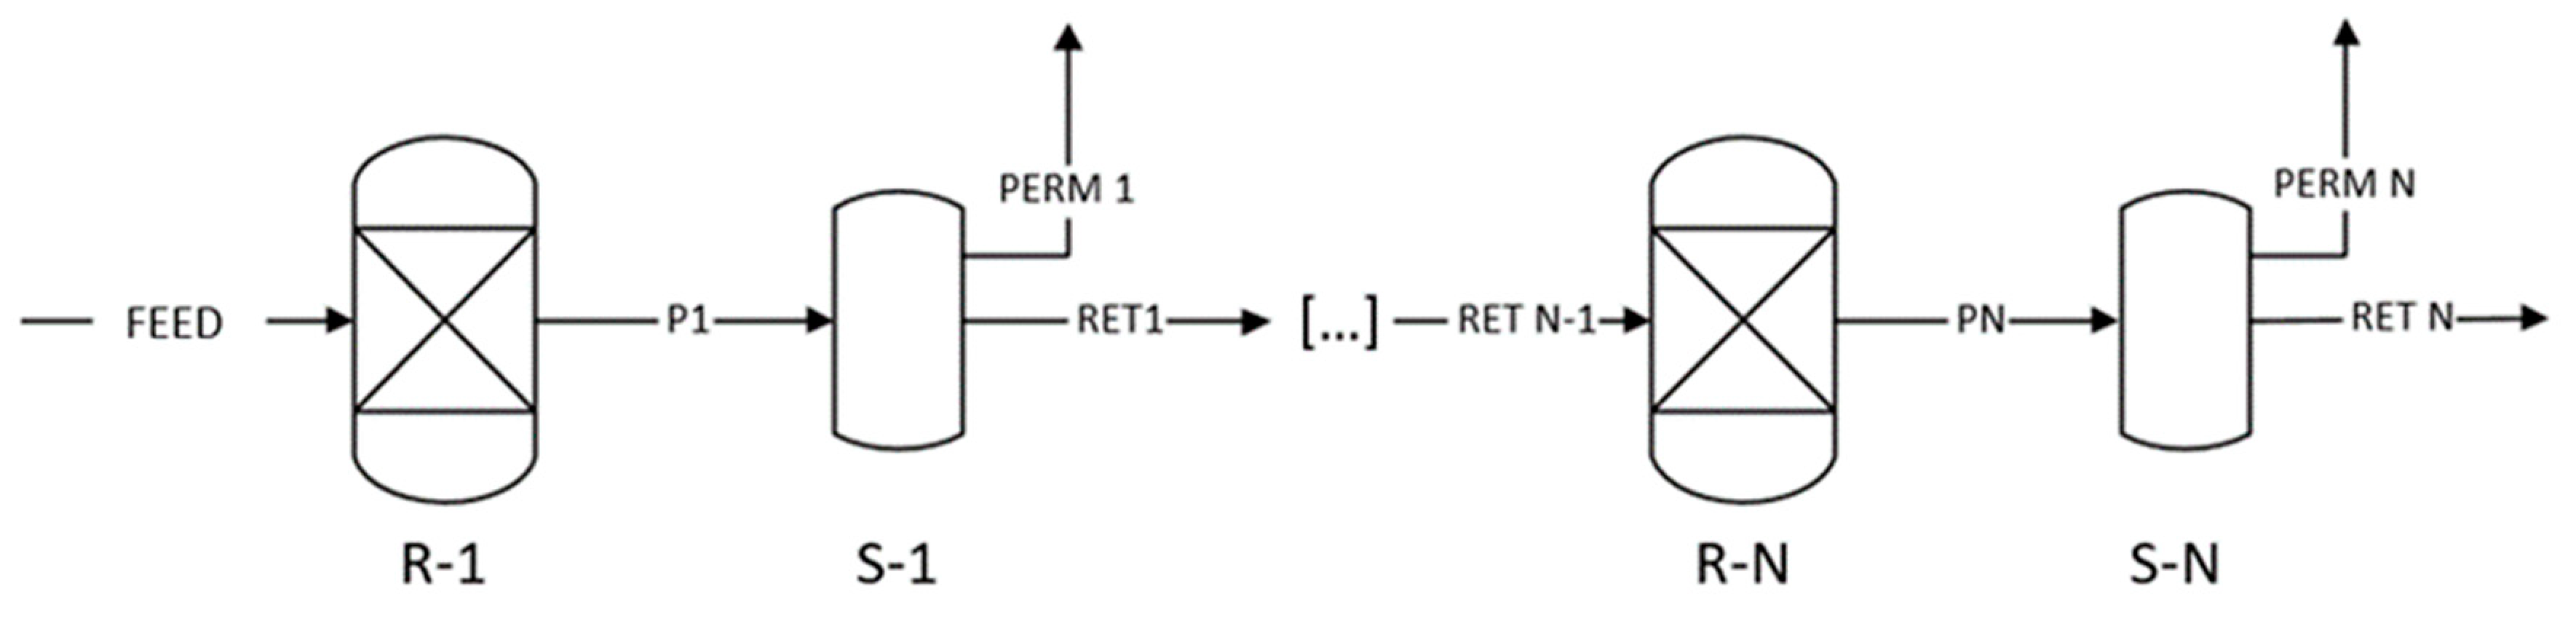
The entire process for H2-production on-board, the membrane reactor was modeled in Aspen-Plus® v.10, selecting the SR-POLAR method as the thermodynamic model for the calculations. However, the software does not have a specific block to simulate membrane reactors, in which both the chemical reaction and the product separation are carried out simultaneously. To overcome this problem, the multi-tubular membrane reactor R-1 designed for this work was simulated by successive modules emulating both chemical reaction and H2 separation. Thus, R-1 is divided into a limited number of units formed by a chemical reactor (RPLUG) and a consecutive separator to perform the real membrane reformer. This scheme is usually adopted as a good solution for simulating accurately the ideal shift effect of the membrane in a membrane reactor when only considering the thermodynamic equilibrium [27,28]. In this work, besides the equilibrium displacement, the kinetics of the possible chemical reactions were also considered as detailed in the following section. Figure 2 shows a simplified diagram of the block scheme used to simulate the membrane reactor in Aspen-Plus® v.10.
The H2 permeation through the membrane for each separator unit was calculated following Sievert’s Law [29].
where represents the hydrogen permeate flow in mol/s, the H2 permeance, A is the permeation area, and the hydrogen partial pressure in retentate and permeate sides, respectively. For this study, a general permeance of = 2.43 × 10⁻³ mol·m−2·s−1·Pa−0.5 was considered, taking as reference the DOE (Department of Energy of United States of America) technical targets for dense metallic membranes, in which 300 scfh/ft−2 hydrogen flow-rate is recommended when operating under 150 and 50 psia hydrogen partial pressure in retentate and permeate sides, respectively [30]. The permeate side was maintained at ambient pressure (1 bar) without applying any gas carrier, while the partial pressure of hydrogen in the retentate side was calculated by multiplying the operating pressure of the reactor and the hydrogen fraction present in the products that leave the previous reactor unit. This assumption is very realistic if considering a low pressure drop inside the reactor due to its considered length and the common control of pressure with back-regulators. The membrane area used in the Sievert’s Law for each separator unit will be the total membrane area considered in the study divided by the number of separator units that emulate the membrane reactor. Once the permeated hydrogen has been calculated, the split fraction is obtained by dividing this value by the total hydrogen that has entered this separator unit. No sweep gas was considered in the permeate stream in order to obtain ultra-pure hydrogen that feeds the fuel cell and, consequently, powers the vehicle.
2.3. Chemical Reactions and Kinetics
As it was previously mentioned, not only the chemical equilibrium was considered but the kinetics for diverse possible reactions inside the membrane reactors were also taken into account for the modeling. Chemical reactions considered in the present work were collected from diverse experiments from literature and the most relevant ones can be summarized as follows:
Based on previous publications from Llera et al. [31] and Hou et al. [32] for ethanol and methane steam reforming, respectively, Langmuir-Hinshelwood (LHHW) kinetics have been implemented in this work for modeling all described possible chemical reactions. LHHW equations involve each adsorption, reaction, and desorption steps carried out during the chemical reaction, thus providing more precise results than a Power Law model. All details about the kinetics expressions used in Aspen-Plus® v.10 are included in Appendix A. Both reactor dimensions and, therefore, the residence time, vary during the modeling for the optimization of the membrane area in the present study.
3. Results and Discussion
3.1. Preliminary Membrane Reactor Design: Modeling and Main Operating Conditions
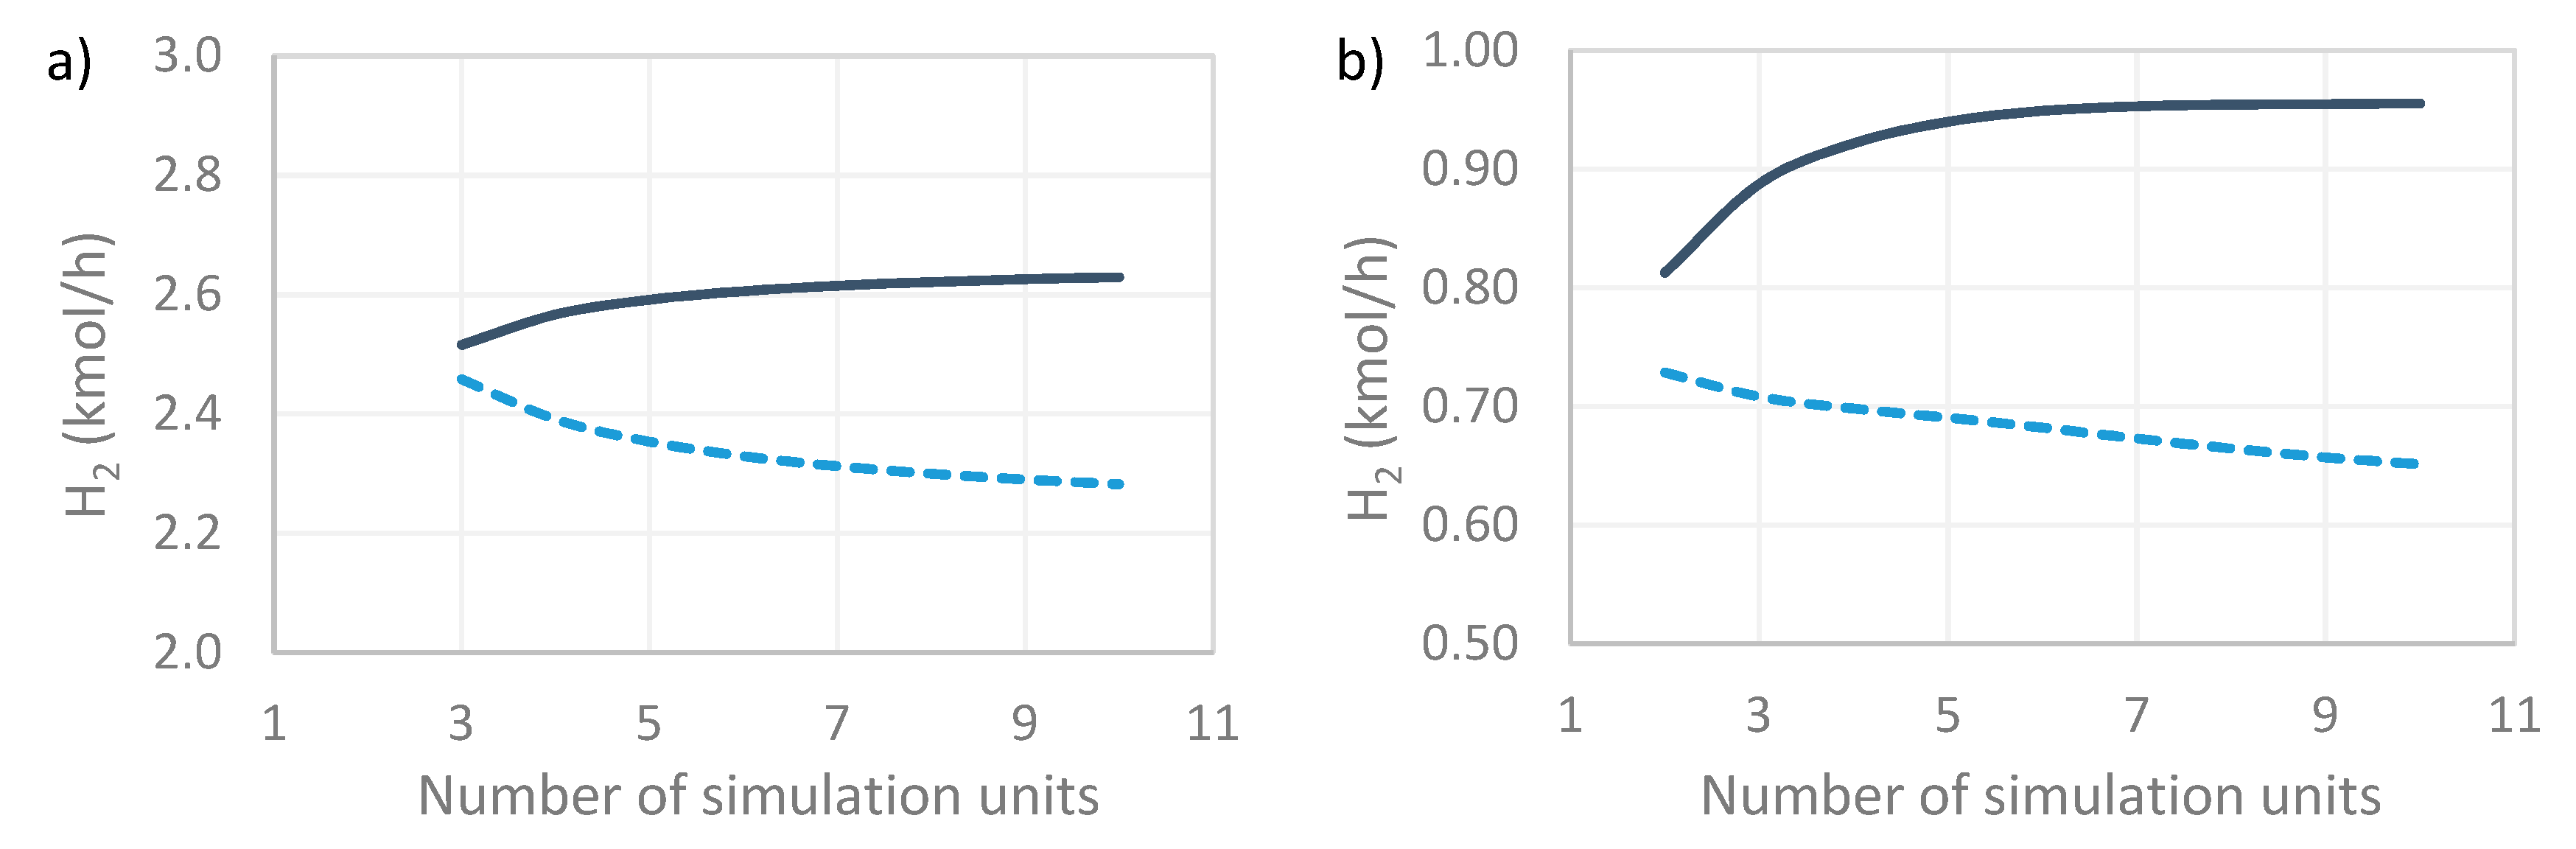
An adequate membrane reactor design involves the selection of specific catalysts for principal chemical reactions, catalyst load, membrane characteristics, device dimensioning (including the required permeation area), and main operating conditions. As it was previously stated, proper catalysts for each alternative addressed in the present work, as well as the associate kinetics parameters, were taken from literature [31,32]. Thus, the present section is focused on modeling the membrane reactor and analyzing the main operating conditions. The adopted strategy for modeling the membrane reactor is based on dividing the equipment in a limited number of consecutive RPLUG reactor and separator blocks. Thus, the first task was to determine the optimal number of units for simulating the shift effect of the reaction thanks to the simultaneous H2 permeation through the membrane. This study was carried out with some preliminary operating conditions, including a total catalyst load of 35 kg and a maximum possible membrane area (2.42 m2) that fits in the available space inside the vehicle. This area was divided into equal parts for each considered number of simulation units. Depicted in Figure 3, we found both the permeate flux and the total amount of H2 generated from ethanol (Figure 3a) or methane (Figure 3b) in the membrane reactor for an increasing number of simulation units (reactor-separator). In general, H2 production increases as a greater number of simulation units is considered due to the shift effect on the thermodynamic equilibrium; while a contrary effect can be observed on permeate flux, due to the H2 depletion along the axial dimension of the reactor. For both ethanol and methane intakes, H2 production seems to stabilize after 10 simulation units, so this value was selected to continue the study and analyze in detail the best operating conditions.
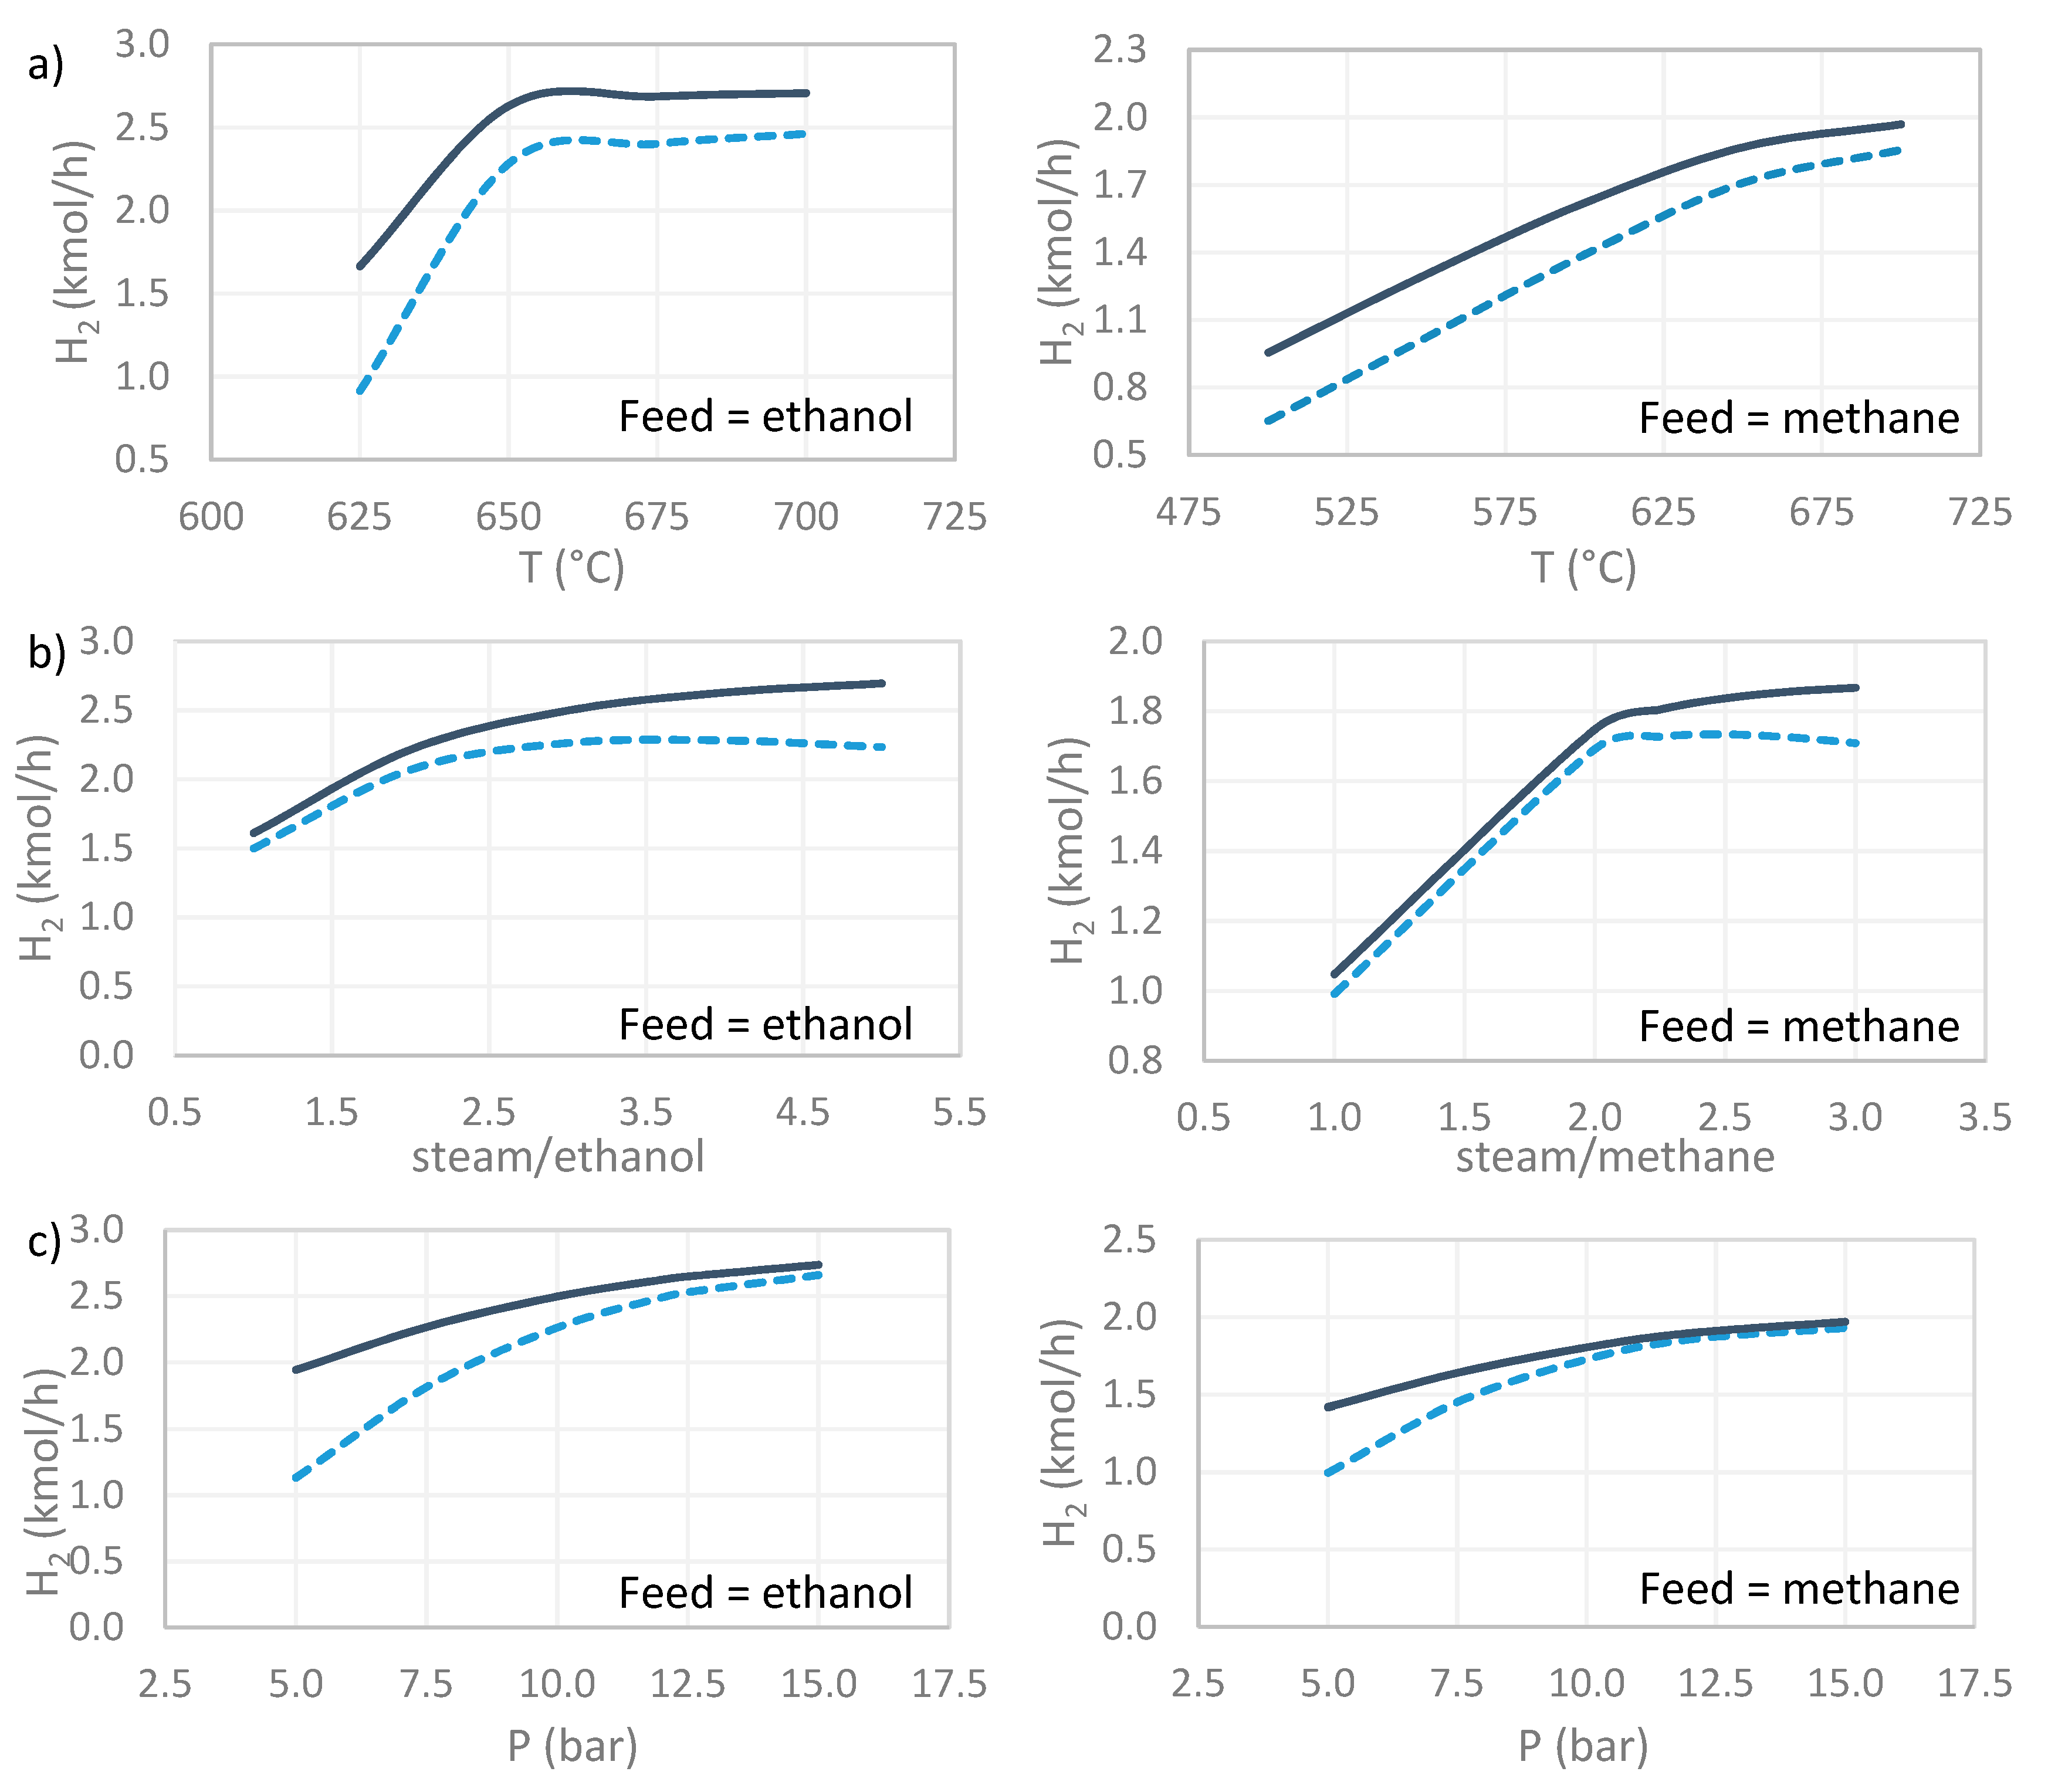
After determining the suitable number of simulation units for the membrane reactor, the influence of temperature, H2O/feed ratio and pressure were addressed as the main operating parameters for both ethanol and methane feeding the membrane reactor (Figure 4). For these studies, 35 kg catalyst load and 2.42 m2 of membrane area were maintained, keeping in mind that they were provisional values to be optimized afterwards.
The temperature optimization was first studied maintaining a pressure of 10 bar and the steam to feed ratio at four and three in the case of reforming ethanol or methane, respectively. As it can be observed in Figure 4a, an increasing temperature favors the hydrocarbons transformation into hydrogen. The main ethanol decomposition (Equation (2)) and steam reforming (Equations (3)–(5)) are endothermic reactions so they will be thermodynamically improved by increasing temperature. Additionally, both reaction kinetics and hydrogen permeance through the membrane are also increased with temperature, following an Arrhenius-type dependence, so the shift effect of the membrane reactor is also boosted and, consequently, the hydrogen production rate. Thus, it can be stated that, in general, higher temperatures improve the hydrogen production. However, temperature is limited by the thermal stability of the H2-selective membrane. Pd-based membranes are prepared onto supporting materials and experimentally they are used in the typical range of 400–550 °C to prevent possible damages on the composite structure, although it is expected to resist slightly higher temperatures [33,34]. In this manner, it is also possible to find several works in which these membranes operate at temperatures up to 650 °C with satisfactory results in terms of mechanical stability [35,36,37,38]. Under this perspective, and considering that temperatures above 650 °C do not increase the hydrogen productivity remarkably, this value was selected as the most appropriate operating temperature to perform the process when feeding both ethanol and methane.
Steam to feed hydrocarbon ratio in the membrane reactor was the next operating condition analyzed in this work (Figure 4b). For this study, the reactor temperature was maintained at 650 °C, considering the optimum value obtained in the previous study, and the reactor pressure at a preliminary value of 10 bar. As it can be extracted from the results, total hydrogen production is enhanced by increasing values of steam content in the feed. In general, the presence of water promotes all chemical reactions in which it acts as reactant, shifting the thermodynamic equilibrium towards further hydrogen production, according to Le Châtelier’s principle. However, large quantities of water dilute the generated hydrogen, reducing its partial pressure in the retentate side and, in consequence, the driving force of the permeation process. Thus, the thermodynamic equilibrium shift due to the H2 extraction through the membrane is limited. These opposite effects can explain the results collated in Figure 4b. First, the permeate flow-rate increases as steam to feed hydrocarbon ratio increases, as the chemical reaction improvement is more important than the hydrogen dilution effect. A maximum value around the ratio 2–3 is reached for the permeate flow-rate, the dilution effect becoming greater than the chemical reaction improvement from this point. This effect is caused by a drastic hydrogen partial pressure decrease in the retentate side, also affecting the pure hydrogen recovery. Considering this behavior and the energy requirements for heating the entire feed stream to the membrane reactor (including both hydrocarbon and steam), values of 3.00 and 2.25 were selected for steam-to-ethanol and steam-to-methane ratio, respectively.
Finally, the operating pressure in the membrane reactor was also evaluated, taking the optimal values obtained in previous studies for the temperature and steam to feed ratio. The modeling performance at these conditions is shown in Figure 4c. In general, an increase in both total produced H2 and permeate H2 can be observed as the pressure increases in the retentate side, being able to extract almost all the H2 generated in the membrane reactor as a pure gas in the permeate side at pressures higher than 10 bar. This separation is slightly easier in the case of feeding methane instead of ethanol due to the relationship between membrane area (kept constant) and the total H2 generated. A pressure increase clearly makes the H2 separation through the membrane easier due to the associated improvement of the permeation driving force. The higher the H2 permeation, the greater the shift effect on the thermodynamic equilibrium for chemical reactions R1 to R4, therefore enhancing the global productivity. However, in the case of ethanol steam reforming, previous studies found a decrease of H2 yield in a traditional fixed-bed reactor due to the production of methane, which cannot be easily converted into hydrogen at high pressures as the reaction is shifted towards the reactants, accordingly to Le Châtelier’s principle [39]. Of course, this negative effect on the H2 production is clear in the case of directly feeding methane to the process. However, as it can be extracted from the modeling results, this negative effect on the thermodynamics seems to be compensated by the continuous hydrogen removal through the membrane, obtaining a steady increase in hydrogen production as the pressure rises in the studied range. Considering other aspects related to the mechanical stability of the membrane, a total pressure of 10 bar for the retentate side was selected as the most appropriate operating condition to be used in the membrane reactor, both for ethanol and methane intakes. The stability of H2-selective membranes at this operating pressure was demonstrated in previous works at lab scale, avoiding cracks generation or delamination of the selective film [36,40].
3.2. Reactor Design Optimization
After analyzing the main operating parameters for the membrane reactor, the equipment design was optimized in terms of catalyst load, required permeation area, possible energy integration, and some preliminary economic considerations, aiming to produce 1.70 kmol·h−1 of pure H2 to power the considered 80 kW PEM-FC for the vehicle.
The maximum size considered for the membrane reactor is based on the available space under the rear seats of a standard vehicle, where it will be placed. In order to maximize the compactness of the reformer and maximize the permeation area, a multi-tubular reactor configuration was adopted. In this reactor, a triangular distribution of membranes with 1.25 in of inter-tubular space to ensure good heat transfer was considered, thus being possible to accommodate a maximum of 38 tubes of 80 cm in length. This reached a maximum membrane area of 2.42 m2.
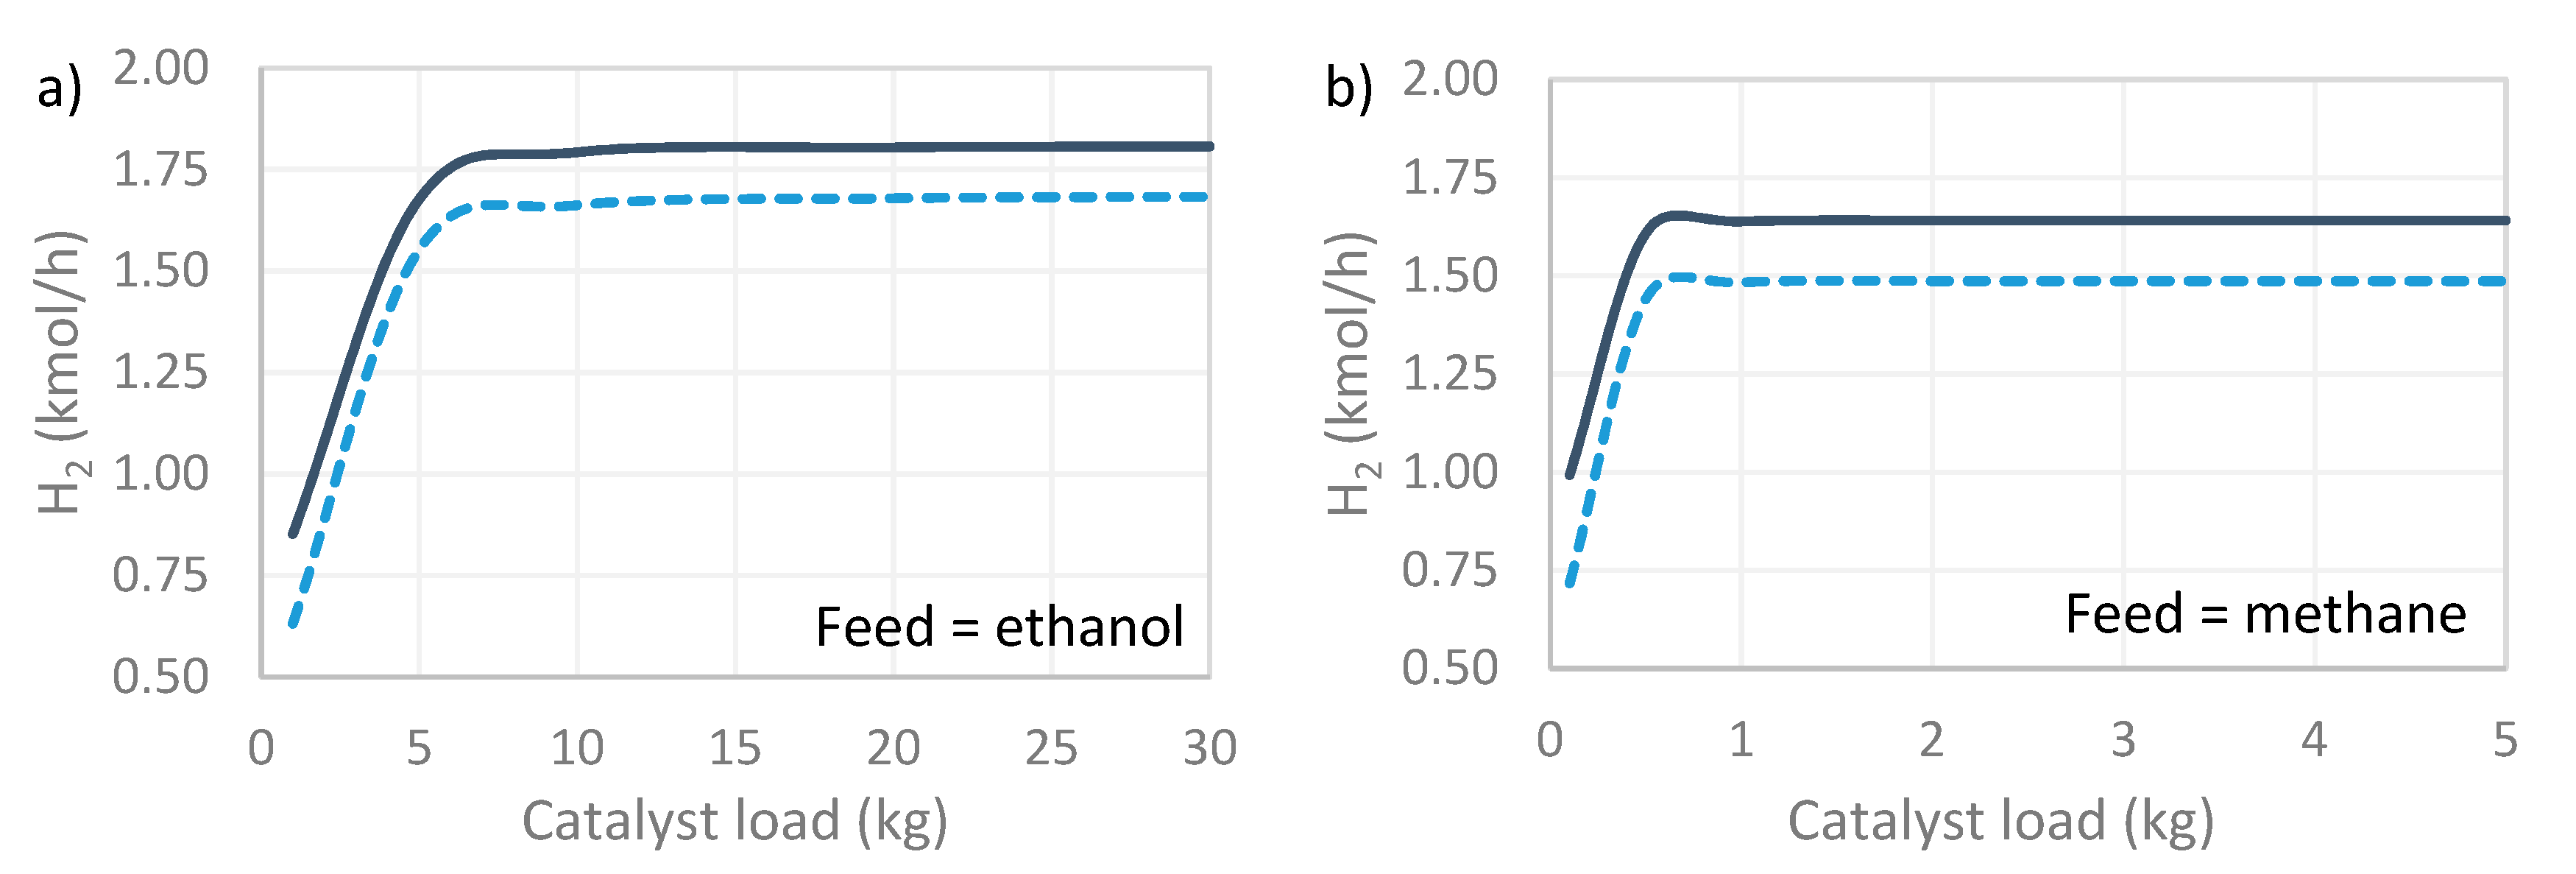
Theoretically, the amount of catalyst affects the space velocity inside the reactor, the hydrocarbon conversion and, consequently, the amount of produced hydrogen. Figure 5 collates the results obtained for different catalyst loads when feeding the membrane reactor with ethanol (Figure 5a) and methane (Figure 5b). A stable H2 production rate is reached for a catalyst load of 5 kg and 1 kg when feeding the reactor with ethanol and methane, respectively. The facility to reach a stable value with a smaller amount of catalyst in the second case can be explained by the kinetic parameters. The pre-exponential factors for the kinetic expression of methane steam reforming (Equation (4)) are higher by several orders of magnitude than the corresponding ones for ethanol steam reforming (Equation (3)). It means that higher conversions can be achieved with a smaller catalyst load. In the case of feeding the membrane reactor with ethanol, almost complete conversions (around 99.99%) were achieved for catalyst loads greater than 5 kg, while this value was maintained around 40% in the case of using 1 kg of catalyst.
Then, several combinations of catalyst load, membrane area and reactant feed were tested aiming to achieve the production target of 1.70 kmol·h−1 of pure H2. With these simulations we can see that, despite hydrogen production being maintained as very stable for increasing catalyst loads, the associated decrease of space velocity improves the hydrogen recovery, as it is possible to save part of the initially considered membrane area. In this manner, it could be possible to maintain similar hydrogen production, saving 20% of membrane area by doubling the catalyst load from 5 kg to 10 kg. However, by doubling again the catalyst load from 10 kg to 20 kg this effect would only save another 3% of the membrane area. Thus, 10 kg was chosen as the optimum catalyst load for the ethanol steam reformer. This effect is negligible in the case of considering a methane feed.
The optimal combination was found to be 1.87 m2 membrane area, 10 kg of catalyst load, and 0.37 kmol h−1 feed for the ethanol steam reforming and 1.76 m2, 1 kg of catalyst and 0.54 kmol·h−1 when feeding methane. As it was previously described, these membrane areas were achieved by considering the use of a multi-tubular membrane reactor. The recent trends in membrane preparation used for hydrogen production processes have been directed to synthesize composite membranes in which a thin layer of palladium or a palladium-based alloy is deposited onto a porous supporting material [34]. Selecting standard dimensions for these supports, i.e., outside diameter of 1.0 in and total length around 24 in, the membrane reactor design will require 28 membranes, ensuring a good fit to the available space under the rear seats in any utility vehicle.
The energy requirements for the proposed model, including the reactants pre-treatment and the heat of reaction requirements, can be achieved by combusting the retentate gases from the membrane reactor. Thus, both ethanol/methane intake and membrane area were optimized to reach an autonomous process in terms of energy, while the desired pure-H2 to feed the PEM-FC was maintained. The transitory state until achieving this situation was not taken into account in the present study. Before the reactor reaches the optimum operating temperature to act as an autonomous system, ethanol or methane would need to be fed directly to the combustor, providing the necessary energy for the initial process conditioning. Thus, the total fuel consumption would be slightly higher than that indicated in this work.
On analyzing the convenience of using a membrane reactor for the on-board H2 generation instead of a traditional reaction system, clear benefits can be found. In this manner, a 75% rise in H2 production is achieved by using a membrane reactor for the on-board hydrogen production from ethanol compared to that obtained in a conventional reactor operating under the same conditions (T = 650 °C, Pret = 10 bar, H2O/C2H5OH = 3 and mcat = 10 kg). Thus, the H2 flow-rate is increased from 1.06 kmol h−1 to 1.85 kmol·h−1 due to the total conversion of the ethanol being reached, whereas it was maintained below 95% in a conventional reactor. In the case of feeding the system with methane, a similar behavior can be found, although in this case the increase was greater. Hydrogen productivity and methane conversion were increased from 0.9 kmol·h−1 to 1.82 kmol·h−1 and from 42.8% to 84.9%, respectively, operating under the same conditions for both conventional and membrane reactors (T = 650 °C, Pret = 10 bar, H2O/CH4 = 2.25 and mcat = 1 kg). All these parameters are summarized in Table 1. The results also imply additional benefits in both weight and space savings due to the intensification of the process reached with the membrane reactor.
Finally, a preliminary approach to main economic and environmental aspects was also included to analyze roughly the viability of on-board H2 production via membrane reactors for powering vehicles. First commercial hydrogen vehicles on the market have an autonomy of around 500–650 km with a pressurized hydrogen tank of 5 kg [41,42]. Considering conservative criteria, a preliminary consumption of 1 kg H2/100 km for general PEM-FC vehicles is estimated. If hydrogen on-board generation is assumed, there is no need to store it, thus solving one of the main drawbacks for commercially introducing hydrogen vehicles in the near future. Considering a regular deposit of 55 L for liquid fuels (i.e., ethanol coming from bio-routes), and simulated results of this work, 8.5 kg of hydrogen could be generated, giving an autonomy for the car of around 850 km. On the other hand, considering a 15 kg deposit for the methane alternative (value used in current natural gas-powered vehicles in the market), 5.8 kg of hydrogen could be produced, making it possible to cover around 580 km. The membrane would be one of the most expensive elements in the process; estimating its cost from economic targets proposed by the US Department of Energy for ensuring commercial viability of this technology, assuming a cost of 500 US $/ft2, it would mean, around 1520 € m2 with the current exchange rate [30]. In this context, the cost for the membranes of the on-board reformers would be around 2650–2800 € in the case of considering feeding the vehicle with bio-methane or bio-ethanol, respectively. This cost can be easily absorbed by both manufacturers and customers, especially considering that CO2 emissions can be significantly reduced. The European Commission indicates that CO2 emissions need to be maintained below 95 g·km−1 for year 2020 [43]. Under this perspective, the studied process feeding with bio-ethanol presents potential CO2 emissions of around 97 g CO2/100 km, slightly higher than the limit proposed by the UE. However, feeding the system with methane, this value could be reduced to 71 g CO2/100 km due to its higher H/C ratio. Here, it is important to remember that previous purification processes for bio-ethanol and bio-methane feedstock have been considered, feeding the vehicle with the pure compounds to avoid a reduction of the useful volume of the vehicle tank. Both of them represent good results, noticeably reducing current values for latest gasoline and diesel vehicles, with CO2 emission levels of 123 and 119 g CO2/100 km, respectively.
4. Conclusions
This work addressed a first approach for analyzing the viability of H2 on-board production by membrane reactors in PEM-FC vehicles via mathematical modelling with Aspen-Plus® v.10. Despite further experimental studies needing to be performed, some interesting insights can be extracted for alternative hydrogen production from bio-ethanol or bio-methane. Firstly, it was demonstrated that the use of membrane reactors enhances the hydrogen productivity and provides enough pure hydrogen to feed the PEM-FC requirements in one single step. Operating conditions for both alternatives were optimized, studying the effect of temperature, pressure, steam/hydrocarbon ratio, and catalyst load for each case. The methane-based on-board hydrogen production seems to be the best alternative, generating 1.82 kmol·h−1 of pure H2 for feeding the PEM-FC and minimizing the CO2 emissions up to 71 g CO2/100 km, ensuring the future limitation proposed by the UE for year 2020 is achieved. This alternative ensures an autonomy of around 580 km for the H2-vehicle assuming a typical methane deposit of similar capacity to the gas-feed commercially available vehicles. For this alternative, the on-board reformer operates at T = 650 °C, Pret = 10 bar, and H2O/CH4 = 2.25, requiring 1 kg of catalyst load and a membrane area of 1.76 m2. However, the alternative achieved from bio-ethanol can also be considered for the future, reaching similar results (1.87 kmol·h−1 of pure H2 at comparable operating conditions) and ensuring a more realistic production from renewable routes in the required terms.
Author Contributions
D.A. and M.H. conceived and designed the experiments; M.H. performed the experiments; D.A. and M.H. analyzed the data; no reagents nor materials were necessary for this study; M.H. wrote the paper with revision of D.A.
Funding
This research received no external funding apart the facilities of Rey Juan Carlos University for studying Chemical Engineering and the collaboration scholarship for M.H. in the Department of Chemical, Energy, and Mechanical Technology of the above-mentioned university.
Acknowledgements
The authors of this work are hugely grateful for the support achieved from Rey Juan Carlos University (Spain). M. Holgado especially acknowledges the collaboration scholarship of 8 months in the Department of Chemical, Energy, and Mechanical Technology of the above-mentioned university. Additionally, we also thanks prof. José Antonio Calles for his advises in preliminary works of this research.
Conflicts of Interest
The authors declare no conflict of interest.
Appendix A
The LHHW kinetics expressions considered in the present work for the ethanol steam reforming are summarized as follows:
where is the ratio between the product of each component fraction to the stoichiometric coefficient and the equilibrium constant of the considered reaction:
At the same time, the equilibrium constant can be defined as the ratio between the kinetics constants for both direct and reverse reactions, obtaining:
In the case of feeding methane, LHHW kinetics expressions can be described as follows:
References
- Balat, H.; Kırtay, E. Hydrogen from biomass—Present scenario and future prospects. Int. J. Hydrogen Energy 2010, 35, 7416–7426. [Google Scholar] [CrossRef]
- International Energy Agency. World Energy Outlook 2017; International Energy Agency: Paris, France, 2018. [Google Scholar]
- Crespo, P.; Van Nieuwkoop, R.H.; Kardakos, E.G.; Schaffner, C. Modelling the energy transition: A nexus of energy system and economic models. Energy Strateg. Rev. 2018, 20, 229–235. [Google Scholar] [CrossRef]
- Lu, G.Q.; da Costa, J.C.D.; Duke, M.; Giessler, S.; Socolow, R.; Williams, R.H.; Kreutz, T. Inorganic membranes for hydrogen production and purification: A critical review and perspective. J. Colloid Interface Sci. 2007, 314, 589–603. [Google Scholar] [CrossRef] [PubMed]
- Durbin, D.J. Review of hydrogen storage techniques for on board vehicle applications. Int. J. Hydrogen Energy 2013, 38, 14595–14617. [Google Scholar] [CrossRef]
- Agnolucci, P. Hydrogen infrastructure for the transport sector. Int. J. Hydrogen Energy 2007, 32, 3526–3544. [Google Scholar] [CrossRef]
- Brunetti, A.; Barbieri, G.; Drioli, E. Integrated membrane system for pure hydrogen production: A Pd–Ag membrane reactor and a PEMFC. Fuel Process. Technol. 2011, 92, 166–174. [Google Scholar] [CrossRef]
- Pfeifer, A.; Dobravec, V.; Pavlinek, L.; Kraja, G. Integration of renewable energy and demand response technologies in interconnected energy systems. Energy 2018, 161, 447–455. [Google Scholar] [CrossRef]
- Benito, M.; Sanz, J.L.; Isabel, R.; Padilla, R.; Arjona, R.; Daza, L. Bio-ethanol steam reforming: Insights on the mechanism for hydrogen production. J. Power Sources 2005, 151, 11–17. [Google Scholar] [CrossRef]
- Oreggioni, D.; Reilly, M.; Kirby, E.; Ferrão, P.; Fournier, J.; Corre, L. ScienceDirect ScienceDirect 1st International Conference on Sustainable Energy and Resource Use in Food Chains Techno-economic analysis of bio-methane production on District Heating and Cooling from agriculture and food industry waste Assessing the feasibility of using the heat demand-outdoor temperature function for a long-term district heat demand forecast. Energy Procedia 2017, 123, 81–88. [Google Scholar] [CrossRef]
- Vita, A.; Pino, L.; Italiano, C.; Palella, A. Chapter 6—Steam Reforming, Partial Oxidation, and Autothermal Reforming of Ethanol for Hydrogen Production in Conventional Reactors. In Ethanol; Basile, A., Iulianelli, A., Dalena, F., Veziroğlu, T.N., Eds.; Elsevier: New York, NY, USA, 2019; pp. 159–191. [Google Scholar]
- Murmura, M.A. Modeling Fixed Bed Membrane Reactors for Hydrogen Production through Steam Reforming Reactions: A Critical Analysis. Membranes 2018, 8, 34. [Google Scholar] [CrossRef]
- Simakov, D.S.A.; Sheintuch, M. Demonstration of a scaled-down autothermal membrane methane reformer for hydrogen generation. Int. J. Hydrogen Energy 2009, 34, 8866–8876. [Google Scholar] [CrossRef]
- Tartakovsky, L.; Sheintuch, M. Fuel reforming in internal combustion engines. Prog. Energy Combust. Sci. 2018, 67, 88–114. [Google Scholar] [CrossRef]
- Purnima, P.; Jayanti, S. ScienceDirect A high-efficiency, auto-thermal system for on-board hydrogen production for low temperature PEM fuel cells using dual reforming of ethanol. Int. J. Hydrogen Energy 2016, 41, 13800–13810. [Google Scholar] [CrossRef]
- Jaggi, V.; Jayanti, S. A conceptual model of a high-efficiency, stand-alone power unit based on a fuel cell stack with an integrated auto-thermal ethanol reformer. Appl. Energy 2013, 110, 295–303. [Google Scholar] [CrossRef]
- Sanz, R.; Calles, J.A.; Alique, D.; Furones, L.; Ordóñez, S.; Marín, P. Hydrogen production in a Pore-Plated Pd-membrane reactor: Experimental analysis and model validation for the Water Gas Shift reaction. Int. J. Hydrogen Energy 2015, 40, 3472–3484. [Google Scholar] [CrossRef]
- Kikuchi, E. Membrane reactor application to hydrogen production. Catal. Today 2000, 56, 97–101. [Google Scholar] [CrossRef]
- De Nooijer, N.; Gallucci, F.; Pellizzari, E.; Melendez, J.; Alfredo, D.; Tanaka, P.; Manzolini, G.; Van Sint, M. On concentration polarisation in a fluidized bed membrane reactor for biogas steam reforming: Modelling and experimental validation. Chem. Eng. J. 2018, 348, 232–243. [Google Scholar] [CrossRef]
- Spallina, V.; Matturro, G.; Ruocco, C.; Meloni, E.; Palma, V.; Fernandez, E.; Gallucci, F. Direct route from ethanol to pure hydrogen through autothermal reforming in a membrane reactor: Experimental demonstration, reactor modelling and design. Energy 2018, 143, 666–681. [Google Scholar] [CrossRef] [Green Version]
- Sanz, R.; Calles, J.A.; Alique, D.; Furones, L. H2 production via water gas shift in a composite Pd membrane reactor prepared by the pore-plating method. Int. J. Hydrogen Energy 2014, 39, 4739–4748. [Google Scholar] [CrossRef]
- Anzelmo, B.; Liguori, S.; Mardilovich, I.; Iulianelli, A.; Ma, Y. ScienceDirect Fabrication & performance study of a palladium on alumina supported membrane reactor: Natural gas steam reforming, a case study. Int. J. Hydrogen Energy 2018, 43, 7713–7721. [Google Scholar] [CrossRef]
- Ruocco, C.; Meloni, E.; Palma, V.; Annaland, M.V.; Spallina, V.; Gallucci, F. Pt–Ni based catalyst for ethanol reforming in a fluidized bed membrane reactor. Int. J. Hydrogen Energy 2016, 41, 20122–20136. [Google Scholar] [CrossRef]
- Arratibel, A.; Medrano, J.A.; Melendez, J.; Tanaka, D.A.P.; van Sint Annaland, M.; Gallucci, F. Attrition-resistant membranes for fluidized-bed membrane reactors: Double-skin membranes. J. Membr. Sci. 2018, 563, 419–426. [Google Scholar] [CrossRef]
- Plazaola, A.A.; Tanaka, D.A.P.; Annaland, M.V.S.; Gallucci, F. Recent advances in Pd-based membranes for membrane reactors. Molecules 2017, 22, 51. [Google Scholar] [CrossRef] [PubMed]
- International Energy Agency. Technology Roadmap, Hydrogen and Fuel Cells; International Energy Agency: Paris, France, 2015. [Google Scholar]
- Rocha, C.; Soria, M.A.; Madeira, L.M. Steam reforming of olive oil mill wastewater with in situ hydrogen and carbon dioxide separation—Thermodynamic analysis. Fuel 2017, 207, 449–460. [Google Scholar] [CrossRef]
- Yonamine, W.; Thangavel, S.; Ohashi, H.; Fushimi, C. Performance analysis of a water–gas shift membrane reactor for integrated coal gasification combined cycle plant. Energy Convers. Manag. 2018, 174, 552–564. [Google Scholar] [CrossRef]
- Mejdell, A.L.; Jøndahl, M.; Peters, T.A.; Bredesen, R.; Venvik, H.J. Effects of CO and CO2 on hydrogen permeation through a ∼3 μm Pd/Ag 23 wt.% membrane employed in a microchannel membrane configuration. Sep. Purif. Technol. 2009, 68, 178–184. [Google Scholar] [CrossRef]
- N.E.T.L. (NETL), Department of Energy (US). Test Protocol, Testing of Hydrogen Separation Membranes; 2008. Available online: https://www.netl.doe.gov/.../Membrane-test-protocol-v10_2008_final10092008.pdf (accessed on 26 December 2017).
- Llera, I.; Mas, V.; Bergamini, M.L.; Laborde, M.; Amadeo, N. Bio-ethanol steam reforming on Ni based catalyst. Kinetic study. Chem. Eng. Sci. 2012, 71, 356–366. [Google Scholar] [CrossRef]
- Hou, K.; Hughes, R. The kinetics of methane steam reforming over a Ni/α-Al2O catalyst. Chem. Eng. J. 2001, 82, 311–328. [Google Scholar] [CrossRef]
- Alique, D.; Imperatore, M.; Sanz, R.; Calles, J.A.; Baschetti, M.G. Hydrogen permeation in composite Pd-membranes prepared by conventional electroless plating and electroless pore-plating alternatives over ceramic and metallic supports. Int. J. Hydrogen Energy. 2016, 41, 19430–19438. [Google Scholar] [CrossRef]
- Alique, D. Processing and Characterization of Coating and Thin Film Materials. In Advanced Ceramic and Metallic Coating and Thin Film Materials for Energy and Environmental Applications; Zhang, J., Jung, Y., Eds.; Springer: Cham, Switzerland, 2018. [Google Scholar] [CrossRef]
- El Hawa, H.W.A.; Paglieri, S.N.; Morris, C.C.; Harale, A.; Way, J.D. Identification of thermally stable Pd-alloy composite membranes for high temperature applications. J. Membr. Sci. 2014, 466, 151–160. [Google Scholar] [CrossRef]
- Hedayati, A.; Le, O.; Lacarri, B. Dynamic simulation of pure hydrogen production via ethanol steam reforming in a catalytic membrane reactor. Energy 2016, 117, 316–324. [Google Scholar] [CrossRef]
- Hedayati, A.; Le, O.; Lacarrière, B.; Llorca, J. Experimental and exergy evaluation of ethanol catalytic steam reforming in a membrane reactor. Catal. Today 2016, 268, 68–78. [Google Scholar] [CrossRef] [Green Version]
- Jia, H.; Wu, P.; Zeng, G.; Salas-Colera, E.; Serrano, A.; Castro, G.R.; Xu, H.; Sun, C.; Goldbach, A. High-temperature stability of Pd alloy membranes containing Cu and Au. J. Membr. Sci. 2017, 544, 151–160. [Google Scholar] [CrossRef]
- Ebshish, A.; Yaakob, Z.; Narayanan, B.; Bshish, A. Steam Reforming of Glycerol over Ni Supported Alumina Xerogel for Hydrogen Production. Energy Procedia 2012, 18, 552–559. [Google Scholar] [CrossRef] [Green Version]
- Barreiro, M.M.; Maroño, M.; Sánchez, J.M. Hydrogen permeation through a Pd-based membrane and RWGS conversion in H2/CO2, H2/N2/CO2 and H2/H2O/CO2 mixtures. Int. J. Hydrogen Energy 2014, 39, 4710–4716. [Google Scholar] [CrossRef]
- Lipman, T.E.; Elke, M.; Lidicker, J. ScienceDirect Hydrogen fuel cell electric vehicle performance and user-response assessment: Results of an extended driver study. Int. J. Hydrogen Energy 2018, 43, 12442–12454. [Google Scholar] [CrossRef]
- Kendall, K.; Kendall, M.; Liang, B.; Liu, Z. ScienceDirect Hydrogen vehicles in China: Replacing the Western. Int. J. Hydrogen Energy 2017, 42, 30179–30185. [Google Scholar] [CrossRef]
- European Commission. Climate Action. Reducing CO2 Emissions from Passenger Cars. 2017. Available online: https://ec.europa.eu/clima/policies/transport/vehicles/cars_en (accessed on 21 April 2017).
Figure 1.
Block diagram for H2-production on-board.

Figure 2.
Membrane reactor simulation by finite elements (micro-reactor + micro-separator).

Figure 3.
Determination of simulation units for the membrane reactor when feeding the process with: (a) ethanol (feed = 10 kmol/h, T = 600 °C, P = 10 bar, H2O/feed = 2) and (b) methane (feed = 10 kmol/h, T = 600 °C, P = 10 bar, H2O/feed = 2). Legend: continuous line = total generated H2 and dashed line = permeated H2.

Figure 4.
Influence of main operating conditions for the membrane reactor when feeding ethanol or methane: (a) temperature, (b) steam to feed hydrocarbon ratio and (c) total retentate pressure. Legend: continuous line = total generated H2 and dashed line = permeated H2.
Figure 4.
Influence of main operating conditions for the membrane reactor when feeding ethanol or methane: (a) temperature, (b) steam to feed hydrocarbon ratio and (c) total retentate pressure. Legend: continuous line = total generated H2 and dashed line = permeated H2.

Figure 5.
Influence of catalyst load when feeding: (a) ethanol and (b) methane. Legend: continuous line = total generated H2 and dashed line = permeated H2.
Figure 5.
Influence of catalyst load when feeding: (a) ethanol and (b) methane. Legend: continuous line = total generated H2 and dashed line = permeated H2.


Table 1.
Optimization results for the membrane reactor design.
| Feed HC | Nin (kmol h−1) | Amembrane (m2) | Catalyst Load (kg) | T (°C) | Pretentate (bar) | H2O/HC | NH2, out (kmol h−1) | XHC (%) | Net Energy Balance (kW) |
|---|---|---|---|---|---|---|---|---|---|
| C2H5OH | 0.37 | 1.87 | 10 | 650 | 10.0 | 3.00 | 1.85 | 100 | −3.13 |
| CH4 | 0.54 | 1.76 | 1 | 650 | 10.0 | 2.25 | 1.82 | 84.9 | −2.99 |
© 2019 by the authors. Licensee MDPI, Basel, Switzerland. This article is an open access article distributed under the terms and conditions of the Creative Commons Attribution (CC BY) license (http://creativecommons.org/licenses/by/4.0/).
Share and Cite
MDPI and ACS Style
Holgado, M.; Alique, D. Preliminary Equipment Design for On-Board Hydrogen Production by Steam Reforming in Palladium Membrane Reactors. ChemEngineering 2019, 3, 6. https://doi.org/10.3390/chemengineering3010006
AMA Style
Holgado M, Alique D. Preliminary Equipment Design for On-Board Hydrogen Production by Steam Reforming in Palladium Membrane Reactors. ChemEngineering. 2019; 3(1):6. https://doi.org/10.3390/chemengineering3010006
Chicago/Turabian StyleHolgado, Marina, and David Alique. 2019. "Preliminary Equipment Design for On-Board Hydrogen Production by Steam Reforming in Palladium Membrane Reactors" ChemEngineering 3, no. 1: 6. https://doi.org/10.3390/chemengineering3010006