Article

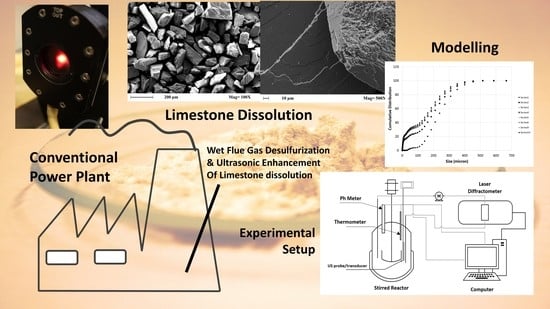
Ultrasonic Power to Enhance Limestone Dissolution in the Wet Flue Gas Desulfurization Process. Modeling and Results from Stepwise Titration Experiments

by
Cataldo De Blasio
1,*,
Claudio Carletti
1,
Jarno Salonen
2 and
Margareta Björklund-Sänkiaho
1
1
Department of Chemical Engineering, Faculty of Science and Engineering, Åbo Akademi University, Biskopsgatan 8, 20500 Turku, Finland
2
Laboratory of Industrial Physics, Department of Physics and Astronomy, University of Turku, FI-20014 Turku, Finland
*
Author to whom correspondence should be addressed.
ChemEngineering 2018, 2(4), 53; https://doi.org/10.3390/chemengineering2040053
Submission received: 26 September 2018 / Revised: 24 October 2018 / Accepted: 29 October 2018 / Published: 6 November 2018

Abstract

:
The goal of this work is to assess the application of ultrasonic power to the reactive dissolution of limestone particles in an acidic environment; this would represent a novel method for improving wet Flue Gas Desulfurization industrial systems. In this study a stepwise titration method is utilized; experiments were done by using different particle size distributions with and without the application of ultrasound. The use of ultrasonic power sensibly affected the reaction rate of limestone and its dissolution; a major difference could be observed when samples from the Wolica region in Poland were studied. In this case, the overall dissolution rate was found to increase by more than 70%. The reactive dissolution of limestone does not follow the same mathematical model when sonication is in effect; in this case, an extra Ultrasonic Enhancement Constant was introduced. It was demonstrated that the dissolution is proportional to an Effective Reaction Surface and, therefore, surface interactions should also be taken into consideration. For this purpose, a study is presented here on the Z-potential and electrophoretic mobility of limestone samples measured in aqueous dispersions by means of Laser Doppler Micro-Electrophoresis.

Graphical Abstract

1. Introduction

There is an increasing concern about pollution and emissions in the world. The evidence highlights the detrimental effects of air pollution on the environment and the health of living organisms. Sulfur dioxide represents one of the most dangerous compounds released from the combustion of sulfur-containing fuels like coal. As it is well known, sulfur reacts with oxygen during combustion and SO2 is then released into the atmosphere causing serious problems to the environment and to living organisms [1]. Coal can contain significant amounts of sulfur. For instance, in some regions of China, there are types of coal which could contain over 10 wt% of the mentioned compound. This kind of coal is considered to have a Superhigh-Organic Sulfur content [2].
Coal is still largely utilized for power production and its consumption is destined to increase within the next years [3]. Despite the decrease in coal consumption, the coal resources in the world are still considerably large and it is a common opinion that coal could inevitably be used and consumed if no sustainable solutions are found for the increasing energy consumption. It has been estimated that the worldwide coal consumption as an energy source is expected to have a growth of 0.3% per year in the next 25 years [4].
Currently, coal is mainly utilized in the large scale for power generation and the most utilized method for Flue Gas Desulfurization, FGD, is the wet scrubbing process [5]. For this reason, Flue Gas Desulfurization, FGD, plays a key role when coal-fired power plants are utilized. In fact, almost 90% of the FGD units is constituted by wet FGD, WFGD, scrubbers [6]. Therefore, improvements proposed to this technology, like in the case of this article, would represent an advance of primary importance to reduce pollution and energy consumption.
A WFGD unit of a 500 MWe power plant can consume between two to three percent of its produced power [7,8]. This means that an estimation of the total power consumed by wet FGD in OECD countries can be up to 64.4 TWh in one year [9] and this could be comparable with the entire energy consumption of a nation. Therefore, it is evident that an improvement in the WFGD process technology will have an enormous impact in terms of the economy and environment. The WFGD process consists of several physical-chemical steps. In the WFGD scrubber, SO2 is firstly absorbed by means of reactive absorption and successive reactions take place in the so-called dissolution/reaction tank of the system. Descriptions of the chemistry and physical-chemical steps can be found in the literature [10].
In this process, the dissolution of limestone particles is the main determining step for the release of calcium ions, Ca2+. Furthermore, in the literature, it has been reported as one of the main determining steps in the overall abatement of SO2 [11]. In the overall process, there are two steps in which there is a mass transfer among different phases: the SO2 absorption in the liquid slurry and the dissolution of the solid limestone. Because of this, it is of utmost importance to study and to evaluate accurately the kinetics related to the limestone dissolution in the formed acidic environment. Several studies have been conducted in order to model the reactivity of limestone in these conditions. Often, the acidic conditions have been simulated by using HCl solutions [12,13,14,15,16,17]. Additionally, a common method is to carry out the experiments at conditions that simulate the steady state industrial process and, therefore, the pH is maintained approximately constant [9,18,19].
The mathematical modeling of limestone dissolution has been performed for diverse systems and diverse configurations. For instance, models were provided for limestone dissolution from a plane surface [16] or from rotating cylinders [20]. Considering that, instead, particles suspended under mechanical agitation can dissolve in acidic slurries at constant or varying pH values [2,21]. In each of these systems, approximations are necessary in order to obtain analytical or numerical solutions to the problem at hand. A common approximation is made regarding the mass transfer rate of hydronium ions to the surface of the reaction: when the stirring is sufficient, the mass transfer rate terms are neglected from the balance equations since it is assumed that the convective mass transfer is not the limiting step in this process. On the other hand, mass transfer limited limestone dissolution studies have been reported where the kinetics is assessed and the evidence indicates the dissolution rate dependence on the degree of agitation [11,22]. The purity and composition of the limestone samples should also be considered; limestone particles are not the same in all cases, there are differences in their structure, crystal shape, composition, amount of impurities. An approximation in this sense is to consider a particle as “pure” or “not pure”, and this will allow for considering the particle as a Bernoulli random variable. In case the amount of impurities is known, then the number of particles required to obtain the wanted confidence interval on that proportion of impure sample can be calculated by an approximated statistical method [2].
Because it would be beneficial to improve the technology in terms of design, operating parameters, or physical conditions, some process parameters need to be optimized. One problem is the estimation of the minimum stirring velocity at which the complete suspension of all the particles occurs; therefore, studies have been conducted by using diverse methods and technologies [23]. In addition, CFD modeling is also applied for this purpose [24]. Another problem is the degree of grinding for the limestone in order to achieve a reasonable dissolution rate. The grinding should be minimized in order to consume less power; on the other hand, the solid-liquid mass transfer rate should be maximized by having a sufficient surface of reaction. Because of this reason, optimization studies have been performed on the WFGD process [9].
When studying the reactive dissolution of solid particles, mass transfer phenomena and the intrinsic reactivity of the samples play key roles. This is naturally valid during limestone dissolution. A general description of the mass transfer rate for the diffusing element is given by Equation (1) [25]:
d C a d t = r + k c · S V · ( C a i C a )
where r stands for the reaction rate, <kc> is the average mass transfer coefficient, S is the surface of the reaction, V is the volume of the reactor and Ca, Cai are the concentrations of the diffusing element (on which the mass balance is done) in the bulk solution and at the solid-liquid interface respectively. The reaction can be of different orders, for instance, for limestone dissolution in an acidic environment is reported to be of the first order [26], the second order [27], and also estimated to be of an order between 0.9 and 1 [22].
Analytical solutions for first, second and also for the third order of reaction are reported in the literature [10]. The mass transfer rate for multiphase systems is commonly modeled considering that the dissolution (mass transfer) rate is directly proportional to the contact surface, to a difference in concentration considered for the diffusing element, to a diffusivity term, and to a mass transfer constant (also known as the mass transfer coefficient) which is related to the estimation of a Sherwood number. An accurate mass transfer coefficient estimation is an important step in several problems of diffusion in multiphase systems and computational fluid dynamics. This parameter is related to the geometry, configuration, and the degree of mixing for the system at hand [28]. The mass transfer coefficient can be affected by the type of configuration itself and the flow conditions. It is well known that turbulent conditions enhance the mass transfer rate and this can be affected also by other parameters, depending on the technology used to enhance the dissolution.
Limestone dissolution rate is affected by pH and it increases at low pH values. The addition of acids to the reaction tank of the WFGD system has been proposed in this regards; one example is the use of waste acids from organic compounds, for instance, acetic acid. This is the case of Shengyu and collaborators [29] where authors have used acetic acid additives as absorbent, the claim, in this case, is that the utilization of organic acids would reduce the power required for the pulverization of limestone. New technologies among wet FGD systems include, for instance, the FGDplus technology from Andritz. This technology is based on an optimized “tracked mass transfer” within the scrubber [30]. Another innovation introduced to general FGD systems was presented by the Babcock & Wilcox Power Generation Group, Inc. (B&W PGG) as the Inhibited Oxidation Wet Flue Gas Desulfurization system [31]. This technology utilizes emulsified sulfur, or as alternative sodium thiosulfate to a reagent feed tank. The claim, in this case, is that the oxidation rate will be below 15% and in this way, scale deposits will be controlled. Furthermore, as a result, it is claimed that with this system no wastewater treatment is required.
Ultrasonic power can be used to enhance dissolution of solid particles [32] and it has been shown that ultrasound can also enhance the selectivity and the product yield for some solid-liquid reaction systems [33] and even the rate of reaction [34]. Detailed treatments of the science and engineering of sonochemistry can be found in the literature [35]; one of the effects attributed to ultrasound upon chemical reactions is, for instance, the formation of free radicals which could accelerate the reactions involved. Sonication can enhance mass transfer by enlarging the reaction surface, provoke grinding phenomena, surface renewal and therefore enhance the product yield and rate of dissolution. However, some of these effects might not precisely act on the reaction mechanisms but give a secondary enhancing effect.
Ultrasonic power is produced by transducers that yield acoustic waves with a high frequency of approximately 15 kHz to 10 MHz [36]. They are longitudinal waves and because of them, the dissolving particles undergo a series of oscillations. Because of these oscillations, the fluid is subject to phases of compressions and decompressions (also called rarefactions). Ultrasound waves are currently used in medicine to image and scan organs and tissues [37], to give one example, they are used during pregnancy imaging.
Ultrasound is not applied in wet FGD commercial applications, therefore this study gives valuable and necessary information to assess further the feasibility of this novel technology. The results of this study will be utilized for evaluating process design options, reactor design, and related optimization. It has been stated that a scale-up of ultrasound enhancement is one of the main challenges for this process; therefore, understanding the underlying mechanisms can help in the scaling up the enhancement effect of sonication.
Limestone dissolution has been widely studied under conditions relevant for WFGD technology. However, information is lacking on how sonication could be successfully used to improve the energy efficiency of these systems, especially in the case of transient conditions. Furthermore, limestone particles are not spherical and they present uneven surfaces and cavities as it appears clearly from the SEM figures presented in this manuscript. On the other hand, it is also a fact that between water (a highly polar compound) and limestone, there are also surface tension and electrochemical forces which should be taken into consideration. To the knowledge of the authors, a study of the Z-potential of limestone samples used in WFGD has not been done previously in the literature. Therefore, an investigation of the Z-potential for the samples presented was performed in this work. In this study, an investigation of the dissolution of diverse kinds of limestone samples is carried out by a stepwise titration method under acidic conditions. One of the most common methods used to study limestone dissolution is the pH-stat method, however, the stepwise titration method was chosen in this study mainly because it gives the opportunity of studying transient conditions. The experiments were done with and without the usage of ultrasound and in both cases, the mathematical models proposed were suitable to describe the dissolution behavior. The modeling and understanding of the intrinsic physical-chemical phenomena involved in the transient reactive dissolution of limestone under ultrasonic treatment can aid in the development of novel enhancement methods for WFGD.

2. Materials and Methods

2.1. Materials

The limestone samples utilized in this study originate from Parainen (Finland) and Wolica (Poland); both samples are provided by the Nordkalk Corporation. The Wolica sample is from the Jurassic age (150 Ma) and it is classified as a sedimentary limestone presenting very few fossils [38]. On the other hand, the Parainen sample is from the Proterozoic age (1900 Ma), and it is classified as a metamorphic limestone. The sample from Parainen presents a high degree of crystallization while the sample from Wolica presents a more uneven surface with respect to the Parainen sample, and therefore higher specific surface area (SSA). The Scanning Electron Microscopy (SEM) images of the samples are presented below and show the difference in the surface, shape, and morphology between sample types. Both samples are considered to be non-porous since the pore volume values measured by means of nitrogen adsorption were equal or less than 0.002 m3/g for both samples [9]. The mineral phases of the samples were assessed by X-ray diffraction (XRD) in previous works [39,40]. The samples were crushed using a jaw crusher; after this, the obtained powder was ground by means of a vibratory disc mill and sieved diverse times to the wanted size range. The larger particle size range was denominated as “Large” and the sieve size was 212–250 μ m while the smaller size range was denominated as “Small” and the sieve size was 74–125 μ m . The amount of sample utilized in all cases is given in Table 1.
The amount of sample has been evaluated by considering the obscuration of the laser diffractometer; this is because, especially in the case when ultrasound is used with the sample from Wolica, one of the effects is the breakage of the particles with related augmentation of the machine obscuration over the limits.

2.2. Experimental Setup

The limestone samples were weighted on a Precisa Gravimetrics 410 AM-FR scale, and the sample was inserted in a stirred beaker with 0.5 L of distilled water. The stirring was conducted with three blade propeller (3.3 cm of overall diameter) with downward pumping and the stirring speed was maintained at 2300 rpm for all the experiments. The stirring speed has been calculated to be sufficient for the complete suspension of all the particles utilized. This is in accordance with a method proposed in the literature [41] and it has also been investigated by experiments done on the acid consumption rate at different stirring velocities by maintaining the pH of the solution at a constant value. Besides assuring complete particle suspension, the selected stirring speed was sufficient to avoid mass transfer limitations that could occur in the case of not sufficient vigorous agitation [42]. The Particle Size Distribution, PSD, for all the cases presented was measured by a Laser Diffractometer, Malvern Mastersizer 3000 from Malvern Instruments. The probe and transducer are provided within the Hydro EV external unit of the laser diffractometer. The ultrasonic power settings were maintained at a constant at 50% of the range provided, the power delivered was 20 W at a nominal frequency of 40 kHz. The ultrasonic power and the stirring speed was regulated by a computer device. The experimental setup is shown in Figure 1.
For each titration step, the pH was recorded by using a pH electrode (double junction with a built-in reference and epoxy body VWR electrode). The Z-potential and electrophoretic mobility of the limestone samples was measured in aqueous dispersions by means of laser Doppler micro-electrophoresis (Malvern Zetasizer Nano Series Nano-ZS). Scanning Electron Microscopy, SEM, was used to analyze the surface morphology of the limestone samples. The equipment in use is a LEO Gemini 1530 with a Thermo Scientific UltraDry Silicon Drift Detector (SDD). The samples were coated with carbon to increase their conductivity.

2.3. Procedure

2.3.1. PSD and pH Measurements

After the initial insertion of the sample into the reactor (the pH was usually of 5–5.5) and after taking measures of the sample’s Particle Size Distribution, PSD; one milliliter of HCl-water solution was used for each titration step. The HCl solution had a concentration of one mole per liter. The PSD was measured online by the laser diffractometer. When no ultrasound was used, five titration steps were performed and the PSD measurements were taken 15 times; instead, when the ultrasound was used, seven titration steps were performed and for each titration step the PSD was taken seven times. This is because when ultrasonic power is used, the time to reach a threshold value of the pH will be less and, therefore, a lower number of measurements could be taken before the sample is consumed completely. The step-wise titration method offers the possibility to verify the method several times in the course of the experiments.

2.3.2. Z-Potential Measurements Sample Preparation

Concerning the Z-potential and electrophoretic mobility of the limestone samples, Wolica and Parainen samples were sieved with a sieve size <74 µm, the particle size distribution of these samples was measured and it is shown below in Figure 2.
The samples having the above PSD were mixed (300 mg in 725 mL of distilled H2O) and let to decant for 15 min, the top 20 mL were taken, and the PSD was measured.
As shown in Figure 3, the particles suspended in the liquid that did not decant had a size well below 100 µm.

2.3.3. Z-potential Measurements

A quantity of 303 mg and 300.05 mg of the Wolica and Parainen samples (<74 µm) were mixed with 25 mL of de-ionized water (18.2 M Ω · m ), respectively. Afterward, the solutions were left to decant for 15 min. Finally, 20 mL of the dispersed solution was taken from the top dispersion. Citric acid-Na2HPO4 Mc Ilvaine buffers (diluted 10 times) were prepared, having the following pH values: 2.6, 3.0, 4.0, 5.0, 6.0, and 7.0. The buffer solutions were mixed with 1600 μL of the dispersed solution before measuring the Z-potential. The value of f(Ka) required for estimating the Z-potential was taken as 1.5 (Smoluchowski approximation) [43].

2.4. Theory/Calculation

The concentration of calcium ions as a function of time was fitted to the model by using Equation (2) [10,25] for the case of experiments conducted without sonication.
d y d t = k r · y α + k c · S V ( 1 y )
In Equation (2), k c is the mean mass transfer coefficient, k r is the reaction rate constant, S is the Effective Surface of the Reaction, ESR, V is the volume of the slurry in the reactor. The term y represents the ratio between the calcium ions concentration and the concentration at the solid-liquid interface assumed as the saturation concentration:
y = C a C a i
In the same Equation (2), α is the reaction order. The parameters related to the limestone dissolution, such as the diffusivity of Ca2+ ions and the solubility of CaCO3 were taken from the literature [44,45]. The Specific Surface Area, SSA, when assuming spherical particles is given at each PSD measurement and it is estimated from
S S A = 6 i V i d i ρ i V i
where V i is the relative volume belonging to the class i with a mean diameter d i and ρ represents the particles’ density. The SSA is given for each measurement directly by the laser diffactometer. The analytical solution for the second order and the third order kinetics of Equation (2) were derived in the literature [10] and here the solution for the second order is reported as follows:
y = τ ( τ 4 ( k r ) T a n h [ τ ( τ 4 ( k r ) 2 · t ] τ 2 k r
where τ = k c S / V . The parameters k r and τ are obtained by implementing the iterative Levenberg-Marquardt method defined as a damped least-squares curve fitting.
On the other hand, for the case of limestone dissolution with ultrasound, the expression is given by Equation (6), accurately describes the experimental data. The method used to find the constant k r and τ , in this case, was necessarily numerical.
d y d t = k r ( y ) 2 + k c · S V · ( 1 y ) k u ( y )
The additional term on the right of Equation (6), k u , is denominated here as the Ultrasound Enhancement Constant. This term represents the proportionality constant which is related to the use of ultrasound.
Ultrasonic power has a reasonable impact on the dissolution of samples, especially the ones from the Wolica region. The mass transfer rate, in this case, is affected by the reactivity of the material, the mass transfer rate at which the reactant moves through the medium, and by the action of the ultrasonic waves.

3. Results

3.1. Limestone Characterization

It was confirmed by XRD analysis that both samples were mainly composed of the trigonal rhombohedral calcite mineral; this study also confirmed that the Parainen sample contains reduced amounts of quartz mineral [39]. In the diagenesis of carbonate rocks, it is possible to distinguish six major processes: microbial micritization, cementation, dissolution, neomorphism, compaction, and dolomitization [38]. All these phenomena affect the degree of crystallinity and friability; additionally, the age of the samples is also one of the causes for the increased compaction of the samples. These factors have an influence on the dissolution rate observed with different kinds of samples. It can be clearly observed from the SEM images, Figure 4, that the samples from Parainen have a much higher degree of compaction presenting also more euhedral shapes, while the samples from Wolica tend to present more irregular surfaces and as well as anhedral shapes.

3.2. Dissolution Rate

In this study, a considerable difference concerning limestone dissolution has been observed between the case of sonication and when experiments were carried out in silent conditions. From the online measurements of PSD and pH, it is possible to make some observations on the effects taking place during the limestone dissolution; there are diverse phenomena that might be enhanced by the usage of ultrasonic power. Considering the acid consumption, ultrasound (especially in the case of samples from Wolica) determines a rapid settling of the pH at higher values. As a matter of fact, for the case of Wolica Large sample presented in Figure 5, the overall acid consumption rate was increased by 72.33% when ultrasound was used.
Figure 5 shows the acid consumption against time for the case of Parainen and Wolica samples with and without ultrasound. In the plots presented, the minimum value of pH for each titration step was taken at time zero. At the top of the figure, the case when no ultrasound is used is shown and only the first and second titration steps are given for clarity. As a matter of fact, the acid consumption rate curves for the remaining steps were overlying on top of the presented curves. Additionally, for the case when ultrasound is used, some curves are not reported to improve the clarity of the drawing.

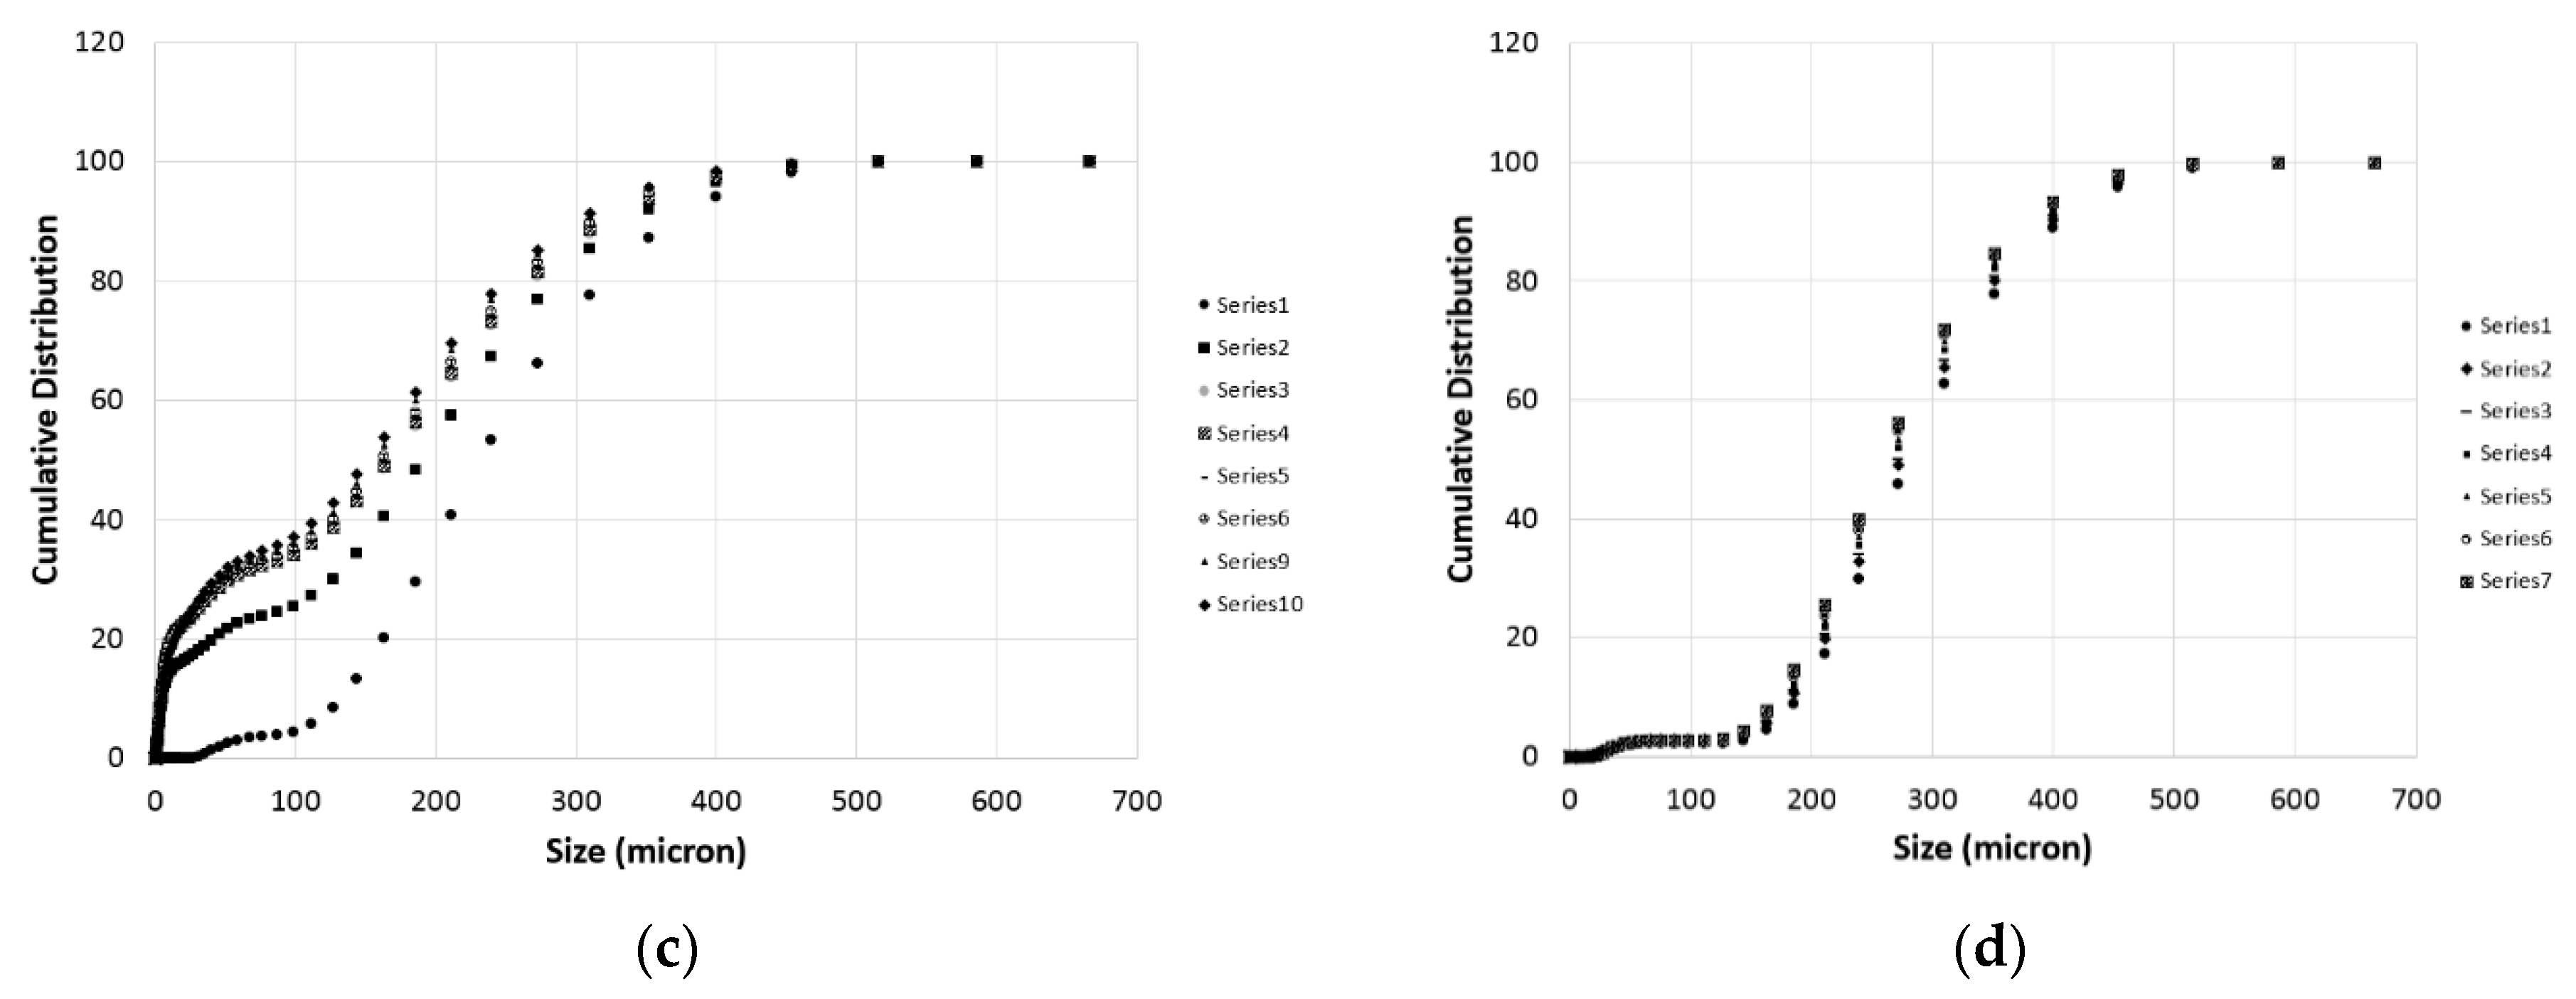
3.3. Particle Size Distributions

During each titration step, a number of PSD measurements were taken as described in the previous section. These measurements are particularly important to get information on the particles population and to have a preliminary estimation of the effective surface of reaction for the samples. Some of the measures are demonstrated in Figure 6 for the case of Wolica Large and Parainen Large samples while Figure 7 demonstrates the PSD for the Wolica Small sample for one titration step and all PSD measurements (left), while on the right the PSD is shown for all the titration steps and the first PSD measure is taken for each of them.

4. Discussion

4.1. Effects of Ultrasound on Specific Surface Area determination

Ultrasound has an effect on limestone dissolution, it influences the reactivity of the system and the transport phenomena involved. In the case of limestone dissolution, the ultrasonic power has an impact on the transport phenomena, the reactivity of the samples and their breakage. Phenomena like the microjet impact (velocities higher than 100 m/s) [46,47] could not be the only mechanism causing the breaking of solid particles, shockwave damage is another mechanism widely accepted [36]. Figure 8 gives a simplified description of the cavitation of micro-bubbles and the formation of micro-jets acting on the solid surface.
It is expected that ultrasound has a more profound effect in enhancing limestone dissolution in the case of fragile samples, for example, the Wolica sample in this study. It can be also observed that sonication greatly enhances the dissolution of smaller particles. This can be seen by the evolution in time of the PSD in Figure 6 for the Wolica sample. This could imply that the limestone could be ground to a larger size fraction than usual and exploit the ultrasound enhancement to reduce the energy consumption of the griding process. The two samples investigated in this study have very large differences in terms of structure, age, and composition [9,40]. This reflects on the degree of crystallinity of the samples and in terms of the solid surface. It can be observed that the effect of ultrasound is very small for the experiments conducted on the Parainen sample, compared with the case of experiments done with the Wolica sample. This can be seen from the estimation of the surfaces done from the particle size distribution measurements. An example of SSA values obtained in the case when ultrasound is used for all titration steps and between the samples Parainen Large and Wolica Large, is given in Figure 9.
When the sample does not present cavities and the degree of crystallization is quite high, the amount of micro-bubbles trapped within the solid surface is quite small and, therefore, the effects of nucleation and cavitation are not as important as in the case of large amounts of bubbles. As a matter of fact, for the case of Parainen Large, samples are determined to be not porous according to BET measurements. From the experiments, it appears evident that the effect of ultrasound is more important during the initial phase of the experiment. However, the effect of ultrasound is still quantifiable for the remaining titration steps; this also suggests that the second mechanism proposed (shock wave propagation) [48] has an effect on the particles’ breakage.

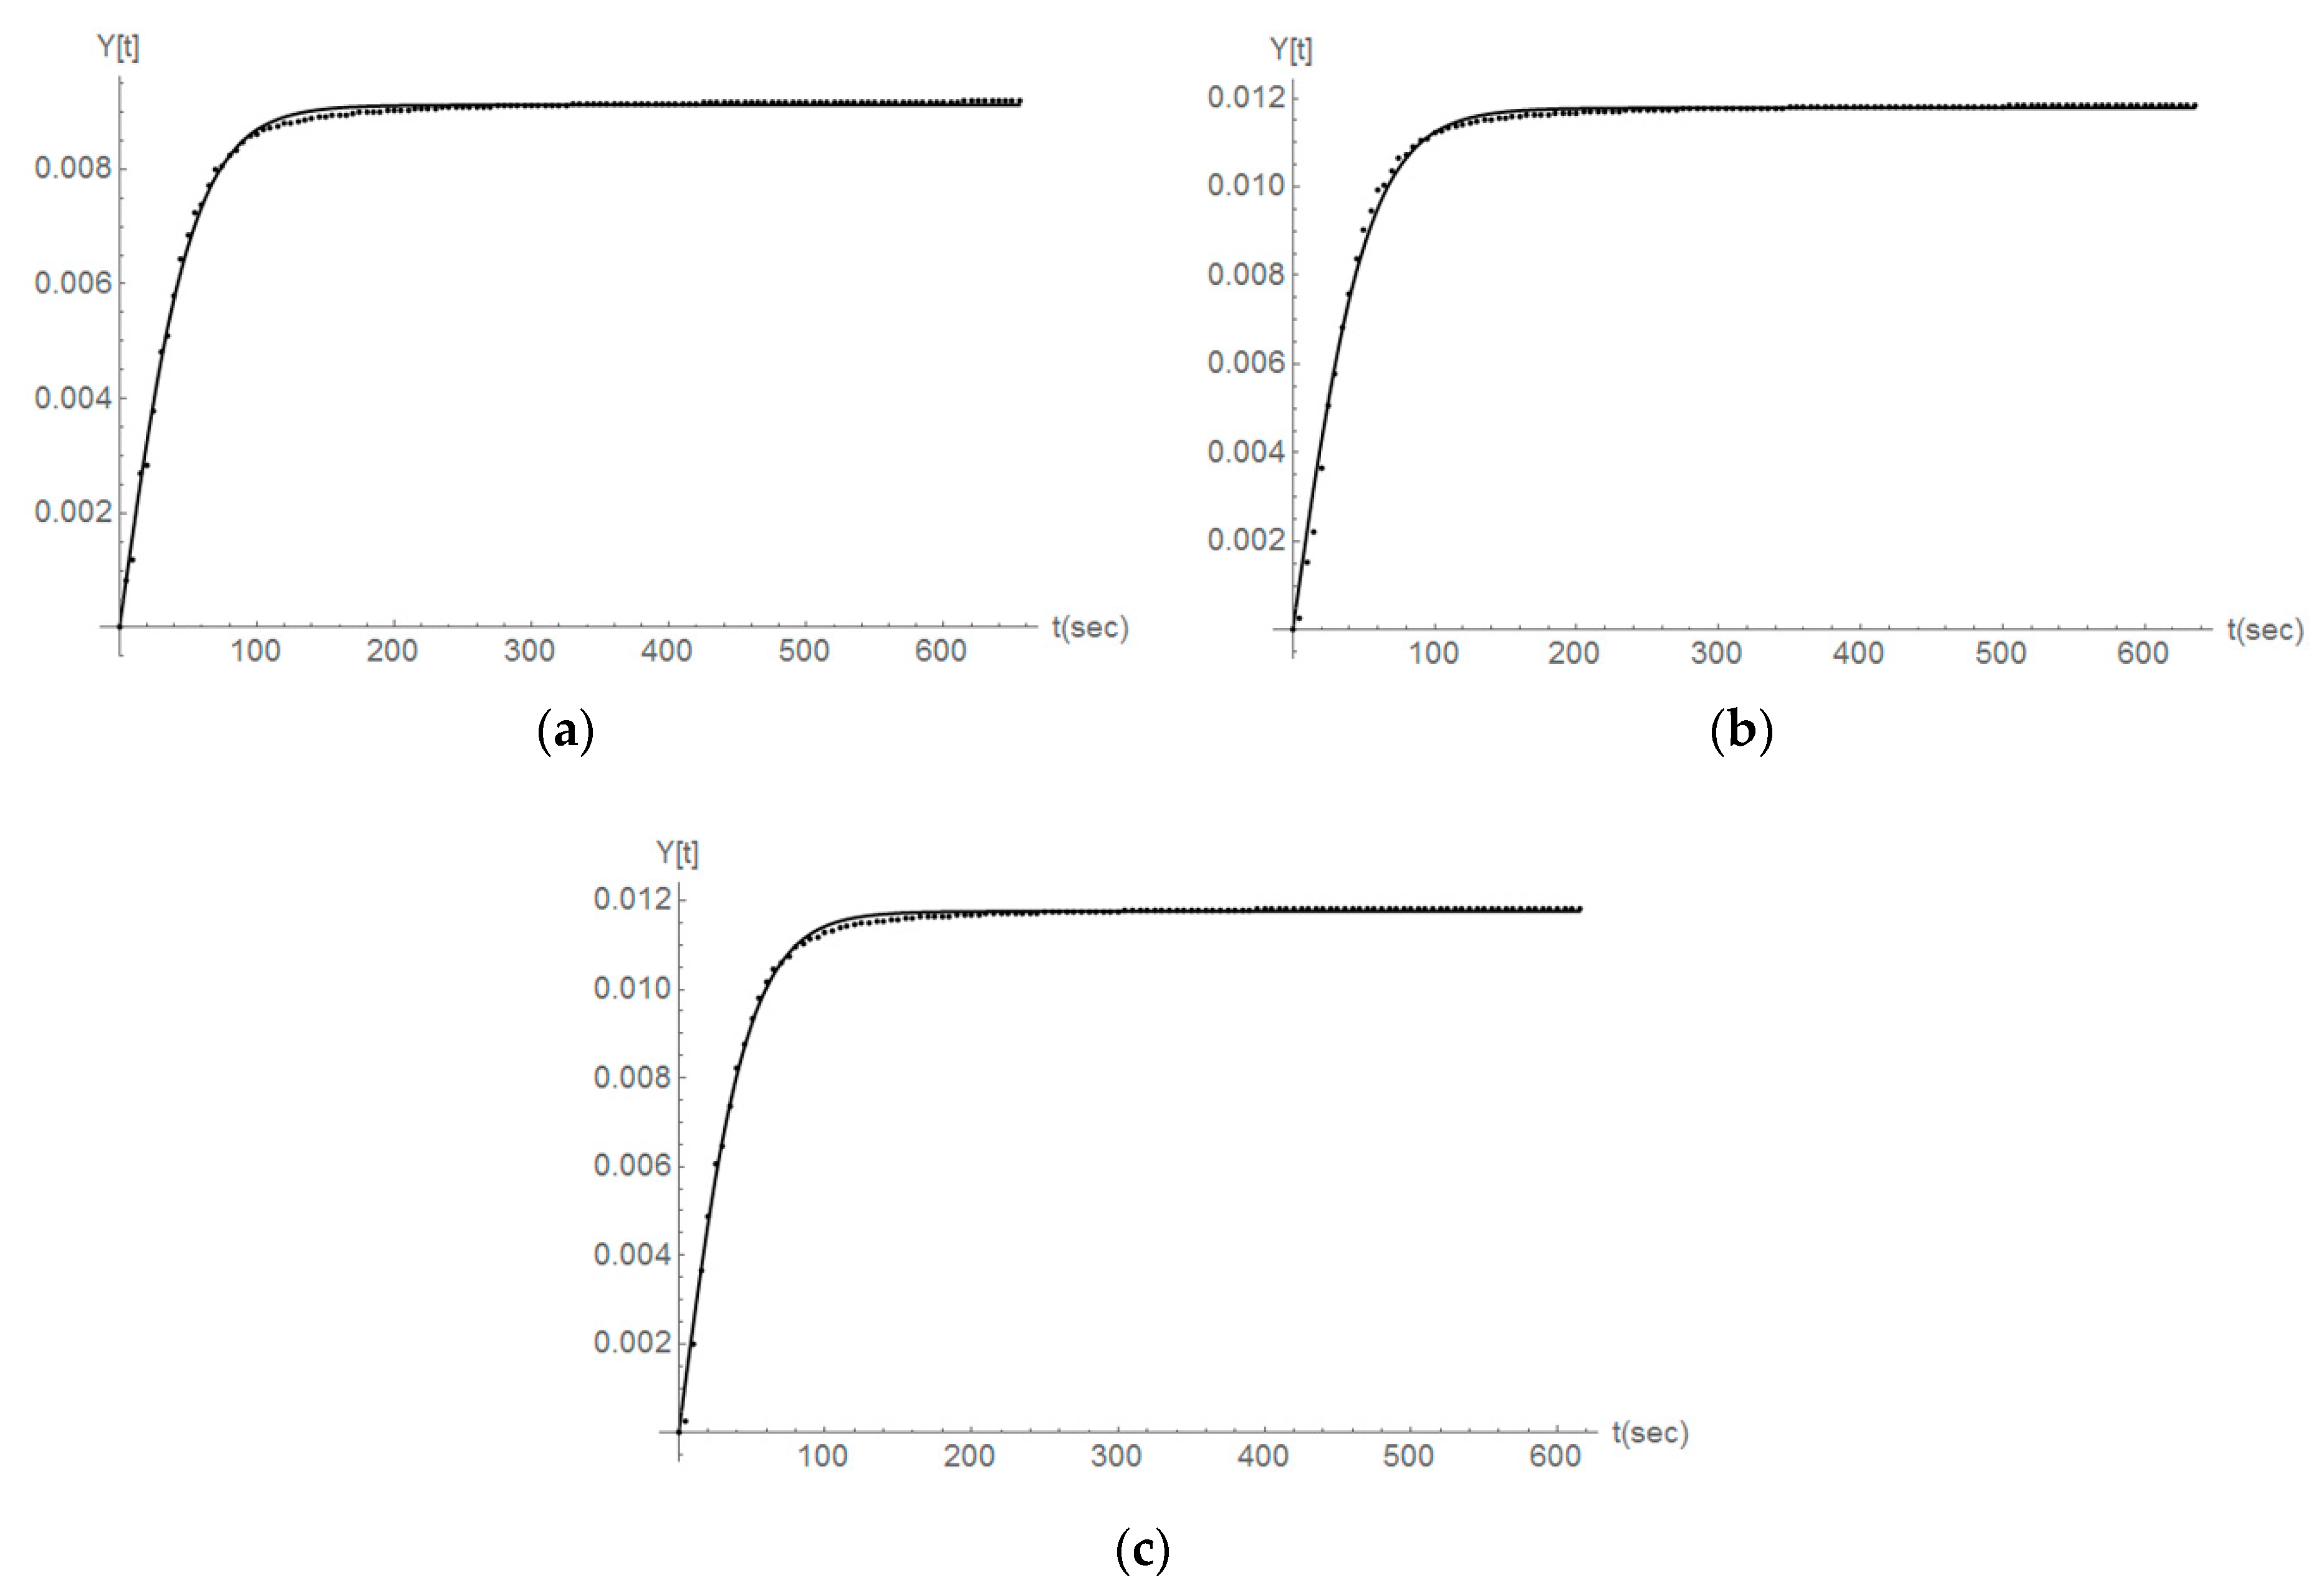
4.2. Mathematical Modelling

The modeling presented by Equation (2) for the case of second-order reaction kinetics represents in a clear way the experimental data derived for the variable y (Y(t) in Figure 10, Figure 11 and Figure 12) and in the case when no ultrasound is used. As an example here the y values for the first three titration steps and the case of Parainen Large samples are reported with the proposed mathematical model.
For the case of experiments done with the sample from Parainen, it is possible to denote that Equation (2) still represents the data in a good manner. Figure 11 gives the cases of experiments done on Parainen Large.
From our experiments it can be suggested that indeed the ultrasonic treatment of the samples resulted in more breakage, however, as suggested in the literature [33,34], it can be observed that the breakage could be not the only effect to be taken into account when ultrasound was used and this needs to be further investigated. Figure 12 demonstrates a comparison between the fitting of experimental data provided by Equation (6) (Figure Top) and how the model proposed by Equation (2) (Figure Down) performs for the case when ultrasonic power was delivered to the slurry solution.
It can be noticed that Equation (2) is not suitable to describe the limestone dissolution in the presence of ultrasound and this is not exclusively valid for second order reaction, but also for other diverse orders. Equation (6) would suggest that ultrasonic power contributes to diverse phenomena involved in the dissolution of the solid particles. These phenomena are not only related to the breakage of the particles but they could also influence their reactivity.

4.3. Effect of Surface Interactions on Limestone Dissolution

The Z-potential of carbonates and its change as a function of pH has been presented previously in the literature. The Z-potential dependence on pH has been reported for the dolomite and magnesite samples [49]. Furthermore, it was also found that the Z-potential is a function of pH in the case of calcium carbonate [50]. The Z-potential obtained in the literature [50] varied from −40 mV to 0 mV between pH 6 to pH 7.5. Thus, an electrical double layer may be formed around the particles, and its effect on limestone dissolution may be dependent on pH. Such a double layer may hinder the hydronium ions approaching the limestone surface which could be the cause for the relatively low activation energies found in the literature [40,51]. It has been reported that the double layer formed around the particles has a direct effect on mass transfer [52]. Additionally, it was written that for divalent metal carbonates the surface charge is positive or negative depending on solution pH [53]. It is important to mention that the effect of the solvent used for the measurements may have a relevant effect on the Z-potential results [54]. Therefore, the Z-potential dependency on pH may be subject to the background electrolyte used. The results presented in Figure 13 clearly indicate that Z-potential shifts as a function of pH. Furthermore, these results suggest the formation of an electrical double layer. Therefore, this confirms the literature findings for calcium carbonate on the Z-potential dependence on pH but for a broad pH range: from pH < 3 to pH > 7.
The results in Figure 13 are relevant to WFGD since in the studied range of pH it has been claimed that the rate determining steps of limestone dissolution changes from being a mass transfer to a chemical reaction. The dependence of Z-potential on pH presented in Figure 13 may shed some light in explaining the apparent change between mass transfer versus the chemical reaction control of the dissolution mechanism. The enhancement mechanism of sonication could be related to the change in the Z-potential as a function of pH if the apparent mass transfer limitations at a lower pH are overcome by altering the electrical double layer. Furthermore, it should be pointed out that the position at which the curve crosses the isoelectric point could be a function of the background electrolyte or the sample concentration.

5. Conclusions

The present study shows that ultrasonic power is consistently affecting the dissolution of limestone and its online particle size distribution. This was more evident in the case of the porous samples, younger in age, from the Wolica region in Poland. In this case, the overall dissolution rate was found to be increased by more than 70%. The mathematical models proposed in this study were valid for transient conditions of pH and they were describing the solid dissolution rate in a satisfactory manner for both the ultrasonic and silent conditions. When ultrasound was utilized, it was necessary to introduce an additional term denominated the Ultrasound Enhancement Constant. Ultrasound not only induces particles’ breaking but also could enhance the reactivity of the particles by means of direct or indirect effects. The mathematical models proposed suggested that an effective surface of reaction should be taken into account for the solid-liquid reactions and therefore additional studies have been performed and presented here on the existence of diverse solid-liquid layers.
The Z-potential measurements propose the existence of an electrical double layer which is also a function of the solution pH. The presence of the above-mentioned electrical double layer may hamper the approach of the hydronium ions to the limestone surface; this hindering effect varies during the reaction. The enhancement mechanism of sonication may lie on the fact of overcoming or altering the electrical double layer due to the ultrasound effects. The results from this research provide valuable information necessary to carry on a more accurate feasibility analysis of the ultrasound technology applied to the WFGD process.

Author Contributions

C.D.B. contributed to this research article in terms of writing the original draft preparation; C.D.B. has been the main contributor for the conceptualization, the methodology and validation of the proposed models. C.C. and. J.S. have been contributing to the writing of the sections where the effect of surface interactions on limestone dissolution are given. This includes also the experimental part related to this study. M.B.-S. has contributed to the production and writing of this manuscript in terms of reviewing and editing, providing necessary resources, suggestions and expertise for this investigation.

Funding

This research received no external funding.

Acknowledgments

The authors wish to express their gratitude to the Åbo Akademi Foundation. Linus Silvander at Åbo Akademi University and Martti Kaasalainen at University of Turku are gratefully acknowledged for experimental help. Nordkalk Corporation is also thanked for providing the limestone samples.

Conflicts of Interest

The authors declare no conflict of interest.

References

  1. McGranahan, G.; Murray, F. Air Pollution and Health in Rapidly Developing Countries; Routledge: Abingdon, UK, 2003; ISBN 1-85383-966-3. [Google Scholar]
  2. De Blasio, C.; Carletti, C.; Lundell, A.; Visuri, V.-V.; Kokkonen, T.; Westerlund, T.; Fabritius, T.; Järvinen, M. Employing a step-wise titration method under semi-slow reaction regime for evaluating the reactivity of limestone and dolomite in acidic environment. Miner. Eng. 2016, 86, 43–58. [Google Scholar] [CrossRef]
  3. U.S. Energy Information Administration. US EIA November 2017 Monthly Energy Review; EIA: Washington, DC, USA, 2017.
  4. Del Valle-Zermeño, R.; Formosa, J.; Chimenos, J.M. Wet flue gas desulfurization using alkaline agents. Rev. Chem. Eng. 2015, 31. [Google Scholar] [CrossRef]
  5. De Gisi, S.; Molino, A.; Notarnicola, M. Enhancing the recovery of gypsum in limestone-based wet flue gas desulfurization with high energy ball milling process: A feasibility study. Process Saf. Environ. Prot. 2017, 109, 117–129. [Google Scholar] [CrossRef]
  6. Guelli, U.; Souza, S.M.A.; Santos, F.B.F.; Ulson de Souza, A.A.; Vidal Barrero, F. Limestone dissolution in flue gas desulfurization—experimental and numerical study. J. Chem. Technol. Biotechnol. 2010, 85, 1208–1214. [Google Scholar] [CrossRef]
  7. Stultz, S.C.; Kitto, J.B. Steam: It’s Generation and Use, 40th ed.; Babcock & Wilcox: Barberton, OH, USA, 1992. [Google Scholar]
  8. Hrastel, I.; Gerbec, M.; Stergaršek, A. Technology optimization of wet flue gas desulfurization process. Chem. Eng. Technol. 2007, 30, 220–233. [Google Scholar] [CrossRef]
  9. Carletti, C.; De Blasio, C.; Mäkilä, E.; Salonen, J.; Westerlund, T. Optimization of a Wet Flue Gas Desulfurization Scrubber through Mathematical Modeling of Limestone Dissolution Experiments. Ind. Eng. Chem. Res. 2015, 54, 9783–9797. [Google Scholar] [CrossRef]
  10. De Blasio, C.; Carletti, C.; Westerlund, T.; Järvinen, M. On modeling the dissolution of sedimentary rocks in acidic environments. An overview of selected mathematical methods with presentation of a case study. J. Math. Chem. 2013, 51, 2120–2143. [Google Scholar] [CrossRef]
  11. Pepe, F. Dissolution of Finely Ground Limestone Particles in Acidic Solutions. Ind. Eng. Chem. Res. 2001, 40, 5378–5385. [Google Scholar] [CrossRef]
  12. De Blasio, C.; Mäkilä, E.; Westerlund, T. Use of carbonate rocks for flue gas desulfurization: Reactive dissolution of limestone particles. Appl. Energy 2012, 90, 175–181. [Google Scholar] [CrossRef]
  13. Toprac, A.J.; Rochelle, G.T. Limestone dissolution in stack gas desulfurization. A mass-transfer model is shown to predict the the measured dissolution rates with less than 30% error. Environ. Progress 1982, 1, 52–58. [Google Scholar] [CrossRef]
  14. Lund, K.; Fogler, H.S.; McCune, C.C. Acidization—I. The dissolution of dolomite in hydrochloric acid. Chem. Eng. Sci. 1973, 28, 691–700. [Google Scholar] [CrossRef]
  15. Altun, N.E. Assessment of marble waste utilization as an alternative sorbent to limestone for SO2 control. Fuel Process. Technol. 2014, 128, 461–470. [Google Scholar] [CrossRef]
  16. Bjerle, I.; Rochelle, G.T. Limestone dissolution from a plane surface. Chem. Eng. Sci. 1984, 39, 183–185. [Google Scholar] [CrossRef]
  17. Sun, B.; Zhou, Q.; Chen, X.; Xu, T.; Hui, S. Effect of particle size in a limestone–hydrochloric acid reaction system. J. Hazard. Mater. 2010, 179, 400–408. [Google Scholar] [CrossRef] [PubMed]
  18. Dou, B.; Pan, W.; Jin, Q.; Wang, W.; Li, Y. Prediction of SO2 removal efficiency for wet Flue Gas Desulfurization. Energy Convers. Manag. 2009, 50, 2547–2553. [Google Scholar] [CrossRef]
  19. Siagi, Z.O.; Mbarawa, M. Dissolution rate of South African calcium-based materials at constant pH. J. Hazard. Mater. 2009, 163, 678–682. [Google Scholar] [CrossRef] [PubMed]
  20. Wallin, M.; Bjerle, I. A mass transfer model for limestone dissolution from a rotating cylinder. Chem. Eng. Sci. 1989, 44, 61–67. [Google Scholar] [CrossRef]
  21. Plummer, L.N.; Wigley, T.M.L.; Parkhurst, D.L. The kinetics of calcite dissolution in CO2-water systems at 5 degrees to 60 degrees C and 0.0 to 1.0 atm CO2. Am. J. Sci. 1978, 278, 179–216. [Google Scholar] [CrossRef]
  22. Fusi, L.; Monti, A.; Primicerio, M. Determining calcium carbonate neutralization kinetics from experimental laboratory data. J. Math. Chem. 2012, 50, 2492–2511. [Google Scholar] [CrossRef]
  23. Jafari, R.; Tanguy, P.A.; Chaouki, J. Characterization of minimum impeller speed for suspension of solids in liquid at high solid concentration, using gamma-ray densitometry. Int. J. Chem. Eng. 2012, 2012, 945314. [Google Scholar] [CrossRef]
  24. Hosseini, S.; Patel, D.; Ein-Mozaffari, F.; Mehrvar, M. Study of solid- liquid mixing in agitated tanks through computational fluid dynamics modeling. Ind. Eng. Chem. Res. 2010, 49, 4426–4435. [Google Scholar] [CrossRef]
  25. Levenspiel, O. Chemical Reaction Engineering, 3rd ed.; John Wiley & Sons: New York, NY, USA, 1999. [Google Scholar]
  26. Barton, P.; Vatanatham, T. Kinetics of limestone neutralization of acid waters. Environ. Sci. Technol. 1976, 10, 262–266. [Google Scholar] [CrossRef] [PubMed]
  27. Chou, L.E.I.; Garrels, R.M.; Wollast, R. Comparative study of the kinetics and mechanisms of dissolution of carbonate minerals. Chem. Geol. 1989, 78, 269–282. [Google Scholar] [CrossRef]
  28. Tosun, I. Modelling in Transport Phenomena, a Conceptual Approach; Elsevier: Amsterdam, The Netherlands, 2002; ISBN 0444510524. [Google Scholar]
  29. Shengyu, L.; Wende, X.; Pei, L.; Zhixiang, Y. Feasibility Study of New Limestone Flue Gas Desulfurization Process. Clean Soil Air Water 2008, 36, 482–487. [Google Scholar] [CrossRef]
  30. Andritz Group. Andritz Air Pollution Control Is a Global Supplier of Systems for Flue Gas Cleaning Solutions Worldwide; Andritz: Graz, Austria, 2018. [Google Scholar]
  31. Babcock & Wilcox Power Generation Group. Inhibited Oxidation Wet Flue Gas Desulfurization; Babcock & Wilcox Power Generation Group: Barberton, OH, USA, 2012. [Google Scholar]
  32. Okur, H.; Tekin, T.; Ozer, A.K.; Bayramoglu, M. Effect of ultrasound on the dissolution of colemanite in H2SO4. Hydrometallurgy 2002, 67, 79–86. [Google Scholar] [CrossRef]
  33. Hagenson, L.C.; Doraiswamy, L.K. Comparison of the effects of ultrasound and mechanical agitation on a reacting solid-liquid system. Chem. Eng. Sci. 1998, 53, 131–148. [Google Scholar] [CrossRef]
  34. Grénman, H.; Murzina, E.; Rönnholm, M.; Eränen, K.; Mikkola, J.-P.; Lahtinen, M.; Salmi, T.; Murzin, D.Y. Enhancement of solid dissolution by ultrasound. Chem. Eng. Process. 2007, 46, 862–869. [Google Scholar] [CrossRef]
  35. Thompson, L.H.; Doraiswamy, L.K. Sonochemistry: Science and Engineering. Ind. Eng. Chem. Res. 1999, 38, 1215–1249. [Google Scholar] [CrossRef]
  36. Suslick, K.S. Sonochemistry. Science 1990, 247, 1439–1445. [Google Scholar] [CrossRef] [PubMed]
  37. Martin, D.J.; Wells, I.T.P.; Goodwin, C.R. Physics of ultrasound. Anaesth. Intensiv. Care Med. 2015, 16, 132–135. [Google Scholar] [CrossRef]
  38. De Blasio, C. Reactive Dissolution of Sedimentary Rocks in Flue Gas Desulfurization. Modeling and Experimental Investigation; Painosalama: Turku, Finland, 2010; ISBN 978-952-12-2482-9. [Google Scholar]
  39. Järvinen, L.; Leiro, J.A.; Bjondahl, F.; Carletti, C.; Eklund, O. XPS and SEM study of calcite bearing rock powders in the case of reactivity measurement with HCl solution. Surf. Interface Anal. 2012, 44, 519–528. [Google Scholar] [CrossRef]
  40. Carletti, C.; Grénman, H.; De Blasio, C.; Mäkilä, E.; Salonen, J.; Murzin, D.Y.; Salmi, T.; Westerlund, T. Revisiting the dissolution kinetics of limestone–experimental analysis and modeling. J. Chem. Technol. Biotechnol. 2016, 91, 1517–1531. [Google Scholar] [CrossRef]
  41. Molerus, O.; Latzel, W. Suspension of solid particles in agitated vessels—II. Archimedes numbers >40, reliable prediction of minimum stirrer angular velocities. Chem. Eng. Sci. 1987, 42, 1431–1437. [Google Scholar] [CrossRef]
  42. Carletti, C.; De Blasio, C.; Miceli, M.; Pirone, R.; Westerlund, T. Ultrasonic enhanced limestone dissolution: Experimental and mathematical modeling. Chem. Eng. Process. 2017, 118, 26–36. [Google Scholar] [CrossRef]
  43. Kaszuba, M.; Corbett, J.; Watson, F.M.; Jones, A. High-concentration zeta potential measurements using light-scattering techniques. Philos. Trans. Math. Phys. Eng. Sci. 2010, 368, 4439–4451. [Google Scholar] [CrossRef] [PubMed] [Green Version]
  44. Hudson, J.L.; Rochelle, G.T. Flue Gas Desulfurization; ACS Symposium Series: Washington, DC, USA, 1982; ISBN 978-0-8412-0722-6. [Google Scholar]
  45. Boudreau, B.P. Diagenetic Models and Their Implementation: Modelling Transport and Reactions in Aquatic Sediments; Springer: Berlin, Germany, 1997. [Google Scholar]
  46. Chen, D. Applications of ultrasound in water and wastewater treatment. In Handbook on Application of Ultrasound: Sonochemistry for Sustainability; CRC Press: Boca Raton, FL, USA, 2012. [Google Scholar]
  47. Pang, Y.L.; Abdullah, A.Z.; Bhatia, S. Review on sonochemical methods in the presence of catalysts and chemical additives for treatment of organic pollutants in wastewater. Desalination 2011, 277, 1–14. [Google Scholar] [CrossRef]
  48. Pinton, G.F.; Trahey, G.E. Modeling of shock wave propagation in large amplitude ultrasound. Ultrason. Imaging 2008, 30, 44–60. [Google Scholar] [CrossRef] [PubMed]
  49. Prédali, J.-J.; Cases, J.-M. Zeta potential of magnesian carbonates in inorganic electrolytes. J. Colloid Interface Sci. 1973, 45, 449–458. [Google Scholar] [CrossRef]
  50. Moulin, P.; Roques, H. Zeta potential measurement of calcium carbonate. J. Colloid Interface Sci. 2003, 261, 115–126. [Google Scholar] [CrossRef]
  51. Carletti, C. New Aspects in Limestone Dissolution for Wet Flue Gas Desulfurization; Åbo Akademi University: Åbo, Finland, 2015. [Google Scholar]
  52. Iyer, R.S.; Stanmore, B.R.; Pullammanappallil, P.C. The role of the diffuse double layer in leaching of calcium from the surface of flyash particles. Colloids Surf. Physicochem. Eng. Asp. 2001, 177, 69–74. [Google Scholar] [CrossRef]
  53. Pokrovsky, O.S.; Schott, J. Surface chemistry and dissolution kinetics of divalent metal carbonates. Environ. Sci. Technol. 2002, 36, 426–432. [Google Scholar] [CrossRef] [PubMed]
  54. Farooq, U.; Tweheyo, M.T.; Sjøblom, J.; Øye, G. Surface characterization of model, outcrop, and reservoir samples in low salinity aqueous solutions. J. Dispers. Sci. Technol. 2011, 32, 519–531. [Google Scholar] [CrossRef]
Figure 1. The experimental setup used.
Chemengineering 02 00053 g001
Figure 2. The PSD Wolica Powder (a) Parainen (b) dp < 74 μm.
Chemengineering 02 00053 g002
Figure 3. The PSD Wolica Powder (a) Parainen (b) decanted sample 15 min.
Chemengineering 02 00053 g003
Figure 4. The SEM Images of the samples used with a size fraction of 150–212 µm. (a,b) Wolica, (c,d) Parainen.
Chemengineering 02 00053 g004
Figure 5. The acid consumption against time (sec) with no ultrasounds (a,b) and with ultrasounds (c,d). Parainen Large (a,c), Wolica Large (b,d).
Chemengineering 02 00053 g005
Figure 6. The Wolica Large (a,c) and Parainen Large (b,d) samples, cumulative distribution for the case of no sonication (a,b) and the usage of ultrasounds (c,d).
Chemengineering 02 00053 g006aChemengineering 02 00053 g006b
Figure 7. The cumulative distribution for the sample Wolica Small (with sonication). Distributions on (a) refer to all PSD measurements for titration step one. (b) The first measurement of the PSD for each titration step is reported.
Chemengineering 02 00053 g007
Figure 8. The cavitation of micro-bubbles and the formation of micro-jets.
Chemengineering 02 00053 g008
Figure 9. The SSA values for the Parainen Large and Wolica Large samples when ultrasound is used. All titration steps.
Chemengineering 02 00053 g009
Figure 10. The comparison between the experimental determination of y (Y[t] in the figure) (dots) and the second-order kinetics modeling presented in Equation (2) (line) for the case of the Parainen Large samples and the first 3 titration steps (ac).
Chemengineering 02 00053 g010
Figure 11. The Parainen large, second and third titration steps, the comparison between the case of no ultrasound (a,b) and the usage of ultrasound (c,d). Fitting the experimental data (dots) with a second-order reaction kinetics (line).
Chemengineering 02 00053 g011
Figure 12. The Wolica Small samples. The comparison between the second order with an additional term (a,b) and second order with no additional term (c,d). Second and third titration steps (left-right).
Chemengineering 02 00053 g012
Figure 13. The Z-potential Wolica and Parainen with the McIlvaine buffers.
Chemengineering 02 00053 g013
Table 1. The amount of sample used for the case of samples denominated as Wolica Large/Small (WL/WS) and Parainen Large/Small (PL/PS).
Wolica SamplesParainen Samples
WL 1.7–2 gPL 2–3 g
WL US 0.9–2 gPL US 2–4 g
WS 1–1.5 gPS 2 g
WS US 0.8 gPS US 1.9–2.5 g

