Article

Photosynthetic Pigments Changes of Three Phenotypes of Picocyanobacteria Synechococcus sp. under Different Light and Temperature Conditions

by
Sylwia Śliwińska-Wilczewska
1,*,
Zofia Konarzewska
1,
Kinga Wiśniewska
2 and
Marta Konik
3
1
Division of Marine Ecosystems Functioning, Institute of Oceanography, University of Gdansk, Avenue Piłsudskiego 46, P-81-378 Gdynia, Poland
2
Division of Marine Chemistry and Environmental Protection, Institute of Oceanography, University of Gdansk, Avenue Piłsudskiego 46, P-81-378 Gdynia, Poland
3
Department of Marine Physics, Institute of Oceanology Polish Academy of Sciences, P-81-779 Sopot, Poland
*
Author to whom correspondence should be addressed.
Cells 2020, 9(9), 2030; https://doi.org/10.3390/cells9092030
Submission received: 16 August 2020 / Revised: 26 August 2020 / Accepted: 1 September 2020 / Published: 3 September 2020
(This article belongs to the Special Issue Photosynthesis under Biotic and Abiotic Environmental Stress)

Abstract

:
It is estimated that the genus Synechococcus is responsible for about 17% of net primary production in the Global Ocean. Blooms of these organisms are observed in tropical, subtropical and even temperate zones, and they have been recorded recently even beyond the polar circle. The long-term scenarios forecast a growing expansion of Synechococcus sp. and its area of dominance. This is, among others, due to their high physiological plasticity in relation to changing environmental conditions. Three phenotypes of the genus Synechococcus sp. (Type 1, Type 2, and Type 3a) were tested in controlled laboratory conditions in order to identify their response to various irradiance (10, 55, 100 and 145 µmol photons m−2 s−1) and temperature (15, 22.5 and 30 °C) conditions. The highest total pigment content per cell was recorded at 10 μmol photons m−2 s−1 at all temperature variants with the clear dominance of phycobilins among all the pigments. In almost every variant the highest growth rate was recorded for the Type 1. The lowest growth rates were observed, in general, for the Type 3a. However, it was recognized to be less temperature sensitive in comparison to the other two types and rather light-driven with the highest plasticity and adaptation potential. The highest amounts of carotenoids were produced by Type 2 which also showed signs of the cell stress even around 55 μmol photons m−2 s−1 at 15 °C and 22.5 °C. This may imply that the Type 2 is the most susceptible to higher irradiances. Picocyanobacteria Synechococcus sp. require less light intensity to achieve the maximum rate of photosynthesis than larger algae. They also tolerate a wide range of temperatures which combined together make them gain a powerful competitive advantage. Our results will provide key information for the ecohydrodynamical model development. Thus, this work would be an important link in forecasting future changes in the occurrence of these organisms in the context of global warming.

1. Introduction

The discovery of autotrophic picoplankton in the late 1970s [1,2] has contributed to numerous scientific studies on these organisms and demonstrated their significant role as a missing link in the carbon cycle and a major producer in oceanic waters [3]. Many researchers proved that picoplankton also plays an important role in more productive waters, often exceeding the abundance and biomass of other phytoplankton species [4]. The genus Synechococcus is a polyphyletic group of picoplanktonic cyanobacteria that constitutes one of the major contributors to oceanic primary production [5,6] and is a key worldwide distributed component of marine planktonic communities [7]. It is estimated that for about 17% of net primary production in the Global Ocean is responsible solely the genus Synechococcus [8]. Blooms of these organisms are observed in tropical, subtropical and even temperate zones [9]. The present global warming causes temperature rise which was recognized as a main cause of the massive shift of species northwards [10]. Furthermore, Synechococcus has been recorded far beyond the polar circle, e.g., dragged with a strong Atlantic inflow in 2014, as far as 82.5° N [11]. In the future ocean scenarios, a growing expansion of Synechococcus sp. and its area of dominance is forecasted [8,12]. A significant increase in the frequency of their blooms has already been detected [9]. This is, among others, due to their high physiological plasticity in relation to changing environmental conditions [13]. Organisms from the genus Synechococcus are represented by three phenotypes that complement each other and fill tightly the ecological niche due to varying photosynthetic pigment profiles and high chromatic adaptation potential.
The photosynthetic pigment observed in cells of picoplanktonic cyanobacteria is chlorophyll a (Chl a), carotenoid (Car) pigments, and phycobiliproteins (Phyco) [14]. Chl a is the most important pigment because it controls photosynthesis and this transformation of the absorbed energy from sunlight into chemical compounds determines the biomass growth rates [14]. The most dominant Car pigment is zeaxanthin (Zea), representing 40% to 80%. The presence of cell-specific Zea content in Synechococcus sp. and high Zea/Chl a ratios may be regarded as a diagnostic feature [15]. Besides Zea, β-carotene (β-Car) is also present among Car pigments [16]. Car pigments play an important photoprotective role against damage to the photosystem [17]. Furthermore, cells of picocyanobacteria contain accessory phycobilin pigments instead of the additional chlorophylls that are common among other phytoplankton organisms. There are three types of Phyco containing: phycoerythrin (PE), phycocyanin (PC), and allophycocyanin (APC), which absorb green, yellow-orange, and red light, respectively [18]. In cyanobacterial cells, Phyco are organized into aggregates consisting of many subunits called phycobilisomes, which are connected in regular rows to the surface of thylakoid membranes. The main component of the core complex is APC while PE is located in the peripheral parts of these formations [19]. Phyco absorb light in the 500−650 nm range and provide additional energy to photosynthetic centers. The transfer process is highly efficient and reaches 80−90% of the energy absorbed by phycobilin pigments. Their role is vital, especially in case of any light shortages to maintain high photosynthesis rate which guarantees cyanobacteria competitive advantage in low-light conditions. The red PE absorbs the blue-green light that penetrates the deepest into the water column. It enables conducting photosynthesis even at the bottom of the euphotic zone. The deeper live an organism, the more PE it contains and the higher is the PE to Chl a pigment ratio. In the cells of cyanobacteria living in the upper layers of the ocean the dominant pigments are the blue PC and APC [19].
The distinction between the three main identified phenotypes of the genus Synechococcus is based on the phycobilin pigments composition [20,21]. Six et al. [22] in their research presented a classification that divides marine Synechococcus to Type 1, Type 2, and Type 3. Organisms with the dominance of PC were classified as Type 1. Type 2 incorporates phenotypes with a dominance of PE, more specifically PEI, while Type 3 consists of organisms in which PC, as well as PEI and PEII, dominates in phycobilisomes. Furthermore, Six et al., [22] divided Type 3 into four subcategories from a to d, according to the increasing phycoerythrobilin (PEB) and phycocyanobilin (PCB) ratios. Organisms with high levels of PE are found mainly in oligotrophic oceans, while green (PC-rich) phenotypes prefer turbid freshwater [23,24]. In general, picocyanobacteria prefer lower irradiance intensity to reach the maximum rate of photosynthesis than larger algae [25]. Furthermore, studies have shown that the reduction of radiation intensity does not change the efficiency of carbon incorporation during photosynthesis, as is the case with larger plant organisms that exceed 3 μm. Marine Synechococcus sp. is able to saturate photosynthesis and growth rates at very low radiation [26]. Under culture conditions, some strains of picoplankton have shown the ability to survive and grow again after periods of total darkness [27,28]. Platt et al. [29] observed photosynthetic picoplankton at a depth of 1000 m in the depths of the eastern Pacific Ocean and Cai et al. [30] confirmed the presence of small populations of Synechococcus sp. in the Chesapeake Bay during winter months. Furthermore, Ernst [31] isolated Synechocystis sp. (Maple BO 8402) from the Lake Constance with a different type of pigmentation than any described so far. This strain contained Phyco similar to the PC, characterized by very strong red fluorescence occurring after stimulation of the cells with wavelengths of 600 nm but also with wavelengths of 436 and 546 nm [32]. Most cyanobacteria, especially those living all year round in coastal ocean waters, contain PE [23,33,34].
The main aim of this study was to determine the acclimatization capacity of three Baltic phenotypes of Synechococcus sp.: Type 1, Type 2, Type 3a. Furthermore, the study focused on the effect of irradiance, temperature, and their mutual interactions on the content and proportions of cell-specific photosynthetic pigments of the examined cyanobacterial phenotypes. The cell-specific Chl a and Car content was determined by the HPLC method, whereas the content of Phyco was determined by the spectrophotometric method. The detailed characterization of the quantitative and qualitative composition of pigments is important to determine the level of acclimatization of the examined phenotypes of cyanobacteria to specific environmental conditions. The knowledge of biology and especially the physiology of these organisms by capturing their reactions to various environmental factors is important for forecasting the possible expansion of these organisms.

2. Results

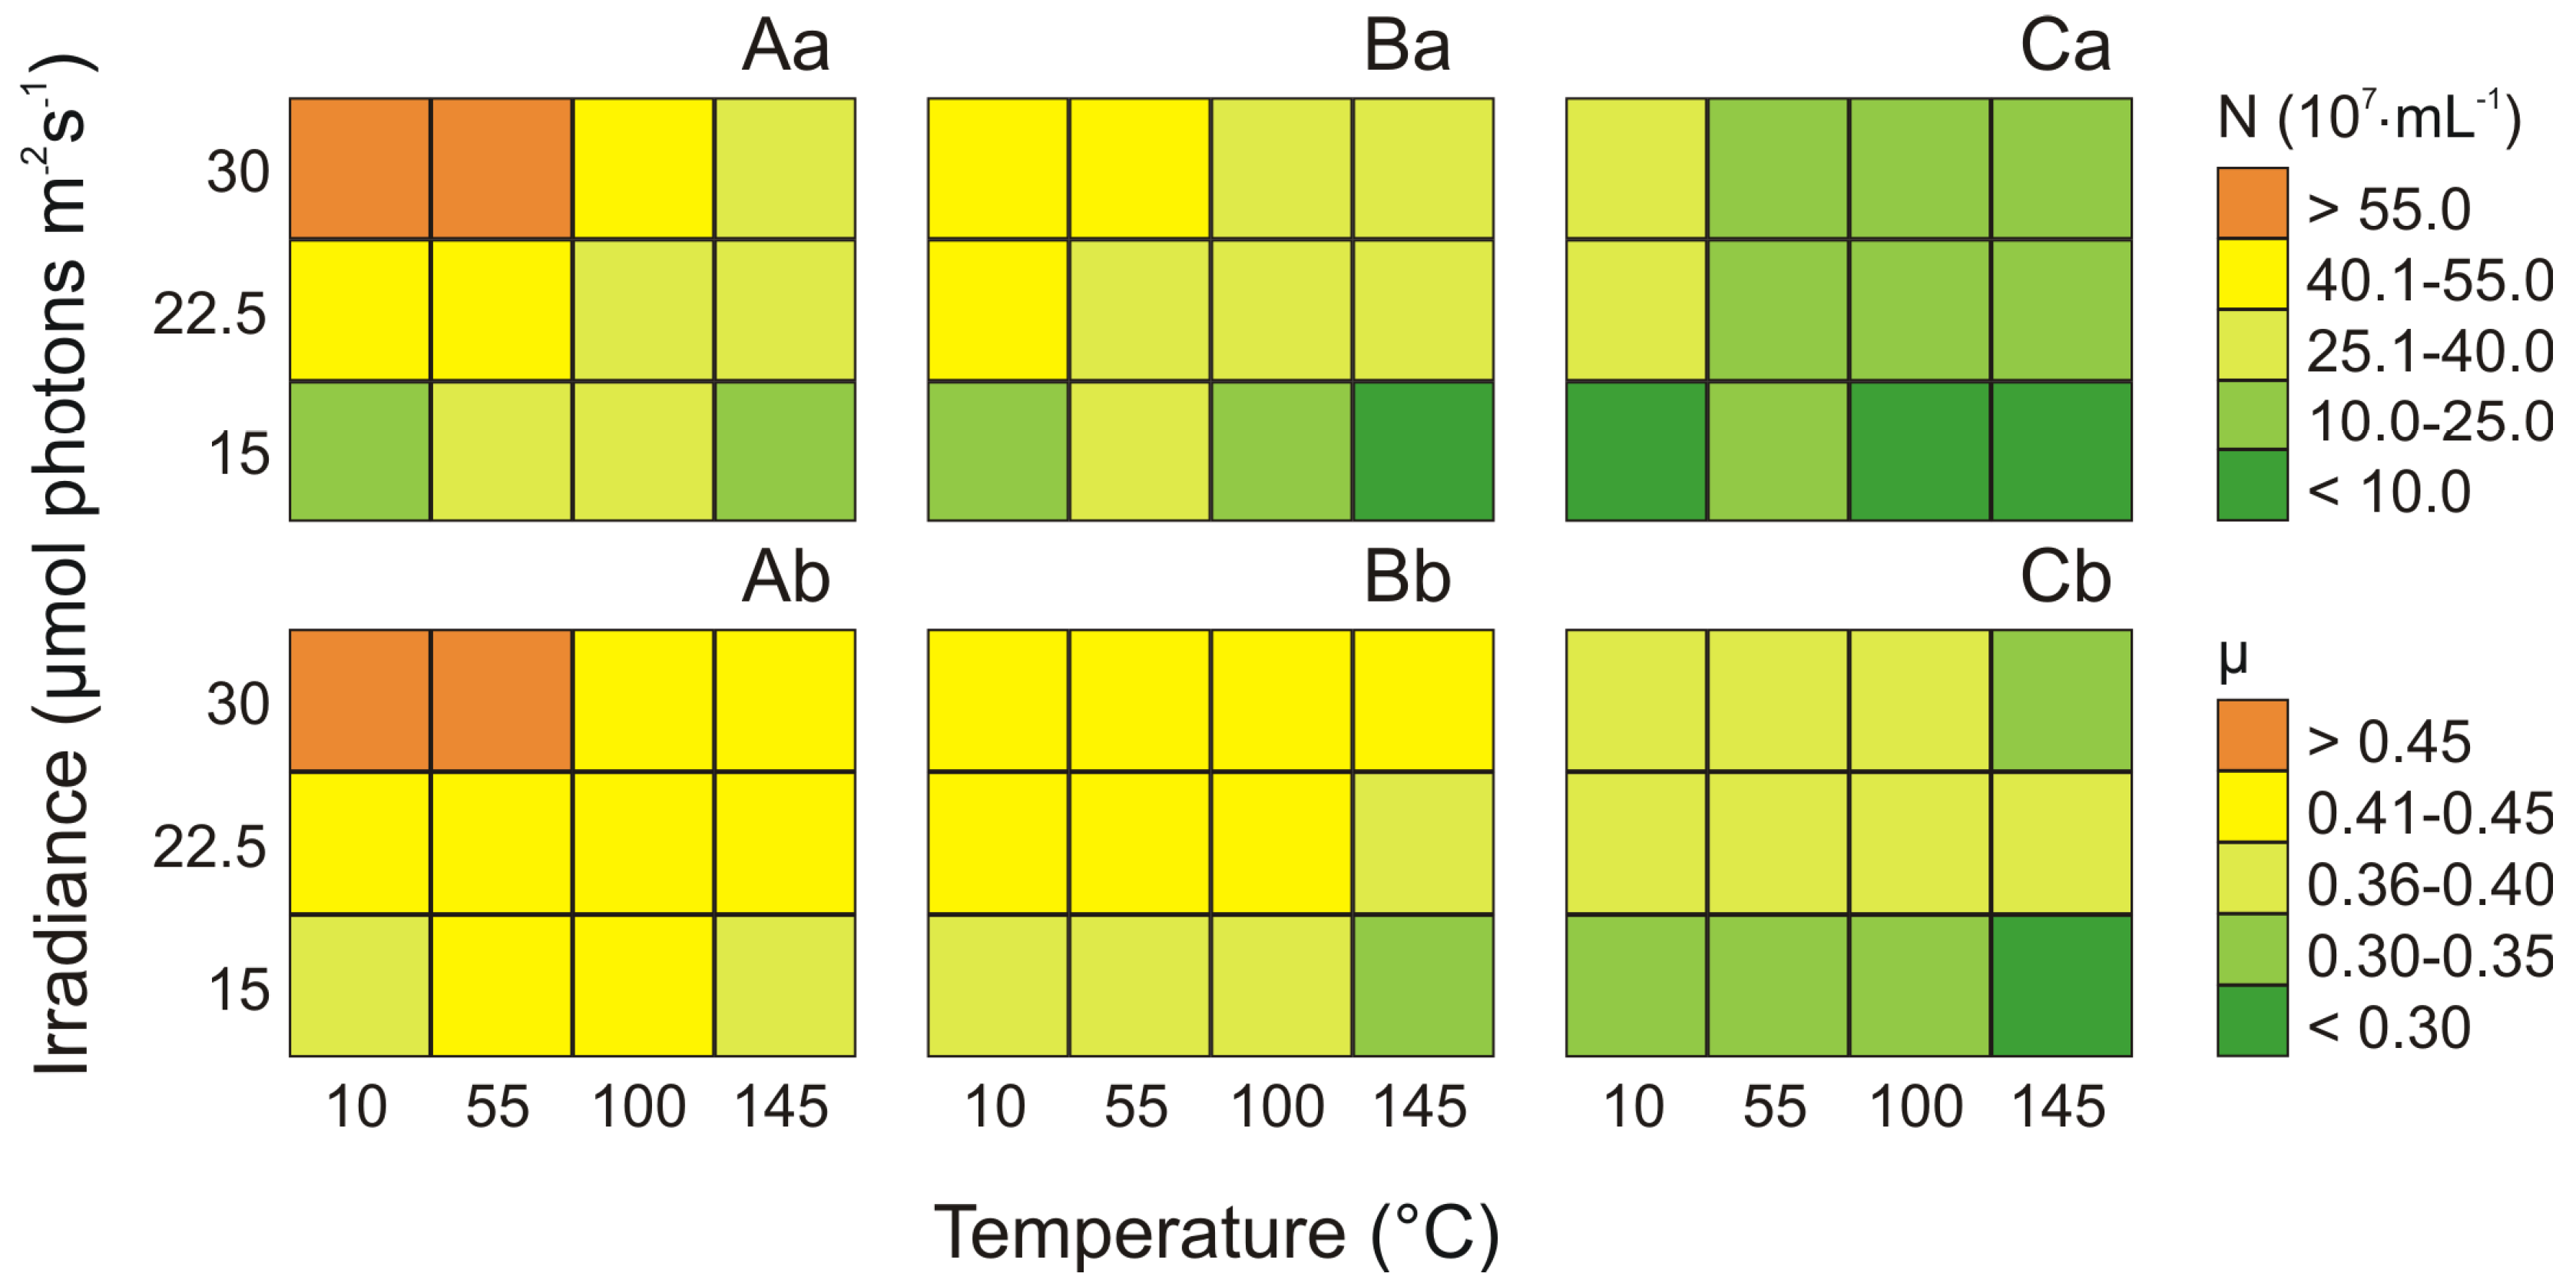
2.1. The Cell Concentration and the Growth Rate of Three Synechococcus sp. Phenotypes under Different Culture Conditions

In this study, the concentration of picocyanobacterial cells as well as the growth rate under different irradiance and temperature conditions were determined for the three studied phenotypes of Synechococcus sp. (Type 1, Type 2, and Type 3a). In general, factorial tests showed that both irradiance and temperature significantly affected the number of cells of three Synechococcus sp. phenotypes (ANOVA, p < 0.001, p < 0.01, p < 0.01, for Type 1, Type 2, and Type 3a, respectively; Table S1). Moreover, ANOVA results indicated that for each picocyanobacteria phenotype the effect of temperature on the culture concentration was higher than the influence of irradiance and the interaction of both factors (Table S1). The highest picocyanobacterial cell numbers (59.5 × 10⁷ and 60.2 × 10⁷ cell mL−1) was noted for Synechococcus sp. Type 1 at 10 μmol photons m−2 s−1 and 55 μmol photons m−2 s−1, respectively and 30 °C (Figure 1Aa), and it was about 4-fold higher that the minimum values observed in 15 °C and 145 μmol photons m−2 s−1 (15.2 × 10⁷ cell mL−1). For Synechococcus sp. Type 2 (Figure 1Ba) and Type 3a (Figure 1Ca) the maximum cell concentration were recorded at the temperature of 22.5 °C and 30 °C, respectively. Moreover, the highest picocyanobacterial cell numbers for Type 2 was found at irradiance 55 μmol photons m−2 s−1 (49.4 × 10⁷ cell mL−1), whereas for Type 3a at 10 μmol photons m−2 s−1 (25.8 × 10⁷ cell mL−1). For both phenotypes, similar to Type 1, the minimum number of cells were obtained at 15 °C and 145 μmol photons m−2 s−1 (about 9.7 × 10⁷ and 6.5 × 10⁷ cell mL−1, respectively).
It was found that analyzed phenotypes of Synechococcus sp. showed different growth rates (μ) under different temperature and light conditions. For Synechococcus sp. Type 1, Type 2, and Type 3a the highest growth rate was recorded at the highest temperature (30 °C). Moreover, the highest growth rate for Type 1 (Figure 1Ab) and Type 2 (Figure 1Bb) was noted at 55 μmol photons m−2 s−1 (0.457, 0.443, respectively) whereas for Type 3a at 10 μmol photons m−2 s−1 (0.396; Figure 1Cb). On the other hand, for Type 1, Type 2, and Type 3a, the shortest growth rate (0.359, 0.327, 0.298, respectively) was obtained at 15 °C and 145 μmol photons m−2 s−1.

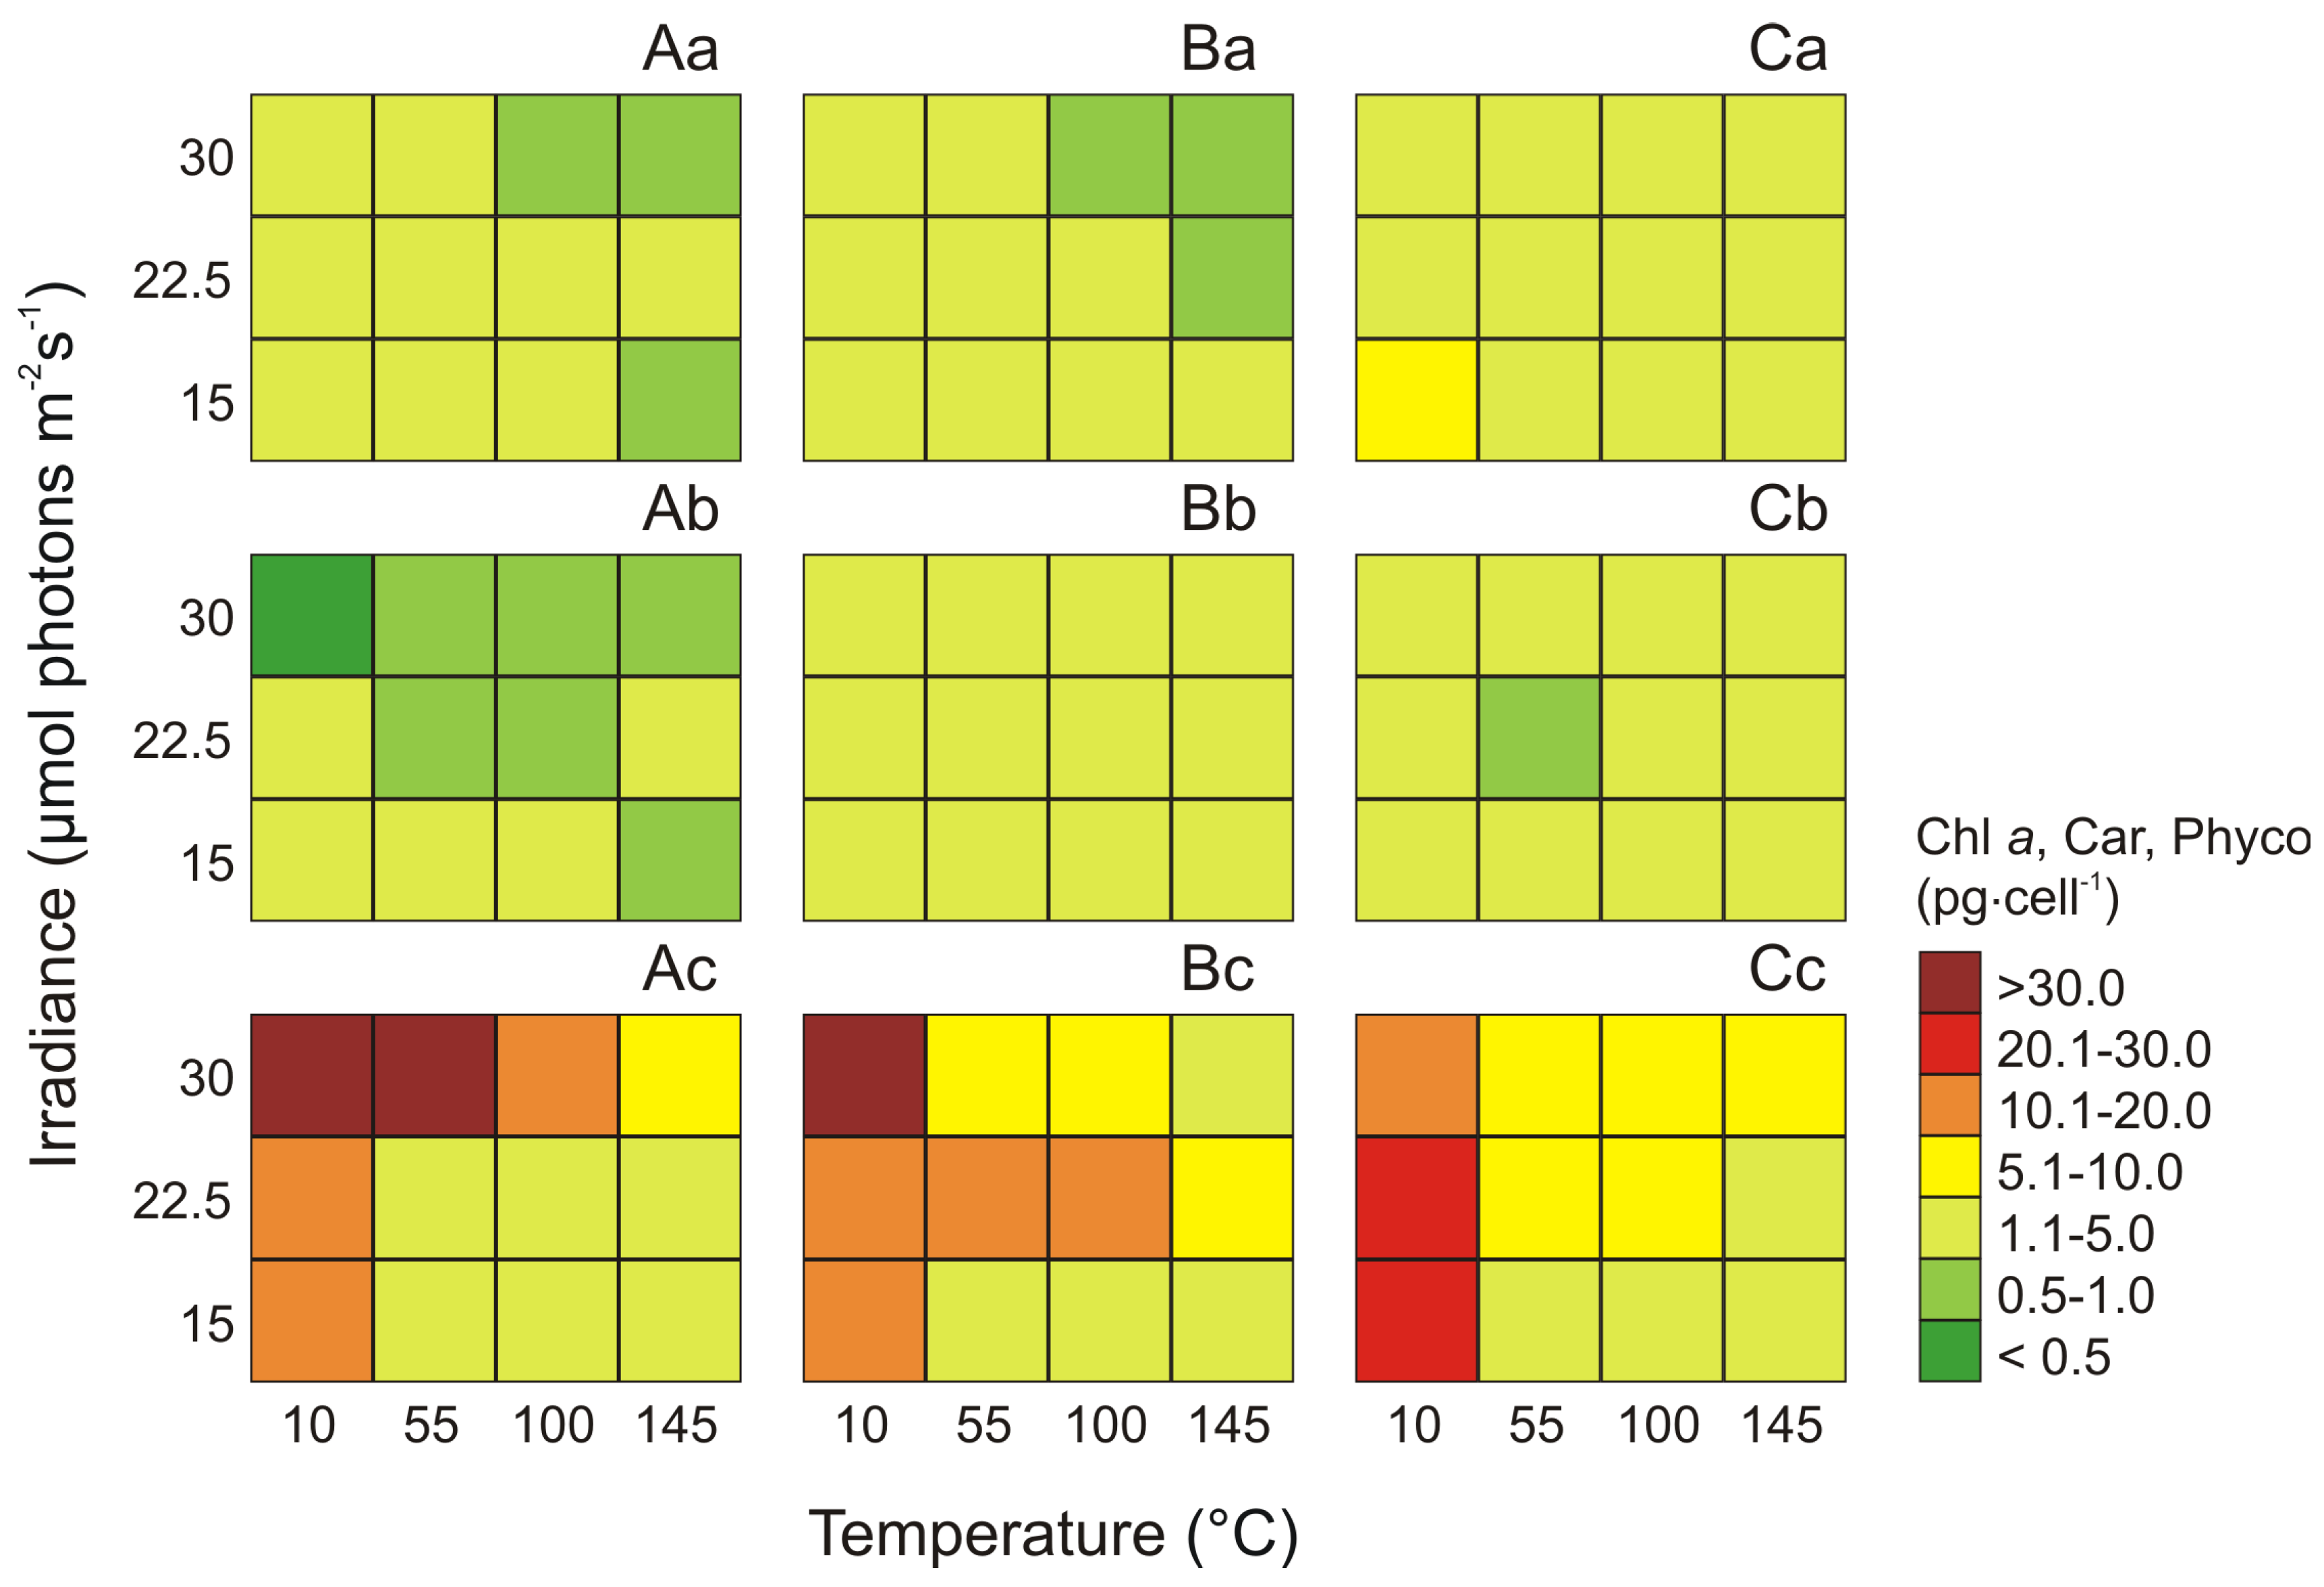
2.2. The Total Pigments Content for Three Phenotypes of the Genus Synechococcus

The acclimation mechanisms of three Synechococcus sp. phenotypes was characterized by the concentration of changes in composition and proportion of photosynthetic pigments i.e., chlorophyll a (Chl a), zeaxanthin (Zea), β-carotene (β-Car), phycoerythrin (PE), phycocyanin (PC), and allophycocyanin (APC) under different light (μmol photons m−2 s−1) and temperature (°C) conditions. In this work, the composition and proportions of Chl a and Car pigments (Zea and β-Car) of three Synechococcus sp. phenotypes were determined by HPLC method, while the content of phycobilins (Phyco) were determined by spectrophotometric method.
Both light and temperature significantly affected the cell-specific Chl a content of Synechococcus sp. Type 1, Type 2, and Type 3a (ANOVA, p < 0.001, for all) and Phyco content (ANOVA, p < 0.001, p < 0.001, and p < 0.001, for Type 1, Type 2, and Type 3a, respectively). Moreover, these factors significantly affected the cell-specific Car content of Synechococcus sp. phenotypes (ANOVA, p < 0.001, p < 0.001, p < 0.001 for Type 1, Type 2, and Type 3a, respectively; Table S2). Generally, ANOVA results indicated that the effect of irradiance on the Chl a and Phyco concentration for picocyanobacteria phenotypes was higher than the influence of temperature and the interaction of the two factors (Table S2). In contrast, the cell-specific Car content of Synechococcus sp. Type 1, Type 2, and Type 3a was more affected by temperature and the interaction of the two factors than by irradiance (Table S2).
The maximum cell-specific concentration of Chl a (about 8.11 pg·cell−1) was noted for Synechococcus sp. Type 3a at 10 μmol photons m−2 s−1 light intensity and 15 °C, and it was about 5.5 times higher than the minimum at 145 μmol photons m−2 s−1 and 30 °C (Figure 2Ca). For Synechococcus sp. Type 1 and Type 2 the maximum cell-specific Chl a concentrations (4.51 pg·cell−1 and 4.82 pg·cell−1, respectively) were recorded at 10 μmol photons m−2 s−1 and 15 °C for Type 1 and 30 °C for Type 2. On the other hand, the minimum values for these phenotypes were obtained at 145 μmol photons m−2 s−1 and 30 °C (0.68 pg·cell−1 and 0.67 pg·cell−1, respectively; Figure 2Aa−Ba).
On the basis of the results obtained in this study, it was found that the analyzed phenotypes were characterized by a similar maximum cell-specific Car content. It was also shown that cell-specific Car content was the lowest among all analyzed photosynthetic pigments. The total Car content for Synechococcus sp. Type 1, Type 2, and Type 3a constituted approximately 7%, 11%, and 12% of the sum of Chl a and Phyco, respectively. It was also found that for Type 2 (Figure 2Bb) and Type 3a (Figure 2Cb) the maximum cell-specific Car content (2.01 pg·cell−1 and 2.25 pg·cell−1, respectively) were recorded at 190 μmol photons m−2 s−1 and 30 °C. By contrast, the minimum values of cell-specific Car content were obtained at 100 μmol photons m−2 s−1 and 22.5 °C (1.20 pg·cell−1, for Type 2 and 0.60 pg·cell−1, for Type 3a). On the other hand, for Synechococcus sp. Type 1, the reported maximum value of cell-specific Car content (1.74 pg·cell−1) at 100 μmol photons m−2 s−1 and 15 °C was approximately 4-fold higher compared to the recorded minimum values at 10 μmol photons m−2 s−1 and 30 °C (Figure 2Ab).
It was noted that the total Phyco pigments were always greater than cell-specific Chl a and Car content of the three examined Synechococcus sp. phenotypes. The study found that the total Phyco content for Synechococcus sp. Type 1, Type 2, and Type 3a constituted about 80%, 75%, and 65% of the sum of Chl a and Car, respectively. The highest cell-specific Phyco content was measured in Synechococcus sp. Type 2 (45.90 pg·cell−1) at 10 μmol photons m−2 s−1 and 30 °C (Figure 2Bc) while the minimum values of these pigments was noted at 55 μmol photons m−2 s−1 and 15 °C (2.70 pg·cell−1). The greatest decrease in the cell-specific Phyco content was noted for Synechococcus sp. Type 1 (Figure 2Ac), which under minimal conditions (100 μmol photons m−2 s−1 and 15 °C) was about 30 times lower than the recorded under maximum values at 10 μmol photons m−2 s−1 and 30 °C (33.56 pg·cell−1). In turn, Synechococcus sp. Type 3a showed the highest resistance to light and temperature, and its decrease in the cell-specific Phyco content under minimal conditions (145 μmol photons m−2 s−1 and 15 °C) was about 12.7 times lower (2.25 pg·cell−1) than the recorded under maximum values (10 μmol photons m−2 s−1 and 22.5 °C; Figure 2Cc).

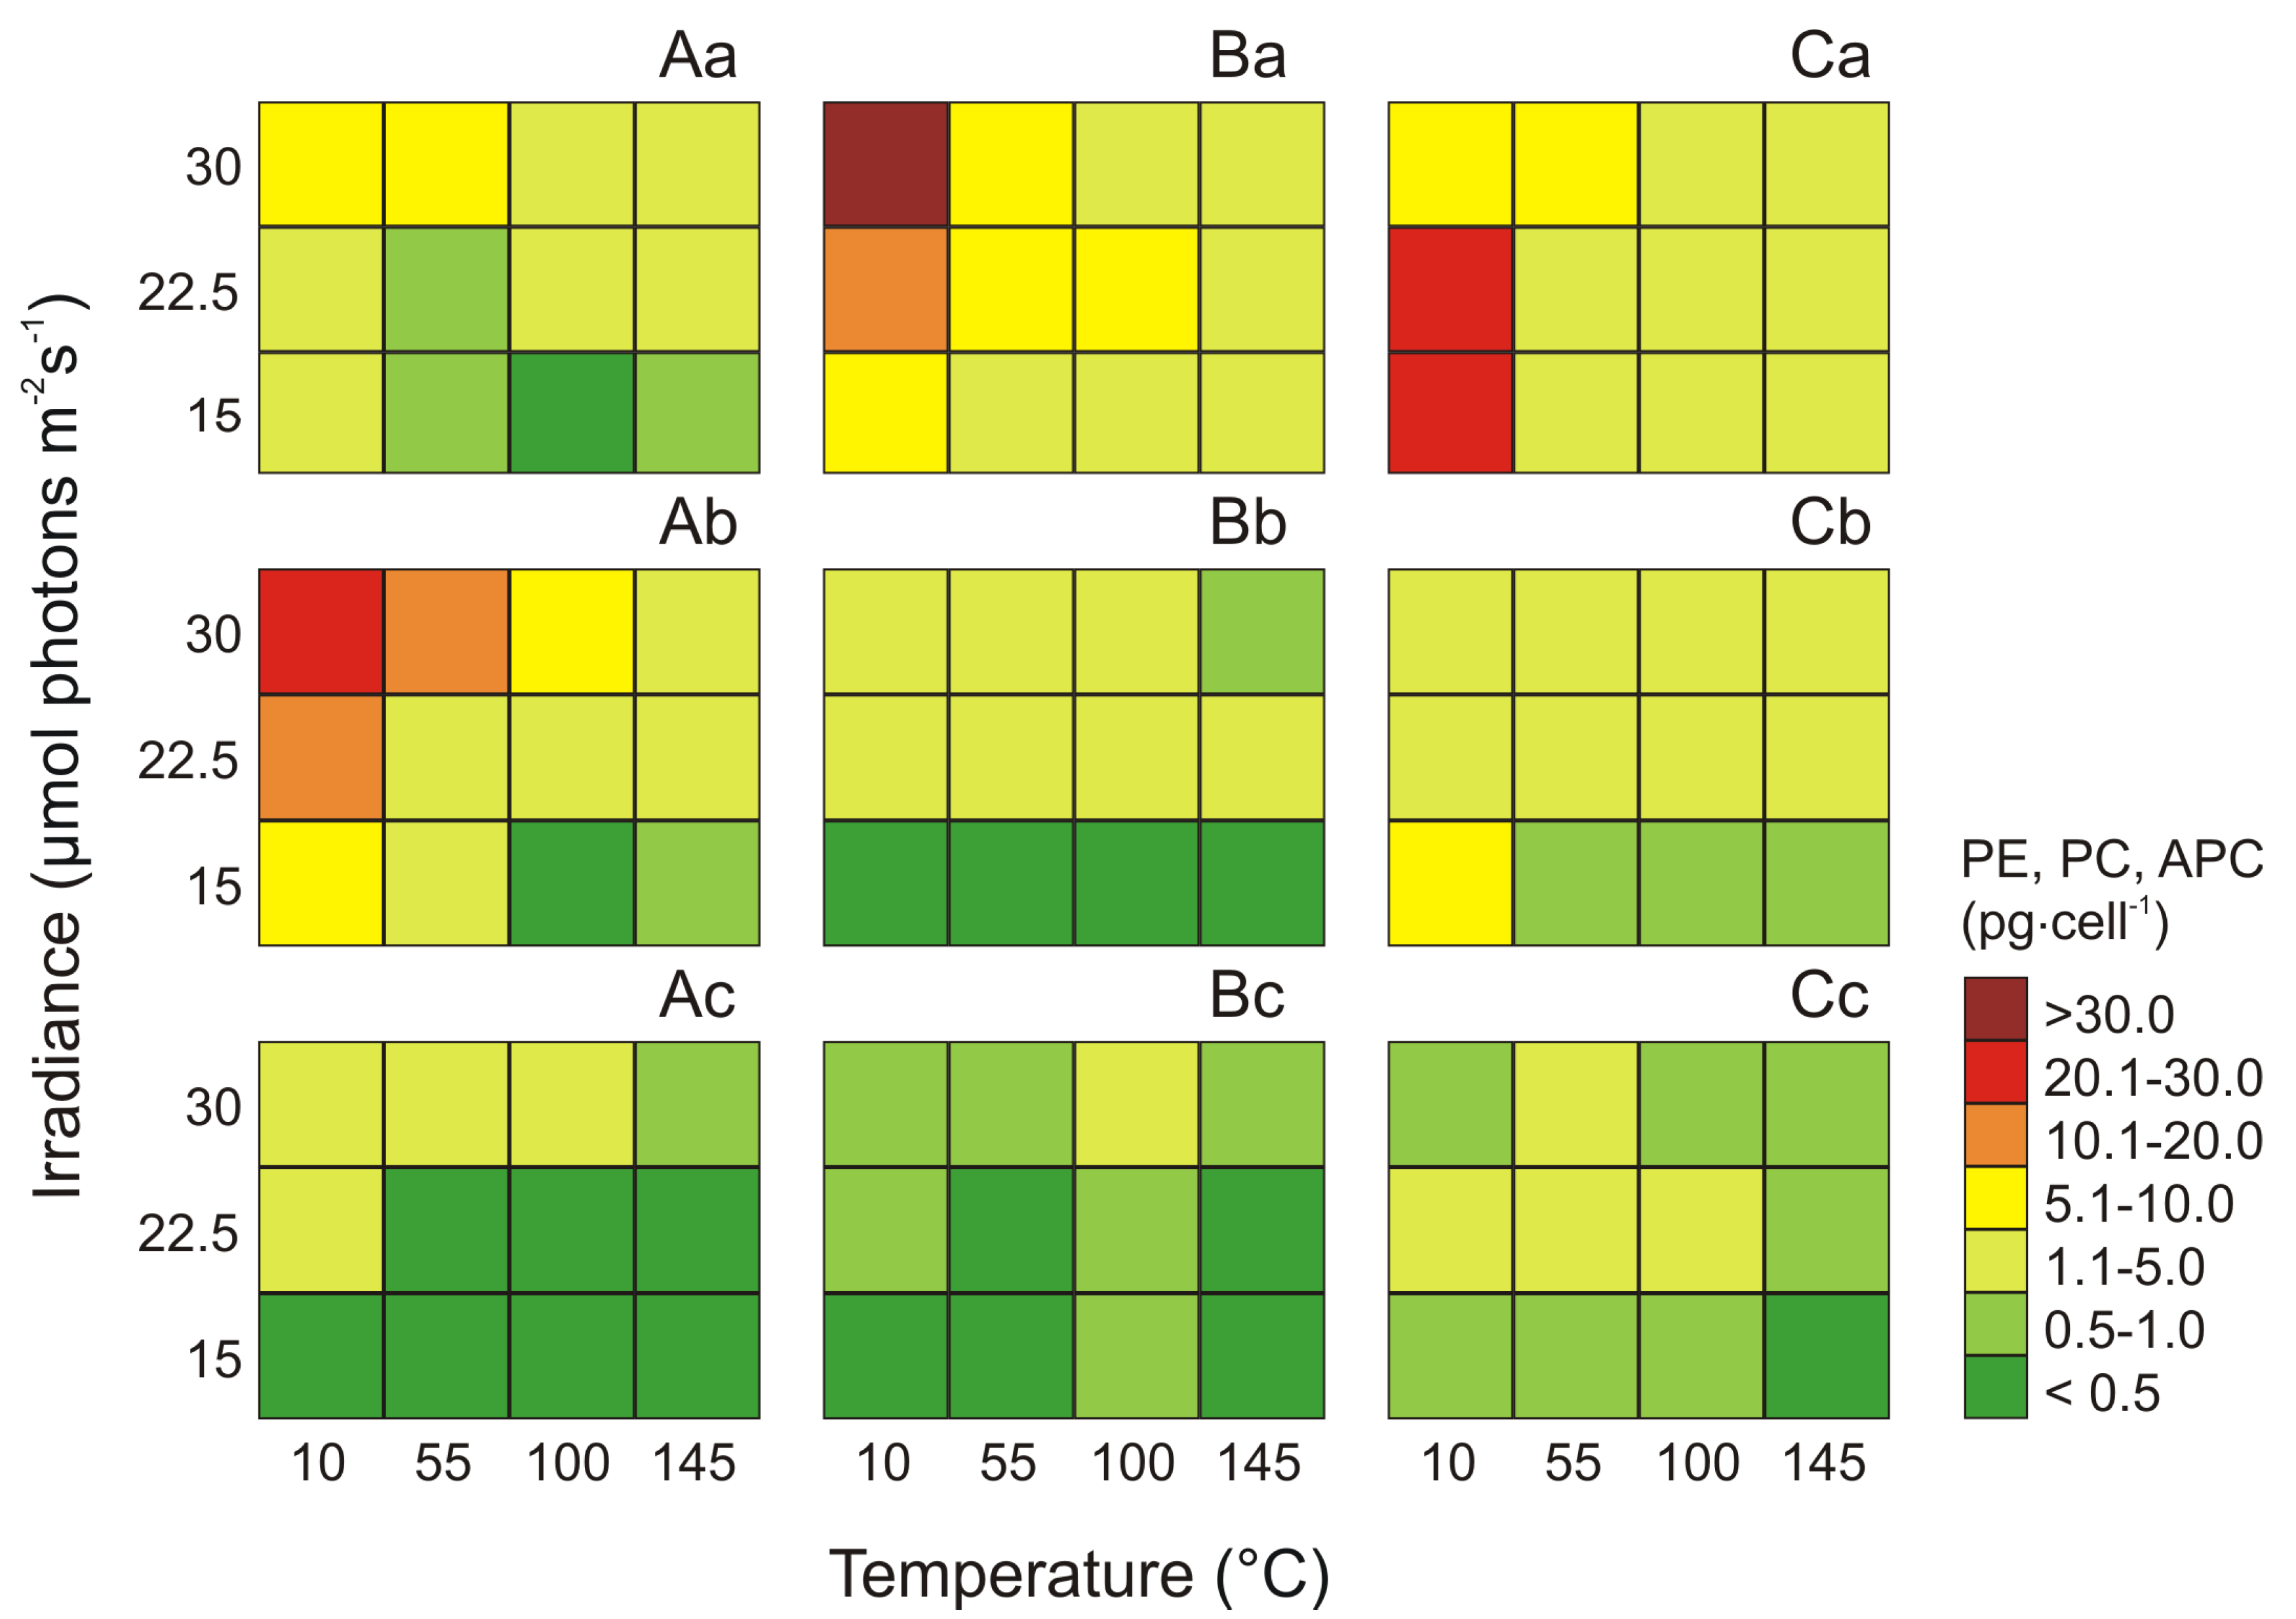
2.3. Effect of Irradiance and Temperature on Phycocyanin, Phycoerythrin, and Allophycocyanin Content

The presence of phycoerythrin (PE), phycocyanin (PC), and allophycocyanin (APC) was demonstrated for all picocyanobacterial phenotypes by spectrophotometric analysis. It was found that irradiance and temperature as well as their interaction significantly affected the cell-specific PE content of Synechococcus sp. (ANOVA, p < 0.001, for Type 1, Type 2, and Type 3a), PC content (ANOVA, p < 0.001, fot Type 1, p < 0.001, for Type 2, and p < 0.001, for Type 3a) and APC content (ANOVA, p < 0.001, p < 0.01, and p < 0.05, for Type 1, Type 2, and Type 3a, respectively; Table S3). ANOVA indicated that for most of Synechococcus sp. phenotypes, the effect of irradiance on PE was higher than the effect of temperature. In contrast, the PC and APC content of analyzed phenotypes was more affected by temperature than by irradiance and by the interaction of both factors (Table S3).
In all the phenotypes, the cell-specific (pg·cell−1) PE, PC, and APC pigment contents were environmentally driven (Figure 3). The cell-specific PE content increased with decrease of irradiance and increase of the temperature, reaching the highest values at the intensity of 10 μmol photons m−2 s−1 and temperature 22.5 °C (21.16 pg·cell−1 for Type 3a; Figure 3Ca) and 30 °C (8.59 pg·cell−1 for Type 1 and 40.35 pg·cell−1 for Type 2; Figure 3Aa,Ba). Under these conditions, the PE in the cells of the tested picocyanobacteria increased approximately 20.0-fold, 19.7-fold, and 13.6-fold, for Type 1, Type 2, and Type 3a, respectively, compared with the observed minimum values at 100–145 μmol photons m−2 s−1 and 15 °C.
On the basis of the conducted analyzes, it was found that the conditions under which the Synechococcus sp. Type 1 and Type 2 achieved the highest concentrations of the cell-specific PC were the low light intensity of 10 μmol photons m−2 s−1 and a high temperature of 30 °C. On the other hand, for Type 3a the maximal value of this pigment was noted at 10 μmol photons m−2 s−1 and 15 °C. The highest concentration value of PC pigments under optimal conditions was observed for Synechococcus Type 1 (20.95 pg·cell−1; Figure 3Ab), and the lowest for Synechococcus Type 2 (4.64 pg·cell−1; Figure 3Bb). The greatest decrease in cell-specific PC (about 64-fold) was noted for Synechococcus Type 1. However, the least susceptible to analyzed factors was Synechococcus Type 3a, with a 10-fold decrease in PC pigments (Figure 3Cb).
The highest cell-specific APC content (4.34 pg·cell−1) was recorded for Synechococcus sp. Type 1 in the 55 μmol photons m−2 s−1 and 30 °C (Figure 3Ac). For these light and temperature conditions, over 18-fold increase was observed in relation to the lowest recorded values at 10 μmol photons m−2 s−1 and 15 °C. For Synechococcus sp. Type 2 and Type 3a the maximum cell-specific APC concentrations (1.09 pg·cell−1 and 1.98 pg·cell−1, respectively) were recorded at 55−100 μmol photons m−2 s−1 and 22.5−30 °C. On the other hand, the minimum values for these phenotypes were obtained at 145 μmol photons m−2 s−1 and 15 °C (0.28 pg·cell−1 for Type 2 and 0.44 pg·cell−1, for Type 3a; Figure 3Bc,Cc).

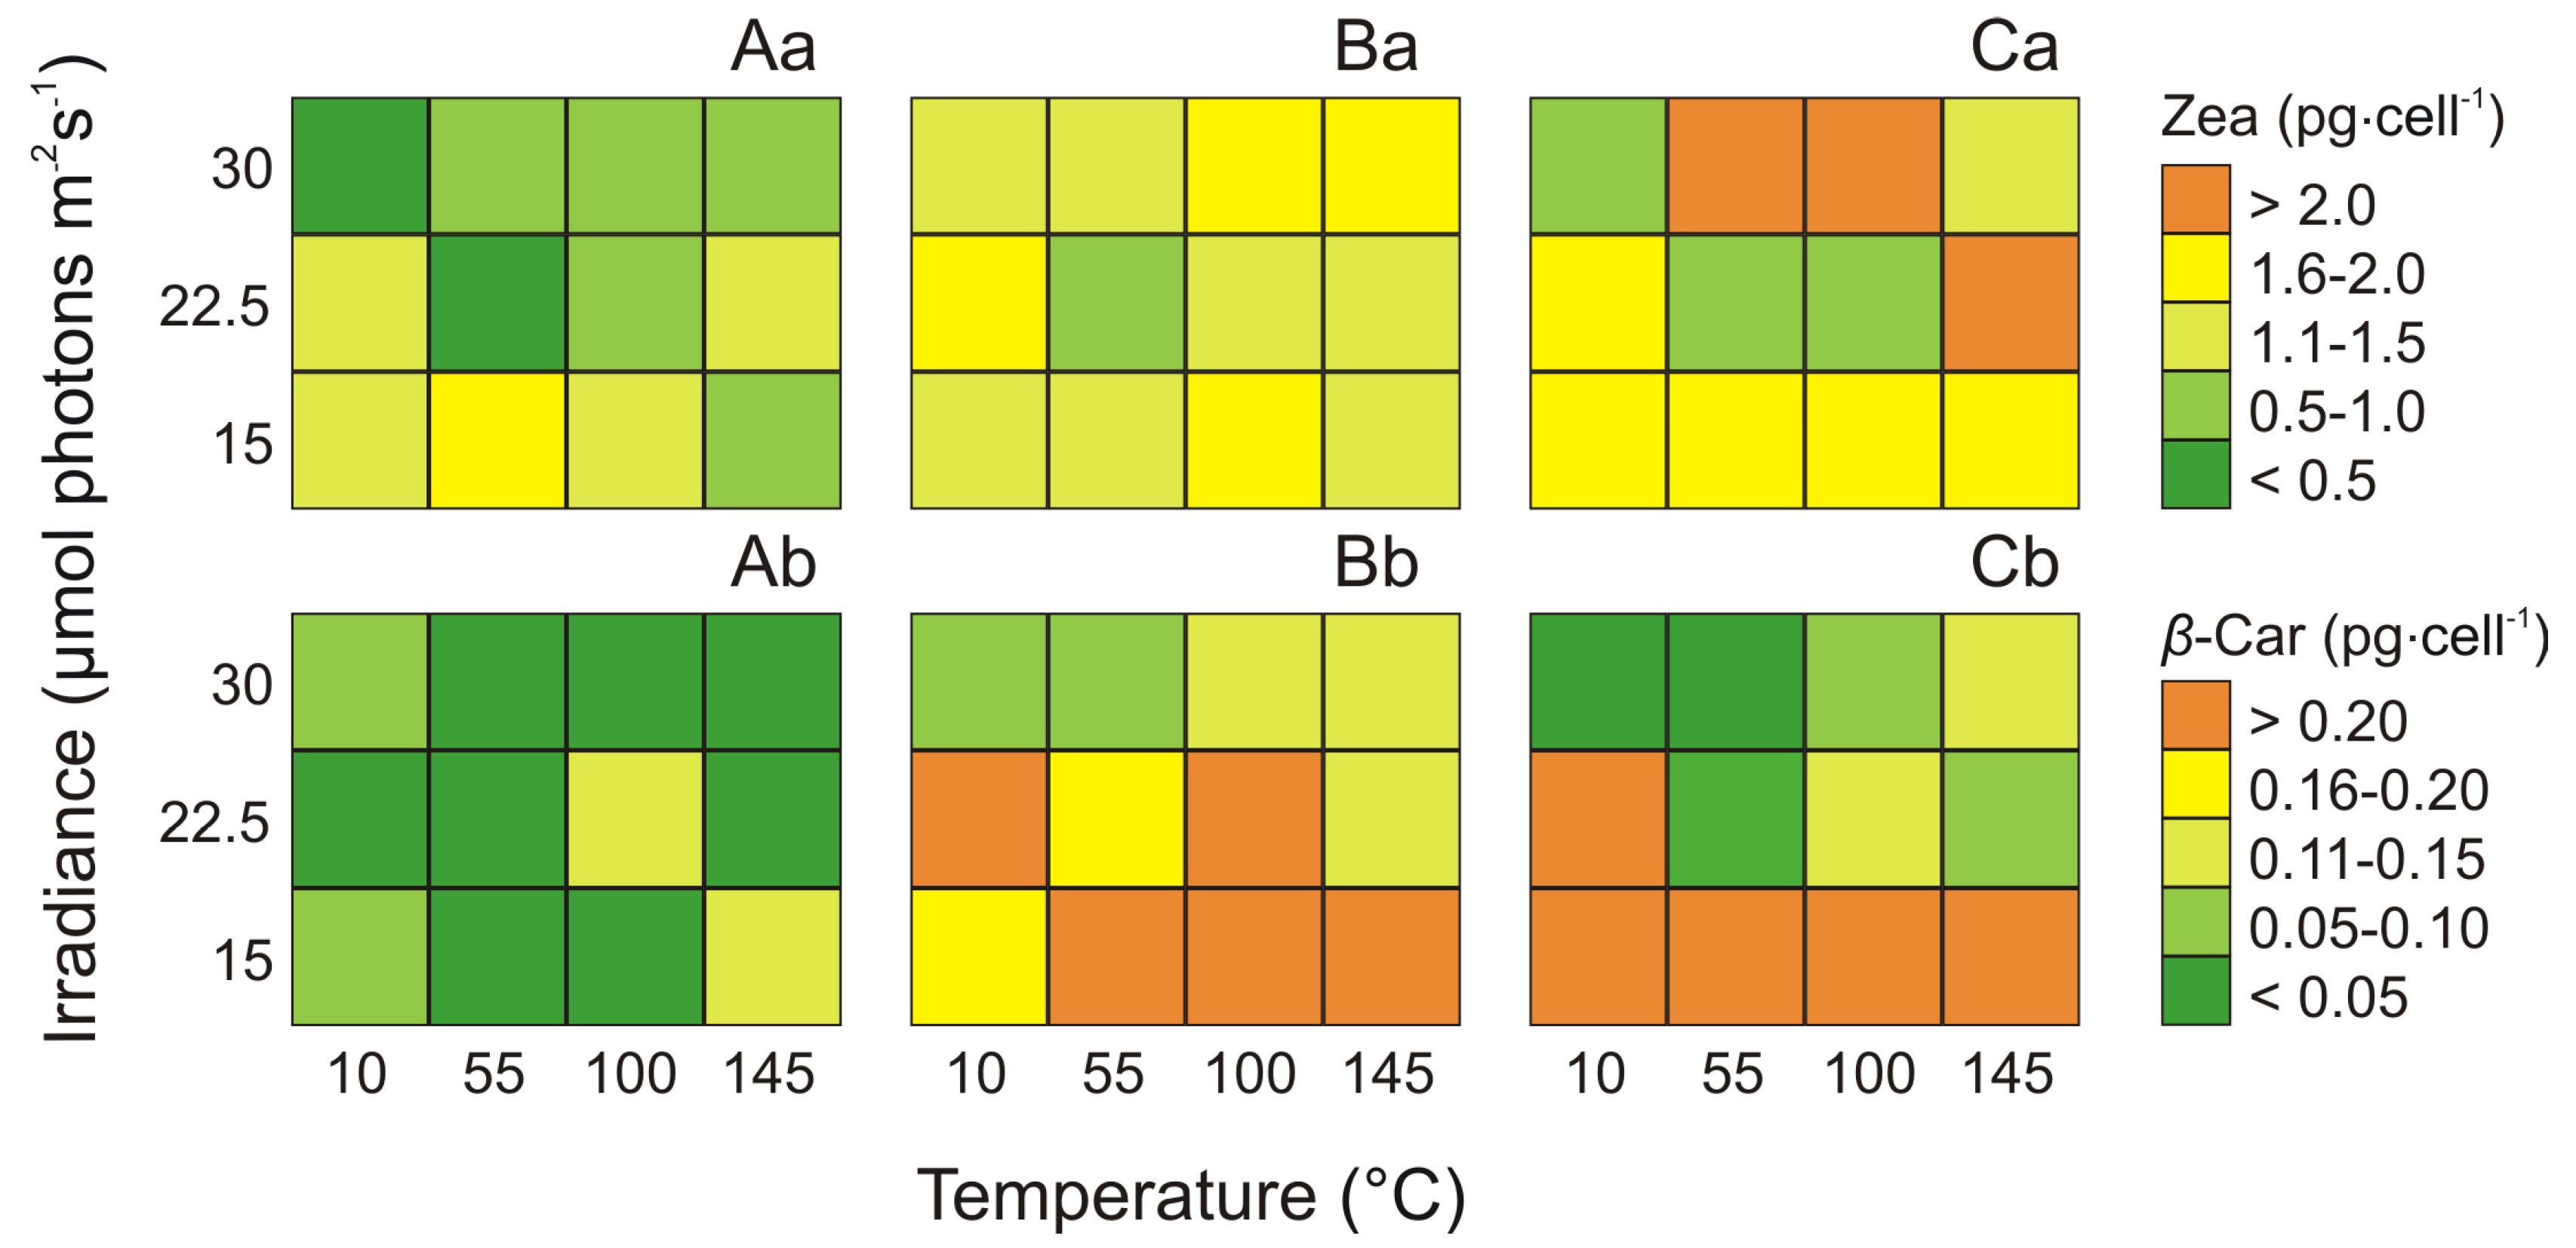
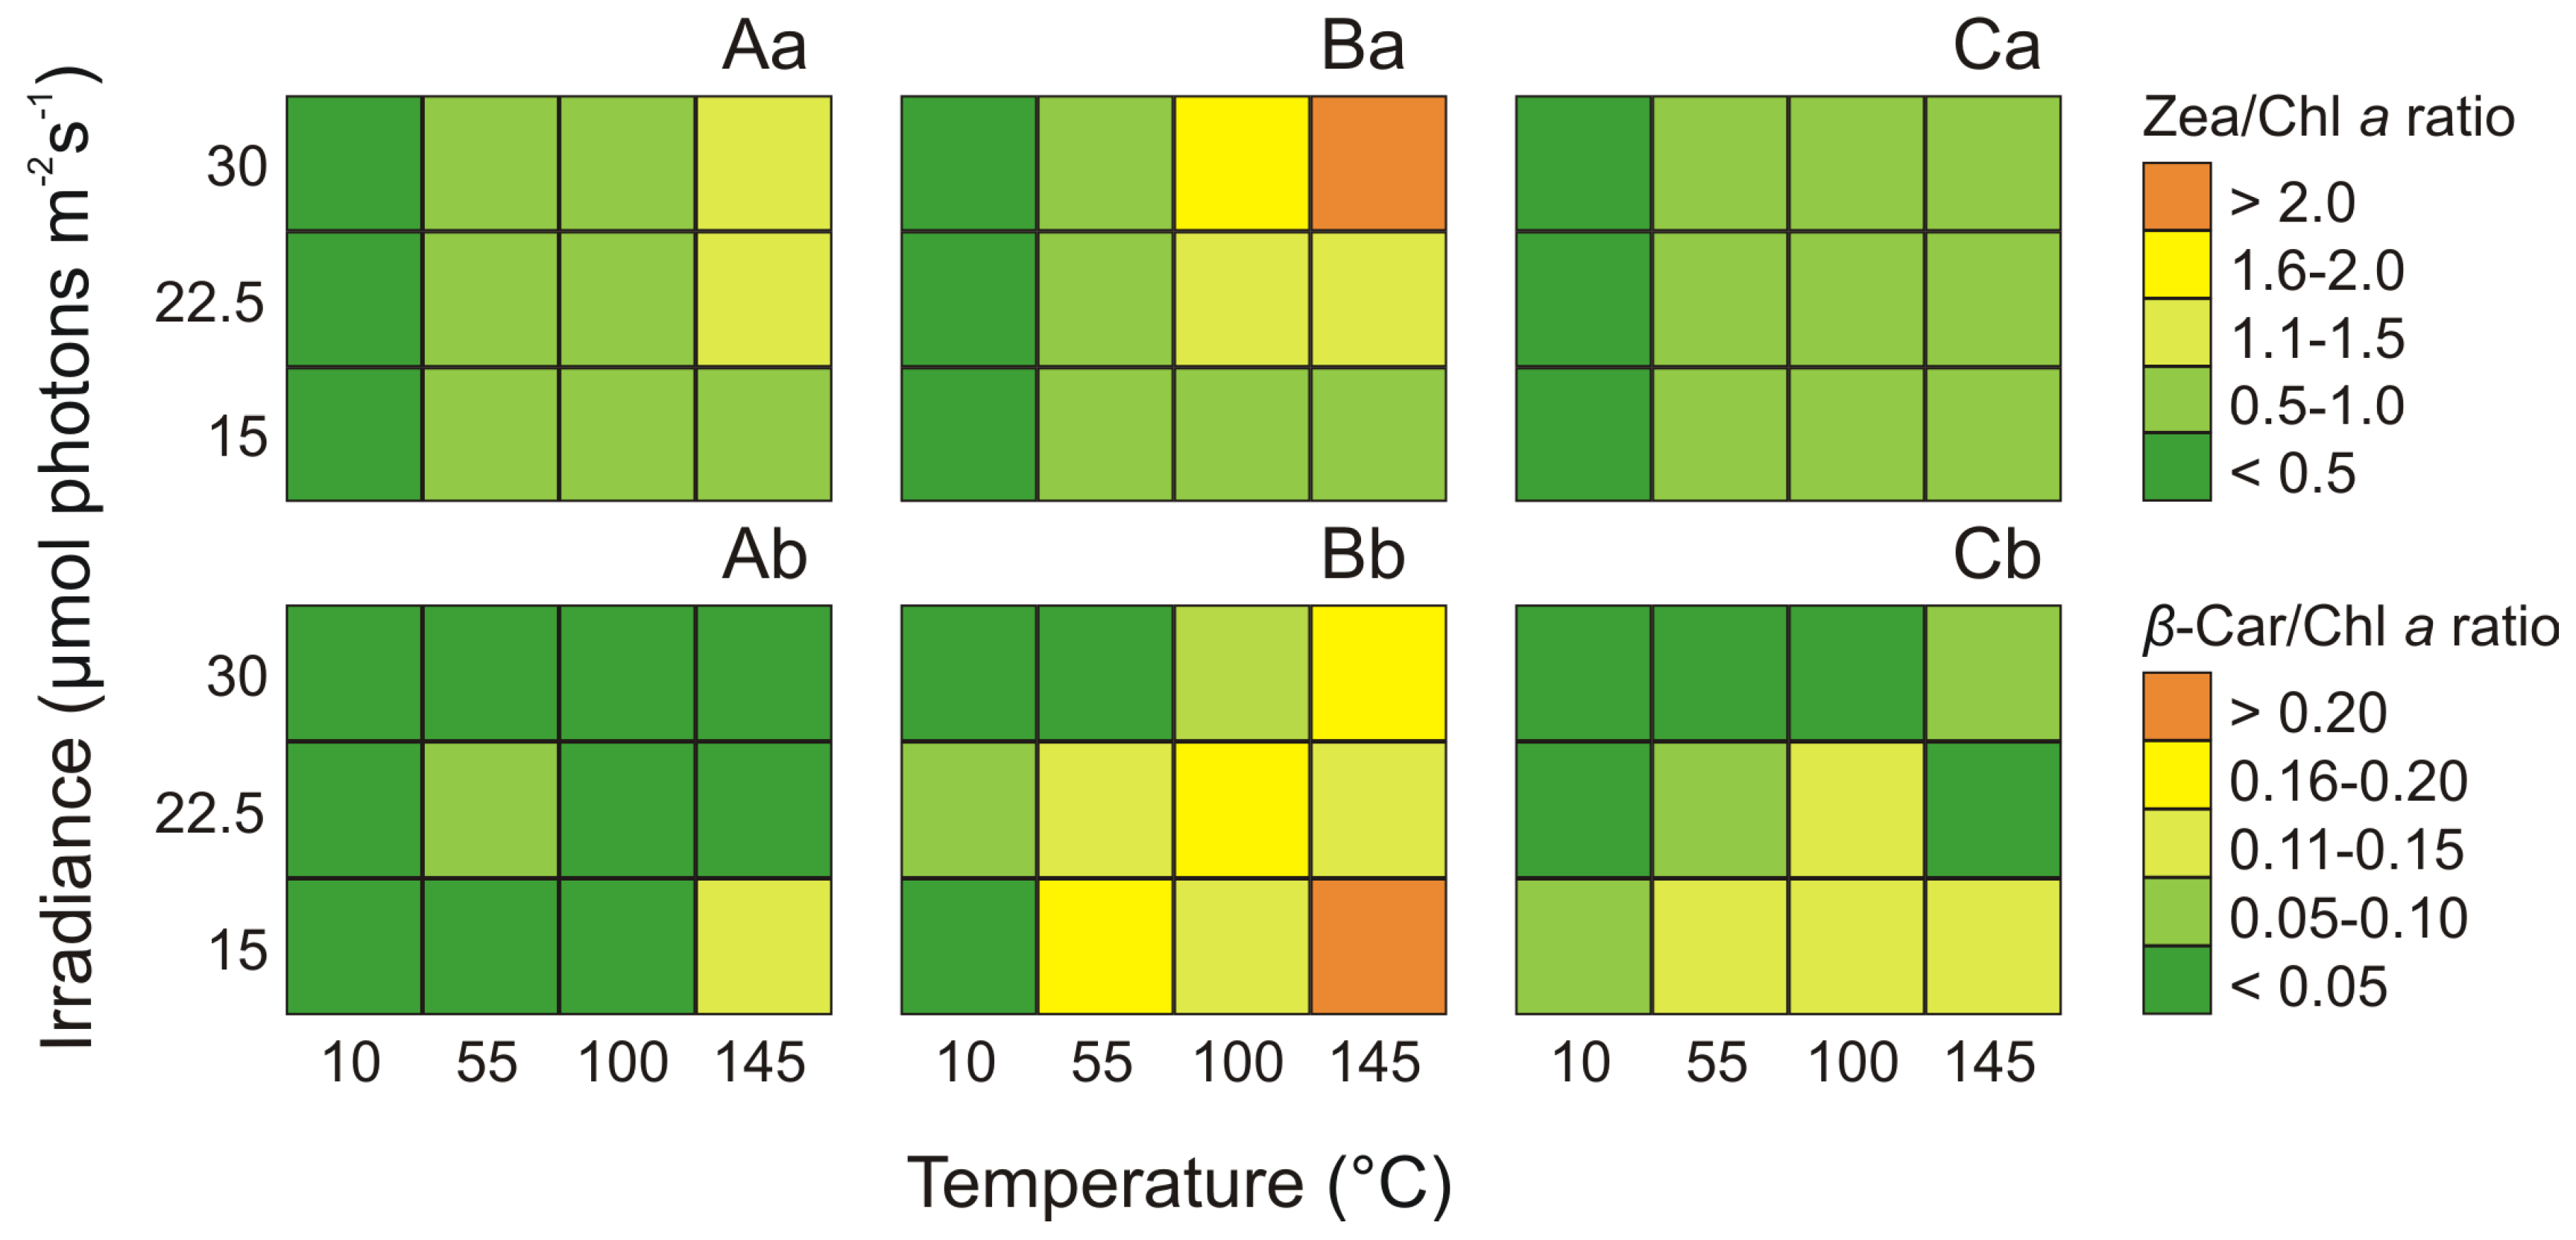
2.4. Effect of Irradiance and Temperature on Zeaxanthin and β-carotene

On the basis of the results, the effect of irradiance and temperature on changes in individual Car pigments in the cells of the picocyanobacterial phenotypes was determined. In all the Synechococcus sp. phenotypes, the cell-specific (pg·cell−1) pigment contents were environmentally driven (Figure 4). In the most of three tested phenotypes, the cell-specific concentrations of Zea (ANOVA, p < 0.001, p < 0.001, p < 0.001 for Type 1, Type 2, and Type 3a, respectively) and β-Car (ANOVA, p < 0.001, p < 0.01, p > 0.05 for Type 1, Type 2, and Type 3a, respectively) were affected by irradiance and temperature (Table S4). ANOVA indicated that in Type 1 and Type 3a, the effect of temperature on Zea was higher than the effect of irradiance. In contrast, the Zea content of Type 2 was more affected by irradiance than by temperature and by the interaction of both factors. It was also noted that for all tested phenotypes, effect of irradiance on β-Car was not statistically significant (Table S4).
The highest Zea content for Synechococcus sp. Type 2 and Type 3a (1.85 pg·cell−1 and 2.11 pg·cell−1, respectively) was noted at 100 μmol photons m−2 s−1 and 30 °C while the lowest value of this pigment were 1.02 pg·cell−1 for Type 2 and 0.53 pg·cell−1 for Type 3a at 55 μmol photons m−2 s−1 and 22.5 °C (Figure 4Ba,Ca). Moreover, the highest value of Zea content for Type 1 was found at irradiance 55 μmol photons m−2 s−1 and 15 °C (1.68 pg cell−1) while the minimum Zea content was obtained at 30 °C and 10 μmol photons m−2 s−1 (0.37 pg·cell−1; Figure 4Aa). The highest values of β-Car in Type 2 and Type 3a were noted at 55 μmol photons m−2 s−1 and 15 °C and 30 °C (0.32 pg·cell−1 and 0.40 pg·cell−1, respectively; Figure 4Bb,Cb). In turn, the lowest content of β-Car being found in Type 1 (0.12 pg·cell−1) at 145 μmol photons m−2 s−1 and 15 °C (Figure 4Ab).

2.5. Effect of Irradiance and Temperature on Pigments Ratios

Light and temperature as well as their interaction were found to significantly affect the Zea/Chl a ratio only in Synechococcus sp. Type 2 (ANOVA, p < 0.001) and the effect of light was higher than the effect of temperature and the interaction of both factors (Table S5). On the other hand, irradiance and temperature as well as their interaction significantly affected the β-Car/Chl a ratio in three Synechococcus sp. phenotypes (ANOVA, p < 0.001, p < 0.01, and p < 0.001, for Type 1, Type 2, and Type 3, respectively). ANOVA indicated that in Type 1 and Type 2, the effect of light on β-Car/Chl a ratio was higher than the effect of temperature. In contrast, the β-Car/Chl a ratio of Type 3a was more affected by temperature than by irradiance and by the interaction of both factors (Table S5). The highest values of Zea/Chl a ratio in Synechococcus sp. Type 2, at the 145 μmol photons m−2 s−1 and the temperature of 30 °C (2.3; Figure 5Ba) was about 11 times higher than the lowest values observed at the light intensity of 10 μmol photons m−2 s−1 and 30 °C. In turn, the lowest value of Zea/Chl a ratio was noted in Type 3a under the same light and temperature conditions (0.8; Figure 5Ca). Besides, the highest β-Car/Chl a ratio was also observed for Synechococcus sp. Type 2, which at the irradiance of 145 μmol photons m−2 s−1, and the temperature of 15 °C was 0.19 (Figure 5Bb). On the other hand, the lowest pigments ratio was recorded for Synechococcus sp. Type 3a, which under the same light and temperature conditions was 0.14 (Figure 5Cb).
Since Phyco pigments participate in the transfer of excitation energy to Chl a in photosystems, the analysis of changes in these pigments in relation to Chl a and Car was also performed (Table S6). It was found that irradiance and temperature as well as their interaction significantly affected the Phyco/Chl a ratio in Synechococcus sp. Type 1, Type 2, and Type 3 (ANOVA, p < 0.001, p < 0.001, and p < 0.01, respectively) and Phyco/Car ratio (ANOVA, p < 0.001, p < 0.001, and p < 0.001 for Type 1, Type 2, and Type 3a, respectively). ANOVA indicated that in Type 1 and Type 2, the effect of temperature on Phyco/Chl a ratio was higher than the effect of irradiance and the interaction of both factors. In turn, the Phyco/Chl a ratio of Type 3a was more affected by irradiance than by temperature. For Phyco/Car ratio the effect of temperature for three analyzed phenotypes was higher than the effect of irradiance and the interaction of both factors (Table S7).
The highest Phyco/Chl a ratio and Phyco/Car ratio were observed for Synechococcus sp. Type 1, which at the light intensity of 55 μmol photons m−2 s−1 and 10 μmol photons m−2 s−1 and the temperature of 30 °C was 16.5 and 62.5, respectively. Moreover, the highest values of these pigment ratio in Type 1 was about 33 times and 125 times, respectively higher than the lowest values observed at the light intensity of 100 μmol photons m−2 s−1 and 15 °C. Conversely, for Synechococcus sp. Type 3a the lowest values of Phyco/Chl a ratio as well as Phyco/Car ratio were found at 10 μmol photons m−2 s−1 and 22.5 °C (5.0 and 21.1, respectively) and were about 7 and 21 times higher, respectively, than the minimums obtained at PAR 100 μmol photons m−2 s−1 and 15 °C (Table S6).

3. Discussion

3.1. Occurrence and Abundance of Picocyanobacteria under Changing Irradiance and Temperature Conditions

Changes in the number of cells of photoautotrophic organisms inhabiting surface waters are the result of the interaction of several physical and chemical environmental factors [35]. Light and temperature play a key role in the occurrence of autotrophic picoplankton [32] and are the main factors causing the appearance of cyanobacteria both at depths and in coastal waters [36,37]. Additionally, light and temperature may be more important abiotic factors influencing the occurrence of picocyanobacteria than the availability of nutrients [36]. In spring, the number of autotrophic picoplankton cells begin to increase which is triggered by the temperature increase due to more intensive insolation of the surface water layers. Their growth reaches its maximum values during summer [36]. Gławdel et al. [38] showed that in the coastal waters of the southern Baltic Sea during the summer period, the autotrophic picoplankton, composed mainly of cyanobacteria in the total biomass exceeded even bacterioplankton. Three phenotypes of picocyanobacteria of the genus Synechococcus (Type 1, Type 2, and Type 3a) were isolated from the southern Baltic Sea. This area is characterized by large changes of environmental conditions. Autotrophic organisms living in such a variable ecosystem show the ability to quickly adapt which is essential for their survival. In this work, the influence of temperature and PAR irradiance on the autecology of the investigated phenotypes of Synechococcus: Type 1, Type 2, and Type 3a were demonstrated.
It was found that the increasing intensity of light had a negative effect on the cell concentration of the three studied phenotypes of Synechococcus sp. The number of picocyanobacteria cells increased as the PAR irradiance decreased, reaching the maximum value in the range of 10–55 μmol photons m−2 s−1 and the minimum value at 145 μmol photons m−2 s−1. Besides, it was shown that Synechococcus sp. Type 2 was the most susceptible to high light intensity. Its number of cells was more than 5-fold lower in high light compared to low light. On the other hand, the cell number decreased about 4-fold in the high light compared to low light for both Synechococcus sp. Type 1 and Type 3a. Literature data also indicated that picocyanobacteria of the genus Synechococcus in natural aquatic communities are adapted to low light and show maximum growth in the deeper layers of the euphotic zone [26,29,33,39,40]. The high abundance of autotrophic picoplankton was recorded even at a depth of 90 m [33]. This may indicate the ability of these organisms to survive seasonal changes and their fall into the aphotic zone. Besides, it is considered that Synechococcus sp. found in natural surface water layers may show photoinhibition of growth under high light [29,39,41] as well as the low rate of photosynthesis in the surface layer compared to greater depths [33,39]. On the other hand, Śliwińska-Wilczewska et al. [13] showed that the number of cells of green and brown phenotypes of Synechococcus sp. increased with the increase in light and was the highest in 280 μmol photons m−2 s−1. Furthermore, Kana and Glibert [42,43] showed that Synechococcus sp. could occur and grow in the irradiance reaching even 2000 μmol photons m−2 s−1. These studies confirmed that Synechococcus sp. can grow in maximally coastal waters due to their adaptation to high light intensities. Thus, picocyanobacteria of the genus Synechococcus can occur both at the near-surface layers and deeper waters. Furthermore, the ability of Synechococcus to grow in low light intensities and their low photoinhibition in exposure to high irradiance could give picocyanobacteria an advantage in changeable light-limited waters.
Temperature is also a very important factor controlling picocyanobacteria abundance in aquatic ecosystems [7,8,37]. Based on the conducted experiments, the influence of increasing temperature on the number of cells of the studied Synechococcus sp. phenotypes was found. The most favorable temperature conditions for the growth of Synechococcus sp. Type 1 and Type 2 were at 30 °C, while the highest number of cells for Type 3a was recorded at 22.5 °C. The most susceptible to high temperature was Synechococcus sp. Type 2. Its abundance was more than 5 times higher at 30 °C compared to the abundance recorded at 15 °C. On the other hand, for both Synechococcus sp. Type 1 and Type 3a, the increase in cell numbers along with the increase in temperature was about 4 times greater than that recorded at the lowest temperature. In laboratory studies, Jodłowska and Śliwińska [44] also found that increasing temperatures from 15 °C to 30 °C increased picocyanobacterial abundances. Similar observations were made by Śliwińska-Wilczewska et al. [13] who showed that with an increase in temperature from 10 °C to 25 °C, the number of cells of the green, red and brown Synechococcus sp. phenotype. was increased. Picocyanobacteria prefer high temperature for growth and their temperature optimum is higher than for eukaryotic phytoplankton organisms [37]. Furthermore, Paerl and Huisman [45] explained that the global temperature rise would stabilize or even inhibit the eukaryotic phytoplankton while the number of cyanobacteria would increase. Many cyanobacteria species demonstrate the highest increase in growth at 30−35 °C [46]. Noaman et al. [47] also demonstrated that the optimum temperature for growth of Synechococcus leopoliensis was 35 °C. An increase in temperature causes an increase in the number of picocyanobacteria cells, and their maximum occurrence was in the summer period when the water temperature is the highest [48]. This relationship is also apparent for the entire autotrophic picoplankton [49] and was confirmed by numerous studies [36,50,51]. Regarding climate change, picocyanobacteria of the genus Synechococcus achieves maximal growth rates at high temperatures and thus can be promoted by future global warming [7,8].
This study also showed that the analyzed phenotypes of Synechococcus sp.: Type 1, Type 2, and Type 3a has different growth rates. The highest growth rate was recorded for Synechococcus sp. Type 1. It was related to the smallest size obtained by these picocyanobacteria [44]. On the other hand, the lowest growth rate was observed for Synechococcus sp. Type 3a. Additionally, it was shown that this phenotype reached the largest cell size in cultures [44]. The research conducted by Stal et al. [52] on PE-rich and PC-rich phenotypes of Synechococcus also showed differences in the rate of cell growth depending on their size and picocyanobacteria with a larger cell size grew slower. Small cell size of Synechococcus Type 1 resulting in faster nutrient uptake allows picocyanobacteria to compete effectively with larger phytoplankton organisms in surface waters. On the other hand, increasing the cell volume of Synechococcus Type 3a may result in better light absorption at greater depths.

3.2. Changes in Pigments Content and Pigment Ratios under Different Irradiance and Temperature Conditions

Cyanobacteria living in coastal waters are often exposed to changes in light and temperature conditions. These factors influence the content of cyanobacterial photosynthetic pigments in aquatic ecosystems [53,54,55,56,57]. The factorial experiments performed in this study showed a negative effect of the increasing intensity of light on the cell-specific Chl a content for the three examined phenotypes of picocyanobacteria, obtaining the highest content at 10 μmol photons m−2 s−1 and the lowest for 145 μmol photons m−2 s−1. The conducted factorial experiments also showed a statistically significant influence of temperature on the cell-specific Chl a content for the examined phenotypes. The highest concentration of this pigment was observed at 30 °C for Synechococcus sp. Type 2 and at 15 °C for Synechococcus sp. Type 1 and Type 3a. The greatest decrease in the cell-specific Chl a content was noted for Synechococcus sp. Type 2, which under minimal conditions was about 7 times lower than the recorded under maximum values. On the other hand, Synechococcus sp. Type 3a showed the highest resistance to high values of irradiance, and its decrease in the content of Chl a in cells under minimal conditions was about 5.5 times higher than the recorded maximum values. Kana and Glibert [43] also showed that the concentration of this pigment was the highest for Synechococcus cells adapted to low light. On the other hand, the greatest decrease in Chl a content was recorded in the light greater than 700 μmol photons m−2 s−1 [42]. High content of Chl a in low light may indicate that picocyanobacteria of the genus Synechococcus may occur in highly shaded waters [52] and even under conditions of extreme radiation deficiency [58].
High light intensity is an unfavorable environmental factor for many photoautotrophic organisms [59]. However, cyanobacteria living in an environment with a high light intensity developed a defense strategy consisting of special pigmentation of the cells [39,60,61]. Convergence between the accumulation of Car pigments under the influence of high light intensity allows them to be assigned a protective role. The highest content of Zea and β-Car was recorded for Synechococcus sp. Type 3a. Zea is an accessory pigment at low light intensities but becomes dominant for cells growing under higher ones [16]. Our research showed that for the examined cyanobacteria cells the amount of Zea was much higher than that of β-Car. The study found that the Zea content for Synechococcus sp. Type 1, Type 2, and Type 3a was 93%, 89%, and 87% of the sum of Car pigments, respectively. Guillard et al. [62] observed that Zea may constitute as much as 50−81% of Car pigments for cyanobacteria of the genus Synechococcus. The high cell-specific Zea content in the Synechococcus sp. is related to the existence of these organisms in surface sea waters and places of exposure to high levels of solar radiation [62,63]. The cell-specific Car content of the tested picocyanobacteria phenotypes changed significantly in response to irradiance increase, which suggests that these organisms reorganize their pigments in order to protect against the unfavorable environmental conditions.
In this study, the factorial experiments carried out showed a negative effect of irradiance on the cell-specific PE, PC, and APC as well as the total sum of Phyco pigments content for the three studied phenotypes of the genus Synechococcus. Moreover, it was shown that the cell-specific content of these pigments increased with increasing temperature for Type 1 and Type 2. In turn, for Type 3a, a negative effect of increasing temperature on Phyco content was noted. On the basis of the conducted analyzes, it was found that the conditions under which the examined phenotypes of picocyanobacteria achieved the highest concentrations of the total sum of cell-specific Phyco content were at low light intensity of 10 μmol photons m−2 s−1 and high temperatures ranging between 22.5 and 30 °C. The greatest decrease in Phyco pigments (about 30-fold) in cyanobacteria cells under the influence of increasing light intensity was noted for Synechococcus Type 1. However, the least susceptible to high irradiance was Synechococcus Type 3a, with a 13-fold decrease in Phyco pigments. Among all Phyco pigments present in picocyanobacteria cells, the highest content of PE was observed for Synechococcus Type 2, whereas for Synechococcus Type 1 PC was the dominant pigment. A study by Kana and Glibert [42,43] also showed that the concentration of PE and PC were dependent on the intensity of light. The concentration of PC is related to the number of phycobilisomes [42]. The greatest increase of PC in cells was observed in low light, suggesting a change in phycobilisome numbers in growth-limiting light [42]. Cyanobacteria of the genus Synechococcus, depending on the light, can change their number and size of phycobilisomes and this may be associated with acclimatization to different light levels [42]. Photoaclimatization is visible when there is a reduction in photosynthetic pigments with increasing irradiance [64,65,66]. Hence, it may be concluded that the studied Synechococcus sp. phenotypes have a high ability to photoacclimatize to changing environmental conditions.
Based on conducted experiments, the highest Zea/Chl a ratio and β-Car/Chl a ratio was noted for Synechococcus sp. Type 2. On the other hand, the lowest ratios of the discussed pigments were recorded for Synechococcus sp. Type 3a. Tang and Vincent [67] showed that the content of Car and Chl a increases with increasing temperature. However, carotenoids grow more slowly with temperature, therefore the Car/Chl a ratio decreases with temperature [67]. Most cyanobacteria show photoinhibition at low temperatures [68], and an increase in the Car/Chl a ratio at low temperature may result in an increase in photoprotective pigments such as carotenoids [69,70]. Studies have shown that a high Car/Chl a ratio is characteristic for surface water populations [16]. In addition, Paerl et al. [71] and Paerl [72] suggested that a high Car/Chl a ratio has a dual role in cells as it maintains high photosynthetic light absorption capacity and protects cells from photooxidation which may explain why the deeper-living PE-rich Synechococcus sp. Type 2 had the highest Zea/Chl a ratio and β-Car/Chl a ratio of all studied phenotypes. This study also showed an increase in the Phyco/Chl a ratio and Phyco/Car ratio in the cells of the investigated cyanobacterial phenotypes with a decrease of irradiance and an increase of temperature. It is related to the advantage of Phyco pigments over Chl a and Car pigments for the tested picocyanobacteria phenotypes at low light intensity. Furthermore, a change in color from green, red and brown at low irradiances to bright yellow at high light levels was also observed for three phenotypes of cyanobacteria of the genus Synechococcus (Type 1, Type 2, and type 3a, respectively). A clear difference in the color of picocyanobacteria was associated with a change of the proportions between the pigments. At low light intensity, picocyanobacteria phenotypes showed the maximum content of Phyco and Chl a pigments. At the highest irradiance, the share of the Car pigments, mainly Zea, increased significantly in picocyanobacterial cells. Similar tendencies were observed by Kana and Glibert [16,42] for picocyanobacteria of the genus Synechococcus. Picocyanobacteria can acclimate to different light intensities by changing the content of pigments, especially Phyco and Chl a [73,74,75]. In this work, we observed the effect of light intensity and temperature on the cell-specific pigment content of all studied picocyanobacterial phenotypes. The concentration of Phyco and Chl a was the highest for picocyanobacteria cells acclimated to low light and decreased with increasing irradiance. Inverse relationships were noted for the cell-specific Car content. The high content of Phyco pigments and Chl a observed in our work indicated that the tested picocyanobacteria phenotypes are well adapted to low light conditions and high temperatures. Besides, the highest differences in the Phyco/Chl a ratio and Phyco/Car ratio were observed in Synechococcus sp. Type 1, which may confirm that this phenotype showed the best photoaclimatization abilities of all analyzed organisms. Because this PC-rich phenotype occurs in more productive waters [18,34,76], this observation may be important in the era of climate change and the associated mass occurrence of Synechococcus sp. in many places around the world [8,9]. It should be emphasized that Flombaum et al. [8] predicted that the number of Synechococcus sp. cells would increase by 14% at the end of the 21st century.

4. Materials and Methods

4.1. Culture Conditions

Three different phenotypes of picocyanobacteria from the genus Synechococcus were examined: BA-120 (Type 2), BA-124 (Type 1), and BA-132 (Type 3a). The strains were isolated from the coastal zone of the Gulf of Gdansk (the southern Baltic Sea) and maintained as unialgal cultures in the Culture Collection of Baltic Algae (CCBA) at the Institute of Oceanography, University of Gdańsk, Poland. Cyanobacteria were cultured on the BG-11 mineral medium [77], which was prepared with water from the Baltic Sea (salinity 8), which was filtered using 0.45 µm filters (Macherey-Nagel MN GF-5, Dueren, Germany) and autoclaved.
The cultures of cyanobacteria were acclimatized to the new conditions corresponding to the incubation conditions of the proper culture. After a week, the culture, which was in the logarithmic growth phase, was used to establish the proper, experimental culture. After the acclimatization time, proper cultures with known initial cell numbers were prepared. For this purpose, a specific volume of inoculum was taken from the actively growing acclimatization culture and added to the sterile media. The optimal number of the initial proper culture was set at 107 cells in 1 mL of the medium. The inoculum selected in this way allowed for a constant increase in the number of cyanobacterial cells without inhibiting logarithmic population growth. The incubation of cultures lasted 14 days. After that time, for three phenotypes of cyanobacteria of the genus Synechococcus the cell concentration, the growth rate and photosynthetic pigments were determined. Each variant of the experiment was conducted in three repetitions and the results of the experiments were presented as an average of three measurements.
The cultures of the examined cyanobacterial strains were carried out in thermostat under the following temperature conditions (°C): 15, 22.5, and 30. The effect of PAR irradiance was tested in photoperiod (16 h of light and 8 h of darkness) at the following values (μmol photons m−2 s−1): 10, 55, 100, and 145. 36 W Philips fluorescent lamps (Philips Lighting, Amsterdam, The Netherlands) were used as light sources and two additional 120 W halogen lamps by OSRAM (Osram Licht AG, Berlin, Germany) were used for the highest irradiance (145 μmol photons m−2 s−1). Measurements of PAR irradiance were made with Li-Cor (Lincoln, NE, USA), model LI-189 with cosine collector.
It is worth mentioning here that a change in the color of the cultures of three phenotypes of picocyanobacteria Synechococcus sp. under different light was observed. The phenotypes were shown to be dark green, red and brown at low irradiance (for Type 1, Type 2, and type 3a, respectively), while in the high light their color turned to bright yellow. It was also shown that the examined phenotypes showed differences in PAR absorption spectra when exposed to low and high light (Figure 6).

4.2. Calculation of Cell Density and Growth Rates

Cell density was calculated using linear regression models based on cell concentration (N mL−1) and optical density (OD) at 750 nm [44]. Calculation of the cell number was conducted using the procedure described by Guillard and Sieracki [78], with a light microscope (Nikon Eclipse 80i, Nikon, Tokyo, Japan) and the Bürker counting chamber. To determine the growth rate of cyanobacteria, cell counts were conducted in cultures at two-day intervals from inoculation to the 14th day of culture. Based on these data the parameters characterizing the growth of cyanobacterial cells in the logarithmic phase: growth rate coefficient and cell doubling time were determined [78].

4.3. Determination of the Chlorophyll and Carotenoids Content

The concentration of photosynthetic pigments of analyzed picocyanobacteria was measured by the HPLC method. After 14 days of incubation, 40 mL of culture was filtered using 0.45 µm filters (Macherey-Nagel MN GF-5) to separate the picocyanobacteria cells from the medium. Chl a and Car were extracted from the picocyanobacteria cells with 90% acetone (V = 5 mL) and sonicated for 2 min. Then, the test-tube with the extract was held in the dark for 2 h at −80 °C. After 2 h, the pigment extract was centrifuged at 10,000 rpm for 5 min to remove filter particles (Sigma 2-16P, Osterode am Harz, Germany).
Chromatographic analyses were carried out using HPLC equipment of Waters company (Waters Chromatography Europe BV, Etten-Leur, The Netherlands) equipped with: Spectro Vision FD-300 fluorescence detector, Waters 486 absorption detector, Pharmacia autosampler LKB 2157, Waters Millennium Chromatography software. Measurements of pigment absorption were taken at 440 nm. Pigment separation was carried out according to a method proposed by Llewellyn and Mantour [79], with modifications [80] at room temperature on Vydac 201TP (C18) column 250 mm long. As an eluent A; 0.5 M ammonium acetate/methanol (20/80) was used and as eluent B; acetone/methanol (20/80) was used. Before injection of pigments extract (40 µL) the column was conditioned using an isocratic flow of eluents (40% A and 60% B) for 15 min. The analysis was performed at a flow rate of 1.0 mL min−1. Chl a, Zea, and β-Car standards were used for the qualitative and quantitative determination of pigments (The International Agency for 14C Determination, VKI, Hørsholm, Denmark). The pigments present in the cells of cyanobacteria strains of the genus Synechococcus were identified based on retention times and absorbance spectrum, which were compared with the standards. Calibration curves were plotted for each standard used to quantify assimilation pigments.

4.4. Determination of the Phycobiliproteins Content

The 40 mL of the test material was filtered through a 0.45 µm filter (Macherey-Nagel MN GF-5) and stored in −80 °C. Reagent for phycobiliprotein extraction contained 0.25 M Trizma Base, 10 mM binary EDTA and 2 mg mL−1 lysozyme. A pH of 5.5 was obtained by acidifying with concentrated HCl. The filters were homogenized in 5 mL of reagent, sonicated for 5 min and incubated first in the dark at 37 °C for about 2 h, then at 1.5 °C for about 20 h. After this time the pigment extract was centrifuged in experimental flasks for 10 min, at 10,000 rpm. Absorption measurements in 1 cm glass cuvettes on Beckman spectrophotometer (Indianapolis, IN, USA), model DU 530, at wavelengths (nm): 565, 620, 650 and 750, were conducted. The pigment contents: PE, PC, and APC were calculated based on Bennett and Bogorad [81] and Bryant et al. [82].

4.5. Statistical Analyses

To test the influence of a single factor as well as an interplay of factors on studied parameters the two-way ANOVA was used. Moreover, to determine the significance of treatment levels a post hoc test (Tukey’s HSD) was conducted. The impact of every environmental agent, as well as an interplay of factors on studied parameters, were measured using the method of orthogonal polynomial tables as described by Fisher and Yates [83]. Furthermore, to describe the connection of the factors and studied parameters regression equations were generated. Data are described as the mean ± standard deviation (SD). Levels of significance were * p < 0.05, ** p < 0.01, and *** p < 0.001. The statistical analyses were executed using the Statistica® 13.1 software (StatSoft Polska, Cracow, Poland).

5. Conclusions

In this work, we found that the three analyzed phenotypes of the genus Synechococcus have diverse irradiance and temperature preferences. This, coupled with their high photoacclimation capabilities give them powerful tools to win the competition for the marine resources and provide them opportunity to dominate the area, at least as long as sufficient nutrient amounts are available. In almost all conditions the highest rate of growth was recorded for the Synechococcus sp. Type 1 which is the most competitive type. It prefers warmer waters −22.5 °C and above, but it produces the least nominal amounts of Car which is a probable cause of equalisation of the growth rates between the Type 1 and Type 2 at the highest irradiances and at the mentioned temperatures over 22 °C. The lowest growth rates were observed for the Type 3a for all variants. However, Type 3a was recognized to be less temperature sensitive and rather light-driven. Moreover, at low light and low temperature the highest pigment content was observed within the cells Type 3a which may suggest higher tolerance for colder waters such as tested here 15 °C or even below. The highest total pigment content per cell was recorded at 10 μmol photons m−2 s−1 at all temperature variants with the clear dominance of phycobilins among all the pigments. The high pigment content observed in picocyanobacteria cells proves that they may adapt and live in the deeper layers of the euphotic zone. The highest amounts of carotenoids were produced by Type 2. This may imply lower tolerance of this type to higher irradiance. Our results showed that the best photoaclimation abilities of all analyzed Synechococcus sp. types is Type 1 with the highest differences in the Phyco/Chl a and Phyco/Car ratios. One of our striking observations is a significant difference between the physiological responses of different Synechococcus sp. phenotypes to changeable environmental conditions. Thus, this work would be an important link in forecasting future changes in the occurrence of these organisms in the context of global warming.

Supplementary Materials

The following are available online at https://www.mdpi.com/2073-4409/9/9/2030/s1, Table S1: Two-way factorial ANOVA of cells concentration measured in Synechococcus sp. Type 1, Type 2, and Type 3a growing at different temperatures (°C) and irradiance (μmol photons m−2 s−1): df—degrees of freedom; F—Fisher’s F-test statistic; Mss—mean sum of squares; Ss—sum of squares. Levels of significance were: * p < 0.05; ** p < 0.01; *** p < 0.001, Table S2: Two-way factorial ANOVA of cell-specific Chl a, Phyco, and Car content measured in Synechococcus sp. Type 1, Type 2, and Type 3a growing at different temperatures (°C) and irradiance (μmol photons m−2 s−1): df—degrees of freedom; F—Fisher’s F-test statistic; Mss—mean sum of squares; Ss—sum of squares. Levels of significance were: * p < 0.05; ** p < 0.01; *** p < 0.001, Table S3: Two-way factorial ANOVA of cell-specific PE, PC, and APC content measured in Synechococcus sp. Type 1, Type 2, and Type 3a growing at different temperatures (°C) and irradiance (μmol photons m−2 s−1): df—degrees of freedom; F—Fisher’s F-test statistic; Mss—mean sum of squares; Ss—sum of squares. Levels of significance were: * p < 0.05; ** p < 0.01; *** p < 0.001, Table S4: Two-way factorial ANOVA of cell-specific Zea and β-Car content measured in Synechococcus sp. Type 1, Type 2, and Type 3a growing at different temperatures (°C) and irradiance (μmol photons m−2 s−1): df—degrees of freedom; F—Fisher’s F-test statistic; Mss—mean sum of squares; Ss—sum of squares. Levels of significance were: * p < 0.05; ** p < 0.01; *** p < 0.001. Table S5: Two-way factorial ANOVA of Zea/Chl a ratio and β-Car/Chl a ratio measured in Synechococcus sp. Type 1, Type 2, and Type 3a growing at different temperatures (°C) and irradiance (μmol photons m−2 s−1): df—degrees of freedom; F—Fisher’s F-test statistic; Mss—mean sum of squares; Ss—sum of squares. Levels of significance were: * p < 0.05; ** p < 0.01; *** p < 0.001, Table S6: The Phyco/Chl a ratios and Phyco/Car ratios obtained after 14 days of experiment for three phenotypes of Synechococcus sp.: Type 1 (A), Type 2 (B), Type 3a (C) under different temperature (°C) and light (μmol photons m−2 s−1) conditions, Table S7: Two-way factorial ANOVA of Phyco/Chl a ratio and Phyco/Car ratio measured in Synechococcus sp. Type 1, Type 2, and Type 3a growing at different temperatures (°C) and irradiance (μmol photons m−2 s−1): df—degrees of freedom; F—Fisher’s F-test statistic; Mss—mean sum of squares; Ss—sum of squares. Levels of significance were: * p < 0.05; ** p < 0.01; *** p < 0.001.

Author Contributions

Conceptualization, S.Ś.-W., Z.K., K.W. and M.K.; methodology, S.Ś.-W., Z.K., K.W. and M.K.; formal analysis, S.Ś.-W., Z.K., K.W. and M.K.; investigation, S.Ś.-W., Z.K., K.W. and M.K.; data curation, S.Ś.-W., Z.K., K.W. and M.K.; writing—original draft preparation, S.Ś.-W., Z.K., K.W. and M.K.; supervision, S.Ś.-W. All authors have read and agreed to the published version of the manuscript.

Funding

This research was funded by BMN grant number 539-O140-B416-20 and NCN PRELUDIUM 17 (UMO-2019/33/N/ST10/00585).

Acknowledgments

The authors would like to thank the Editor and anonymous Reviewers for their valuable comments and suggestions to improve the quality of the paper.

Conflicts of Interest

The authors declare no conflict of interest. The funders had a role in the design of the study; in the collection, analyses, and interpretation of data, and in the decision to publish the results.

References

  1. Johnson, P.W.; Sieburth, J.M. Chroococcoid cyanobacteria in the sea: A ubiquitous and diverse phototrophic biomass. Limnol. Oceanogr. 1979, 24, 928–935. [Google Scholar] [CrossRef]
  2. Waterbury, J.B.; Watson, S.W.; Guillard, R.R.L.; Brand, L.E. Widespread occurrence of a unicellular, marine, planktonic cyanobacterium. Nature 1979, 277, 293–294. [Google Scholar] [CrossRef]
  3. Stockner, J.G. Phototrophic picoplankton: An overview from marine and freshwater ecosystems. Limnol. Oceanogr. 1988, 33, 765–775. [Google Scholar] [CrossRef]
  4. Jasser, I.; Lehtovaara, A.; Arvola, L. Seasonality and coexistence of autotrophic pico- and nanoplankton and zooplankton in three boreal lakes. Internationale Vereinigung für Theoretische und Angewandte Limnologie Verhandlungen 2006, 29, 1413–1416. [Google Scholar] [CrossRef]
  5. Mühling, M.; Woolven-Allen, J.; Murrell, J.C.; Joint, I. Improved group-specific PCR primers for denaturing gradient gel electrophoresis analysis of the genetic diversity of complex microbial communities. ISME J. 2008, 2, 379–392. [Google Scholar] [CrossRef]
  6. Guidi, L.; Chaffron, S.; Bittner, L.; Eveillard, D.; Larhlimi, A.; Roux, S.; Darzi, Y.; Audic, S.; Berline, L.; Brum, J.R.; et al. Plankton networks driving carbon export in the oligotrophic ocean. Nature 2016, 532, 465–470. [Google Scholar] [CrossRef] [Green Version]
  7. Worden, A.Z.; Wilken, S. A plankton bloom shifts as the ocean warms. Science 2016, 354, 287–288. [Google Scholar] [CrossRef]
  8. Flombaum, P.; Gallegos, J.L.; Gordillo, R.A.; Rincon, J.; Zabala, L.L.; Jiao, N.; Karl, D.M.; Li, W.K.; Lomas, M.W.; Veneziano, D. Present and future global distributions of the marine Cyanobacteria Prochlorococcus and Synechococcus. Proc. Natl. Acad. Sci. USA 2013, 110, 9824–9829. [Google Scholar] [CrossRef] [Green Version]
  9. Li, J.; Chen, Z.; Jing, Z.; Zhou, L.; Li, G.; Ke, Z.; Jiang, X.; Liu, J.; Liu, H.; Tan, Y. Synechococcus bloom in the Pearl River Estuary and adjacent coastal area–With special focus on flooding during wet seasons. Sci. Total Environ. 2019, 692, 769–783. [Google Scholar] [CrossRef]
  10. Oziel, L.; Neukermans, G.; Ardyna, M.; Lancelot, C.; Tison, J.-L.; Wassmann, P.; Sirven, J.; Ruiz-Pino, D.; Gascard, J.-C. Role for Atlantic inflows and sea ice loss on shifting phytoplankton blooms in the Barents Sea. J. Geophys. Res. Oceans. 2017, 122, 5121–5139. [Google Scholar] [CrossRef] [Green Version]
  11. Paulsen, M.L.; Doré, H.; Garczarek, L.; Seuthe, L.; Müller, O.; Sandaa, R.A.; Bratbak, G.; Larsen, A. Synechococcus in the Atlantic Gateway to the Arctic Ocean. Front. Mar. Sci. 2016, 3, 191. [Google Scholar] [CrossRef] [Green Version]
  12. Dutkiewicz, S.; Morris, J.J.; Follows, M.J.; Scott, J.; Levitan, O.; Dyhrman, S.T.; Berman-Frank, I. Impact of ocean acidification on the structure of future phytoplankton communities. Nat. Clim. Change 2015, 5, 1002–1006. [Google Scholar] [CrossRef]
  13. Śliwińska-Wilczewska, S.; Cieszyńska, A.; Maculewicz, J.; Latała, A. Ecophysiological characteristics of red, green, and brown strains of the Baltic picocyanobacterium Synechococcus sp.-a laboratory study. Biogeosciences 2018, 15, 6257–6276. [Google Scholar] [CrossRef] [Green Version]
  14. Stransky, H.; Hager, A. Das Carotinoid-muster und die Verbreitung des lichtinduzierten Xanthophyllcyclus in verschiedenen Algenklassen. Cyanophyceae und Rhodophyceae. Arch. Mikrobiol. 1970, 72, 84–96. [Google Scholar] [CrossRef] [PubMed]
  15. Schlüter, L.; Lauridsen, T.L.; Krogh, G.; Jørgensen, T. Identification and quantification of phytoplankton groups in lakes using new pigment ratios―a comparison between pigment analysis by HPLC and microscopy. Freshw. Biol. 2006, 51, 1474–1485. [Google Scholar] [CrossRef]
  16. Kana, T.M.; Glibert, P.M. Zeaxanthin and B-carotene in Synechococcus WH7803 respond differently to irradiance. Limnol. Oceanogr. 1988, 33, 1623–1627. [Google Scholar]
  17. Ostrowska, M.; Woźniak, B.; Dera, J. Modelled quantum yields and energy efficiency of fluorescence, photosynthesis and heat production by phytoplankton in the World Ocean. Oceanologia 2012, 54, 565–610. [Google Scholar] [CrossRef]
  18. Hauschild, C.A.; McMurter, H.J.G.; Pick, F.R. Effect of spectral quality on growth and pigmentation of picocyanobacteria. J. Phycol. 1991, 27, 698–702. [Google Scholar] [CrossRef]
  19. Cornejo, J.; Beale, S.I. Phycobilin biosynthetic reactions in extracts of cyanobacteria. Photosynth. Res. 1997, 51, 223–230. [Google Scholar] [CrossRef]
  20. Śliwińska-Wilczewska, S.; Maculewicz, J.; Barreiro Felpeto, A.; Latała, A. Allelopathic and bloom-forming picocyanobacteria in a changing world. Toxins 2018, 10, 48. [Google Scholar] [CrossRef] [Green Version]
  21. Konarzewska, Z.; Śliwińska-Wilczewska, S.; Barreiro Felpeto, A.; Vasconcelos, V.; Latała, A. Assessment of the Allelochemical Activity and Biochemical Profile of Different Phenotypes of Picocyanobacteria from the Genus Synechococcus. Mar. Drugs 2020, 18, 179. [Google Scholar] [CrossRef] [PubMed] [Green Version]
  22. Six, C.; Thomas, J.C.; Garczarek, L.; Ostrowski, M.; Dufresne, A.; Blot, N.; Scanlan, D.J.; Partensky, F. Diversity and evolution of phycobilisomes in marine Synechococcus spp.: A comparative genomics study. Genome Biol. 2007, 8, R259. [Google Scholar] [CrossRef] [PubMed]
  23. Haverkamp, T.H.; Schouten, D.; Doeleman, M.; Wollenzien, U.; Huisman, J.; Stal, L.J. Colorful microdiversity of Synechococcus strains (picocyanobacteria) isolated from the Baltic Sea. ISME J. 2009, 3, 34–408. [Google Scholar] [CrossRef] [PubMed]
  24. Callieri, C. Synechococcus plasticity under environmental changes. FEMS Microbiol. Lett. 2017, 364, fnx229. [Google Scholar] [CrossRef]
  25. Roy, S.; Llewellyn, C.; Egeland, E.S.; Johnsen, G. Phytoplankton Pigments: Characterization, Chemotaxonomy and Applications in Oceanography; Cambridge University Press: Cambridge, UK, 2011; p. 784. [Google Scholar]
  26. Morris, I.; Glover, H. Physiology of photosynthesis by marine coccoid Cyanobacteria -some ecological implications. Limnol. Oceanogr. 1981, 26, 957–961. [Google Scholar] [CrossRef]
  27. Antia, N.J.; Cheng, J.Y. The survival of axenic cultures of marine planktonic algae from prolonged exposure to darkness at 20 °C. Phycologia 1970, 9, 179–183. [Google Scholar] [CrossRef]
  28. Antia, N.J. Effects of temperature on the darkness survival of marine microplanktonic algae. Microb. Ecol. 1976, 3, 41–54. [Google Scholar] [CrossRef]
  29. Platt, T.; Subba-Rao, D.V.; Irwin, B. Photosynthesis of picoplankton in the oligotrophic ocean. Nature 1983, 301, 702–704. [Google Scholar] [CrossRef]
  30. Cai, H.; Wang, K.; Huang, S.; Jiao, N.; Chen, F. Distinct patterns of picocyanobacterial communities in winter and summer in the Chesapeake Bay. Appl. Environ. Microbiol. 2010, 76, 2955–2960. [Google Scholar] [CrossRef] [Green Version]
  31. Ernst, A. Cyanobacterial picoplankton from Lake Constance. Isolation by fluorescence characteristics. J. Plankton Res. 1991, 13, 1307–1312. [Google Scholar] [CrossRef]
  32. Jasser, I.; Callieri, C. Picocyanobacteria. In Handbook on Cyanobacterial Monitoring and Cyanotoxin Analysis; Meriluoto, J., Spoof, L., Codd, G.A., Eds.; John Wiley & Sons, Ltd.: Hoboken, NJ, USA, 2017; pp. 19–27. [Google Scholar]
  33. Glover, H.E. The physiology and ecology of marine Cyanobacteria, Synechococcus spp. In Advances in Applied Microbiology; Jannasch, H.W., Williams Leb, P.J., Eds.; Academic Press: New York, USA, 1985; pp. 49–107. [Google Scholar]
  34. Vörös, L.; Callieri, C.; Katalin, V.; Bertoni, R. Freshwater picocyanobacteria along a trophic gradient and light quality range. Hydrobiologia 1998, 369, 117–125. [Google Scholar] [CrossRef]
  35. Wang, C.; Wang, Z.; Wang, P.; Zhang, S. Multiple effects of environmental factors on algal growth and nutrient thresholds for harmful algal blooms: Application of response surface methodology. Environ. Model. Assess. 2016, 21, 247–259. [Google Scholar] [CrossRef]
  36. Jasser, I.; Arvola, L. Potential effects of abiotic factors on the abundance of autotrophic picoplankton in four boreal lakes. J. Plankton Res. 2003, 25, 873–883. [Google Scholar] [CrossRef] [Green Version]
  37. Jasser, I. The relationship between autotrophic picoplankton (APP)-the smallest autotrophic component of food web and the trophic status and depth of lakes. Ecohydrol. Hydrobiol. 2006, 6, 69–77. [Google Scholar] [CrossRef]
  38. Gławdel, M.; Mackiewicz, T.; Witek, Z. Composition and abundance of picoplankton in the coastal zone of the Gulf of Gdańsk. Oceanol. Stud. 1999, 28, 17–30. [Google Scholar]
  39. Barlow, R.G.; Alberte, R.S. Photosynthetic characteristic of phycoerythrin-containing marine Synechococcus spp. I. Responses to growth photon flux density. Mar. Biol. 1985, 86, 63–74. [Google Scholar] [CrossRef]
  40. Glover, H.E.; Campbell, L.; Prézelin, B.B. Contribution of Synechococcus spp. to size-fraction primary productivity in three waters masses in the Northwest Atlantic Ocean. Mar. Biol. 1986, 91, 193–203. [Google Scholar] [CrossRef]
  41. Campbell, L.; Carpenter, E.J. Diel patterns of cell division in marine Synechococcus spp. (Cyanobacteria): Use of the frequency of dividing cell technique to measure growth rate. Mar. Ecol. Prog. Ser. 1986, 32, 139–148. [Google Scholar] [CrossRef]
  42. Kana, T.M.; Glibert, P.M. Effect of irradiances up to 2000 μmol E·m−2·s−1 on marine Synechococcus WH7803-I. Growth, pigmentation, and cell composition. Deep-Sea Res. 1987, 34, 479–495. [Google Scholar] [CrossRef]
  43. Kana, T.M.; Glibert, P.M. Effect of irradiances up to 2000 μmol E·m−2·s−1 on marine Synechococcus WH7803-II. Photosynthetic responses and mechanisms. Deep-Sea Res. 1987, 34, 497–516. [Google Scholar] [CrossRef]
  44. Jodłowska, S.; Śliwińska, S. Effects of light intensity and temperature on the photosynthetic irradiance response curves and chlorophyll fluorescence in three picocyanobacterial strains of Synechococcus. Photosynthetica 2014, 52, 223–232. [Google Scholar] [CrossRef]
  45. Paerl, H.W.; Huisman, J. Climate change: A catalyst for global expansion of harmful cyanobacterial blooms. Eviron. Microb. Rep. 2009, 1, 27–37. [Google Scholar] [CrossRef] [PubMed]
  46. Wilde, E.W.; Tilly, L.J. Structural characteristics of algal communities in thermally altered artificial streams. Hydrobiologia 1981, 76, 57–63. [Google Scholar] [CrossRef]
  47. Noaman, N.H.; Fattah, A.; Khaleafa, M.; Zaky, S.H. Factors affecting antimicrobial activity of Synechococcus leopoliensis. Microbiol. Res. 2004, 159, 395–402. [Google Scholar] [CrossRef]
  48. Robarts, R.D.; Zohary, T. Temperature effects on photosynthetic capacity, respiration, and growth rates of bloom-forming cyanobacteria. N. Z. J. Mar. Freshwat. Res. 1987, 21, 391–399. [Google Scholar] [CrossRef] [Green Version]
  49. Weisse, T. The microbial food-web and its sensitivity to eutrophication and contaminant enrichment: Across-system overview. Int. Rev. Ges. Hydrobiol. 1991, 76, 327–338. [Google Scholar] [CrossRef]
  50. Kuosa, H. Picoplanktonic algae in the northern Baltic Sea: Seasonal dynamics and flagellate grazing. Mar. Ecol. Prog. Ser. 1991, 73, 269–276. [Google Scholar] [CrossRef]
  51. Kononen, K.; Kuparinen, J.; Mäkelä, K.; Laanemets, J.; Pavelson, J.; Nômmann, S. Initiation of cyanobacterial blooms in a frontal region at the entrance to the Gulf of Finland, Baltic Sea. Limnol. Ocean. 1996, 41, 98–112. [Google Scholar] [CrossRef]
  52. Stal, L.J.; Albertano, P.; Bergman, B.; Bröckel, K.; Gallon, J.R.; Hayes, P.K.; Sivonen, K.; Walsby, A.E.; BASIC: Baltic Sea cyanobacteria. An investigation of the structure and dynamics of water blooms of cyanobacteria in the Baltic Sea―responses to a changing environment. Cont. Shelf Res. 2003, 23, 1695–1714. [Google Scholar]
  53. Hanelt, D.; Wiencke, C.; Bischof, K. Photosynthesis in Algae. In Advances in Photosynthesis and Respiration; Larkum, A.W.D., Douglas, S.E., Raven, J.A., Eds.; Springer Science & Business Media: Berlin, Germany, 2003; Volume 14, p. 417. [Google Scholar]
  54. Stomp, M.; Huisman, J.; Stal, L.J.; Matthijs, H.C. Colorful niches of phototrophic microorganisms shaped by vibrations of the water molecule. ISME J. 2007, 1, 271–282. [Google Scholar] [CrossRef]
  55. Millie, D.F.; Ingram, D.A.; Dionigi, C.P. Pigment and photosynthetic responses of Oscillatoria agardhii (Cyanophyta) to photon flux density and spectral quality. J. Phycol. 1990, 26, 660–666. [Google Scholar] [CrossRef]
  56. Prézelin, B.B. Light reactions in photosynthesis. In Physiological Bases of Phytoplankton Ecology; Platt, T., Ed.; Canadian Bulletin of Fisheries and Aquatic Sciences: Ottawa, ON, Canada, 1981; pp. 1–43. [Google Scholar]
  57. Paerl, H.W. Nuisance phytoplankton blooms in coastal, estuarine, and inland waters. Limnol. Oceanogr. 1988, 33, 823–847. [Google Scholar] [CrossRef]
  58. Carter, J.R. Diatom from the Devil’s Hole Cave, Fife; Nova Hedwigia: Scotland, UK, 1971; pp. 657–681. [Google Scholar]
  59. Lund, I.W.G. The ecology of the freshwater phytoplankton. Biol. Rev. Cambridge Philosoph. Soc. 1965, 40, 231–293. [Google Scholar] [CrossRef]
  60. Foy, R.H.; Gibson, C.E. Photosynthetic characteristics of planktonic blue-green algae: Changes in photosynthetic capacity and pigmentation of Oscillatoria redekei Van Goor under high and low light. Br. Phycol. J. 1982, 17, 183–193. [Google Scholar] [CrossRef]
  61. Post, A.F. Transient state characteristics of adaptation to changes in light conditions for the cyanobacterium Oscillatoria agardhii. I. Pigmentation and photosynthesis. Arch. Microbiol. 1986, 145, 353–357. [Google Scholar] [CrossRef]
  62. Guillard, R.R.L.; Murphy, L.S.; Foss, P.; Liaaen-Jensen, S. Synechococcus spp. as likely zeaxanthin-dominant ultraphytoplankton in the North Atlantic. Limnol. Oceanogr. 1985, 30, 412–414. [Google Scholar] [CrossRef]
  63. Gieskes, W.W.; Kraay, G.W. Floristic and physiological differences between the shallow and the deep nanophytoplankton community in the euphotic zone of the open tropical Atlantic revealed by HPLC analysis of pigments. Mar. Biol. 1986, 91, 567–576. [Google Scholar] [CrossRef]
  64. Dubinsky, Z.; Falkowski, P.J.; Wyman, K. Light harvesting and utilization by phytoplankton. Plant. Cell Physiol. 1986, 27, 1335–1349. [Google Scholar] [CrossRef]
  65. Neale, P.J.; Melis, A. Algal photosynthetic membrane complex and the photosynthesis-irradiance curve: A comparison of light-adaptation responses in Chlamydomonas reinhardtii (Chlorophyta). J. Phycol. 1986, 22, 531–538. [Google Scholar] [CrossRef]
  66. Sukenik, A.; Bennett, J.; Falkowski, P.G. Light saturated photosynthesis-limitation by electron transport or carbon-fixation? Biochim. Biophys. Acta. 1987, 891, 205–215. [Google Scholar] [CrossRef]
  67. Tang, E.P.Y.; Vincent, W.F. Effects of daylength and temperature on the growth and photosynthesis of an Arctic cyanobacterium, Schizothrix calcicola (Oscillatoriaceae). Eur. J. Phycol. 2000, 35, 263–272. [Google Scholar] [CrossRef]
  68. Rae, R.; Vincent, W.F. Phytoplankton production in subarctic lake and river ecosystems: Development of a photosynthesis-temperature-irradiance model. J. Plankton Res. 1998, 20, 1293–1312. [Google Scholar] [CrossRef]
  69. Young, A.J. Factors that affect the carotenoids composition of higher plants and algae. In Carotenoids in Photosynthesis; Young, A.J., Britton, G., Eds.; Chapman and Hall: London, UK, 1993; pp. 160–205. [Google Scholar]
  70. Young, A.J.; Frank, H.A. Energy transfer reactions involving carotenoids: Quenching of chlorophyll fluorescence. J. Photochem. Photobiol. B 1996, 36, 3–15. [Google Scholar] [CrossRef]
  71. Paerl, H.W.; Tucker, J.; Bland, P.T. Carotenoid enhancement and its role in maintaining blue-green algal (Microcystis aeruginosa) surface blooms. Limnol. Oceanogr. 1983, 28, 847–857. [Google Scholar]
  72. Paerl, H.W. Cyanobacterial carotenoids: Their roles in maintaining optimal photosynthetic production among aquatic bloom-forming genera. Oecologia 1984, 61, 143–149. [Google Scholar] [CrossRef]
  73. Jones, L.W.; Myers, J. Pigment variations in Anacystis nidulans induced by light of selected wavelengths. J. Phycol. 1965, 1, 7–15. [Google Scholar] [CrossRef]
  74. Glover, H.E.; Keller, M.D.; Spinrad, R.W. The effects of light quality on photosynthesis and growth of marine eukaryotic and prokaryotic phytoplankton clones. J. Exp. Mar. Biol. Ecol. 1987, 105, 137–159. [Google Scholar] [CrossRef]
  75. Tilzer, M.M. Light-dependence of photosynthesis and growth in cyanobacteria: Implications for their dominance in eutrophic lakes. New Zeal. J. Mar. Fresh. Res. 1987, 21, 401–412. [Google Scholar] [CrossRef] [Green Version]
  76. Fahnenstiel, G.L.; Carrick, H.J.; Rogers, C.E.; Sicko-Goad, L. Red fluorescing phototrophic picoplankton in the Laurentian Great Lakes: What are they and what are they doing? Int. Rev. Ges. Hydrobiol. 1991, 76, 603–616. [Google Scholar] [CrossRef]
  77. Stanier, R.Y.; Cohen-Bazire, G.; Kunisawa, R.; Mandel, M. Purification and properties of unicellular blue-green algae (order Chroococcales). Bact. Rev. 1971, 35, 171–205. [Google Scholar] [CrossRef] [Green Version]
  78. Guillard, R.R.; Sieracki, M.S. Counting cells in cultures with the light microscope. In Algal Culturing Techniques; Andersen, R.R., Ed.; Elsevier Academic Press: Burlington, VT, USA, 2005; pp. 239–252. [Google Scholar]
  79. Llewellyn, C.A.; Mantoura, R.F.C. The rapid determination of algal chlorophyll and carotenoid pigments and their breakdown products in natural waters by reverse-phase high-performance liquid chromatography. Anal. Chem. Acta. 1983, 151, 297–314. [Google Scholar]
  80. Jodłowska, S.; Latała, A. Simultaneous separation of chlorophylls and carotenoids by RP-HPLC in some algae and cyanobacteria from the Southern Baltic. Oceanol. Hydrobiol. Stud. 2003, 32, 81–89. [Google Scholar]
  81. Bennett, A.; Bogorad, L. Complementary chromatic adaptation in freshwater blue-green alga. J. Cell Biol. 1973, 58, 419–435. [Google Scholar] [CrossRef] [PubMed]
  82. Bryant, D.A.; Guglielmi, G.; Tandeau de Marsac, N.; Casteta, A.-M.; Cohen-Bazire, G. The structure of cyanobacterial phycobilisomes: A model. Arch. Microbiol. 1979, 123, 113–127. [Google Scholar] [CrossRef]
  83. Fisher, R.A.; Yates, F. Statistical Tables for Biological, Agricultural and Medical Research, 6th ed.; Olivier and Boyd: Edinburgh, UK, 1963; p. 146. [Google Scholar]
Figure 1. Changes in the number of cells (N × 107 mL−1; a) and the growth rate (μ; b) obtained after 14 days of experiment for three phenotypes of Synechococcus sp.: Type 1 (A), Type 2 (B), Type 3a (C) under different irradiance (μmol photons m−2 s−1) and temperature (°C) conditions.
Cells 09 02030 g001
Figure 2. Changes in content (pg·cell−1) of Chl a (a), sum of total Car (b), and sum of total Phyco (c) obtained after 14 days of experiment for three phenotypes of Synechococcus sp.: Type 1 (A), Type 2 (B), Type 3a (C) under different irradiance (μmol photons m−2 s−1) and temperature (°C) conditions.
Cells 09 02030 g002
Figure 3. Changes in content (pg·cell−1) of PE (a), PC (b), and APC (c) obtained after 14 days of experiment for three phenotypes of Synechococcus sp.: Type 1 (A), Type 2 (B), Type 3a (C) under different irradiance (μmol photons m−2 s−1) and temperature (°C) conditions.
Cells 09 02030 g003
Figure 4. Changes in content (pg·cell−1) of Zea (a) and β-Car (b) obtained after 14 days of experiment for three phenotypes of Synechococcus sp.: Type 1 (A), Type 2 (B), Type 3a (C) under different irradiance (μmol photons m−2 s−1) and temperature (°C) conditions.
Cells 09 02030 g004
Figure 5. Changes in Zea/Chl a ratio (a) and β-Car/Chl a ratio (b) obtained after 14 days of experiment for three phenotypes of Synechococcus sp.: Type 1 (A), Type 2 (B), Type 3a (C) under different irradiance (μmol photons m−2 s−1) and temperature (°C) conditions.
Cells 09 02030 g005
Figure 6. Left-side panel―photographs of the picocyanobacterial phenotypes in 100 mL glass Erlenmeyer flasks: Type 1 (A), Type 2 (B), and type 3a (C), obtained from low (left) and high (right) light; right-side panel―Absorbance spectra measured in the PAR range determined for the picocyanobacterial phenotypes at an optical density (OD750) = 0.1, obtained from low light (LL) and high light (HL).
Cells 09 02030 g006

