Bromodomain Protein BRD4 Accelerates Glucocorticoid Dysregulation of Bone Mass and Marrow Adiposis by Modulating H3K9 and Foxp1

 and
and 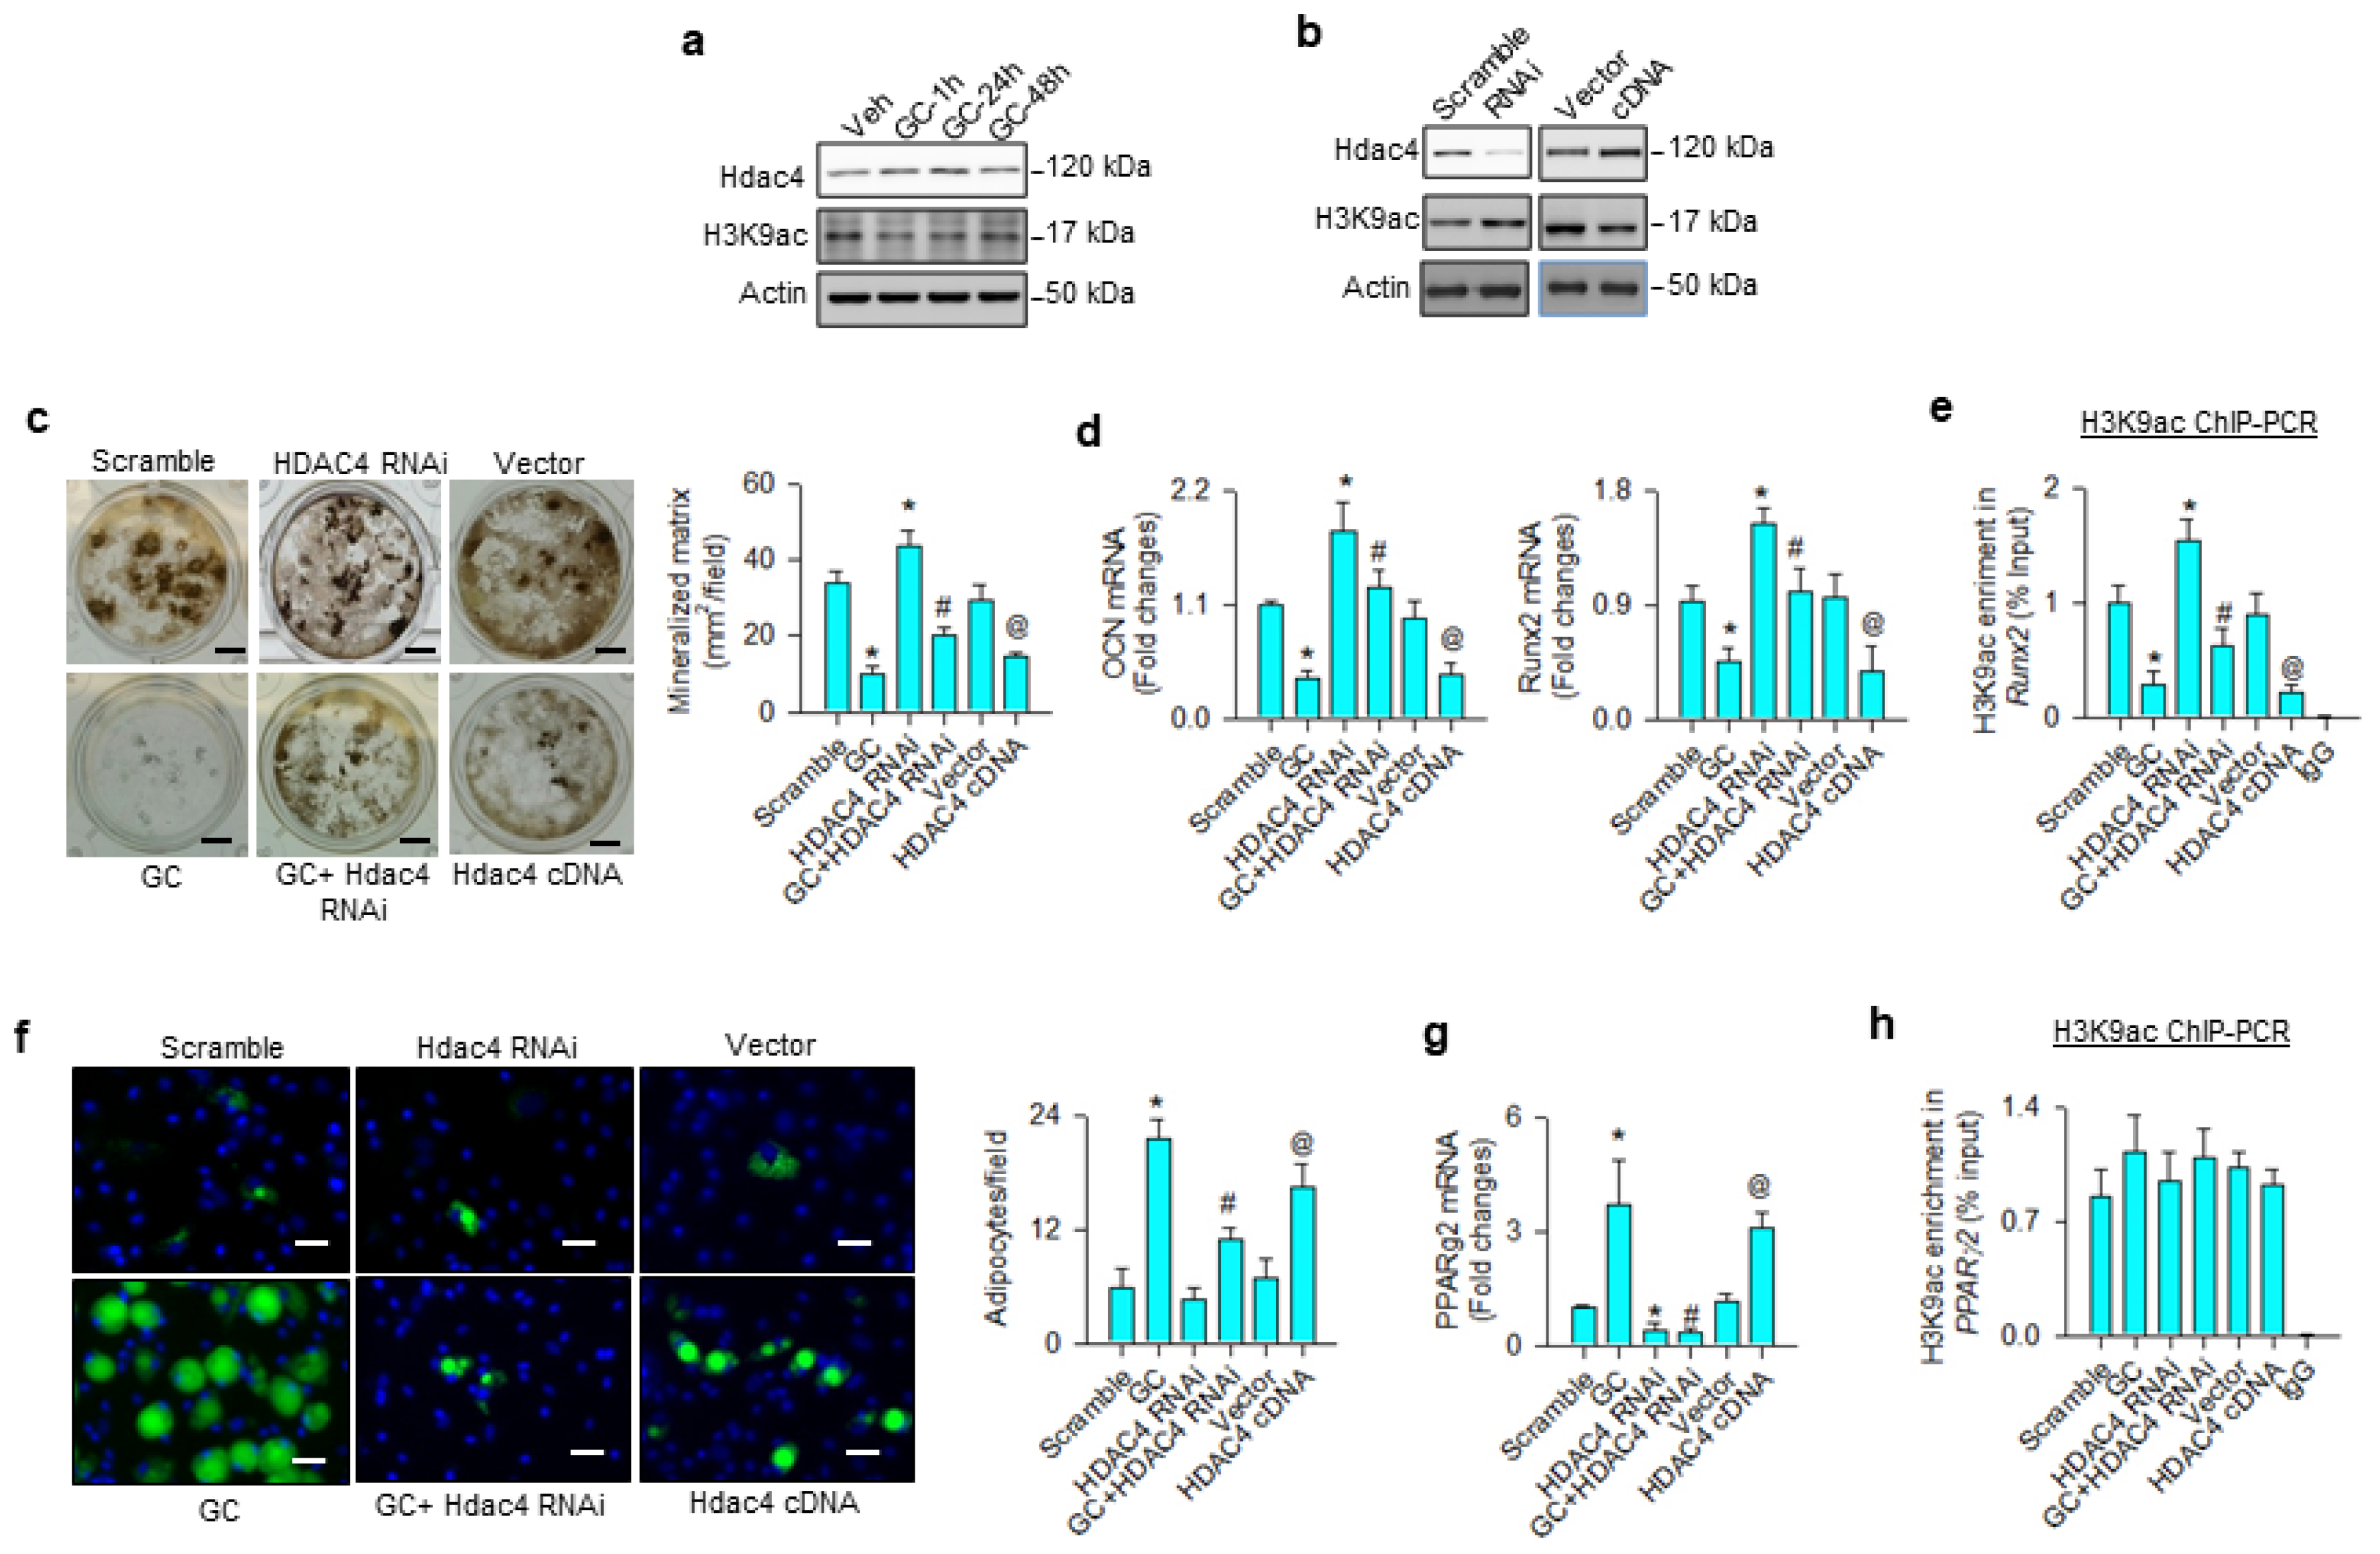
Abstract
:1. Introduction
2. Materials and Methods
2.1. Bone-Marrow Mesenchymal Stem Cell Cultures
2.2. In Vitro Osteogenesis and Adipogenesis Assay
2.3. RNA Interference and cDNA Transfection
2.4. RT-PCR
2.5. Immunoblotting
2.6. Immunofluorescence
2.7. Chromatin Immunoprecipitation (ChIP)-PCR
2.8. Chromatin Immunoprecipitation-Sequencing (ChIP-seq)
2.9. Glucocorticoid-Induced Bone Loss in Mice
2.10. μCT Analysis
2.11. Ex Vivo Osteogenesis and Adipogenesis
2.12. Histomorphometry
2.13. Statistical Analysis
3. Results
3.1. H3K9 Hypomethylation Dysregulated Osteogenic and Adipogenic Differentiation
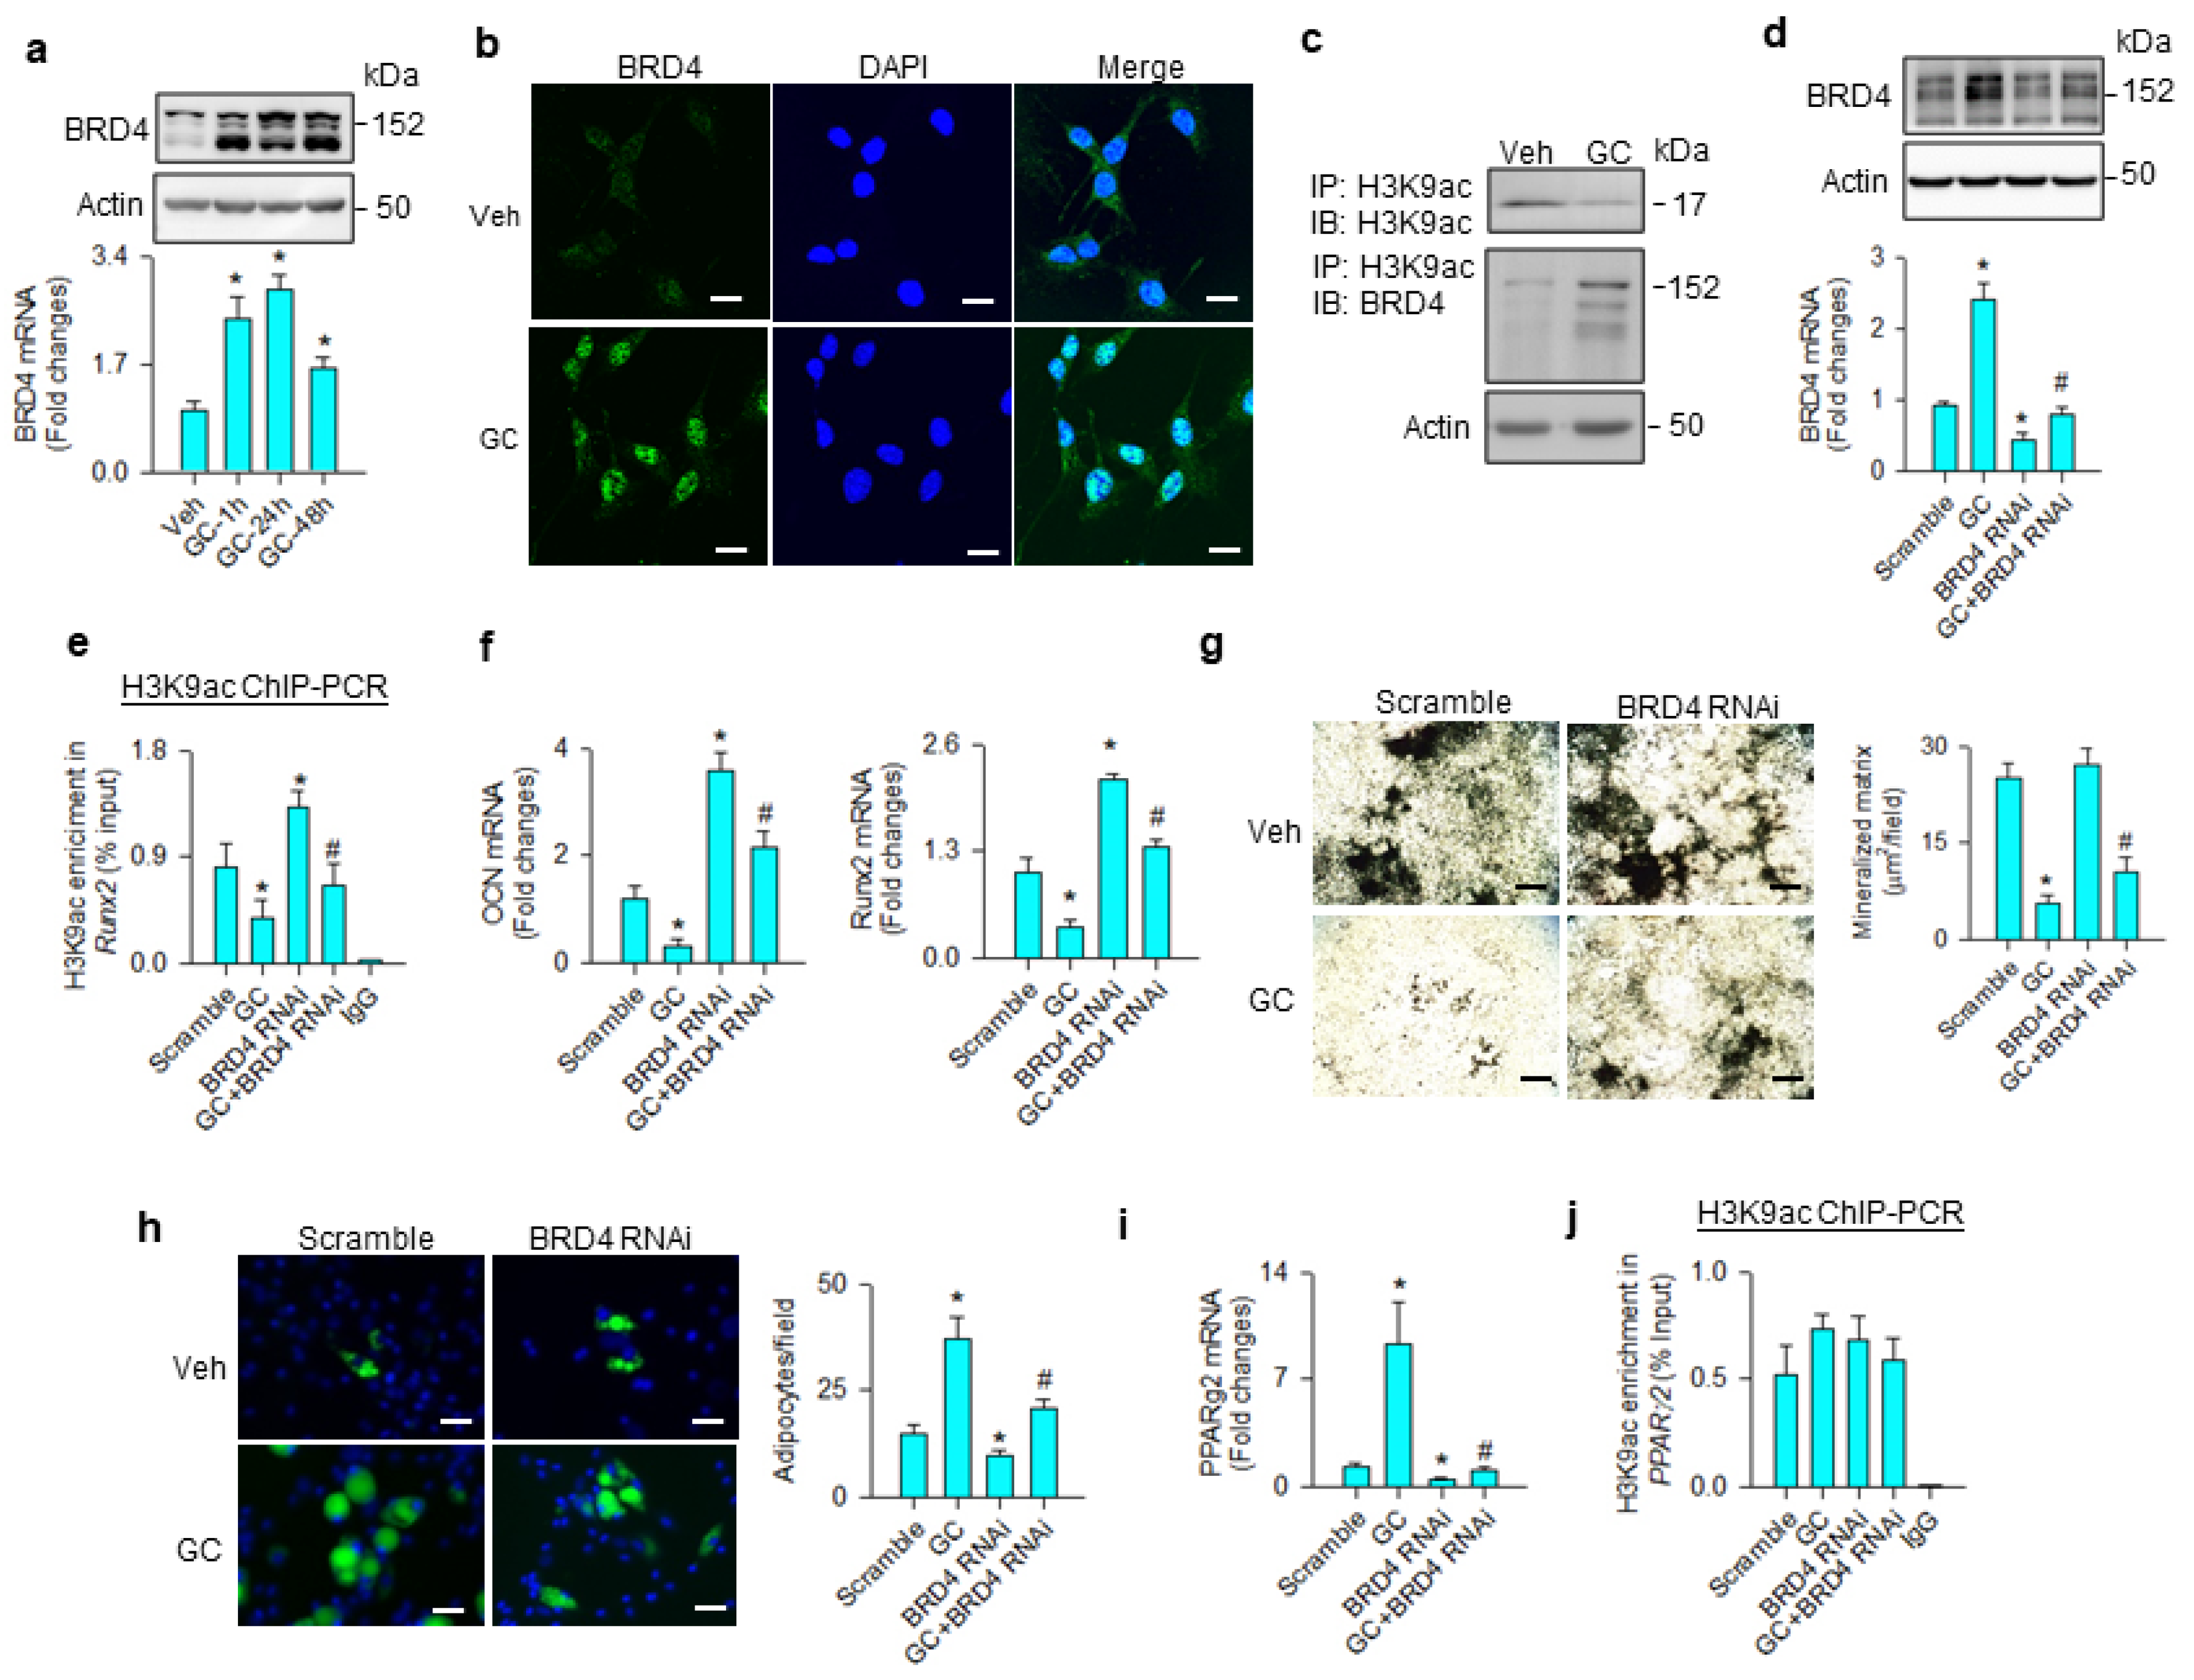
3.2. BRD4-Regulated Osteogenic and Adipogenic Differentiation
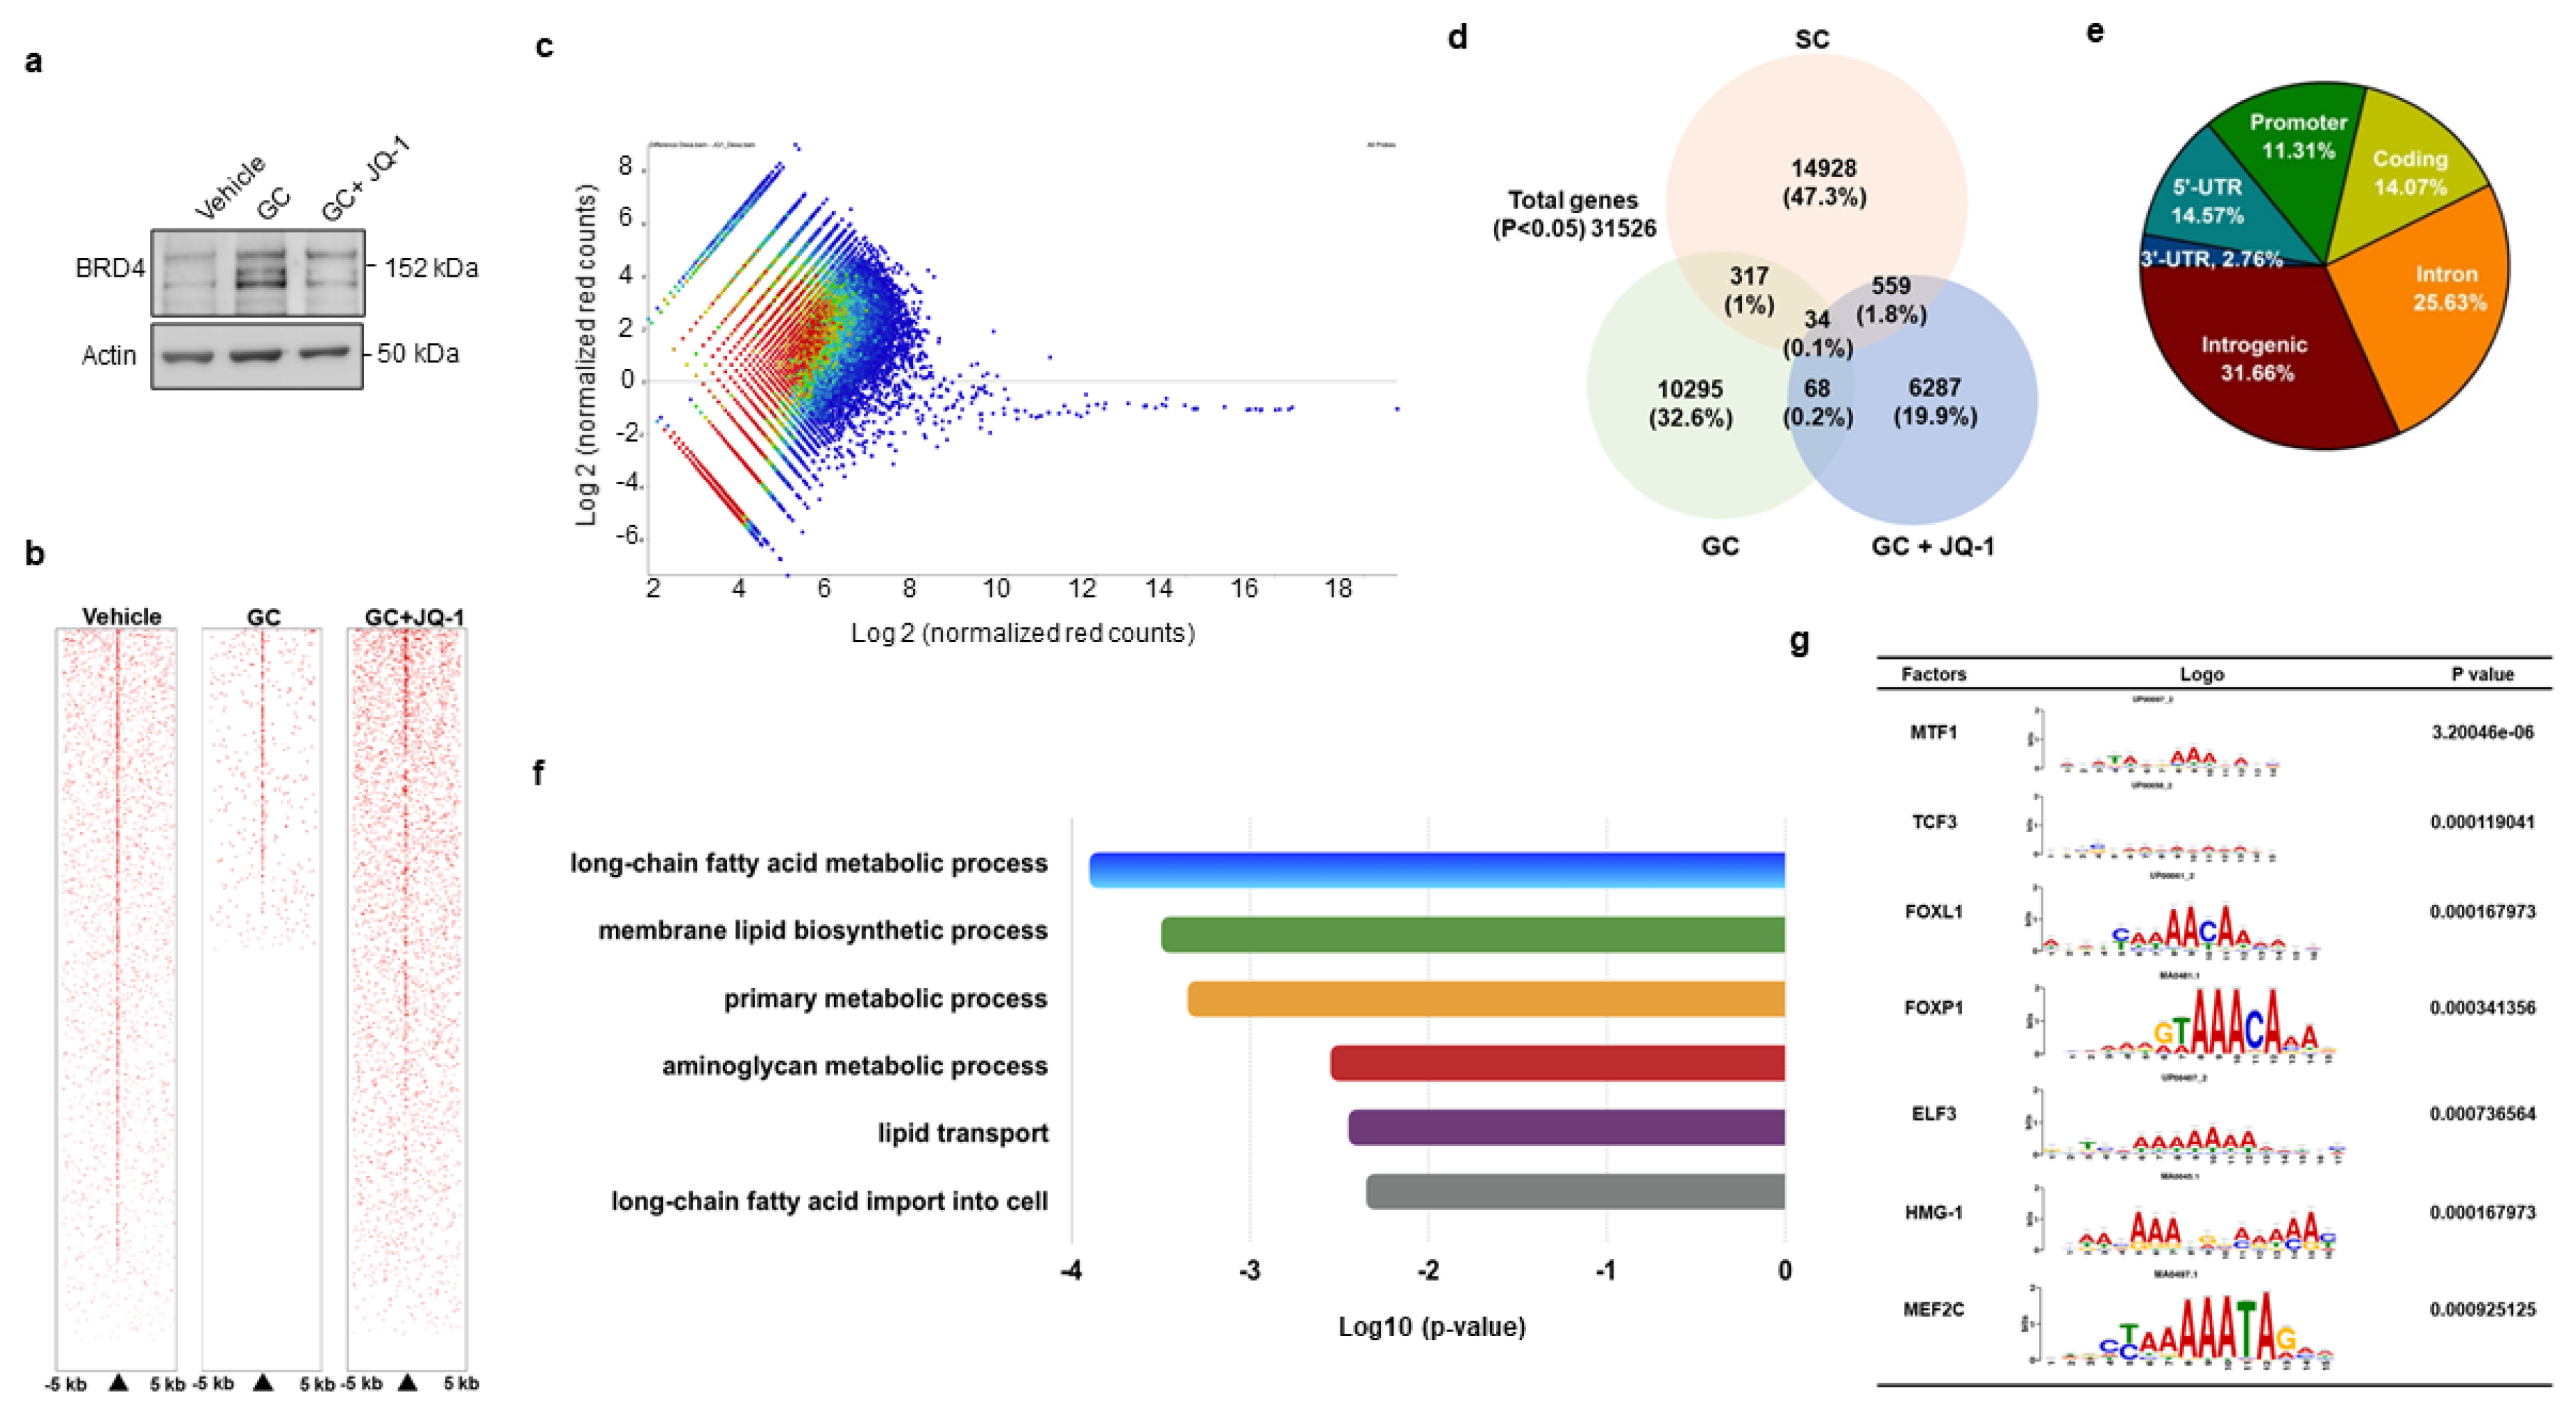
3.3. BRD4 Inhibition Changed H3K9ac Enrichment at Coding Region of Lipid Regulators
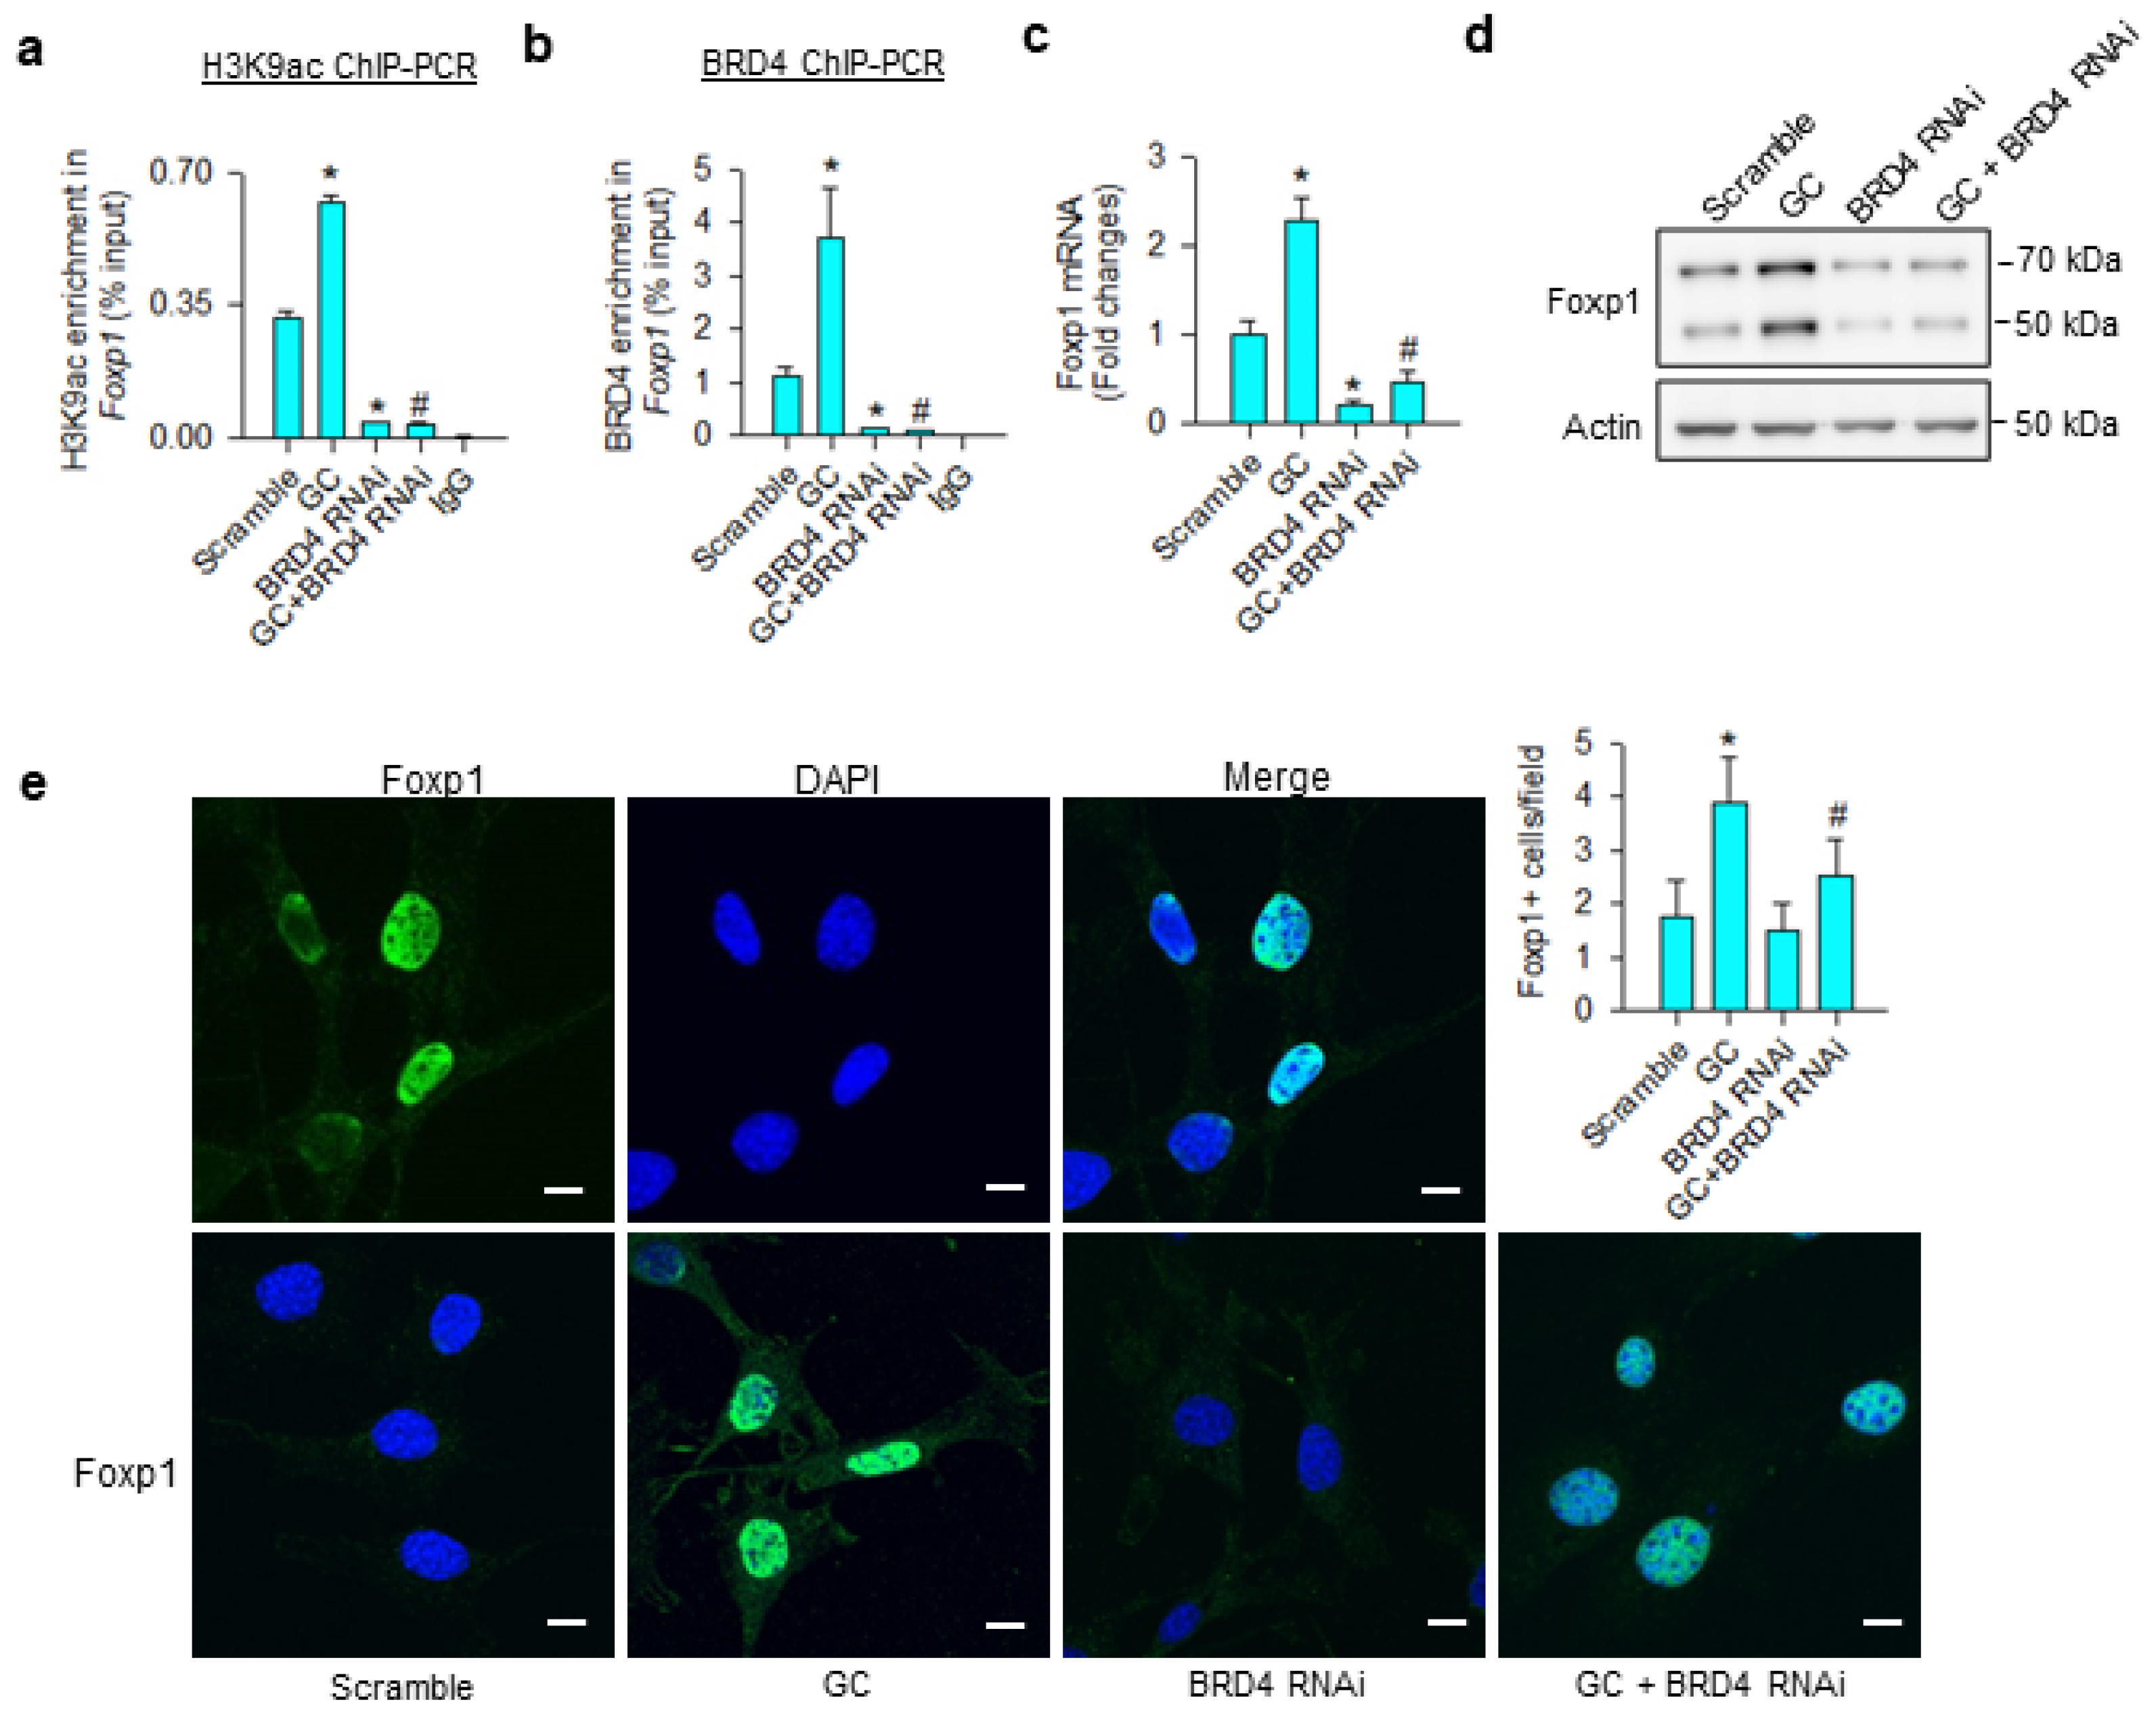
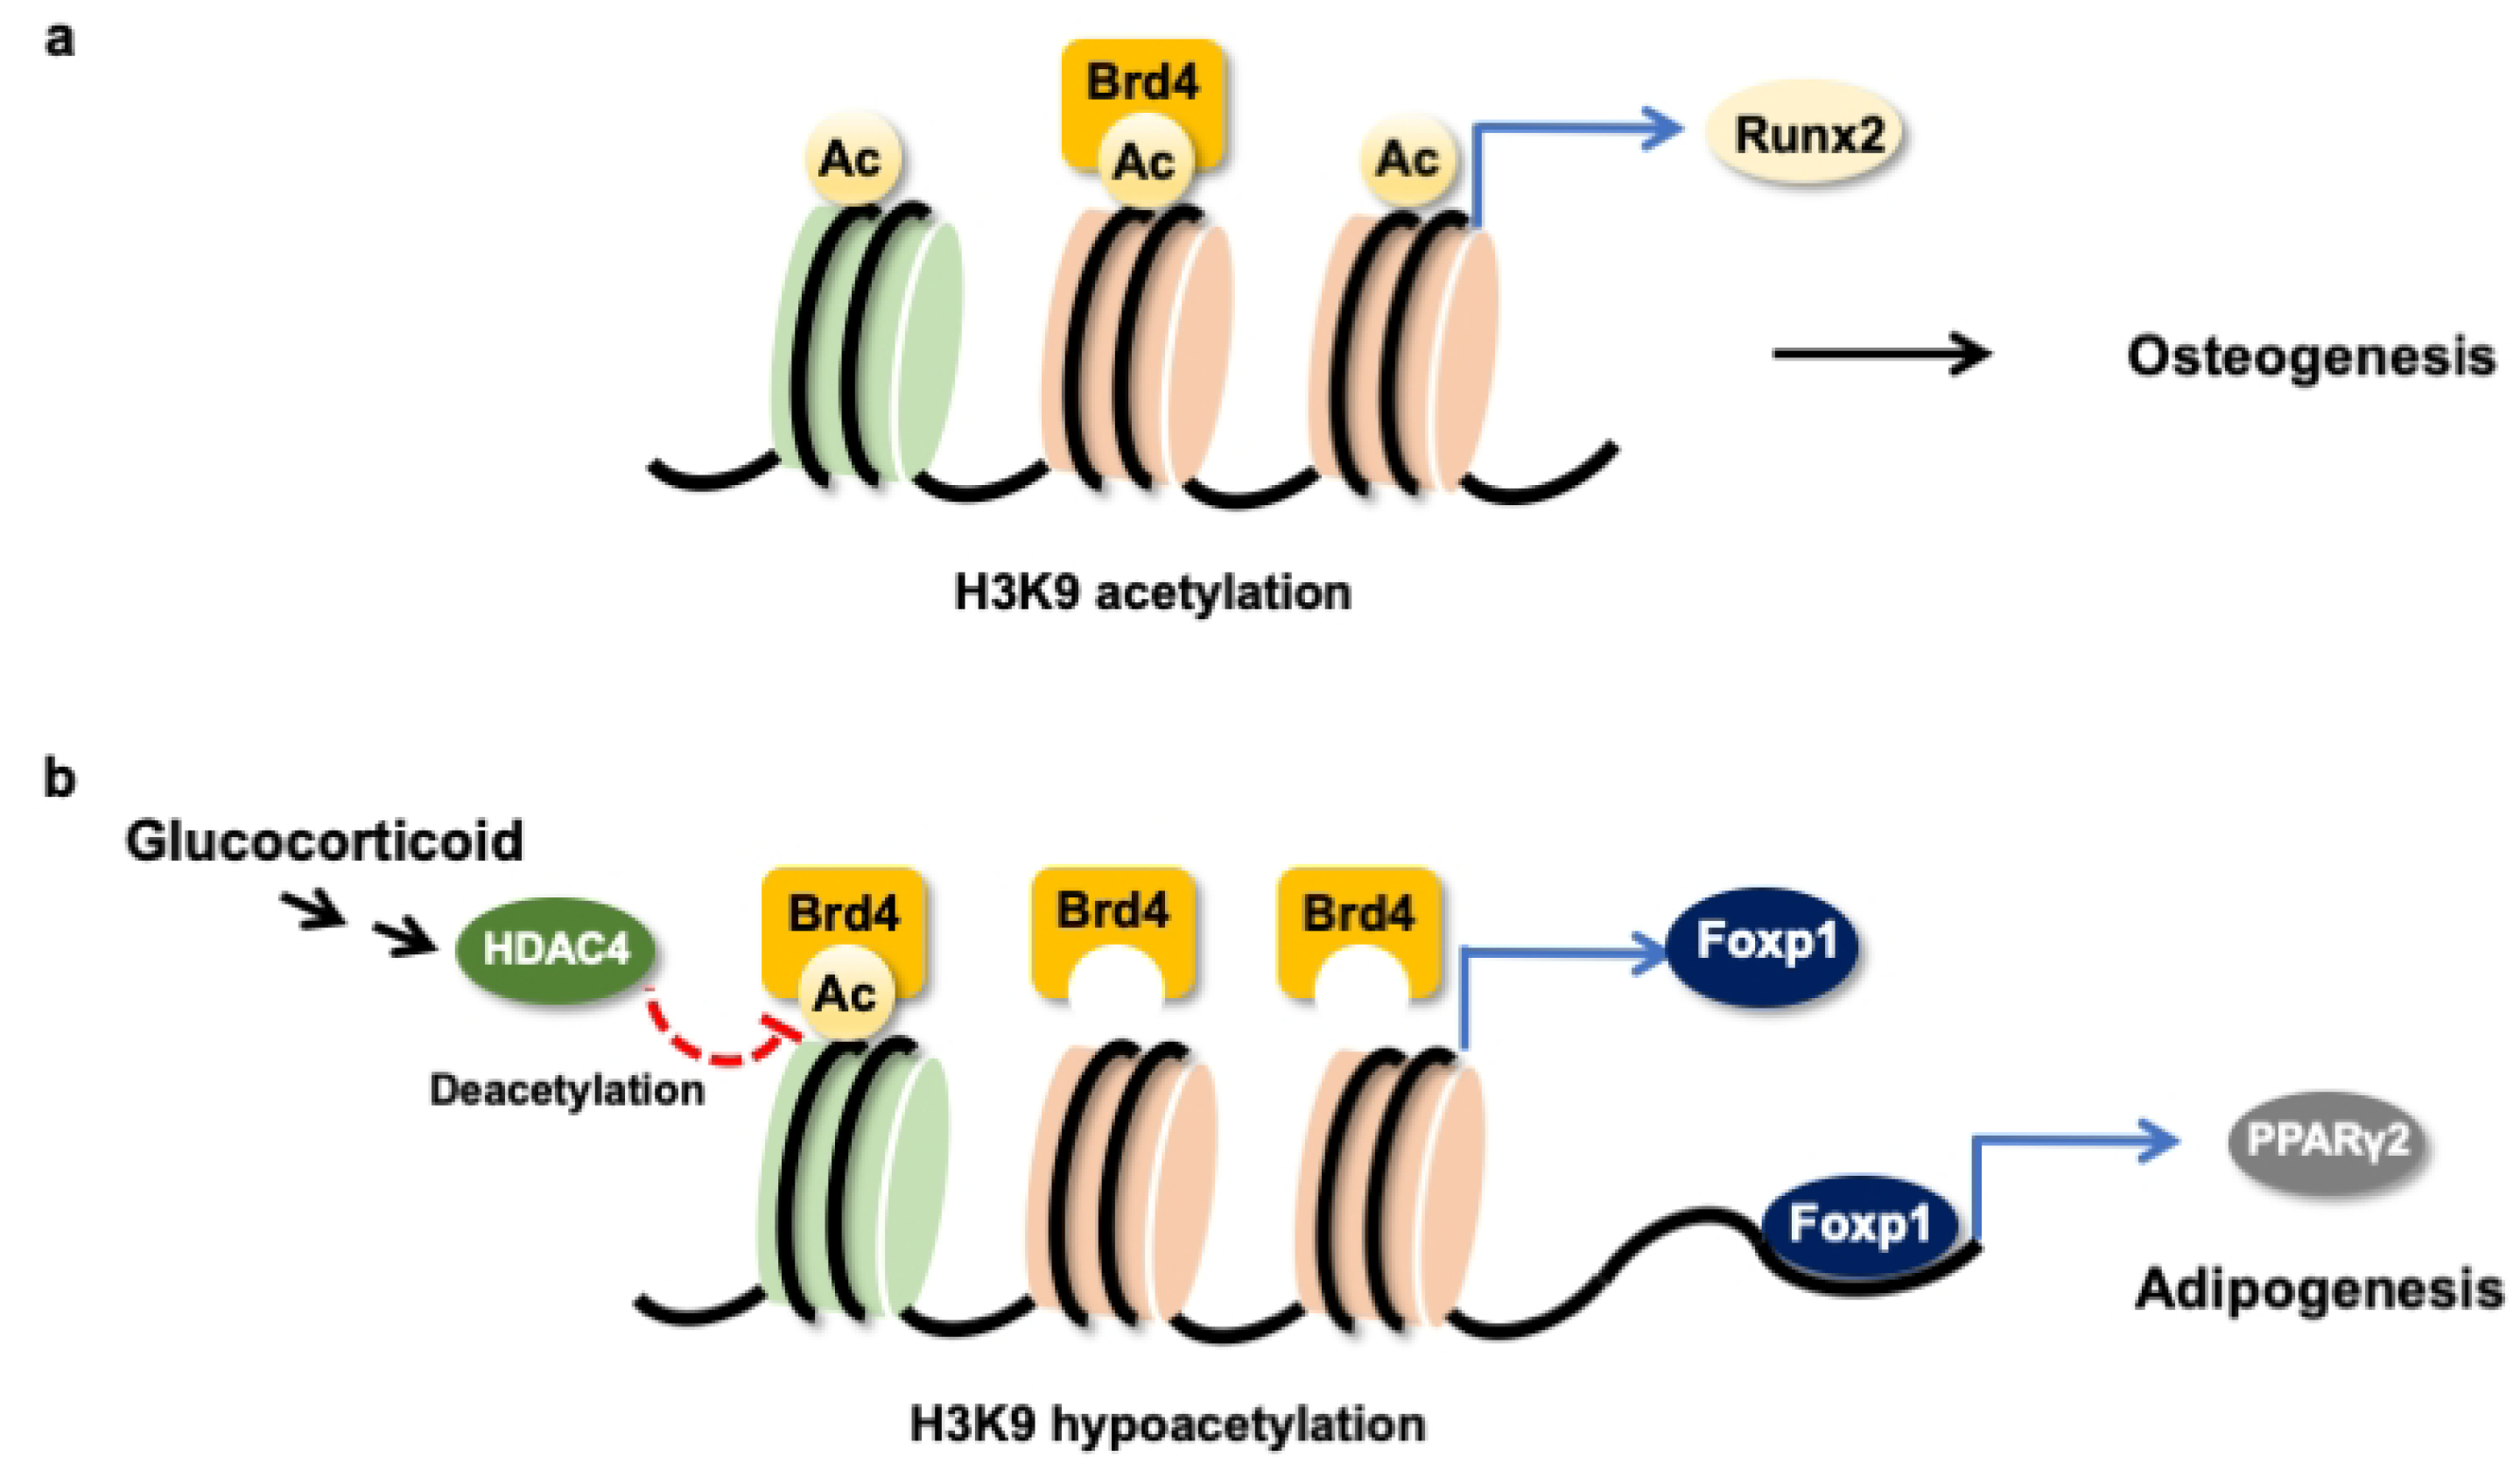
3.4. Foxp1 Mediated Glucocorticoid Upregulation of Adipocyte Formation
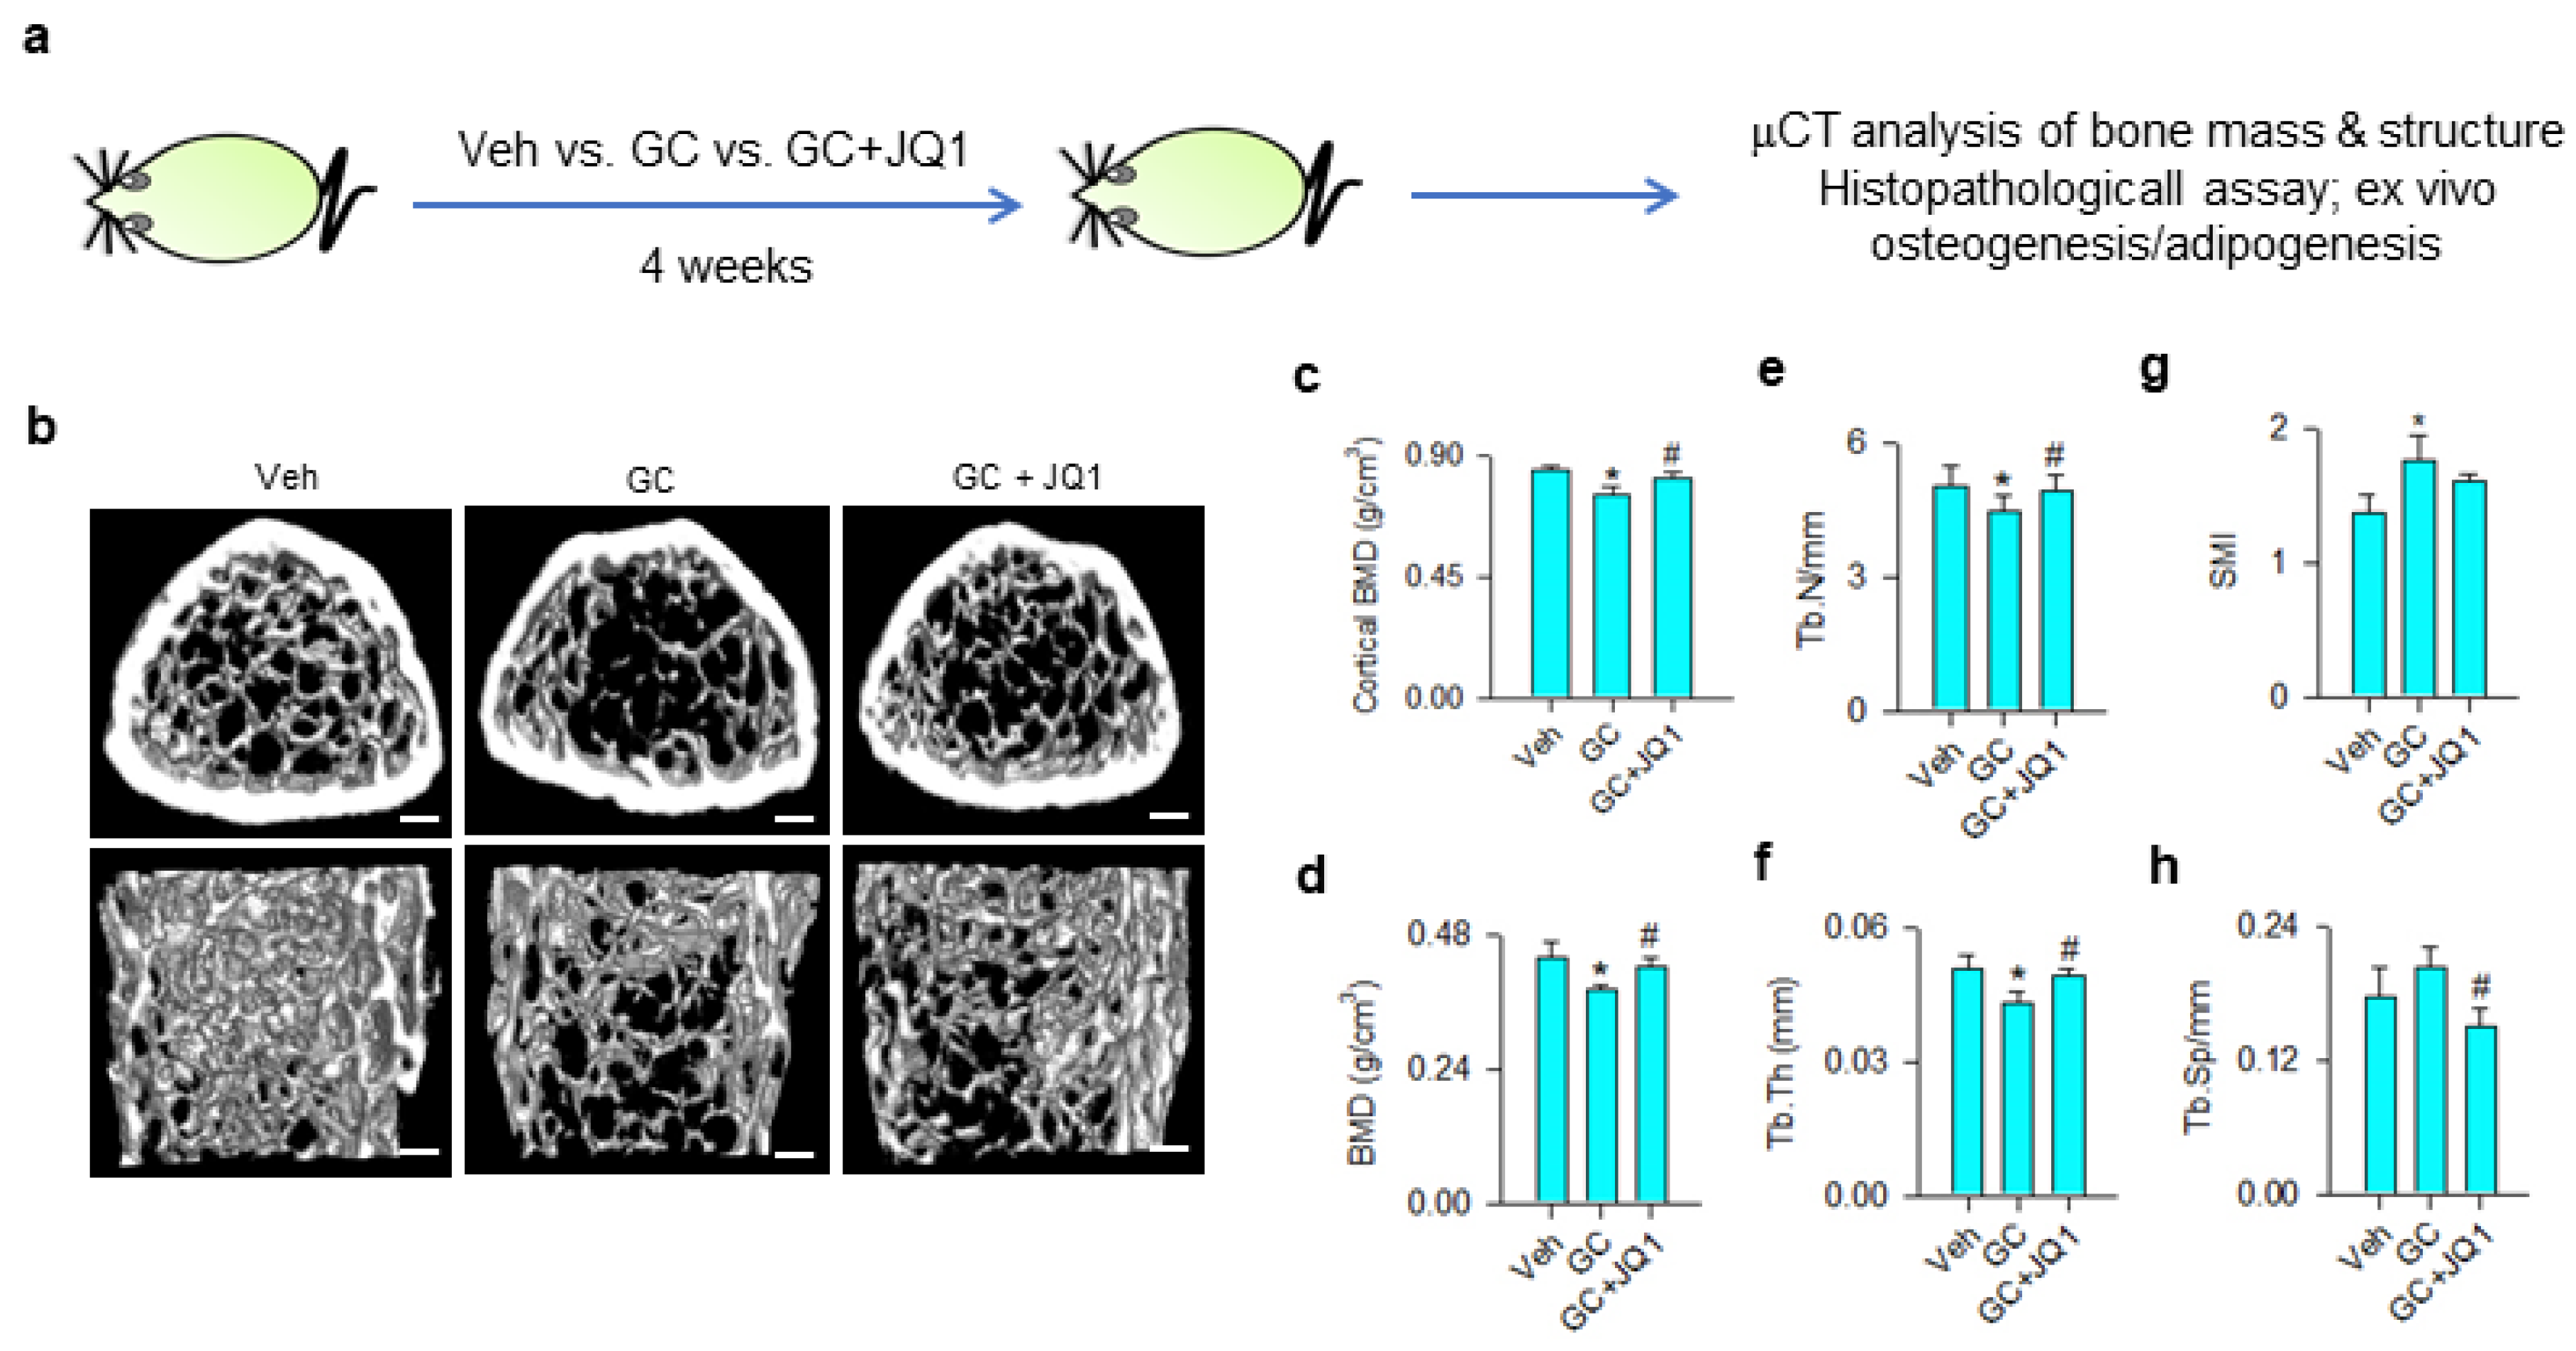
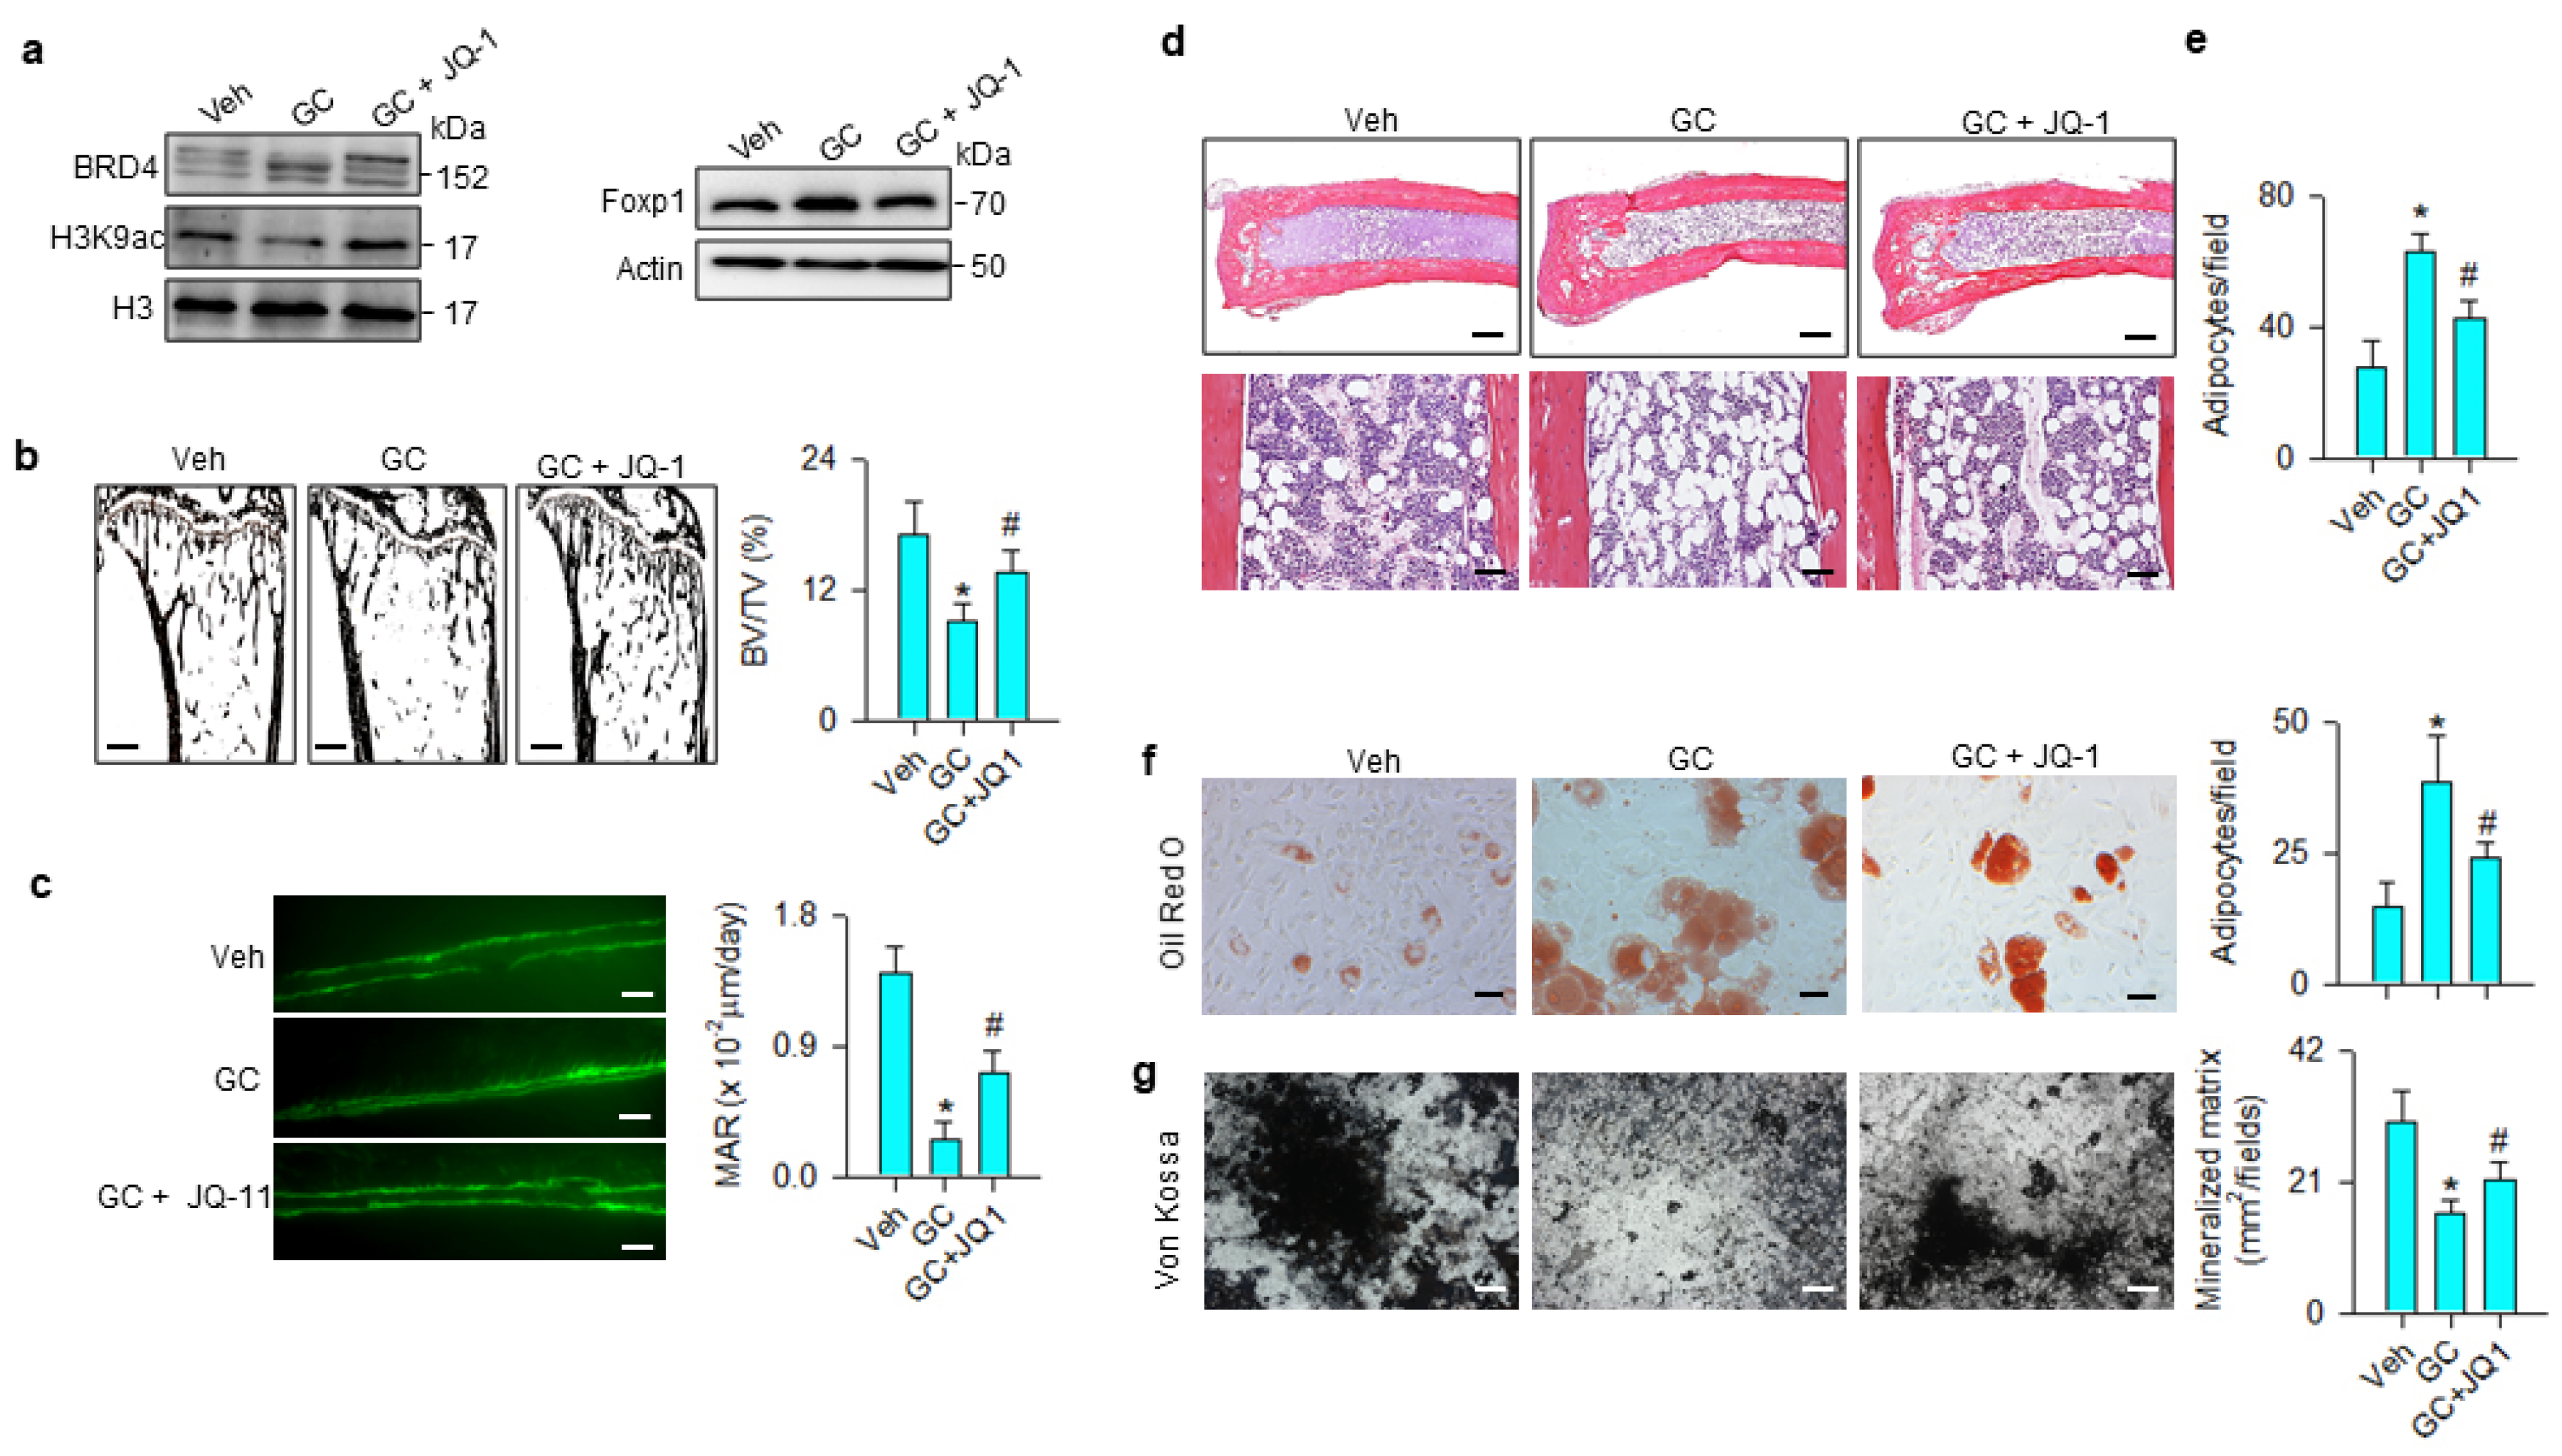
3.5. BRD4 Inhibitor Treatment Slowed Glucocorticoid-Induced Bone Loss
4. Discussion
Author Contributions
Funding
Conflicts of Interest
References
- Hardy, R.S.; Zhou, H.; Seibel, M.J.; Cooper, M.S. Glucocorticoids and bone: Consequences of endogenous and exogenous excess and replacement therapy. Endocr. Rev. 2018, 39, 519–548. [Google Scholar] [CrossRef] [PubMed] [Green Version]
- Rapp, A.E.; Hachemi, Y.; Kemmler, J.; Koenen, M.; Tuckermann, J.; Ignatius, A. Induced global deletion of glucocorticoid receptor impairs fracture healing. FASEB J. 2018, 32, 2235–2245. [Google Scholar] [CrossRef] [PubMed] [Green Version]
- Ahmad, M.; Hachemi, Y.; Paxian, K.; Mengele, F.; Koenen, M.; Tuckermann, J. A Jack of all trades: Iimpact of glucocorticoids on cellular cross-talk in osteoimmunology. Front. Immunol. 2019, 10, 2460. [Google Scholar] [CrossRef] [PubMed] [Green Version]
- Buckley, L.; Humphrey, M.B. Glucocorticoid-induced osteoporosis. N. Engl. J. Med. 2018, 379, 2547–2556. [Google Scholar] [CrossRef] [PubMed]
- Saag, K.G.; Wagman, R.B.; Geusens, P.; Adachi, J.D.; Messina, O.D.; Emkey, R.; Chapurlat, R.; Wang, A.; Pannacciulli, N.; Lems, W.F. Denosumab versus risedronate in glucocorticoid-induced osteoporosis: A multicentre, randomised, double-blind, active-controlled, double-dummy, non-inferiority study. Lancet Diabetes Endocrinol. 2018, 6, 445–454. [Google Scholar] [CrossRef]
- Balasubramanian, A.; Wade, S.W.; Adler, R.A.; Saag, K.; Pannacciulli, N.; Curtis, J.R. Glucocorticoid exposure and fracture risk in a cohort of US patients with selected conditions. J. Bone Miner. Res. 2018, 33, 1881–1888. [Google Scholar] [CrossRef]
- Rizzoli, R.; Biver, E. Glucocorticoid-induced osteoporosis: Who to treat with what agent? Nat. Rev. Rheumatol. 2015, 11, 98–109. [Google Scholar] [CrossRef]
- Rharass, T.; Lucas, S. MECHANISMS IN ENDOCRINOLOGY: Bone marrow adiposity and bone, a bad romance? Eur. J. Endocrinol. 2018, 179, 165–182. [Google Scholar] [CrossRef]
- Van Meurs, J.B.; Boer, C.G.; Lopez-Delgado, L.; Riancho, J.A. Role of epigenomics in bone and cartilage disease. J. Bone Miner. Res. 2019, 34, 215–230. [Google Scholar] [CrossRef] [Green Version]
- Bradley, E.W.; Carpio, L.R.; van Wijnen, A.J.; McGee-Lawrence, M.E.; Westendorf, J.J. Histone deacetylases in bone development and skeletal disorders. Physiol. Rev. 2015, 95, 1359–1381. [Google Scholar] [CrossRef] [Green Version]
- Zhang, P.; Liu, Y.; Jin, C.; Zhang, M.; Lv, L.; Zhang, X.; Liu, H.; Zhou, Y. Histone H3K9 Acetyltransferase PCAF Is essential for osteogenic differentiation through bone morphogenetic protein signaling and may be Involved in osteoporosis. Stem Cells 2016, 34, 2332–2341. [Google Scholar] [CrossRef] [PubMed]
- Li, J.; Liu, C.; Li, Y.; Zheng, Q.; Xu, Y.; Liu, B.; Sun, W.; Li, Y.; Ji, S.; Liu, M.; et al. TMCO1-mediated Ca2+ leak underlies osteoblast functions via CaMKII signaling. Nat. Commun. 2019, 10, 1589. [Google Scholar] [CrossRef] [PubMed] [Green Version]
- McGee-Lawrence, M.E.; Pierce, J.L.; Yu, K.; Culpepper, N.R.; Bradley, E.W.; Westendorf, J.J. Loss of Hdac3 in osteoprogenitors increases bone expression of osteoprotegerin, improving systemic insulin sensitivity. J. Cell Physiol. 2018, 233, 2671–2680. [Google Scholar] [CrossRef] [PubMed]
- Adamik, J.; Jin, S.; Sun, Q.; Zhang, P.; Weiss, K.R.; Anderson, J.L.; Silbermann, R.; Roodman, G.D.; Galson, D.L. EZH2 or HDAC1 inhibition reverses multiple myeloma-induced epigenetic suppression of osteoblast differentiation. Mol. Cancer Res. 2017, 15, 405–417. [Google Scholar] [CrossRef] [Green Version]
- Singh, K.; Krug, L.; Basu, A.; Meyer, P.; Treiber, N.; Vander Beken, S.; Wlaschek, M.; Kochanek, S.; Bloch, W.; Geiger, H.; et al. Alpha-ketoglutarate curbs differentiation and induces cell death in mesenchymal stromal precursors with mitochondrial dysfunction. Stem Cells 2017, 35, 1704–1718. [Google Scholar] [CrossRef] [Green Version]
- Ko, J.Y.; Chuang, P.C.; Chen, M.W.; Ke, H.C.; Wu, S.L.; Chang, Y.H.; Chen, Y.S.; Wang, F.S. MicroRNA-29a ameliorates glucocorticoid-induced suppression of osteoblast differentiation by regulating beta-catenin acetylation. Bone 2013, 57, 468–475. [Google Scholar] [CrossRef]
- Belkina, A.C.; Denis, G.V. BET domain co-regulators in obesity, inflammation and cancer. Nat. Rev. Cancer 2012, 12, 465–477. [Google Scholar] [CrossRef] [Green Version]
- Loven, J.; Hoke, H.A.; Lin, C.Y.; Lau, A.; Orlando, D.A.; Vakoc, C.R.; Bradner, J.E.; Lee, T.I.; Young, R.A. Selective inhibition of tumor oncogenes by disruption of super-enhancers. Cell 2013, 153, 320–334. [Google Scholar] [CrossRef] [Green Version]
- Najafova, Z.; Tirado-Magallanes, R.; Subramaniam, M.; Hossan, T.; Schmidt, G.; Nagarajan, S.; Baumgart, S.J.; Mishra, V.K.; Bedi, U.; Hesse, E.; et al. BRD4 localization to lineage-specific enhancers is associated with a distinct transcription factor repertoire. Nucleic. Acids Res. 2017, 45, 127–141. [Google Scholar] [CrossRef] [Green Version]
- An, Q.D.; Li, Y.Y.; Zhang, H.X.; Lu, J.; Yu, X.D.; Lin, Q.; Zhang, Y.G. Inhibition of bromodomain-containing protein 4 ameliorates oxidative stress-mediated apoptosis and cartilage matrix degeneration through activation of NF-E2-related factor 2-heme oxygenase-1 signaling in rat chondrocytes. J. Cell Biochem. 2018, 119, 7719–7728. [Google Scholar] [CrossRef]
- Brown, J.D.; Feldman, Z.B.; Doherty, S.P.; Reyes, J.M.; Rahl, P.B.; Lin, C.Y.; Sheng, Q.; Duan, Q.; Federation, A.J.; Kung, A.L.; et al. BET bromodomain proteins regulate enhancer function during adipogenesis. Proc. Natl. Acad. Sci. USA 2018, 115, 2144–2149. [Google Scholar] [CrossRef] [PubMed] [Green Version]
- Lawal, R.A.; Zhou, X.; Batey, K.; Hoffman, C.M.; Georger, M.A.; Radtke, F.; Hilton, M.J.; Xing, L.; Frisch, B.J.; Calvi, L.M. The notch ligand Jagged 1 regulates the osteoblastic lineage by maintaining the osteoprogenitor pool. J. Bone Miner. Res. 2017, 32, 1320–1331. [Google Scholar] [CrossRef] [PubMed]
- Park, B.W.; Kang, E.J.; Byun, J.H.; Son, M.G.; Kim, H.J.; Hah, Y.S.; Kim, T.H.; Mohana Kumar, B.; Ock, S.A.; Rho, G.J. In vitro and in vivo osteogenesis of human mesenchymal stem cells derived from skin, bone marrow and dental follicle tissue. Differentiation 2012, 83, 249–259. [Google Scholar] [CrossRef]
- Lian, W.S.; Ko, J.Y.; Chen, Y.S.; Ke, H.C.; Wu, S.L.; Kuo, C.W.; Wang, F.S. Chaperonin 60 sustains osteoblast autophagy and counteracts glucocorticoid aggravation of osteoporosis by chaperoning RPTOR. Cell Death Dis. 2018, 9, 938. [Google Scholar] [CrossRef] [PubMed] [Green Version]
- Bardet, A.F.; He, Q.; Zeitlinger, J.; Stark, A. A computational pipeline for comparative ChIP-seq analyses. Nat. Protoc. 2011, 7, 45–61. [Google Scholar] [CrossRef] [PubMed]
- Lian, W.S.; Ko, J.Y.; Chen, Y.S.; Ke, H.J.; Hsieh, C.K.; Kuo, C.W.; Wang, S.Y.; Huang, B.W.; Tseng, J.G.; Wang, F.S. MicroRNA-29a represses osteoclast formation and protects against osteoporosis by regulating PCAF-mediated RANKL and CXCL12. Cell Death Dis. 2019, 10, 705. [Google Scholar] [CrossRef] [PubMed]
- Wu, T.; Kamikawa, Y.F.; Donohoe, M.E. Brd4’s bromodomains mediate histone H3 acetylation and chromatin remodeling in pluripotent cells through p300 and Brg1. Cell Rep. 2018, 25, 1756–1771. [Google Scholar] [CrossRef] [Green Version]
- Liu, P.; Huang, S.; Ling, S.; Xu, S.; Wang, F.; Zhang, W.; Zhou, R.; He, L.; Xia, X.; Yao, Z.; et al. Foxp1 controls brown/beige adipocyte differentiation and thermogenesis through regulating beta3-AR desensitization. Nat. Commun. 2019, 10, 5070. [Google Scholar] [CrossRef] [Green Version]
- Sparks, J.A. Rheumatoid Arthritis. Ann. Intern. Med. 2019, 170, ITC1–ITC16. [Google Scholar] [CrossRef]
- Colditz, J.; Thiele, S.; Baschant, U.; Garbe, A.I.; Niehrs, C.; Hofbauer, L.C.; Rauner, M. Osteogenic Dkk1 mediates glucocorticoid-induced but not arthritis-induced bone loss. J. Bone Miner. Res. 2019, 34, 1314–1323. [Google Scholar] [CrossRef]
- Chen, Q.; Shou, P.; Zheng, C.; Jiang, M.; Cao, G.; Yang, Q.; Cao, J.; Xie, N.; Velletri, T.; Zhang, X.; et al. Fate decision of mesenchymal stem cells: Adipocytes or osteoblasts? Cell Death Differ. 2016, 23, 1128–1139. [Google Scholar] [CrossRef] [Green Version]
- Shen, W.C.; Lai, Y.C.; Li, L.H.; Liao, K.; Lai, H.C.; Kao, S.Y.; Wang, J.; Chuong, C.M.; Hung, S.C. Methylation and PTEN activation in dental pulp mesenchymal stem cells promotes osteogenesis and reduces oncogenesis. Nat. Commun. 2019, 10, 2226. [Google Scholar] [CrossRef] [PubMed]
- Huang, J.; Zhao, L.; Fan, Y.; Liao, L.; Ma, P.X.; Xiao, G.; Chen, D. The microRNAs miR-204 and miR-211 maintain joint homeostasis and protect against osteoarthritis progression. Nat. Commun. 2019, 10, 2876. [Google Scholar] [CrossRef] [PubMed] [Green Version]
- Wang, L.; Niu, N.; Li, L.; Shao, R.; Ouyang, H.; Zou, W. H3K36 trimethylation mediated by SETD2 regulates the fate of bone marrow mesenchymal stem cells. PLoS Biol. 2018, 16, e2006522. [Google Scholar] [CrossRef] [Green Version]
- Jing, H.; Su, X.; Gao, B.; Shuai, Y.; Chen, J.; Deng, Z.; Liao, L.; Jin, Y. Epigenetic inhibition of Wnt pathway suppresses osteogenic differentiation of BMSCs during osteoporosis. Cell Death Dis. 2018, 9, 176. [Google Scholar] [CrossRef]
- Wang, J.; Wang, C.D.; Zhang, N.; Tong, W.X.; Zhang, Y.F.; Shan, S.Z.; Zhang, X.L.; Li, Q.F. Mechanical stimulation orchestrates the osteogenic differentiation of human bone marrow stromal cells by regulating HDAC1. Cell Death Dis. 2016, 7, e2221. [Google Scholar] [CrossRef] [PubMed] [Green Version]
- Shangguan, Y.; Wen, Y.; Tan, Y.; Qin, J.; Jiang, H.; Magdalou, J.; Chen, L.; Wang, H. Intrauterine programming of glucocorticoid-insulin-like growth factor-1 axis-mediated developmental origin of osteoporosis susceptibility in female offspring rats with prenatal caffeine exposure. Am. J. Pathol. 2018, 188, 2863–2876. [Google Scholar] [CrossRef] [PubMed] [Green Version]
- Zentelyte, A.; Gasiuniene, M.; Treigyte, G.; Baronaite, S.; Savickiene, J.; Borutinskaite, V.; Navakauskiene, R. Epigenetic regulation of amniotic fluid mesenchymal stem cell differentiation to the mesodermal lineages at normal and fetus-diseased gestation. J. Cell Biochem. 2020, 121, 1811–1822. [Google Scholar] [CrossRef]
- Zhang, Y.; Ma, C.; Liu, X.; Wu, Z.; Yan, P.; Ma, N.; Fan, Q.; Zhao, Q. Epigenetic landscape in PPARgamma2 in the enhancement of adipogenesis of mouse osteoporotic bone marrow stromal cell. Biochim. Biophys. Acta 2015, 1852, 2504–2516. [Google Scholar] [CrossRef] [Green Version]
- Jang, M.J.; Park, U.H.; Kim, J.W.; Choi, H.; Um, S.J.; Kim, E.J. CACUL1 reciprocally regulates SIRT1 and LSD1 to repress PPARgamma and inhibit adipogenesis. Cell Death Dis. 2017, 8, 3201. [Google Scholar] [CrossRef] [Green Version]
- Gong, F.; Chiu, L.Y.; Miller, K.M. Acetylation reader proteins: Linking acetylation signaling to genome maintenance and cancer. PLoS Genet. 2016, 12, e1006272. [Google Scholar] [CrossRef] [PubMed]
- Tian, T.V.; Di Stefano, B.; Stik, G.; Vila-Casadesus, M.; Sardina, J.L.; Vidal, E.; Dasti, A.; Segura-Morales, C.; De Andres-Aguayo, L.; Gomez, A.; et al. Whsc1 links pluripotency exit with mesendoderm specification. Nat. Cell Biol. 2019, 21, 824–834. [Google Scholar] [CrossRef] [PubMed]
- Dey, A.; Yang, W.; Gegonne, A.; Nishiyama, A.; Pan, R.; Yagi, R.; Grinberg, A.; Finkelman, F.D.; Pfeifer, K.; Zhu, J.; et al. BRD4 directs hematopoietic stem cell development and modulates macrophage inflammatory responses. EMBO J. 2019, 38, e100293. [Google Scholar] [CrossRef] [PubMed]
- Inoue, T.; Hariya, N.; Imamochi, Y.; Dey, A.; Ozato, K.; Goda, T.; Kubota, T.; Mochizuki, K. Epigenetic regulation of lipoprotein lipase gene via BRD4, which is potentially associated with adipocyte differentiation and insulin resistance. Eur. J. Pharmacol. 2019, 858, 172492. [Google Scholar] [CrossRef]
- Yamada, A.; Honma, K.; Mochizuki, K.; Goda, T. BRD4 regulates fructose-inducible lipid accumulation-related genes in the mouse liver. Metabolism 2016, 65, 1478–1488. [Google Scholar] [CrossRef]
- Sakurai, N.; Inamochi, Y.; Inoue, T.; Hariya, N.; Kawamura, M.; Yamada, M.; Dey, A.; Nishiyama, A.; Kubota, T.; Ozato, K.; et al. BRD4 regulates adiponectin gene induction by recruiting the P-TEFb complex to the transcribed region of the gene. Sci. Rep. 2017, 7, 11962. [Google Scholar] [CrossRef] [PubMed]
- Schmidt, S.F.; Larsen, B.D.; Loft, A.; Nielsen, R.; Madsen, J.G.; Mandrup, S. Acute TNF-induced repression of cell identity genes is mediated by NFkappaB-directed redistribution of cofactors from super-enhancers. Genome Res. 2015, 25, 1281–1294. [Google Scholar] [CrossRef] [Green Version]
- Takahashi, A.; Nagata, M.; Gupta, A.; Matsushita, Y.; Yamaguchi, T.; Mizuhashi, K.; Maki, K.; Ruellas, A.C.; Cevidanes, L.S.; Kronenberg, H.M.; et al. Autocrine regulation of mesenchymal progenitor cell fates orchestrates tooth eruption. Proc. Natl. Acad. Sci. USA 2019, 116, 575–580. [Google Scholar] [CrossRef] [Green Version]
- Lin, J.C. RBM4-MEF2C network constitutes a feed-forward circuit that facilitates the differentiation of brown adipocytes. RNA Biol. 2015, 12, 208–220. [Google Scholar] [CrossRef] [Green Version]
- Shimizu, T.; Yamakuchi, M.; Biswas, K.K.; Aryal, B.; Yamada, S.; Hashiguchi, T.; Maruyama, I. HMGB1 is secreted by 3T3-L1 adipocytes through JNK signaling and the secretion is partially inhibited by adiponectin. Obesity 2016, 24, 1913–1921. [Google Scholar] [CrossRef] [Green Version]
- Baudhuin, M.; Lamoureux, F.; Jacques, C.; Rodriguez Calleja, L.; Quillard, T.; Charrier, C.; Amiaud, J.; Berreur, M.; Brounais-LeRoyer, B.; Owen, R.; et al. Inhibition of BET proteins and epigenetic signaling as a potential treatment for osteoporosis. Bone 2017, 94, 10–21. [Google Scholar] [CrossRef] [PubMed]
- Li, H.; Liu, P.; Xu, S.; Li, Y.; Dekker, J.D.; Li, B.; Fan, Y.; Zhang, Z.; Hong, Y.; Yang, G.; et al. FOXP1 controls mesenchymal stem cell commitment and senescence during skeletal aging. J. Clin. Investig. 2017, 127, 1241–1253. [Google Scholar] [CrossRef] [PubMed]
- Zhao, H.; Zhou, W.; Yao, Z.; Wan, Y.; Cao, J.; Zhang, L.; Zhao, J.; Li, H.; Zhou, R.; Li, B.; et al. Foxp1/2/4 regulate endochondral ossification as a suppresser complex. Dev. Biol. 2015, 398, 242–254. [Google Scholar] [CrossRef] [PubMed] [Green Version]


© 2020 by the authors. Licensee MDPI, Basel, Switzerland. This article is an open access article distributed under the terms and conditions of the Creative Commons Attribution (CC BY) license (http://creativecommons.org/licenses/by/4.0/).
Share and Cite
Wang, F.-S.; Chen, Y.-S.; Ko, J.-Y.; Kuo, C.-W.; Ke, H.-J.; Hsieh, C.-K.; Wang, S.-Y.; Kuo, P.-C.; Jahr, H.; Lian, W.-S. Bromodomain Protein BRD4 Accelerates Glucocorticoid Dysregulation of Bone Mass and Marrow Adiposis by Modulating H3K9 and Foxp1. Cells 2020, 9, 1500. https://doi.org/10.3390/cells9061500
Wang F-S, Chen Y-S, Ko J-Y, Kuo C-W, Ke H-J, Hsieh C-K, Wang S-Y, Kuo P-C, Jahr H, Lian W-S. Bromodomain Protein BRD4 Accelerates Glucocorticoid Dysregulation of Bone Mass and Marrow Adiposis by Modulating H3K9 and Foxp1. Cells. 2020; 9(6):1500. https://doi.org/10.3390/cells9061500
Chicago/Turabian StyleWang, Feng-Sheng, Yu-Shan Chen, Jih-Yang Ko, Chung-Wen Kuo, Huei-Jing Ke, Chin-Kuei Hsieh, Shao-Yu Wang, Pei-Chen Kuo, Holger Jahr, and Wei-Shiung Lian. 2020. "Bromodomain Protein BRD4 Accelerates Glucocorticoid Dysregulation of Bone Mass and Marrow Adiposis by Modulating H3K9 and Foxp1" Cells 9, no. 6: 1500. https://doi.org/10.3390/cells9061500