Investigation of Ultrasound-Mediated Intracellular Ca2+ Oscillations in HIT-T15 Pancreatic β-Cell Line

 and
and 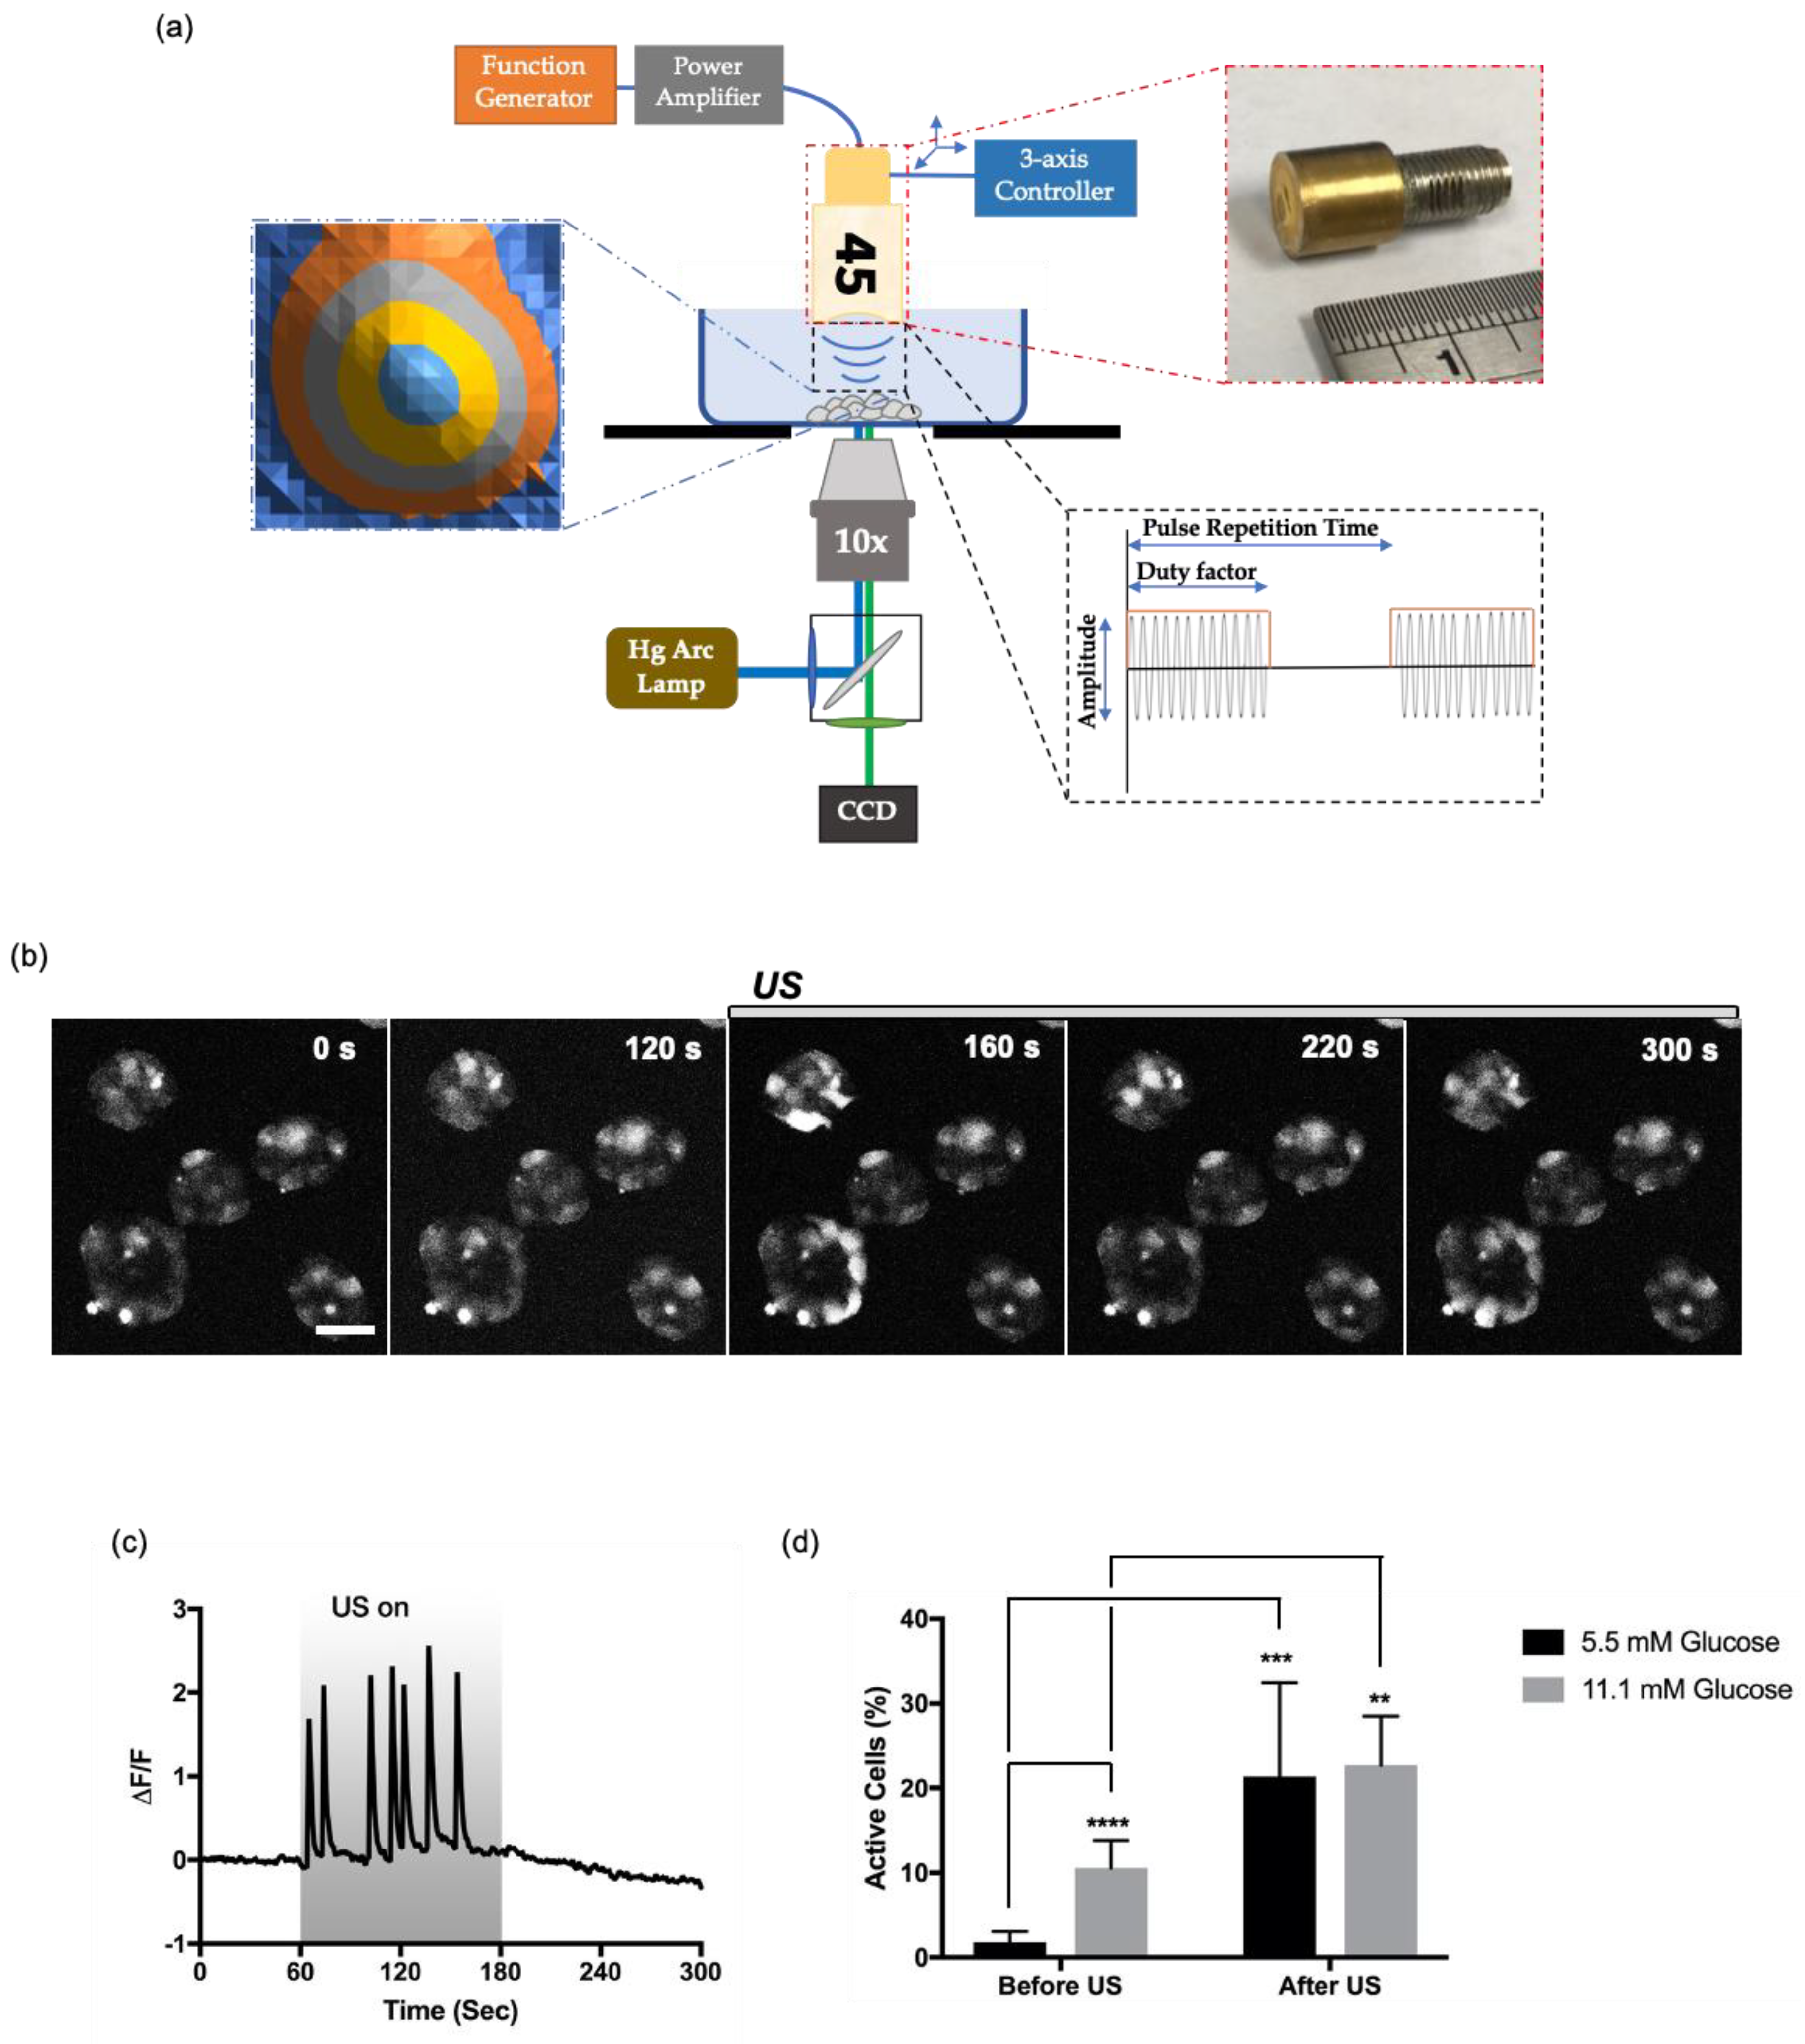
Abstract
:1. Introduction
2. Materials and Methods
2.1. Reagents and Inhibitors
2.2. Cell Preparation
2.3. Ultrasound Stimulation
2.4. Live Intracellular Ca2+ Imaging
2.5. Data Processing and Statistics
3. Results
3.1. Intracellular Ca2+ Dynamics in HIT-T15 Cells upon Various Stimuli
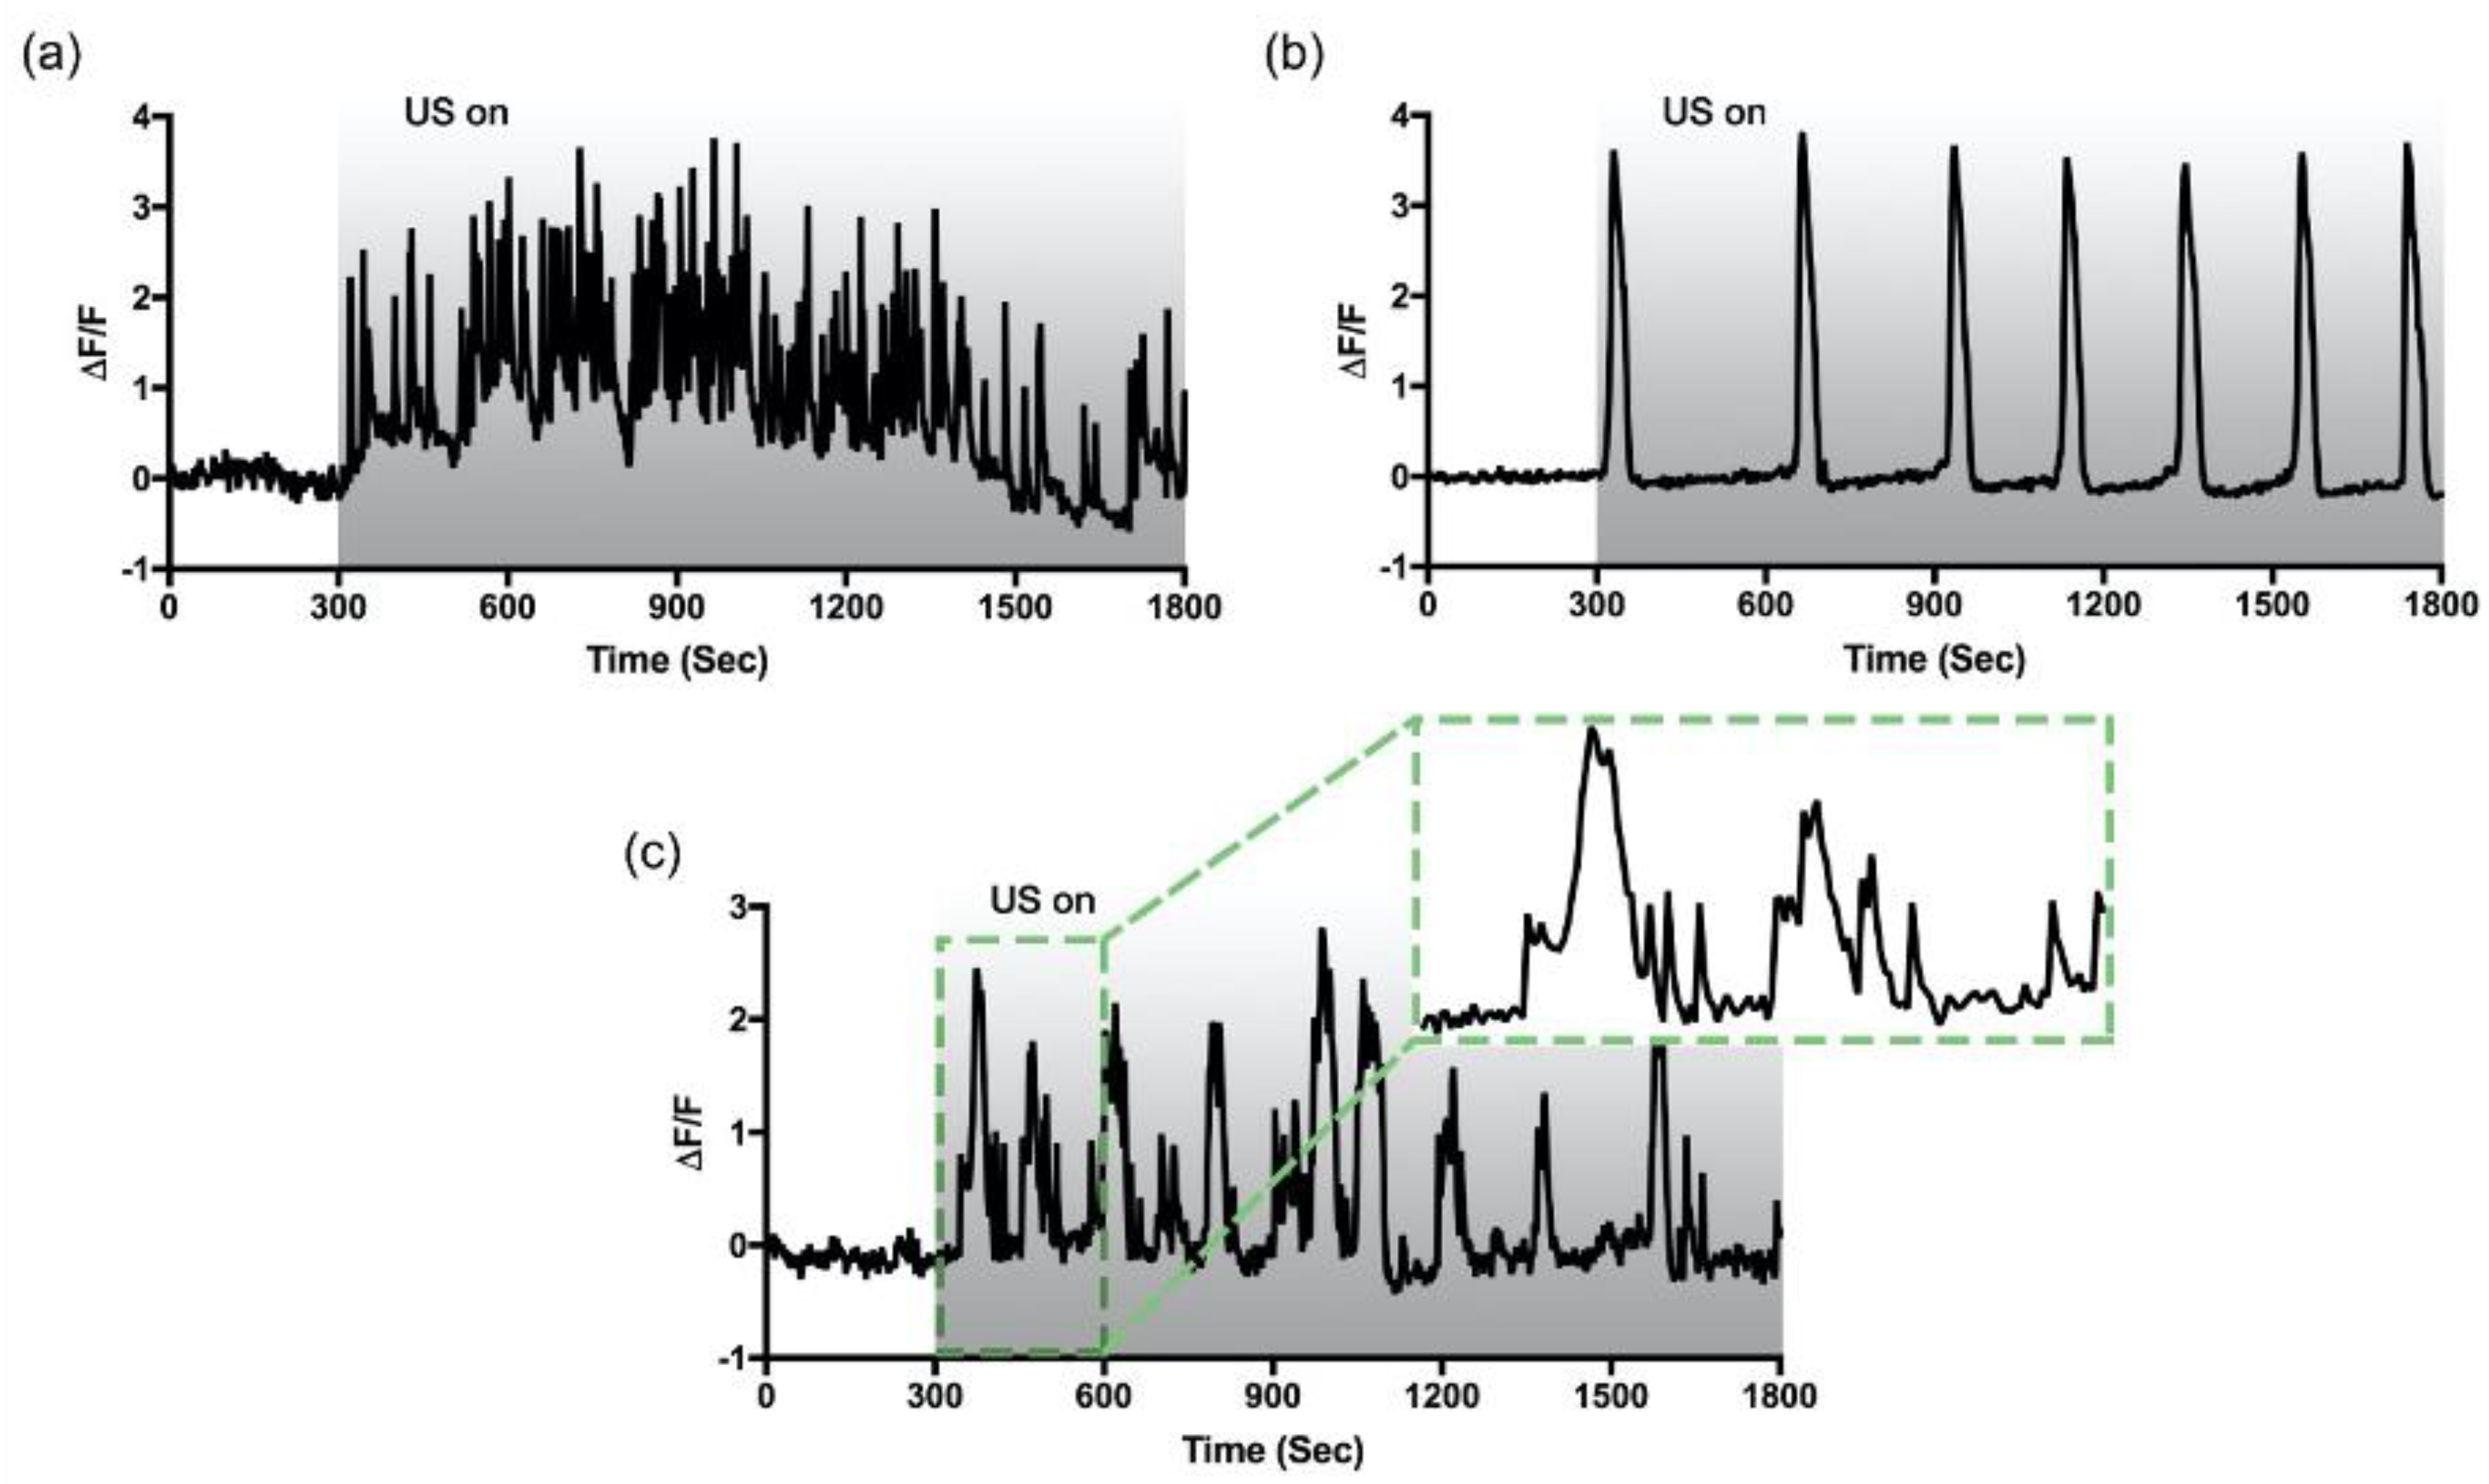
3.2. Two Distinctive Ultrasound-Induced Ca2+ Oscillations
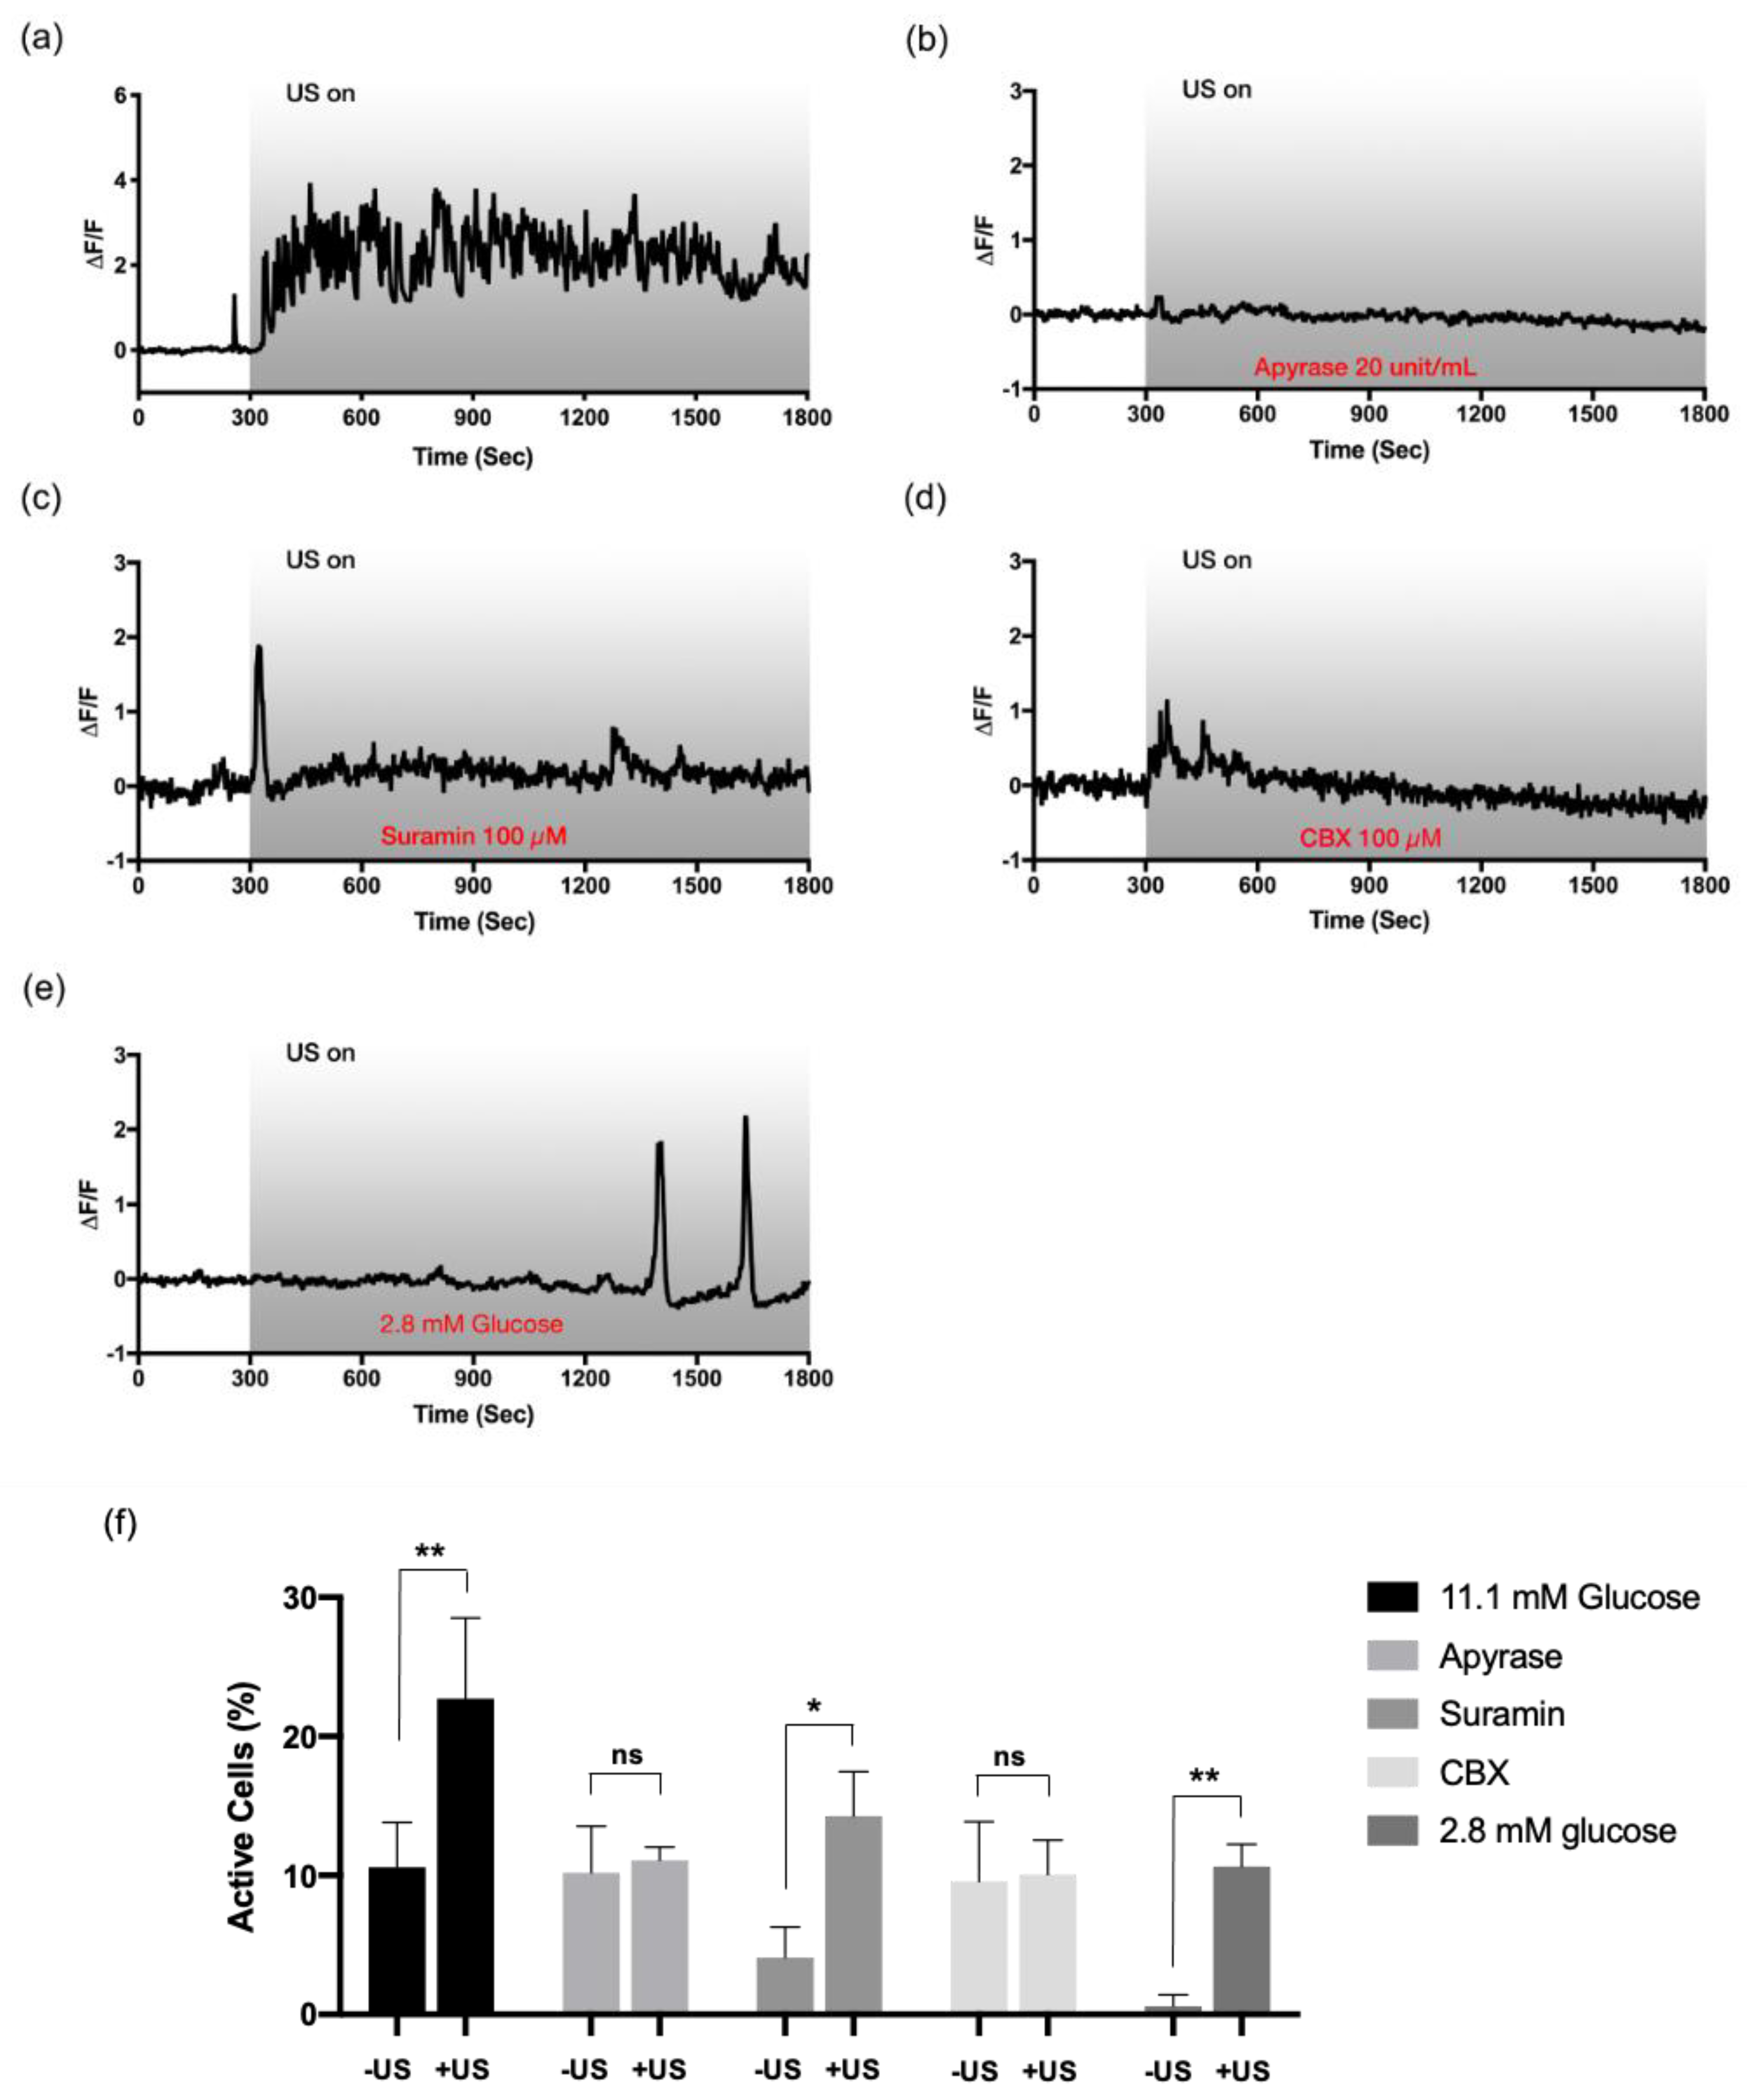
3.3. The Involvement of Purinergic P2 Signaling
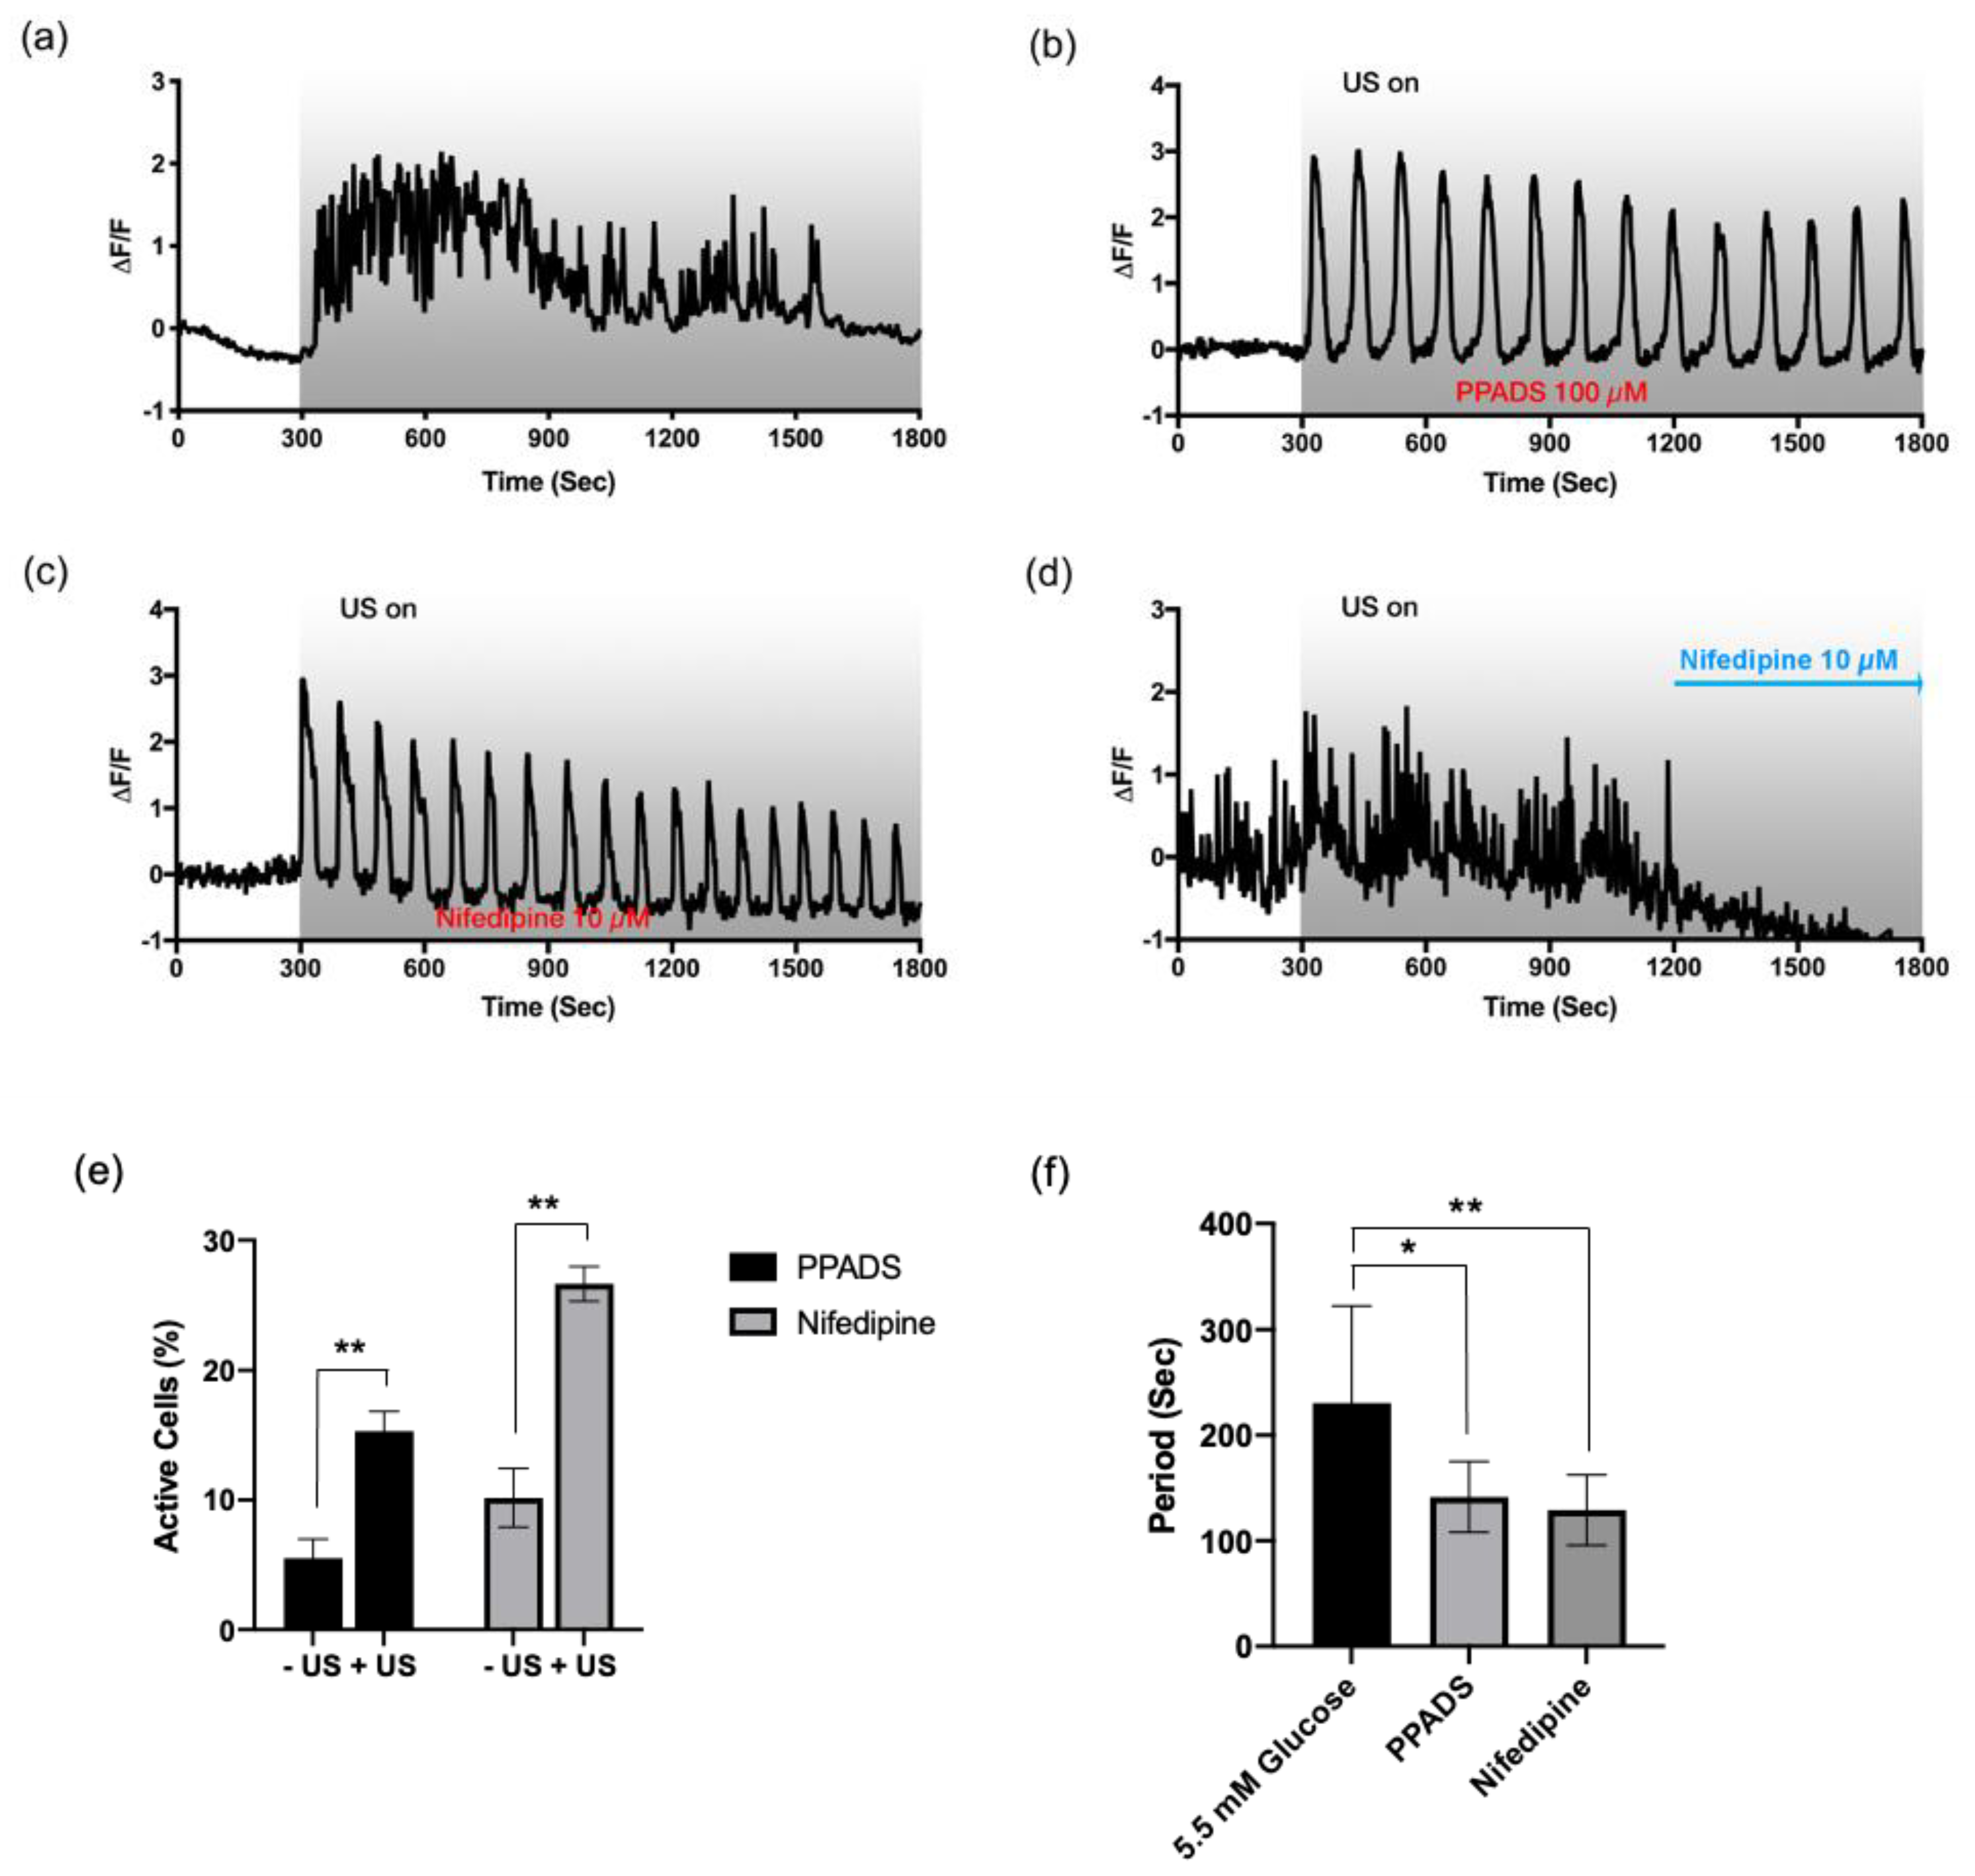
3.4. Fast and Irregular Oscillation Depends on P2X Receptors Coupled to L-Type Ca2+ Channels
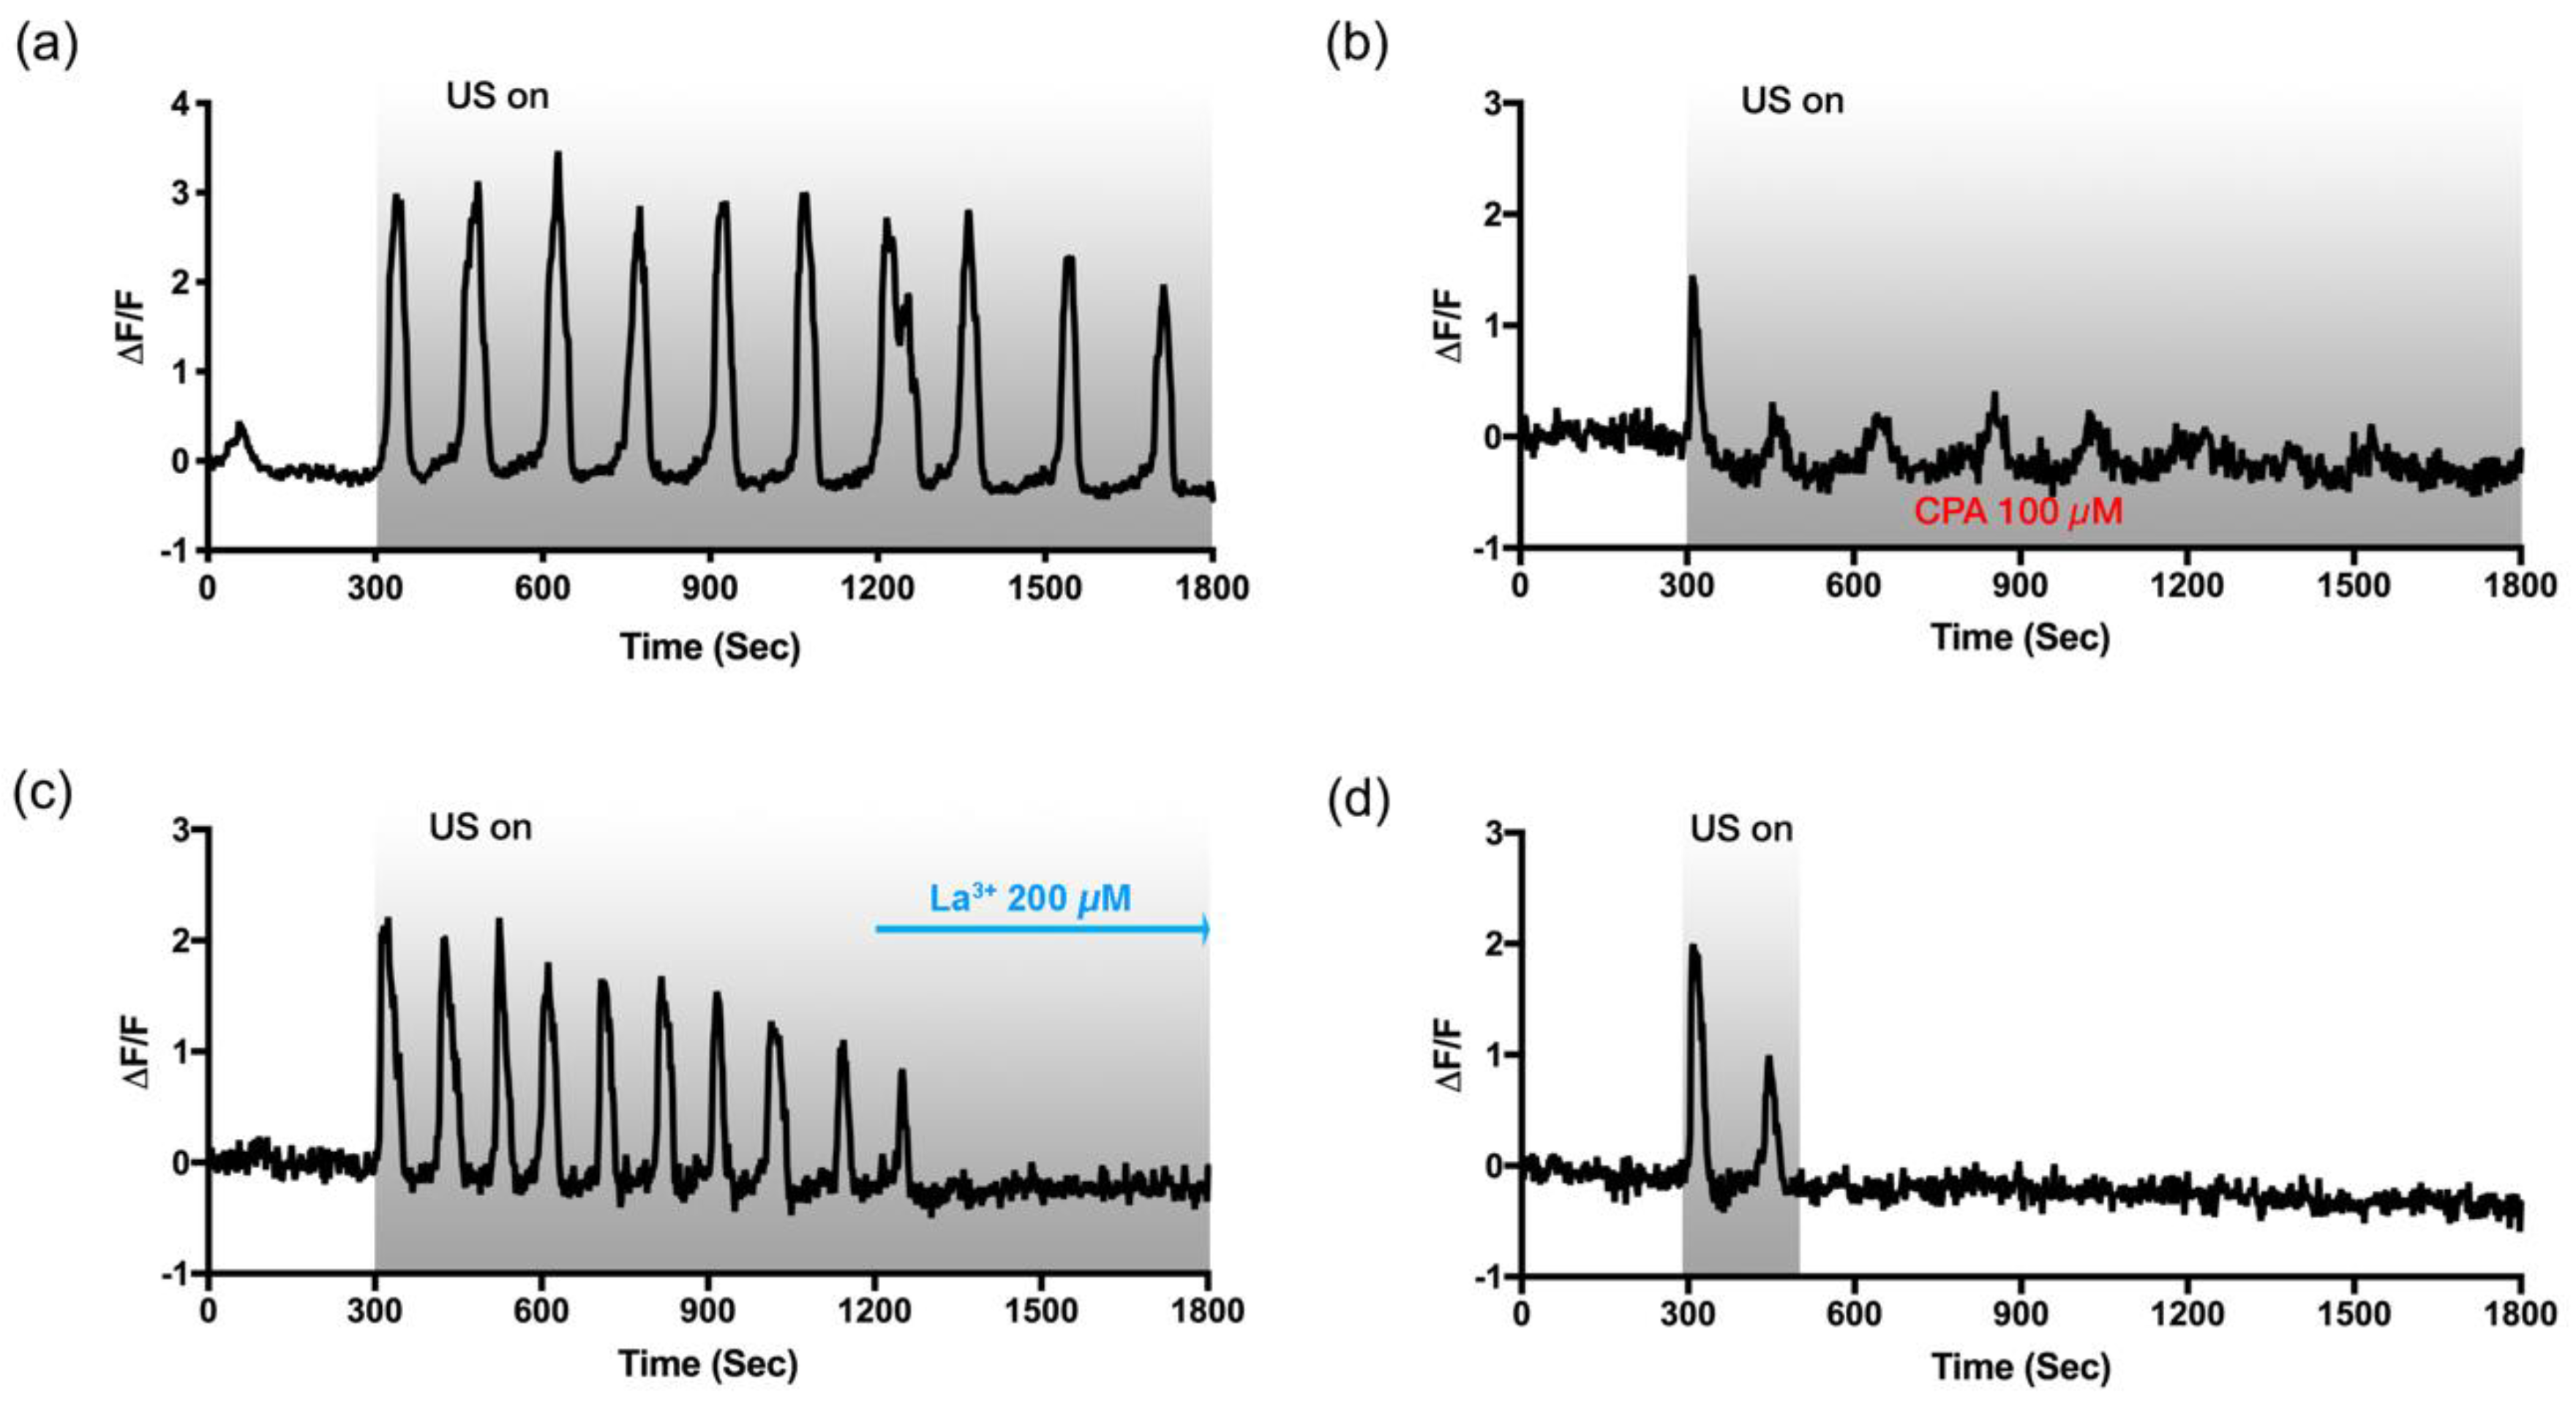
3.5. Slow and Periodic Oscillation Depends on P2Y Receptors and Store-Operated Ca2+ Channels
4. Discussion
Supplementary Materials
Author Contributions
Funding
Acknowledgments
Conflicts of Interest
References
- Nathan, D.M.; Schreiber, E.; Fogel, H.; Mojsov, S.; Habener, J.F. Insulinotropic action of glucagonlike peptide-I-(7-37) in diabetic and nondiabetic subjects. Diabetes Care 1992, 15, 270–276. [Google Scholar] [CrossRef]
- Lundquist, I.; Alm, P.; Salehi, A.; Henningsson, R.; Grapengiesser, E.; Hellman, B. Carbon monoxide stimulates insulin release and propagates Ca2+ signals between pancreatic beta-cells. Am. J. Physiol. Endocrinol. Metab. 2003, 285, E1055–E1063. [Google Scholar] [CrossRef] [PubMed]
- Ashcroft, F.M.; Rorsman, P. ATP-sensitive K+ channels: A link between B-cell metabolism and insulin secretion. Biochem. Soc. Trans. 1990, 18, 109–111. [Google Scholar] [CrossRef] [PubMed]
- Newsholme, P.; Gaudel, C.; McClenaghan, N.H. Nutrient regulation of insulin secretion and beta-cell functional integrity. Adv. Exp. Med. Biol. 2010, 654, 91–114. [Google Scholar] [CrossRef] [PubMed]
- Lang, D.A.; Matthews, D.R.; Peto, J.; Turner, R.C. Cyclic oscillations of basal plasma glucose and insulin concentrations in human beings. N. Engl. J. Med. 1979, 301, 1023–1027. [Google Scholar] [CrossRef]
- Bratusch-Marrain, P.R.; Komjati, M.; Waldhäusl, W.K. Efficacy of pulsatile versus continuous insulin administration on hepatic glucose production and glucose utilization in type I diabetic humans. Diabetes 1986, 35, 922–926. [Google Scholar] [CrossRef]
- Matthews, D.R.; Lang, D.A.; Burnett, M.A.; Turner, R.C. Control of pulsatile insulin secretion in man. Diabetologia 1983, 24, 231–237. [Google Scholar] [CrossRef] [Green Version]
- Paolisso, G.; Sgambato, S.; Torella, R.; Varricchio, M.; Scheen, A.; D’Onofrio, F.; Lefèbvre, P.J. Pulsatile insulin delivery is more efficient than continuous infusion in modulating islet cell function in normal subjects and patients with type 1 diabetes. J. Clin. Endocrinol. Metab. 1988, 66, 1220–1226. [Google Scholar] [CrossRef]
- O’Meara, N.M.; Sturis, J.; Herold, K.C.; Ostrega, D.M.; Polonsky, K.S. Alterations in the patterns of insulin secretion before and after diagnosis of IDDM. Diabetes Care 1995, 18, 568–571. [Google Scholar] [CrossRef]
- Lang, D.A.; Matthews, D.R.; Burnett, M.; Turner, R.C. Brief, irregular oscillations of basal plasma insulin and glucose concentrations in diabetic man. Diabetes 1981, 30, 435–439. [Google Scholar] [CrossRef]
- Hagren, O.I.; Tengholm, A. Glucose and insulin synergistically activate phosphatidylinositol 3-kinase to trigger oscillations of phosphatidylinositol 3,4,5-trisphosphate in beta-cells. J. Biol. Chem. 2006, 281, 39121–39127. [Google Scholar] [CrossRef] [PubMed] [Green Version]
- Best, L.; Miley, H.E.; Yates, A.P. Activation of an anion conductance and beta-cell depolarization during hypotonically induced insulin release. Exp. Physiol. 1996, 81, 927–933. [Google Scholar] [CrossRef] [PubMed] [Green Version]
- Casas, S.; Novials, A.; Reimann, F.; Gomis, R.; Gribble, F.M. Calcium elevation in mouse pancreatic beta cells evoked by extracellular human islet amyloid polypeptide involves activation of the mechanosensitive ion channel TRPV4. Diabetologia 2008, 51, 2252–2262. [Google Scholar] [CrossRef] [PubMed] [Green Version]
- Suarez Castellanos, I.; Singh, T.; Balteanu, B.; Bhowmick, D.C.; Jeremic, A.; Zderic, V. Calcium-dependent ultrasound stimulation of secretory events from pancreatic beta cells. J. Ther. Ultrasound 2017, 5, 30. [Google Scholar] [CrossRef] [Green Version]
- Hwang, J.Y.; Lee, N.S.; Lee, C.; Lam, K.H.; Kim, H.H.; Woo, J.; Lin, M.Y.; Kisler, K.; Choi, H.; Zhou, Q.; et al. Investigating contactless high frequency ultrasound microbeam stimulation for determination of invasion potential of breast cancer cells. Biotechnol. Bioeng. 2013, 110, 2697–2705. [Google Scholar] [CrossRef] [Green Version]
- Weitz, A.C.; Lee, N.S.; Yoon, C.W.; Bonyad, A.; Goo, K.S.; Kim, S.; Moon, S.; Jung, H.; Zhou, Q.; Chow, R.H.; et al. Functional Assay of Cancer Cell Invasion Potential Based on Mechanotransduction of Focused Ultrasound. Front. Oncol. 2017, 7, 161. [Google Scholar] [CrossRef] [Green Version]
- Hwang, J.Y.; Lim, H.G.; Yoon, C.W.; Lam, K.H.; Yoon, S.; Lee, C.; Chiu, C.T.; Kang, B.J.; Kim, H.H.; Shung, K.K. Non-contact high-frequency ultrasound microbeam stimulation for studying mechanotransduction in human umbilical vein endothelial cells. Ultrasound Med. Biol. 2014, 40, 2172–2182. [Google Scholar] [CrossRef] [Green Version]
- Yoon, C.W.; Jung, H.; Goo, K.; Moon, S.; Koo, K.M.; Lee, N.S.; Weitz, A.C.; Shung, K.K. Low-Intensity Ultrasound Modulates Ca2+ Dynamics in Human Mesenchymal Stem Cells via Connexin 43 Hemichannel. Ann. Biomed. Eng. 2017, 46, 48–59. [Google Scholar] [CrossRef]
- Lam, K.H.; Hsu, H.S.; Li, Y.; Lee, C.; Lin, A.; Zhou, Q.; Kim, E.S.; Shung, K.K. Ultrahigh frequency lensless ultrasonic transducers for acoustic tweezers application. Biotechnol. Bioeng. 2013, 110, 881–886. [Google Scholar] [CrossRef] [Green Version]
- Cannata, J.M.; Ritter, T.A.; Chen, W.H.; Silverman, R.H.; Shung, K.K. Design of efficient, broadband single-element (20-80 MHz) ultrasonic transducers for medical imaging applications. IEEE Trans. Ultrason. Ferroelectr. Freq. Control. 2003, 50, 1548–1557. [Google Scholar] [CrossRef]
- Carpenter, A.E.; Jones, T.R.; Lamprecht, M.R.; Clarke, C.; Kang, I.H.; Friman, O.; Guertin, D.A.; Chang, J.H.; Lindquist, R.A.; Moffat, J.; et al. CellProfiler: Image analysis software for identifying and quantifying cell phenotypes. Genome Biol. 2006, 7, R100. [Google Scholar] [CrossRef] [PubMed] [Green Version]
- Jung, S.K.; Kauri, L.M.; Qian, W.J.; Kennedy, R.T. Correlated oscillations in glucose consumption, oxygen consumption, and intracellular free Ca(2+) in single islets of Langerhans. J. Biol. Chem. 2000, 275, 6642–6650. [Google Scholar] [CrossRef] [PubMed] [Green Version]
- Leech, C.A.; Holz, G.G.; Habener, J.F. Voltage-independent calcium channels mediate slow oscillations of cytosolic calcium that are glucose dependent in pancreatic beta-cells. Endocrinology 1994, 135, 365–372. [Google Scholar] [CrossRef] [PubMed]
- Lee, N.S.; Rohan, J.G.; Zitting, M.; Kamath, S.; Weitz, A.; Sipos, A.; Salvaterra, P.M.; Hasegawa, K.; Pera, M.; Chow, R.H. A novel dual-color reporter for identifying insulin-producing beta-cells and classifying heterogeneity of insulinoma cell lines. PLoS ONE 2012, 7, e35521. [Google Scholar] [CrossRef] [PubMed] [Green Version]
- Beauvois, M.C.; Merezak, C.; Jonas, J.C.; Ravier, M.A.; Henquin, J.C.; Gilon, P. Glucose-induced mixed [Ca2+]c oscillations in mouse beta-cells are controlled by the membrane potential and the SERCA3 Ca2+-ATPase of the endoplasmic reticulum. Am. J. Physiol. Cell Physiol. 2006, 290, C1503–C1511. [Google Scholar] [CrossRef] [PubMed] [Green Version]
- Burnstock, G. Purinergic signalling in endocrine organs. Purinergic. Signal. 2014, 10, 189–231. [Google Scholar] [CrossRef] [Green Version]
- Tahani, H.M. The purinergic nerve hypothesis and insulin secretion. Z Ernahrungswiss 1979, 18, 128–138. [Google Scholar] [CrossRef]
- Bertrand, G.; Chapal, J.; Loubatieres-Mariani, M.M. Potentiating synergism between adenosine diphosphate or triphosphate and acetylcholine on insulin secretion. Am. J. Physiol. 1986, 251, E416–E421. [Google Scholar] [CrossRef]
- Leitner, J.W.; Sussman, K.E.; Vatter, A.E.; Schneider, F.H. Adenine nucleotides in the secretory granule fraction of rat islets. Endocrinology 1975, 96, 662–677. [Google Scholar] [CrossRef]
- Petit, P.; Lajoix, A.D.; Gross, R. P2 purinergic signalling in the pancreatic beta-cell: Control of insulin secretion and pharmacology. Eur. J. Pharm. Sci. 2009, 37, 67–75. [Google Scholar] [CrossRef]
- Novak, I. Purinergic receptors in the endocrine and exocrine pancreas. Purinergic. Signal. 2008, 4, 237–253. [Google Scholar] [CrossRef] [Green Version]
- Satin, L.S.; Tavalin, S.J.; Kinard, T.A.; Teague, J. Contribution of L- and non-L-type calcium channels to voltage-gated calcium current and glucose-dependent insulin secretion in HIT-T15 cells. Endocrinology 1995, 136, 4589–4601. [Google Scholar] [CrossRef] [PubMed]
- Bertrand, G.; Chapal, J.; Loubatieres-Mariani, M.M.; Roye, M. Evidence for two different P2-purinoceptors on beta cell and pancreatic vascular bed. Br. J. Pharmacol. 1987, 91, 783–787. [Google Scholar] [CrossRef] [PubMed] [Green Version]
- Lee, D.H.; Park, K.S.; Kim, D.R.; Lee, J.W.; Kong, I.D. Dual effect of ATP on glucose-induced insulin secretion in HIT-T15 cells. Pancreas 2008, 37, 302–308. [Google Scholar] [CrossRef] [PubMed]
- Sabourin, J.; Allagnat, F. Store-operated Ca2+ entry: A key component of the insulin secretion machinery. J. Mol. Endocrinol. 2016, 57, F35–F39. [Google Scholar] [CrossRef] [PubMed]
- Santerre, R.F.; Cook, R.A.; Crisel, R.M.; Sharp, J.D.; Schmidt, R.J.; Williams, D.C.; Wilson, C.P. Insulin synthesis in a clonal cell line of simian virus 40-transformed hamster pancreatic beta cells. Proc. Natl. Acad. Sci. USA 1981, 78, 4339–4343. [Google Scholar] [CrossRef] [Green Version]
- Suarez Castellanos, I.; Jeremic, A.; Cohen, J.; Zderic, V. Ultrasound Stimulation of Insulin Release from Pancreatic Beta Cells as a Potential Novel Treatment for Type 2 Diabetes. Ultrasound Med. Biol. 2017, 43, 1210–1222. [Google Scholar] [CrossRef]
- Dalecki, D. Mechanical bioeffects of ultrasound. Annu. Rev. Biomed. Eng. 2004, 6, 229–248. [Google Scholar] [CrossRef]
- Tufail, Y.; Matyushov, A.; Baldwin, N.; Tauchmann, M.L.; Georges, J.; Yoshihiro, A.; Tillery, S.I.; Tyler, W.J. Transcranial pulsed ultrasound stimulates intact brain circuits. Neuron 2010, 66, 681–694. [Google Scholar] [CrossRef] [Green Version]
- O’Reilly, M.A.; Huang, Y.; Hynynen, K. The impact of standing wave effects on transcranial focused ultrasound disruption of the blood-brain barrier in a rat model. Phys. Med. Biol. 2010, 55, 5251–5267. [Google Scholar] [CrossRef] [Green Version]
- Sato, M.; Nagayama, K.; Kataoka, N.; Sasaki, M.; Hane, K.; Kataoka, N.; Sasaki, M.; Hane, K. Local mechanical properties measured by atomic force microscopy for cultured bovine endothelial cells exposed to shear stress. J. Biomech. 2000, 33, 127–135. [Google Scholar] [CrossRef]
- Boitor, R.; Sinjab, F.; Strohbuecker, S.; Sottile, V.; Notingher, I. Towards quantitative molecular mapping of cells by Raman microscopy: Using AFM for decoupling molecular concentration and cell topography. Faraday Discuss. 2016, 187, 199–212. [Google Scholar] [CrossRef] [PubMed]
- Tengholm, A.; Gylfe, E. Oscillatory control of insulin secretion. Mol. Cell Endocrinol. 2009, 297, 58–72. [Google Scholar] [CrossRef] [PubMed] [Green Version]
- Grapengiesser, E.; Gylfe, E.; Hellman, B. Three types of cytoplasmic Ca2+ oscillations in stimulated pancreatic beta-cells. Arch. Biochem. Biophys. 1989, 268, 404–407. [Google Scholar] [CrossRef]
- Khakh, B.S.; Burnstock, G.; Kennedy, C.; King, B.F.; North, R.A.; Seguela, P.; Voigt, M.; Humphrey, P.P.; Seguela, P.; Voigt, M.; et al. International union of pharmacology. XXIV. Current status of the nomenclature and properties of P2X receptors and their subunits. Pharmacol. Rev. 2001, 53, 107–118. [Google Scholar] [PubMed]
- Abbracchio, M.P.; Burnstock, G.; Boeynaems, J.M.; Barnard, E.A.; Boyer, J.L.; Kennedy, C.; Knight, G.E.; Fumagalli, M.; Gachet, C.; Jacobson, K.A.; et al. International Union of Pharmacology LVIII: Update on the P2Y G protein-coupled nucleotide receptors: From molecular mechanisms and pathophysiology to therapy. Pharmacol. Rev. 2006, 58, 281–341. [Google Scholar] [CrossRef] [PubMed]
- Tanaka, T.; Nagashima, K.; Inagaki, N.; Kioka, H.; Takashima, S.; Fukuoka, H.; Noji, H.; Kakizuka, A.; Imamura, H. Glucose-stimulated single pancreatic islets sustain increased cytosolic ATP levels during initial Ca2+ influx and subsequent Ca2+ oscillations. J. Biol. Chem. 2014, 289, 2205–2216. [Google Scholar] [CrossRef] [Green Version]
- Jacques-Silva, M.C.; Correa-Medina, M.; Cabrera, O.; Rodriguez-Diaz, R.; Makeeva, N.; Fachado, A.; Diez, J.; Berman, D.M.; Kenyon, N.S.; Ricordi, C.; et al. ATP-gated P2 × 3 receptors constitute a positive autocrine signal for insulin release in the human pancreatic beta cell. Proc. Natl. Acad. Sci. USA 2010, 107, 6465–6470. [Google Scholar] [CrossRef] [Green Version]
- Gong, Q.; Kakei, M.; Koriyama, N.; Nakazaki, M.; Morimitsu, S.; Yaekura, K.; Tei, C. P2Y-purinoceptor mediated inhibition of L-type Ca2+ channels in rat pancreatic beta-cells. Cell Struct. Funct. 2000, 25, 279–289. [Google Scholar] [CrossRef] [Green Version]
- Qu, Y.; Campbell, D.L.; Strauss, H.C. Modulation of L-type Ca2+ current by extracellular ATP in ferret isolated right ventricular myocytes. J. Physiol. 1993, 471, 295–317. [Google Scholar] [CrossRef]
- Monaghan, K.P.; Koh, S.D.; Ro, S.; Yeom, J.; Horowitz, B.; Sanders, K.M. Nucleotide regulation of the voltage-dependent nonselective cation conductance in murine colonic myocytes. Am. J. Physiol. Cell Physiol. 2006, 291, C985–C994. [Google Scholar] [CrossRef] [PubMed]
- McHugh, D.; Sharp, E.M.; Scheuer, T.; Catterall, W.A. Inhibition of cardiac L-type calcium channels by protein kinase C phosphorylation of two sites in the n-terminal domain. Proc. Natl. Acad. Sci. USA 2000, 97, 12334–12338. [Google Scholar] [CrossRef] [PubMed] [Green Version]
- Bao, L.; Sachs, F.; Dahl, G. Connexins are mechanosensitive. Am. J. Physiol. Cell Physiol. 2004, 287, C1389–C1395. [Google Scholar] [CrossRef] [PubMed] [Green Version]
- Garcia, M.; Knight, M.M. Cyclic loading opens hemichannels to release ATP as part of a chondrocyte mechanotransduction pathway. J. Orthop. Res. 2010, 28, 510–515. [Google Scholar] [CrossRef]
- Takada, H.; Furuya, K.; Sokabe, M. Mechanosensitive ATP release from hemichannels and Ca2+ influx through TRPC6 accelerate wound closure in keratinocytes. J. Cell Sci. 2014, 127, 4159–4171. [Google Scholar] [CrossRef] [Green Version]
- Batra, N.; Burra, S.; Siller-Jackson, A.J.; Gu, S.; Xia, X.; Weber, G.F.; DeSimone, D.; Bonewald, L.F.; Lafer, E.M.; Sprague, E.; et al. Mechanical stress-activated integrin alpha5beta1 induces opening of connexin 43 hemichannels. Proc. Natl. Acad. Sci. USA 2012, 109, 3359–3364. [Google Scholar] [CrossRef] [Green Version]
- Lee, N.S.; Yoon, C.W.; Wang, Q.; Moon, S.; Koo, K.M.; Jung, H.; Chen, R.; Jiang, L.; Lu, G.; Fernandez, A.; et al. Focused ultrasound stimulates ER localized mechanosensitive PANNEXIN-1 to mediate intracellular calcium release in invasive cancer cells. BioRxiv 2020. [Google Scholar] [CrossRef] [Green Version]
- Orriss, I.R.; Key, M.L.; Hajjawi, M.O.; Arnett, T.R. Extracellular ATP released by osteoblasts is a key local inhibitor of bone mineralisation. PLoS ONE 2013, 8, e69057. [Google Scholar] [CrossRef]
- Hoyle, C.H.; Knight, G.E.; Burnstock, G. Suramin antagonizes responses to P2-purinoceptor agonists and purinergic nerve stimulation in the guinea-pig urinary bladder and taenia coli. Br J Pharmacol 1990, 99, 617–621. [Google Scholar] [CrossRef] [Green Version]
- Anselmi, F.; Hernandez, V.H.; Crispino, G.; Seydel, A.; Ortolano, S.; Roper, S.D.; Kessaris, N.; Richardson, W.; Rickheit, G.; Filippov, M.A.; et al. ATP release through connexin hemichannels and gap junction transfer of second messengers propagate Ca2+ signals across the inner ear. Proc. Natl. Acad. Sci. USA 2008, 105, 18770–18775. [Google Scholar] [CrossRef] [Green Version]
- Flores-Soto, E.; Reyes-Garcia, J.; Sommer, B.; Chavez, J.; Barajas-Lopez, C.; Montano, L.M. PPADS, a P2X receptor antagonist, as a novel inhibitor of the reverse mode of the Na+/Ca2+ exchanger in guinea pig airway smooth muscle. Eur. J. Pharmacol. 2012, 674, 439–444. [Google Scholar] [CrossRef] [PubMed]
- Seidler, N.W.; Jona, I.; Vegh, M.; Martonosi, A. Cyclopiazonic acid is a specific inhibitor of the Ca2+-ATPase of sarcoplasmic reticulum. J. Biol. Chem. 1989, 264, 17816–17823. [Google Scholar] [PubMed]
- Nobile, M.; Monaldi, I.; Alloisio, S.; Cugnoli, C.; Ferroni, S. ATP-induced, sustained calcium signalling in cultured rat cortical astrocytes: Evidence for a non-capacitative, P2X7-like-mediated calcium entry. FEBS Lett. 2003, 538, 71–76. [Google Scholar] [CrossRef] [Green Version]
- Tian, C.; Du, L.; Zhou, Y.; Li, M. Store-operated CRAC channel inhibitors: Opportunities and challenges. Future Med. Chem. 2016, 8, 817–832. [Google Scholar] [CrossRef] [Green Version]


© 2020 by the authors. Licensee MDPI, Basel, Switzerland. This article is an open access article distributed under the terms and conditions of the Creative Commons Attribution (CC BY) license (http://creativecommons.org/licenses/by/4.0/).
Share and Cite
Yoon, C.W.; Lee, N.S.; Koo, K.M.; Moon, S.; Goo, K.; Jung, H.; Yoon, C.; Lim, H.G.; Shung, K.K. Investigation of Ultrasound-Mediated Intracellular Ca2+ Oscillations in HIT-T15 Pancreatic β-Cell Line. Cells 2020, 9, 1129. https://doi.org/10.3390/cells9051129
Yoon CW, Lee NS, Koo KM, Moon S, Goo K, Jung H, Yoon C, Lim HG, Shung KK. Investigation of Ultrasound-Mediated Intracellular Ca2+ Oscillations in HIT-T15 Pancreatic β-Cell Line. Cells. 2020; 9(5):1129. https://doi.org/10.3390/cells9051129
Chicago/Turabian StyleYoon, Chi Woo, Nan Sook Lee, Kweon Mo Koo, Sunho Moon, Kyosuk Goo, Hayong Jung, Changhan Yoon, Hae Gyun Lim, and K. Kirk Shung. 2020. "Investigation of Ultrasound-Mediated Intracellular Ca2+ Oscillations in HIT-T15 Pancreatic β-Cell Line" Cells 9, no. 5: 1129. https://doi.org/10.3390/cells9051129