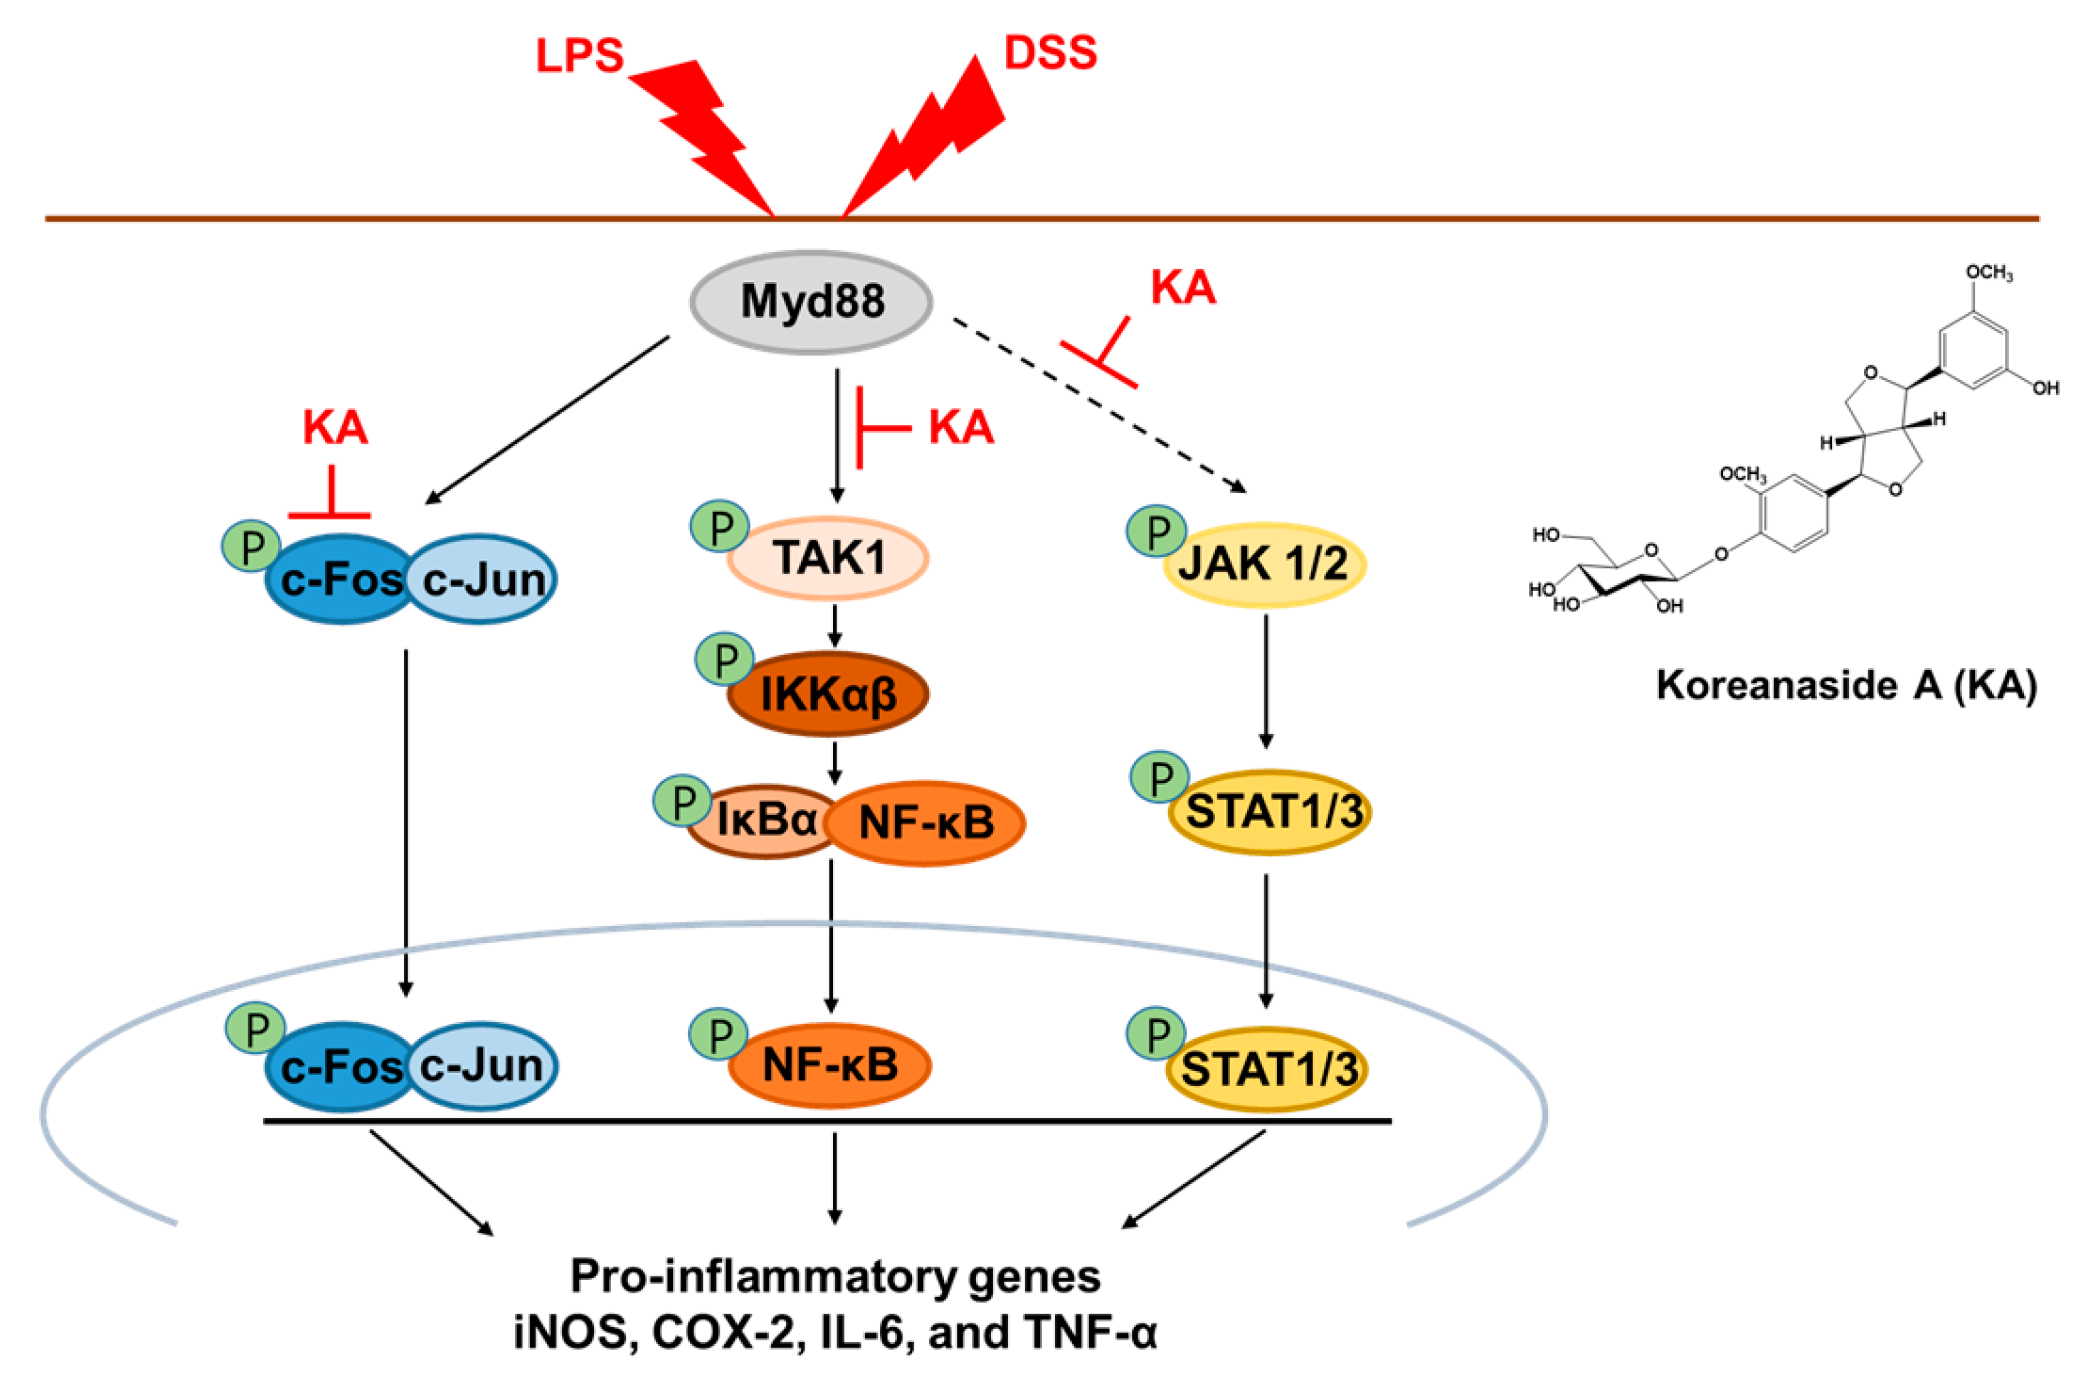
Anti-Inflammatory Mechanisms of Koreanaside A, a Lignan Isolated from the Flower of Forsythia koreana, against LPS-Induced Macrophage Activation and DSS-Induced Colitis Mice: The Crucial Role of AP-1, NF-κB, and JAK/STAT Signaling

 , and
, and 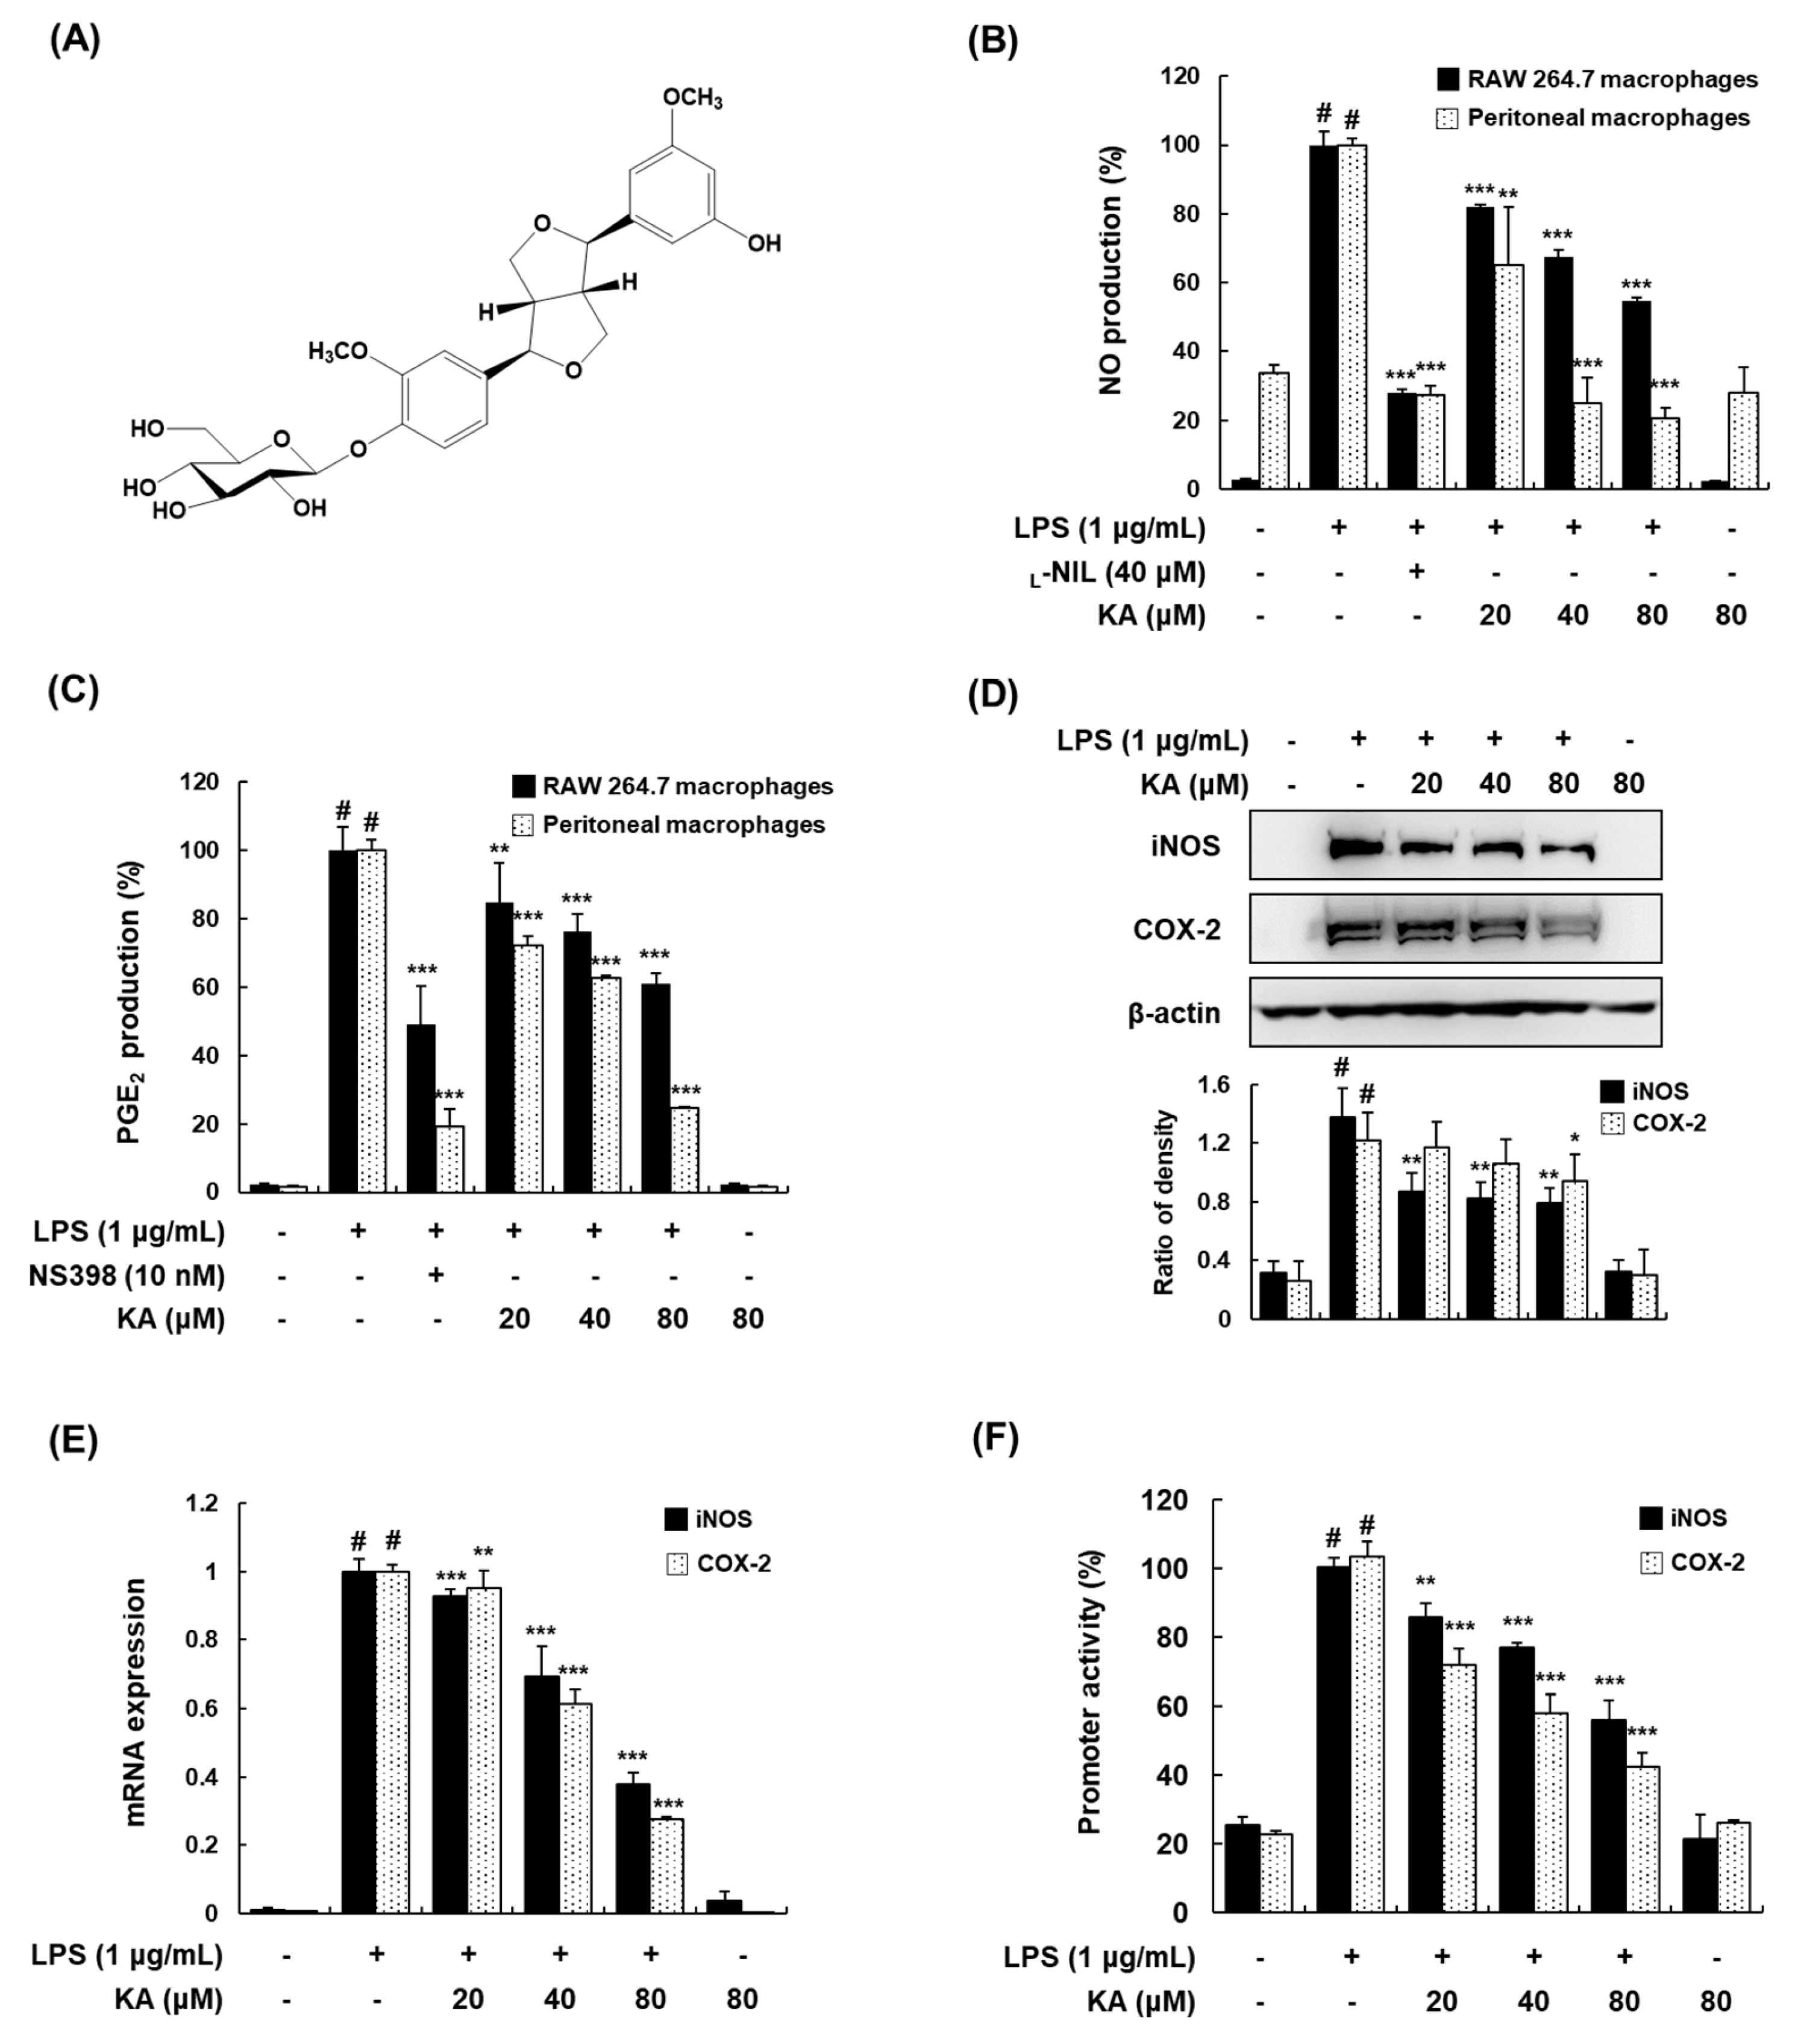
Abstract
:1. Introduction
2. Materials and Methods
2.1. Plants Material and Isolation of Koreanasdie A (KA)
2.2. Cell Culture and Treatment
2.3. Cell Viability Assay
2.4. Determination of NO, PGE2, TNF-α, and IL-6 Production
2.5. Western Blot Analysis
2.6. Plasmid, Transient Transfection, and Luciferase Assay
2.7. RNA Preparation and qRT-PCR
2.8. Nuclear Extraction and Electrophoretic Mobility Shift Assay (EMSA)
2.9. Experimental Animals
2.10. Induction of Colitis
2.11. Histopathology
2.12. Statistical Analysis
3. Results
3.1. KA Inhibits NO and PGE2 Production through the Suppression of iNOS and COX-2 Expression in LPS-Induced RAW 264.7 and Peritoneal Macrophages
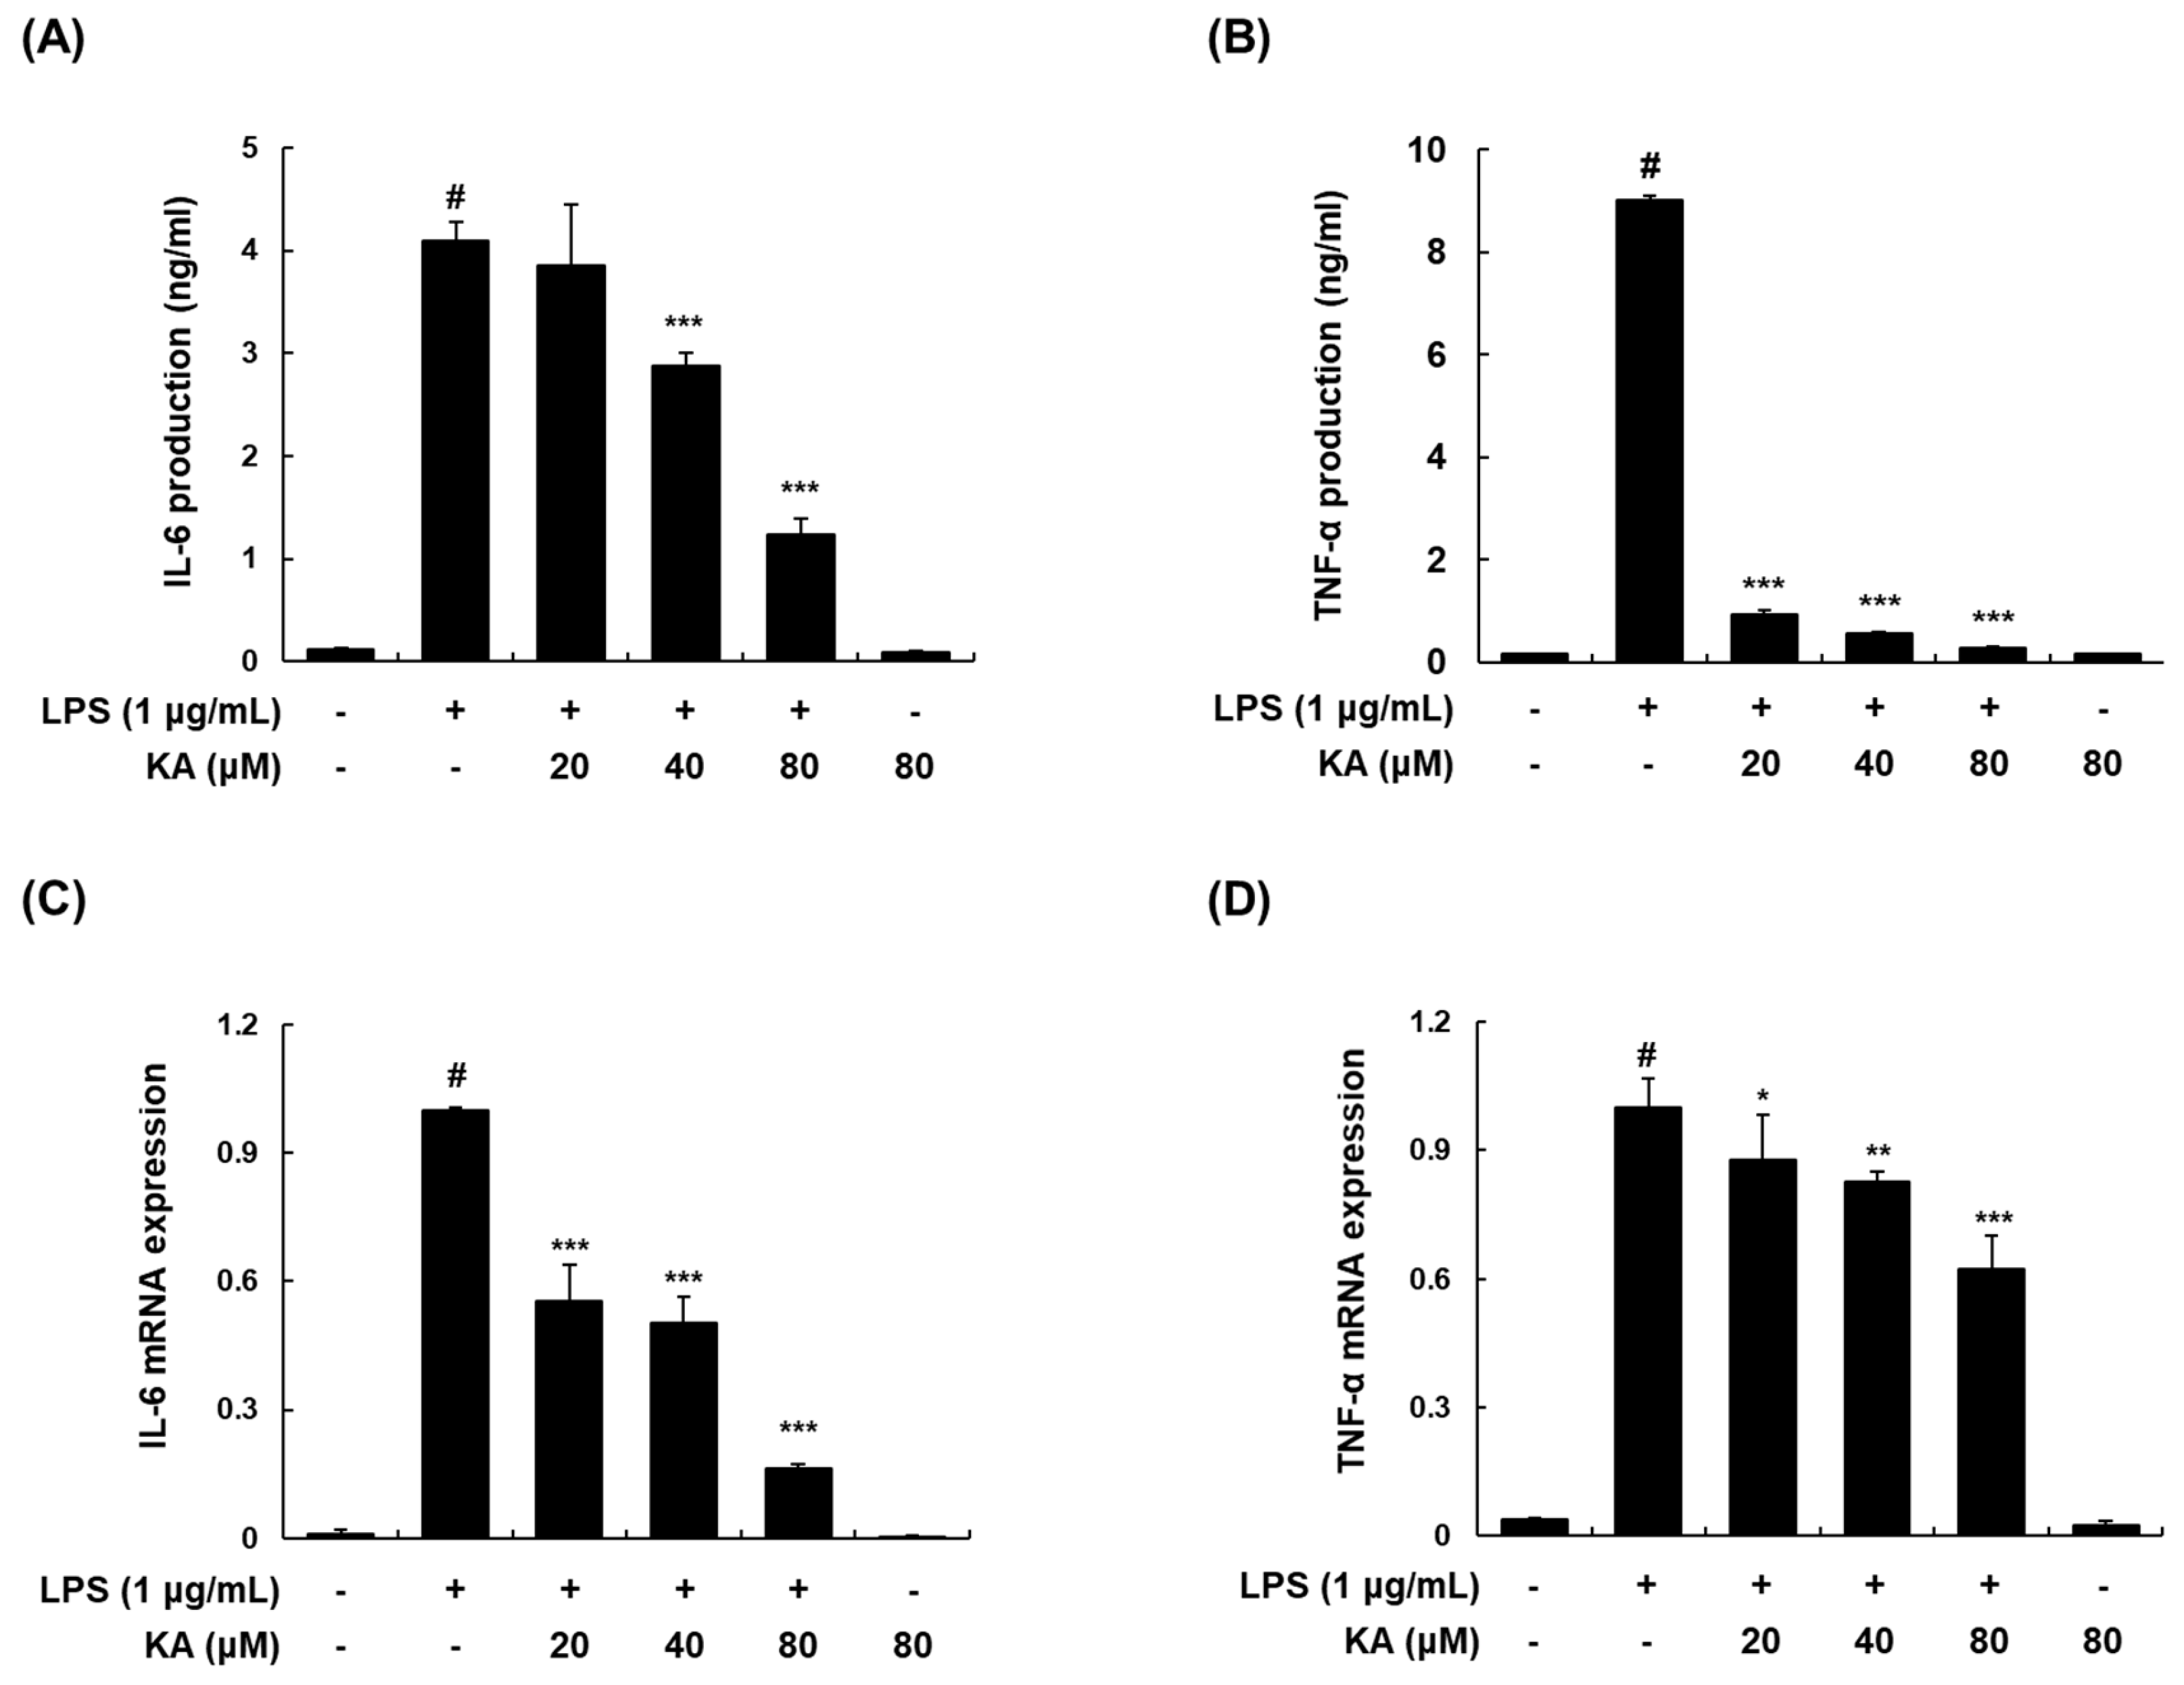
3.2. KA Inhibits LPS-Induced IL-6 and TNF-α Production and Expression in LPS-Induced RAW 264.7 Macrophages
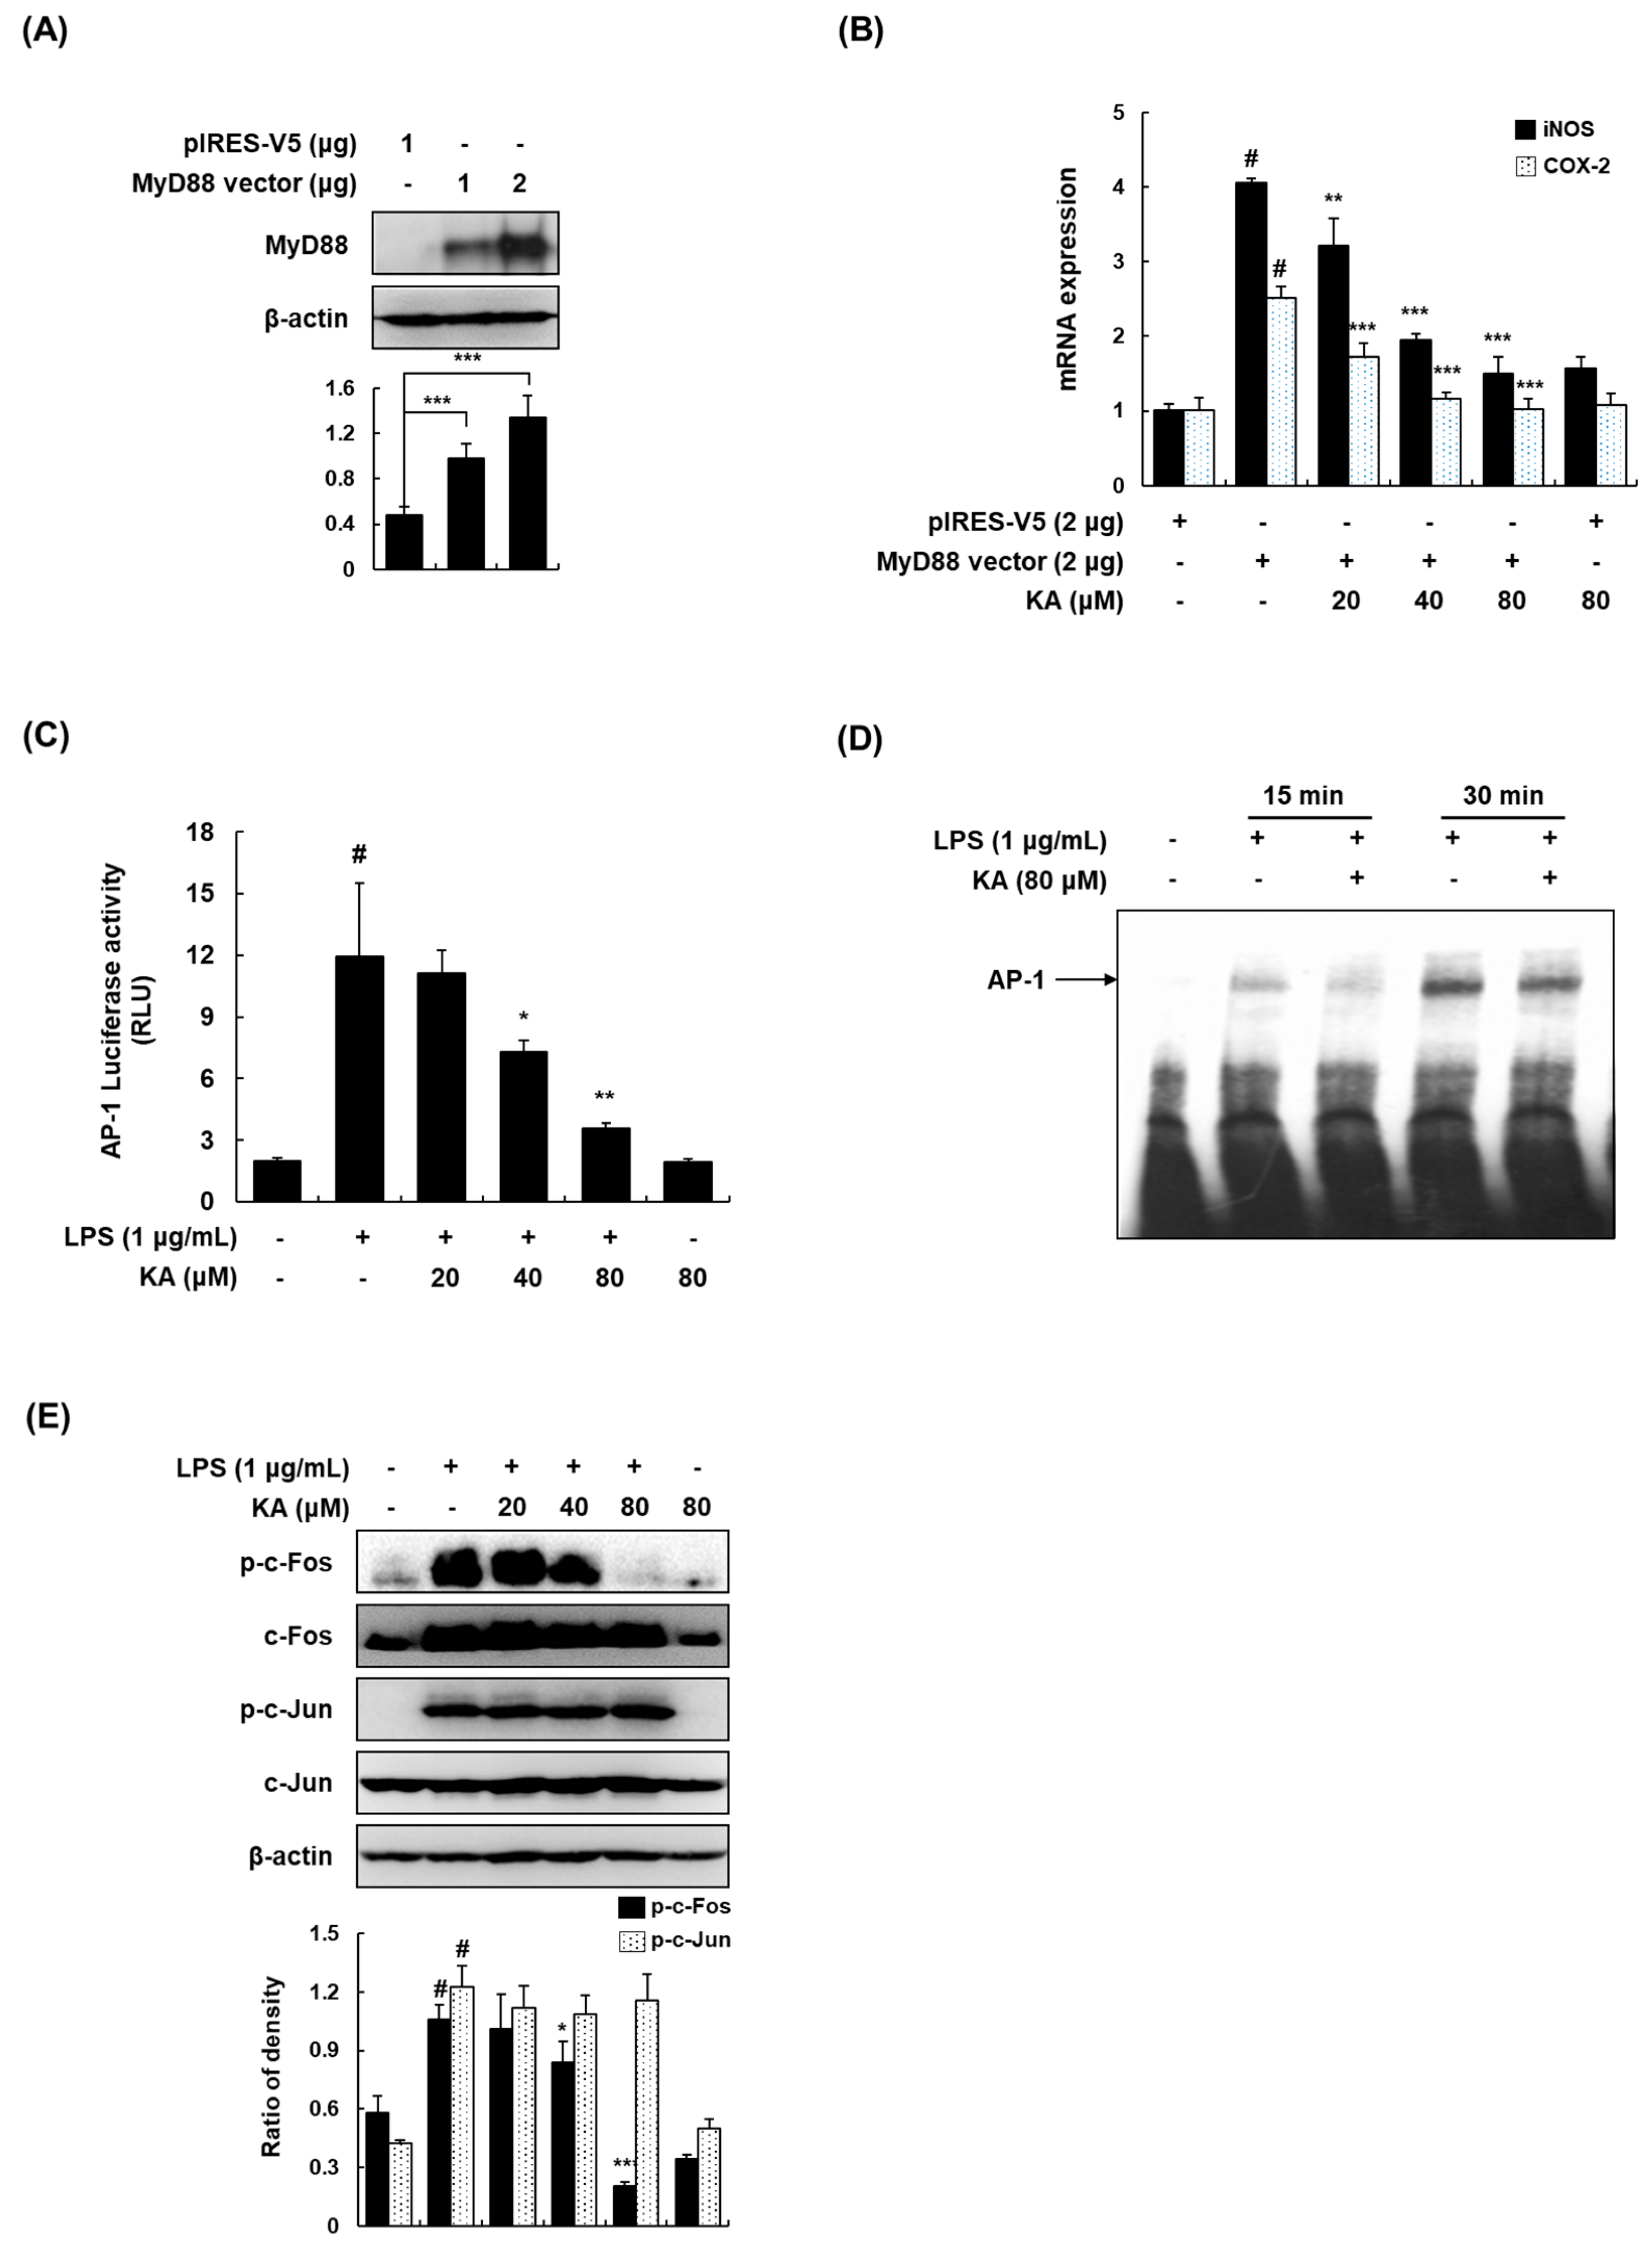
3.3. KA Inhibits the AP-1 Signaling Pathway in LPS-Induced RAW 264.7 Macrophages
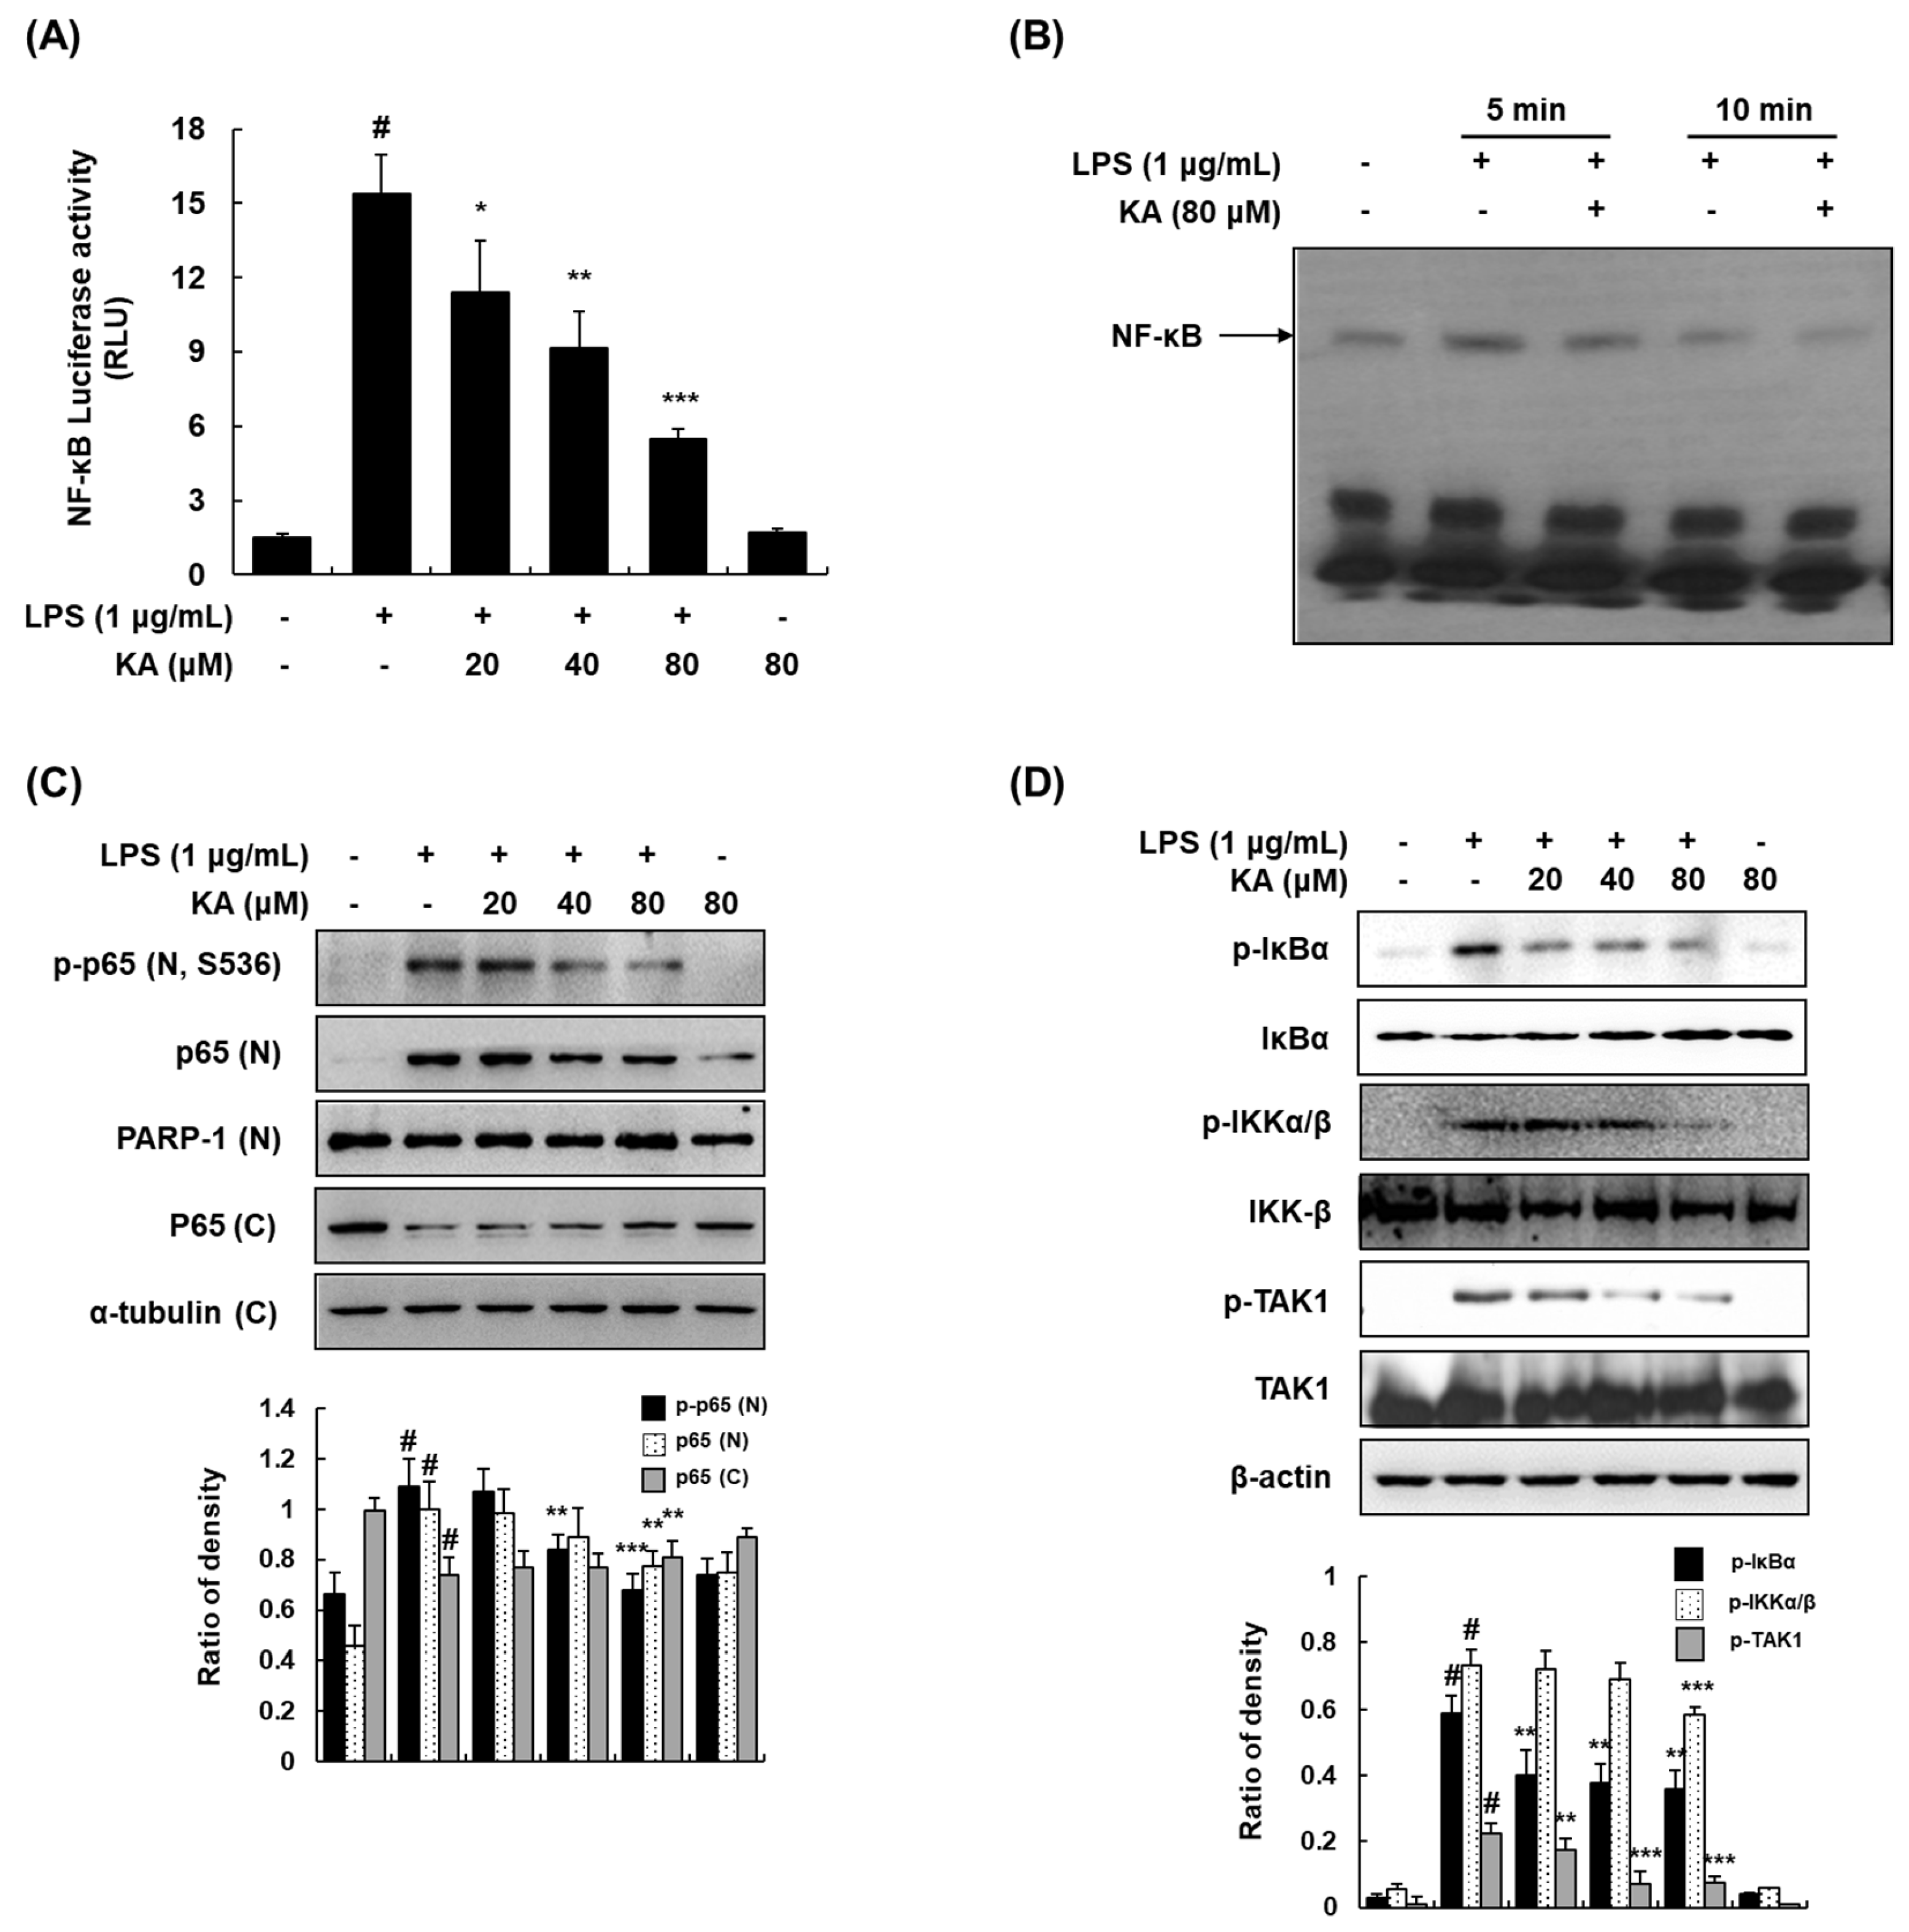
3.4. KA Inhibits the NF-κB Signaling Pathway in LPS-Induced RAW 264.7 Macrophages
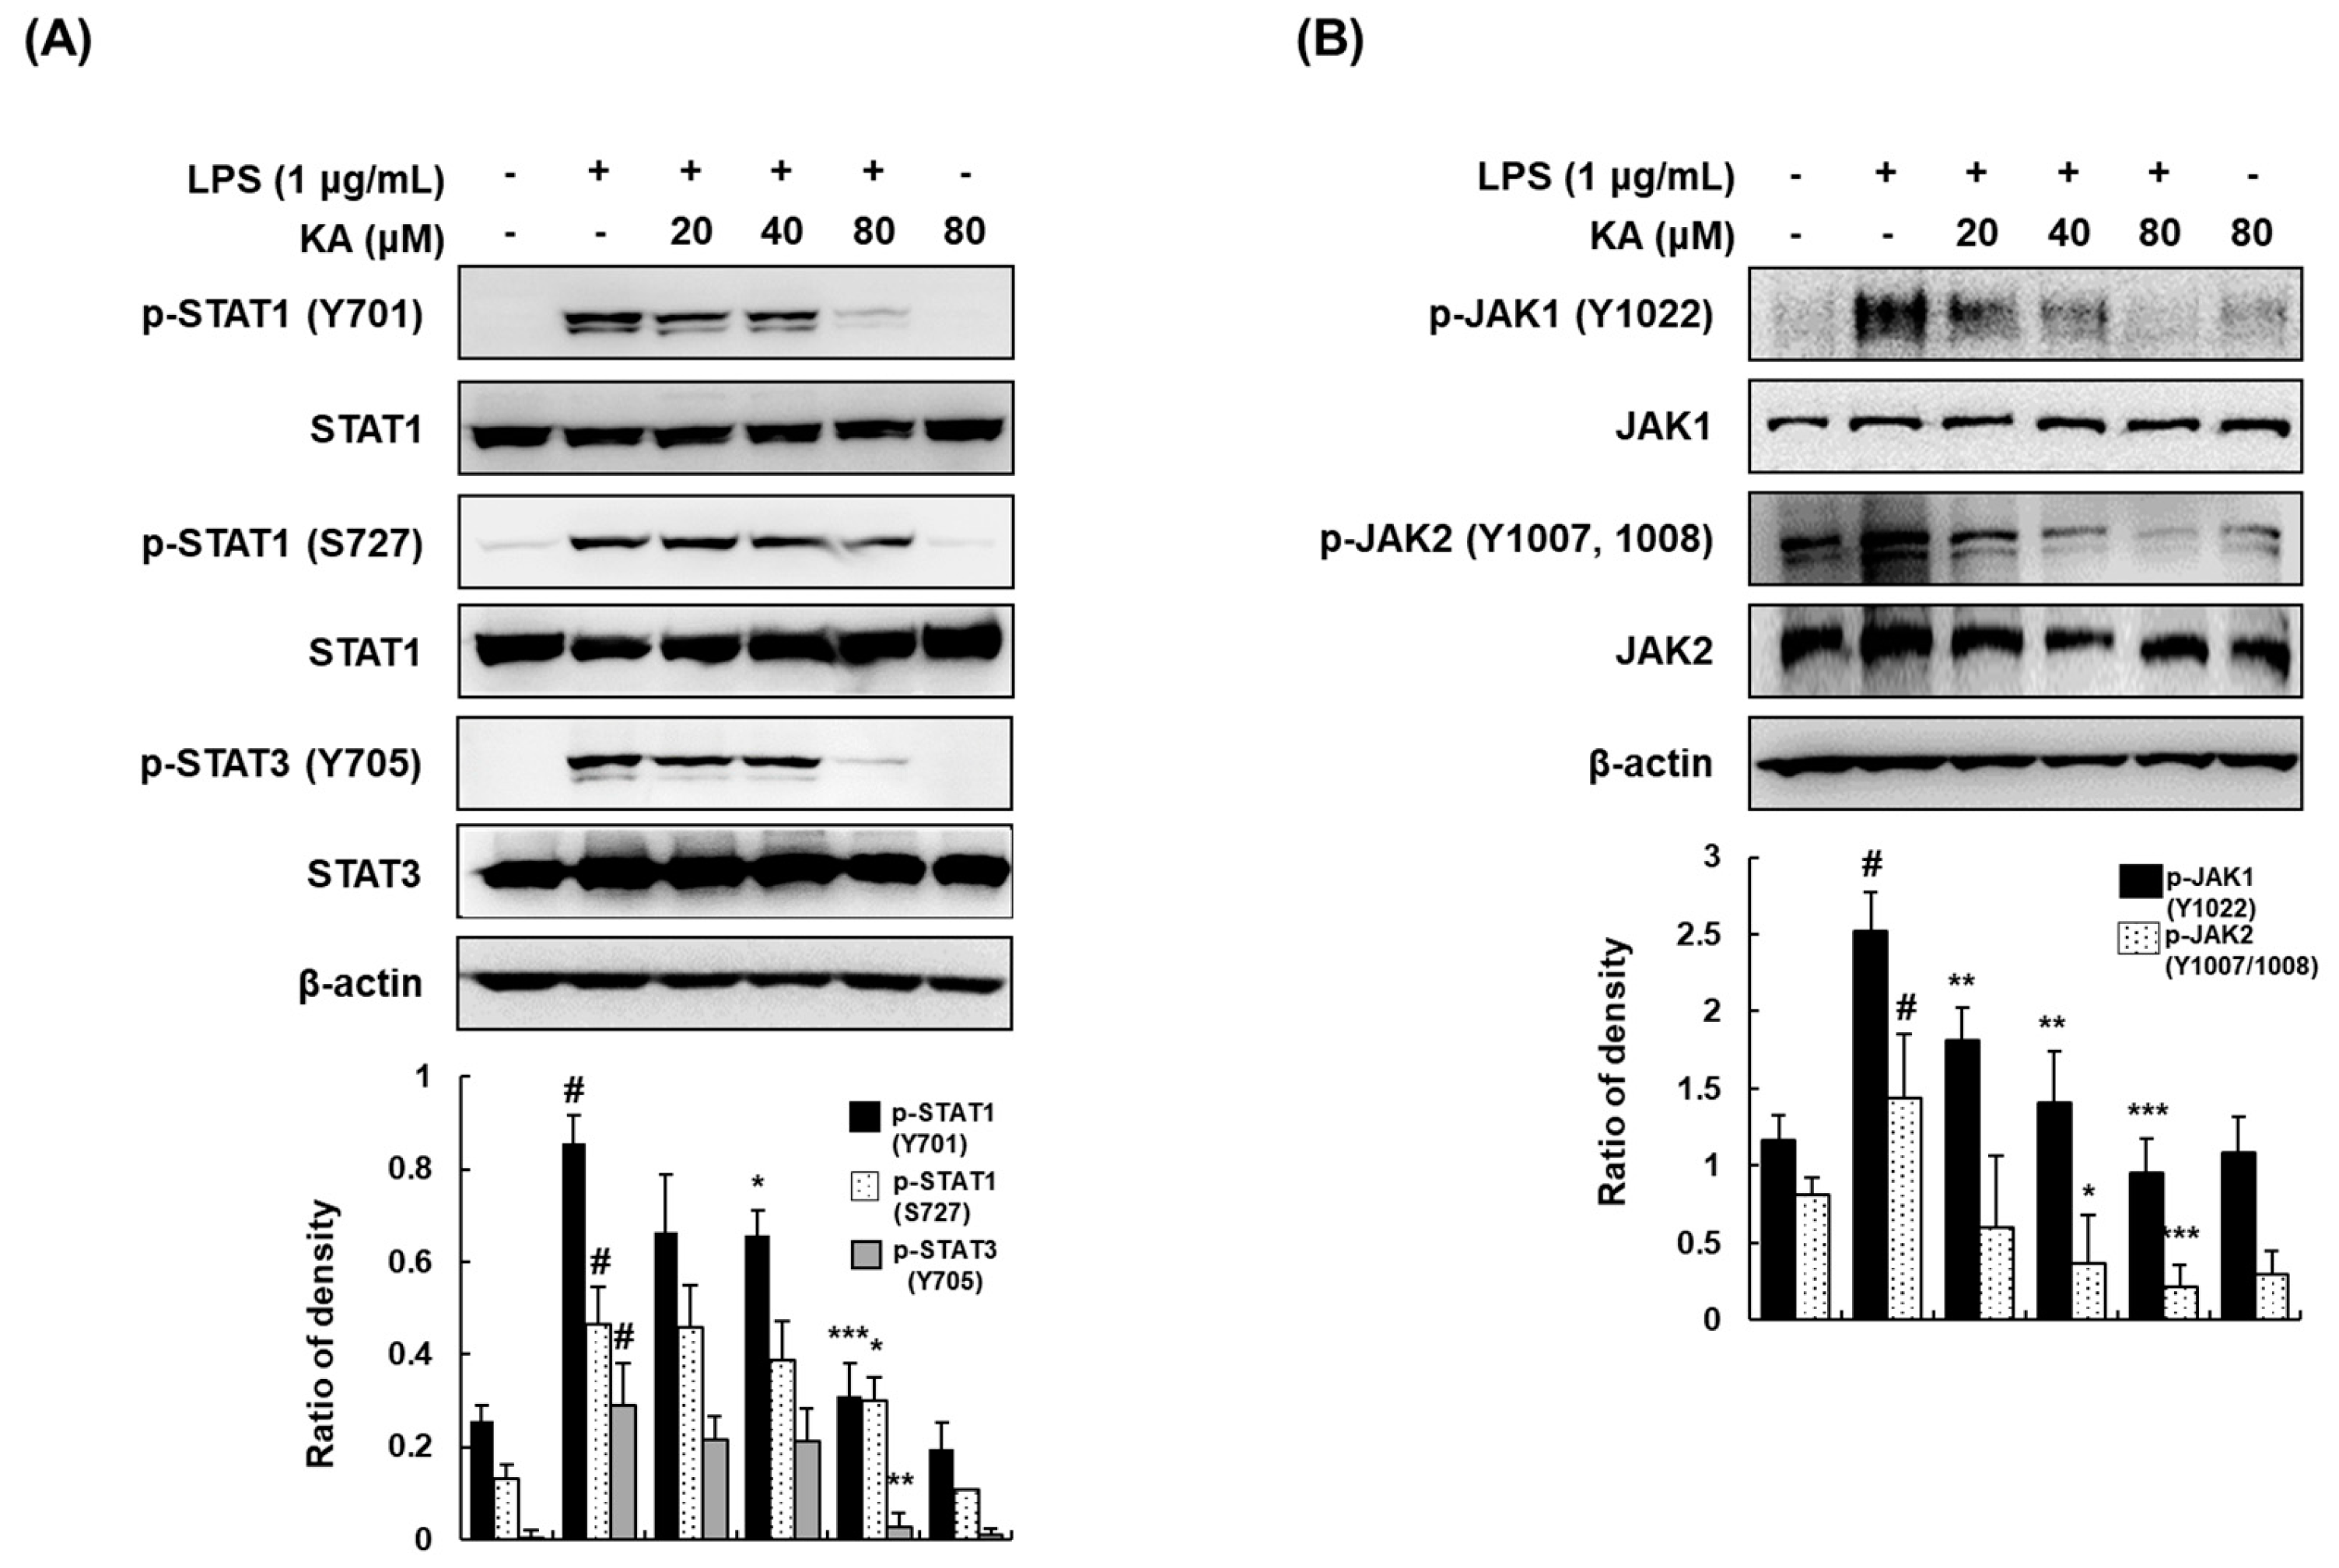
3.5. KA Inhibits JAK/STAT Phosphorylation in LPS-Induced RAW 264.7 Macrophages
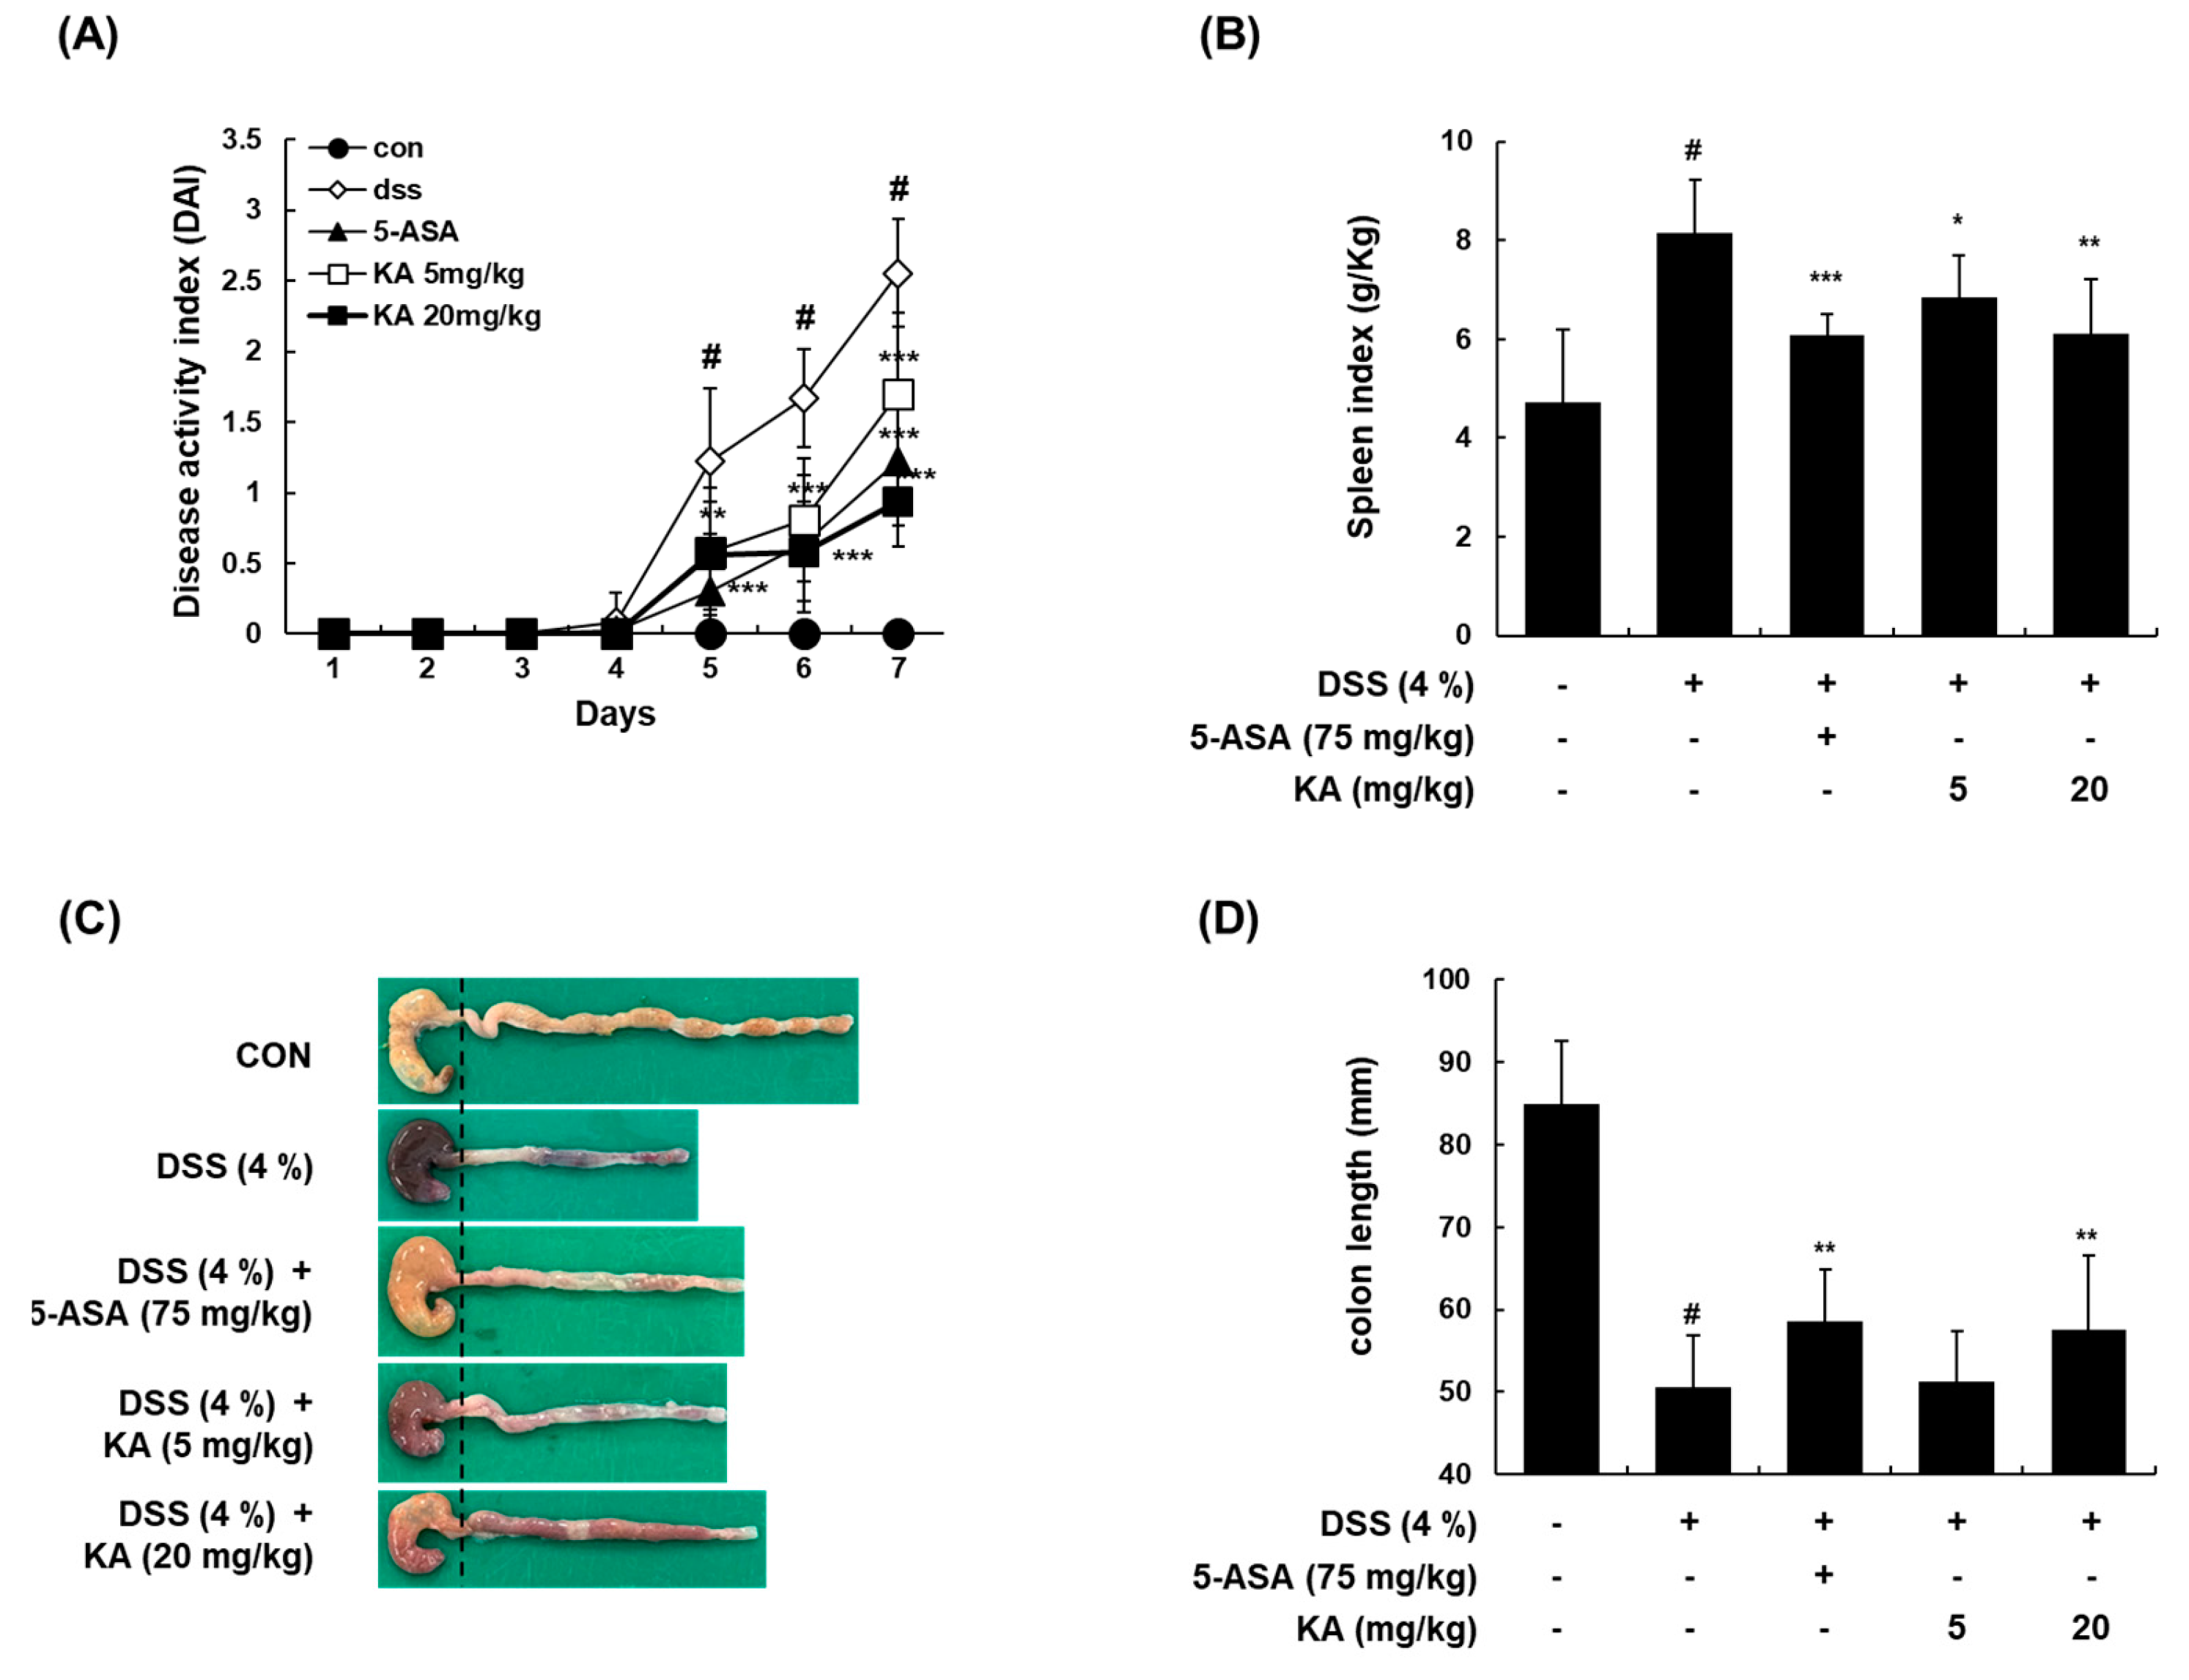
3.6. KA Attenuates Colitis Severity, Colon Shortening, and Spleen Enlargement in a DSS-Induced Acute Colitis Model
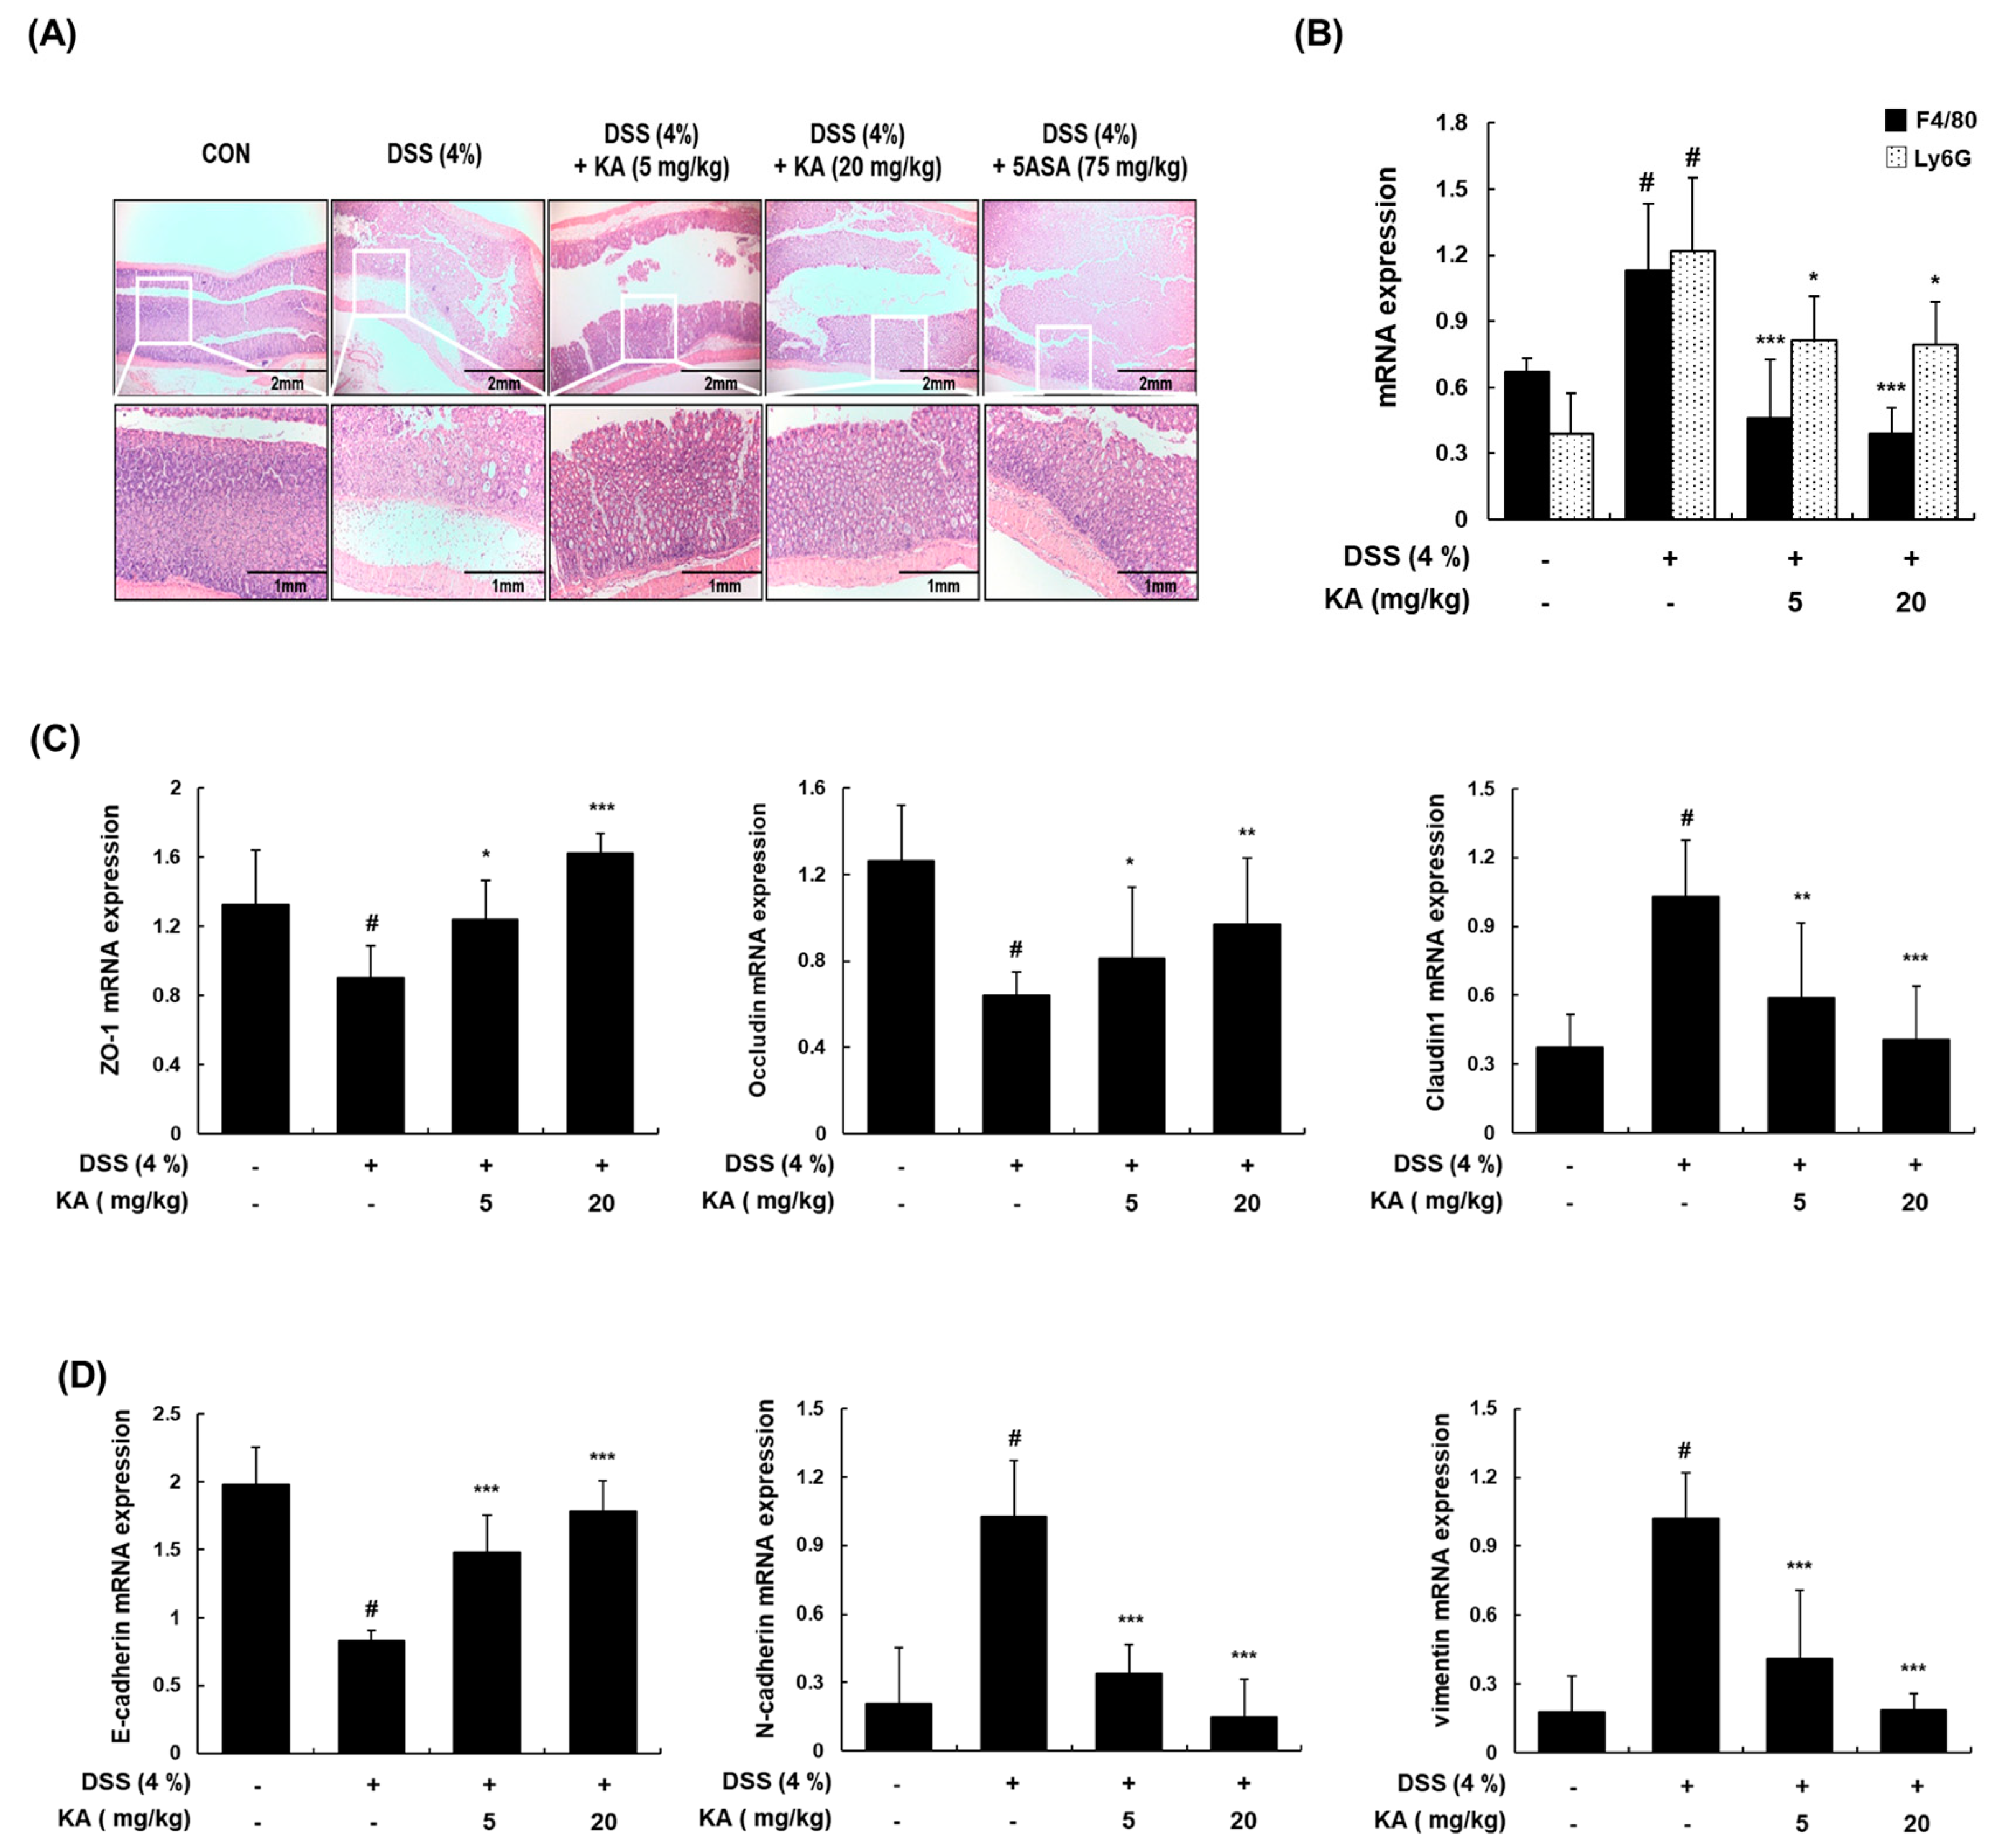
3.7. KA Decreases Colon Tissue Injury and Restores Epithelial Barrier mRNA Expression in Mice with DSS-Induced Colitis
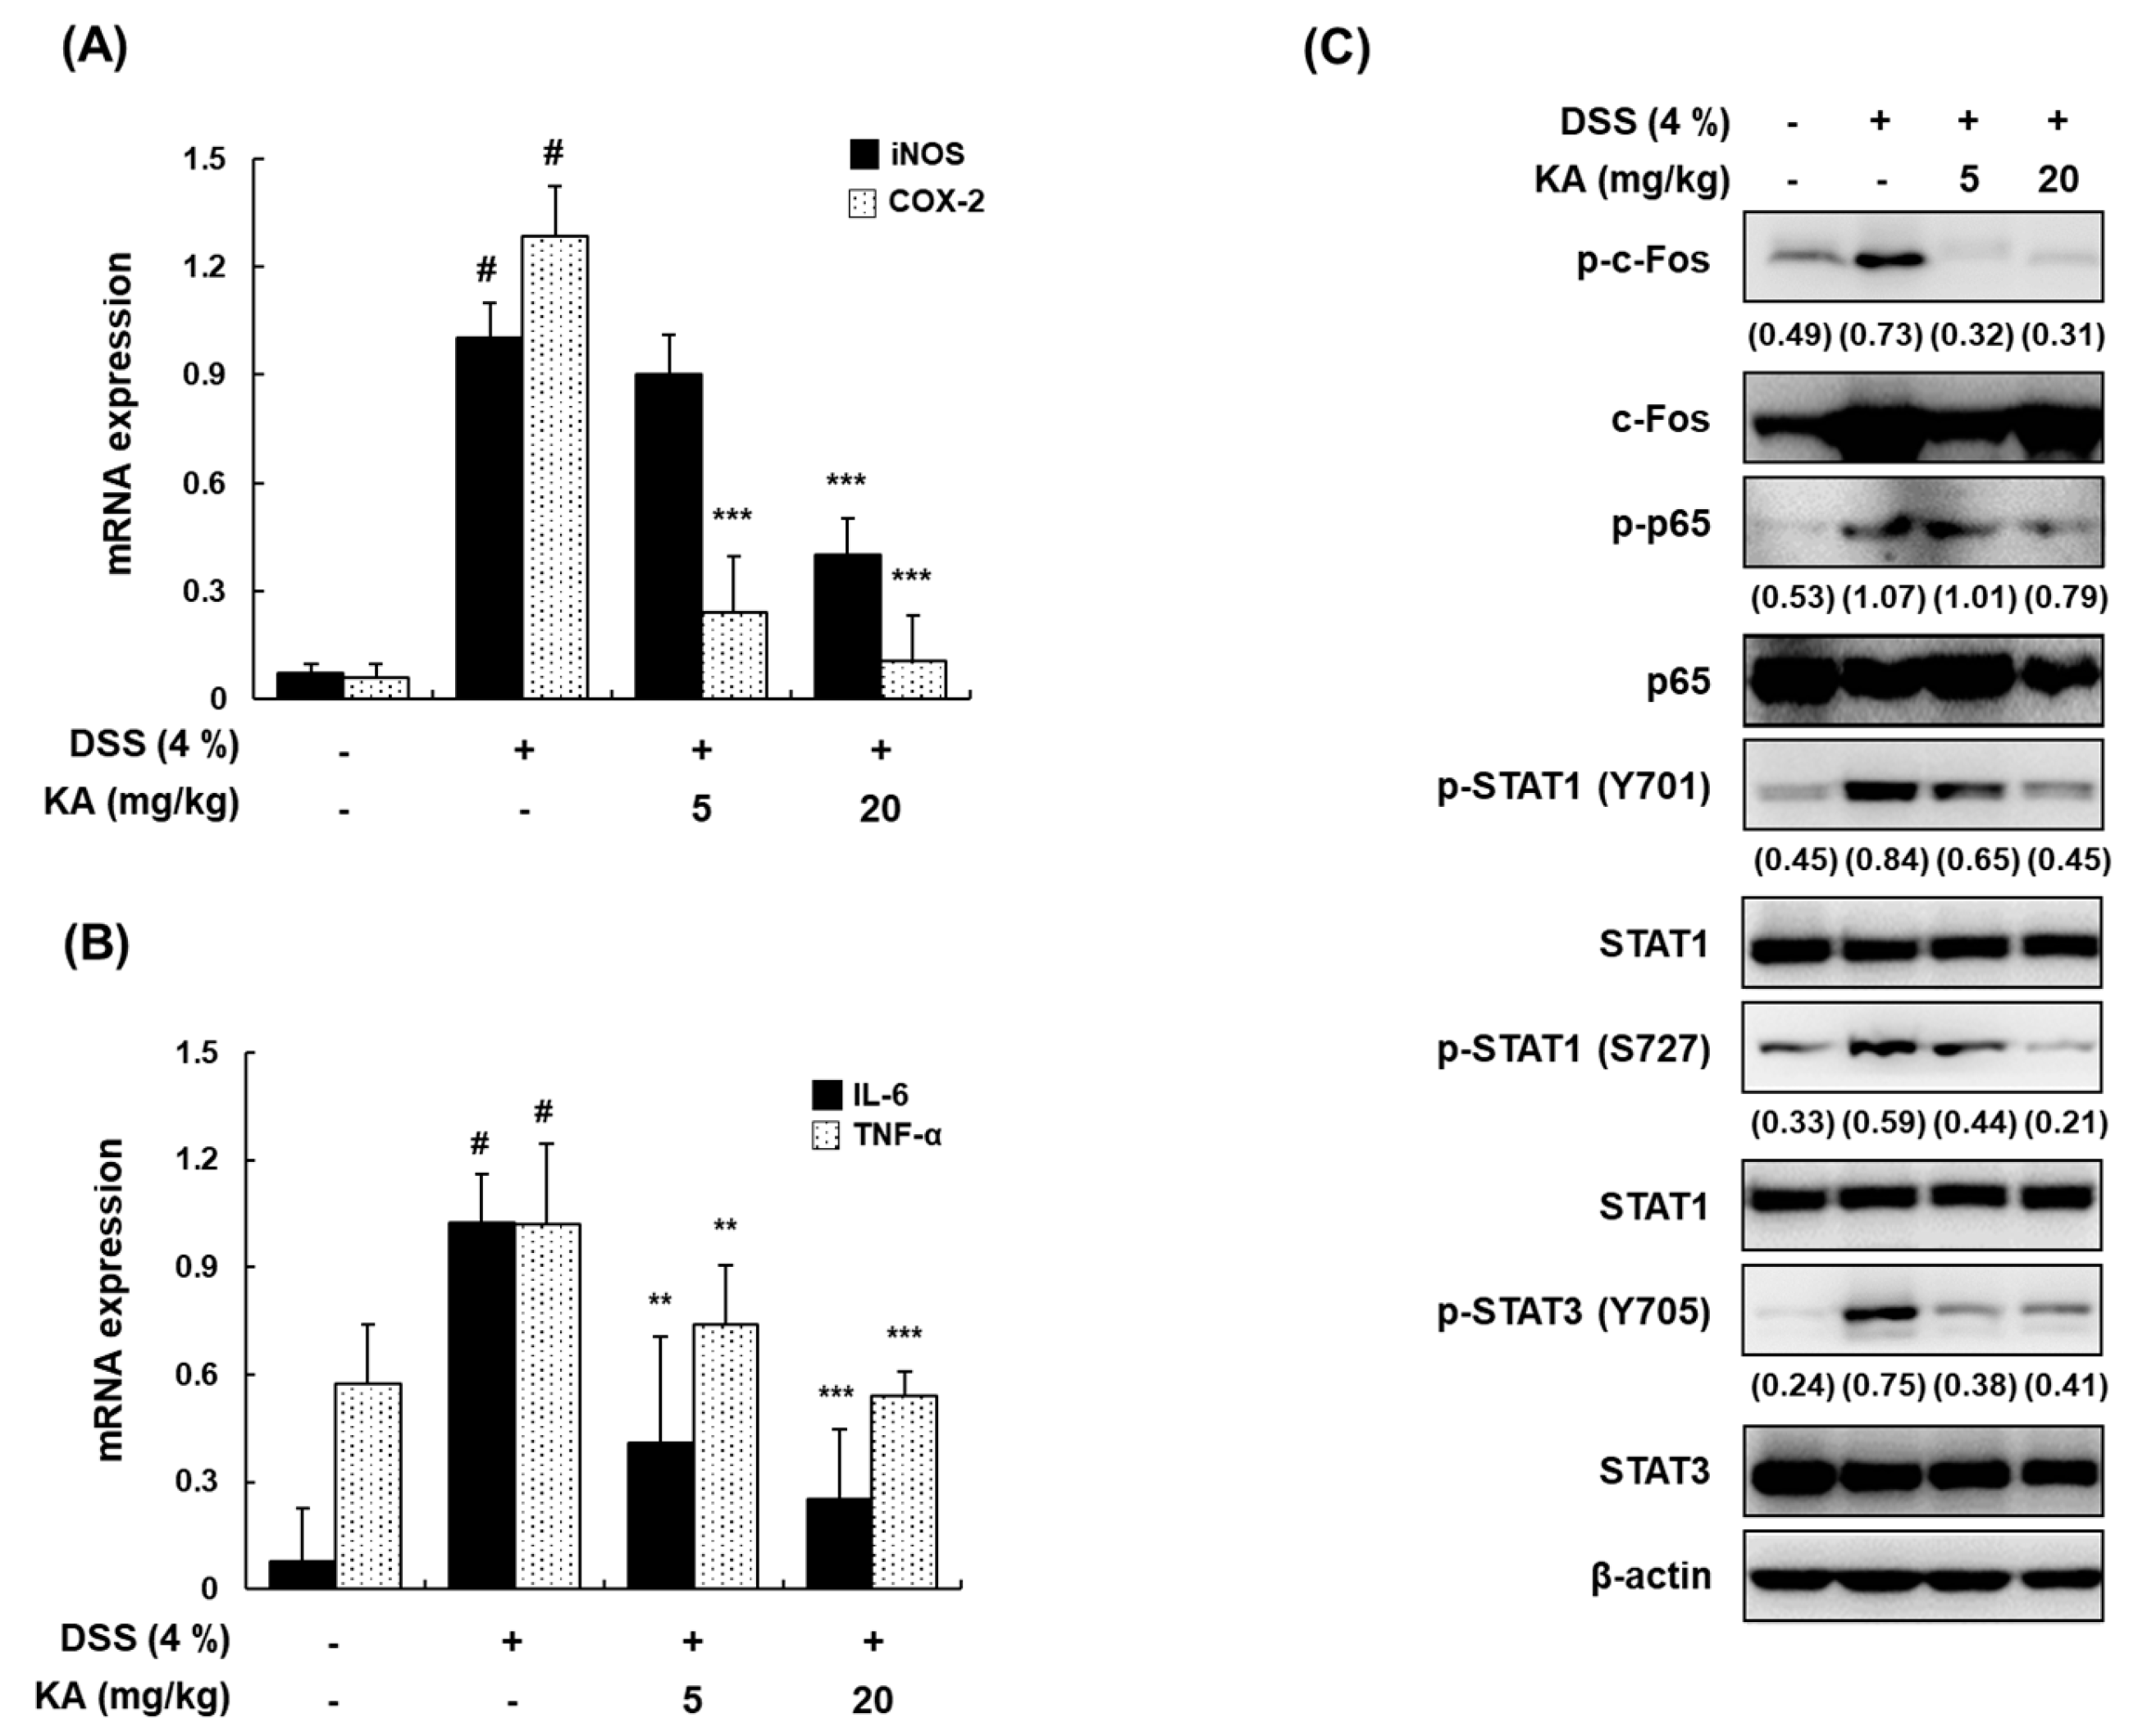
3.8. KA Inhibits iNOS, COX-2, and Inflammatory Cytokine mRNA Expression through AP-1, NF-κB, and STAT1/3 Inactivation in DSS-Induced Colon Tissues
4. Discussion
5. Conclusions
Supplementary Materials
Author Contributions
Funding
Conflicts of Interest
References
- Goodhand, J.R.; Wahed, M.; Mawdsley, J.E.; Farmer, A.D.; Aziz, Q.; Rampton, D.S. Mood disorders in inflammatory bowel disease: Relation to diagnosis, disease activity, perceived stress, and other factors. Inflamm. Bowel Dis. 2012, 18, 2301–2309. [Google Scholar] [CrossRef] [PubMed]
- Chelakkot, C.; Ghim, J.; Ryu, S.H. Mechanisms regulating intestinal barrier integrity and its pathological implications. Exp. Mol. Med. 2018, 50, 103. [Google Scholar] [CrossRef] [PubMed]
- Edelblum, K.L.; Turner, J.R. The tight junction in inflammatory disease: Communication breakdown. Curr. Opin. Pharmacol. 2009, 9, 715–720. [Google Scholar] [CrossRef] [PubMed]
- Lovisa, S.; Genovese, G.; Danese, S. Role of Epithelial-to-Mesenchymal Transition in Inflammatory Bowel Disease. J. Crohns Colitis 2019, 13, 659–668. [Google Scholar] [CrossRef] [PubMed]
- Chen, Y.; Xiao, Y.; Ge, W.; Zhou, K.; Wen, J.; Yan, W.; Wang, Y.; Wang, B.; Qu, C.; Wu, J.; et al. miR-200b inhibits TGF-beta1-induced epithelial-mesenchymal transition and promotes growth of intestinal epithelial cells. Cell Death Dis. 2013, 4, e541. [Google Scholar] [CrossRef]
- Kyoko, O.O.; Kono, H.; Ishimaru, K.; Miyake, K.; Kubota, T.; Ogawa, H.; Okumura, K.; Shibata, S.; Nakao, A. Expressions of tight junction proteins Occludin and Claudin-1 are under the circadian control in the mouse large intestine: Implications in intestinal permeability and susceptibility to colitis. PLoS ONE 2014, 9, e98016. [Google Scholar] [CrossRef]
- Guan, Q.; Zhang, J. Recent Advances: The Imbalance of Cytokines in the Pathogenesis of Inflammatory Bowel Disease. Mediat. Inflamm. 2017, 2017, 4810258. [Google Scholar] [CrossRef] [PubMed]
- Shin, J.S.; Cho, E.J.; Choi, H.E.; Seo, J.H.; An, H.J.; Park, H.J.; Cho, Y.W.; Lee, K.T. Anti-inflammatory effect of a standardized triterpenoid-rich fraction isolated from Rubus coreanus on dextran sodium sulfate-induced acute colitis in mice and LPS-induced macrophages. J. Ethnopharm. 2014, 158, 291–300. [Google Scholar] [CrossRef]
- Yi, Y.S. Folate Receptor-Targeted Diagnostics and Therapeutics for Inflammatory Diseases. Immune Netw. 2016, 16, 337–343. [Google Scholar] [CrossRef]
- Min, Y.; Kim, M.J.; Lee, S.; Chun, E.; Lee, K.Y. Inhibition of TRAF6 ubiquitin-ligase activity by PRDX1 leads to inhibition of NFKB activation and autophagy activation. Autophagy 2018, 14, 1347–1358. [Google Scholar] [CrossRef]
- Avila, M.; Martinez-Juarez, A.; Ibarra-Sanchez, A.; Gonzalez-Espinosa, C. Lyn kinase controls TLR4-dependent IKK and MAPK activation modulating the activity of TRAF-6/TAK-1 protein complex in mast cells. Innate Immun. 2012, 18, 648–660. [Google Scholar] [CrossRef] [PubMed] [Green Version]
- Turjanski, A.G.; Vaque, J.P.; Gutkind, J.S. MAP kinases and the control of nuclear events. Oncogene 2007, 26, 3240–3253. [Google Scholar] [CrossRef] [PubMed] [Green Version]
- Kyriakis, J.M.; Avruch, J. Mammalian mitogen-activated protein kinase signal transduction pathways activated by stress and inflammation. Physiol. Rev. 2001, 81, 807–869. [Google Scholar] [CrossRef] [PubMed]
- Oeckinghaus, A.; Ghosh, S. The NF-kappaB family of transcription factors and its regulation. Cold Spring Harb. Perspect. Biol. 2009, 1, a000034. [Google Scholar] [CrossRef] [PubMed]
- Liu, T.; Zhang, L.; Joo, D.; Sun, S.C. NF-kappaB signaling in inflammation. Signal Transduct. Target. Ther. 2017, 2. [Google Scholar] [CrossRef] [PubMed]
- Banerjee, S.; Biehl, A.; Gadina, M.; Hasni, S.; Schwartz, D.M. JAK-STAT Signaling as a Target for Inflammatory and Autoimmune Diseases: Current and Future Prospects. Drugs 2017, 77, 521–546. [Google Scholar] [CrossRef] [PubMed]
- Levy, D.E.; Darnell, J.E., Jr. Stats: Transcriptional control and biological impact. Nat. Rev. Mol. Cell. Biol. 2002, 3, 651–662. [Google Scholar] [CrossRef]
- Yang, X.N.; Khan, I.; Kang, S.C. Chemical composition, mechanism of antibacterial action and antioxidant activity of leaf essential oil of Forsythia koreana deciduous shrub. Asian Pac. J. Trop. Med. 2015, 8, 694–700. [Google Scholar] [CrossRef] [PubMed] [Green Version]
- Choi, I.Y.; Moon, P.D.; Koo, H.N.; Myung, N.Y.; Kim, S.J.; Lee, J.H.; Han, S.H.; Moon, G.; Seo, S.Y.; Sung, H.J.; et al. Observations of Forsythia koreana methanol extract on mast cell-mediated allergic reactions in experimental models. In Vitro Cell. Dev. Biol. Anim. 2007, 43, 215–221. [Google Scholar] [CrossRef]
- Nishibe, S.; Okabe, K.; Tsukamoto, H.; Sakushima, A.; Hisada, S.; Baba, H.; Akisada, T. Studies on the Chinese crude drug “Forsythiae Fructus.” VI. The structure and antibacterial activity of suspensaside isolated from Forsythia suspensa. Chem. Pharm. Bull. 1982, 30, 4548–4553. [Google Scholar] [CrossRef]
- Sun, L.; Rai, A.; Rai, M.; Nakamura, M.; Kawano, N.; Yoshimatsu, K.; Suzuki, H.; Kawahara, N.; Saito, K.; Yamazaki, M. Comparative transcriptome analyses of three medicinal Forsythia species and prediction of candidate genes involved in secondary metabolisms. J. Nat. Med. 2018, 72, 867–881. [Google Scholar] [CrossRef] [PubMed]
- Lee, Y.G.; Jang, S.A.; Seo, K.H.; Gwag, J.E.; Kim, H.G.; Ko, J.H.; Ji, S.A.; Kang, S.C.; Lee, D.Y.; Baek, N.I. New Lignans from the Flower of Forsythia koreana and Their Suppression Effect on VCAM-1 Expression in MOVAS Cells. Chem. Biodivers. 2018, 15, e1800026. [Google Scholar] [CrossRef] [PubMed]
- Shin, J.S.; Park, S.J.; Ryu, S.; Kang, H.B.; Kim, T.W.; Choi, J.H.; Lee, J.Y.; Cho, Y.W.; Lee, K.T. Potent anti-inflammatory effect of a novel furan-2,5-dione derivative, BPD, mediated by dual suppression of COX-2 activity and LPS-induced inflammatory gene expression via NF-kappaB inactivation. Br. J. Pharm. 2012, 165, 1926–1940. [Google Scholar] [CrossRef] [PubMed]
- Hong, J.Y.; Chung, K.S.; Shin, J.S.; Park, G.; Jang, Y.P.; Lee, K.T. Anti-Colitic Effects of Ethanol Extract of Persea americana Mill. through Suppression of Pro-Inflammatory Mediators via NF-kappaB/STAT3 Inactivation in Dextran Sulfate Sodium-Induced Colitis Mice. Int. J. Mol. Sci. 2019, 20, 177. [Google Scholar] [CrossRef] [PubMed]
- Sato, S.; Sanjo, H.; Takeda, K.; Ninomiya-Tsuji, J.; Yamamoto, M.; Kawai, T.; Matsumoto, K.; Takeuchi, O.; Akira, S. Essential function for the kinase TAK1 in innate and adaptive immune responses. Nat. Immunol. 2005, 6, 1087–1095. [Google Scholar] [CrossRef] [PubMed]
- Coskun, M.; Salem, M.; Pedersen, J.; Nielsen, O.H. Involvement of JAK/STAT signaling in the pathogenesis of inflammatory bowel disease. Pharm. Res. 2013, 76, 1–8. [Google Scholar] [CrossRef] [PubMed]
- Seif, F.; Khoshmirsafa, M.; Aazami, H.; Mohsenzadegan, M.; Sedighi, G.; Bahar, M. The role of JAK-STAT signaling pathway and its regulators in the fate of T helper cells. Cell Commun. Signal. 2017, 15, 23. [Google Scholar] [CrossRef]
- El-Shenawy, N.S.; Hamza, R.Z.; Khaled, H.E. Protective effect of alpha-lipoic acid against spleen toxicity of dimethylnitrosamine in male mice: Antioxidant and ultrastructure approaches. Biomed. Pharm. 2017, 96, 459–465. [Google Scholar] [CrossRef]
- Ginzel, M.; Feng, X.; Kuebler, J.F.; Klemann, C.; Yu, Y.; von Wasielewski, R.; Park, J.K.; Hornef, M.W.; Vieten, G.; Ure, B.M.; et al. Dextran sodium sulfate (DSS) induces necrotizing enterocolitis-like lesions in neonatal mice. PLoS ONE 2017, 12, e0182732. [Google Scholar] [CrossRef]
- Kucharzik, T.; Walsh, S.V.; Chen, J.; Parkos, C.A.; Nusrat, A. Neutrophil transmigration in inflammatory bowel disease is associated with differential expression of epithelial intercellular junction proteins. Am. J. Pathol. 2001, 159, 2001–2009. [Google Scholar] [CrossRef]
- Son, H.; Moon, A. Epithelial-mesenchymal Transition and Cell Invasion. Toxicol. Res. 2010, 26, 245–252. [Google Scholar] [CrossRef] [PubMed] [Green Version]
- Louis, E.D.; Bromley, S.M.; Jurewicz, E.C.; Watner, D. Olfactory dysfunction in essential tremor: A deficit unrelated to disease duration or severity. Neurology 2002, 59, 1631–1633. [Google Scholar] [CrossRef] [PubMed]
- Kim, J.J.; Shajib, M.S.; Manocha, M.M.; Khan, W.I. Investigating intestinal inflammation in DSS-induced model of IBD. J. Vis. Exp. 2012. [Google Scholar] [CrossRef]
- Chen, L.; Deng, H.; Cui, H.; Fang, J.; Zuo, Z.; Deng, J.; Li, Y.; Wang, X.; Zhao, L. Inflammatory responses and inflammation-associated diseases in organs. Oncotarget 2018, 9, 7204–7218. [Google Scholar] [CrossRef] [PubMed]
- Christiaens, I.; Zaragoza, D.B.; Guilbert, L.; Robertson, S.A.; Mitchell, B.F.; Olson, D.M. Inflammatory processes in preterm and term parturition. J. Reprod. Immunol. 2008, 79, 50–57. [Google Scholar] [CrossRef]
- Zhao, P.; Wang, S.; Jiang, J.; Liu, H.; Zhu, X.; Zhao, N.; Li, J.; Yin, Y.; Pan, X.; Yang, X.; et al. TIPE2 sensitizes osteosarcoma cells to cis-platin by down-regulating MDR1 via the TAK1- NF-kappaB and-AP-1 pathways. Mol. Immunol. 2018, 101, 471–478. [Google Scholar] [CrossRef] [PubMed]
- Akira, S.; Takeda, K. Toll-like receptor signalling. Nat. Rev. Immunol. 2004, 4, 499–511. [Google Scholar] [CrossRef]
- Chun, J.; Choi, R.J.; Khan, S.; Lee, D.S.; Kim, Y.C.; Nam, Y.J.; Lee, D.U.; Kim, Y.S. Alantolactone suppresses inducible nitric oxide synthase and cyclooxygenase-2 expression by down-regulating NF-kappaB, MAPK and AP-1 via the MyD88 signaling pathway in LPS-activated RAW 264.7 cells. Int. Immunopharmacol. 2012, 14, 375–383. [Google Scholar] [CrossRef]
- Karin, M.; Liu, Z.; Zandi, E. AP-1 function and regulation. Curr. Opin. Cell Biol. 1997, 9, 240–246. [Google Scholar] [CrossRef]
- Ninomiya-Tsuji, J.; Kishimoto, K.; Hiyama, A.; Inoue, J.; Cao, Z.; Matsumoto, K. The kinase TAK1 can activate the NIK-I kappaB as well as the MAP kinase cascade in the IL-1 signalling pathway. Nature 1999, 398, 252–256. [Google Scholar] [CrossRef]
- Buckley, J.M.; Wang, J.H.; Redmond, H.P. Cellular reprogramming by gram-positive bacterial components: A review. J. Leukoc. Biol. 2006, 80, 731–741. [Google Scholar] [CrossRef] [PubMed]
- Kou, X.; Qi, S.; Dai, W.; Luo, L.; Yin, Z. Arctigenin inhibits lipopolysaccharide-induced iNOS expression in RAW264.7 cells through suppressing JAK-STAT signal pathway. Int. Immunopharmacol. 2011, 11, 1095–1102. [Google Scholar] [CrossRef] [PubMed]
- Yu, Q.; Zeng, K.; Ma, X.; Song, F.; Jiang, Y.; Tu, P.; Wang, X. Resokaempferol-mediated anti-inflammatory effects on activated macrophages via the inhibition of JAK2/STAT3, NF-kappaB and JNK/p38 MAPK signaling pathways. Int. Immunopharmacol. 2016, 38, 104–114. [Google Scholar] [CrossRef] [PubMed]
- Ramsauer, K.; Sadzak, I.; Porras, A.; Pilz, A.; Nebreda, A.R.; Decker, T.; Kovarik, P. p38 MAPK enhances STAT1-dependent transcription independently of Ser-727 phosphorylation. Proc. Natl. Acad. Sci. USA 2002, 99, 12859–12864. [Google Scholar] [CrossRef] [PubMed] [Green Version]
- Westbrook, A.M.; Szakmary, A.; Schiestl, R.H. Mechanisms of intestinal inflammation and development of associated cancers: Lessons learned from mouse models. Mutat. Res. 2010, 705, 40–59. [Google Scholar] [CrossRef] [PubMed] [Green Version]
- Groschwitz, K.R.; Hogan, S.P. Intestinal barrier function: Molecular regulation and disease pathogenesis. J. Allergy Clin. Immunol. 2009, 124, 3–20; quiz 21–22. [Google Scholar] [CrossRef]
- Vancamelbeke, M.; Vermeire, S. The intestinal barrier: A fundamental role in health and disease. Expert Rev. Gastroenterol. Hepatol. 2017, 11, 821–834. [Google Scholar] [CrossRef] [PubMed]
- Grunert, S.; Jechlinger, M.; Beug, H. Diverse cellular and molecular mechanisms contribute to epithelial plasticity and metastasis. Nat. Rev. Mol. Cell Biol. 2003, 4, 657–665. [Google Scholar] [CrossRef]


© 2019 by the authors. Licensee MDPI, Basel, Switzerland. This article is an open access article distributed under the terms and conditions of the Creative Commons Attribution (CC BY) license (http://creativecommons.org/licenses/by/4.0/).
Share and Cite
Kim, T.-W.; Shin, J.-S.; Chung, K.-S.; Lee, Y.-G.; Baek, N.-I.; Lee, K.-T. Anti-Inflammatory Mechanisms of Koreanaside A, a Lignan Isolated from the Flower of Forsythia koreana, against LPS-Induced Macrophage Activation and DSS-Induced Colitis Mice: The Crucial Role of AP-1, NF-κB, and JAK/STAT Signaling. Cells 2019, 8, 1163. https://doi.org/10.3390/cells8101163
Kim T-W, Shin J-S, Chung K-S, Lee Y-G, Baek N-I, Lee K-T. Anti-Inflammatory Mechanisms of Koreanaside A, a Lignan Isolated from the Flower of Forsythia koreana, against LPS-Induced Macrophage Activation and DSS-Induced Colitis Mice: The Crucial Role of AP-1, NF-κB, and JAK/STAT Signaling. Cells. 2019; 8(10):1163. https://doi.org/10.3390/cells8101163
Chicago/Turabian StyleKim, Tae-Woo, Ji-Sun Shin, Kyung-Sook Chung, Yeong-Geun Lee, Nam-In Baek, and Kyung-Tae Lee. 2019. "Anti-Inflammatory Mechanisms of Koreanaside A, a Lignan Isolated from the Flower of Forsythia koreana, against LPS-Induced Macrophage Activation and DSS-Induced Colitis Mice: The Crucial Role of AP-1, NF-κB, and JAK/STAT Signaling" Cells 8, no. 10: 1163. https://doi.org/10.3390/cells8101163