Melatonin Effects on Non-Alcoholic Fatty Liver Disease Are Related to MicroRNA-34a-5p/Sirt1 Axis and Autophagy

 ,
,  , , , ,
  , and
, and 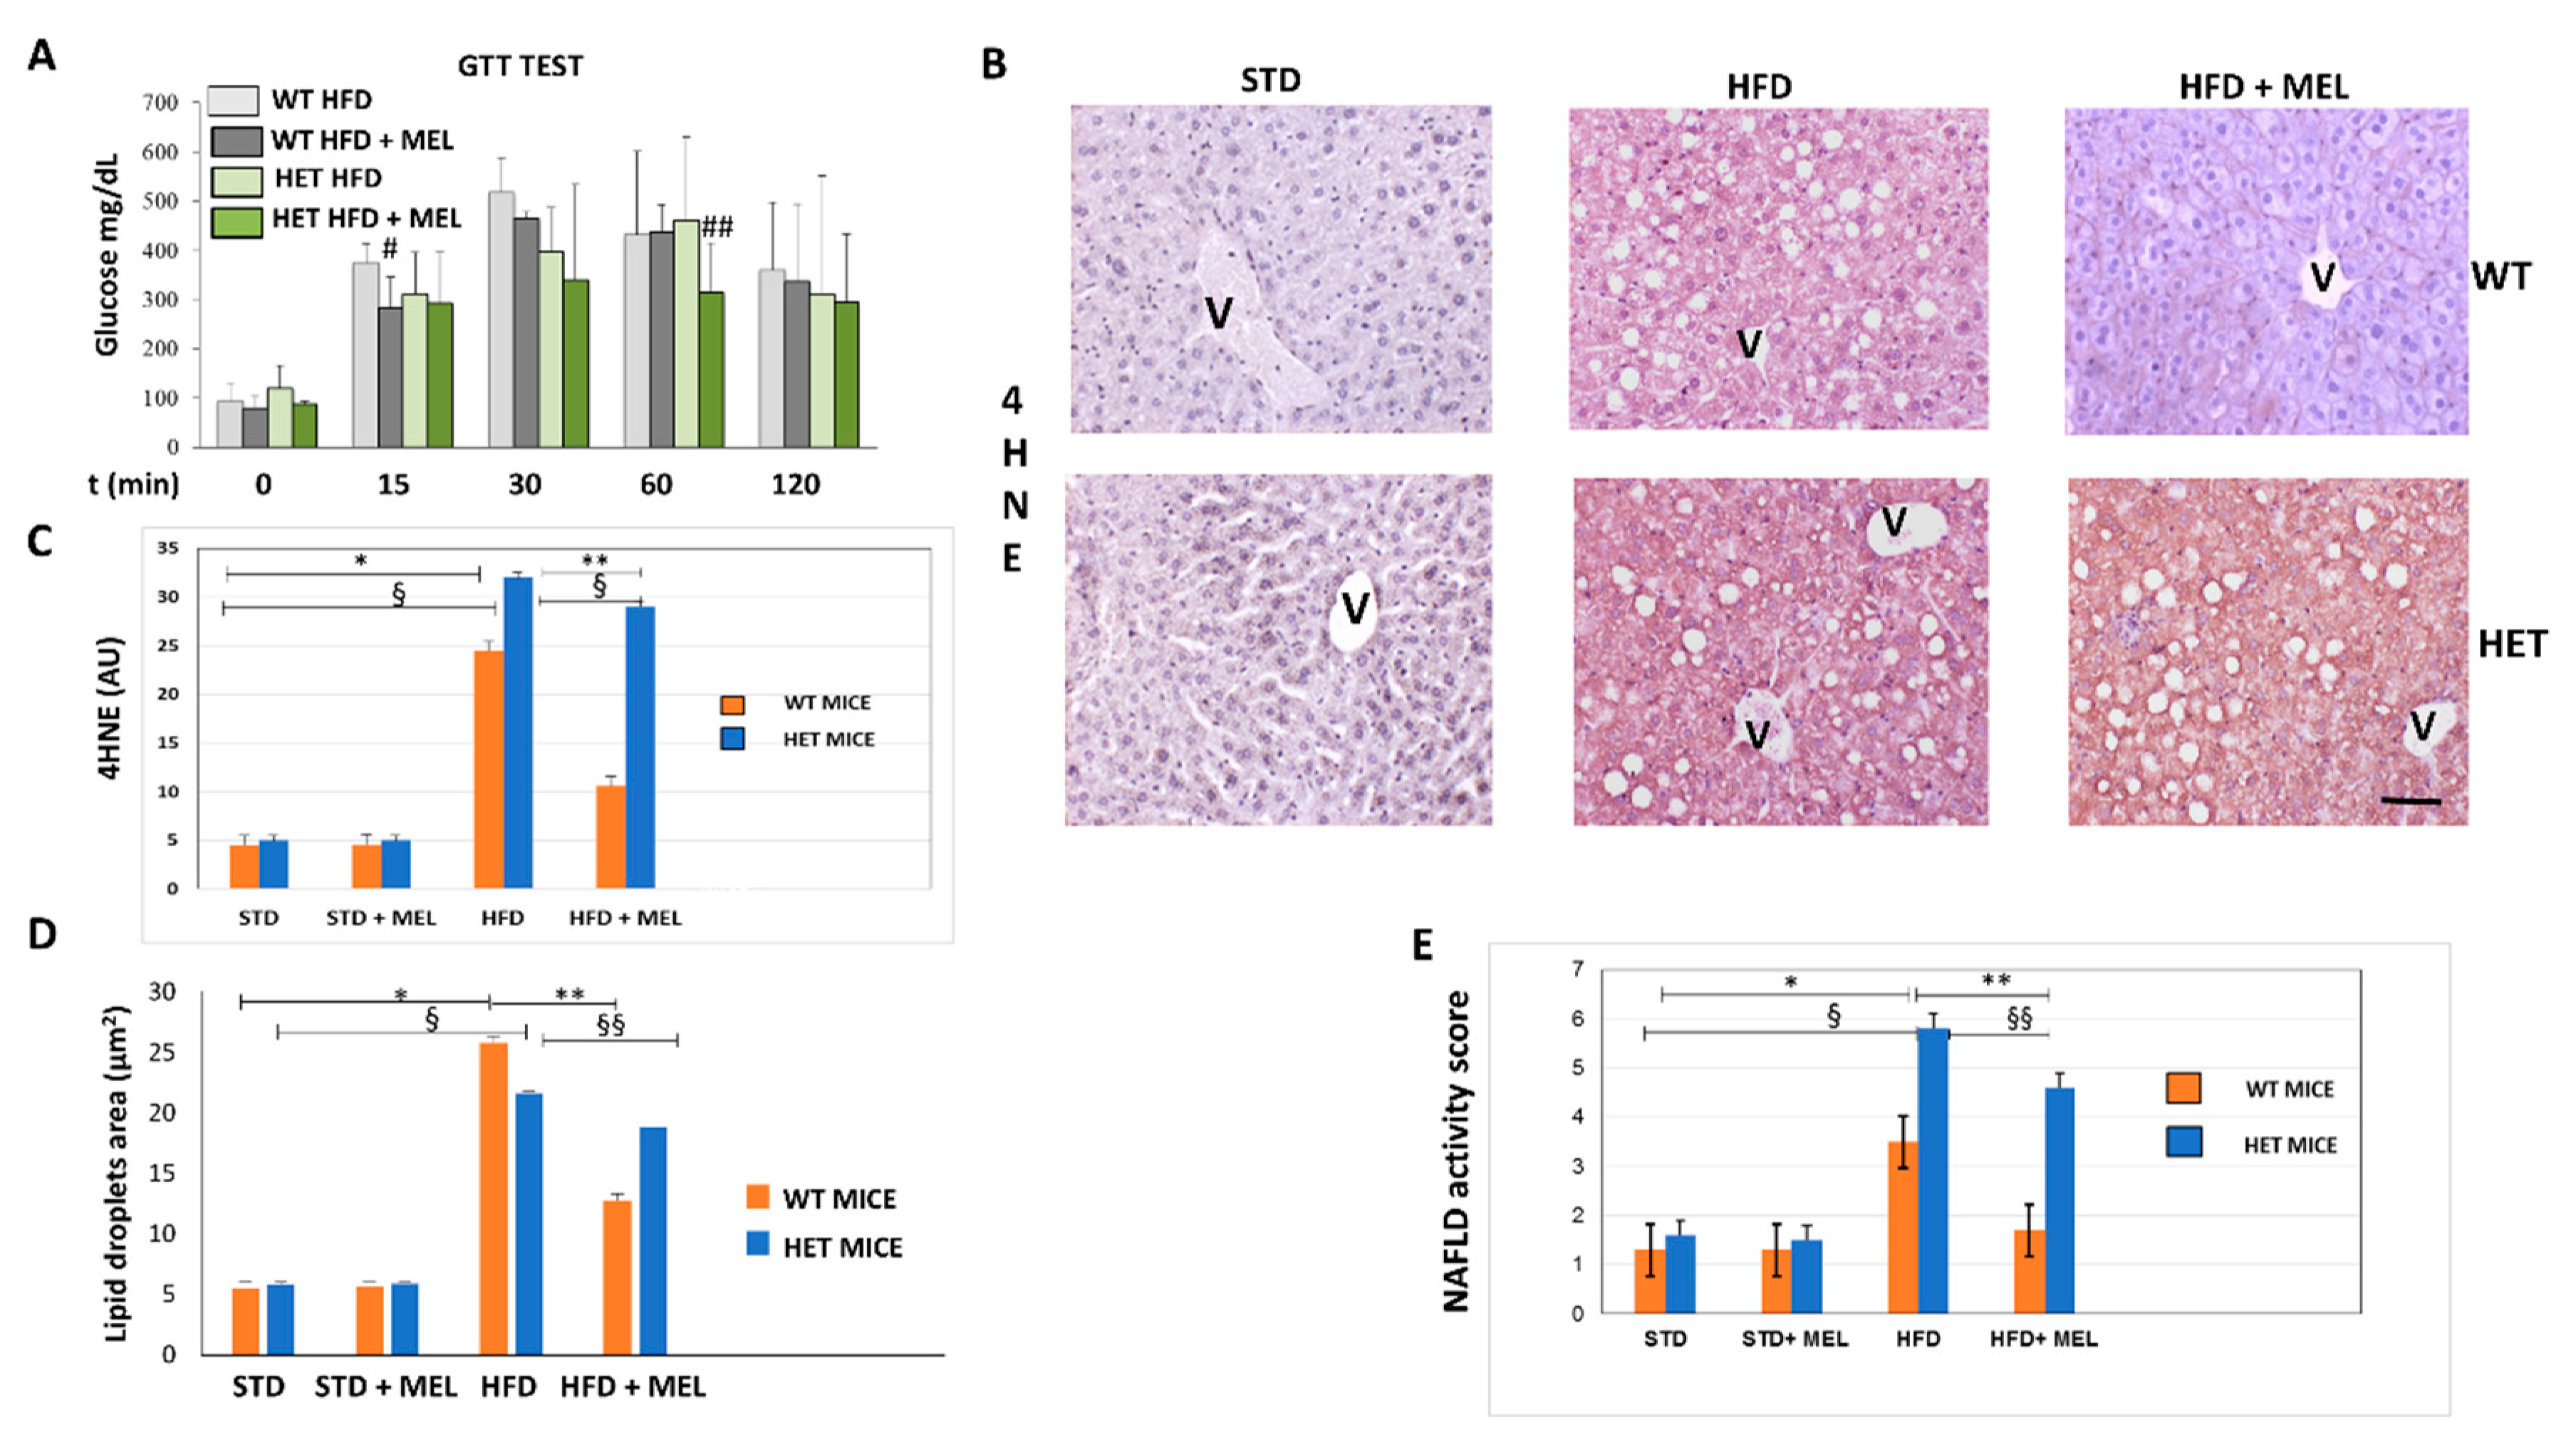
Abstract
:1. Introduction
2. Materials and Methods
2.1. Animal Model and Treatments
2.2. Indirect Calorimetry and Glucose Tolerance Test
2.3. Histopathology
2.4. Immunohistochemistry
2.5. Analysis of the Autophagy In Vivo
2.6. Transmission Electron Microscopy
2.7. RNA Isolation and Quantitative Real-Time PCR for miRNA and Gene Expression
2.8. Western Blot Analysis
2.9. Statistical Analysis
3. Results
3.1. Melatonin Improved Metabolism and Lipid Peroxidation in WT but Not in HET Mice Fed a High-Fat Diet
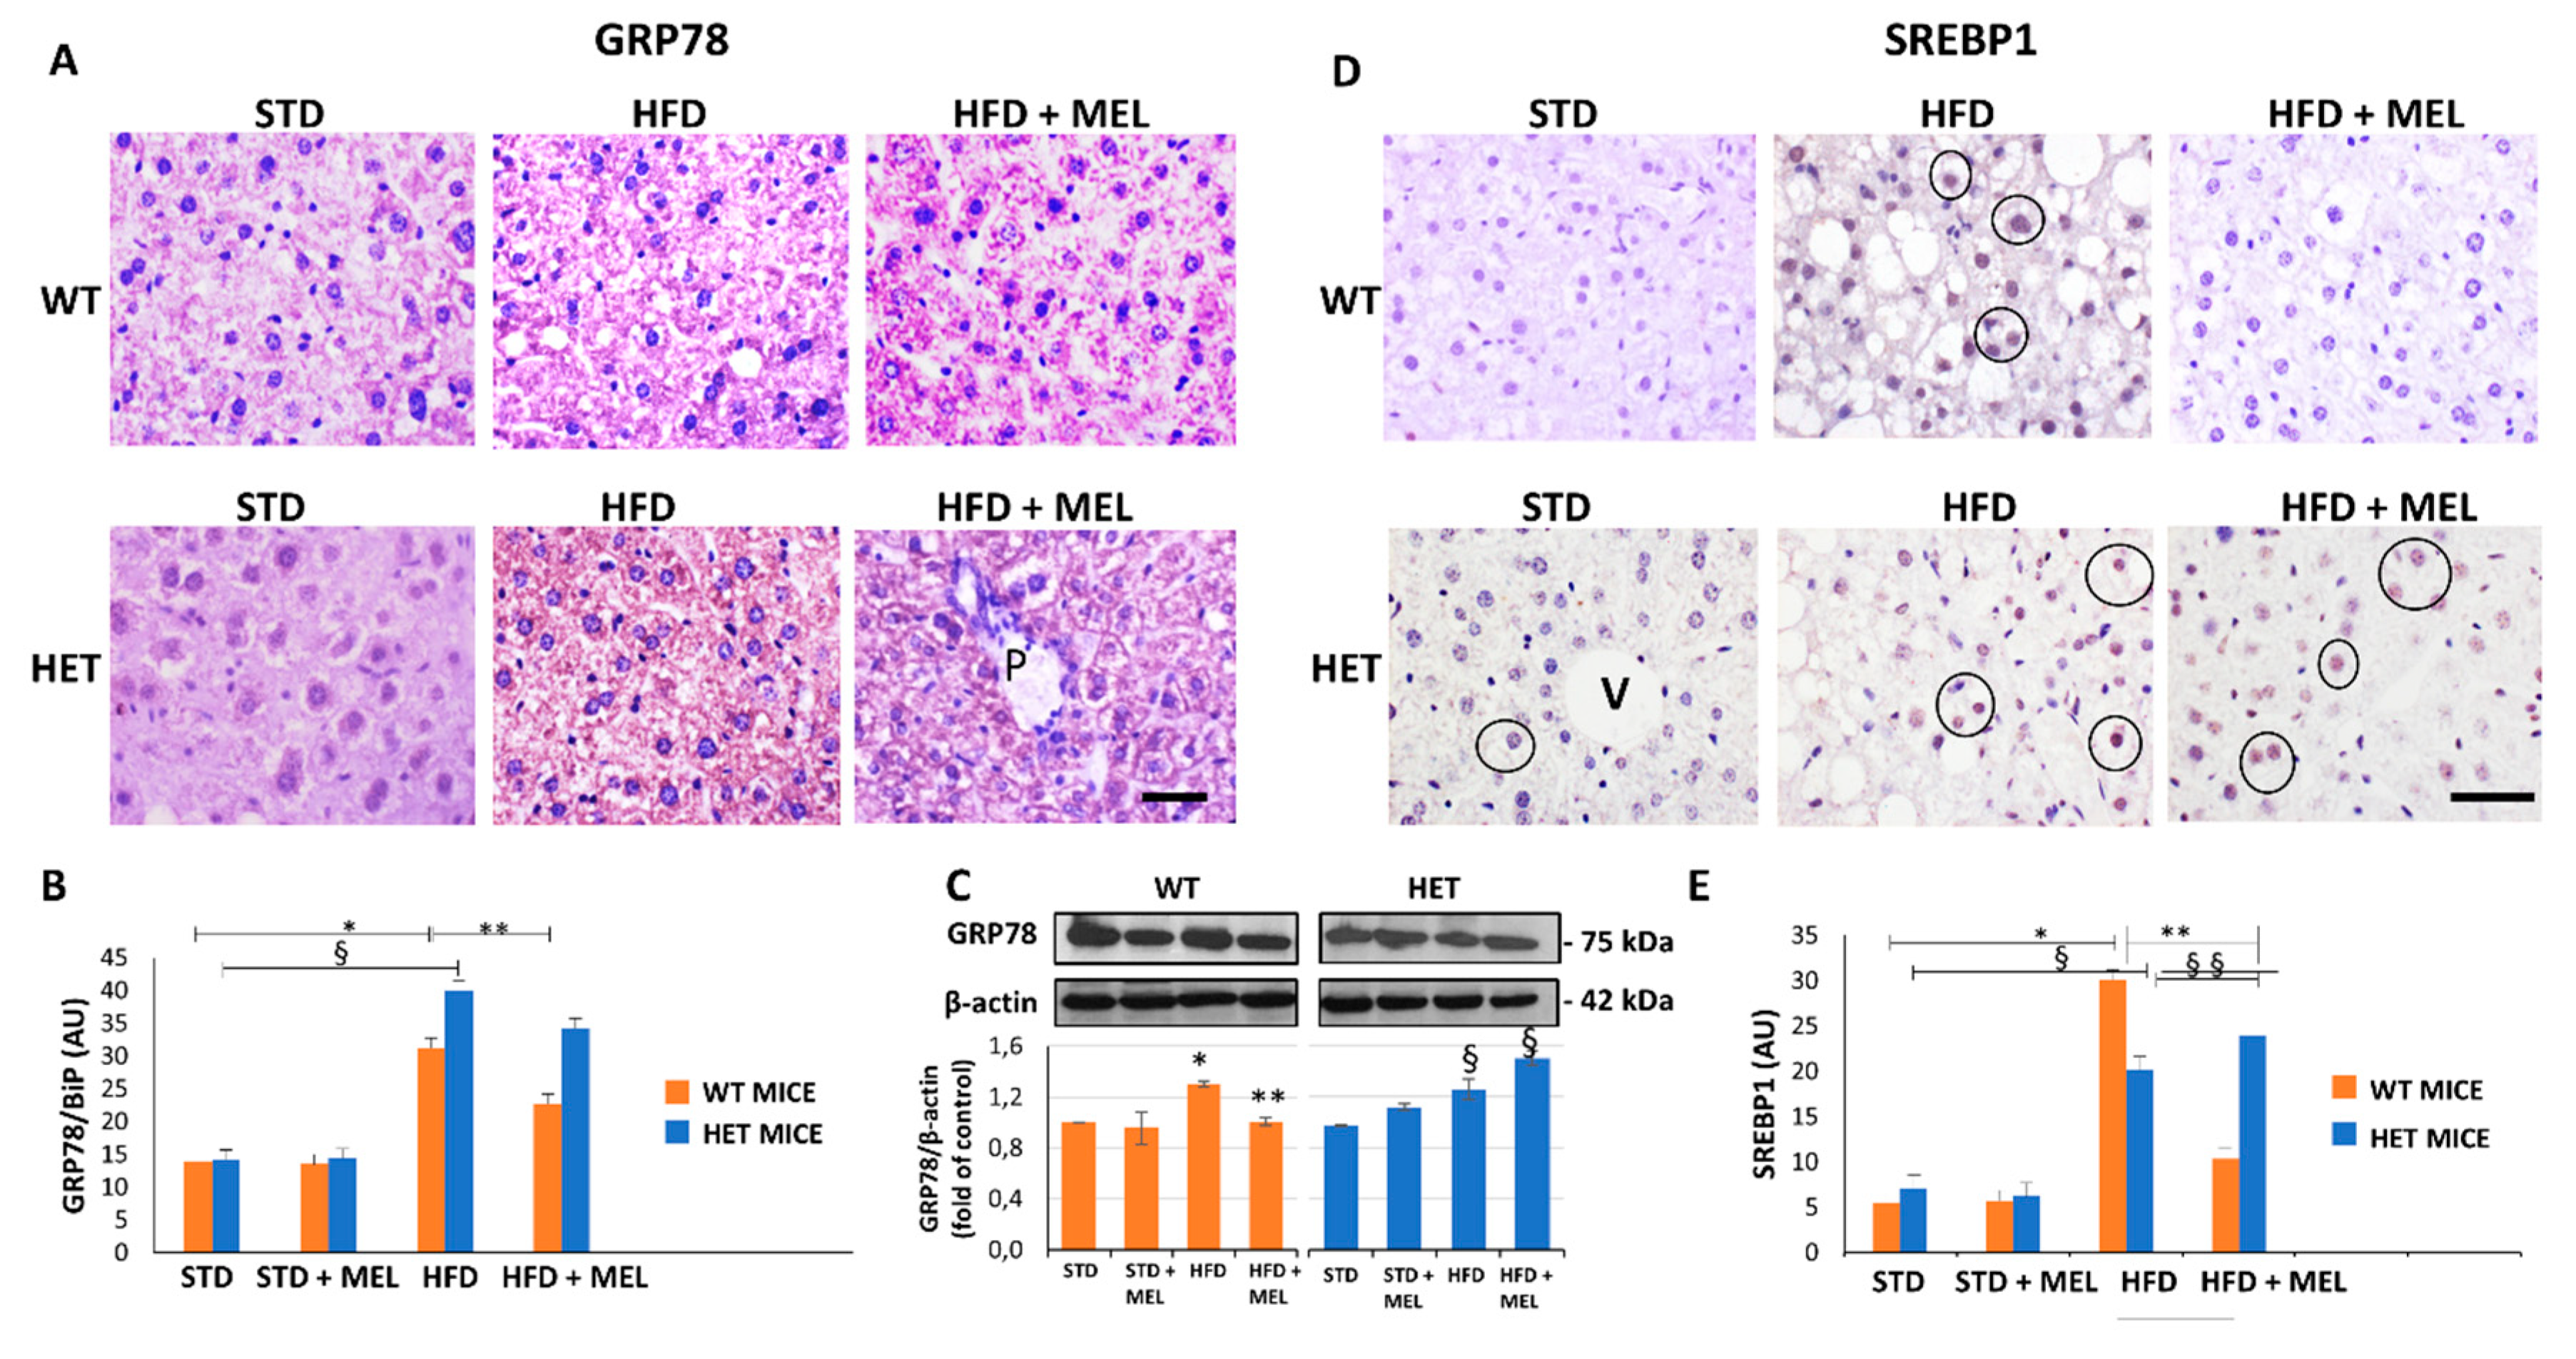
3.2. Melatonin Attenuated Steatosis and ER Stress in WT but Not in HET Mice Placed on a High-Fat Diet
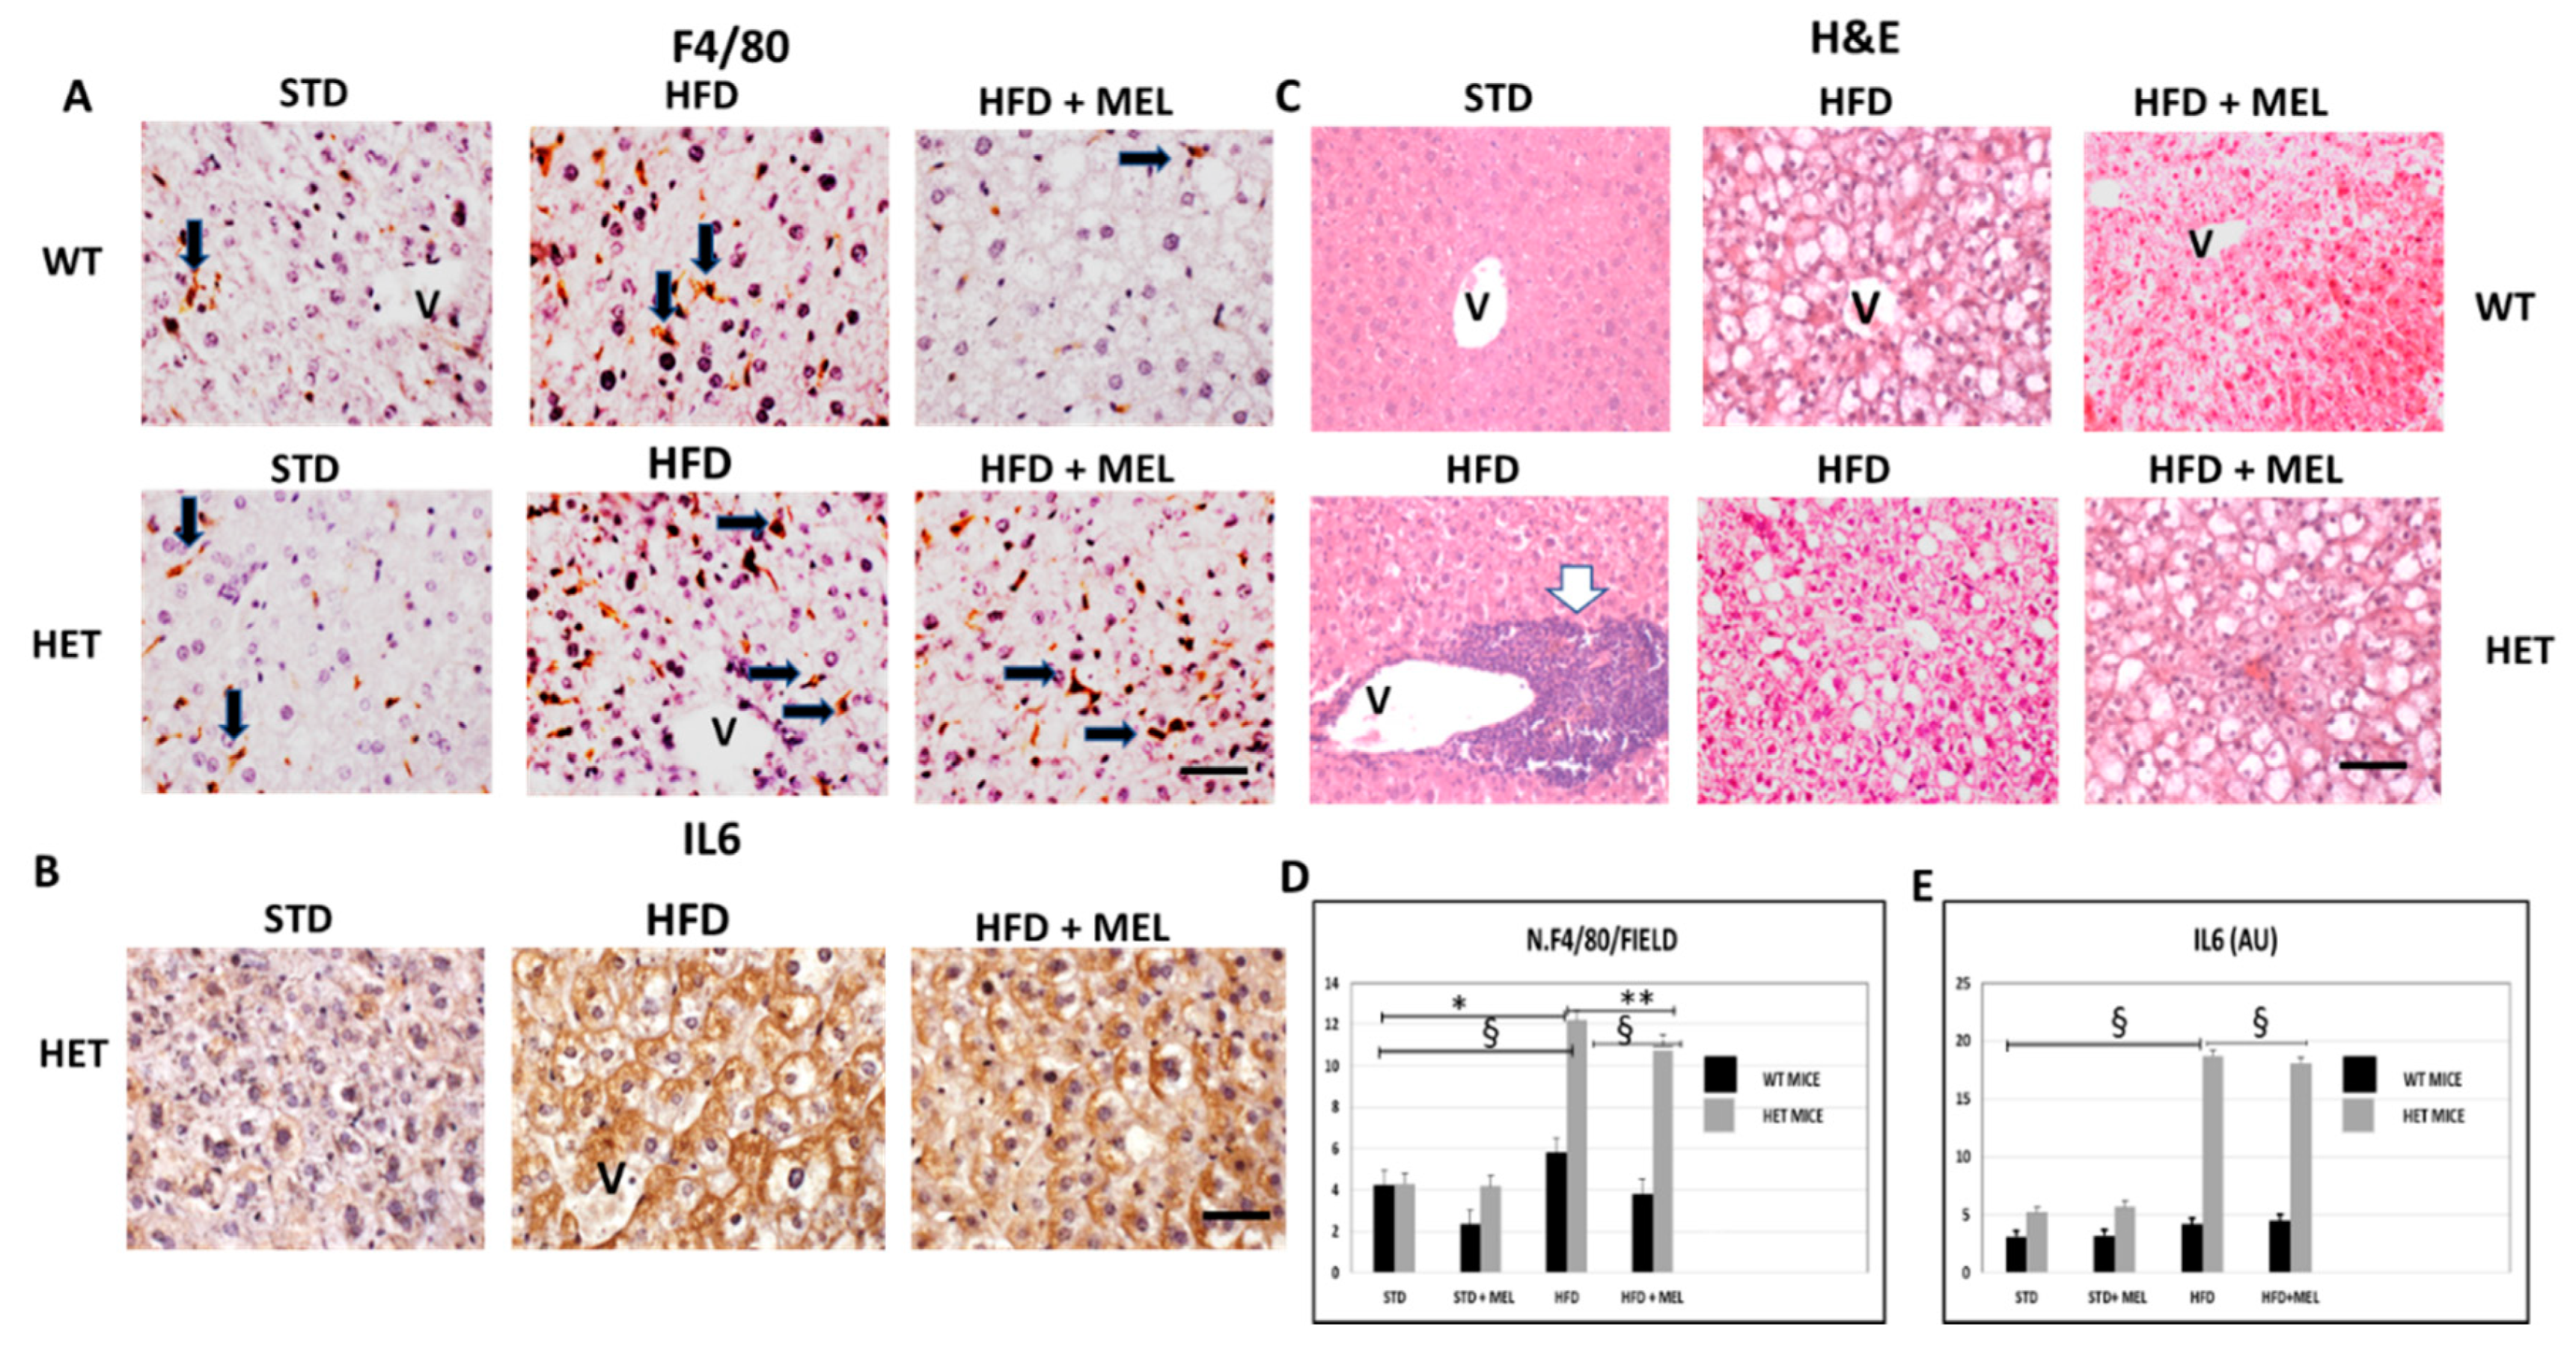
3.3. Melatonin Was Ineffective against Inflammation and Fibrosis in HET Mice Fed a High-Fat Diet
3.4. Autophagic Flux Was Sustained in WT Mice but Not in HET Mice during Starvation
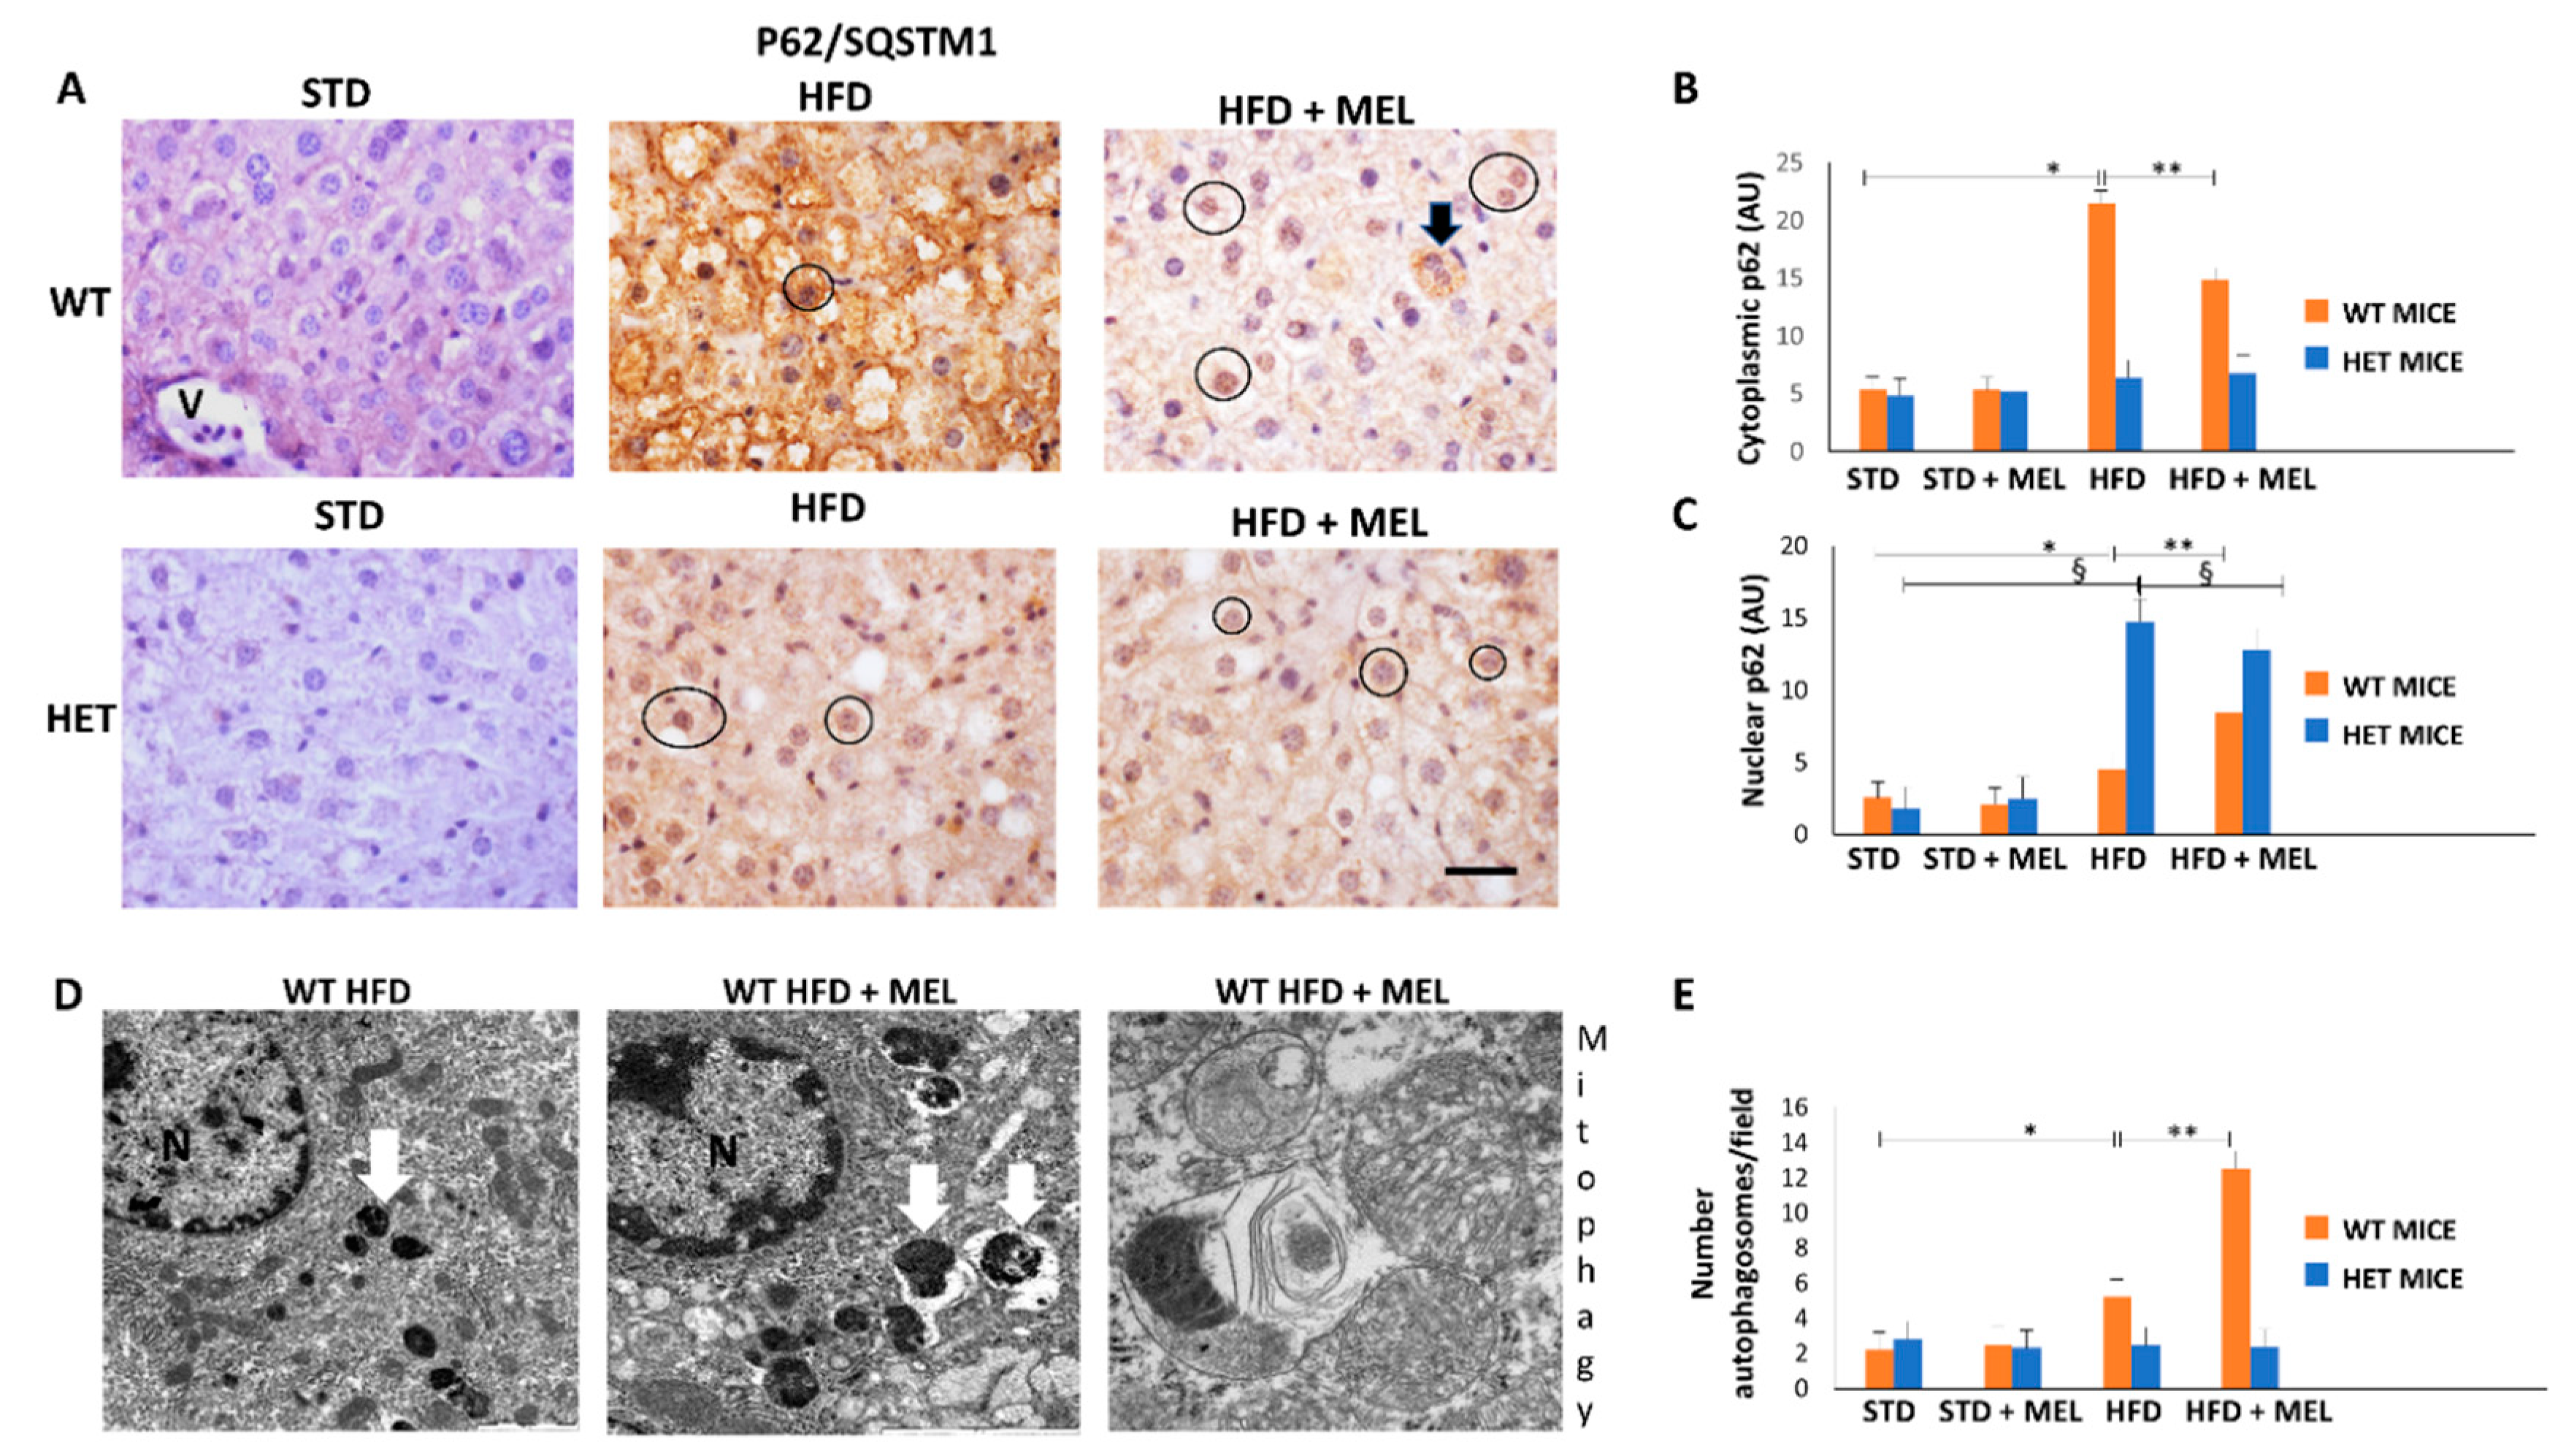
3.5. Melatonin Triggered Autophagy and Mitophagy only in WT Mice Fed a High-Fat Diet
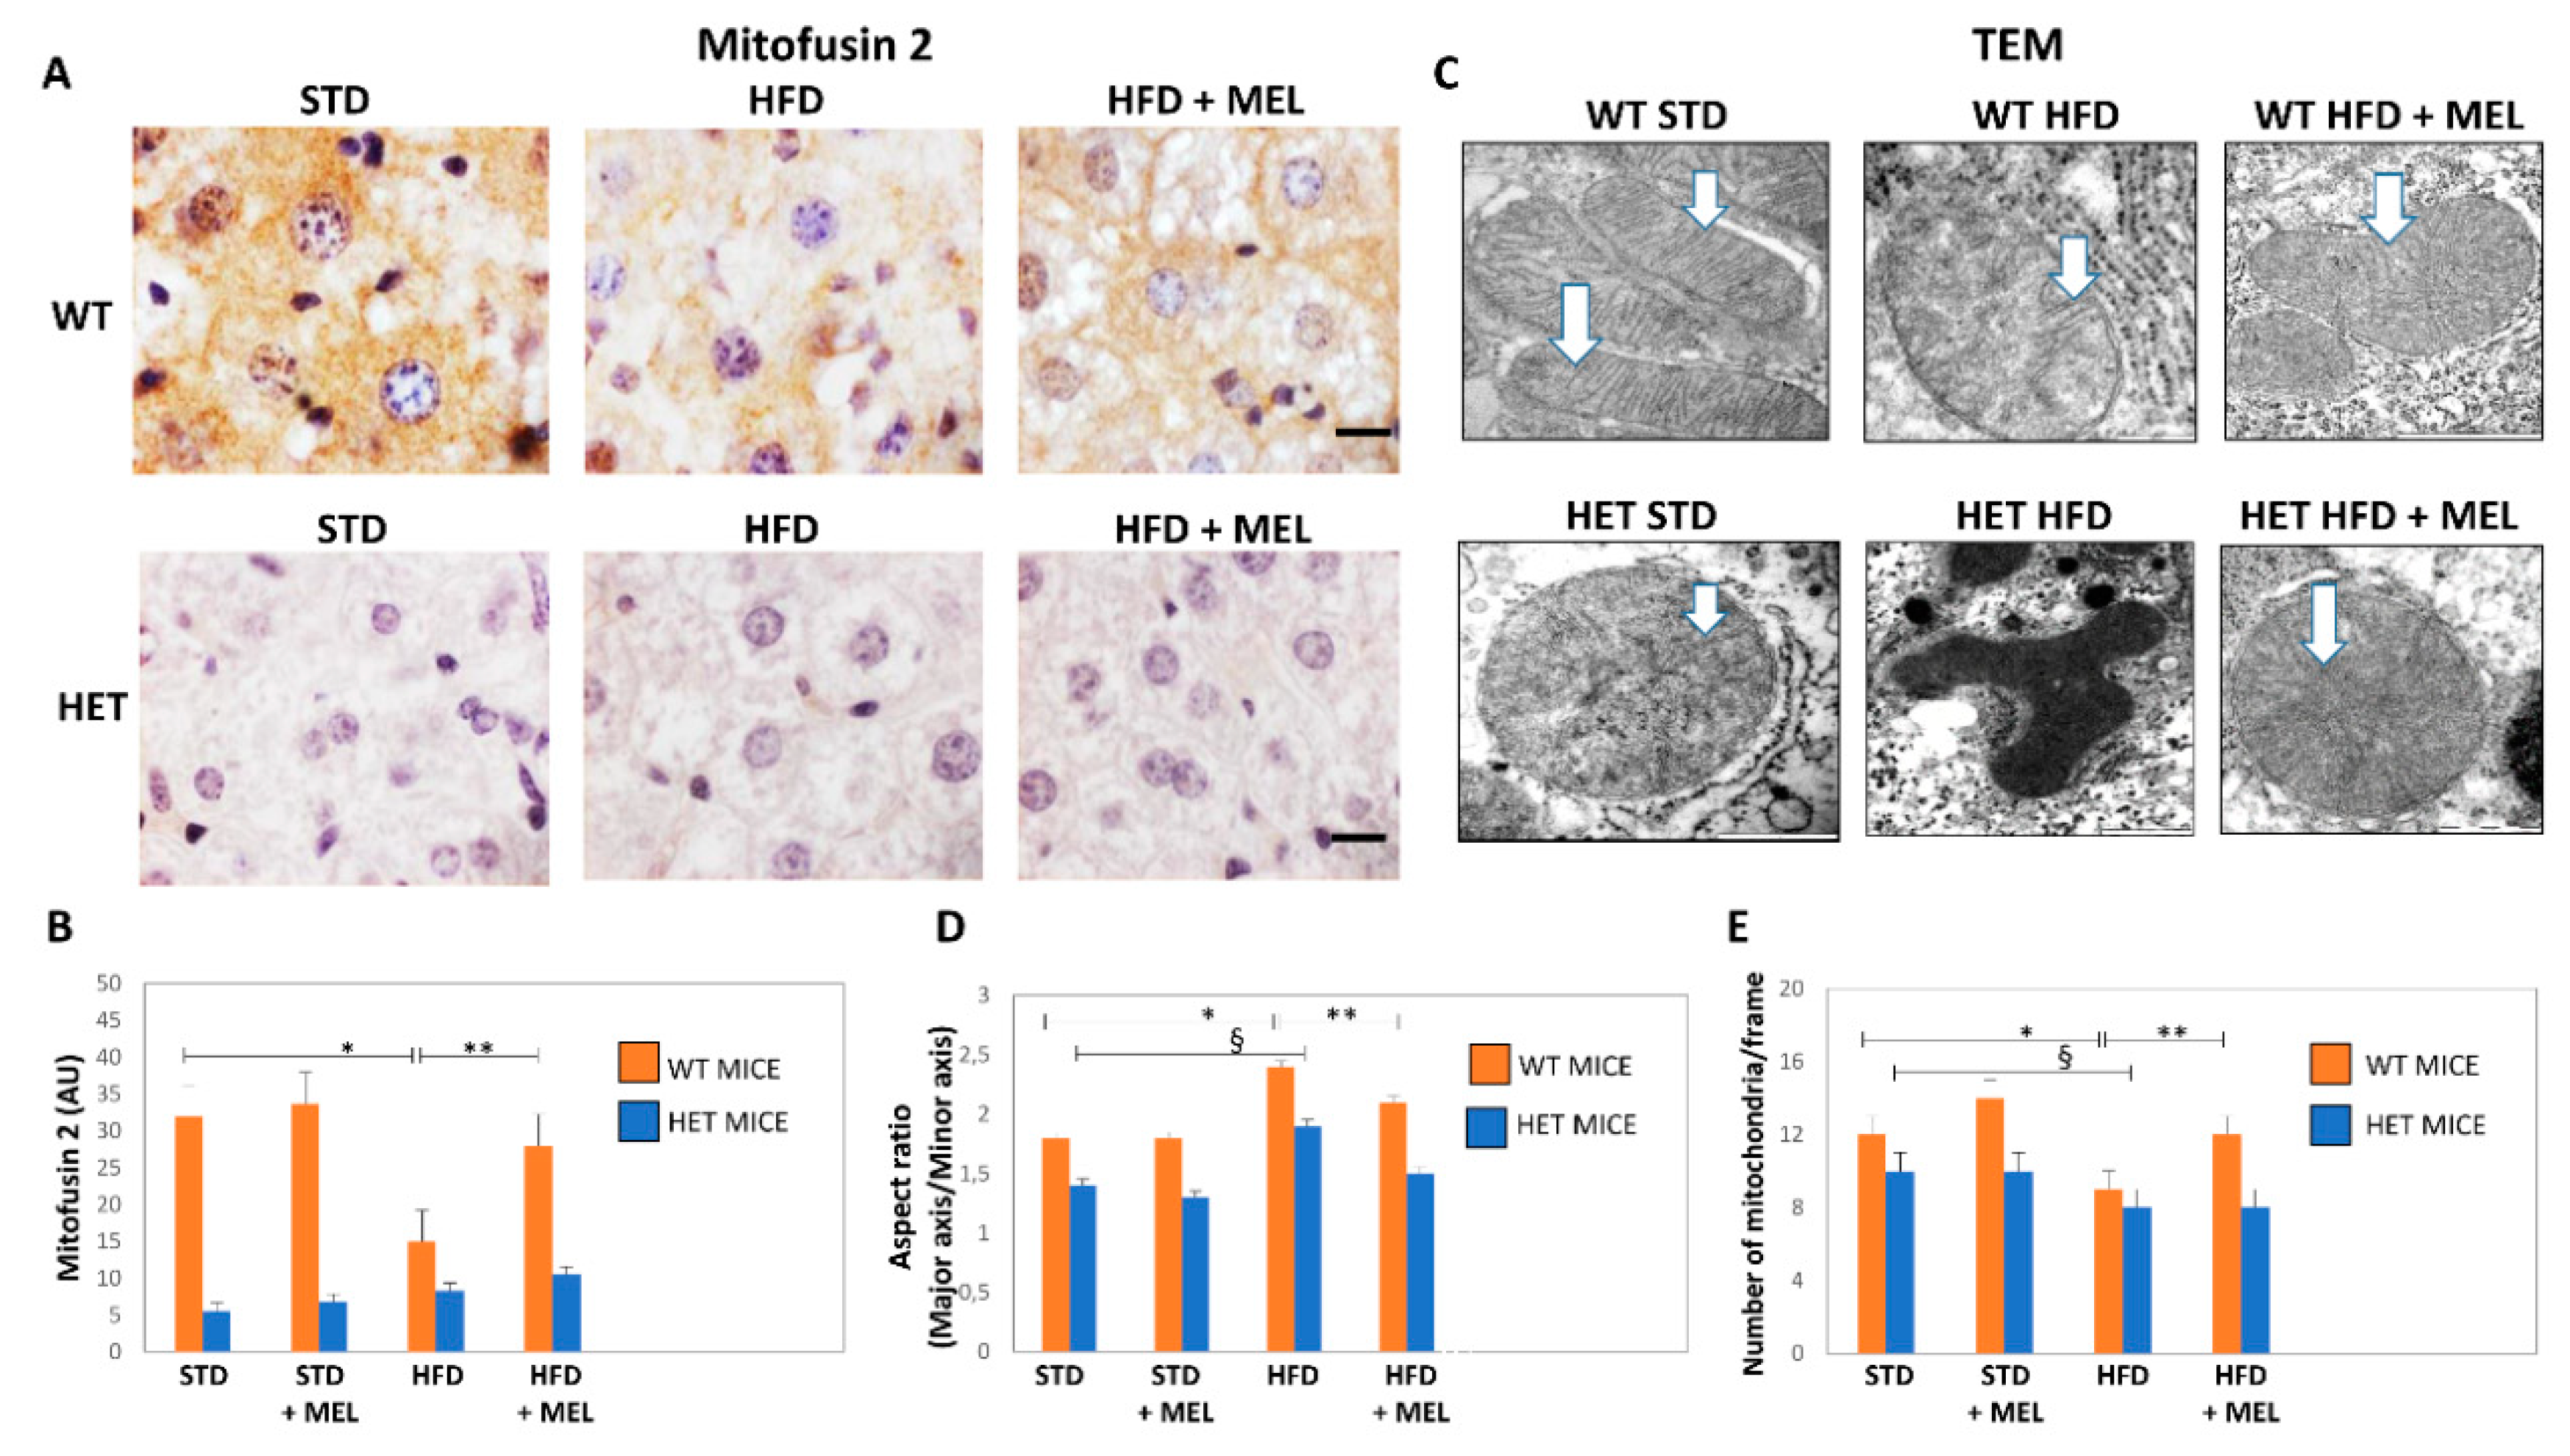
3.6. Melatonin Recovered Mitochondria in WT Mice but Not in HET Mice Placed on a High-Fat Diet
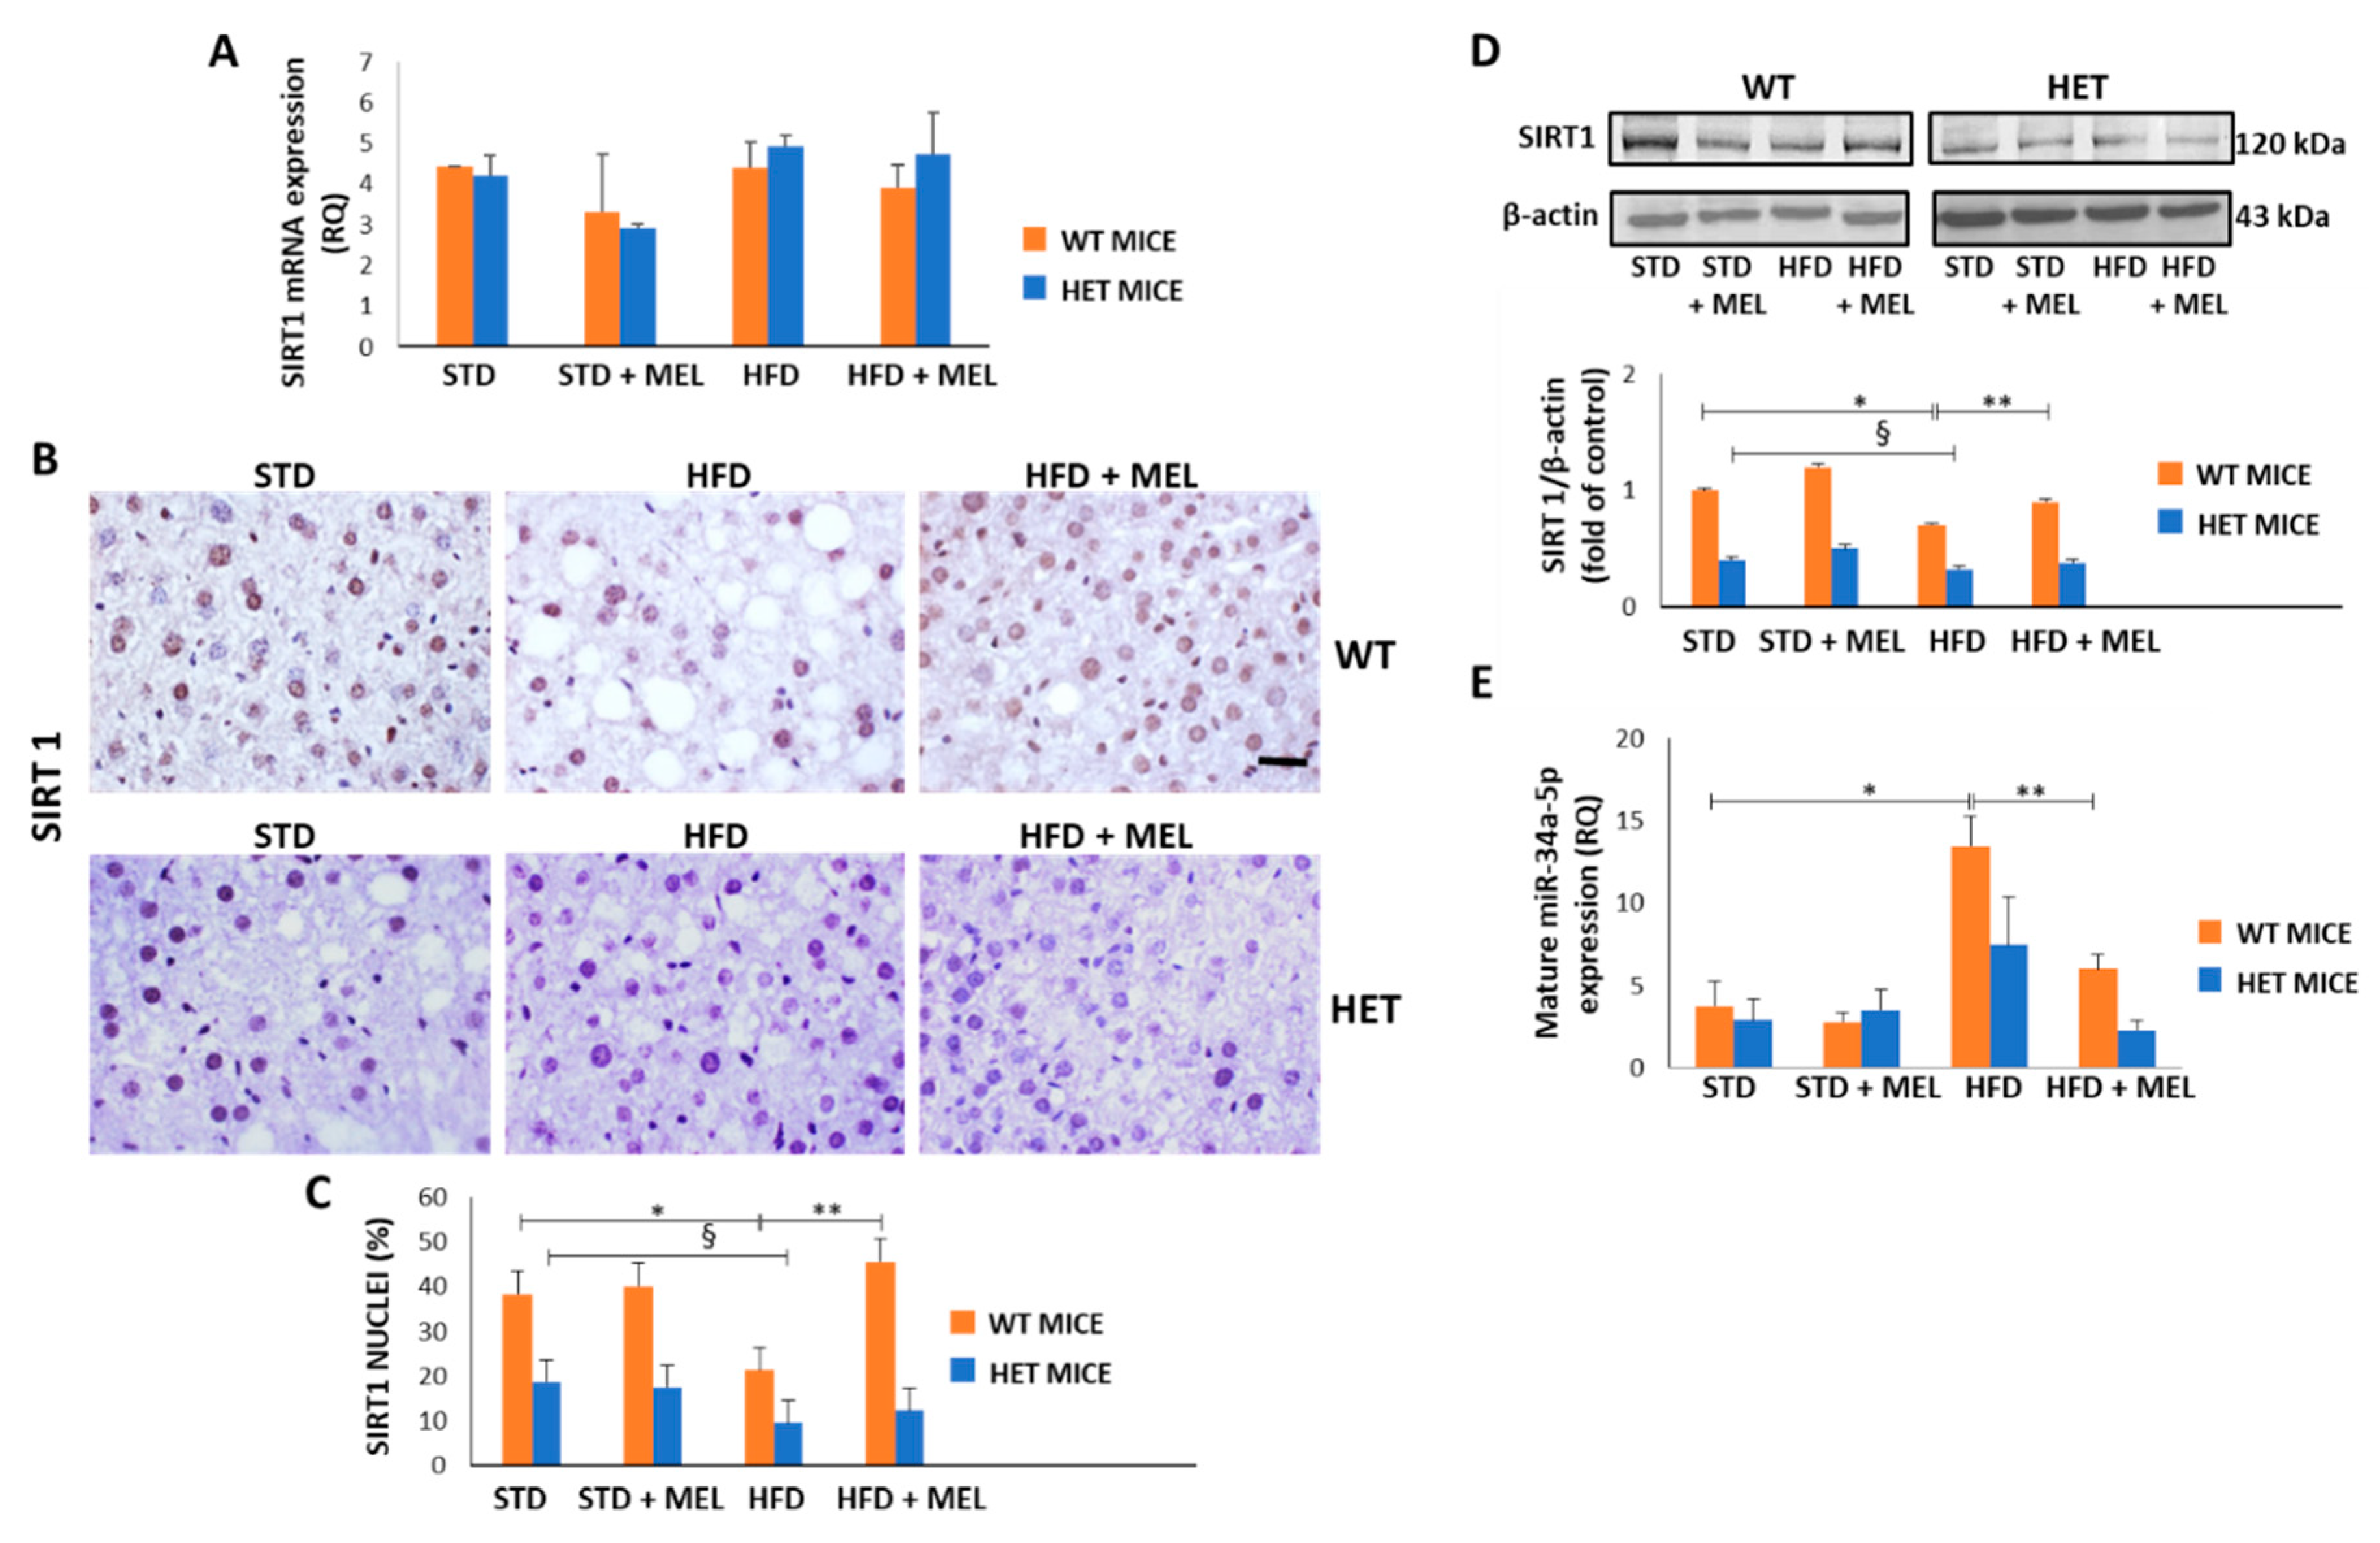
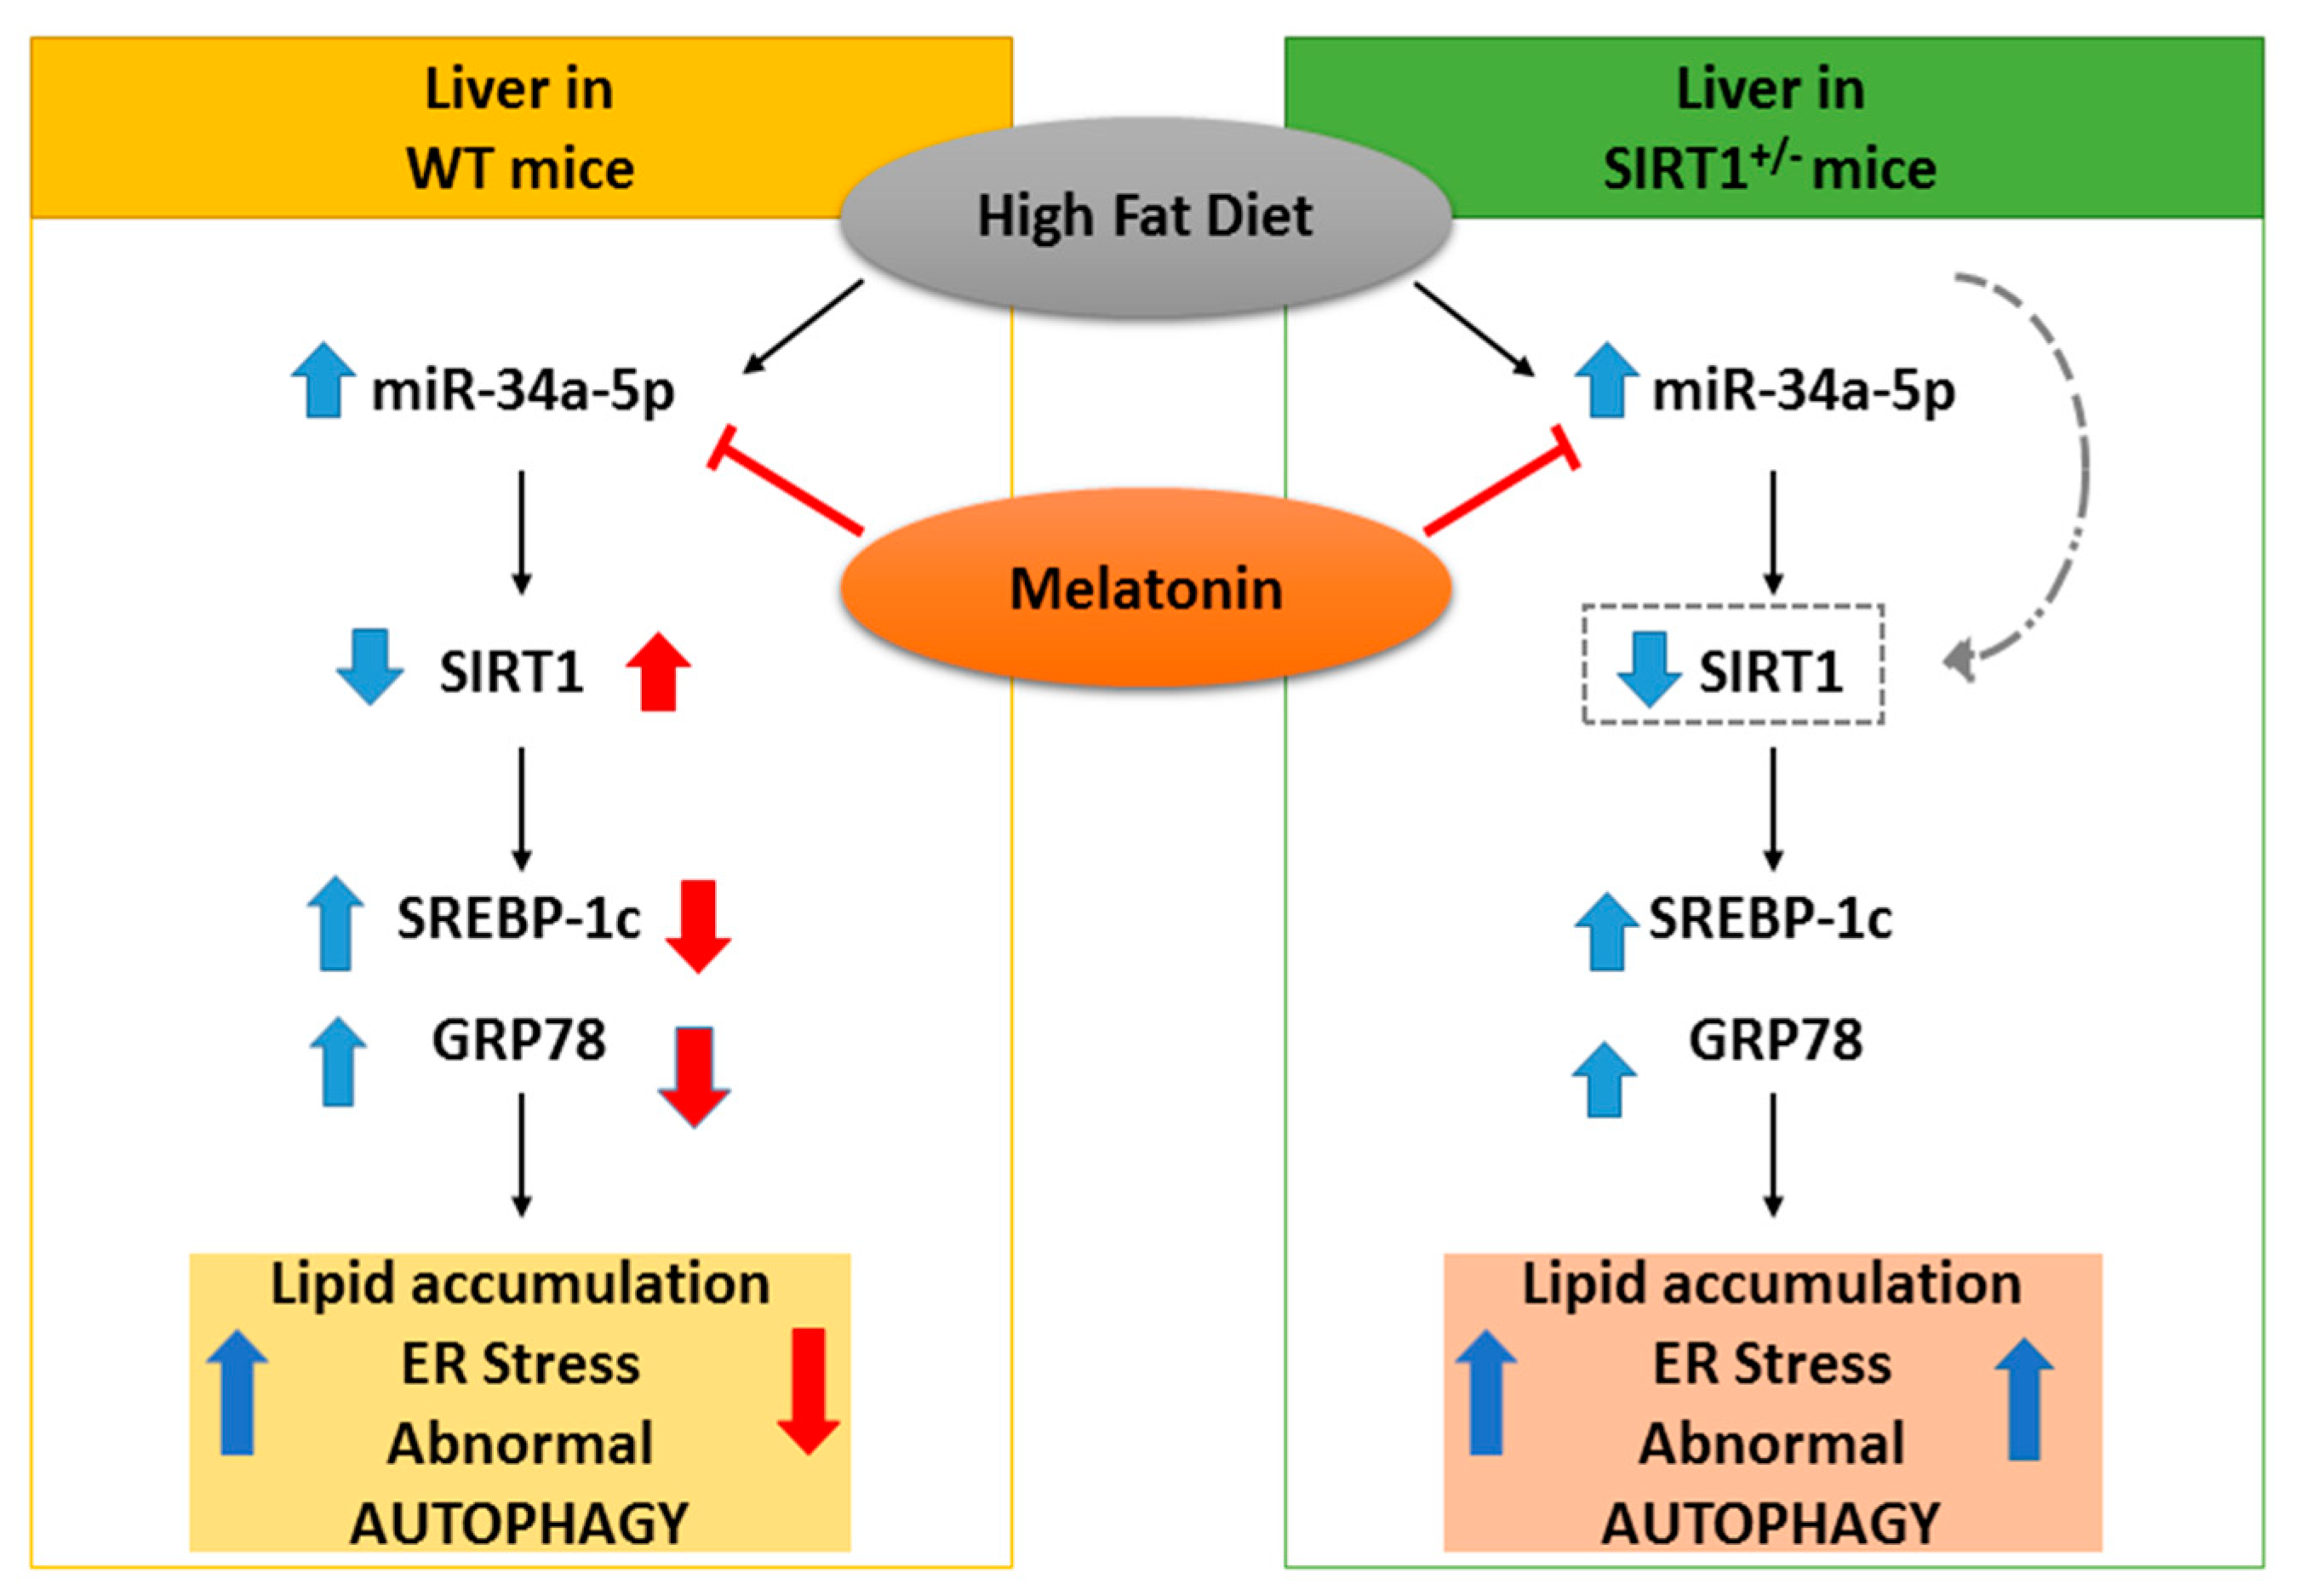
3.7. Melatonin Upregulated SIRT1 and Downregulated miR-34a-5p in WT Mice Fed a High-Fat Diet
4. Discussion
5. Conclusions
Supplementary Materials
Author Contributions
Funding
Acknowledgments
Conflicts of Interest
References
- Engin, A. Non-Alcoholic Fatty Liver Disease. Adv. Exp. Med. Biol. 2017, 960, 443–467. [Google Scholar] [PubMed]
- Tiniakos, D.G.; Vos, M.B.; Brunt, E.M. Nonalcoholic Fatty Liver Disease: Pathology and Pathogenesis. Annu. Rev. Pathol. Mech. Dis. 2010, 5, 145–171. [Google Scholar] [CrossRef] [PubMed] [Green Version]
- Mittal, S.; El-Serag, H.B.; Sada, Y.H.; Kanwal, F.; Duan, Z.; Temple, S.; May, S.B.; Kramer, J.R.; Richardson, P.A.; Davila, J.A. Hepatocellular Carcinoma in the Absence of Cirrhosis in United States Veterans Is Associated with Nonalcoholic Fatty Liver Disease. Clin. Gastroenterol. Hepatol. 2016, 14, 124–131.e1. [Google Scholar] [CrossRef]
- Younossi, Z.M. Non-alcoholic fatty liver disease—A global public health perspective. J. Hepatol. 2019, 70, 531–544. [Google Scholar] [CrossRef] [PubMed]
- Arab, J.P.; Arrese, M.; Trauner, M. Recent Insights into the Pathogenesis of Nonalcoholic Fatty Liver Disease. Annu. Rev. Pathol. Mech. Dis. 2018, 13, 321–350. [Google Scholar] [CrossRef] [PubMed]
- Mazzoccoli, G.; De Cosmo, S.; Mazza, T. The Biological Clock: A Pivotal Hub in Non-alcoholic Fatty Liver Disease Pathogenesis. Front. Physiol. 2018, 9, 193. [Google Scholar] [CrossRef] [PubMed] [Green Version]
- Ertunc, M.E.; Hotamisligil, G.S. Lipid signaling and lipotoxicity in metaflammation: Indications for metabolic disease pathogenesis and treatment. J. Lipid Res. 2016, 57, 2099–2114. [Google Scholar] [CrossRef] [PubMed]
- Lebeaupin, C.; Vallée, D.; Hazari, Y.; Hetz, C.; Chevet, E.; Bailly-Maitre, B. Endoplasmic reticulum stress signalling and the pathogenesis of non-alcoholic fatty liver disease. J. Hepatol. 2018, 69, 927–947. [Google Scholar] [CrossRef]
- Madrigal-Matute, J.; Cuervo, A.M. Regulation of Liver Metabolism by Autophagy. Gastroenterology 2016, 150, 328–339. [Google Scholar] [CrossRef] [Green Version]
- Hijmans, B.S.; Grefhorst, A.; Oosterveer, M.H.; Groen, A.K. Zonation of glucose and fatty acid metabolism in the liver: Mechanism and metabolic consequences. Biochimie 2014, 96, 121–129. [Google Scholar] [CrossRef]
- González-Rodríguez, Á.; Mayoral, R.; Agra, N.; Valdecantos, M.P.; Pardo, V.; Miquilena-Colina, M.E.; Vargas-Castrillón, J.; Lo Iacono, O.; Corazzari, M.; Fimia, G.M.; et al. Impaired autophagic flux is associated with increased endoplasmic reticulum stress during the development of NAFLD. Cell Death Dis. 2014, 5, e1179. [Google Scholar] [CrossRef] [PubMed]
- Zhang, Y.; Sowers, J.R.; Ren, J. Targeting autophagy in obesity: From pathophysiology to management. Nat. Rev. Endocrinol. 2018, 14, 356–376. [Google Scholar] [CrossRef] [PubMed]
- Gusdon, A.M.; Song, K.-X.; Qu, S. Nonalcoholic Fatty liver disease: Pathogenesis and therapeutics from a mitochondria-centric perspective. Oxid. Med. Cell. Longev. 2014, 2014, 637027. [Google Scholar] [CrossRef] [PubMed]
- De Mello, A.H.; Costa, A.B.; Engel, J.D.G.; Rezin, G.T. Mitochondrial dysfunction in obesity. Life Sci. 2018, 192, 26–32. [Google Scholar] [CrossRef] [PubMed]
- Simões, I.C.M.; Fontes, A.; Pinton, P.; Zischka, H.; Wieckowski, M.R. Mitochondria in non-alcoholic fatty liver disease. Int. J. Biochem. Cell Biol. 2018, 95, 93–99. [Google Scholar] [CrossRef] [PubMed]
- Lee, S.; Kim, J.-S. Mitophagy: Therapeutic potentials for liver disease and beyond. Toxicol. Res. 2014, 30, 243–250. [Google Scholar] [CrossRef] [PubMed]
- Tang, B.L. Sirt1 and the Mitochondria. Mol. Cells 2016, 39, 87–95. [Google Scholar] [Green Version]
- Rodgers, J.T.; Puigserver, P. Fasting-dependent glucose and lipid metabolic response through hepatic sirtuin 1. Proc. Natl. Acad. Sci. USA 2007, 104, 12861–12866. [Google Scholar] [CrossRef] [Green Version]
- Sathyanarayan, A.; Mashek, M.T.; Mashek, D.G. ATGL Promotes Autophagy/Lipophagy via SIRT1 to Control Hepatic Lipid Droplet Catabolism. Cell Rep. 2017, 19, 1–9. [Google Scholar] [CrossRef] [Green Version]
- Li, Y.; Xu, S.; Giles, A.; Nakamura, K.; Lee, J.W.; Hou, X.; Donmez, G.; Li, J.; Luo, Z.; Walsh, K.; et al. Hepatic overexpression of SIRT1 in mice attenuates endoplasmic reticulum stress and insulin resistance in the liver. FASEB J. 2011, 25, 1664–1679. [Google Scholar] [CrossRef] [Green Version]
- Ponugoti, B.; Kim, D.-H.; Xiao, Z.; Smith, Z.; Miao, J.; Zang, M.; Wu, S.-Y.; Chiang, C.-M.; Veenstra, T.D.; Kemper, J.K. SIRT1 deacetylates and inhibits SREBP-1C activity in regulation of hepatic lipid metabolism. J. Biol. Chem. 2010, 285, 33959–33970. [Google Scholar] [CrossRef] [PubMed]
- Liou, C.-J.; Lee, Y.-K.; Ting, N.-C.; Chen, Y.-L.; Shen, S.-C.; Wu, S.-J.; Huang, W.-C. Protective Effects of Licochalcone A Ameliorates Obesity and Non-Alcoholic Fatty Liver Disease Via Promotion of the Sirt-1/AMPK Pathway in Mice Fed a High-Fat Diet. Cells 2019, 8, 447. [Google Scholar] [CrossRef] [PubMed]
- Xu, F.; Gao, Z.; Zhang, J.; Rivera, C.A.; Yin, J.; Weng, J.; Ye, J. Lack of SIRT1 (Mammalian Sirtuin 1) Activity Leads to Liver Steatosis in the SIRT1 +/− Mice: A Role of Lipid Mobilization and Inflammation. Endocrinology 2010, 151, 2504–2514. [Google Scholar] [CrossRef] [PubMed]
- Mariani, S.; Fiore, D.; Basciani, S.; Persichetti, A.; Contini, S.; Lubrano, C.; Salvatori, L.; Lenzi, A.; Gnessi, L. Plasma levels of SIRT1 associate with non-alcoholic fatty liver disease in obese patients. Endocrine 2015, 49, 711–716. [Google Scholar] [CrossRef] [PubMed]
- Wu, T.; Liu, Y.; Fu, Y.; Liu, X.; Zhou, X. Direct evidence of sirtuin downregulation in the liver of non-alcoholic fatty liver disease patients. Ann. Clin. Lab. Sci. 2014, 44, 410–418. [Google Scholar] [PubMed]
- Yamakuchi, M. MicroRNA Regulation of SIRT1. Front. Physiol. 2012, 3, 68. [Google Scholar] [CrossRef] [PubMed] [Green Version]
- Lee, J.; Kemper, J.K. Controlling SIRT1 expression by microRNAs in health and metabolic disease. Aging 2010, 2, 527–534. [Google Scholar] [CrossRef] [PubMed] [Green Version]
- Yamakuchi, M.; Ferlito, M.; Lowenstein, C.J. miR-34a repression of SIRT1 regulates apoptosis. Proc. Natl. Acad. Sci. USA 2008, 105, 13421–13426. [Google Scholar] [CrossRef] [Green Version]
- Lee, J.; Padhye, A.; Sharma, A.; Song, G.; Miao, J.; Mo, Y.-Y.; Wang, L.; Kemper, J.K. A pathway involving farnesoid X receptor and small heterodimer partner positively regulates hepatic sirtuin 1 levels via microRNA-34a inhibition. J. Biol. Chem. 2010, 285, 12604–12611. [Google Scholar] [CrossRef]
- Ding, J.; Li, M.; Wan, X.; Jin, X.; Chen, S.; Yu, C.; Li, Y. Effect of MIR-34a in regulating steatosis by targeting PPARα expression in nonalcoholic fatty liver disease. Sci. Rep. 2015, 5, 13729. [Google Scholar] [CrossRef]
- Pogribny, I.P.; Starlard-Davenport, A.; Tryndyak, V.P.; Han, T.; Ross, S.A.; Rusyn, I.; Beland, F.A. Difference in expression of hepatic microRNAs miR-29c, miR-34a, miR-155, and miR-200b is associated with strain-specific susceptibility to dietary nonalcoholic steatohepatitis in mice. Lab. Investig. 2010, 90, 1437. [Google Scholar] [CrossRef] [PubMed]
- Castro, R.E.; Ferreira, D.M.S.; Afonso, M.B.; Borralho, P.M.; Machado, M.V.; Cortez-Pinto, H.; Rodrigues, C.M.P. miR-34a/SIRT1/p53 is suppressed by ursodeoxycholic acid in the rat liver and activated by disease severity in human non-alcoholic fatty liver disease. J. Hepatol. 2013, 58, 119–125. [Google Scholar] [CrossRef] [PubMed]
- Venegas, C.; García, J.A.; Escames, G.; Ortiz, F.; López, A.; Doerrier, C.; García-Corzo, L.; López, L.C.; Reiter, R.J.; Acuña-Castroviejo, D. Extrapineal melatonin: Analysis of its subcellular distribution and daily fluctuations. J. Pineal Res. 2012, 52, 217–227. [Google Scholar] [CrossRef] [PubMed]
- Maldonado, M.D.; Mora-Santos, M.; Naji, L.; Carrascosa-Salmoral, M.P.; Naranjo, M.C.; Calvo, J.R. Evidence of melatonin synthesis and release by mast cells. Possible modulatory role on inflammation. Pharmacol. Res. 2010, 62, 282–287. [Google Scholar] [CrossRef] [PubMed]
- Reiter, R.J.; Rosales-Corral, S.; Tan, D.X.; Jou, M.J.; Galano, A.; Xu, B. Melatonin as a mitochondria-targeted antioxidant: One of evolution’s best ideas. Cell. Mol. Life Sci. 2017, 74, 3863–3881. [Google Scholar] [CrossRef] [PubMed]
- Valenzuela-Melgarejo, F.J.; Caro-Díaz, C.; Cabello-Guzmán, G. Potential Crosstalk between Fructose and Melatonin: A New Role of Melatonin-Inhibiting the Metabolic Effects of Fructose. Int. J. Endocrinol. 2018, 2018, 7515767. [Google Scholar] [CrossRef]
- Tan, D.-X.; Manchester, L.C.; Qin, L.; Reiter, R.J. Melatonin: A Mitochondrial Targeting Molecule Involving Mitochondrial Protection and Dynamics. Int. J. Mol. Sci. 2016, 17, 2124. [Google Scholar] [CrossRef]
- Song, C.; Li, M.; Xu, L.; Shen, Y.; Yang, H.; Ding, M.; Liu, X.; Xie, Z. Mitochondrial biogenesis mediated by melatonin in an APPswe/PS1dE9 transgenic mice model. Neuroreport 2018, 29, 1517–1524. [Google Scholar] [CrossRef]
- Venegas, C.; García, J.A.; Doerrier, C.; Volt, H.; Escames, G.; López, L.C.; Reiter, R.J.; Acuña-Castroviejo, D. Analysis of the daily changes of melatonin receptors in the rat liver. J. Pineal Res. 2013, 54, 313–321. [Google Scholar] [CrossRef]
- Stacchiotti, A.; Favero, G.; Lavazza, A.; Golic, I.; Aleksic, M.; Korac, A.; Rodella, L.F.; Rezzani, R. Hepatic Macrosteatosis Is Partially Converted to Microsteatosis by Melatonin Supplementation in ob/ob Mice Non-Alcoholic Fatty Liver Disease. PLoS ONE 2016, 11, e0148115. [Google Scholar] [CrossRef]
- Bonomini, F.; Favero, G.; Rodella, L.F.; Moghadasian, M.H.; Rezzani, R. Melatonin Modulation of Sirtuin-1 Attenuates Liver Injury in a Hypercholesterolemic Mouse Model. BioMed Res. Int. 2018, 2018, 7968452. [Google Scholar] [CrossRef] [PubMed]
- Mayo, J.C.; Sainz, R.M.; González Menéndez, P.; Cepas, V.; Tan, D.-X.; Reiter, R.J. Melatonin and sirtuins: A “not-so unexpected” relationship. J. Pineal Res. 2017, 62, e12391. [Google Scholar] [CrossRef] [PubMed]
- Machado, M.V.; Michelotti, G.A.; Xie, G.; de Almeida, T.P.; Boursier, J.; Bohnic, B.; Guy, C.D.; Diehl, A.M.; Diehl, A.M. Mouse Models of Diet-Induced Nonalcoholic Steatohepatitis Reproduce the Heterogeneity of the Human Disease. PLoS ONE 2015, 10, e0127991. [Google Scholar] [CrossRef] [PubMed]
- Van Herck, M.; Vonghia, L.; Francque, S. Animal Models of Nonalcoholic Fatty Liver Disease—A Starter’s Guide. Nutrients 2017, 9, 1072. [Google Scholar] [CrossRef] [PubMed]
- Henkel, J.; Alfine, E.; Saín, J.; Jöhrens, K.; Weber, D.; Castro, J.; König, J.; Stuhlmann, C.; Vahrenbrink, M.; Jonas, W.; et al. Soybean Oil-Derived Poly-Unsaturated Fatty Acids Enhance Liver Damage in NAFLD Induced by Dietary Cholesterol. Nutrients 2018, 10, 1326. [Google Scholar] [CrossRef]
- Asgharpour, A.; Cazanave, S.C.; Pacana, T.; Seneshaw, M.; Vincent, R.; Banini, B.A.; Kumar, D.P.; Daita, K.; Min, H.-K.; Mirshahi, F.; et al. A diet-induced animal model of non-alcoholic fatty liver disease and hepatocellular cancer. J. Hepatol. 2016, 65, 579–588. [Google Scholar] [CrossRef] [PubMed] [Green Version]
- Castro, R.E.; Diehl, A.M. Towards a definite mouse model of NAFLD. J. Hepatol. 2018, 69, 272–274. [Google Scholar] [CrossRef] [Green Version]
- Rezzani, R.; Favero, G.; Stacchiotti, A.; Rodella, L.F. Endothelial and vascular smooth muscle cell dysfunction mediated by cyclophylin A and the atheroprotective effects of melatonin. Life Sci. 2013, 92, 875–882. [Google Scholar] [CrossRef]
- Ezaki, J.; Matsumoto, N.; Takeda-Ezaki, M.; Komatsu, M.; Takahashi, K.; Hiraoka, Y.; Taka, H.; Fujimura, T.; Takehana, K.; Yoshida, M.; et al. Liver autophagy contributes to the maintenance of blood glucose and amino acid levels. Autophagy 2011, 7, 727–736. [Google Scholar] [CrossRef] [Green Version]
- Mollica, M.P.; Mattace Raso, G.; Cavaliere, G.; Trinchese, G.; De Filippo, C.; Aceto, S.; Prisco, M.; Pirozzi, C.; Di Guida, F.; Lama, A.; et al. Butyrate Regulates Liver Mitochondrial Function, Efficiency, and Dynamics in Insulin-Resistant Obese Mice. Diabetes 2017, 66, 1405–1418. [Google Scholar] [CrossRef] [Green Version]
- Eskelinen, E.-L. Maturation of autophagic vacuoles in Mammalian cells. Autophagy 2005, 1, 1–10. [Google Scholar] [CrossRef] [PubMed]
- Salvi, A.; Bongarzone, I.; Ferrari, L.; Abeni, E.; Arici, B.; De Bortoli, M.; Scuri, S.; Bonini, D.; Grossi, I.; Benetti, A.; et al. Molecular characterization of LASP-1 expression reveals vimentin as its new partner in human hepatocellular carcinoma cells. Int. J. Oncol. 2015, 46, 1901–1912. [Google Scholar] [CrossRef] [PubMed] [Green Version]
- Grossi, I.; Arici, B.; Portolani, N.; De Petro, G.; Salvi, A. Clinical and biological significance of miR-23b and miR-193a in human hepatocellular carcinoma. Oncotarget 2017, 8, 6955. [Google Scholar] [CrossRef] [PubMed]
- Schmittgen, T.D.; Livak, K.J. Analyzing real-time PCR data by the comparative C(T) method. Nat. Protoc. 2008, 3, 1101. [Google Scholar] [CrossRef] [PubMed]
- Kleiner, D.E.; Brunt, E.M.; Van Natta, M.; Behling, C.; Contos, M.J.; Cummings, O.W.; Ferrell, L.D.; Liu, Y.-C.; Torbenson, M.S.; Unalp-Arida, A.; et al. Design and validation of a histological scoring system for nonalcoholic fatty liver disease. Hepatology 2005, 41, 1313–1321. [Google Scholar] [CrossRef] [PubMed]
- Manley, S.; Williams, J.A.; Ding, W.-X. Role of p62/SQSTM1 in liver physiology and pathogenesis. Exp. Biol. Med. 2013, 238, 525–538. [Google Scholar] [CrossRef] [PubMed] [Green Version]
- Li, X.; Lian, F.; Liu, C.; Hu, K.-Q.; Wang, X.-D. Isocaloric Pair-Fed High-Carbohydrate Diet Induced More Hepatic Steatosis and Inflammation than High-Fat Diet Mediated by miR-34a/SIRT1 Axis in Mice. Sci. Rep. 2015, 5, 16774. [Google Scholar] [CrossRef] [PubMed]
- Guo, P.; Pi, H.; Xu, S.; Zhang, L.; Li, Y.; Li, M.; Cao, Z.; Tian, L.; Xie, J.; Li, R.; et al. Melatonin Improves Mitochondrial Function by Promoting MT1/SIRT1/PGC-1 Alpha-Dependent Mitochondrial Biogenesis in Cadmium-Induced Hepatotoxicity In Vitro. Toxicol. Sci. 2014, 142, 182–195. [Google Scholar] [CrossRef] [Green Version]
- Ding, M.; Feng, N.; Tang, D.; Feng, J.; Li, Z.; Jia, M.; Liu, Z.; Gu, X.; Wang, Y.; Fu, F.; et al. Melatonin prevents Drp1-mediated mitochondrial fission in diabetic hearts through SIRT1-PGC1α pathway. J. Pineal Res. 2018, 65, e12491. [Google Scholar] [CrossRef]
- Carloni, S.; Favrais, G.; Saliba, E.; Albertini, M.C.; Chalon, S.; Longini, M.; Gressens, P.; Buonocore, G.; Balduini, W. Melatonin modulates neonatal brain inflammation through endoplasmic reticulum stress, autophagy, and miR-34a/silent information regulator 1 pathway. J. Pineal Res. 2016, 61, 370–380. [Google Scholar] [CrossRef]
- Pakravan, H.; Ahmadian, M.; Fani, A.; Aghaee, D.; Brumanad, S.; Pakzad, B. The Effects of Melatonin in Patients with Nonalcoholic Fatty Liver Disease: A Randomized Controlled Trial. Adv. Biomed. Res. 2017, 6, 40. [Google Scholar] [PubMed]
- Pan, M.; Song, Y.-L.; Xu, J.-M.; Gan, H.-Z. Melatonin ameliorates nonalcoholic fatty liver induced by high-fat diet in rats. J. Pineal Res. 2006, 41, 79–84. [Google Scholar] [CrossRef]
- Bonomini, F.; Borsani, E.; Favero, G.; Rodella, L.F.; Rezzani, R. Dietary Melatonin Supplementation Could Be a Promising Preventing/Therapeutic Approach for a Variety of Liver Diseases. Nutrients 2018, 10, 1135. [Google Scholar] [CrossRef] [PubMed]
- Su, S.-C.; Reiter, R.J.; Hsiao, H.-Y.; Chung, W.-H.; Yang, S.-F. Functional Interaction between Melatonin Signaling and Noncoding RNAs. Trends Endocrinol. Metab. 2018, 29, 435–445. [Google Scholar] [CrossRef] [PubMed]
- Tessitore, A.; Cicciarelli, G.; Del Vecchio, F.; Gaggiano, A.; Verzella, D.; Fischietti, M.; Mastroiaco, V.; Vetuschi, A.; Sferra, R.; Barnabei, R.; et al. MicroRNA expression analysis in high fat diet-induced NAFLD-NASH-HCC progression: Study on C57BL/6J mice. BMC Cancer 2016, 16, 3. [Google Scholar] [CrossRef] [PubMed]
- Fu, T.; Choi, S.-E.; Kim, D.-H.; Seok, S.; Suino-Powell, K.M.; Xu, H.E.; Kemper, J.K. Aberrantly elevated microRNA-34a in obesity attenuates hepatic responses to FGF19 by targeting a membrane coreceptor β-Klotho. Proc. Natl. Acad. Sci. USA 2012, 109, 16137–16142. [Google Scholar] [CrossRef]
- Ding, S.; Jiang, J.; Zhang, G.; Bu, Y.; Zhang, G.; Zhao, X. Resveratrol and caloric restriction prevent hepatic steatosis by regulating SIRT1-autophagy pathway and alleviating endoplasmic reticulum stress in high-fat diet-fed rats. PLoS ONE 2017, 12, e0183541. [Google Scholar] [CrossRef] [PubMed]
- Han, H.-S.; Choi, B.H.; Kim, J.S.; Kang, G.; Koo, S.-H. Hepatic Crtc2 controls whole body energy metabolism via a miR-34a-Fgf21 axis. Nat. Commun. 2017, 8, 1878. [Google Scholar] [CrossRef] [Green Version]
- Knebel, B.; Haas, J.; Hartwig, S.; Jacob, S.; Köllmer, C.; Nitzgen, U.; Muller–Wieland, D.; Kotzka, J. Liver-Specific Expression of Transcriptionally Active SREBP-1c Is Associated with Fatty Liver and Increased Visceral Fat Mass. PLoS ONE 2012, 7, e31812. [Google Scholar] [CrossRef]
- Matsumoto, E.; Ishihara, A.; Tamai, S.; Nemoto, A.; Iwase, K.; Hiwasa, T.; Shibata, S.; Takiguchi, M. Time of day and nutrients in feeding govern daily expression rhythms of the gene for sterol regulatory element-binding protein (SREBP)-1 in the mouse liver. J. Biol. Chem. 2010, 285, 33028–33036. [Google Scholar] [CrossRef]
- Zhang, Y.; Geng, C.; Liu, X.; Li, M.; Gao, M.; Liu, X.; Fang, F.; Chang, Y. Celastrol ameliorates liver metabolic damage caused by a high-fat diet through Sirt1. Mol. Metab. 2017, 6, 138–147. [Google Scholar] [CrossRef] [PubMed]
- Xu, F.; Zheng, X.; Lin, B.; Liang, H.; Cai, M.; Cao, H.; Ye, J.; Weng, J. Diet-induced obesity and insulin resistance are associated with brown fat degeneration in SIRT1-deficient mice. Obesity 2016, 24, 634–642. [Google Scholar] [CrossRef] [PubMed] [Green Version]
- Galloway, C.A.; Lee, H.; Brookes, P.S.; Yoon, Y. Decreasing mitochondrial fission alleviates hepatic steatosis in a murine model of nonalcoholic fatty liver disease. Am. J. Physiol. Liver Physiol. 2014, 307, G632–G641. [Google Scholar] [CrossRef] [PubMed] [Green Version]
- Chen, X.; Li, L.; Liu, X.; Luo, R.; Liao, G.; Li, L.; Liu, J.; Cheng, J.; Lu, Y.; Chen, Y. Oleic acid protects saturated fatty acid mediated lipotoxicity in hepatocytes and rat of non-alcoholic steatohepatitis. Life Sci. 2018, 203, 291–304. [Google Scholar] [CrossRef] [PubMed]
- Wang, J.-M.; Qiu, Y.; Yang, Z.; Kim, H.; Qian, Q.; Sun, Q.; Zhang, C.; Yin, L.; Fang, D.; Back, S.H.; et al. IRE1α prevents hepatic steatosis by processing and promoting the degradation of select microRNAs. Sci. Signal 2018, 11, eaao4617. [Google Scholar] [CrossRef]
- Wree, A.; Marra, F. The inflammasome in liver disease. J. Hepatol. 2016, 65, 1055–1056. [Google Scholar] [CrossRef] [PubMed]
- Scott, C.L.; Guilliams, M. The role of Kupffer cells in hepatic iron and lipid metabolism. J. Hepatol. 2018, 69, 1197–1199. [Google Scholar] [CrossRef] [Green Version]
- Boga, J.A.; Caballero, B.; Potes, Y.; Perez-Martinez, Z.; Reiter, R.J.; Vega-Naredo, I.; Coto-Montes, A. Therapeutic potential of melatonin related to its role as an autophagy regulator: A review. J. Pineal Res. 2019, 66, e12534. [Google Scholar] [CrossRef]
- Liu, C.; Liu, L.; Zhu, H.-D.; Sheng, J.-Q.; Wu, X.-L.; He, X.-X.; Tian, D.-A.; Liao, J.-Z.; Li, P.-Y. Celecoxib alleviates nonalcoholic fatty liver disease by restoring autophagic flux. Sci. Rep. 2018, 8, 4108. [Google Scholar] [CrossRef]
- Chen, R.; Wang, Q.; Song, S.; Liu, F.; He, B.; Gao, X. Protective role of autophagy in methionine-choline deficient diet-induced advanced nonalcoholic steatohepatitis in mice. Eur. J. Pharmacol. 2016, 770, 126–133. [Google Scholar] [CrossRef]
- Zhou, H.; Du, W.; Li, Y.; Shi, C.; Hu, N.; Ma, S.; Wang, W.; Ren, J. Effects of melatonin on fatty liver disease: The role of NR4A1/DNA-PKcs/p53 pathway, mitochondrial fission, and mitophagy. J. Pineal Res. 2018, 64, e12450. [Google Scholar] [CrossRef] [PubMed]
- Wang, X.; Zhang, X.; Chu, E.S.H.; Chen, X.; Kang, W.; Wu, F.; To, K.-F.; Wong, V.W.S.; Chan, H.L.Y.; Chan, M.T.V.; et al. Defective lysosomal clearance of autophagosomes and its clinical implications in nonalcoholic steatohepatitis. FASEB J. 2018, 32, 37–51. [Google Scholar] [CrossRef] [PubMed]
- Biel, T.G.; Lee, S.; Flores-Toro, J.A.; Dean, J.W.; Go, K.L.; Lee, M.-H.; Law, B.K.; Law, M.E.; Dunn, W.A.; Zendejas, I.; et al. Sirtuin 1 suppresses mitochondrial dysfunction of ischemic mouse livers in a mitofusin 2-dependent manner. Cell Death Differ. 2016, 23, 279–290. [Google Scholar] [CrossRef] [PubMed]
- Yamada, T.; Murata, D.; Adachi, Y.; Itoh, K.; Kameoka, S.; Igarashi, A.; Kato, T.; Araki, Y.; Huganir, R.L.; Dawson, T.M.; et al. Mitochondrial Stasis Reveals p62-Mediated Ubiquitination in Parkin-Independent Mitophagy and Mitigates Nonalcoholic Fatty Liver Disease. Cell Metab. 2018, 28, 588–604.e5. [Google Scholar] [CrossRef] [PubMed] [Green Version]
- Nassir, F.; Ibdah, J.A. Sirtuins and nonalcoholic fatty liver disease. World J. Gastroenterol. 2016, 22, 10084. [Google Scholar] [CrossRef] [PubMed]
- de Luxán-Delgado, B.; Caballero, B.; Potes, Y.; Rubio-González, A.; Rodríguez, I.; Gutiérrez-Rodríguez, J.; Solano, J.J.; Coto-Montes, A. Melatonin administration decreases adipogenesis in the liver of ob/ob mice through autophagy modulation. J. Pineal Res. 2014, 56, 126–133. [Google Scholar] [CrossRef] [PubMed]
- Wang, Y.; Zhu, K.; Yu, W.; Wang, H.; Liu, L.; Wu, Q.; Li, S.; Guo, J. MiR-181b regulates steatosis in nonalcoholic fatty liver disease via targeting SIRT1. Biochem. Biophys. Res. Commun. 2017, 493, 227–232. [Google Scholar] [CrossRef]
- Zhang, Z.; Silveyra, E.; Jin, N.; Ribelayga, C.P. A congenic line of the C57BL/6J mouse strain that is proficient in melatonin synthesis. J. Pineal Res. 2018, 65, e12509. [Google Scholar] [CrossRef]
- Shao, D.; Yao, C.; Kim, M.H.; Fry, J.; Cohen, R.A.; Costello, C.E.; Matsui, R.; Seta, F.; McComb, M.E.; Bachschmid, M.M. Improved mass spectrometry-based activity assay reveals oxidative and metabolic stress as sirtuin-1 regulators. Redox Biol. 2019, 22, 101150. [Google Scholar] [CrossRef]


© 2019 by the authors. Licensee MDPI, Basel, Switzerland. This article is an open access article distributed under the terms and conditions of the Creative Commons Attribution (CC BY) license (http://creativecommons.org/licenses/by/4.0/).
Share and Cite
Stacchiotti, A.; Grossi, I.; García-Gómez, R.; Patel, G.A.; Salvi, A.; Lavazza, A.; De Petro, G.; Monsalve, M.; Rezzani, R. Melatonin Effects on Non-Alcoholic Fatty Liver Disease Are Related to MicroRNA-34a-5p/Sirt1 Axis and Autophagy. Cells 2019, 8, 1053. https://doi.org/10.3390/cells8091053
Stacchiotti A, Grossi I, García-Gómez R, Patel GA, Salvi A, Lavazza A, De Petro G, Monsalve M, Rezzani R. Melatonin Effects on Non-Alcoholic Fatty Liver Disease Are Related to MicroRNA-34a-5p/Sirt1 Axis and Autophagy. Cells. 2019; 8(9):1053. https://doi.org/10.3390/cells8091053
Chicago/Turabian StyleStacchiotti, Alessandra, Ilaria Grossi, Raquel García-Gómez, Gaurangkumar Arvindbhai Patel, Alessandro Salvi, Antonio Lavazza, Giuseppina De Petro, Maria Monsalve, and Rita Rezzani. 2019. "Melatonin Effects on Non-Alcoholic Fatty Liver Disease Are Related to MicroRNA-34a-5p/Sirt1 Axis and Autophagy" Cells 8, no. 9: 1053. https://doi.org/10.3390/cells8091053