Article

Forkhead Domains of FOXO Transcription Factors Differ in both Overall Conformation and Dynamics

by
Katarina Psenakova
1,2,†,
Klara Kohoutova
1,†,
Veronika Obsilova
2,
Michael J. Ausserlechner
3,
Vaclav Veverka
4,5,* and
Tomas Obsil
1,2,*
1
Department of Physical and Macromolecular Chemistry, Faculty of Science, Charles University, 128 43 Prague, Czech Republic
2
Department of Structural Biology of Signaling Proteins, Division BIOCEV, Institute of Physiology of the Czech Academy of Sciences, 252 50 Vestec, Czech Republic
3
Department of Pediatrics I, Medical University Innsbruck, A-6020 Innsbruck, Austria
4
Institute of Organic Chemistry and Biochemistry of the Czech Academy of Sciences, 166 10 Prague, Czech Republic
5
Department of Cell Biology, Faculty of Science, Charles University, 128 43 Prague, Czech Republic
*
Authors to whom correspondence should be addressed.
These authors contributed equally to this work.
Cells 2019, 8(9), 966; https://doi.org/10.3390/cells8090966
Submission received: 30 July 2019 / Revised: 21 August 2019 / Accepted: 23 August 2019 / Published: 24 August 2019
(This article belongs to the Special Issue The FoxO Transcription Factors and Metabolic Regulation)

Abstract

:
FOXO transcription factors regulate cellular homeostasis, longevity and response to stress. FOXO1 (also known as FKHR) is a key regulator of hepatic glucose production and lipid metabolism, and its specific inhibition may have beneficial effects on diabetic hyperglycemia by reducing hepatic glucose production. Moreover, all FOXO proteins are considered potential drug targets for drug resistance prevention in cancer therapy. However, the development of specific FOXO inhibitors requires a detailed understanding of structural differences between individual FOXO DNA-binding domains. The high-resolution structure of the DNA-binding domain of FOXO1 reported in this study and its comparison with structures of other FOXO proteins revealed differences in both their conformation and flexibility. These differences are encoded by variations in protein sequences and account for the distinct functions of FOXO proteins. In particular, the positions of the helices H1, H2 and H3, whose interface form the hydrophobic core of the Forkhead domain, and the interactions between hydrophobic residues located on the interface between the N-terminal segment, the H2-H3 loop, and the recognition helix H3 differ among apo FOXO1, FOXO3 and FOXO4 proteins. Therefore, the availability of apo structures of DNA-binding domains of all three major FOXO proteins will support the development of FOXO-type-specific inhibitors.

Graphical Abstract

1. Introduction

The members of the Forkhead box (FOX) family of transcription factors share a conserved winged-helix DNA-binding domain (DBD) known as the Forkhead domain [1,2]. This domain consists of approximately 110 amino acids and folds into three major α-helices (H1-H3), a short twisted three-stranded antiparallel β-sheet (comprising three β strands S1–S3) and two wing-like loops (W1 and W2), and their arrangement within the Forkhead domain is H1-S1-H2-H3-S2-W1-S3-W2 [3]. The third helix H3 is the main DNA recognition element that binds to the major groove roughly perpendicularly to the DNA axis and makes most of the base-specific contacts with the core sequence [3,4,5,6,7,8]. Furthermore, the DNA-binding surface also includes the loop region W1, the loop between helices H4 and H3 and the N-terminal segment preceding the helix H1. In comparison with other FOX subclasses, the Forkhead domains of FOXO proteins contain a 5-amino-acid insertion between α-helices H2 and H3 (residues KGDSN). All FOXO-DBDs recognize consensus sequences 5′-GTAAACAAtab-3′ and 5′-(C/A)(A/C)AAA(C/T)AA-3′ known as the DAF-16 family member-binding element (DBE) and the insulin responsive element (IRE), respectively, which include the core sequence 5′-(A/C)AA(C/T)A-3′ recognized by all Forkhead transcription factors [9,10,11,12]. However, the factors that contribute to DNA binding specificity to diverse DNA sequences adjacent to the core sequence among individual FOX members are still not fully understood [13,14]. All FOXO proteins bind to DNA duplexes as monomers similarly to other Forkhead proteins [3,4,5,6,7,8].
The “O” subclass of FOX family consists of four proteins (FOXO1/FKHR, FOXO3/FKHRL1, FOXO4/AFX and FOXO6), which regulate cellular homeostasis, longevity and response to stress by modulating diverse cellular functions, including cell cycle, stress resistance, DNA damage repair, apoptosis, tumor resistance and metabolism (reviewed in [15,16,17]). The transcriptional activity of FOXO proteins is negatively regulated by protein kinase B (PKB, also known as Akt), which phosphorylates three Ser/Thr residues and induces binding to the scaffolding protein 14-3-3. In turn, 14-3-3 protein binding sterically obscures both the nuclear localization sequence and the Forkhead domain of FOXO proteins, thereby shifting the equilibrium of FOXO localization toward the cytoplasm [18,19,20,21,22]. In addition to the Forkhead domain, FOXO proteins contain two other conserved regions (CR1 and CR3) located within long and presumably disordered segments bordering the Forkhead domain (Figure 1). CR1 is positioned at the N-terminus and contains the first PKB phosphorylation site, which is also a 14-3-3 protein-binding motif, whereas CR3 is located at the C-terminus and represents the transactivation domain [23]. The nuclear localization sequence partly overlaps with the C-terminal part of the Forkhead domain and contains the second PKB phosphorylation site/14-3-3-binding motif. The third PKB phosphorylation site, which is not the 14-3-3 binding motif, is located approximately 60 residues downstream of the second site.
FOXO proteins are further regulated through a number of additional posttranslational modifications, including phosphorylation, acetylation, ubiquitination, and methylation (reviewed in [24,25,26]). Sites of these modifications are localized within both the Forkhead domain and long flexible regions bordering the Forkhead domain, and their modifications affect the stability of FOXO proteins, binding to the target DNA, and interactions with other binding partners [18,19,27,28,29,30].
FOXO proteins were initially considered potent tumor suppressors due to their ability to induce cell cycle arrest and apoptosis; however, recent studies have shown that FOXO proteins can also promote tumor development and progression by maintaining cellular homeostasis and by inducing drug-resistance [31,32,33]. Moreover, the resistance to cytotoxic chemotherapeutics is linked to deregulated signaling not only through FOXO proteins but also FOXM1, which is a potent oncogene whose expression and activity are negatively regulated by FOXO3 [34,35]. FOXO3 and FOXM1 exert opposing functions in the regulation of cancer-related processes, and targeting the FOXO3-FOXM1 axis could be a viable strategy for the treatment of cancer. Therefore, blocking FOX transcriptional activities with specific inhibitors may help to prevent drug resistance in cancer therapy. Previous studies have shown that selective pharmacological inhibition of FOXO1 may have beneficial effects on diabetic hyperglycemia by reducing hepatic glucose production [36,37]. Several small-molecule compounds reported by Langlet et al. [37] were shown to specifically clear FOXO1 from glucose-6-phosphatase promoter. However, design and/or further optimization of specific FOXO inhibitors requires a detailed understanding of structural differences between individual FOXO-DBDs. Structures of both apo and DNA-bound forms of FOXO3-DBD and FOXO4-DBD and of the FOXO1-DBD:DNA complex have already been reported. In this study, we report a high-resolution solution structure of apo FOXO1-DBD, which allowed us to systematically compare all three major FOXO-DBDs in both their apo and DNA-bound forms. This comparison revealed that apo FOXO-DBDs differ in mutual positions of the helices H1, H2 and H3, that form the Forkhead domain core and in interactions between hydrophobic regions within the N-terminal segment, the H2-H3 loop, and the recognition helix H3. Moreover, FOXO proteins also show variations in conformational heterogeneity in the H4-H3 loop and in the N-terminal part of the helix H3.

2. Materials and Methods

2.1. FOXO1-DBD Expression and Purification

DNA encoding mouse FOXO1-DBD (residues 156−269) was ligated into the pGEX-6P-1 vector (GE Healthcare Bio-Sciences, Pittsburgh, PA, USA) using the BamHI and XhoI sites. 13C/15N- and 15N-labeled FOXO1-DBD was expressed as an N-terminal GST-tagged fusion protein in Escherichia coli BL21(DE3) cells grown in minimal medium containing 15N-ammonium sulfate and/or 13C-glucose as the sole nitrogen and carbon source. Protein expression was induced by 0.5 mM isopropyl β-d-1-thiogalactopyranoside for 18 h at 20 °C. Pelleted cells were resuspended in buffer 2× PBS, 10 mM dithiothreitol (DTT), 1 mM EDTA, and lysed by sonication at 4 °C. The protein was purified using Glutathione Sepharose 4 Fast Flow (GE Healthcare Bio-Sciences, Pittsburgh, PA, USA) in buffer containing 20 mM Tris-HCl, 0.5 M NaCl, 10 mM DTT, 1 mM EDTA, 10% (w/v) glycerol at pH 7.5. The fusion protein was eluted at room temperature using 10 mM glutathione and dialyzed against buffer containing 20 mM Tris-HCl, 100 mM NaCl, 1 mM EDTA, 1 mM DTT, 10% (w/v) glycerol at pH 8.0. The affinity tag was removed by PreScission Protease cleavage overnight at 4 °C (10 U/mg recombinant fusion protein). After cleavage, FOXO1-DBD was purified by size-exclusion chromatography (HiLoad Superdex 75; GE Healthcare) in 20 mM phosphate buffer containing 50 mM KCl, 1 mM TCEP, 1 mM EDTA and 10% (w/v) glycerol at pH 6.5.

2.2. NMR Spectroscopy

NMR spectra were acquired at 25 °C on Bruker Avance III™ HD 600 MHz and 850 MHz spectrometers, both equipped with a 1H/13C/15N cryoprobe. The 350-μL sample of 380 μM 13C/15N-labeled FOXO1-DBD in buffer containing 20 mM sodium phosphate at pH 6.5, 50 mM KCl, 1 mM TCEP, 1 mM EDTA and 10% D2O/90% H2O was used for the sequence-specific backbone resonance assignment. The protein spectra were affected by C-terminal degradation, which was manifested as peak doubling and signal intensity reduction over time. Protein fitness was assessed by regular acquisition of 2D 1H-15N HSQC spectra. In total, protein samples from three independent purifications were used for NMR data collection. The spectra were processed using Bruker Topspin 3.5 and were analyzed in NMRFAM-SPARKY [38]. Sequence-specific backbone and side-chain resonance assignment was obtained using a series of standard triple-resonance spectra (HNCO, HN(CA)CO, HNCACB, CBCA(CO)NH, HBHA(CO)NH, CCC(CO)HN and HCCH-TOCSY, experiments) [39,40]. In particular, 104 of the 114 (91%) backbone amide signals in the 2D 1H-15N HSQC spectrum of FOXO1-DBD were assigned (Supplementary Figure S1). A set of 1H-1H distance constraints required for structural determination was obtained from intensities of NOE cross peaks in the 3D 15N/1H NOESY-HSQC and 13C/1H NOESY-HMQC spectra, both acquired with τm = 120 ms. This yielded unique assignments for 95.8% (3006/3139) of the NOE peaks, providing 1712 non-redundant 1H-1H distance constraints.

2.3. NMR Structure Calculation

FOXO1-DBD structural calculation was performed in Cyana 3.98 using the combined automated NOE assignment and structure determination protocol (Candid) [41] followed by five cycles of simulated annealing combined with redundant dihedral angle constraints (Redac) [42]. The NOESY data were complemented by the backbone torsion angle constraints obtained from the NMR resonance assignments using TALOS+ [43] as an input. The resulting set of FOXO1-DBD converged structures with no NOE-derived distance constraints and van der Waals violations greater than 0.5 Å or dihedral angle constraint violation greater than 5° were refined in explicit water using YASARA [44]. The 30 FOXO1-DBD structures with the lowest total energy were selected, analyzed and validated using the Protein Structure Validation Software suite (http://psvs-1_5-dev.nesg.org). The constraints and structural quality statistics for the final water-refined set of FOXO1-DBD structures are summarized in Table 1. The structures, NMR resonance assignments and constraints used in structural calculation were deposited in the Protein Data Bank (PDB code: 6QVW) and Biological Magnetic Resonance Bank (BMRB code: 34364).

3. Results and Discussion

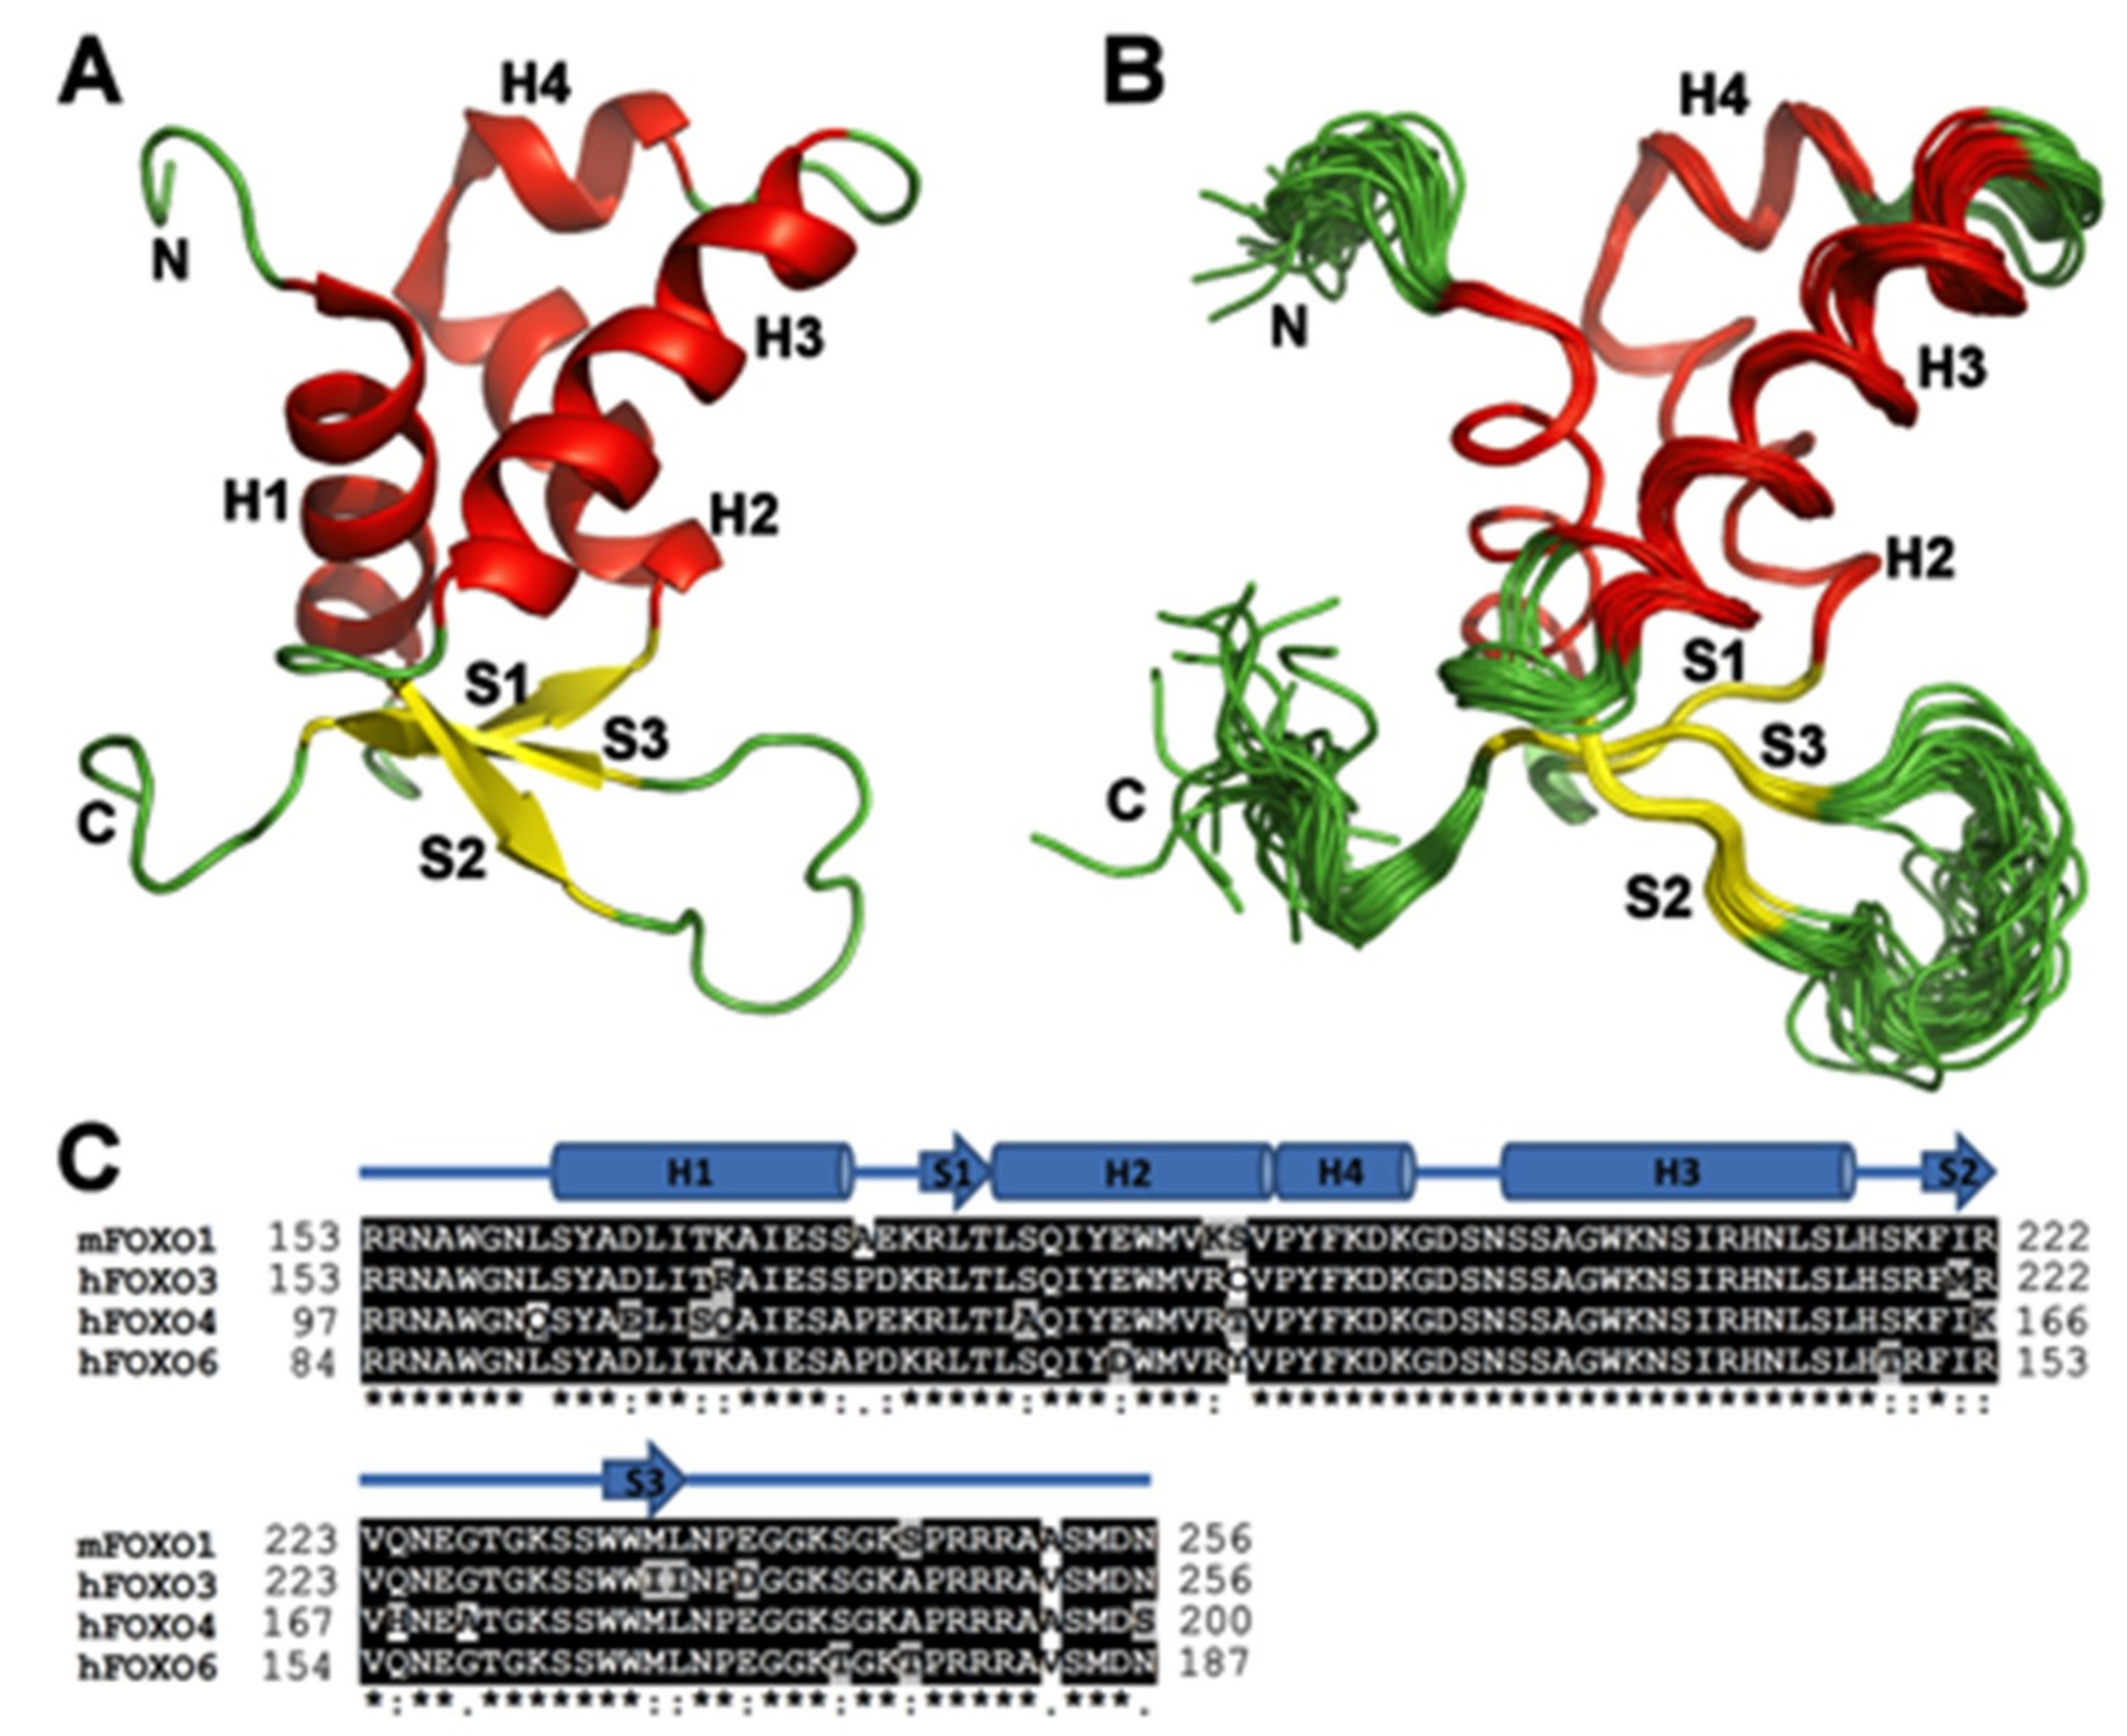
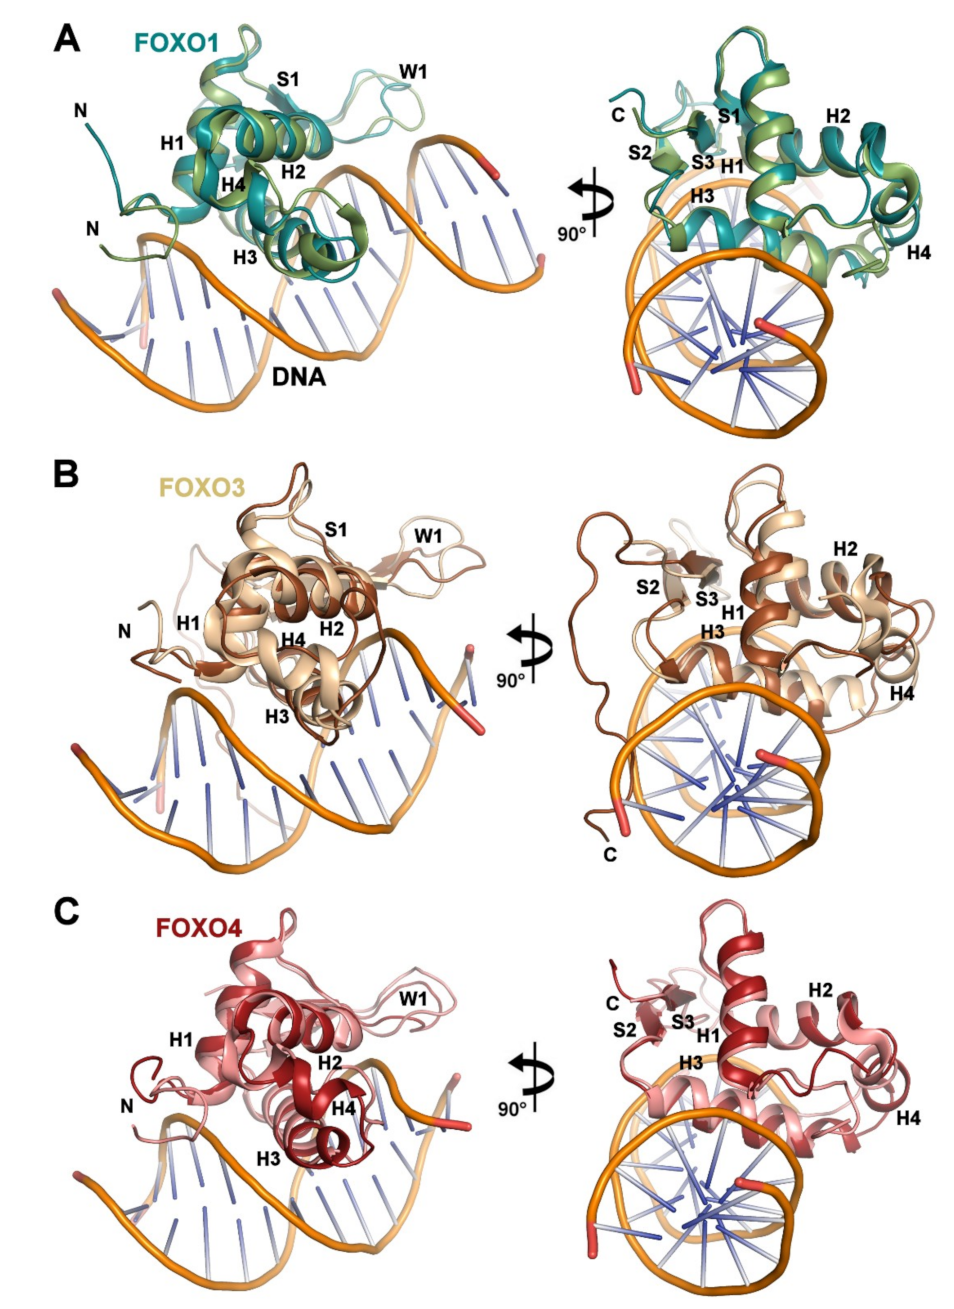
3.1. Solution Structure of the DNA-binding Domain of FOXO1

For detailed understanding of structural differences between individual FOXO DNA-binding domains, we determined the solution structure of the apo FOXO1-DBD. FOXO1-DBD adopts the expected Forkhead winged-helix fold (Figure 2A,B), and similar to FOXO3-DBD and FOXO4-DBD structures, the region between helices H2 and H3 of FOXO1-DBD contains an additional short helix, H4, which partly overlaps with the N-terminal end of the 5-amino-acid insertion [45,46]. A well-defined structure with an average root mean square deviation (R.M.S.D.) for Cα atoms less than 1.0 Å was obtained for residues of the α-helices H1, H2 and H4, β-strand S1, C-terminal half of α-helix H3, and β-strands S2 and S3 (Figure 2B). Conversely, higher conformational heterogeneity, which reflects smaller numbers of experimentally derived restrains, presumably due to increased dynamics, was observed in the N-terminal segment, N-terminal half of the α-helix H3, loop between H3 and S2 and both loops W1 and W2, which is in the regions involved in DNA binding [6,7,8].

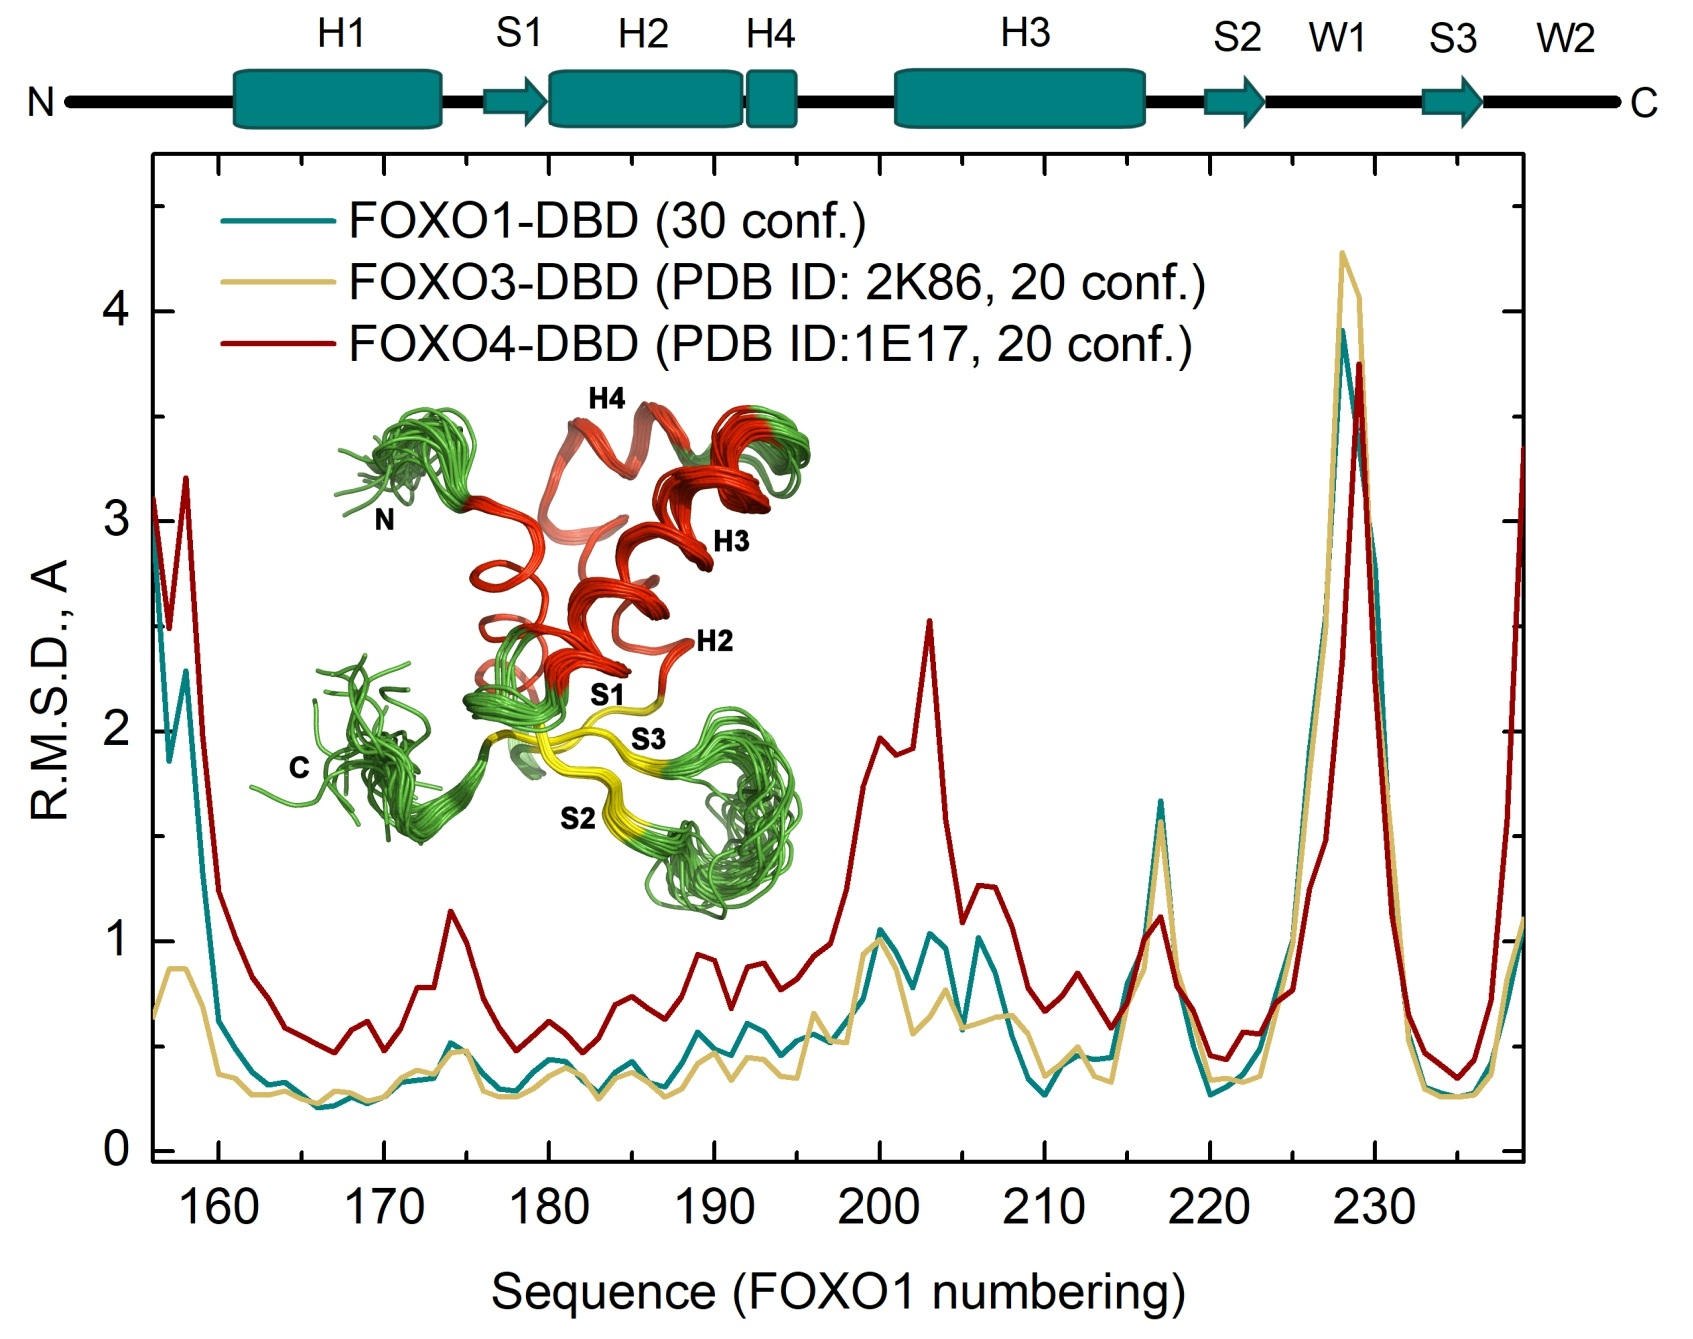
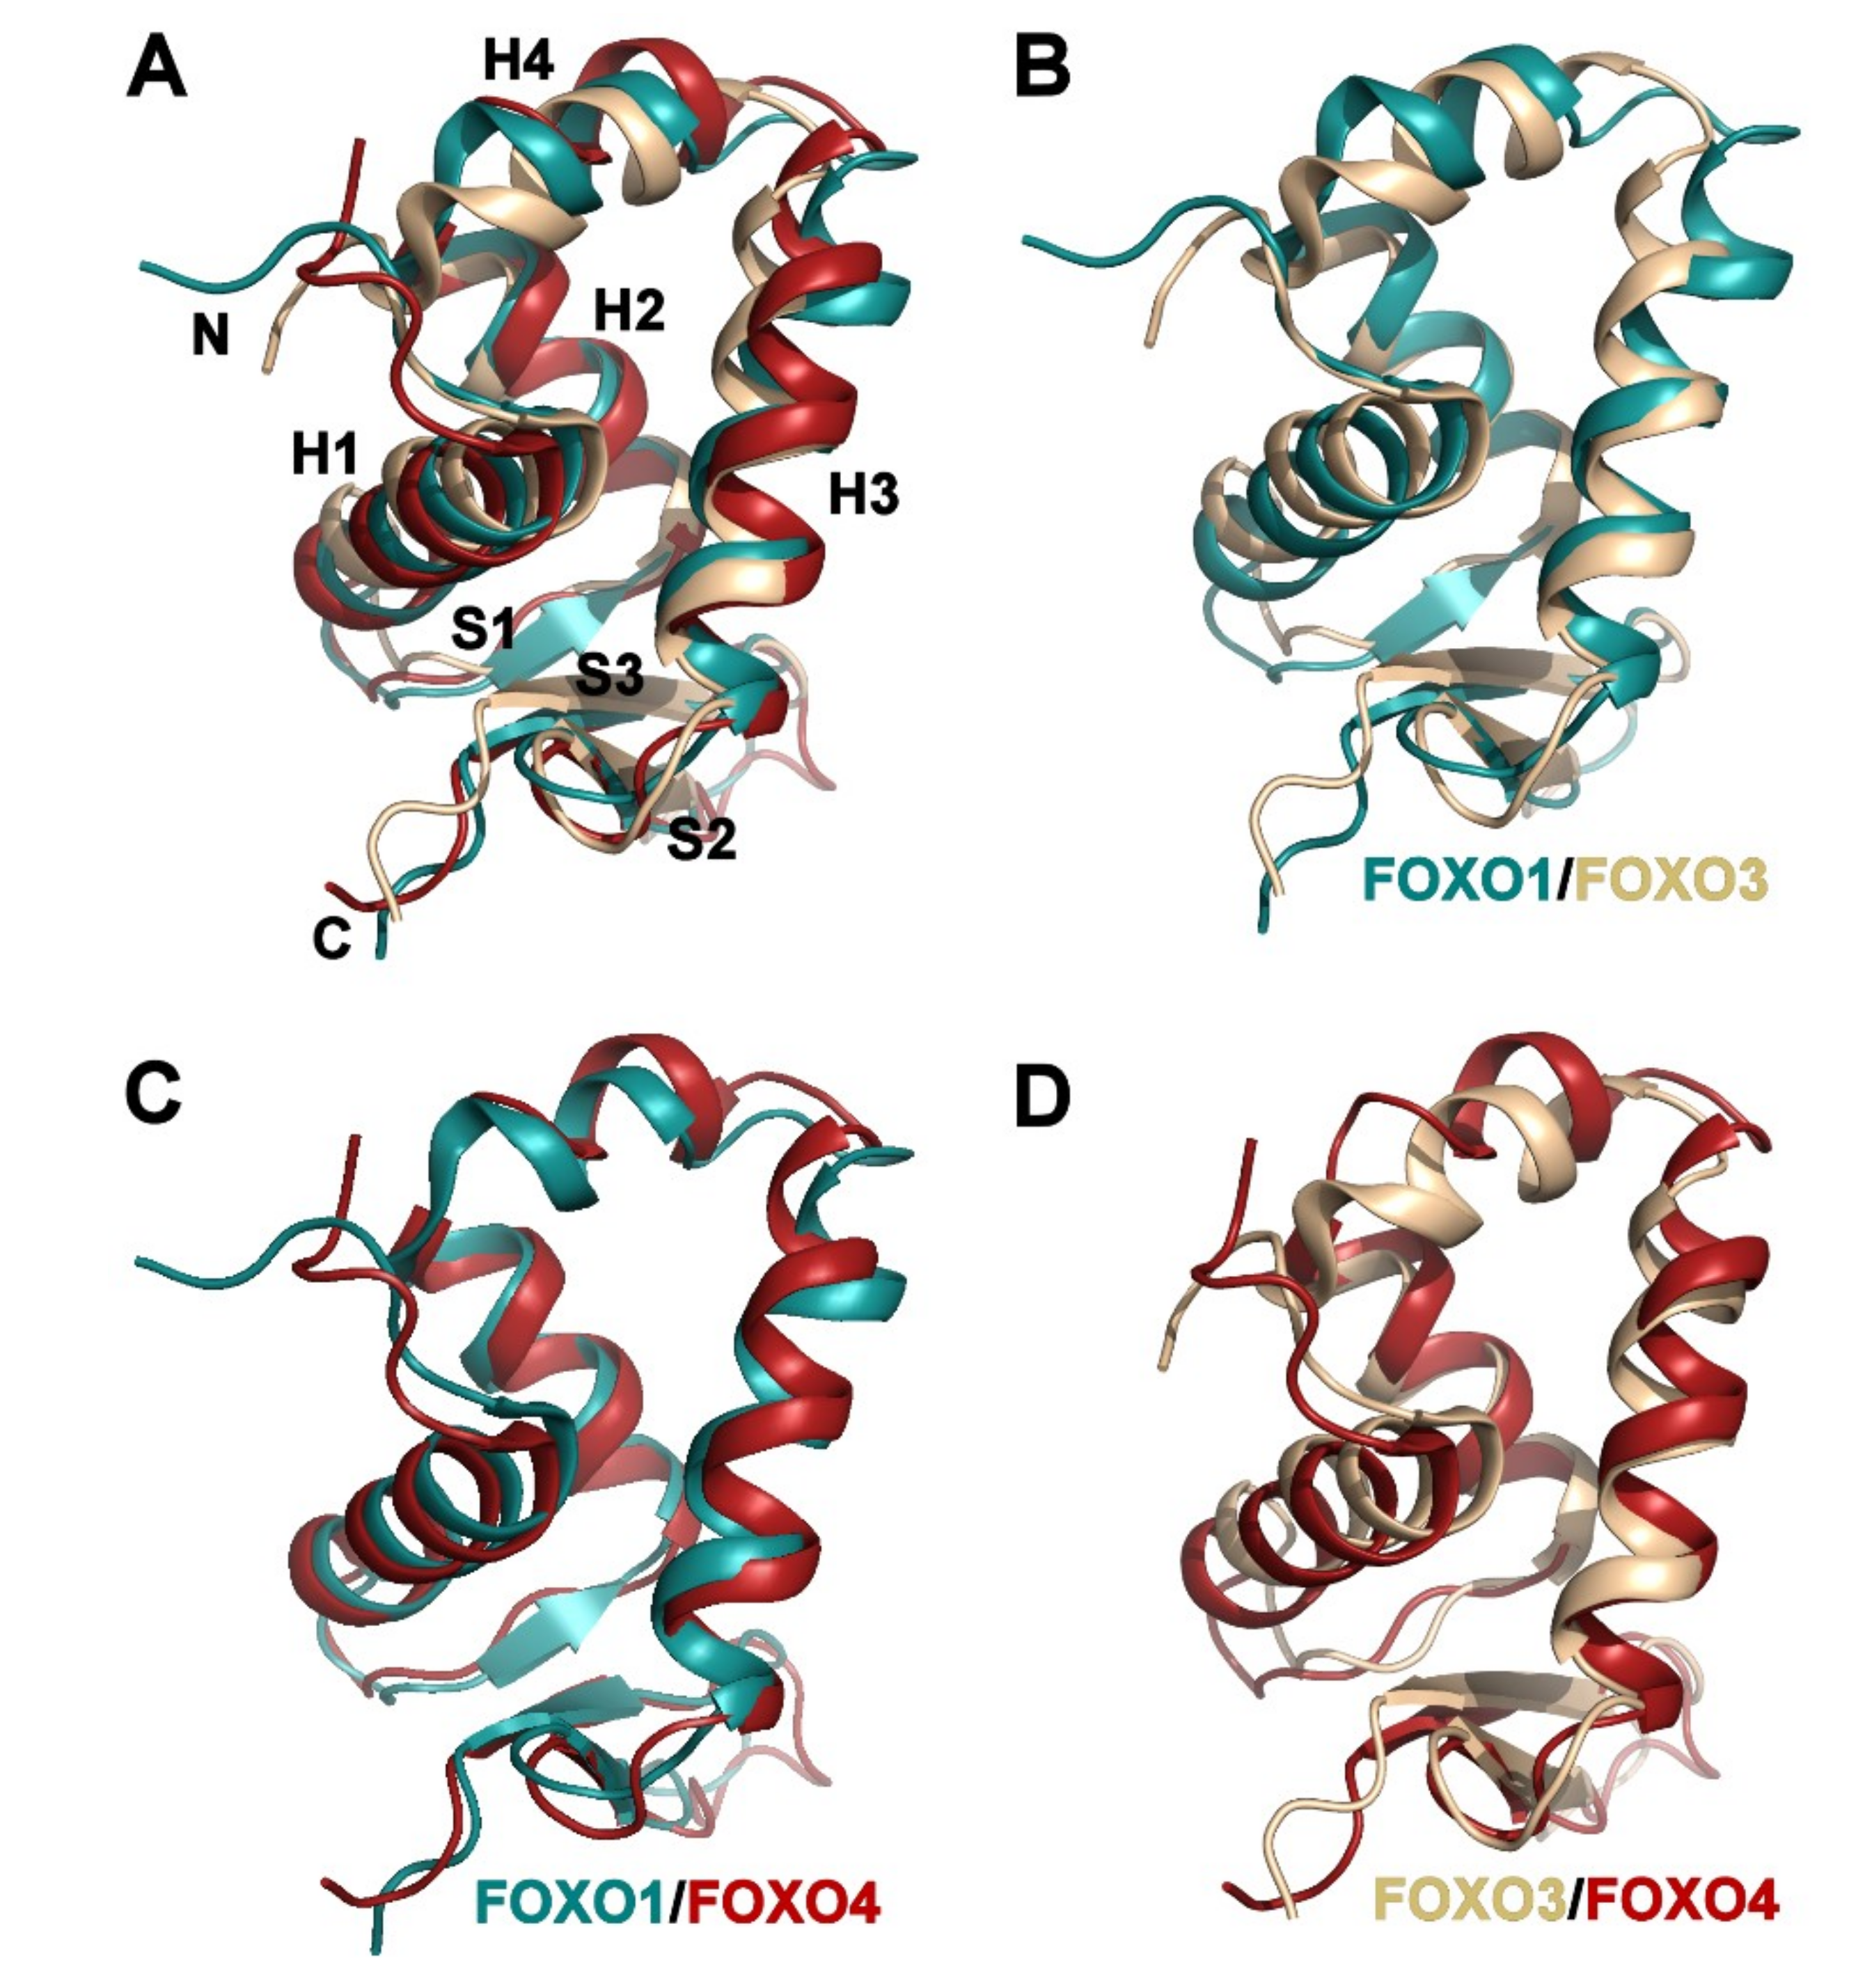
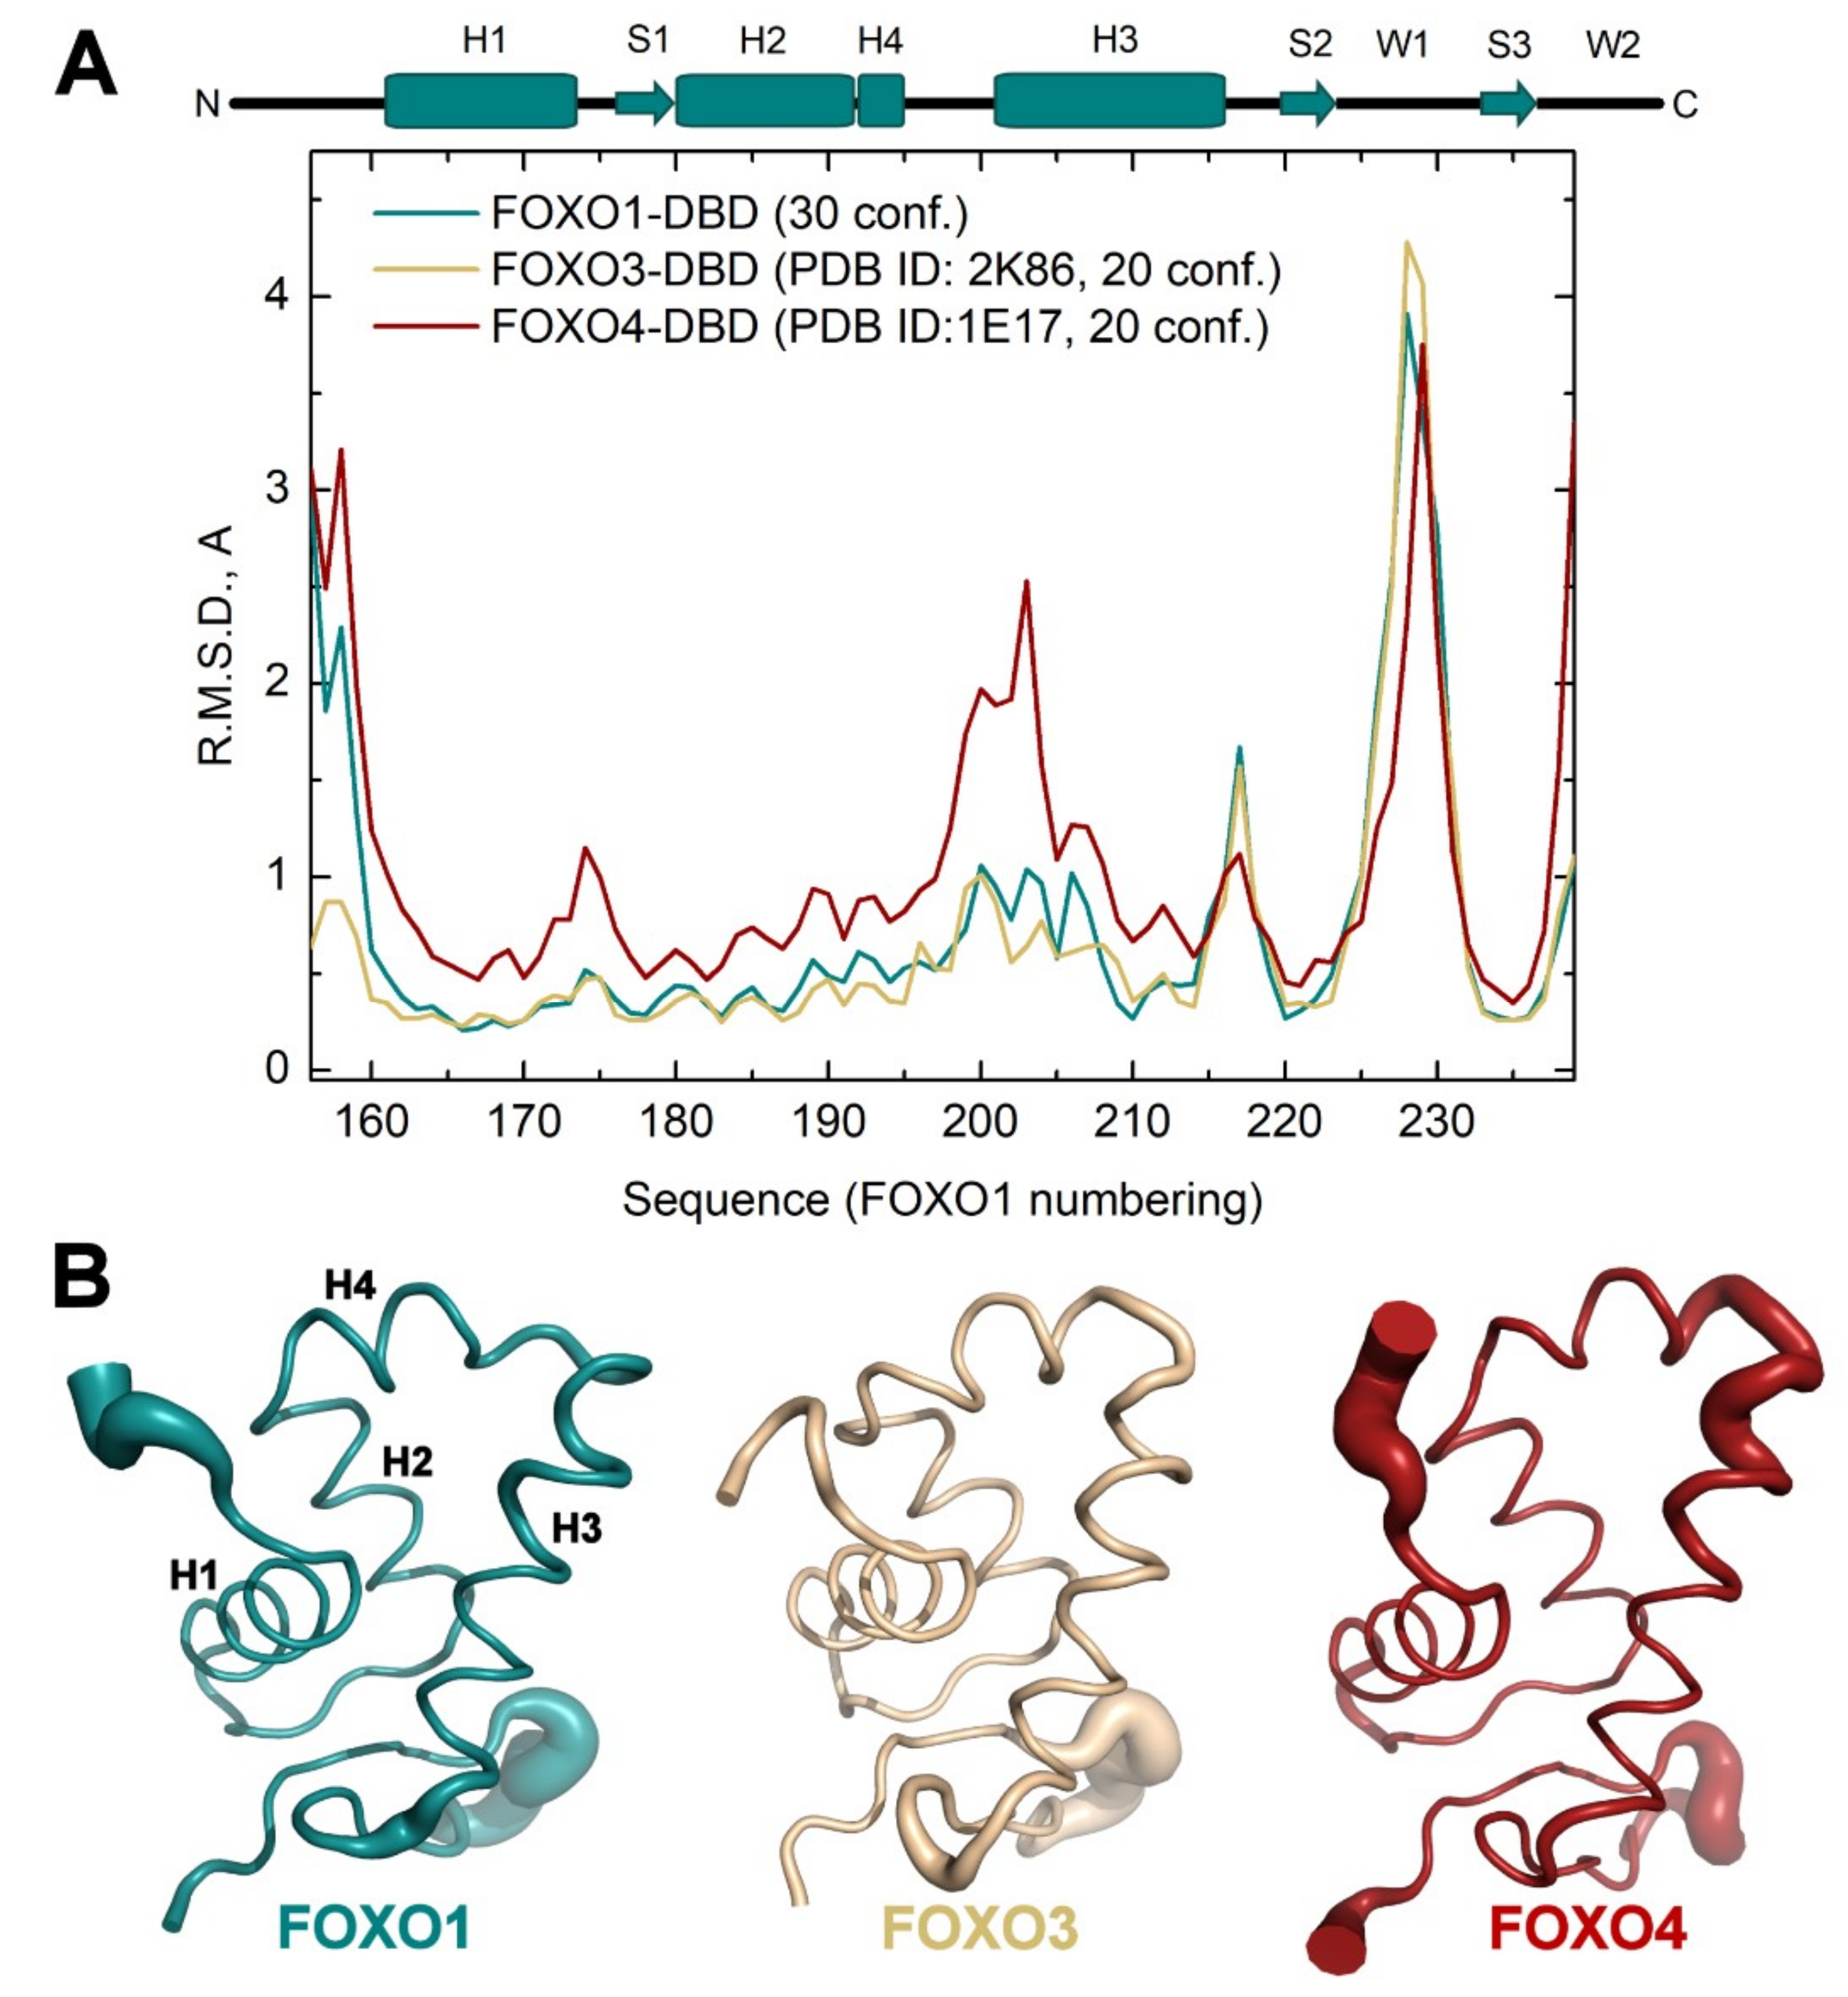
3.2. Comparison of FOXO1-DBD with Forkhead Domains of Other FOXO Proteins

Because the previously reported solution structures of apo FOXO3-DBD (PDB ID: 2K86 [46]) and apo FOXO4-DBD (PDB ID: 1E17 [45]) were solved with constructs of different lengths, apo FOXO-DBDs were structurally compared using residues 156-239 (mouse FOXO1 numbering) present in all three structures. The superimposition of representative conformers (representatives of the most populated clusters assessed by cluster analysis of conformational ensembles of NMR solution structures [47]) revealed that the apo FOXO1-DBD can be superimposed with the solution structures of apo FOXO3-DBD and FOXO4-DBD with root-mean-square deviations (R.M.S.D.) of 2.05 and 2.12 Å, respectively, over 84 Cα atoms (Supplementary Table S1). FOXO3-DBD and FOXO4-DBD can be superimposed with the R.M.S.D. of 2.50 Å over 84 Cα atoms. The most significant differences are observed in the loop between helices H2 and H3, which contains the additional helix H4, and the N-terminal half of helix H3, whose orientation differs among all three FOXO-DBDs (Figure 3 and Figure S2). Structural superimposition and difference residue-residue distance maps calculated for selected conformers also suggest that the mutual positions of the α-helices H1, H2 and H3, whose interface form the hydrophobic core of the domain, apparently differ among apo-FOXO-DBDs. To describe these differences, three isoleucine residues located approximately in the middle of all three helices in regions with high backbone coordinate precision were selected (I166, I183 and I210 in the case of FOXO1), and the distances of their Cα atoms were compared (Figure S3). The results suggested that FOXO1-DBD is more compact (has shorter H2-H3 and H1-H2 distances) than the other two FOXO proteins, whereas FOXO4-DBD appears to be less compact, based on the sum of Cα-Cα distances between selected Ile residues. The differences in FOXO-DBDs core packing were further corroborated by calculating the contact area of residues from helices H1, H2 and H3 using the program AREAIMOL [48]. These calculations revealed the contact area of 893 Å2, 900 Å2 and 929 Å2 for FOXO1-, FOXO3- and FOXO4-DBD, respectively. In addition, all three apo forms also show different interactions between hydrophobic residues located on the interface between the N-terminal segment (Trp157 and Tyr162 in FOXO1), the H2–H3 loop (Tyr193 and Phe194), and the helix H3 (Trp206) (Figure 4). This cluster of hydrophobic residues forms part of the DNA-binding surface that makes contacts with the DNA backbone (Figure 4D). Furthermore, interactions in this region fine-tune the Forkhead domain DNA-binding specificity and affinity, most likely by affecting the position of the recognition helix H3 with respect to the helices H1 and H2, as shown for hepatocyte nuclear factor 3 (HNF-3, also known as FOXA), FOXC1 (FREAC3) and FOXD1 (FREAC4) proteins [13,49]. In the FOXO1-DBD structure, the side-chains of Tyr193, Phe194 and Trp206 interact in a face-to-edge fashion. In contrast, in FOXO3-DBD, the side-chain of Trp206 is rotated towards the side-chain of Tyr162 from the N-terminus of the helix H1 and makes a hydrogen bond with the hydroxyl group of Tyr193 from the helix H4. Interactions in FOXO4-DBD resemble those observed in FOXO1-DBD, but the side-chains of Phe138 and Trp150 interact in a face-to-face manner.
The comparison between the conformational flexibility of NMR solution structure ensembles using the MOBI server [50] revealed that FOXO1-DBD and FOXO3-DBD are comparable in this regard and show high flexibility (R.M.S.D. difference from average for Cα atoms > 1 Å) only within the H3-S2 and S2-S3 loops (Figure 5). Conversely, FOXO4-DBD exhibits a substantially increased conformational heterogeneity also in the H1-S1 loop and, especially, within the H4-H3 loop and N-terminal part of the helix H3.
Thus, the comparison of solution structures of apo FOXO-DBDs reveals differences both in their conformation and local flexibility. These differences presumably reflect variations in FOXO-DBD protein sequences, which are present, for example, within the α-helix H1 and C-termini of the helix H2 and β-strand S3 (Figure 2C and Figure S4). Accordingly, these differences may account for the distinct functions of FOXO proteins. For example, FOXO3- and FOXO4-DBDs have been shown to interact with the DNA-binding domain of transcription factor p53 [46,51]. Because the N-terminal segment of FOXO-DBD including aromatic residues W101 and Y106 (in FOXO4 numbering) is involved in this interaction, it is entirely possible that FOXO variants interact with p53 with different affinities due to the structural differences within the N-terminal parts of their DBDs. Moreover, the observed structural differences also suggest that FOXO-DBDs, although highly homologous, may differ in their DNA-binding affinities for different sequences.

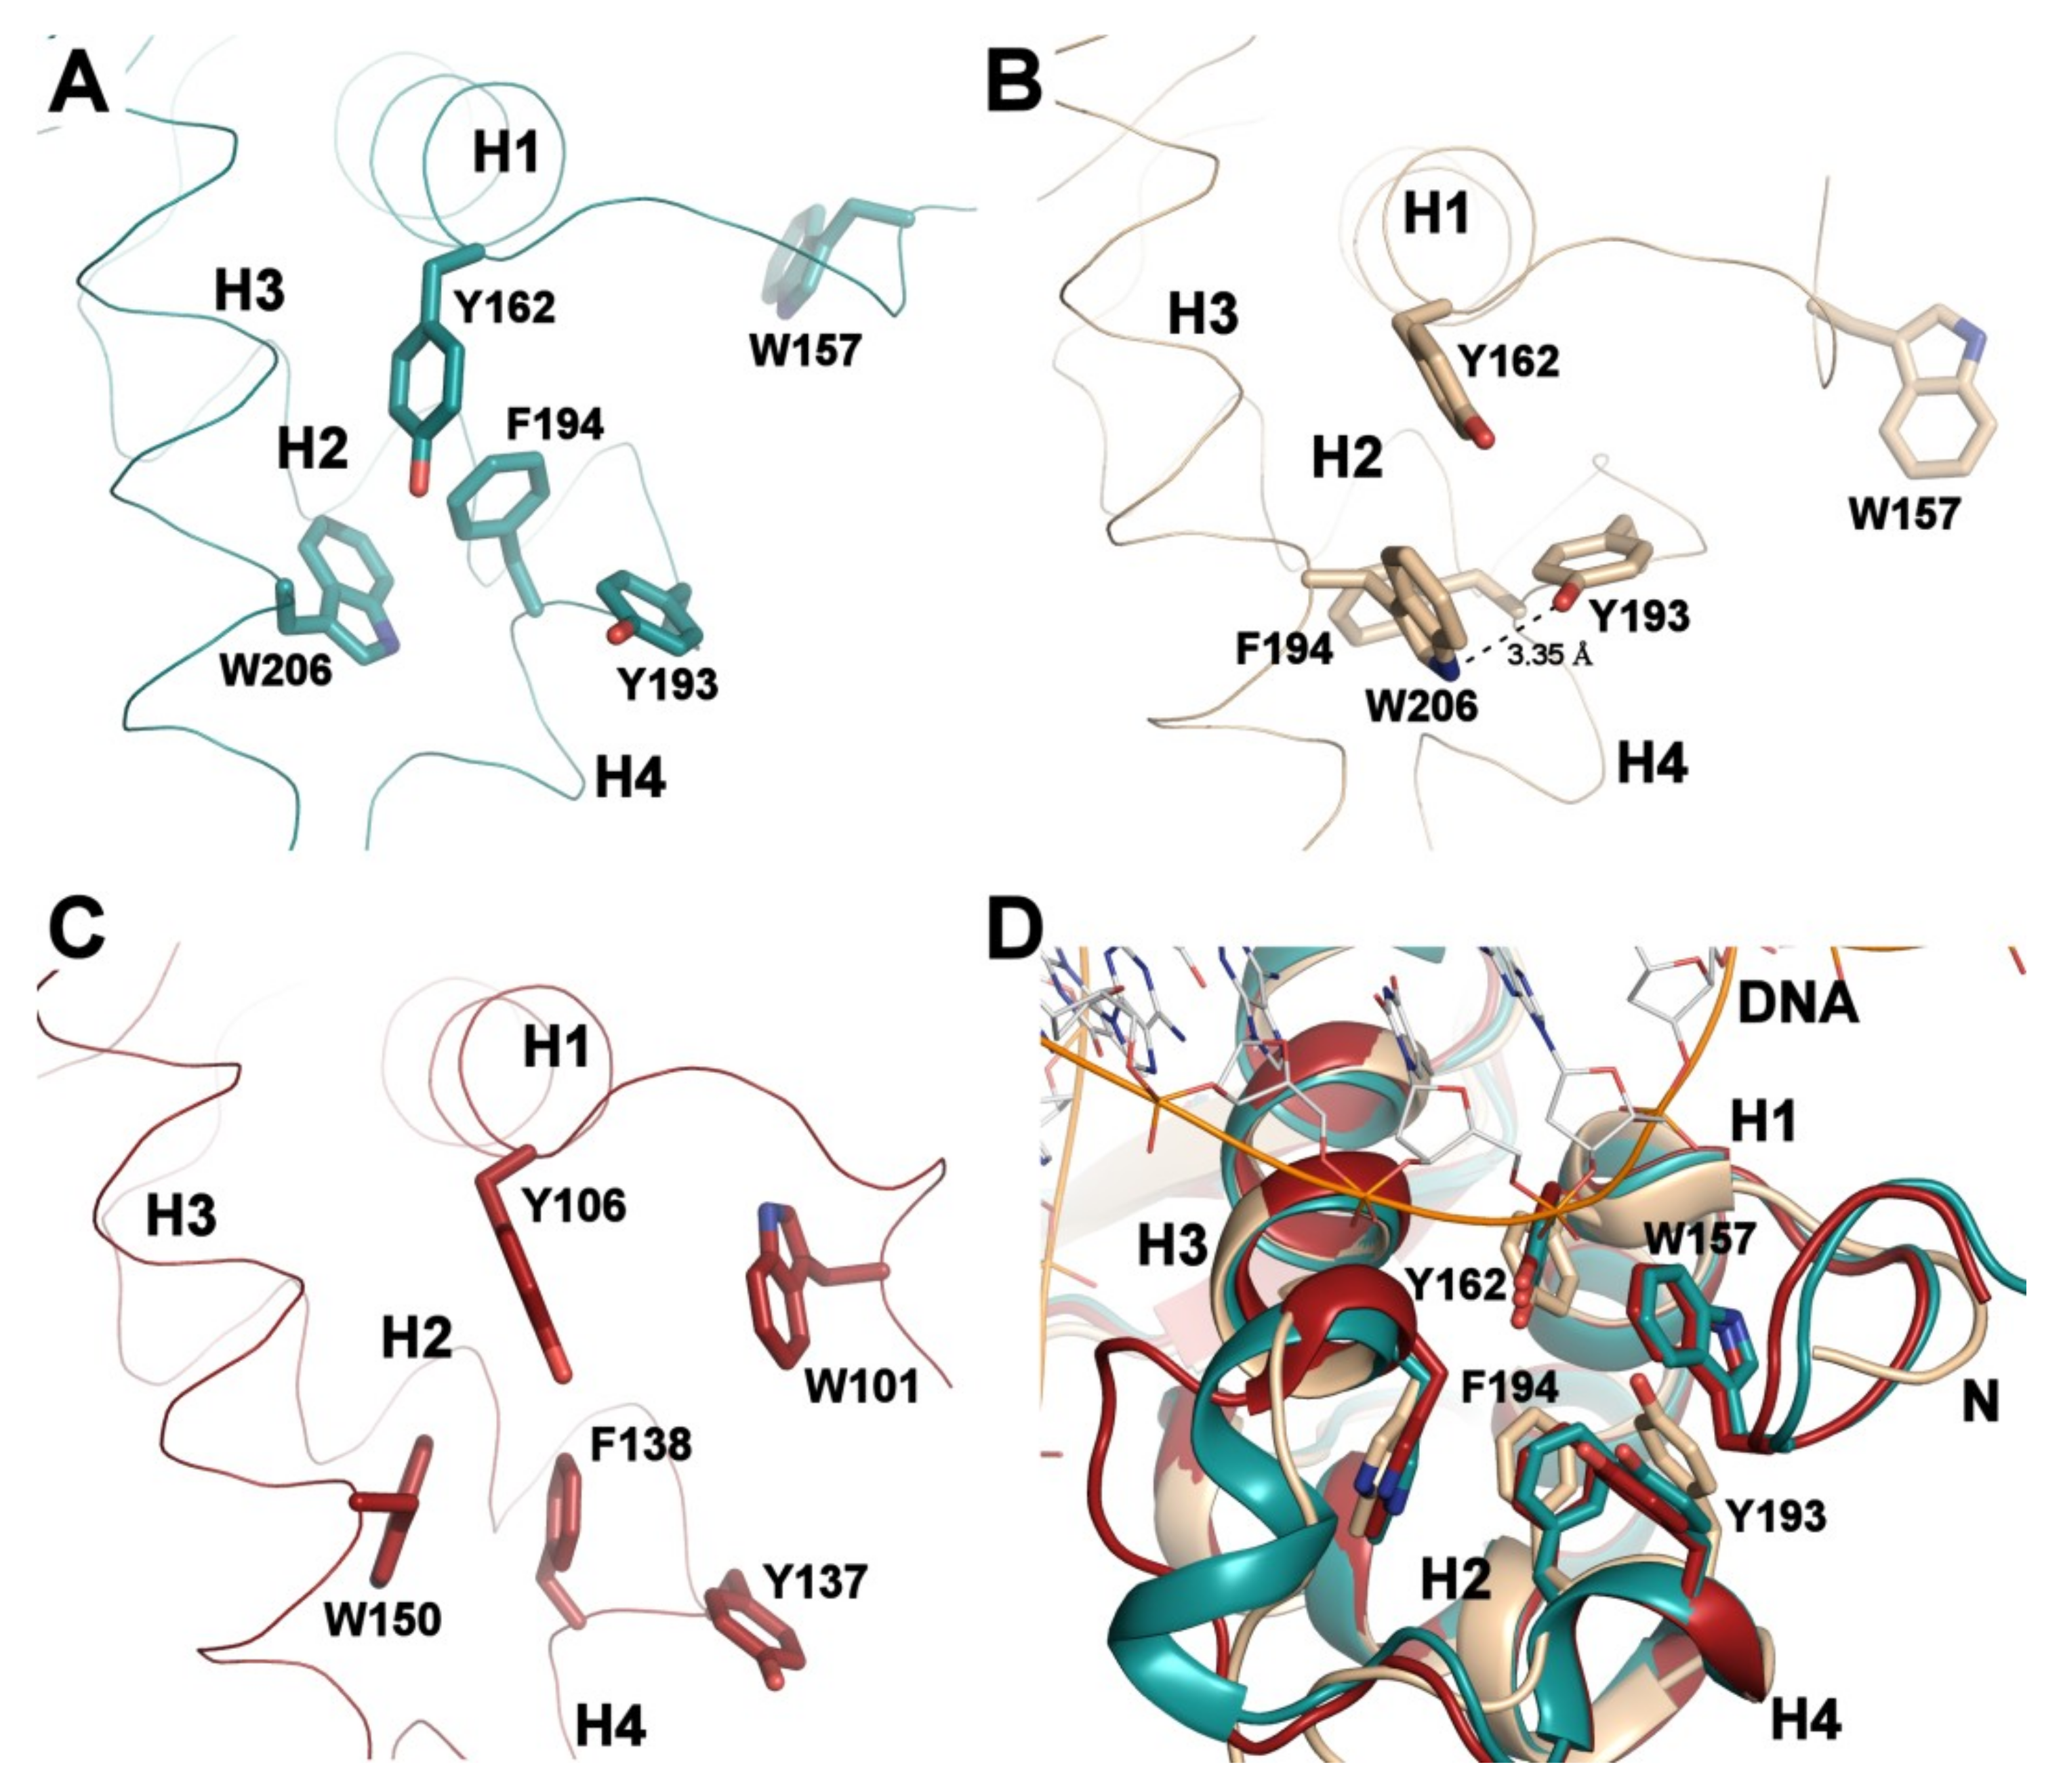
3.3. Structural Differences Between Apo and DNA-bound Forms of FOXO1-DBD

The structure of apo FOXO1-DBD can be superimposed with the crystal structure of the FOXO1-DBD:DNA complex (PDB ID: 3COA [7]) with an R.M.S.D. of 2.36 Å over 83 Cα atoms. Substantial differences are observed in the N-terminal segment, N-terminal part of the recognition helix H3, which is in the DNA-bound form shifted by 2 Å towards the N-terminal segment, loop between β-strands S2 and S3 (called wing W1), loop between H3 and S2, and loop between α-helices H2 and H3, that is, mainly in regions involved in DNA binding because the DNA-binding surface is formed by the helix H3, S2-S3 loop (wing W1) and N-terminal segment (Figure 6 and Figure S5) [7]. The positions of the α-helices H1 and H2 and β-strands S1-S3 remain virtually unchanged. Similar DNA-binding-induced conformational changes were observed in FOXO3-DBD and FOXO4-DBD [7,8]. The superimposition of apo and DNA-bound forms of FOXO3-DBD (2.72 Å over 81 Cα atoms) revealed additional changes in the position of the α-helix H1, whose C-terminal end is in the DNA-bound form, in comparison with the apo structure, which is shifted by 1.6 Å towards the β-strand S3 (Figure 6B) [6,46]. In addition, the C-terminus of H2, the H2–H3 loop and the N-terminus of H3 have substantially different conformations in both structures, but this is, at least partly, caused by crystal contacts because the H2–H3 loop of the FOXO3-DBD:DNA complex interacts with the DNA backbone of the symmetry-related copy of the complex. In FOXO4-DBD, the apo and the DNA-bound forms can be superimposed with an R.M.S.D. of 2.48 Å over 85 Cα atoms, and DNA binding has no effect on the positions of the three major helices H1, H2 and H3 (Figure 6C) [8,45]. Nevertheless, the recognition helix H3 of the FOXO4-DBD:DNA complex is compared to the apo structure shortened at the N-terminus by approximately one turn and thus similarly to the FOXO3-DBD:DNA structure. Although the interactions between hydrophobic residues at the interface of the N-terminal segment, H2-H3 loop, and helix H3 differ among apo FOXO-DBDs (Figure 4), the DNA-bound forms have similar arrangements of these residues (Figure 4D). This suggests that individual FOXO-DBDs undergo different conformational transitions upon their binding to the target DNA. This transition has been previously suggested by detailed analysis of interaction between FOXO4-DBD and DNA, which revealed that FOXO4-DBD binding to DNA involves a profound reduction of segmental dynamics of DBD upon complex formation [52].

4. Conclusions

FOX proteins are found in all eukaryotic species where they play a central role in cellular proliferation, differentiation, tumorigenesis and longevity (reviewed in [53,54]). The FOX family comprises more than 100 members classified into 17 subclasses designated A–Q. The members of the FOXO subclass (FOXO1, FOXO3, FOXO4 and FOXO6) are involved in a wide range of key biological processes including apoptosis, cell cycle, stress resistance, tumor resistance, differentiation, and metabolism (reviewed in [15,16,17]). Whereas FOXO1, FOXO3 and FOXO4 are widely expressed, FOXO6 is expressed mainly in neural tissues and developing brain [55]. Previous studies have shown that FOXO1 regulates the transcription of numerous genes involved in anti-oxidative stress, cell cycle arrest, apoptosis, autophagy, and metabolic regulation under both physiological and pathophysiological conditions [56,57]. Several studies have also shown that FOXO1 is a key regulator of hepatic glucose production and lipid metabolism because the liver-specific deletion of FOXO1 increases insulin sensitivity, fasting hypoglycemia and lipogenesis, whereas constitutively active FOXO1 blocks the insulin-mediated reduction of hepatic glucose production [58,59,60,61]. Therefore, FOXO1 is considered as a promising therapeutic target for diabetic hyperglycemia. In addition, FOXO proteins (FOXO1, FOXO3 and FOXO4) are putative targets for prevention cancer therapy-related drug resistance. However, the development of specific FOXO inhibitors requires a detailed understanding of structural differences between individual FOXO-DBDs. The high-resolution structure of FOXO1-DBD and its comparison with structures of other FOXO proteins revealed differences in both their conformation and flexibility that may account for the distinct functions of FOXO proteins. In addition, the availability of the resonance assignment for DBD of all three major FOXO types will enable us to use solution NMR spectroscopy to easily screen and characterize FOXO-small molecule ligand complexes at the atomic level and to study the selectivity of prepared compounds for various FOXO proteins.

Supplementary Materials

The following are available online at https://www.mdpi.com/2073-4409/8/9/966/s1, Figure S1: 1H-15N HSQC spectrum of 15N-labeled mouse FOXO1-DBD (residues 156-269), Figure S2: Difference residue-residue (RR) distance maps, Figure S3: Comparison of mutual positions of the α-helices H1, H2 and H3, Figure S4: Position of non-conserved residues in FOXO-DBD sequences, Figure S5: Comparison of apo FOXO1-DBD with the structure of the FOXO1-DBD:DNA complex, Table S1: Root-mean-square deviations (R.M.S.D.) for the superimposition of apo FOXO-DBD structures.

Author Contributions

K.P. and K.K. prepared protein samples for NMR measurements; K.P., K.K. and V.V. performed NMR measurements, data analysis and interpretation; V.O., M.J.A. and T.O. designed the research and wrote the manuscript. All authors discussed the results and commented on the manuscript. V.V., V.O. and T.O. supervised the research.

Funding

This research was funded by the Czech Science Foundation (Project 17-33854L), the Czech Academy of Sciences (Research Projects RVO: 67985823 of the Institute of Physiology of the Czech Academy of Sciences) and partly by the European Regional Development Fund; OP RDE; Project: ChemBioDrug (No. CZ.02.1.01/0.0/0.0/16_019/0000729).

Acknowledgments

We thank Carlos V. Melo for proofreading the article.

Conflicts of Interest

The authors declare no conflict of interest.

References

  1. Weigel, D.; Jackle, H. The Fork Head Domain—A Novel DNA-Binding Motif of Eukaryotic Transcription Factors. Cell 1990, 63, 455–456. [Google Scholar] [CrossRef]
  2. Kaestner, K.H.; Knochel, W.; Martinez, D.E. Unified nomenclature for the winged helix/forkhead transcription factors. Genes Dev. 2000, 14, 142–146. [Google Scholar] [PubMed]
  3. Clark, K.L.; Halay, E.D.; Lai, E.; Burley, S.K. Co-crystal structure of the HNF-3/fork head DNA-recognition motif resembles histone H5. Nature 1993, 364, 412–420. [Google Scholar] [CrossRef] [PubMed]
  4. Tsai, K.L.; Huang, C.Y.; Chang, C.H.; Sun, Y.J.; Chuang, W.J.; Hsiao, C.D. Crystal structure of the human FOXK1a-DNA complex and its implications on the diverse binding specificity of winged helix/forkhead proteins. J. Biol. Chem. 2006, 281, 17400–17409. [Google Scholar] [CrossRef]
  5. Stroud, J.C.; Wu, Y.; Bates, D.L.; Han, A.; Nowick, K.; Paabo, S.; Tong, H.; Chen, L. Structure of the forkhead domain of FOXP2 bound to DNA. Structure 2006, 14, 159–166. [Google Scholar] [CrossRef] [PubMed]
  6. Tsai, K.L.; Sun, Y.J.; Huang, C.Y.; Yang, J.Y.; Hung, M.C.; Hsiao, C.D. Crystal structure of the human FOXO3a-DBD/DNA complex suggests the effects of post-translational modification. Nucleic Acids Res. 2007, 35, 6984–6994. [Google Scholar] [CrossRef] [PubMed]
  7. Brent, M.M.; Anand, R.; Marmorstein, R. Structural basis for DNA recognition by FoxO1 and its regulation by posttranslational modification. Structure 2008, 16, 1407–1416. [Google Scholar] [CrossRef]
  8. Boura, E.; Rezabkova, L.; Brynda, J.; Obsilova, V.; Obsil, T. Structure of the human FOXO4-DBD-DNA complex at 1.9 A resolution reveals new details of FOXO binding to the DNA. Acta Crystallogr. D Biol. Crystallogr. 2010, 66, 1351–1357. [Google Scholar] [CrossRef] [PubMed]
  9. Furuyama, T.; Nakazawa, T.; Nakano, I.; Mori, N. Identification of the differential distribution patterns of mRNAs and consensus binding sequences for mouse DAF-16 homologues. Biochem. J. 2000, 349, 629–634. [Google Scholar] [CrossRef]
  10. Biggs, W.H., 3rd; Cavenee, W.K.; Arden, K.C. Identification and characterization of members of the FKHR (FOX O) subclass of winged-helix transcription factors in the mouse. Mamm. Genome. 2001, 12, 416–425. [Google Scholar] [CrossRef]
  11. O’Brien, R.M.; Granner, D.K. Regulation of gene expression by insulin. Physiol. Rev. 1996, 76, 1109–1161. [Google Scholar] [CrossRef]
  12. Streeper, R.S.; Svitek, C.A.; Chapman, S.; Greenbaum, L.E.; Taub, R.; O’Brien, R.M. A multicomponent insulin response sequence mediates a strong repression of mouse glucose-6-phosphatase gene transcription by insulin. J. Biol. Chem. 1997, 272, 11698–11701. [Google Scholar] [CrossRef]
  13. Overdier, D.G.; Porcella, A.; Costa, R.H. The DNA-binding specificity of the hepatocyte nuclear factor 3/forkhead domain is influenced by amino-acid residues adjacent to the recognition helix. Mol. Cell Biol. 1994, 14, 2755–2766. [Google Scholar] [CrossRef]
  14. Kaufmann, E.; Muller, D.; Knochel, W. DNA recognition site analysis of Xenopus winged helix proteins. J. Mol. Biol. 1995, 248, 239–254. [Google Scholar] [CrossRef]
  15. Hornsveld, M.; Dansen, T.B.; Derksen, P.W.; Burgering, B.M.T. Re-evaluating the role of FOXOs in cancer. Semin Cancer Biol. 2018, 50, 90–100. [Google Scholar] [CrossRef]
  16. Ma, J.; Matkar, S.; He, X.; Hua, X. FOXO family in regulating cancer and metabolism. Semin Cancer Biol. 2018, 50, 32–41. [Google Scholar] [CrossRef]
  17. Tia, N.; Singh, A.K.; Pandey, P.; Azad, C.S.; Chaudhary, P.; Gambhir, I.S. Role of Forkhead Box O (FOXO) transcription factor in aging and diseases. Gene 2018, 648, 97–105. [Google Scholar] [CrossRef]
  18. Brunet, A.; Bonni, A.; Zigmond, M.J.; Lin, M.Z.; Juo, P.; Hu, L.S.; Anderson, M.J.; Arden, K.C.; Blenis, J.; Greenberg, M.E. Akt promotes cell survival by phosphorylating and inhibiting a Forkhead transcription factor. Cell 1999, 96, 857–868. [Google Scholar] [CrossRef]
  19. Kops, G.J.; de Ruiter, N.D.; De Vries-Smits, A.M.; Powell, D.R.; Bos, J.L.; Burgering, B.M. Direct control of the Forkhead transcription factor AFX by protein kinase B. Nature 1999, 398, 630–634. [Google Scholar] [CrossRef]
  20. Brunet, A.; Kanai, F.; Stehn, J.; Xu, J.; Sarbassova, D.; Frangioni, J.V.; Dalal, S.N.; DeCaprio, J.A.; Greenberg, M.E.; Yaffe, M.B. 14-3-3 transits to the nucleus and participates in dynamic nucleocytoplasmic transport. J. Cell Biol. 2002, 156, 817–828. [Google Scholar] [CrossRef]
  21. Obsilova, V.; Vecer, J.; Herman, P.; Pabianova, A.; Sulc, M.; Teisinger, J.; Boura, E.; Obsil, T. 14-3-3 Protein interacts with nuclear localization sequence of forkhead transcription factor FoxO4. Biochemistry 2005, 44, 11608–11617. [Google Scholar] [CrossRef]
  22. Silhan, J.; Vacha, P.; Strnadova, P.; Vecer, J.; Herman, P.; Sulc, M.; Teisinger, J.; Obsilova, V.; Obsil, T. 14-3-3 protein masks the DNA binding interface of forkhead transcription factor FOXO4. J. Biol. Chem. 2009, 284, 19349–19360. [Google Scholar] [CrossRef]
  23. So, C.W.; Cleary, M.L. MLL-AFX requires the transcriptional effector domains of AFX to transform myeloid progenitors and transdominantly interfere with forkhead protein function. Mol. Cell Biol. 2002, 22, 6542–6552. [Google Scholar] [CrossRef]
  24. Greer, E.L.; Brunet, A. FOXO transcription factors at the interface between longevity and tumor suppression. Oncogene 2005, 24, 7410–7425. [Google Scholar] [CrossRef] [Green Version]
  25. Vogt, P.K.; Jiang, H.; Aoki, M. Triple layer control: Phosphorylation, acetylation and ubiquitination of FOXO proteins. Cell Cycle 2005, 4, 908–913. [Google Scholar] [CrossRef]
  26. van der Horst, A.; Burgering, B.M.T. Stressing the role of FoxO proteins in lifespan and disease. Nature Reviews Molecular Cell Biol. 2007, 8, 440–450. [Google Scholar] [CrossRef]
  27. Brunet, A.; Sweeney, L.B.; Sturgill, J.F.; Chua, K.F.; Greer, P.L.; Lin, Y.; Tran, H.; Ross, S.E.; Mostoslavsky, R.; Cohen, H.Y.; et al. Stress-dependent regulation of FOXO transcription factors by the SIRT1 deacetylase. Science 2004, 303, 2011–2015. [Google Scholar] [CrossRef]
  28. van der Horst, A.; de Vries-Smits, A.M.; Brenkman, A.B.; van Triest, M.H.; van den Broek, N.; Colland, F.; Maurice, M.M.; Burgering, B.M. FOXO4 transcriptional activity is regulated by monoubiquitination and USP7/HAUSP. Nat. Cell Biol. 2006, 8, 1064–1073. [Google Scholar] [CrossRef]
  29. Calnan, D.R.; Brunet, A. The FoxO code. Oncogene 2008, 27, 2276–2288. [Google Scholar] [CrossRef] [Green Version]
  30. Webb, A.E.; Kundaje, A.; Brunet, A. Characterization of the direct targets of FOXO transcription factors throughout evolution. Aging Cell 2016, 15, 673–685. [Google Scholar] [CrossRef]
  31. Hui, R.C.; Francis, R.E.; Guest, S.K.; Costa, J.R.; Gomes, A.R.; Myatt, S.S.; Brosens, J.J.; Lam, E.W. Doxorubicin activates FOXO3a to induce the expression of multidrug resistance gene ABCB1 (MDR1) in K562 leukemic cells. Mol. Cancer Ther. 2008, 7, 670–678. [Google Scholar] [CrossRef]
  32. Han, C.Y.; Cho, K.B.; Choi, H.S.; Han, H.K.; Kang, K.W. Role of FoxO1 activation in MDR1 expression in adriamycin-resistant breast cancer cells. Carcinogenesis 2008, 29, 1837–1844. [Google Scholar] [CrossRef] [Green Version]
  33. Salcher, S.; Hagenbuchner, J.; Geiger, K.; Seiter, M.A.; Rainer, J.; Kofler, R.; Hermann, M.; Kiechl-Kohlendorfer, U.; Ausserlechner, M.J.; Obexer, P. C10ORF10/DEPP, a transcriptional target of FOXO3, regulates ROS-sensitivity in human neuroblastoma. Mol. Cancer. 2014, 13, 224. [Google Scholar] [CrossRef] [Green Version]
  34. Karadedou, C.T.; Gomes, A.R.; Chen, J.; Petkovic, M.; Ho, K.K.; Zwolinska, A.K.; Feltes, A.; Wong, S.Y.; Chan, K.Y.; Cheung, Y.N.; et al. FOXO3a represses VEGF expression through FOXM1-dependent and -independent mechanisms in breast cancer. Oncogene 2012, 31, 1845–1858. [Google Scholar] [CrossRef]
  35. Yao, S.; Fan, L.Y.; Lam, E.W. The FOXO3-FOXM1 axis: A key cancer drug target and a modulator of cancer drug resistance. Semin Cancer Biol. 2018, 50, 77–89. [Google Scholar] [CrossRef]
  36. Pajvani, U.B.; Accili, D. The new biology of diabetes. Diabetologia 2015, 58, 2459–2468. [Google Scholar] [CrossRef]
  37. Langlet, F.; Haeusler, R.A.; Linden, D.; Ericson, E.; Norris, T.; Johansson, A.; Cook, J.R.; Aizawa, K.; Wang, L.; Buettner, C.; et al. Selective Inhibition of FOXO1 Activator/Repressor Balance Modulates Hepatic Glucose Handling. Cell 2017, 171, 824–835 e818. [Google Scholar] [CrossRef]
  38. Lee, W.; Tonelli, M.; Markley, J.L. NMRFAM-SPARKY: Enhanced software for biomolecular NMR spectroscopy. Bioinformatics 2015, 31, 1325–1327. [Google Scholar] [CrossRef]
  39. Renshaw, P.S.; Veverka, V.; Kelly, G.; Frenkiel, T.A.; Williamson, R.A.; Gordon, S.V.; Hewinson, R.G.; Carr, M.D. Sequence-specific assignment and secondary structure determination of the 195-residue complex formed by the Mycobacterium tuberculosis proteins CFP-10 and ESAT-6. J. Biomol. NMR 2004, 30, 225–226. [Google Scholar] [CrossRef]
  40. Veverka, V.; Lennie, G.; Crabbe, T.; Bird, I.; Taylor, R.J.; Carr, M.D. NMR assignment of the mTOR domain responsible for rapamycin binding. J. Biomol. NMR 2006, 36 (Suppl. 1), 3. [Google Scholar] [CrossRef]
  41. Herrmann, T.; Guntert, P.; Wuthrich, K. Protein NMR structure determination with automated NOE assignment using the new software CANDID and the torsion angle dynamics algorithm DYANA. J. Mol. Biol. 2002, 319, 209–227. [Google Scholar] [CrossRef]
  42. Guntert, P.; Wuthrich, K. Improved efficiency of protein structure calculations from NMR data using the program DIANA with redundant dihedral angle constraints. J. Biomol. NMR 1991, 1, 447–456. [Google Scholar] [CrossRef]
  43. Shen, Y.; Delaglio, F.; Cornilescu, G.; Bax, A. TALOS+: A hybrid method for predicting protein backbone torsion angles from NMR chemical shifts. J. Biomol. NMR 2009, 44, 213–223. [Google Scholar] [CrossRef]
  44. Harjes, E.; Harjes, S.; Wohlgemuth, S.; Muller, K.H.; Krieger, E.; Herrmann, C.; Bayer, P. GTP-Ras disrupts the intramolecular complex of C1 and RA domains of Nore1. Structure 2006, 14, 881–888. [Google Scholar] [CrossRef]
  45. Weigelt, J.; Climent, I.; Dahlman-Wright, K.; Wikstrom, M. Solution structure of the DNA binding domain of the human forkhead transcription factor AFX (FOXO4). Biochemistry 2001, 40, 5861–5869. [Google Scholar] [CrossRef]
  46. Wang, F.; Marshall, C.B.; Yamamoto, K.; Li, G.Y.; Plevin, M.J.; You, H.; Mak, T.W.; Ikura, M. Biochemical and structural characterization of an intramolecular interaction in FOXO3a and its binding with p53. J. Mol. Biol. 2008, 384, 590–603. [Google Scholar] [CrossRef]
  47. Kelley, L.A.; Gardner, S.P.; Sutcliffe, M.J. An automated approach for clustering an ensemble of NMR-derived protein structures into conformationally related subfamilies. Protein Eng 1996, 9, 1063–1065. [Google Scholar] [CrossRef] [Green Version]
  48. Lee, B.; Richards, F.M. The interpretation of protein structures: Estimation of static accessibility. J. Mol. Biol. 1971, 55, 379–400. [Google Scholar] [CrossRef]
  49. Pierrou, S.; Hellqvist, M.; Samuelsson, L.; Enerback, S.; Carlsson, P. Cloning and characterization of seven human forkhead proteins: Binding site specificity and DNA bending. Embo J. 1994, 13, 5002–5012. [Google Scholar] [CrossRef]
  50. Martin, A.J.; Walsh, I.; Tosatto, S.C. MOBI: A web server to define and visualize structural mobility in NMR protein ensembles. Bioinformatics 2010, 26, 2916–2917. [Google Scholar] [CrossRef]
  51. Baar, M.P.; Brandt, R.M.C.; Putavet, D.A.; Klein, J.D.D.; Derks, K.W.J.; Bourgeois, B.R.M.; Stryeck, S.; Rijksen, Y.; van Willigenburg, H.; Feijtel, D.A.; et al. Targeted Apoptosis of Senescent Cells Restores Tissue Homeostasis in Response to Chemotoxicity and Aging. Cell 2017, 169, 132–147 e116. [Google Scholar] [CrossRef]
  52. Vacha, P.; Zuskova, I.; Bumba, L.; Herman, P.; Vecer, J.; Obsilova, V.; Obsil, T. Detailed kinetic analysis of the interaction between the FOXO4-DNA-binding domain and DNA. Biophys. Chem. 2013, 184C, 68–78. [Google Scholar] [CrossRef]
  53. Golson, M.L.; Kaestner, K.H. Fox transcription factors: From development to disease. Development 2016, 143, 4558–4570. [Google Scholar] [CrossRef]
  54. Benayoun, B.A.; Caburet, S.; Veitia, R.A. Forkhead transcription factors: Key players in health and disease. Trends Genet. 2011, 27, 224–232. [Google Scholar] [CrossRef]
  55. Jacobs, F.M.; van der Heide, L.P.; Wijchers, P.J.; Burbach, J.P.; Hoekman, M.F.; Smidt, M.P. FoxO6, a novel member of the FoxO class of transcription factors with distinct shuttling dynamics. J. Biol. Chem. 2003, 278, 35959–35967. [Google Scholar] [CrossRef]
  56. Xing, Y.Q.; Li, A.; Yang, Y.; Li, X.X.; Zhang, L.N.; Guo, H.C. The regulation of FOXO1 and its role in disease progression. Life Sci. 2018, 193, 124–131. [Google Scholar] [CrossRef]
  57. Lu, H.; Huang, H. FOXO1: A potential target for human diseases. Current drug targets 2011, 12, 1235–1244. [Google Scholar] [CrossRef]
  58. Nakae, J.; Biggs, W.H., 3rd; Kitamura, T.; Cavenee, W.K.; Wright, C.V.; Arden, K.C.; Accili, D. Regulation of insulin action and pancreatic beta-cell function by mutated alleles of the gene encoding forkhead transcription factor Foxo1. Nat. Genet. 2002, 32, 245–253. [Google Scholar] [CrossRef]
  59. Matsumoto, M.; Han, S.; Kitamura, T.; Accili, D. Dual role of transcription factor FoxO1 in controlling hepatic insulin sensitivity and lipid metabolism. J. Clin. Invest. 2006, 116, 2464–2472. [Google Scholar] [CrossRef] [Green Version]
  60. Matsumoto, M.; Pocai, A.; Rossetti, L.; Depinho, R.A.; Accili, D. Impaired regulation of hepatic glucose production in mice lacking the forkhead transcription factor Foxo1 in liver. Cell Metab. 2007, 6, 208–216. [Google Scholar] [CrossRef]
  61. Cook, J.R.; Matsumoto, M.; Banks, A.S.; Kitamura, T.; Tsuchiya, K.; Accili, D. A mutant allele encoding DNA binding-deficient FoxO1 differentially regulates hepatic glucose and lipid metabolism. Diabetes 2015, 64, 1951–1965. [Google Scholar] [CrossRef]
Figure 1. Domain structure of FOXO proteins. The positions of PKB/Akt phosphorylation sites are indicated by circles. The first two PKB/Akt phosphorylation sites are also binding motifs for the scaffolding 14-3-3 protein. CR1, conserved region 1; NLS, nuclear localization signal; NES, nuclear export signal; TAD (CR3), transactivation domain.
Cells 08 00966 g001
Figure 2. Solution structure of FOXO1-DBD. (A) Cartoon representation of the NMR solution structure of FOXO1-DBD showing residues 156-243. Secondary structure elements are labeled according to the nomenclature typical of the winged-helix motif [3]. (B) 30 superimposed FOXO1-DBD conformers of the NMR solution structure ensemble. (C) Sequence alignment of FOXO forkhead domains. Secondary-structure elements (based on the FOXO1-DBD) are indicated at the top. Protein sequences of mouse and human FOXO1-DBD are identical.
Cells 08 00966 g002
Figure 3. Comparison of FOXO1-DBD with previously reported solution structures of FOXO3-DBD and FOXO4-DBD. (A) Superimposition of representative conformers of FOXO1-DBD (conf. no. 16), FOXO3-DBD (conf. no. 11, PDB ID: 2K86 [46]) and FOXO4-DBD (conf. no. 3, PDB ID: 1E17 [45]). Selected conformers are representatives of the most populated clusters obtained by cluster analysis of conformational ensembles of NMR solution structures [47]. Structural comparison was performed using residues 156–239 (mouse FOXO1 numbering). Structures were superimposed using all Cα atoms. (BD) Superimposition of FOXO1/FOXO3, FOXO1/FOXO4 and FOXO3/FOXO4 DBDs.
Cells 08 00966 g003
Figure 4. Interactions of hydrophobic residues on the interface between the N-terminal segment, the H2–H3 loop and helix H3. (A) Interactions observed in apo FOXO1-DBD (conf. no. 16). (B) Interactions observed in apo FOXO3-DBD (conf. #11, PDB ID: 2K86 [46]). (C) Interactions observed in apo FOXO4-DBD (conf. no. 3, PDB ID: 1E17 [45]). (D) Interactions observed in DNA-bound forms of FOXO1-DBD (PDB ID: 3COA [7], shown in dark cyan), FOXO3-DBD (PDB ID: 2UZK [6], shown in sand) and FOXO4-DBD (PDB ID: 3L2C [8], shown in dark red). For clarity, only DNA in the FOXO1-DBD:DNA complex is shown.
Cells 08 00966 g004
Figure 5. Conformational flexibility of FOXO-DBDs. (A) Root Mean Squared Deviation (R.M.S.D.) difference from average as a function of the sequence of FOXO1-DBD, FOXO3-DBD (PDB ID: 2K86 [46]) and FOXO4-DBD (PDB ID: 1E17 [45]). RMSD profiles were calculated using the MOBI server [50]. Secondary-structure elements (based on the FOXO1-DBD) are indicated at the top. (B) Sausage representation of NMR ensembles of FOXO1-DBD, FOXO3-DBD and FOXO4-DBD. The backbone diameter indicates the conformational mobility.
Cells 08 00966 g005
Figure 6. Comparison between apo and DNA-bound forms of FOXO-DBDs. (A) Superimposition of the solution structure of FOXO1-DBD (conf. no. 16, shown in dark cyan) with the crystal structure of the FOXO1-DBD:DNA complex (PDB ID: 3COA [7], shown in green). (B) Superimposition of the solution structure of FOXO3-DBD (conf. no. 11, PDB ID: 2K86 [46], shown in sand) with the crystal structure of the FOXO3-DBD:DNA complex (PDB ID: 2UZK [6], shown in brown). (C) Superimposition of the solution structure of FOXO4-DBD (conf. no. 3, PDB ID: 1E17 [45], shown in dark red) with the crystal structure of the FOXO4-DBD:DNA complex (PDB ID: 3L2C [8], shown in pink).
Cells 08 00966 g006
Table 1. Statistics for the final water-refined sets of structures.
Non-Redundant Distance and Angle Constrains
Total number of NOE constraints1712
Short-range NOEs
  Intra-residue (i = j)445
  Sequential (|i − j| = 1)402
Medium-range NOEs (1 < | i − j | < 5)325
Long-range NOEs (|i − j| ≥ 5)530
Torsion angles128
Hydrogen bond restrains-
Total number of restricting constraints1840
Total restricting constraints per restrained residue16.3
Residual constraint violations
Distance violations per structure
  0.1–0.2 Å7.44
  0.2–0.5 Å2.46
  > 0.5 Å0
Root mean square (r.m.s.) of distance violation per constraint0.02 Å
Maximum distance violation0.48 Å
Dihedral angle viol. per structure
  1–10°3.12
  > 10°0
r.m.s. of dihedral violations per constraint0.55°
Maximum dihedral angle viol.5.0°
Ramachandran plot summary
  Most favored regions98.3%
  Additionally allowed regions1.7%
  Generously allowed regions0.0%
  Disallowed regions0.0%
r.m.s.d. to the mean structureall/ordered 1
  All backbone atoms10.0/0.4 Å
  All heavy atoms10.1/0.8 Å
PDB entry6QVW
BMRB accession code34364
1 Residues with sum of phi and psi order parameters > 1.8.

