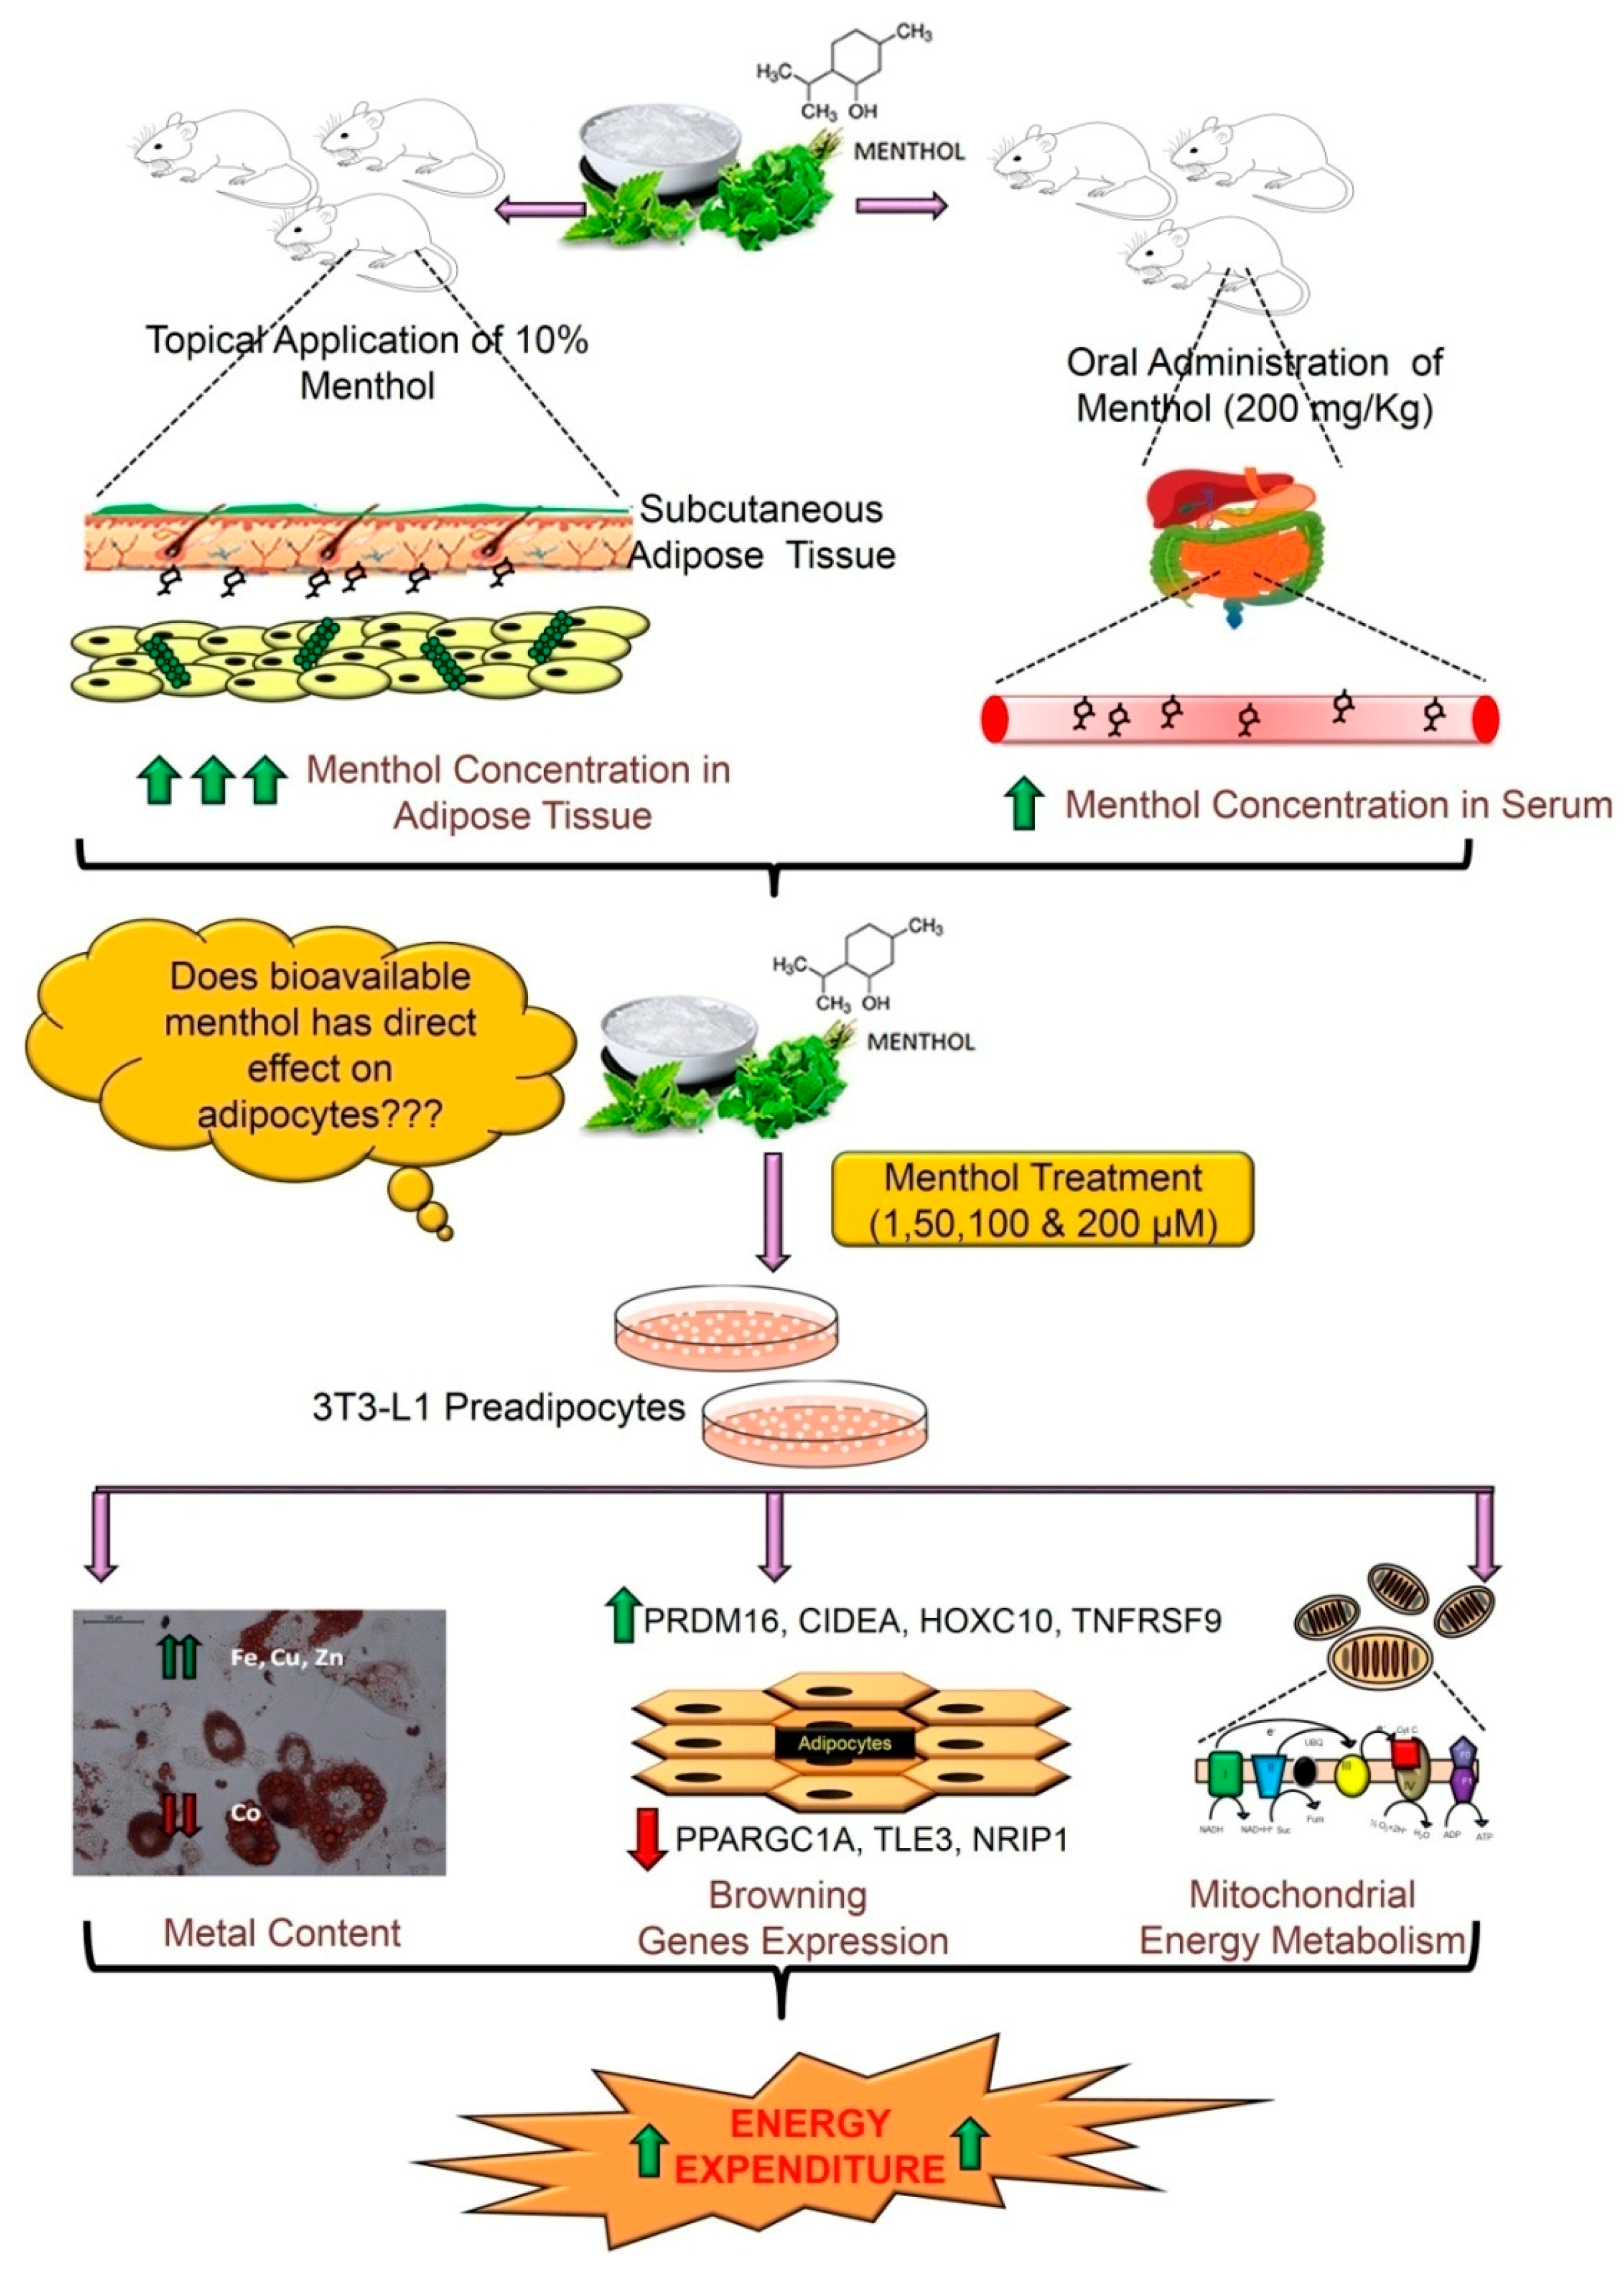
Bioavailable Menthol (Transient Receptor Potential Melastatin-8 Agonist) Induces Energy Expending Phenotype in Differentiating Adipocytes

 , and
, and 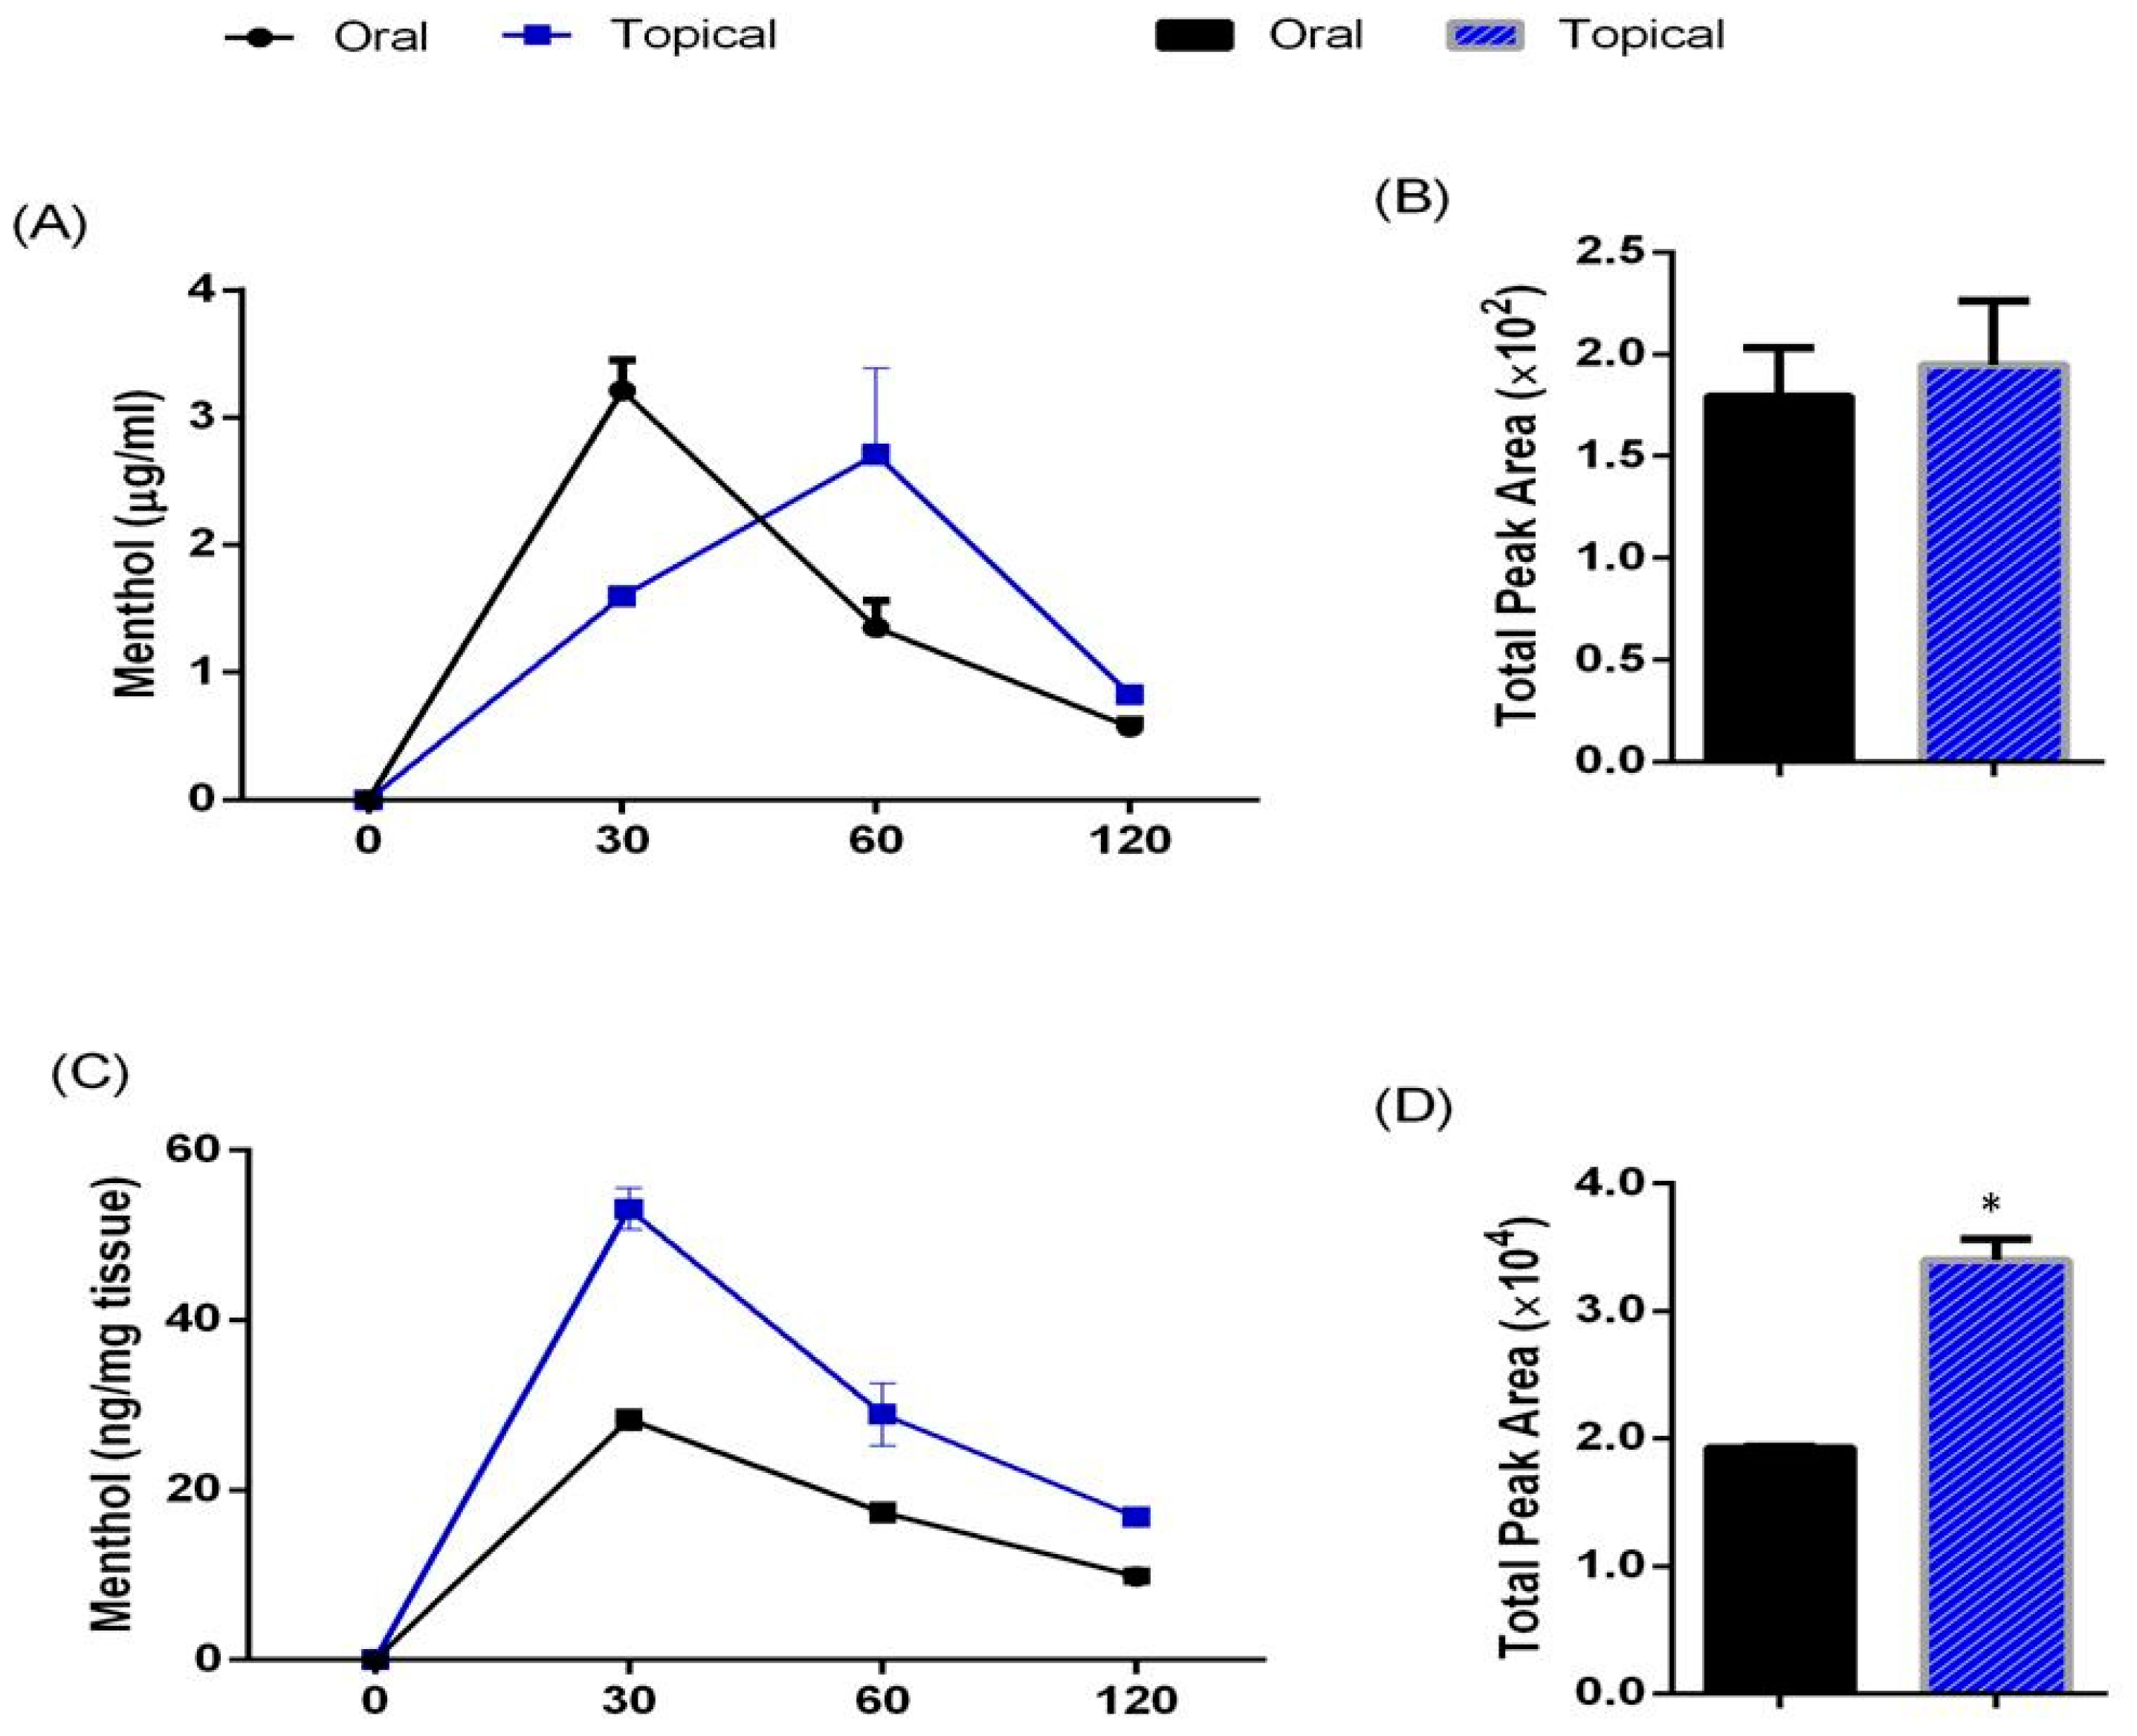
Abstract
:1. Introduction
2. Materials and Methods
2.1. Chemicals
2.2. Animal Treatment
2.3. Gas Chromatography-Flame Ionization Detector (GC-FID) for Menthol Bioavailability in Serum and Subcutaneous WAT
2.3.1. Extraction Procedure
2.3.2. GC-FID Protocol
2.4. 3T3-L1 Cell Culture
2.5. Cell Viability Assay
2.6. Oil-Red-O Staining
2.7. ICP-MS for Metal Analysis
2.8. qRT-PCR for Browning/Energy Expenditure Genes
2.9. Gene Expression Analysis of Mitochondrial Energy Metabolism
2.10. Statistical Analysis
3. Results
3.1. Pharmacokinetic Profile of Acute Oral Administration and Topical Application of TRPM8 Agonist (Menthol) in Mice
3.2. Menthol Treatment Did Not Affect Cellular Differentiation, Lipid Accumulation and Cell Viability in 3T3-L1 Cells In-Vitro
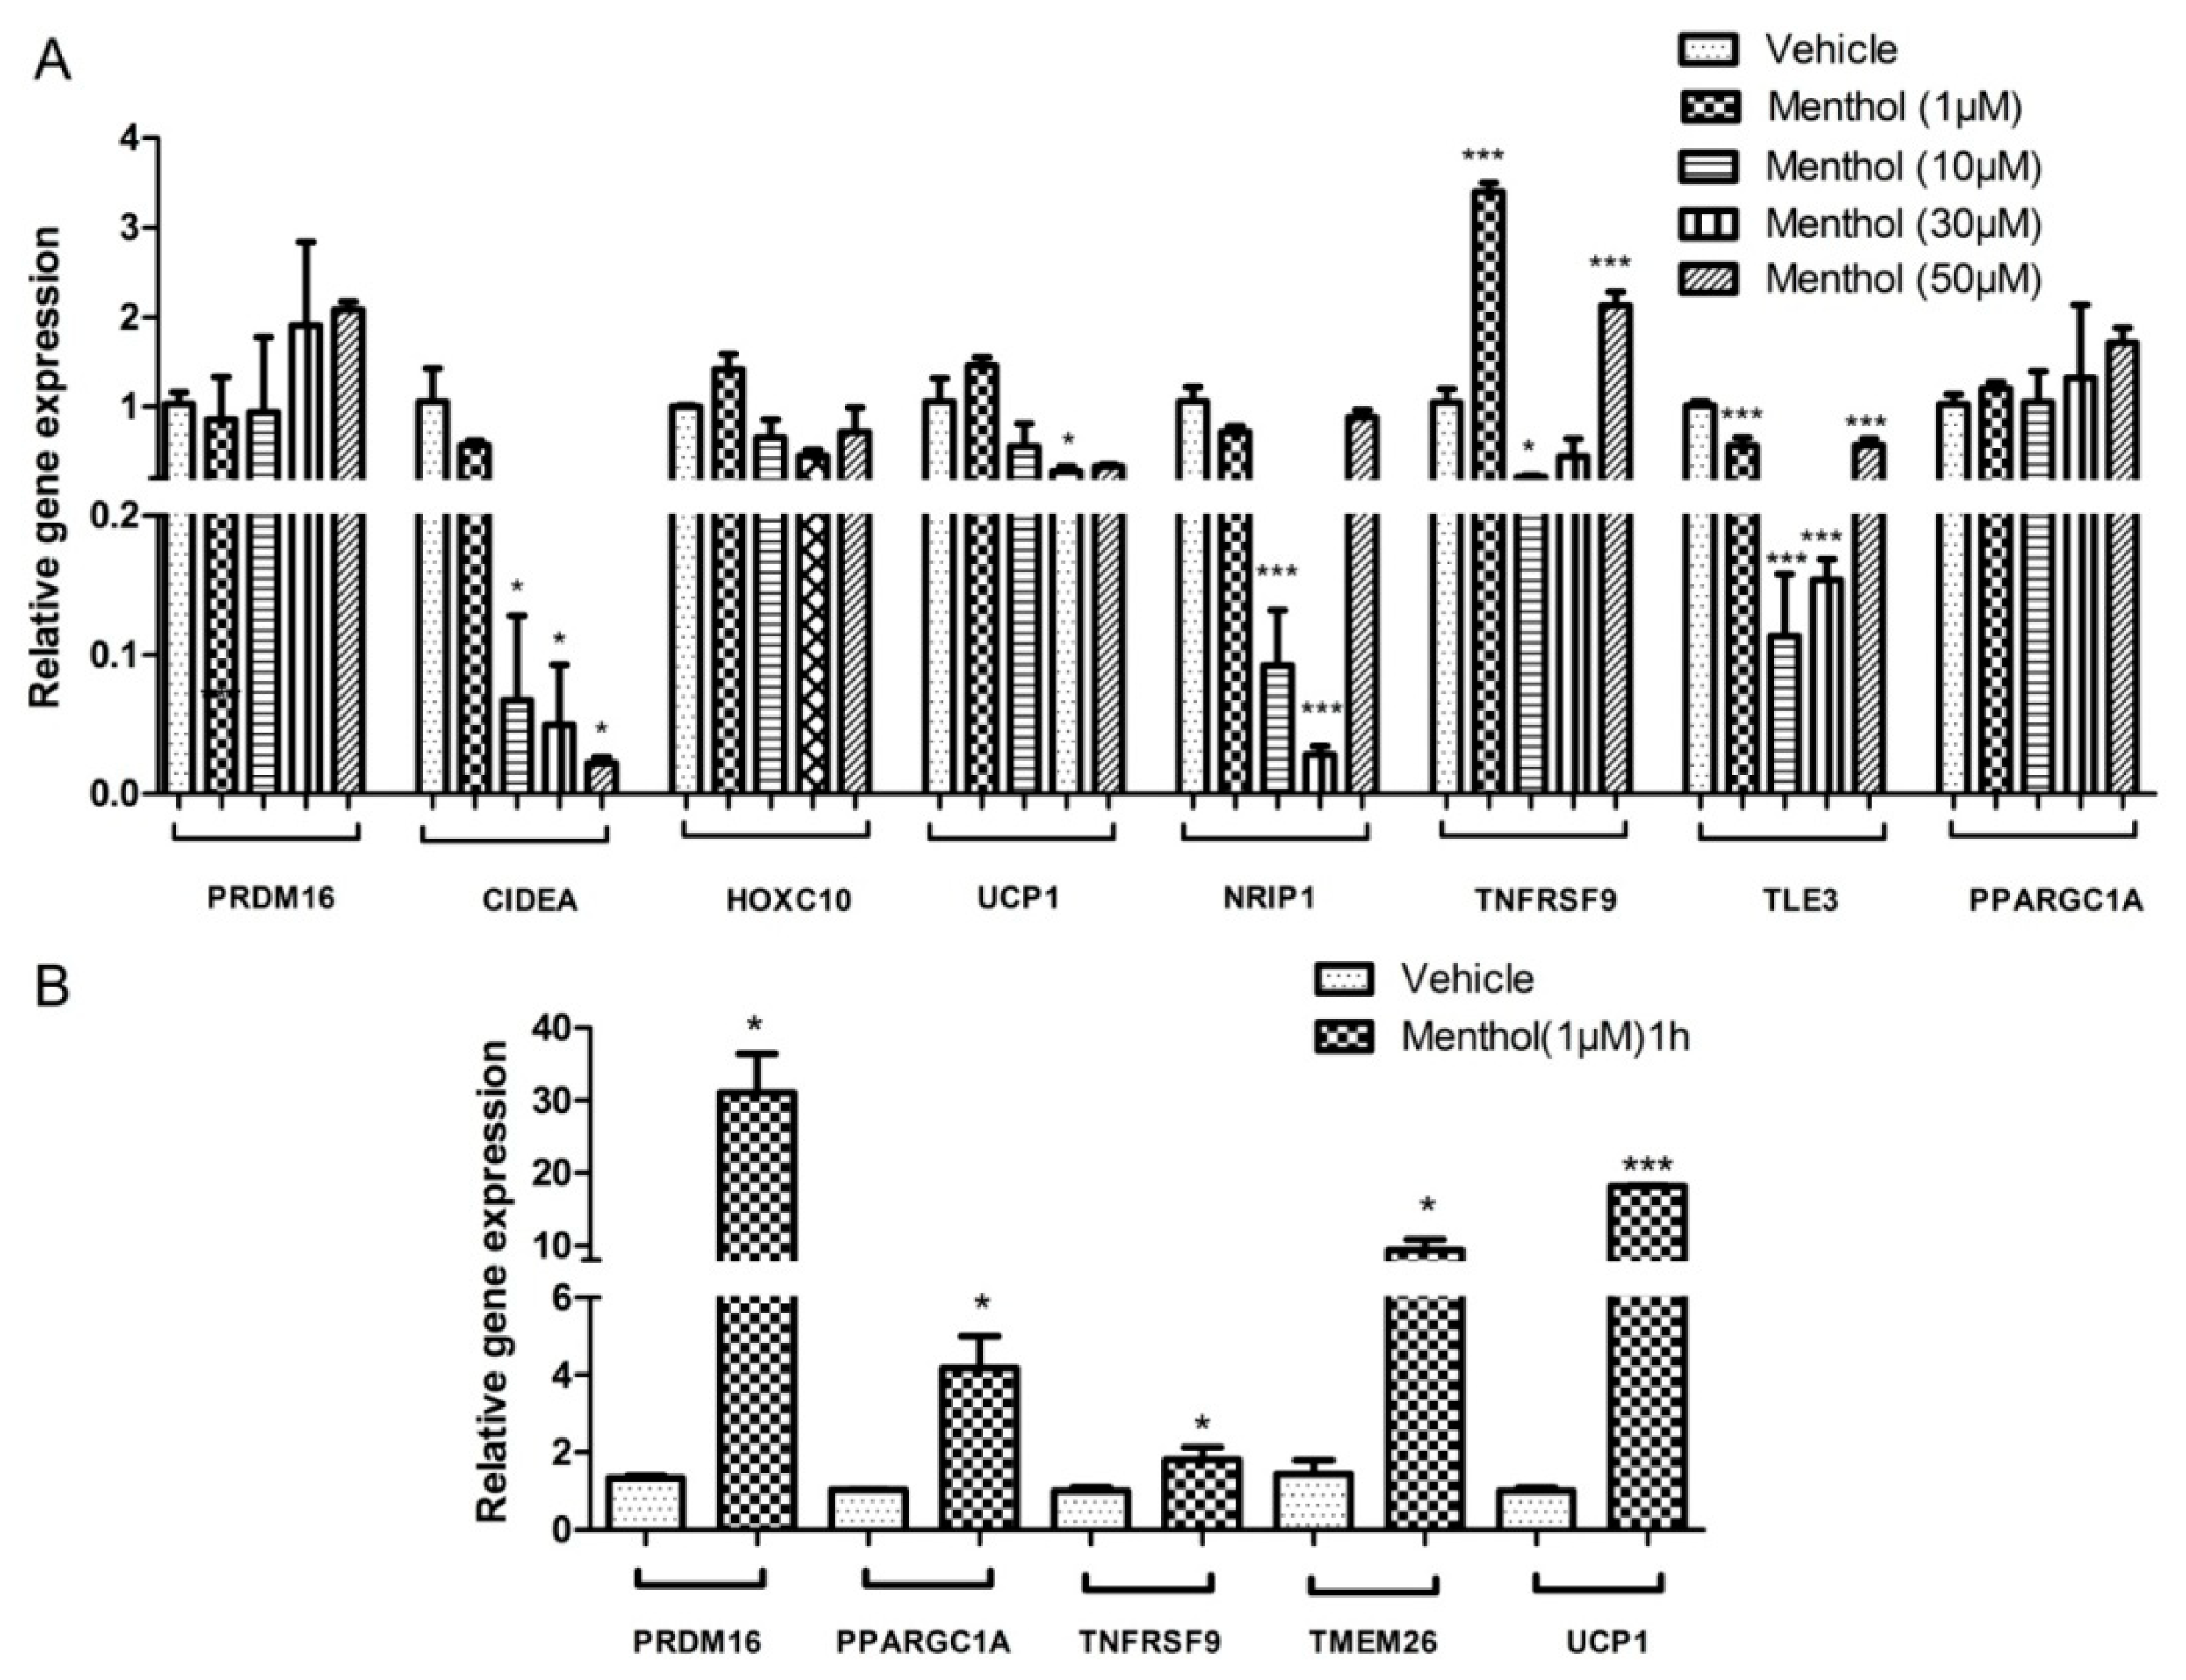
3.3. Menthol Treatment Altered Metal Concentration and Browning Gene Markers in 3T3-L1 Pre-Adipocytes In-Vitro
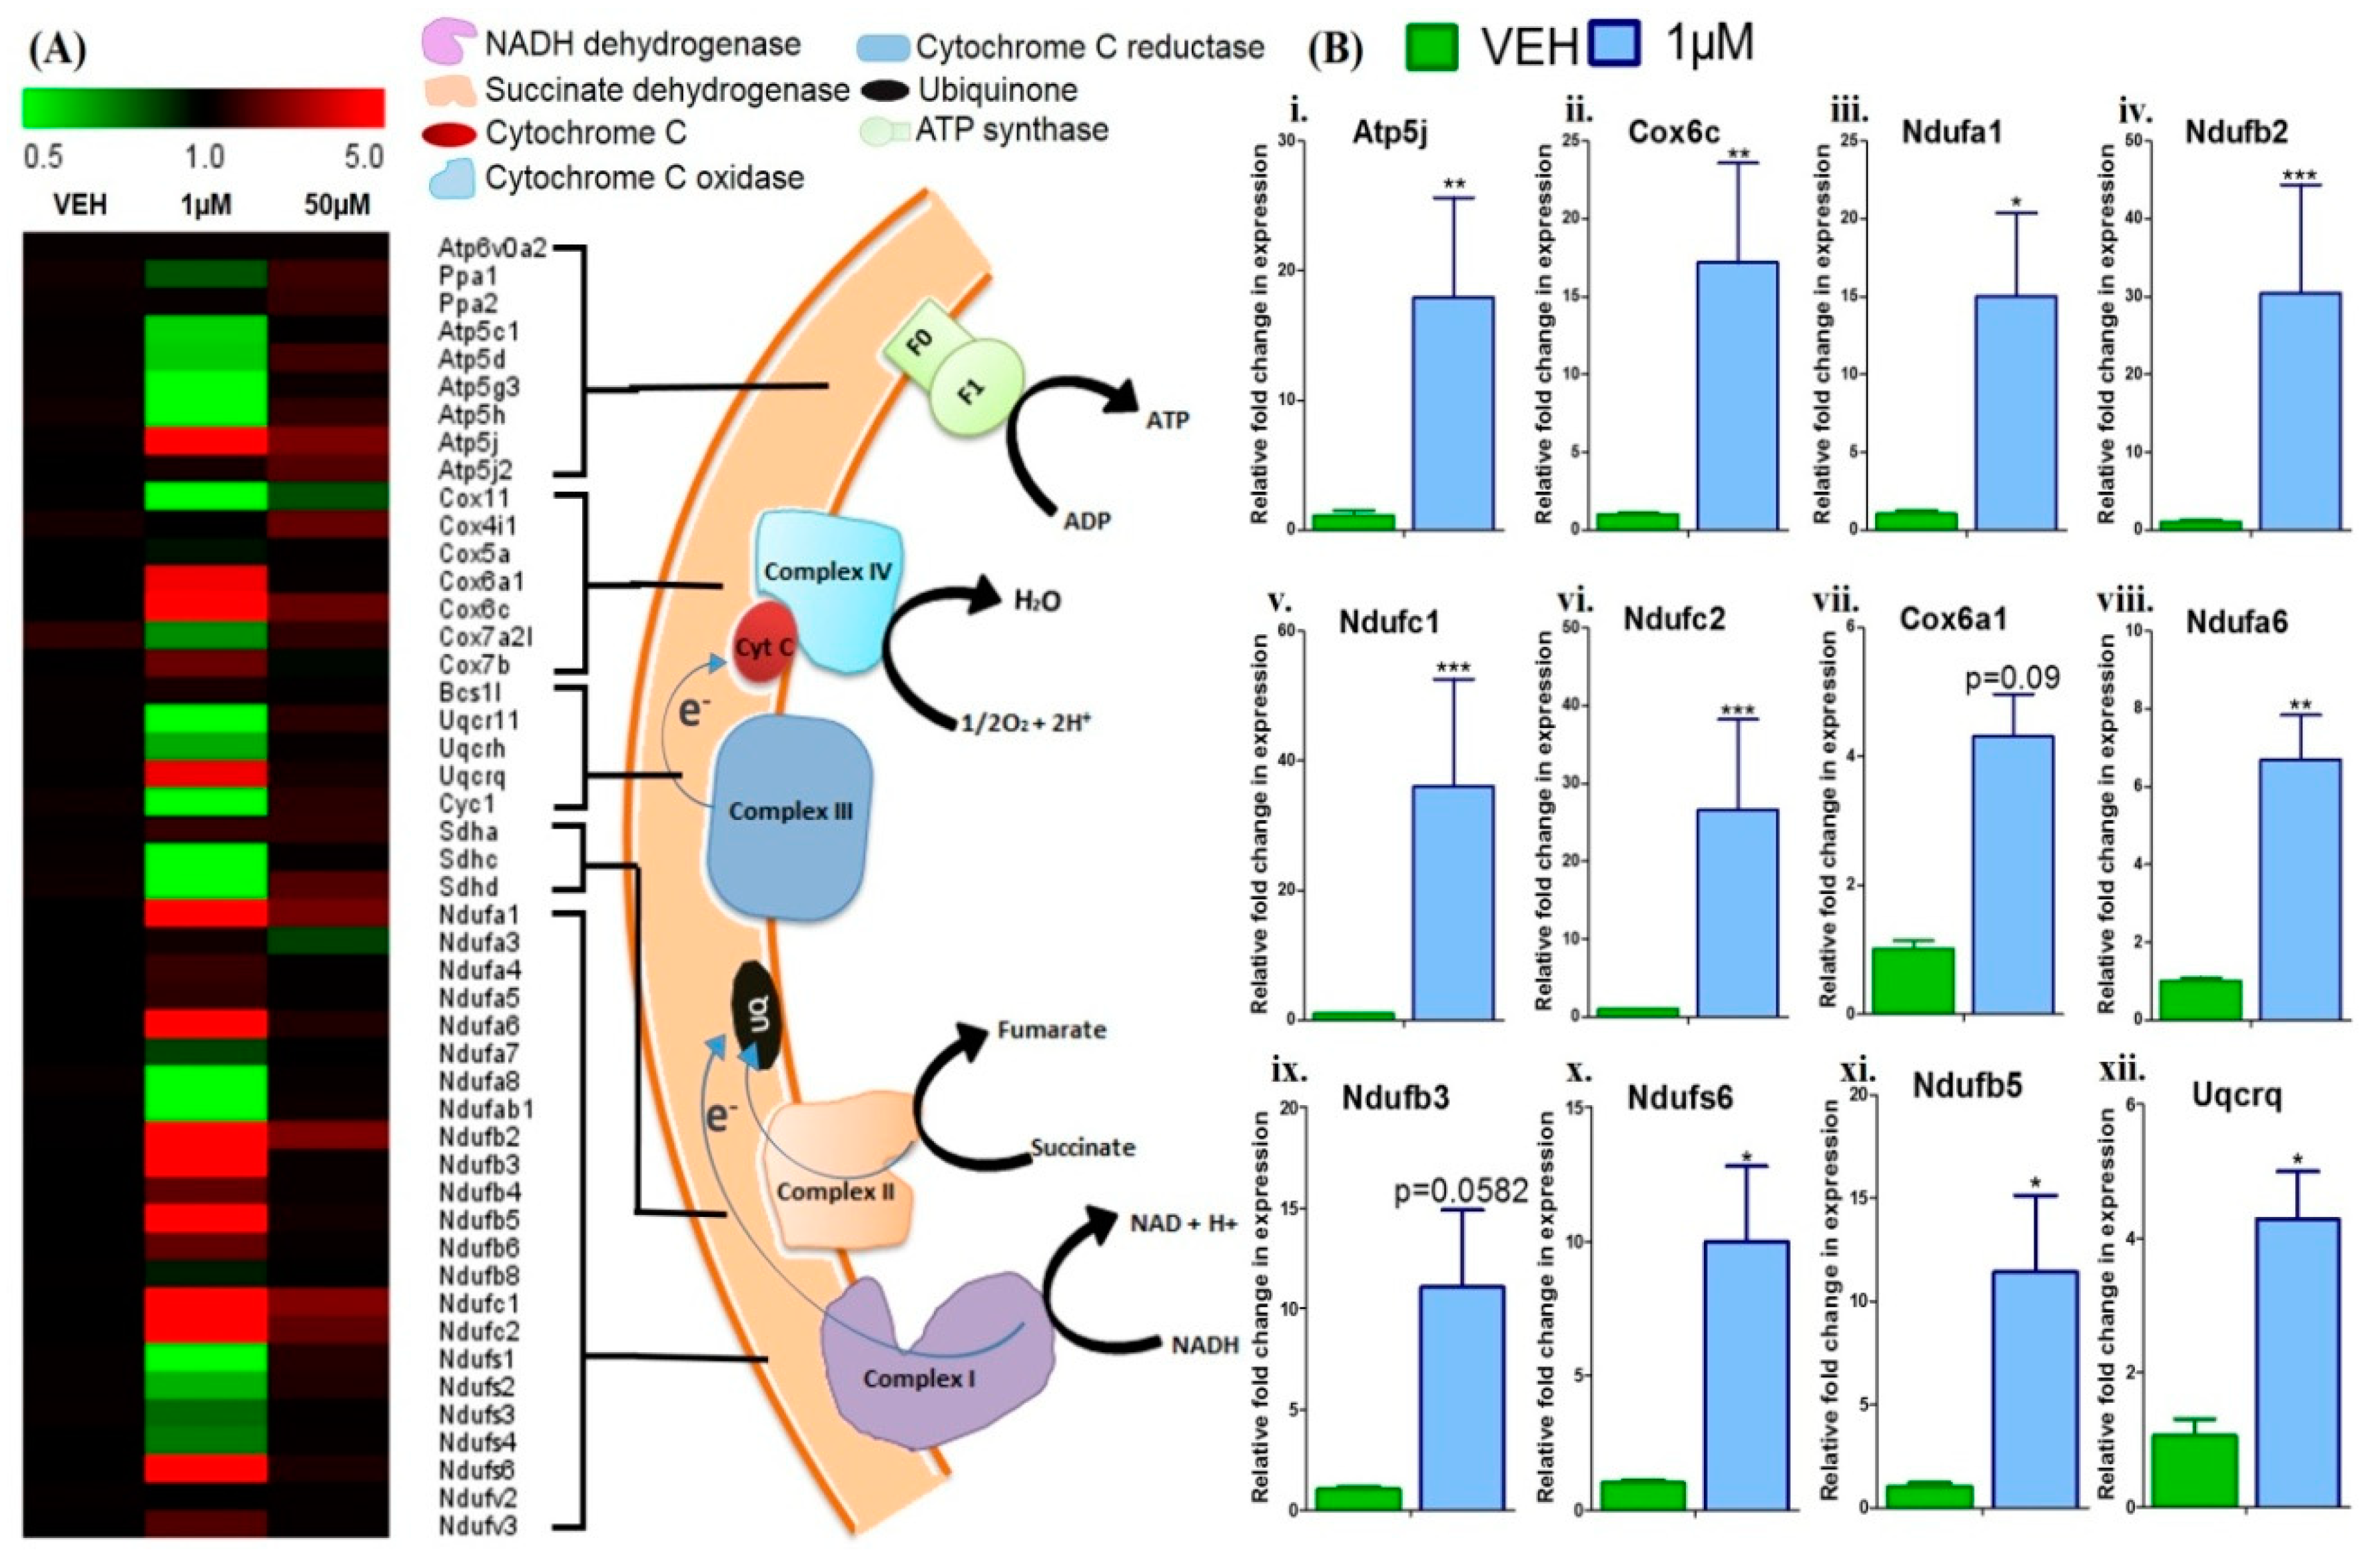
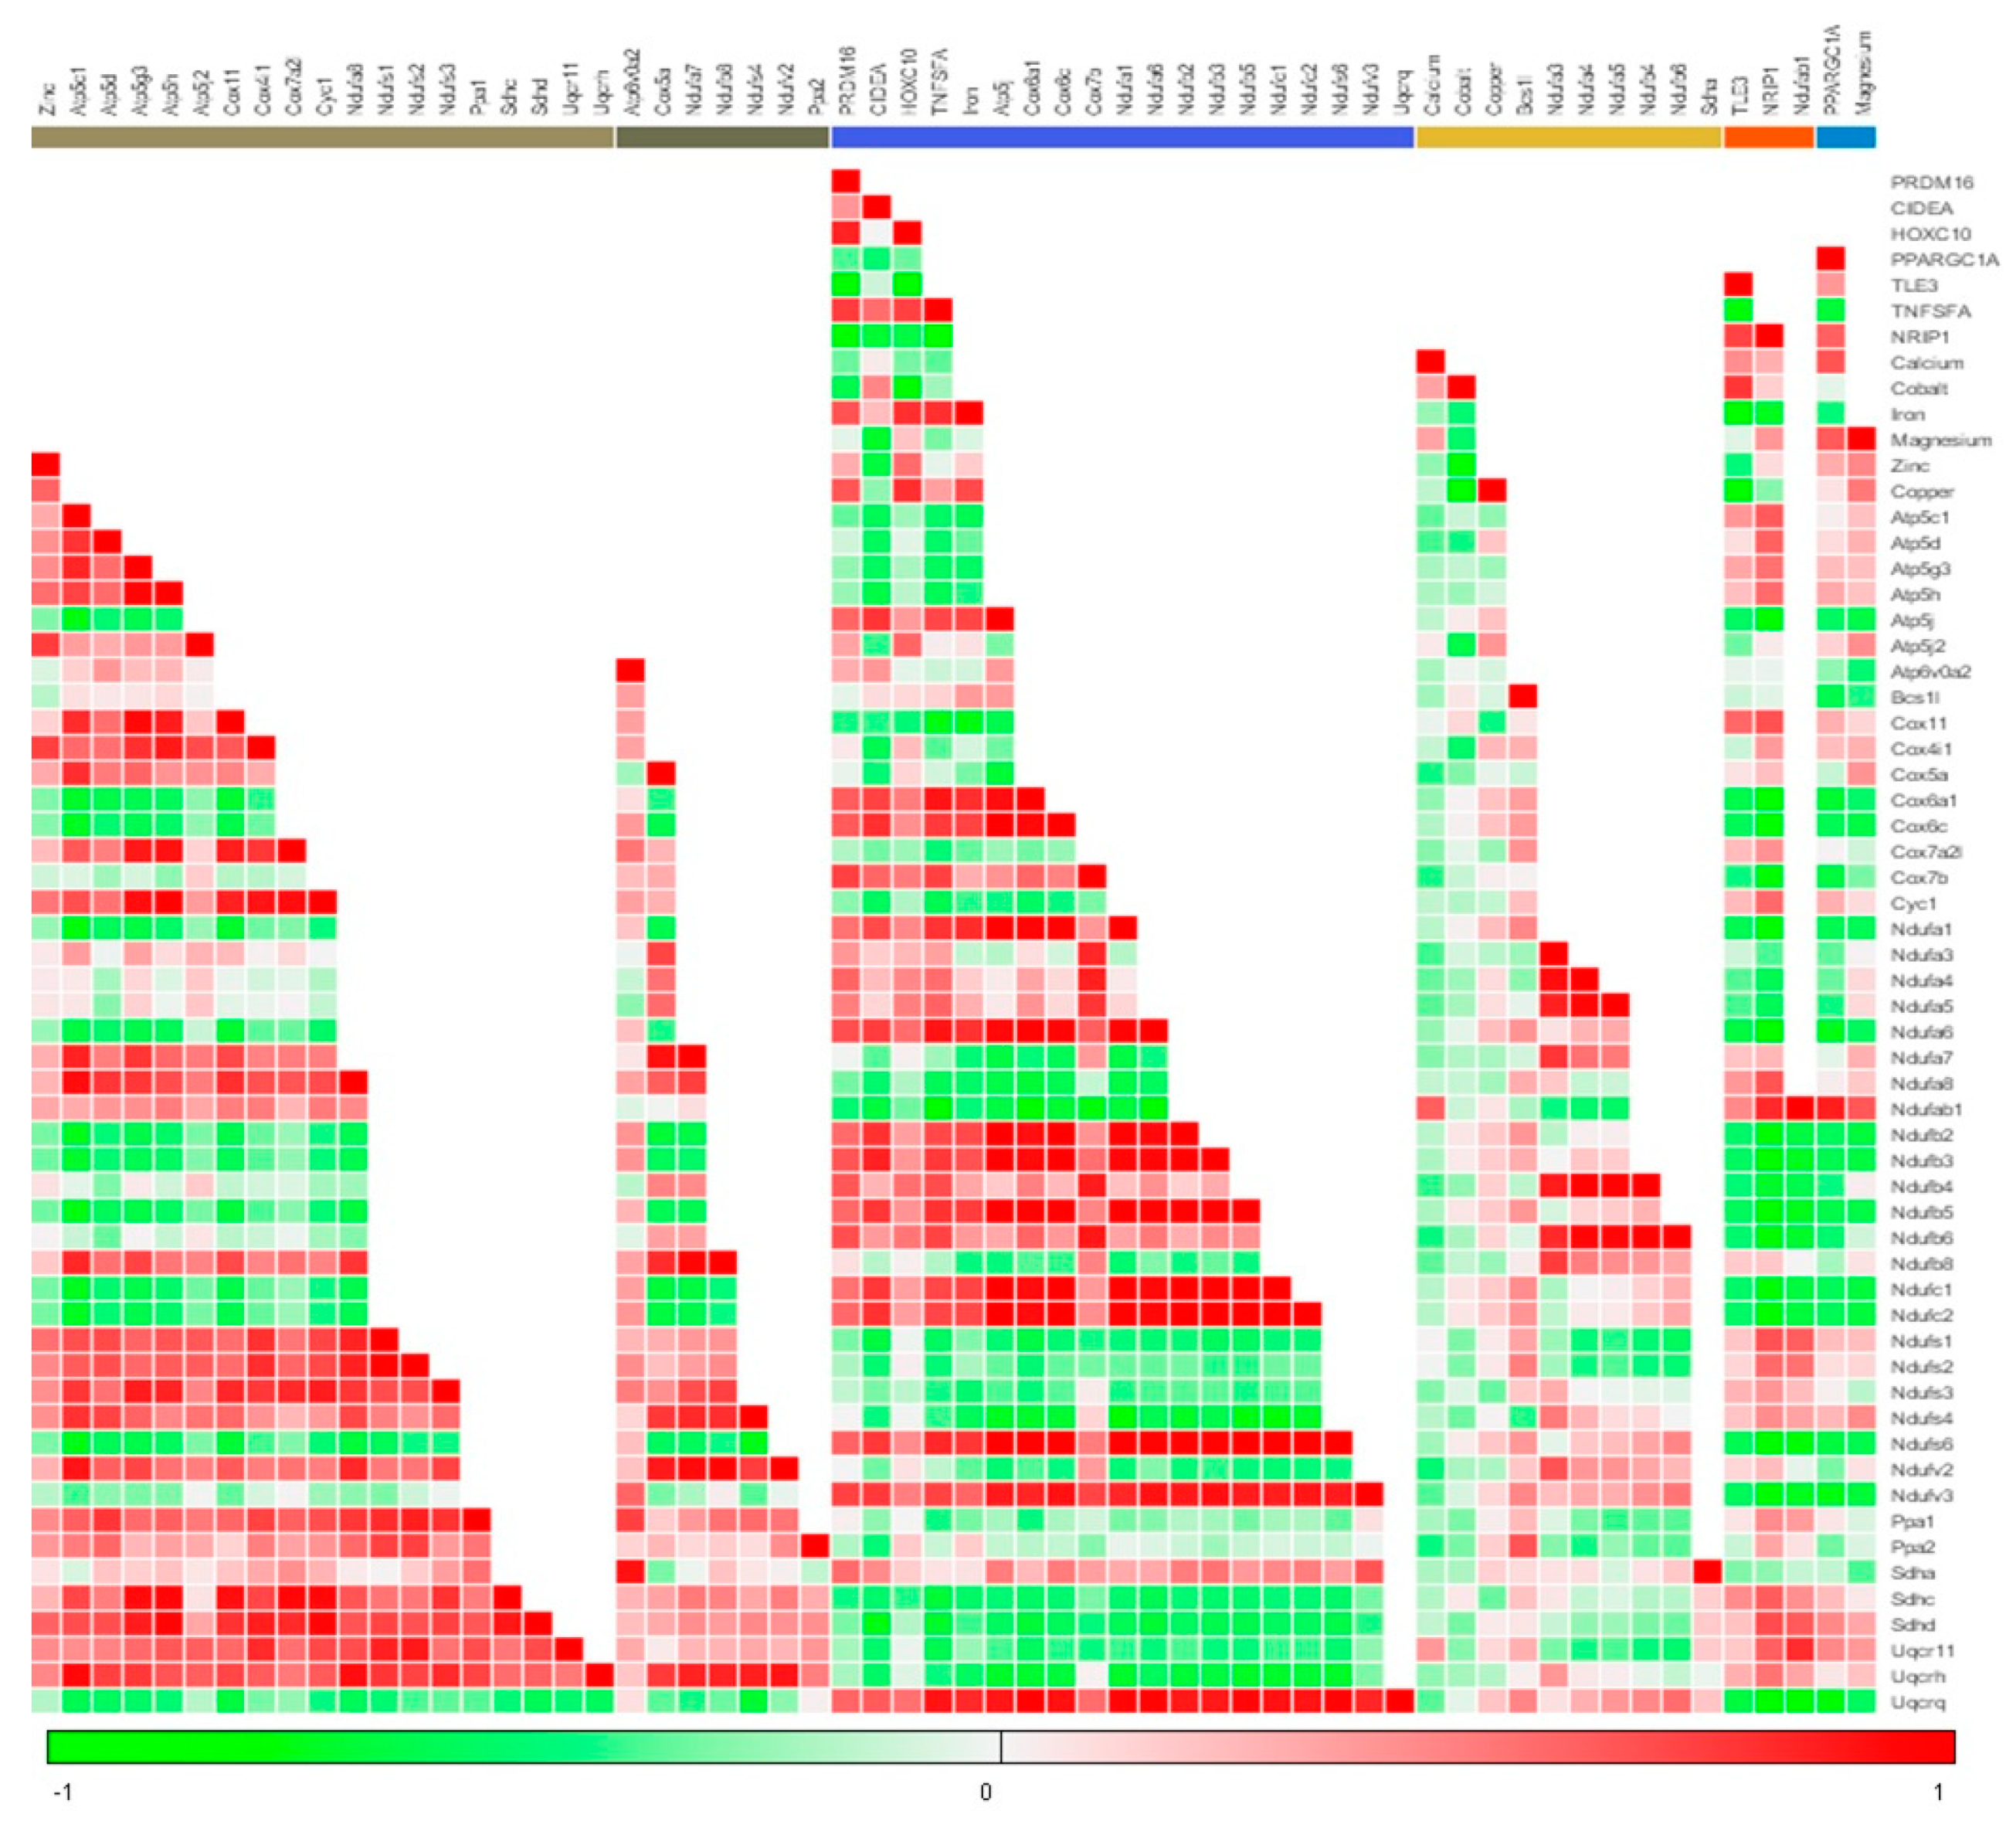
3.4. Menthol Treatment Modulated Mitochondrial Activity Gene Markers for Energy Metabolism in 3T3-L1 Pre-Adipocytes In-Vitro
4. Discussion
5. Conclusions
Author Contributions
Funding
Acknowledgments
Conflicts of Interest
References
- WHO. Obesity: Preventing and Managing the Global Epidemic. Available online: https://www.who.int/nutrition/publications/obesity/WHO_TRS_894/en/ (accessed on 16 December 2018).
- Mitchell, N.S.; Catenacci, V.A.; Wyatt, H.R.; Hill, J.O. Obesity: Overview of an epidemic. Psychiatr. Clin. 2011, 34, 717–732. [Google Scholar] [CrossRef] [PubMed]
- Christiansen, E.; Garby, L. Prediction of body weight changes caused by changes in energy balance. Eur. J. Clin. Investig. 2002, 32, 826–830. [Google Scholar] [CrossRef]
- Donahoo, W.T.; Levine, J.A.; Melanson, E.L. Variability in energy expenditure and its components. Curr. Opin. Clin. Nutr. Metab. Care 2004, 7, 599–605. [Google Scholar] [CrossRef] [PubMed]
- Michlig, S.; Merlini, J.M.; Beaumont, M.; Ledda, M.; Tavenard, A.; Mukherjee, R.; Camacho, S.; Le Coutre, J. Effects of TRP channel agonist ingestion on metabolism and autonomic nervous system in a randomized clinical trial of healthy subjects. Sci. Rep. 2016, 6, 20795. [Google Scholar] [CrossRef] [PubMed]
- Saito, M.; Okamatsu-Ogura, Y.; Matsushita, M.; Watanabe, K.; Yoneshiro, T.; Nio-Kobayashi, J.; Iwanaga, T.; Miyagawa, M.; Kameya, T.; Nakada, K. High incidence of metabolically active brown adipose tissue in healthy adult humans: Effects of cold exposure and adiposity. Diabetes 2009, 58, 1526–1531. [Google Scholar] [CrossRef]
- van der Lans, A.A.; Hoeks, J.; Brans, B.; Vijgen, G.H.; Visser, M.G.; Vosselman, M.J.; Hansen, J.; Jörgensen, J.A.; Wu, J.; Mottaghy, F.M. Cold acclimation recruits human brown fat and increases nonshivering thermogenesis. J. Clin. Investig. 2013, 123, 3395–3403. [Google Scholar] [CrossRef] [Green Version]
- van Marken Lichtenbelt, W.; Kingma, B.; Van Der Lans, A.; Schellen, L. Cold exposure–an approach to increasing energy expenditure in humans. Trends Endocrinol. Metab. 2014, 25, 165–167. [Google Scholar] [CrossRef]
- Romu, T.; Vavruch, C.; Dahlqvist-Leinhard, O.; Tallberg, J.; Dahlström, N.; Persson, A.; Heglind, M.; Lidell, M.E.; Enerbäck, S.; Borga, M. A randomized trial of cold-exposure on energy expenditure and supraclavicular brown adipose tissue volume in humans. Metabolism 2016, 65, 926–934. [Google Scholar] [CrossRef]
- Li, C.; Li, J.; Xiong, X.; Liu, Y.; Lv, Y.; Qin, S.; Liu, D.; Wei, R.; Ruan, X.; Zhang, J. TRPM8 activation improves energy expenditure in skeletal muscle and exercise endurance in mice. Gene 2018, 641, 111–116. [Google Scholar] [CrossRef]
- McKemy, D.D.; Neuhausser, W.M.; Julius, D. Identification of a cold receptor reveals a general role for TRP channels in thermosensation. Nature 2002, 416, 52–58. [Google Scholar] [CrossRef]
- Peier, A.M.; Moqrich, A.; Hergarden, A.C.; Reeve, A.J.; Andersson, D.A.; Story, G.M.; Earley, T.J.; Dragoni, I.; McIntyre, P.; Bevan, S. A TRP channel that senses cold stimuli and menthol. Cell 2002, 108, 705–715. [Google Scholar] [CrossRef]
- Bautista, D.M.; Siemens, J.; Glazer, J.M.; Tsuruda, P.R.; Basbaum, A.I.; Stucky, C.L.; Jordt, S.-E.; Julius, D. The menthol receptor TRPM8 is the principal detector of environmental cold. Nature 2007, 448, 204–208. [Google Scholar] [CrossRef]
- Khare, P.; Mangal, P.; Baboota, R.K.; Jagtap, S.; Kumar, V.; Singh, D.P.; Boparai, R.K.; Sharma, S.S.; Khardori, R.; Bhadada, S.K. Involvement of glucagon in preventive effect of menthol against high fat diet induced obesity in mice. Front. Pharmacol. 2018, 9. [Google Scholar] [CrossRef]
- Bishnoi, M.; Kondepudi, K.K.; Gupta, A.; Karmase, A.; Boparai, R.K. Expression of multiple Transient Receptor Potential channel genes in murine 3T3-L1 cell lines and adipose tissue. Pharmacol. Rep. 2013, 65, 751–755. [Google Scholar] [CrossRef] [Green Version]
- Jiang, C.; Zhai, M.; Yan, D.; Li, D.; Li, C.; Zhang, Y.; Xiao, L.; Xiong, D.; Deng, Q.; Sun, W. Dietary menthol-induced TRPM8 activation enhances WAT “browning” and ameliorates diet-induced obesity. Oncotarget 2017, 8, 75114. [Google Scholar] [CrossRef]
- Ma, S.; Yu, H.; Zhao, Z.; Luo, Z.; Chen, J.; Ni, Y.; Jin, R.; Ma, L.; Wang, P.; Zhu, Z. Activation of the cold-sensing TRPM8 channel triggers UCP1-dependent thermogenesis and prevents obesity. J. Mol. Cell Biol. 2012, 4, 88–96. [Google Scholar] [CrossRef] [Green Version]
- Rossato, M.; Granzotto, M.; Macchi, V.; Porzionato, A.; Petrelli, L.; Calcagno, A.; Vencato, J.; De Stefani, D.; Silvestrin, V.; Rizzuto, R. Human white adipocytes express the cold receptor TRPM8 which activation induces UCP1 expression, mitochondrial activation and heat production. Mol. Cell. Endocrinol. 2014, 383, 137–146. [Google Scholar] [CrossRef]
- Vögler, O.; Lopez-Bellan, A.; Alemany, R.; Tofé, S.; González, M.; Quevedo, J.; Pereg, V.; Barcelo, F.; Escriba, P. Structure–effect relation of C18 long-chain fatty acids in the reduction of body weight in rats. Int. J. Obes. 2008, 32, 464–473. [Google Scholar] [CrossRef]
- Goralczyk, A.; van Vijven, M.; Koch, M.; Badowski, C.; Yassin, M.S.; Toh, S.-A.; Shabbir, A.; Franco-Obregón, A.; Raghunath, M. TRP channels in brown and white adipogenesis from human progenitors: New therapeutic targets and the caveats associated with the common antibiotic, streptomycin. FASEB J. 2017, 31, 3251–3266. [Google Scholar] [CrossRef]
- Khare, P.; Jagtap, S.; Jain, Y.; Baboota, R.K.; Mangal, P.; Boparai, R.K.; Bhutani, K.K.; Sharma, S.S.; Premkumar, L.S.; Kondepudi, K.K. Cinnamaldehyde supplementation prevents fasting-induced hyperphagia, lipid accumulation, and inflammation in high-fat diet-fed mice. Biofactors 2016, 42, 201–211. [Google Scholar]
- Yang, M.T.; Fu, J.; Wang, Y.-K.; Desai, R.A.; Chen, C.S. Assaying stem cell mechanobiology on microfabricated elastomeric substrates with geometrically modulated rigidity. Nat. Protoc. 2011, 6, 187–213. [Google Scholar] [CrossRef] [PubMed]
- Baboota, R.K.; Singh, D.P.; Sarma, S.M.; Kaur, J.; Sandhir, R.; Boparai, R.K.; Kondepudi, K.K.; Bishnoi, M. Capsaicin induces “brite” phenotype in differentiating 3T3-L1 preadipocytes. PLoS ONE 2014, 9, e103093. [Google Scholar] [CrossRef]
- Livak, K.J.; Schmittgen, T.D. Analysis of relative gene expression data using real-time quantitative PCR and the 2−ΔΔCT method. Methods 2001, 25, 402–408. [Google Scholar] [CrossRef] [PubMed]
- Clemmensen, C.; Jall, S.; Kleinert, M.; Quarta, C.; Gruber, T.; Reber, J.; Sachs, S.; Fischer, K.; Feuchtinger, A.; Karlas, A. Coordinated targeting of cold and nicotinic receptors synergistically improves obesity and type 2 diabetes. Nat. Commun. 2018, 9, 4304. [Google Scholar] [CrossRef]
- Moraes, M.N.; de Assis, L.V.M.; dos Santos Henriques, F.; Batista, M.L., Jr.; Güler, A.D.; de Lauro Castrucci, A.M. Cold-sensing TRPM8 channel participates in circadian control of the brown adipose tissue. Biochim. Biophys. Acta (BBA) Mol. Cell Res. 2017, 1864, 2415–2427. [Google Scholar] [CrossRef] [PubMed]
- Valente, A.; Carrillo, A.E.; Tzatzarakis, M.N.; Vakonaki, E.; Tsatsakis, A.M.; Kenny, G.P.; Koutedakis, Y.; Jamurtas, A.Z.; Flouris, A.D. The absorption and metabolism of a single L-menthol oral versus skin administration: Effects on thermogenesis and metabolic rate. Food Chem. Toxicol. 2015, 86, 262–273. [Google Scholar] [CrossRef]
- Zhao, L.; Zhang, X.; Shen, Y.; Fang, X.; Wang, Y.; Wang, F. Obesity and iron deficiency: A quantitative meta-analysis. Obes. Rev. 2015, 16, 1081–1093. [Google Scholar] [CrossRef] [PubMed]
- Wang, C.; Liang, X.; Tao, C.; Yao, X.; Wang, Y.; Wang, Y.; Li, K. Induction of copper and iron in acute cold-stimulated brown adipose tissues. Biochem. Biophys. Res. Commun. 2017, 488, 496–500. [Google Scholar] [CrossRef]
- Severson, D.L.; Denton, R.M.; Pask, H.T.; Randle, P.J. Calcium and magnesium ions as effectors of adipose-tissue pyruvate dehydrogenase phosphate phosphatase. Biochem. J. 1974, 140, 225–237. [Google Scholar] [CrossRef] [Green Version]
- Zemel, M.B.; Shi, H.; Greer, B.; Dirienzo, D.; Zemel, P.C. Regulation of adiposity by dietary calcium. FASEB J. 2000, 14, 1132–1138. [Google Scholar] [CrossRef]
- Yanoff, L.; Menzie, C.; Denkinger, B.; Sebring, N.; McHugh, T.; Remaley, A.; Yanovski, J. Inflammation and iron deficiency in the hypoferremia of obesity. Int. J. Obes. 2007, 31, 1412. [Google Scholar] [CrossRef]
- Prasad, A.S.; Beck, F.W.; Bao, B.; Fitzgerald, J.T.; Snell, D.C.; Steinberg, J.D.; Cardozo, L.J. Zinc supplementation decreases incidence of infections in the elderly: Effect of zinc on generation of cytokines and oxidative stress. Am. J. Clin. Nutr. 2007, 85, 837–844. [Google Scholar] [CrossRef]
- Kazi, T.G.; Afridi, H.I.; Kazi, N.; Jamali, M.K.; Arain, M.B.; Jalbani, N.; Kandhro, G.A. Copper, chromium, manganese, iron, nickel, and zinc levels in biological samples of diabetes mellitus patients. Biol. Trace Elem. Res. 2008, 122, 1–18. [Google Scholar] [CrossRef] [PubMed]
- Kawakami, T.; Hanao, N.; Nishiyama, K.; Kadota, Y.; Inoue, M.; Sato, M.; Suzuki, S. Differential effects of cobalt and mercury on lipid metabolism in the white adipose tissue of high-fat diet-induced obesity mice. Toxicol. Appl. Pharmacol. 2012, 258, 32–42. [Google Scholar] [CrossRef]
- Oz, M.; El Nebrisi, E.G.; Yang, K.-H.S.; Howarth, F.C.; Al Kury, L.T. Cellular and Molecular Targets of Menthol Actions. Front. Pharmacol. 2017, 8, 472. [Google Scholar] [CrossRef]
- Macpherson, L.J.; Hwang, S.W.; Miyamoto, T.; Dubin, A.E.; Patapoutian, A.; Story, G.M. More than cool: Promiscuous relationships of menthol and other sensory compounds. Mol. Cell. Neurosci. 2006, 32, 335–343. [Google Scholar] [CrossRef]
- Karashima, Y.; Damann, N.; Prenen, J.; Talavera, K.; Segal, A.; Voets, T.; Nilius, B. Bimodal action of menthol on the transient receptor potential channel TRPA1. J. Neurosci. 2007, 27, 9874–9884. [Google Scholar] [CrossRef] [PubMed]
- Gelal, A.; Jacob, P.; Yu, L.; Benowitz, N.L. Disposition Kinetics and Effects of Menthol*. Clin. Pharmacol. Ther. 1999, 66, 128–135. [Google Scholar] [CrossRef] [PubMed]
- Kaffenberger, R.M.; Doyle, M.J. Determination of Menthol and Menthol Glucuronide in Human Urine by Gas Chromatography Using an Enzyme-Sensitive Internal Standard and Flame Ionization Detection. J. Chromatogr. B. Biomed. Sci. App. 1990, 527, 59–66. [Google Scholar] [CrossRef]
- Martin, D.; Valdez, J.; Boren, J.; Mayersohn, M. Dermal Absorption of Camphor, Menthol, and Methyl Salicylate in Humans. J. Clin. Pharmacol. 2004, 44, 1151–1157. [Google Scholar] [CrossRef] [PubMed]
- JECFA. Menthol. In Evaluation of certain food additives and contaminants: forty-second report of the Joint FAO/WHO Expert Committee on Food Additives; World Health Organizaton: Geneva, Switzerland, 1999; pp. 57–76. [Google Scholar]


© 2019 by the authors. Licensee MDPI, Basel, Switzerland. This article is an open access article distributed under the terms and conditions of the Creative Commons Attribution (CC BY) license (http://creativecommons.org/licenses/by/4.0/).
Share and Cite
Khare, P.; Chauhan, A.; Kumar, V.; Kaur, J.; Mahajan, N.; Kumar, V.; Gesing, A.; Chopra, K.; Kondepudi, K.K.; Bishnoi, M. Bioavailable Menthol (Transient Receptor Potential Melastatin-8 Agonist) Induces Energy Expending Phenotype in Differentiating Adipocytes. Cells 2019, 8, 383. https://doi.org/10.3390/cells8050383
Khare P, Chauhan A, Kumar V, Kaur J, Mahajan N, Kumar V, Gesing A, Chopra K, Kondepudi KK, Bishnoi M. Bioavailable Menthol (Transient Receptor Potential Melastatin-8 Agonist) Induces Energy Expending Phenotype in Differentiating Adipocytes. Cells. 2019; 8(5):383. https://doi.org/10.3390/cells8050383
Chicago/Turabian StyleKhare, Pragyanshu, Aakriti Chauhan, Vibhu Kumar, Jasleen Kaur, Neha Mahajan, Vijay Kumar, Adam Gesing, Kanwaljit Chopra, Kanthi Kiran Kondepudi, and Mahendra Bishnoi. 2019. "Bioavailable Menthol (Transient Receptor Potential Melastatin-8 Agonist) Induces Energy Expending Phenotype in Differentiating Adipocytes" Cells 8, no. 5: 383. https://doi.org/10.3390/cells8050383