
Estrogen Signaling Influences Nephron Segmentation of the Zebrafish Embryonic Kidney


Department of Biological Sciences, Center for Stem Cells and Regenerative Medicine, Center for Zebrafish Research, Boler-Parseghian Center for Rare and Neglected Diseases, Warren Center for Drug Discovery, University of Notre Dame, Notre Dame, IN 46556, USA
*
Author to whom correspondence should be addressed.
Cells 2023, 12(4), 666; https://doi.org/10.3390/cells12040666
Submission received: 25 January 2023
/
Revised: 13 February 2023
/
Accepted: 16 February 2023
/
Published: 20 February 2023
(This article belongs to the Special Issue Feature Papers in "Stem Cells" 2023)
Abstract
:Despite significant advances in understanding nephron segment patterning, many questions remain about the underlying genes and signaling pathways that orchestrate renal progenitor cell fate choices and regulate differentiation. In an effort to identify elusive regulators of nephron segmentation, our lab conducted a high-throughput drug screen using a bioactive chemical library and developing zebrafish, which are a conserved vertebrate model and particularly conducive to large-scale screening approaches. 17β-estradiol (E2), which is the dominant form of estrogen in vertebrates, was a particularly interesting hit from this screen. E2 has been extensively studied in the context of gonad development, but roles for E2 in nephron development were unknown. Here, we report that exogenous estrogen treatments affect distal tubule composition, namely, causing an increase in the distal early segment and a decrease in the neighboring distal late. These changes were noted early in development but were not due to changes in cell dynamics. Interestingly, exposure to the xenoestrogens ethinylestradiol and genistein yielded the same changes in distal segments. Further, upon treatment with an estrogen receptor 2 (Esr2) antagonist, PHTPP, we observed the opposite phenotypes. Similarly, genetic deficiency of the Esr2 analog, esr2b, revealed phenotypes consistent with that of PHTPP treatment. Inhibition of E2 signaling also resulted in decreased expression of essential distal transcription factors, irx3b and its target irx1a. These data suggest that estrogenic compounds are essential for distal segment fate during nephrogenesis in the zebrafish pronephros and expand our fundamental understanding of hormone function during kidney organogenesis.
1. Introduction
The kidney is a vital organ that facilitates waste excretion, osmoregulation, and fluid homeostasis [1]. Kidney development is a complex process, giving rise to specialized epithelial functional units called nephrons [2,3]. While nephron numbers can greatly vary across species, nephron segmentation and overall function remain highly conserved in vertebrates [4,5]. Namely, the glomerulus functions to filter blood while the subsequent tubular segments modify the filtrate to assure proper secretion and reabsorption, and finally, waste is excreted through the collecting duct [6,7,8,9,10,11,12,13,14,15]. Each of the tubular segments carry out specialized tasks [8,9,10,11,12,13,14,15]. For example, the proximal convoluted tubule is responsible for secreting ammonia, which functions to adjust filtrate pH [8,9,10,11,12,13,14,15]. Later segments, such as the distal convoluted tubule, facilitate sodium and chloride reabsorption [8,9,10,11,12,13,14,15]. While the function and expression signatures of each segment are becoming increasingly better characterized [16], the molecular cues required to guide differentiation of these discrete nephron cell types remain poorly understood.
The zebrafish embryonic kidney, or pronephros, is highly amenable to parsing out these genetic components for several reasons. The architecture of the pronephros is simple, comprised of only two nephrons [17]. The nephrons possess a similar array of functional segments that contain cell types which are analogous to the mammalian nephron [18]. This is consistent with a high degree of genetic conservation between zebrafish and humans [5,19,20]. Coupled with rapid ex utero development, the zebrafish serves as a suitable model for high-throughput genetic and biochemical screens, specifically in the context of renal development to study renal progenitor patterning [21,22,23,24,25,26]. Using the zebrafish, for example, studies have identified novel regulators of nephron segmentation, including the Iroquois transcription factor Irx3b, which is essential for distal early (DE) segment formation [27]. A recent forward genetic screen identified the transcription factor AP-2 alpha (Tfap2a) and its downstream target irx1a as key factors in the DE terminal differentiation program [28,29]. Formation of the distal late (DL) segment is known to involve several transcription factors and signaling pathways [30,31,32,33,34,35,36,37]. Even with these advances, there remain significant gaps in our understanding of the mechanisms that drive progenitor cell fate decisions.
In an effort to uncover novel regulators of nephron segmentation, a recent study conducted a high-throughput screen of known bioactive molecules [38,39]. Results from this screen suggested that 17-beta (β) estradiol (or E2, the most dominant form of estrogen in vertebrates) could be a player in nephron development [39]. Here, we follow-up with these results, and report that indeed, estrogen signaling contributes to the processes of nephron segmentation. More specifically, E2 operates throughout development, as early as the 20 somite stage (ss), and contributes to DE/DL segment patterning. From a screen of selective estrogen receptor modulators (SERMs) and genetic studies, we found that E2 specifically operates through esr2b to promote DE fate at the expense of the DL. Finally, we found that esr2b works upstream of essential transcription factors, irx3b and irx1a, to confer distal cell fate. Together, these findings implicate estrogen signaling as an essential regulator of nephron segmentation.
2. Materials and Methods
2.1. Ethics Statement and Zebrafish Husbandry
The Center for Zebrafish Research at the University of Notre Dame maintained the zebrafish used in these studies and experiments were performed with the approval of the University of Notre Dame Institutional Animal Care and Use Committee (IACUC), under protocol numbers 19-06-5412, 20-09-6240, and 22-07-7335.
2.2. Animal Models
Tübingen strain wild-type (WT) zebrafish were used for the reported studies unless otherwise noted. The esr2b mutant line, Uab127, was graciously provided by Dr. Gorelick’s lab at the University of Alabama at Birmingham [40,41]. Zebrafish were raised and staged as described [42]. For all experiments, embryos were incubated in E3 medium at 28 °C until the desired developmental stage, anesthetized with 0.02% tricaine, and fixed using 4% paraformaldehyde/1x PBS (PFA) [43,44]. Embryos were analyzed before sex determination, so we cannot report the effect of sex and gender in the context of this study.
2.3. Whole Mount and Fluorescent in situ Hybridization (WISH, FISH)
WISH was performed as previously described [45,46,47,48,49] with antisense RNA probes, either digoxigenin-labeled (cdh17, odf3b, slc20a1a, trpm7, slc12a1, slc12a3, kcnj1a.1, tbx2b, irx1a, irx3b) or fluorescein-labeled (smyhc), using in vitro transcription from IMAGE clone templates, as previously described [18,27]. FISH was performed as described using TSA Plus Fluorescein or Cyanine Kits (Table 1) [45,46,47,48,49]. For gene expression studies, every analysis was performed in triplicate for each genetic model with sample sizes of n > 20 per replicate.
2.4. Immunofluorescence (IF)
2.5. Chemical Treatments
Chemical treatments were completed as previously described, with chemicals as listed in Table 1 [34,38,39]. Chemicals were dissolved in DMSO to make a 10 mM stock solution. Stocks were aliquoted and stored at −80 °C. Aliquots were thawed at room temperature and protected from light. Working solutions were diluted in E3 and distributed to 6- or 12-well plates. Chemical treatments were completed beginning at the shield stage (6 h post-fertilization (hpf)) until the 24 hpf stage, unless otherwise noted. We chose to treat at the shield stage, as the animals were already undergoing gastrulation. Thus, this timepoint prevents interference with the onset of gastrulation. The dose for each chemical was decided by treating at doses consistent with previous studies or slightly increased concentrations to maximize penetrance while minimizing morphological defects. Animals treated with E2 exhibited distal segmentation phenotypes at both 20 µM and 25 µM. As most animals had a curved body axis at 25 µM, we proceeded with 20 µM treatments. We treated with 400 µM DPN, 400 µM MPP, and 75 µM PPT, however the animals did not exhibit changes in distal nephron segmentation. When exposed to higher doses, the animals exhibited morphological defects or mortality. PHTPP exhibited the highest penetrance of distal segmentation without morphological defects at 18 µM. Xenoestrogens genistein and ethinylestradiol exhibited the highest penetrance of distal segmentation without morphological defects at 20 µM. Treatments were conducted in triplicate with at least n > 20 embryos per replicate at various doses (Table 2). All experiments were conducted with a DMSO vehicle control. DMSO control animals are demarcated as “WT” in all graphics and schematics.
2.6. Genetic Models
Antisense morpholino oligonucleotides (MOs) were obtained from Gene Tools, LLC (Philomath, OR, USA). MOs were solubilized in DNase/RNase-free water to generate 4 mM stock solutions, which were stored at 20 °C. Zebrafish embryos were injected at the 1-cell stage with 5 nL of diluted MO. Optimal dosage was determined by previously published doses and our own experience [53]. esr1 was targeted with 5′–catgtaaaacaggctggtcacCTTG–3′ (0.4 mM). Esr2a was targeted with 5′–agagagtcttacCTTGTATACTC–3′ (0.8 mM). Esr2b was targeted with 5′–ttgaccatgagcattacCTTGAATG–3′ (0.8 mM) [53]. Uab127 embryos were genotyped with the forward primer 5′–GTCCCGCTTAGTCCCACAAT–3′ and the reverse primer 5′–TGACAGCTGCCACCTAAAGA–3′ [54].
2.7. Image Acquisition
A Nikon Eclipse Ni with a DS-Fi2 camera was used to image WISH samples and live zebrafish. Live zebrafish were mounted in methylcellulose with trace amounts of tricaine present. IF and FISH images were acquired using a Nikon C2 confocal microscope or a Nikon A1R confocal microscope.
2.8. Quantification and Statistical Analysis
Each experiment was completed in a minimum of triplicates. Analysis of all experimental work was performed in a blinded manner. From these measurements, an average and standard deviation (SD) were calculated, and t-tests or ANOVA tests were completed to compare control and experimental measurements using GraphPad Prism 9 software. Statistical details for each experiment are located in the corresponding figure legend.
3. Results
3.1. Exogenous E2 Treatment Alters Nephron Segmentation
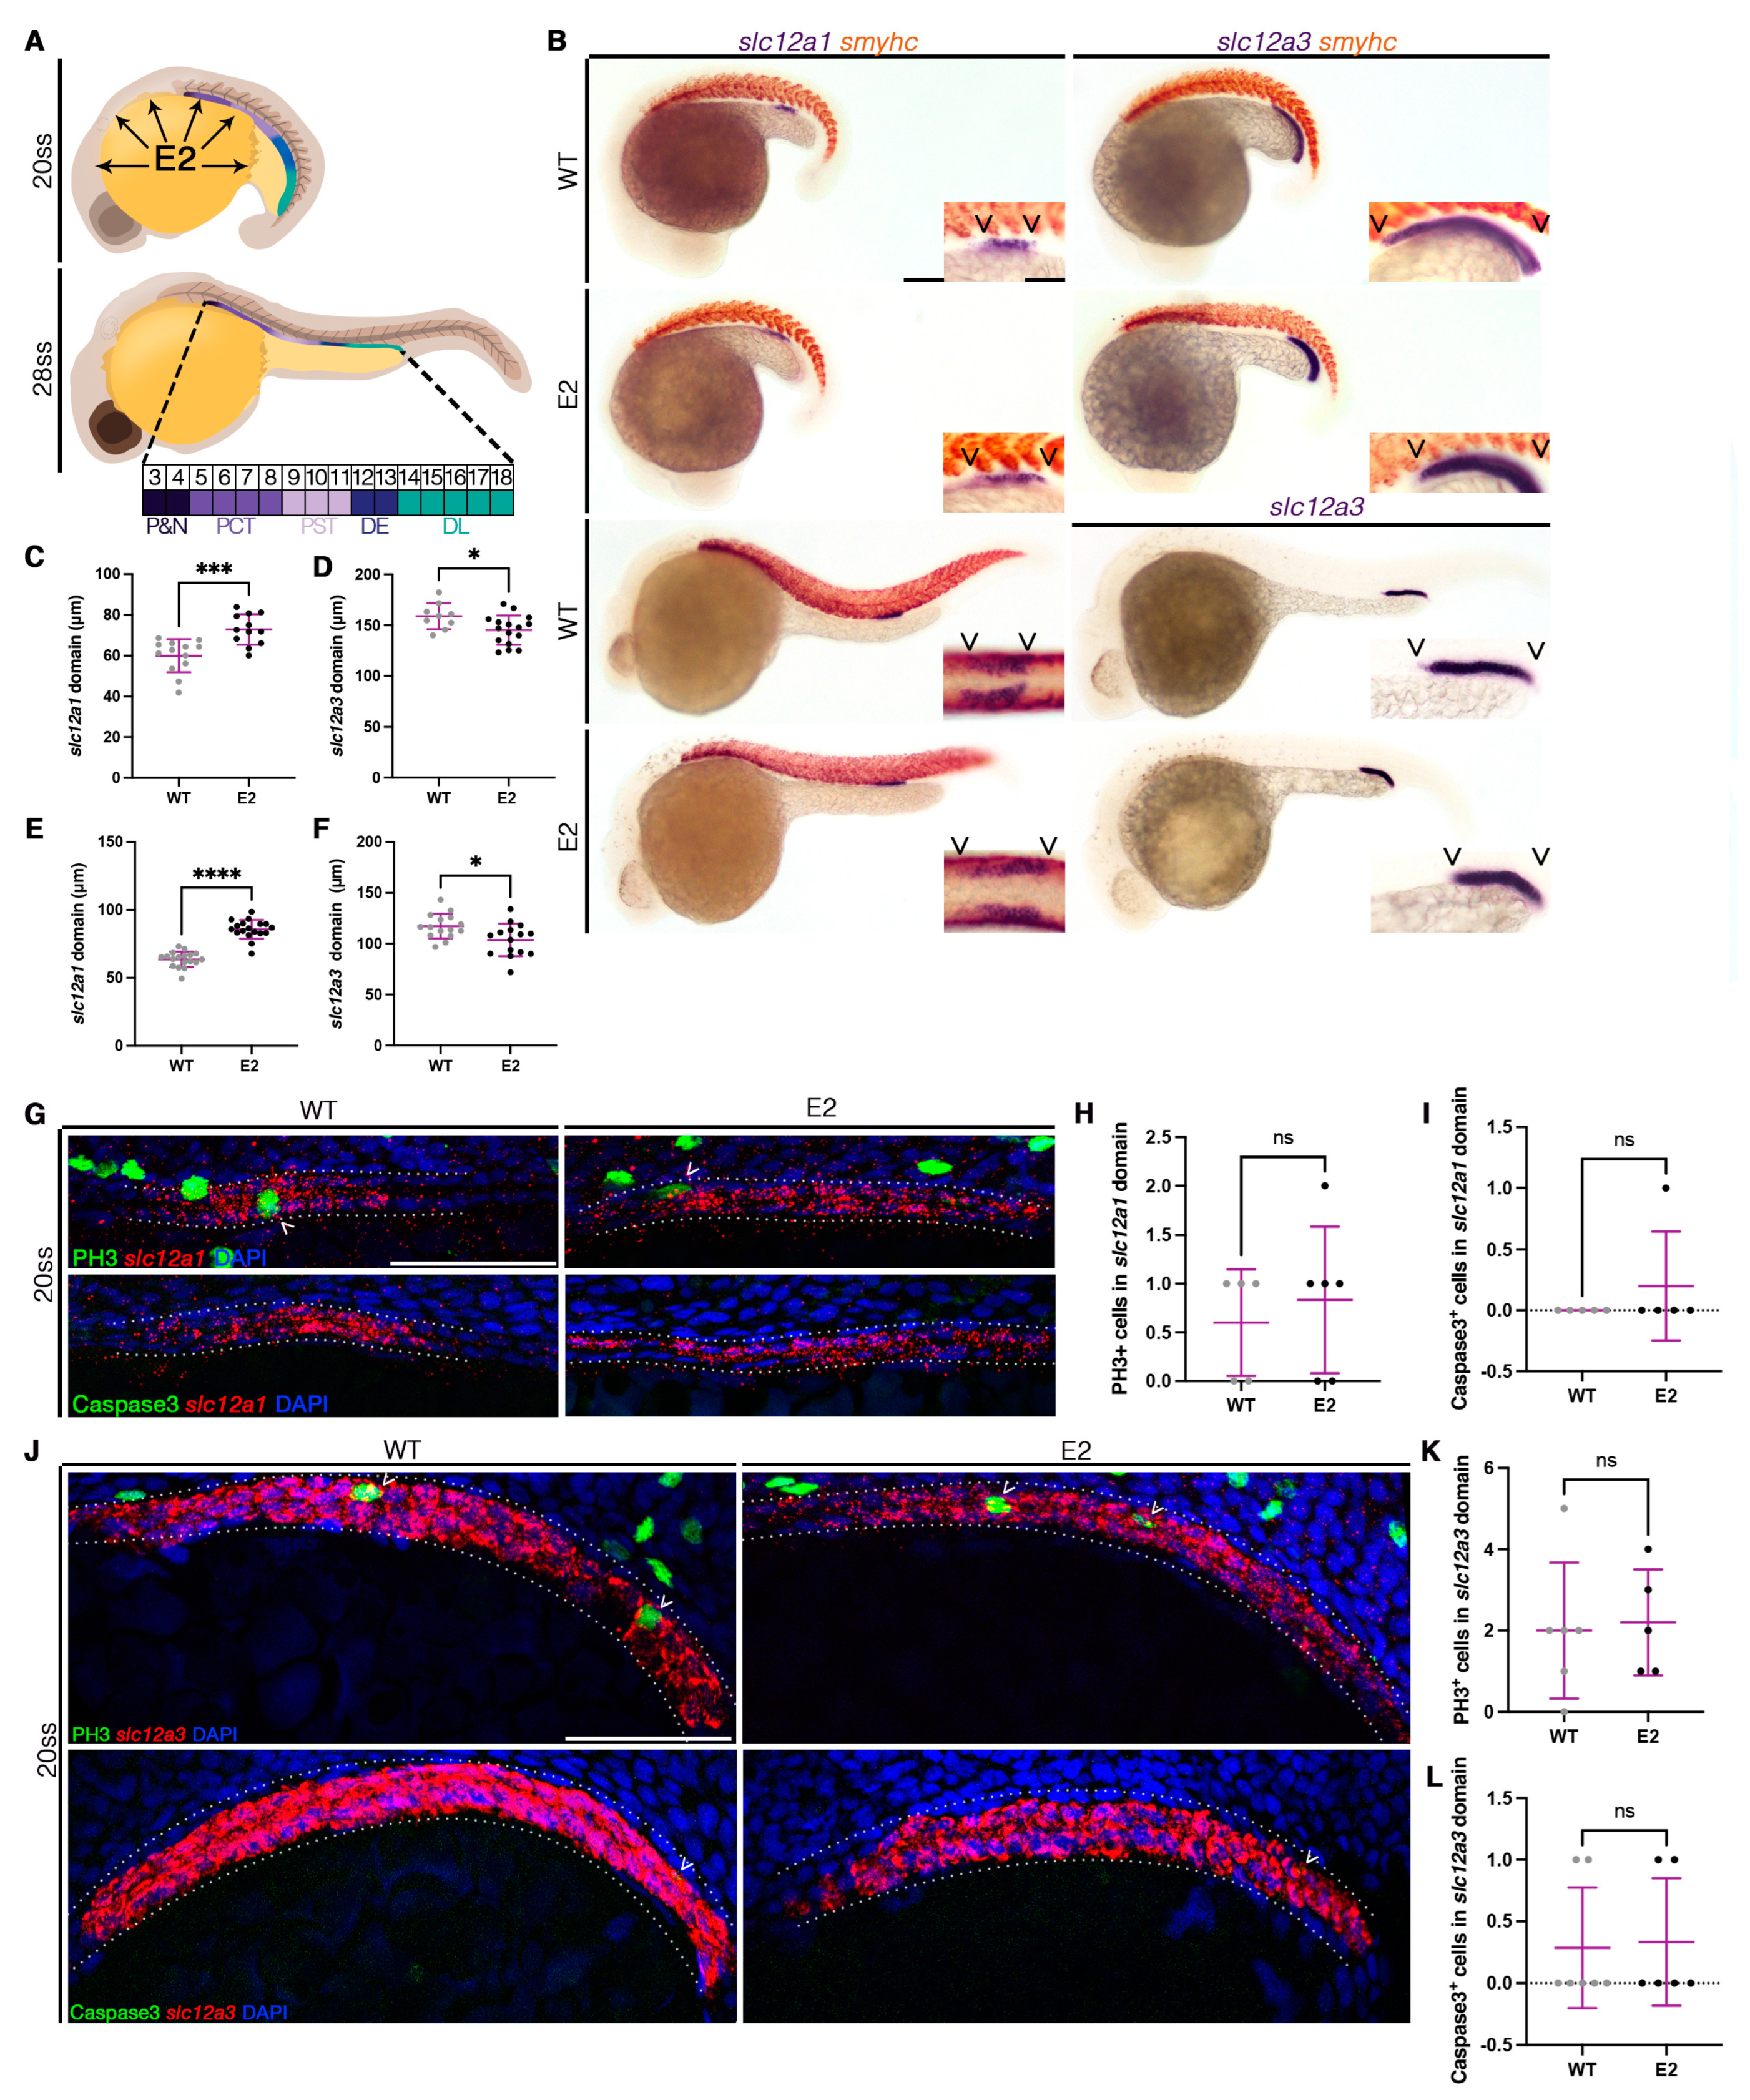
The zebrafish has long been established as a valuable high-throughput model to interrogate various biological processes using small molecules [38,55,56,57]. The zebrafish is particularly amenable to studying kidney development, as the functional units, called nephrons, are comprised of highly conserved segments that are patterned by 24 h post-fertilization (hpf). In a chemical screen using known bioactives, researchers identified potential regulators contributing to nephron segmentation [39]. Among the screen hits, 17-beta estradiol (E2, the most dominant form of estrogen in vertebrates) treatment resulted in changes in segmentation [39]. This was particularly interesting, as previous work has established that estrogen response elements (ERE) are active in the pronephros at 18 h post-fertilization (hpf) [58]. Furthermore, estrogen is present in the yolk, at a rate almost 7 times higher than the rest of the animal [58]. We therefore hypothesized that this potent chemical diffuses into the adjacent intermediate mesoderm, thereby influencing pronephric development, specifically segmentation of the nephron by 24 hpf (Figure 1A). To test this, we examined if nephron segmentation was influenced by exogenous E2. We treated embryos at different doses of E2 beginning at the shield stage, then allowed animals to develop to the stage of interest. At an E2 dosage of 20 µM, animals exhibited changes in the distal nephron as early as the 20 ss (Figure 1B). Specifically, the DE segment expanded (Figure 1C) while the DL was shortened (Figure 1D). This phenotype persisted to the 28 ss when the nephron segments were initially patterned (Figure 1B,E,F).
To confirm that these changes were a true change in cell identity rather than changes in slc12a1 or slc12a3 independently, we used additional markers for the DE and DL (kcnj1a.1 and tbx2b, respectively). Indeed, we found that the observed DE and DL domain changes were recapitulated with these alternative cell type markers (Figure S1). Additionally, treatment of E2 did not result in changes in the PCT (slc20a1a) or PST (trpm7) (Figure S1). Additionally, the time of addition did not appear to affect the penetrance of the observed phenotypes (Figure S2). However, we chose to continue with treatment at 6 hpf for subsequent treatments, as this time is most conducive to a high-throughput workflow. We also treated animals at increased concentrations, including 25 µM. Overall, the increased concentration phenocopied those observe at 20 µM, including increased DE and decreased DL (Figure S3). Animals treated at 25 µM did not exhibit changes in other cell types or the overall nephron length, suggesting that the observed phenotypes were segment-specific rather than affecting the formation of the entire tubule (Figure S3). However, the 25 µM treatment did result in greater morphological differences, such as body curvature (Figure S3). Therefore, we continued with treatments at 20 µM as we observed the highest penetrance of phenotypes, while still producing animals with overall morphologically normal-appearing body plans.
As the observed changes in DE and DL formation may be caused by alterations in cell dynamics or changes in cell fate decisions, we next investigated cell death and proliferation in the segments of interest. We chose to evaluate these characteristics at the 20 ss, the earliest time point at which we observed altered segmentation. Interestingly, there was no significant difference in proliferating cells, as marked by Phospho-Histone H3 (PH3) in the DE segment (Figure 1G,H). Additionally, no changes in cell death as marked by activated Caspase3 were detected (Figure 1G,I). Similarly, there was no significant difference in proliferating cells nor cell death in the DL segment (Figure 1J–L). These data suggest that exogenous E2 treatment does not affect cell dynamics, but rather, influences nephron patterning, specifically of the DE and DL.
3.2. Xenoestrogen Treatment Recapitulates E2 Pronephros Segment Phenotypes
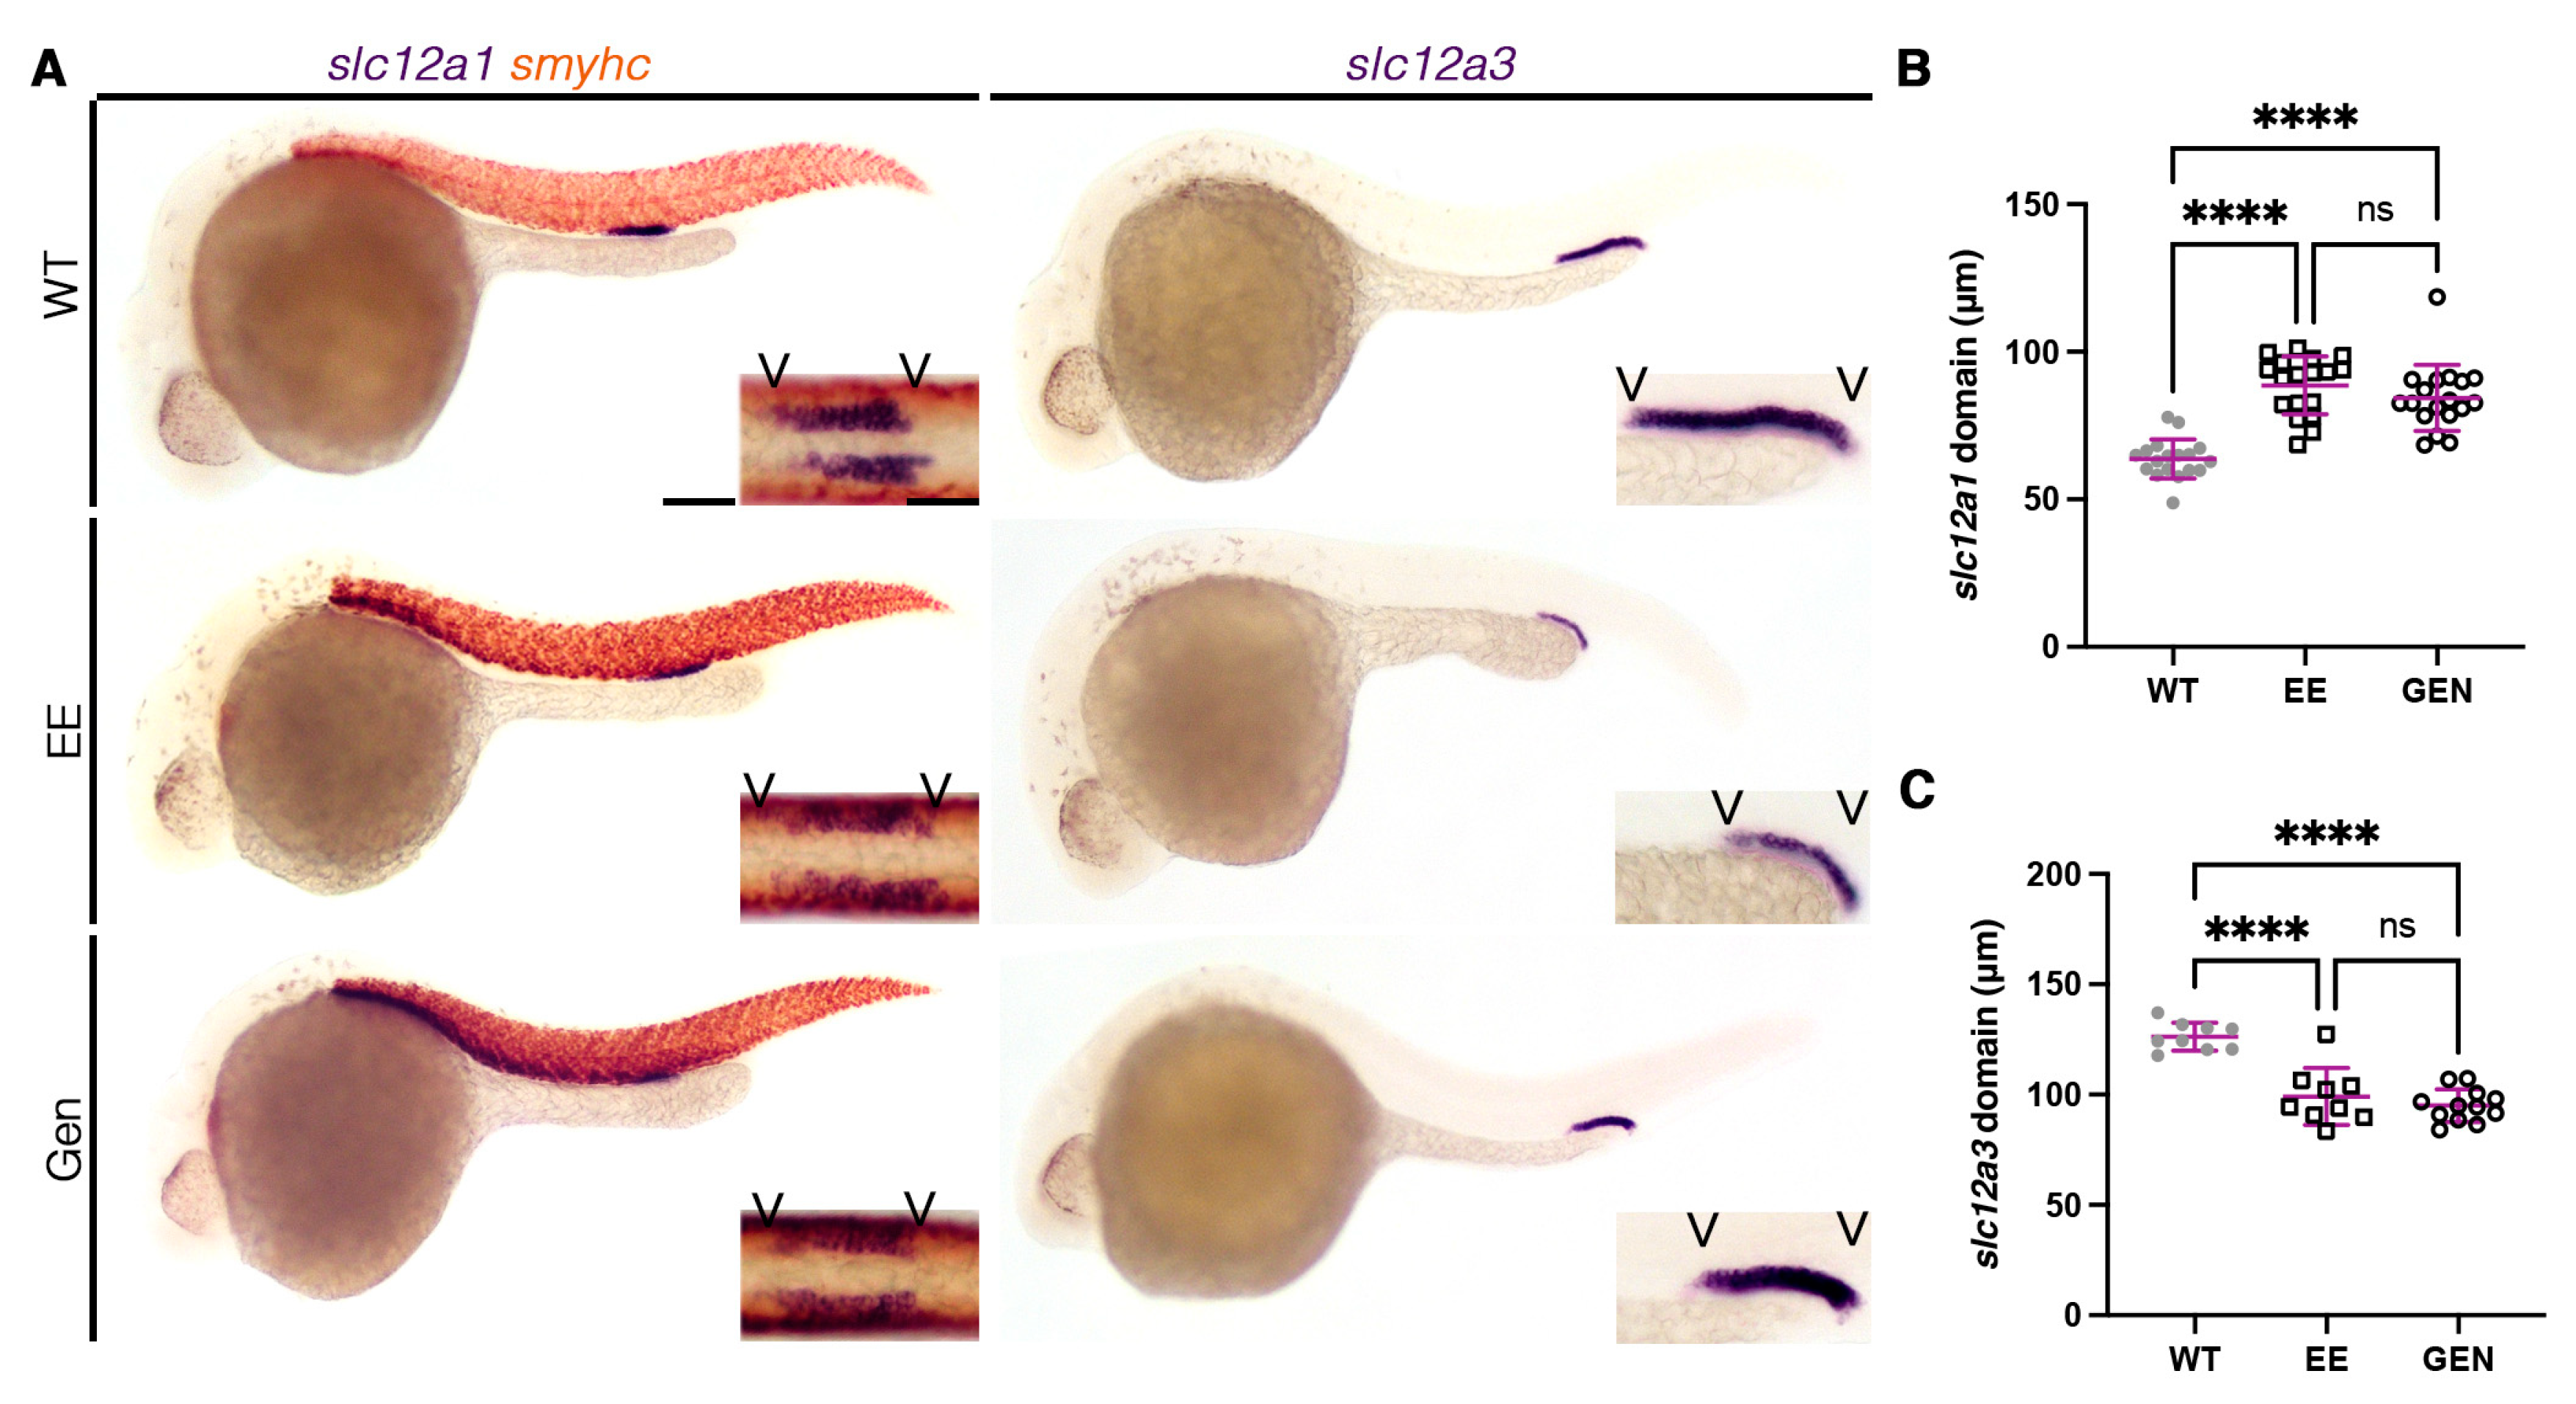
Xenoestrogens are potent teratogens that have been previously shown to activate E2 signaling pathways similarly to E2 [58,59]. We treated with three compounds: genistein, found in soy products, ethinylestradiol, commonly used in contraceptives, and bisphenol A (BPA), a hardening agent in plastic. As seen with E2 treatment, 20 µM of ethinylestradiol and genistein resulted in an increase in the DE domain (Figure 2A,B). These two xenoestrogens also caused a coordinated decrease in the DL domain (Figure 2A,C). Similar to that of E2, treatment of ethinylestradiol and genistein also altered the expression of other DE and DL markers (Figure S4C–E), while the more proximal segments remained unchanged (Figure S4F–H). Unlike ethinylestradiol and genistein, BPA did not affect the DE domain length (Figure S4A,B).
To assure the drug was not degraded, we evaluated other previously identified phenotypes induced by BPA, such as otolith malformations [60]. Indeed, 50 µM treatment of BPA induced altered otolith formation, suggesting that while the chemical was active, it does not phenocopy E2 in the kidney (Figure S4). BPA has been previously shown to bind preferentially to Esr1 in the zebrafish and exhibits less potent phenotypes in other tissues, suggesting that the lack of a distal phenotype may be due to chemical–receptor interactions [58,59]. Nonetheless, estrogen signaling, regardless of its activating agent (E2, ethinylestradiol, or genistein), appears to influence distal nephron segmentation.
3.3. E2 Acts through Esr2b to Confer Distal Segment Changes in the Nephron
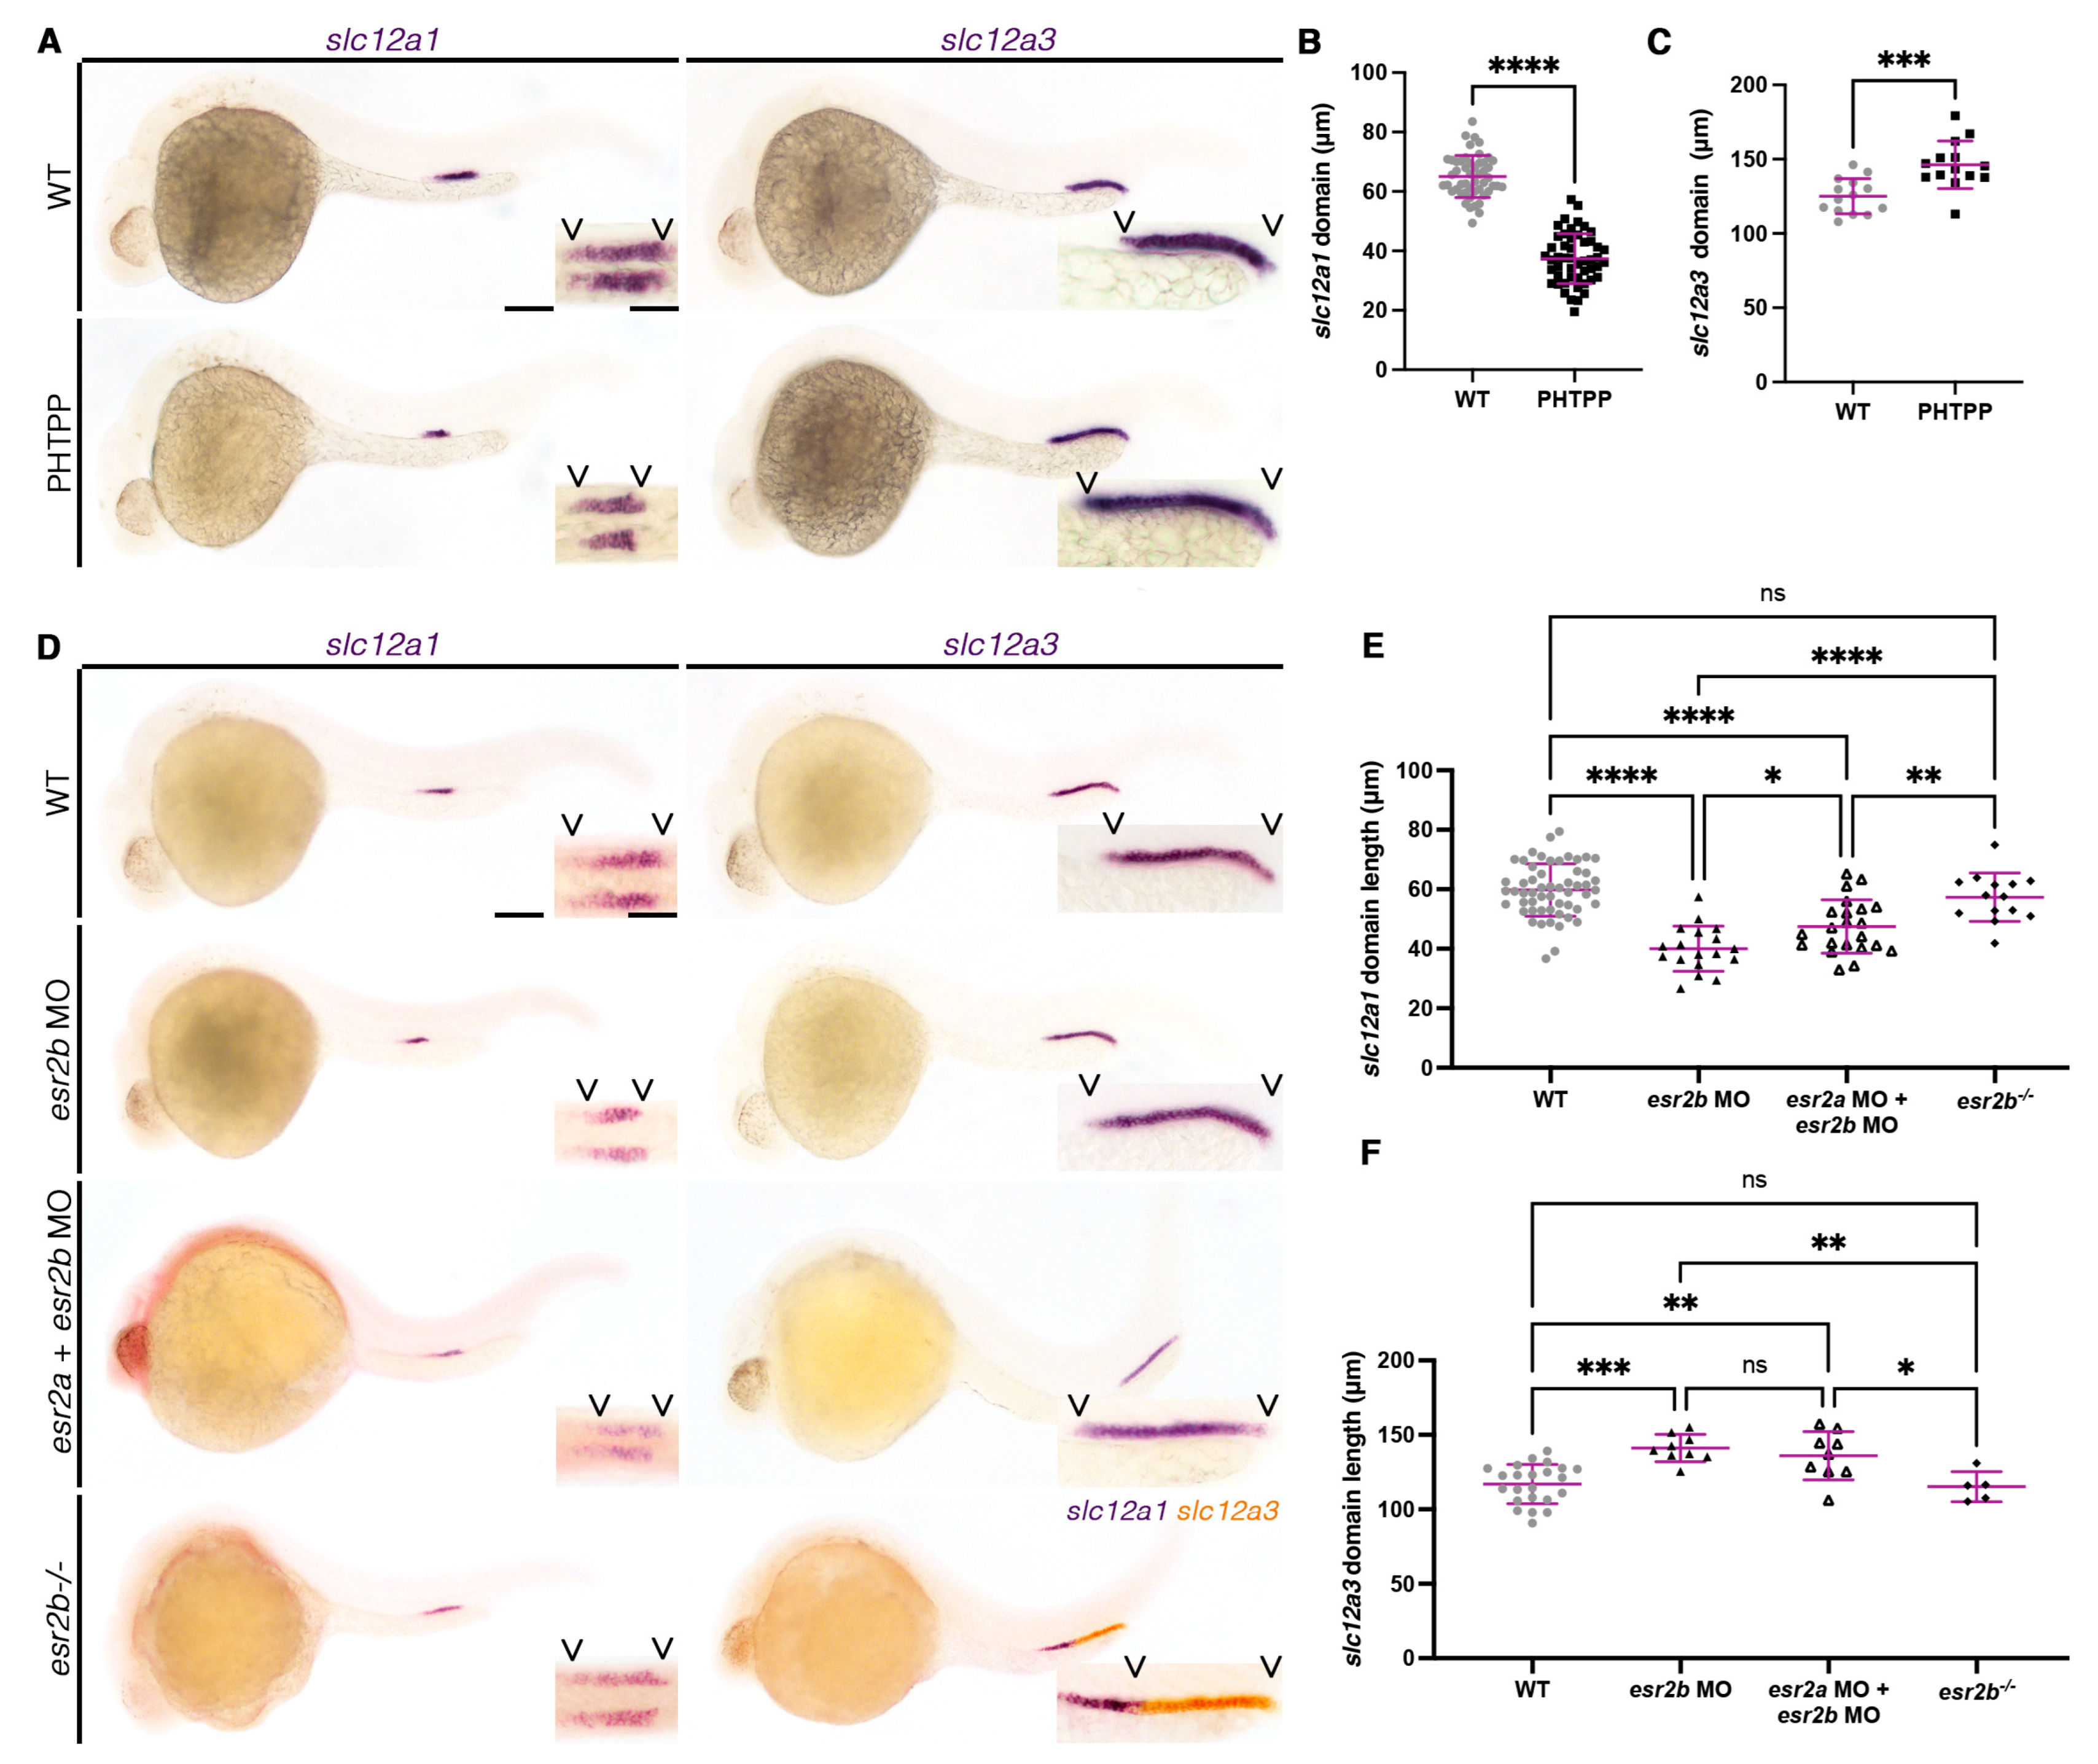
As ethinylestradiol, genistein, and E2 appeared to alter the distal cell fate, we next interrogated the mechanism by which this occurs. Since EREs are active in the nephron early in development, we specifically explored estrogen receptors that operate as ligand-activated transcription factors. In the zebrafish, this includes Esr1, Esr2a, and Esr2b. We first used a targeted chemical screen of selective estrogen receptor modulators (SERMs), including MPP (Esr1 antagonist), PPT (Esr1 agonist), PHTPP (Esr2 antagonist), and DPN (Esr2 agonist). From this screen, an 18 µM treatment of PHTPP, a pan-antagonist of Esr2a and Esr2b, resulted in a decrease of the DE domain and an increase in the DL (Figure 3A–C). Interestingly, DPN, the putative pan-agonist for Esr2a and Esr2b, did not result in an increase in the DE domain (Figure S5). While DPN has been shown to clearly antagonize human ESR2, recent studies have revealed that subtle differences exist between the activation of ESR2 in humans and Esr2a and Esr2b in zebrafish, specifically regarding activation by SERMs [59]. Interestingly, DPN has been shown to preferentially activate Esr1 over Esr2a or Esr2b in zebrafish, which may have prevented an observable phenotype in the DE [59]. Similarly, neither MPP nor PPT resulted in altered distal segments (Figure S5A,B). We further confirmed that PHTPP was specifically affecting the distal segments by measuring the kcnj1a.1 and tbx2b domains, alternate markers for the DE and DL, respectively. Similar to slc12a1, the kcnj1a.1 domain was significantly decreased while the tbx2b domain recapitulated the slc12a3 domain, which was significantly increased (Figure S6). Additionally, the proximal segments (PCT and PST) remained unchanged (Figure S6). Together, the results from the SERM screen suggest that estrogen signaling may be acting via esr2a or esr2b in nephron segmentation.
To confirm the results of the SERM screen and further understand which receptor may be the primary player in the kidney, we used morpholinos targeting esr1, esr2a, and esr2b to knockdown each receptor, respectively. Each of these tools was previously validated to interfere with splicing for each specific target, while off-target alterations in splicing were not observed [53]. Knockdown of esr1 and esr2a did not result in changes to the DE (Figure S7). However, esr2b deficiency resulted in a decreased DE, and increased the length of the DL, which recapitulates the PHTPP phenotype, though this occurred at a decreased penetrance compared to PHTPP treatment (Figure 3D–F). We hypothesized that esr2b may be the major player in distal cell development. However, it is plausible that esr2a may serve a redundant role. To address this, we knocked down esr2a and esr2b in combination. The double-deficient animals did not exhibit more severe differences in DE or DL segmentation compared to the single esr2b-deficient animals (Figure 3D–F). This led us to hypothesize that Esr2a and Esr2b likely do not function redundantly in the context of conferring nephron cell fate.
While morpholinos offer valuable insight to genetic mechanisms in development, we were also interested in exploring the role of esr2b in the context of a stable genetic mutant. We obtained the esr2buab127 line, which contains a 5 base pair deletion resulting in a premature stop codon before the DNA-binding domain [40,41]. Interestingly, esr2b−/− animals did not exhibit significant changes in the DE or DL domains (Figure 3D–F). From pairwise matings of esr2b+/− parents, none of the progeny, including heterozygotes, were significantly different from one another in the DE nor the DL (Figure 3, Figure S7). However, we hypothesize that this is due to mature and robust maternally deposited transcripts encoding Esr2b, which have been previously detected [58]. Due to a previously reported fertility defect in homozygous esr2b−/− females, we could not evaluate maternal zygotic mutant embryos [40]. However, the consistency between PHTPP treatment and esr2b MO is consistent with our hypothesis that estrogen signaling influences distal segmentation.
3.4. Alterations in Estrogen Signaling Associated with Changes in Expression of Distal Segment Transcription Factors Irx3b and Irx1a in the Pronephros
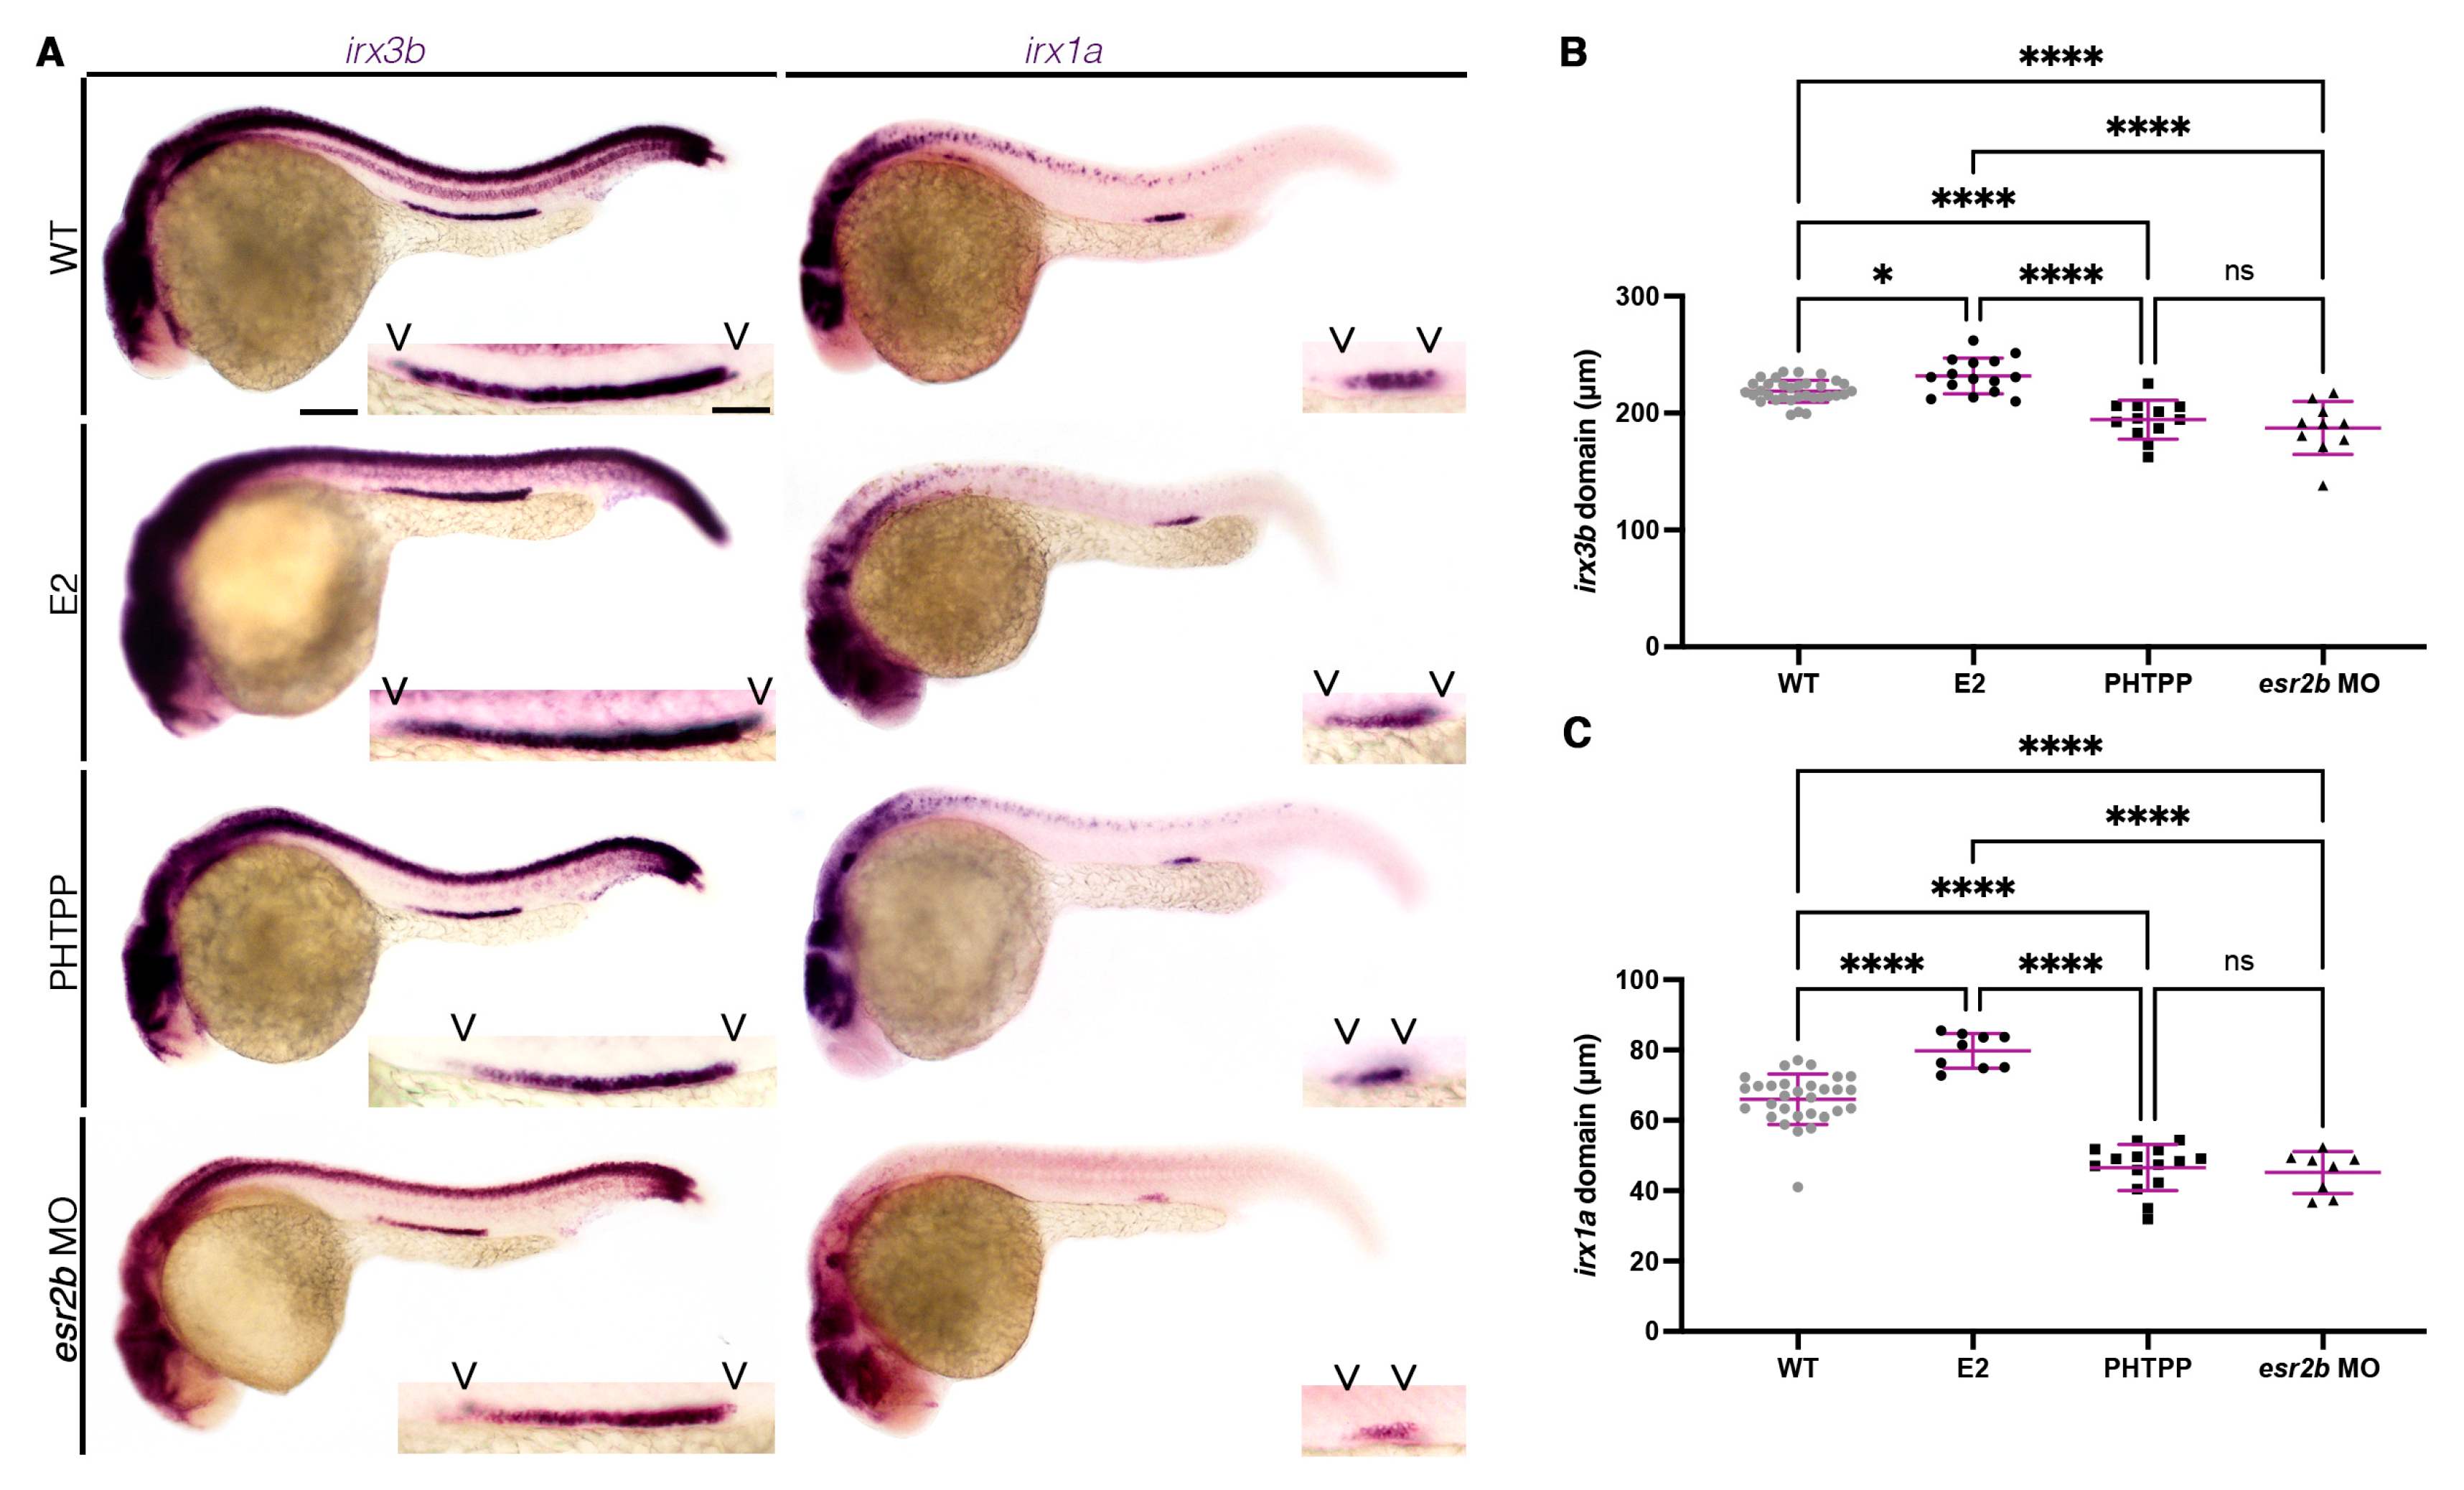
We next sought to explore the mechanism by which E2 and esr2b act in zebrafish embryonic nephrogenesis. Previous work has established several roles for the transcription factor Irx3b and its downstream target, Irx1a, in nephron segmentation [27,28,29,61,62,63,64,65,66]. Specifically, in the zebrafish, Irx3b is essential for adoption of the DE lineage identity, where downstream expression of Irx1a is sufficient to support adoption of this identity [27,28]. Using WISH, we interrogated the effect of E2 and PHTPP on irx3b expression, respectively. Interestingly, we found that E2 resulted in an expansion of the irx3b pronephros domain at both 20 µM and 25 µM doses (Figure 4A–C, Figure S3). Conversely, PHTPP exhibited the opposite phenotype with a truncation of the irx3b domain (Figure 4A–C, Figure S3). Similarly, E2 treatment expanded the irx1a pronephros domain, while PHTPP decreased irx1a expression. Together, these data suggest that E2 signaling acts through Esr2b, upstream of Irx3b and Irx1a, to determine distal nephron segmentation.
4. Discussion
While traditionally associated with women’s health, estrogen signaling has long been established as a regulator of developmental processes. Outside of gonad development, estrogen signaling also influences the development of the brain [67,68,69,70,71,72], hematopoietic stem cell niche [58,73], kidney [74,75], prostate and lung [76], among others [77]. The primary ligand of estrogen signaling in vertebrates is 17β-estradiol (E2), which can bind three receptors in mammals (ESR1 (ERa), ESR2 (ERb), and GPER) and four receptors in zebrafish (Esr1, Esr2a, Esr2b, and Gper). Notably, the highly conserved functional domains (DBD and LBD) have sequence homology upwards of 70% between zebrafish and humans [75]. Furthermore, zebrafish receptors are activated in a similar manner to their human counterparts by the same ligands [59]. For these reasons, along with their powerful genetics and tractability for developmental studies, zebrafish have been a useful model for expanding our understanding of estrogen signaling in ontogeny. The results from a recent bioactive screen completed by our lab were of particular interest, as they suggested for the first time that estrogen may play an explicit role in the process of nephron segmentation [39]. These initial observations were only superficial, however, and required additional follow-up studies in order to elucidate the molecular details.
Here, we have used the zebrafish as a model for nephrogenesis to interrogate the role of estrogen signaling, with a focus on E2 and early segmentation during the formation of the first kidney, or embryonic pronephros. We found that exogenous E2 alters DE and DL segment domains without changing cell death or proliferation in those areas, suggesting that estrogen signaling contributes to the patterning of renal progenitors that generate these populations. This is rather surprising, as estrogen and related derivatives have been shown to inhibit proliferation in the brain [78]. In contrast, our findings suggested that E2 signaling may be controlling cell fate decisions, which has also been observed in other tissues [54]. For example, in the liver, hepatocytes and biliary epithelial cells arise from a common hepatoblast progenitor, and researchers found that E2 acting specifically through the receptor Esr2b promoted commitment to the hepatocyte fate both in zebrafish and human hepatoblast culture [54]. Previous studies have also demonstrated that estrogen regulates key transporter expression and function (Aquaporin2) in the kidney, which is consistent with our observations in altered transporters slc12a1 and slc12a3 expression [79]. Though, it remains unknown if these changes in transporter expression have an effect on kidney physiology.
Additionally, consistent with prior work, we found that xenoestrogens ethiniylestradiol and genistein act similarly to E2 [58,59]. Xenoestrogens, or ‘foreign’ estrogens, are widely found throughout our environment and in man-made products such as plastics. Similar enough in structure to mimic naturally occurring estrogen, they can bind to estrogen receptors and induce potentially harmful outcomes, such as birth defects. Thus, elucidating the effects of these compounds is relevant to understanding environmental factors of conditions such as congenital anomalies of the kidney and urinary tract (CAKUT) [80,81]. Our work emphasized the ability of xenoestrogens to elicit potent effects on developing tissues.
Next, our targeted SERM screen further suggested that either Esr2a or Esr2b was responsible for the segmentation changes, as PHTPP resulted in a decreased DE and increased DL. Only knockdown of esr2b recapitulated the PHTPP phenotype, leading us to hypothesize that Esr2b is the major player for estrogen signaling in the embryonic kidney. Considering that the Irx family of transcription factors, specifically irx3b and its downstream target irx1a, have been shown to regulate DE cell fate, we next investigated if exogenous E2 or inhibition of Esr2 signaling affected their relative expression domains. Indeed, E2 expanded both irx3b and irx1a domains, while PHTPP treatment resulted in a truncation. Therefore, we hypothesize that E2 signaling works upstream of these factors (Figure 5).
Interestingly, we did not observe a segmentation phenotype in esr2b−/− animals. This is likely due to maternally deposited transcripts in the early embryo. Previous work has established that both esr2a and esr2b expression drastically decrease shortly after fertilization, which is consistent with maternal deposition [58]. Due to the infertility of esr2b−/− females, we are unable to test this with a stable genetic line. Further, the normal distal segments of esr2b−/− animals may be, in part, due to genetic compensation from other estrogen receptors, a common occurrence in stable genetic mutants [82]. Considering our findings, future directions may be interested in the exact mechanism of E2 segmentation for regulation. Here, we suggest candidates irx3b and irx1a, but it is unknown if Esr2b directly binds the promoter of either of these factors or perhaps as a coactivator for their respective downstream targets. For this reason, co-immunoprecipitation of Esr2b followed by sequencing may be of particular interest.
Additionally, we chose to focus on nephron segmentation specifically, considering how little is known about the role of estrogen signaling in this process. There have been exciting, continued advances in our understanding of nephron segment patterning in recent years [83,84]. The field has made important discoveries about the landscape of kidney cell types, their expression profiles, and changes in various disease states [16]. Nevertheless, many knowledge gaps remain. For example, the complex interplays between critical genes are not fully understood. The present study illuminates a role for estrogen signaling, but much more research is needed in order to delineate how the activities of this pathway interrelate to the other genetic mechanisms that influence the processes of nephron segmentation.
Future studies may also be interested in how continued E2 treatment through early larval stages affects mesonephric branching. Long-term exposure of E2 and similar estrogenic compounds has been noted to cause morphological defects in zebrafish larva, as we observed in our studies as well, so it is likely that animals would display kidney defects in this experiment [85]. Other studies, however, treated at lower concentrations of estrogen modulators for longer periods of time and have avoided gross morphological deficiencies [75,86]. Interestingly, when embryos are exposed to low concentrations of E2 followed by microarray analysis, researchers found transcriptomic changes in the renal tissue at 3 dpf [75]. The upregulated genes found in this study span various functions, including solute transport, ATP binding, and kinase activity, and many localize to the DE region. While additional studies are required to parse out if these transcriptional changes identified in whole-body lysates confer changes to cellular identity in the kidney, these results still point to the ability of estrogen signaling to modulate pronephric expression profiles. Furthermore, studies regarding the effects of acute versus chronic estrogen exposure may elucidate the nature of these transcriptional changes.
5. Conclusions
Embryonic E2 exposure is highly regulated during gestation, though additional estrogenic compounds may be present depending on the environment. In particular, models of oral contraception have been shown to disrupt fetal development [87]. However, the effects of early estrogen exposure may span beyond early development. For example, even transient exposure of estrogenic compounds can alter osteoclast formation into adulthood [88]. Long-term effects may be due to alterations in epigenetics, as gestational administration of E2 can affect DNA methylation even into adulthood [89]. In addition to the long-lasting phenotypes resulting from E2 exposure in other tissues, estrogenic compounds have also been noted as potential therapeutics in various kidney disorders. In proliferative kidney diseases of fish, ethinyl estradiol exposure attenuated disease progression [90]. Estrogen has also mitigated kidney ischemia and reperfusion injury by activating metabolic pathways through PPARγ [91,92]. Estrogen-based hormone replacement in postmenopausal patients also appears to ameliorate kidney dysfunction and slow the progression of chronic kidney disease symptoms [93,94]. Interestingly, estrogen inhibition with tamoxifen also had beneficial effects, as treatment reduced renal fibrosis in human and rat kidneys [95]. Our current study further underscores the need to understand the mechanism by which estrogenic compounds activate these changes in renal tissue. Estrogen, in its various forms, may be reno-protective or damaging, but the fundamental observations reported here are essential in taking a step towards elucidating the role of hormonal signaling in the kidney.
Supplementary Materials
The following supporting information can be downloaded at: https://www.mdpi.com/article/10.3390/cells12040666/s1, Figure S1: Further characterization of nephron segment development in E2-treated zebrafish embryos. Figure S2: Assessment of DE segment development following E2 treatment with different times of addition in zebrafish embryos. Figure S3: Characterization of pronephros development following exposure to 25 µM E2. Figure S4: Further characterization of nephron segment development in xenoestrogen-treated zebrafish embryos. Figure S5: Selective estrogen receptor modulators MPP, PPT, and DPN have no effect on DE segment development in the zebrafish pronephros. Figure S6: Effects of Esr2 antagonist PHTPP on nephron segmentation. Figure S7: Evaluation of DE segment development following esr1 and esr2 knockdown.
Author Contributions
Conceptualization, H.M.W. and R.A.W.; methodology, H.M.W., A.E.G. and R.A.W.; validation, H.M.W., A.E.G., M.R.P. and L.A.; formal analysis, H.M.W., A.E.G., M.R.P., L.A. and R.A.W.; investigation, H.M.W., A.E.G. and L.A.; resources, H.M.W. and R.A.W.; data curation, H.M.W., A.E.G., M.R.P. and L.A.; writing—original draft preparation, H.M.W. and R.A.W.; writing—review and editing, H.M.W., A.E.G., M.R.P., L.A. and R.A.W.; visualization, H.M.W., A.E.G., M.R.P. and L.A.; supervision, H.M.W. and R.A.W.; project administration, H.M.W. and R.A.W.; funding acquisition, H.M.W. and R.A.W. All authors have read and agreed to the published version of the manuscript.
Funding
This research was funded by funds from the University of Notre Dame College of Science (to R.A.W.), a Graduate Women in Science National Fellowship (to H.M.W.), a Warren Center Drug Development Welter Family Fellowship (to H.M.W.), a Center for Stem Cells and Regenerative Medicine Graduate Fellowship (to H.M.W.), and a College of Science Summer Undergraduate Fellowship (to A.E.G). We are deeply grateful to the Gallagher family, most especially Elizabeth and Michael Gallagher, for their generous gift to the University of Notre Dame that enables the ongoing support for novel stem cell research. The funders had no role in the study design, data collection and analysis, the decision to publish, or manuscript preparation.
Institutional Review Board Statement
The animal study protocol was approved by the University of Notre Dame Institutional Animal Care and Use Committee (IACUC), under protocol numbers 19-06-5412, 20-09-6240, and 22-07-7335.
Informed Consent Statement
Not applicable.
Data Availability Statement
All data are provided herein or within supplementary files.
Acknowledgments
We thank the University of Notre Dame Department of Biological Sciences for their support. We extend ongoing gratitude to the Freimann Life Science Center and the Center for Zebrafish Research at the University of Notre Dame for their oversight and care of our zebrafish aquarium. We appreciate the members of the Gorelick lab for providing the esr2b mutant line. R.A.W. thanks G.R.W. for unwavering support and encouragement, and B.C., K.P., and M.M. for their support and advice. H.M.W would also like to thank J.C., B.C., and R.C. for their support in and out of scientific training. Finally, we thank all the past and current members of our lab for most outstanding discussions about kidney development, and our favorite animal, the zebrafish.
Conflicts of Interest
The authors declare no conflict of interest.
References
- Preuss, H.G. Basics of renal anatomy and physiology. Clin. Lab Med. 1993, 13, 1–11. [Google Scholar] [CrossRef]
- Dressler, G.R. The cellular basis of kidney development. Annu. Rev. Cell Dev. Biol. 2006, 22, 509–529. [Google Scholar] [CrossRef]
- Chambers, J.M.; Wingert, R.A. Advances in understanding vertebrate nephrogenesis. Tissue Barriers 2020, 8, e1832844. [Google Scholar] [CrossRef] [PubMed]
- Desgrange, A.; Cereghini, S. Nephron patterning: Lessons from Xenopus, zebrafish and mouse studies. Cells 2015, 4, 483–499. [Google Scholar] [CrossRef] [Green Version]
- Outtandy, P.; Russell, C.; Kleta, R.; Bockenhauer, D. Zebrafish as a model for kidney function and disease. Pediatr. Nephrol. 2019, 34, 751–762. [Google Scholar] [CrossRef] [PubMed] [Green Version]
- Pollak, M.R.; Quaggin, S.E.; Hoenig, M.P.; Dworkin, L.D. The glomerulus: The sphere of influence. Clin. J. Am. Soc. Nephrol. 2014, 9, 1461–1469. [Google Scholar] [CrossRef] [PubMed] [Green Version]
- Hoenig, M.P.; Zeidel, M.L. Homeostasis, the milieu intérieur, and the wisdom of the nephron. Clin. J. Am. Soc. Nephrol. 2014, 9, 1272–1281. [Google Scholar] [CrossRef] [Green Version]
- Zhuo, J.L.; Li, X.C. Proximal nephron. Compr. Physiol. 2013, 3, 1079–1123. [Google Scholar] [PubMed] [Green Version]
- Curthoys, N.P.; Moe, O.W. Proximal tubule function and response to acidosis. Clin. J. Am. Soc. Nephrol. 2014, 9, 1627–1638. [Google Scholar] [CrossRef] [PubMed] [Green Version]
- Dantzler, W.H.; Layton, A.T.; Layton, H.E.; Pannabecker, T.L. Urine-concentrating mechanism in the inner medulla: Function of the thin limbs of the loops of Henle. Clin. J. Am. Soc. Nephrol. 2014, 9, 1781–1789. [Google Scholar] [CrossRef] [PubMed] [Green Version]
- Mount, D.B. Thick ascending limb of the loop of Henle. Clin. J. Am. Soc. Nephrol. 2014, 9, 1974–1986. [Google Scholar] [CrossRef] [PubMed] [Green Version]
- Subramanya, A.R.; Ellison, D.H. Distal convoluted tubule. Clin. J. Am. Soc. Nephrol. 2014, 9, 2147–2163. [Google Scholar] [CrossRef] [PubMed] [Green Version]
- Pearce, D.; Soundararajan, R.; Trimpert, C.; Kashlan, O.B.; Deen, P.M.T.; Kohan, D.E. Collecting duct principal cell transport processes and their regulation. Clin. J. Am. Soc. Nephrol. 2015, 10, 135–146. [Google Scholar] [CrossRef] [PubMed] [Green Version]
- Roy, A.; Al-bataineh, M.M.; Pastor-Soler, N.M. Collecting duct intercalated cell function and regulation. Clin. J. Am. Soc. Nephrol. 2015, 10, 305–324. [Google Scholar] [CrossRef] [Green Version]
- Thompson, L.E.; Joy, M.S. Endogenous markers of kidney function and renal drug clearance processes of filtration, secretion, and reabsorption. Curr. Opin. Toxicol. 2022, 31, 100344. [Google Scholar] [CrossRef]
- Balzer, M.S.; Rohacs, T.; Susztak, K. How many cell types are in the kidney and what do they do? Annu. Rev. Physiol. 2022, 84, 507–531. [Google Scholar] [CrossRef]
- Drummond, I.A.; Majumdar, A.; Hentschel, H.; Elger, M.; Solnica-Krezel, L.; Schier, A.F.; Neuhauss, S.C.; Stemple, D.L.; Zwartkruis, F.; Rangini, Z.; et al. Early development of the zebrafish pronephros and analysis of mutations affecting pronephric function. Development 1998, 125, 4655–4667. [Google Scholar] [CrossRef]
- Wingert, R.A.; Selleck, R.; Yu, J.; Song, H.; Chen, Z.; Song, A.; Zhou, Y.; Thisse, B.; Thisse, C.; McMahon, A.P.; et al. The cdx genes and retinoic acid control the positioning and segmentation of the zebrafish pronephros. PLoS Genet. 2007, 3, 1922–1938. [Google Scholar] [CrossRef] [Green Version]
- Howe, K.; Clark, M.; Torroja, C.; Torrance, J.; Berthelot, C.; Muffato, M.; Collins, J.E.; Humphray, S.; McLaren, K.; Matthews, L.; et al. The zebrafish reference genome sequence and its relationship to the human genome. Nature 2013, 496, 498–503. [Google Scholar] [CrossRef] [Green Version]
- Irion, U.; Nüsslein-Volhard, C. Developmental genetics with model organisms. Proc. Natl. Acad. Sci. USA 2022, 119, e2122148119. [Google Scholar] [CrossRef]
- Lieschke, G.J.; Currie, P.D. Animal models of human disease: Zebrafish swim into view. Nat. Rev. Genet. 2007, 8, 353–367. [Google Scholar] [CrossRef] [PubMed]
- Phillips, J.B.; Westerfield, M. Zebrafish models in translational research: Tipping the scales toward advancements in human health. Dis. Model Mech. 2014, 7, 739–743. [Google Scholar] [CrossRef] [PubMed] [Green Version]
- Molinari, E.; Sayer, J.A. Disease modeling to understand the pathomechanisms of human genetic kidney disorders. Clin. J. Am. Soc. Nephrol. 2020, 15, 855–872. [Google Scholar] [CrossRef] [PubMed] [Green Version]
- Ebarasi, L.; Oddsson, A.; Hultenby, K.; Betsholtz, C.; Tryggvason, K. Zebrafish: A model system for the study of vertebrate renal development, function, and pathophysiology. Curr. Opin. Nephrol. Hypertens. 2011, 20, 416–424. [Google Scholar] [CrossRef]
- Poureetezadi, S.J.; Wingert, R.A. Little fish, big catch: Zebrafish as a model for kidney disease. Kidney Int. 2016, 89, 1204–1210. [Google Scholar] [CrossRef] [Green Version]
- Morales, E.E.; Wingert, R.A. Zebrafish as a model of kidney disease. Results Probl. Cell Differ. 2017, 60, 55–75. [Google Scholar] [PubMed]
- Wingert, R.A.; Davidson, A.J. Zebrafish nephrogenesis involves dynamic spatiotemporal expression changes in renal progenitors and essential signals from retinoic acid and irx3b. Dev. Dyn. 2011, 240, 2011–2027. [Google Scholar] [CrossRef] [PubMed] [Green Version]
- Chambers, B.E.; Gerlach, G.F.; Clark, E.G.; Chen, K.H.; Levesque, A.E.; Leshchiner, I.; Goessling, W.; Wingert, R.A. Tfap2a is a novel gatekeeper of nephron differentiation during kidney development. Development 2019, 146, dev172387. [Google Scholar] [CrossRef] [PubMed] [Green Version]
- Chambers, B.E.; Clark, E.G.; Gatz, A.E.; Wingert, R.A. Kctd15 regulates nephron segment development by repressing Tfap2a activity. Development 2020, 147, dev191973. [Google Scholar] [CrossRef]
- Li, Y.; Cheng, C.N.; Verdun, V.A.; Wingert, R.A. Zebrafish nephrogenesis is regulated by interactions between retinoic acid, mecom, and Notch signaling. Dev. Biol. 2014, 386, 111–122. [Google Scholar] [CrossRef] [Green Version]
- Drummond, B.E.; Li, Y.; Marra, A.N.; Cheng, C.N.; Wingert, R.A. The tbx2a/b transcription factors direct pronephros segmentation and corpuscle of Stannius formation in zebrafish. Dev. Biol. 2017, 421, 52–66. [Google Scholar] [CrossRef] [Green Version]
- Morales, E.E.; Handa, N.; Drummond, B.E.; Chambers, J.M.; Marra, A.N.; Addiego, A.; Wingert, R.A. Homeogene emx1 is required for nephron distal segment development in zebrafish. Sci. Rep. 2018, 8, 18038. [Google Scholar] [CrossRef] [PubMed] [Green Version]
- Chambers, J.M.; Poureetezadi, S.J.; Addiego, A.; Lahne, M.; Wingert, R.A. ppargc1a controls nephron segmentation during zebrafish embryonic kidney ontogeny. Elife 2018, 7, e40266. [Google Scholar] [CrossRef] [PubMed]
- Marra, A.N.; Adeeb, B.D.; Chambers, B.E.; Drummond, B.E.; Ulrich, M.; Addiego, A.; Springer, M.; Poureetezadi, S.J.; Chambers, J.M.; Ronshaugen, M.; et al. Prostaglandin signaling regulates renal multiciliated cell specification and maturation. Proc. Natl. Acad. Sci. USA 2019, 116, 8409–8418. [Google Scholar] [CrossRef] [PubMed] [Green Version]
- Marra, A.N.; Cheng, C.N.; Adeeb, B.; Addiego, A.; Wesselman, H.M.; Chambers, B.E.; Chambers, J.M.; Wingert, R.A. Iroquois transcription factor irx2a is required for multiciliated and transporter cell fate decisions during zebrafish pronephros development. Sci. Rep. 2019, 9, 6454. [Google Scholar] [CrossRef] [Green Version]
- Chambers, J.M.; Addiego, A.; Flores-Mireles, A.L.; Wingert, R.A. Ppargc1a controls ciliated cell development by regulating prostaglandin biosynthesis. Cell Rep. 2020, 33, 108370. [Google Scholar] [CrossRef] [PubMed]
- Weaver, N.E.; Healy, A.; Wingert, R.A. gldc is essential for renal progenitor patterning during kidney development. Biomedicines 2022, 10, 3220. [Google Scholar] [CrossRef] [PubMed]
- Poureetezadi, S.J.; Donahue, E.K.; Wingert, R.A. A manual small molecule screen approaching high-throughput using zebrafish embryos. J. Vis. Exp. 2014, 93, e52063. [Google Scholar]
- Poureetezadi, S.J.; Cheng, C.N.; Chambers, J.M.; Drummond, B.E.; Wingert, R.A. Prostaglandin signaling regulates nephron segment patterning of renal progenitors during zebrafish kidney development. Elife 2016, 5, e17551. [Google Scholar] [CrossRef]
- Romano, S.N.; Edwards, H.E.; Souder, J.P.; Ryan, K.J.; Cui, X.; Gorelick, D.A. G protein-coupled estrogen receptor regulates embryonic heart rate in zebrafish. PLoS Genet. 2017, 13, e1007069. [Google Scholar] [CrossRef]
- Souder, J.P.; Gorelick, D.A. Quantification of estradiol uptake in zebrafish embryos and larvae. Toxicol. Sci. 2017, 158, 465–474. [Google Scholar] [CrossRef] [PubMed] [Green Version]
- Kimmel, C.B.; Ballard, W.W.; Kimmel, S.R.; Ullmann, B.; Schilling, T.F. Stages of embryonic development of the zebrafish. Dev. Dyn. 1995, 203, 253–310. [Google Scholar] [CrossRef] [PubMed]
- Gerlach, G.F.; Wingert, R.A. Zebrafish pronephros tubulogenesis and epithelial identity maintenance are reliant on the polarity proteins Prkc iota and zeta. Dev. Biol. 2014, 396, 183–200. [Google Scholar] [CrossRef] [PubMed] [Green Version]
- McKee, R.; Gerlach, G.F.; Jou, J.; Cheng, C.N.; Wingert, R.A. Temporal and spatial expression of tight junction genes during zebrafish pronephros development. Gene Expr. Patterns 2014, 16, 104–113. [Google Scholar] [CrossRef] [PubMed] [Green Version]
- Cheng, C.N.; Li, Y.; Marra, A.N.; Verdun, V.; Wingert, R.A. Flat mount preparation for observation and analysis of zebrafish embryo specimens stained by whole mount in situ hybridization. J. Vis. Exp. 2014, 89, 51604. [Google Scholar]
- Marra, A.N.; Ulrich, M.; White, A.; Springer, M.; Wingert, R.A. Visualizing multiciliated cells in the zebrafish through a combined protocol of whole mount fluorescent in situ hybridization and immunofluorescence. J. Vis. Exp. 2017, 129, 56261. [Google Scholar]
- Li, Y.; Xu, W.; Jerman, S.; Sun, Z. In vivo analysis of renal epithelial cells in zebrafish. Methods Cell Biol. 2019, 154, 163–181. [Google Scholar]
- Marra, A.N.; Chambers, B.E.; Chambers, J.M.; Drummond, B.E.; Adeeb, B.D.; Wesselman, H.M.; Morales, E.E.; Handa, N.; Pettini, T.; Ronshaugen, M.; et al. Visualizing gene expression during zebrafish pronephros development and regeneration. Methods Cell. Biol. 2019, 154, 183–215. [Google Scholar]
- Wesselman, H.M.; Gatz, A.; Wingert, R.A. Visualizing multiciliated cells in the zebrafish. Methods Cell Biol. 2022. [Google Scholar] [CrossRef]
- Kroeger, P.T.; Drummond, B.E.; Miceli, R.; McKernan, M.; Gerlach, G.F.; Marra, A.N.; Fox, A.; McCampbell, K.K.; Leshchiner, I.; Rodriguez-Mari, A.; et al. The zebrafish kidney mutant zeppelin reveals that brca2/fancd1 is essential for pronephros development. Dev. Biol. 2017, 428, 148–163. [Google Scholar] [CrossRef]
- Marra, A.N.; Wingert, R.A. Epithelial cell fate in the nephron tubule is mediated by the ETS transcription factors etv5a and etv4 during zebrafish kidney development. Dev. Biol. 2016, 411, 231–245. [Google Scholar] [CrossRef] [Green Version]
- Drummond, B.E.; Chambers, B.E.; Wesselman, H.M.; Gibson, S.; Arceri, L.; Ulrich, M.N.; Gerlach, G.F.; Kroeger, P.T.; Leshchiner, I.; Goessling, W.; et al. osr1 maintains renal progenitors and regulates podocyte development by promoting wnt2ba via the antagonism of hand2. Biomedicines 2022, 10, 2868. [Google Scholar] [CrossRef] [PubMed]
- Griffin, L.B.; January, K.E.; Ho, K.W.; Cotter, K.A.; Callard, G.V. Morpholino-mediated knockdown of ERα, ERβa, and ERβb mRNAs in zebrafish (Danio rerio) embryos reveals differential regulation of estrogen-inducible genes. Endocrinology 2013, 154, 4158–4169. [Google Scholar] [CrossRef] [PubMed] [Green Version]
- Chaturantabut, S.; Shwartz, A.; Garnaas, M.K.; LaBella, K.; Li, C.C.; Carroll, K.J.; Cutting, C.C.; Budrow, N.; Palaria, A.; Gorelick, D.A.; et al. Estrogen acts through estrogen receptor 2b to regulate hepatobiliary fate during vertebrate development. Hepatology 2020, 72, 1786–1799. [Google Scholar] [CrossRef]
- North, T.E.; Goessling, W.; Walkley, C.R.; Lengerke, C.; Kopani, K.R.; Lord, A.M.; Weber, G.J.; Bowman, T.V.; Jang, I.H.; Grosser, T.; et al. Prostaglandin E2 regulates vertebrate haematopoietic stem cell homeostasis. Nature 2007, 447, 1007–1011. [Google Scholar] [CrossRef] [PubMed] [Green Version]
- Garnaas, M.K.; Cutting, C.C.; Meyers, A.; Kelsey, P.B.; Harris, J.M.; North, T.E.; Goessling, W. Rargb regulates organ laterality in a zebrafish model of right atrial isomerism. Dev. Biol. 2012, 372, 178–189. [Google Scholar] [CrossRef] [Green Version]
- Gehrig, J.; Pandey, G.; Westhoff, J.H. Zebrafish as a model for drug screening in genetic kidney diseases. Front. Pediatr. 2018, 6, 183. [Google Scholar] [CrossRef]
- Carroll, K.J.; Esain, V.; Garnaas, M.K.; Cortes, M.; Dovey, M.C.; Nissim, S.; Frechette, G.M.; Liu, S.Y.; Kwan, W.; Cutting, C.C.; et al. Estrogen defines the dorsal-ventral limit of VEGF regulation to specify the location of the hemogenic endothelial niche. Dev. Cell 2014, 29, 437–453. [Google Scholar] [CrossRef] [Green Version]
- Pinto, C.; Grimaldi, M.; Boulahtouf, A.; Pakdel, F.; Brion, F.; Aït-Aïssa, S.; Cavaillès, V.; Bourguet, W.; Gustafsson, J.A.; Bondesson, M.; et al. Selectivity of natural, synthetic and environmental estrogens for zebrafish estrogen receptors. Toxicol. Appl. Pharmacol. 2014, 280, 60–69. [Google Scholar] [CrossRef] [Green Version]
- Tohmé, M.; Prud’homme, S.M.; Boulahtouf, A.; Samarut, E.; Brunet, F.; Bernard, L.; Bourguet, W.; Gibert, Y.; Balaguer, P.; Laudet, V. Estrogen-related receptor γ is an in vivo receptor of bisphenol A. FASEB J. 2014, 28, 3124–3133. [Google Scholar] [CrossRef]
- Reggiani, L.; Raciti, D.; Airik, R.; Kispert, A.; Brändli, A.W. The prepattern transcription factor Irx3 directs nephron segment identity. Genes Dev. 2007, 21, 2358–2370. [Google Scholar] [CrossRef] [Green Version]
- El-Dahr, S.S.; Aboudehen, K.; Saifudeen, Z. Transcriptional control of terminal nephron differentiation. Am. J. Physiol. Renal Physiol. 2008, 294, F1273–F1278. [Google Scholar] [CrossRef] [Green Version]
- Heliot, C.; Desgrange, A.; Buisson, I.; Prunskaite-Hyyryläinen, R.; Shan, J.; Vainio, S.; Umbhauer, M.; Cereghini, S. HNF1B controls proximal-intermediate nephron segment identity in vertebrates by regulating Notch signalling components and Irx1/2. Development 2013, 140, 873–885. [Google Scholar] [CrossRef] [PubMed] [Green Version]
- Massa, F.; Garbay, S.; Bouvier, R.; Sugitani, Y.; Noda, T.; Gubler, M.C.; Heidet, L.; Pontoglio, M.; Fischer, E. Hepatocyte nuclear factor 1β controls nephron tubular development. Development 2013, 140, 886–896. [Google Scholar] [CrossRef] [Green Version]
- Naylor, R.W.; Przepiorski, A.; Ren, Q. HNF1B is essential for nephron segmentation during nephrogenesis. J. Am. Soc. Nephrol. 2013, 24, 77–87. [Google Scholar] [CrossRef] [PubMed] [Green Version]
- Naylor, R.W.; Chang, H.G.; Qubisi, S.; Davidson, A.J. A novel mechanism of gland formation in zebrafish involving transdifferentiation of renal epithelial cells and live cell extrusion. Elife 2018, 7, e38911. [Google Scholar] [CrossRef]
- Beyer, C. Estrogen and the developing mammalian brain. Anat. Embryol. (Berl.) 1999, 199, 379–390. [Google Scholar] [CrossRef]
- Arai, Y.; Sekine, Y.; Murakami, S. Estrogen and apoptosis in the developing sexually dimorphic preoptic area in female rats. Neurosci. Res. 1996, 25, 403–407. [Google Scholar] [CrossRef]
- Wang, L.; Andersson, S.; Warner, M.; Gustafsson, J.A. Estrogen receptor (ER) knockout mice reveal a role for ER in migration of cortical neurons in the developing brain. Proc. Natl. Acad. Sci. USA 2003, 100, 703–708. [Google Scholar] [CrossRef] [PubMed] [Green Version]
- Denley, M.C.S.; Gatford, N.J.F.; Sellers, K.J.; Srivastava, D.P. Estradiol and the development of the cerebral cortex: An unexpected role? Front. Neurosci. 2018, 12, 245. [Google Scholar] [CrossRef] [Green Version]
- Zuloaga, D.G.; Zuloaga, K.L.; Hinds, L.R.; Carbone, D.L.; Handa, R.J. Estrogen receptor β expression in the mouse forebrain: Age and sex differences: Estrogen receptor β forebrain distribution. J. Comp. Neurol. 2014, 522, 358–371. [Google Scholar] [CrossRef] [PubMed] [Green Version]
- Makantasi, P.; Dermon, C.R. Estradiol treatment decreases cell proliferation in the neurogenic zones of adult female zebrafish (Danio rerio) brain. Neuroscience 2014, 277, 306–320. [Google Scholar] [CrossRef]
- Nakada, D.; Oguro, H.; Levi, B.P.; Ryan, N.; Kitano, A.; Saitoh, Y.; Takeichi, M.; Wendt, G.R.; Morrison, S.J. Oestrogen increases haematopoietic stem-cell self-renewal in females and during pregnancy. Nature 2014, 505, 555–558. [Google Scholar] [CrossRef] [Green Version]
- Lane, P.H. Estrogen receptors in the kidney: Lessons from genetically altered mice. Gend. Med. 2008, 5, S11–S18. [Google Scholar] [CrossRef]
- Hao, R.; Bondesson, M.; Singh, A.V.; Riu, A.; McCollum, C.W.; Knudsen, T.B.; Gorelick, D.A.; Gustafsson, J. Identification of estrogen target genes during zebrafish embryonic development through transcriptomic analysis. PLoS ONE 2013, 8, e79020. [Google Scholar] [CrossRef] [PubMed] [Green Version]
- Heldring, N.; Pike, A.; Andersson, S.; Matthews, J.; Cheng, G.; Hartman, J.; Tujague, M.; Ström, A.; Treuter, E.; Warner, M.; et al. Estrogen receptors: How do they signal and what are their targets. Physiol. Rev. 2007, 87, 905–931. [Google Scholar] [CrossRef] [Green Version]
- Bondesson, M.; Hao, R.; Lin, C.-Y.; Williams, C.; Gustafsson, J. Estrogen receptor signaling during vertebrate development. Biochim. Biophys. Acta 2015, 1849, 142–151. [Google Scholar] [CrossRef] [Green Version]
- Vaillant, C.; Gueguen, M.M.; Feat, J.; Charlier, T.D.; Coumailleau, P.; Kah, O.; Brion, F.; Pellegrini, E. Neurodevelopmental effects of natural and synthetic ligands of estrogen and progesterone receptors in zebrafish eleutheroembryos. Gen. Comp. Endocrinol. 2020, 288, 113345. [Google Scholar] [CrossRef] [PubMed]
- Tingskov, S.J.; Mutsaers, H.A.M.; Nørregaard, R. Estrogen regulates aquaporin-2 expression in the kidney. Vitam Horm. 2020, 112, 243–264. [Google Scholar]
- Schedl, A. Renal abnormalities and their developmental origin. Nat. Rev. Genet. 2007, 8, 791–802. [Google Scholar] [CrossRef]
- Nicolaou, N.; Renkema, K.Y.; Bongers, E.M.; Giles, R.H.; Knoers, N.V. Genetic, environmental, and epigenetic factors involved in CAKUT. Nat. Rev. Nephrol. 2015, 11, 720–731. [Google Scholar] [CrossRef]
- El-Brolosy, M.A.; Stainier, D.Y.R. Genetic compensation: A phenomenon in search of mechanisms. PLoS Genet. 2017, 13, e1006780. [Google Scholar] [CrossRef] [Green Version]
- Schnell, J.; Achieng, M.; Lindström, N.O. Principles of human and mouse nephron development. Nat. Rev. Nephrol. 2022, 18, 628–642. [Google Scholar] [CrossRef] [PubMed]
- Perl, A.J.; Schuh, M.P.; Kopan, R. Regulation of nephron progenitor cell lifespan and nephron endowment. Nat. Rev. Nephrol. 2022, 18, 683–695. [Google Scholar] [CrossRef] [PubMed]
- Huang, W.; Ai, W.; Lin, W.; Fang, F.; Wang, X.; Huang, H.; Dahlgren, R.A.; Wang, H. Identification of receptors for eight endocrine disrupting chemicals and their underlying mechanisms using zebrafish as a model organism. Ecotoxicol. Environ. Saf. 2020, 204, 111068. [Google Scholar] [CrossRef] [PubMed]
- Xia, L.; Zheng, L.; Zhou, J.L. Transcriptional and morphological effects of tamoxifen on the early development of zebrafish (Danio rerio). J. Appl. Toxicol. 2016, 36, 853–862. [Google Scholar] [CrossRef]
- Timms, B.G.; Howdeshell, K.L.; Barton, L.; Bradley, S.; Richter, C.A.; vom Saal, F.S. Estrogenic chemicals in plastic and oral contraceptives disrupt development of the fetal mouse prostate and urethra. Proc. Natl. Acad. Sci. USA 2005, 102, 7014–7019. [Google Scholar] [CrossRef] [Green Version]
- Migliaccio, S.; Newbold, R.R.; Teti, A.; Jefferson, W.J.; Toverud, S.U.; Taranta, A.; Bullock, B.C.; Suggs, C.A.; Spera, G.; Korach, K.S. Transient estrogen exposure of female mice during early development permanently affects osteoclastogenesis in adulthood. Bone 2000, 27, 47–52. [Google Scholar] [CrossRef]
- van der Weijden, V.A.; Flöter, V.L.; Ulbrich, S.E. Gestational oral low-dose estradiol-17β induces altered DNA methylation of CDKN2D and PSAT1 in embryos and adult offspring. Sci. Rep. 2018, 8, 7494. [Google Scholar] [CrossRef]
- Bailey, C.; von Siebenthal, E.W.; Rehberger, K.; Segner, H. Transcriptomic analysis of the impacts of ethinylestradiol (EE2) and its consequences for proliferative kidney disease outcome in rainbow trout (Oncorhynchus mykiss). Comp. Biochem. Physiol. C Toxicol. Pharmacol. 2019, 222, 31–48. [Google Scholar] [CrossRef]
- Singh, A.P.; Singh, N.; Pathak, D.; Bedi, P.M.S. Estradiol attenuates ischemia reperfusion-induced acute kidney injury through PPAR-γ stimulated eNOS activation in rats. Mol. Cell Biochem. 2019, 453, 1–9. [Google Scholar] [CrossRef] [PubMed]
- Singh, A.P.; Singh, N.; Bedi, P.M.S. Estrogen attenuates renal IRI through PPAR-γ agonism in rats. J. Surg. Res. 2016, 203, 324–330. [Google Scholar] [CrossRef] [PubMed]
- Park, Y.J.; Kim, J.M. Klotho and postmenopausal hormone replacement therapy in women with chronic kidney disease. J. Menopausal Med. 2018, 24, 75–80. [Google Scholar] [CrossRef] [PubMed]
- Ji, H.; Zheng, W.; Menini, S.; Pesce, C.; Kim, J.; Wu, X.; Mulroney, S.E.; Sandberg, K. Female protection in progressive renal disease is associated with estradiol attenuation of superoxide production. Gend. Med. 2007, 4, 56–71. [Google Scholar] [CrossRef] [PubMed]
- Tingskov, S.J.; Jensen, M.S.; Pedersen, C.T.; de Araujo, I.B.B.A.; Mutsaers, H.A.M.; Nørregaard, R. Tamoxifen attenuates renal fibrosis in human kidney slices and rats subjected to unilateral ureteral obstruction. Biomed. Pharmacother. 2021, 133, 111003. [Google Scholar] [CrossRef] [PubMed]
Figure 1.
Exogenous E2 alters distal nephron segmentation independently of cell dynamics. (A) Schematic of nephrogenesis in a zebrafish from the early 20 ss (top) to the fully patterned 28 ss (bottom). 17β-estradiol (E2) is present in the yolk ball and diffuses to surrounding tissues. By 28 ss, the nephron is comprised of discrete segments with unique somite addresses: podocytes and neck (P&N, somites 3–4), proximal convoluted tubule (PCT, somites 5–8), proximal straight tubule (PST, somites 9–11), distal early (DE, somites 12–13), and distal late (DL, somites 14–18). (B) 20 ss (top two rows) and 28 ss (bottom two rows) WT control animals treated with DMSO as a vehicle control, and siblings treated with 20 µM of E2 from the shield stage to 24 hpf, stained via WISH for the DE marker (slc12a1, left) or the DL marker (slc12a3, right) with the somite marker (smyhc). Scale bar = 100 µm for lower magnification, scale bar = 50 µm for higher magnification. (C,D) DE and DL domain lengths at 20 ss in micrometers. (E,F) DE and DL domain lengths at 28 ss in micrometers. (G) The 20 ss WT (left) and 20 µM E2 (right) nephrons (outlined with dotted line) stained for the DE (slc12a1) via FISH and proliferating (PH3, top) or apoptotic (Caspase3, bottom) cells via immunofluorescence. Arrow heads denote double-positive cells. Scale bar = 50 µm. (H) Number of PH3-positive cells in the DE at the 20 ss. (I) Number of Caspase3-positive cells in the DE at the 20 ss. (J) The 20 ss WT (left) and 20 µM E2 (right) nephrons (outlined with dotted lines) stained for the DL (slc12a3) via FISH and proliferating (PH3, top) or apoptotic (Caspase3, bottom) cells via immunofluorescence. Arrow heads denote double-positive cells. Scale bar = 50 µm. (K) Number of PH3-positive cells in the DL at the 20 ss. (L) Number of Caspase3-positive cells in the DL at the 20 ss. Data presented on graphs are represented as mean ± SD. * p < 0.05, *** p < 0.001, and **** p < 0.0001 (t-test).

Figure 2.
Xenoestrogens phenocopy E2 distal nephron segmentation phenotypes. (A) The 28 ss WT (top), 20 µM ethinylestradiol (EE, middle), or 20 µM genistein (GEN, bottom) treated animals stained via WISH for the DE marker (slc12a1) with the somite marker (smyhc) (left), or the DL marker (slc12a3) (right). Scale bar = 100 µm for lower magnification, scale bar = 50 µm for higher magnification. (B,C) DE and DL domain lengths at 28 ss in micrometers. Data presented on graphs are represented as mean ± SD. **** p < 0.0001 (ANOVA).

Figure 3.
Chemical and genetic inhibition of Esr2b results in altered distal segmentation. (A) The 28 ss WT (top) and 18 µM PHTPP (bottom) treated animals stained via WISH for the DE marker (slc12a1) (left) or the DL marker (slc12a3) (right). Scale bar = 100 µm for lower magnification, scale bar = 50 µm for higher magnification. (B,C) DE and DL domain lengths at 28 ss in micrometers. (D) The 28 ss WT (top), esr2b MO-injected (second row), esr2a and esr2b double-MO-injected (third row), and esr2b mutant (bottom row) animals stained via WISH for the DE marker (slc12a1) (left) or the DL marker (slc12a3) (right). Scale bar = 100 µm for lower magnification, scale bar = 50 µm for higher magnification. (E,F) DE and DL domain lengths at 28 ss in micrometers. Data presented on graphs are represented as mean ± SD. * p < 0.05, ** p < 0.01, *** p < 0.001, and **** p < 0.0001 (t-test or ANOVA).

Figure 4.
E2 signaling operates through Esr2b upstream of essential transcription factors to elicit distal nephron cell fate. (A) The 28 ss WT (top), 20 µM E2-treated (second row), 18 µM PHTPP-treated (third row), or esr2b MO-injected (bottom) animals stained via WISH for the transcription factor irx3b (left) and its downstream target irx1a (right). Scale bar = 100 µm for lower magnification, scale bar = 50 µm for higher magnification. (B,C) The irx3b and irx1a domain lengths at 28 ss in micrometers. Data presented on graphs are represented as mean ± SD. * p < 0.05 and **** p < 0.0001 (ANOVA).

Figure 5.
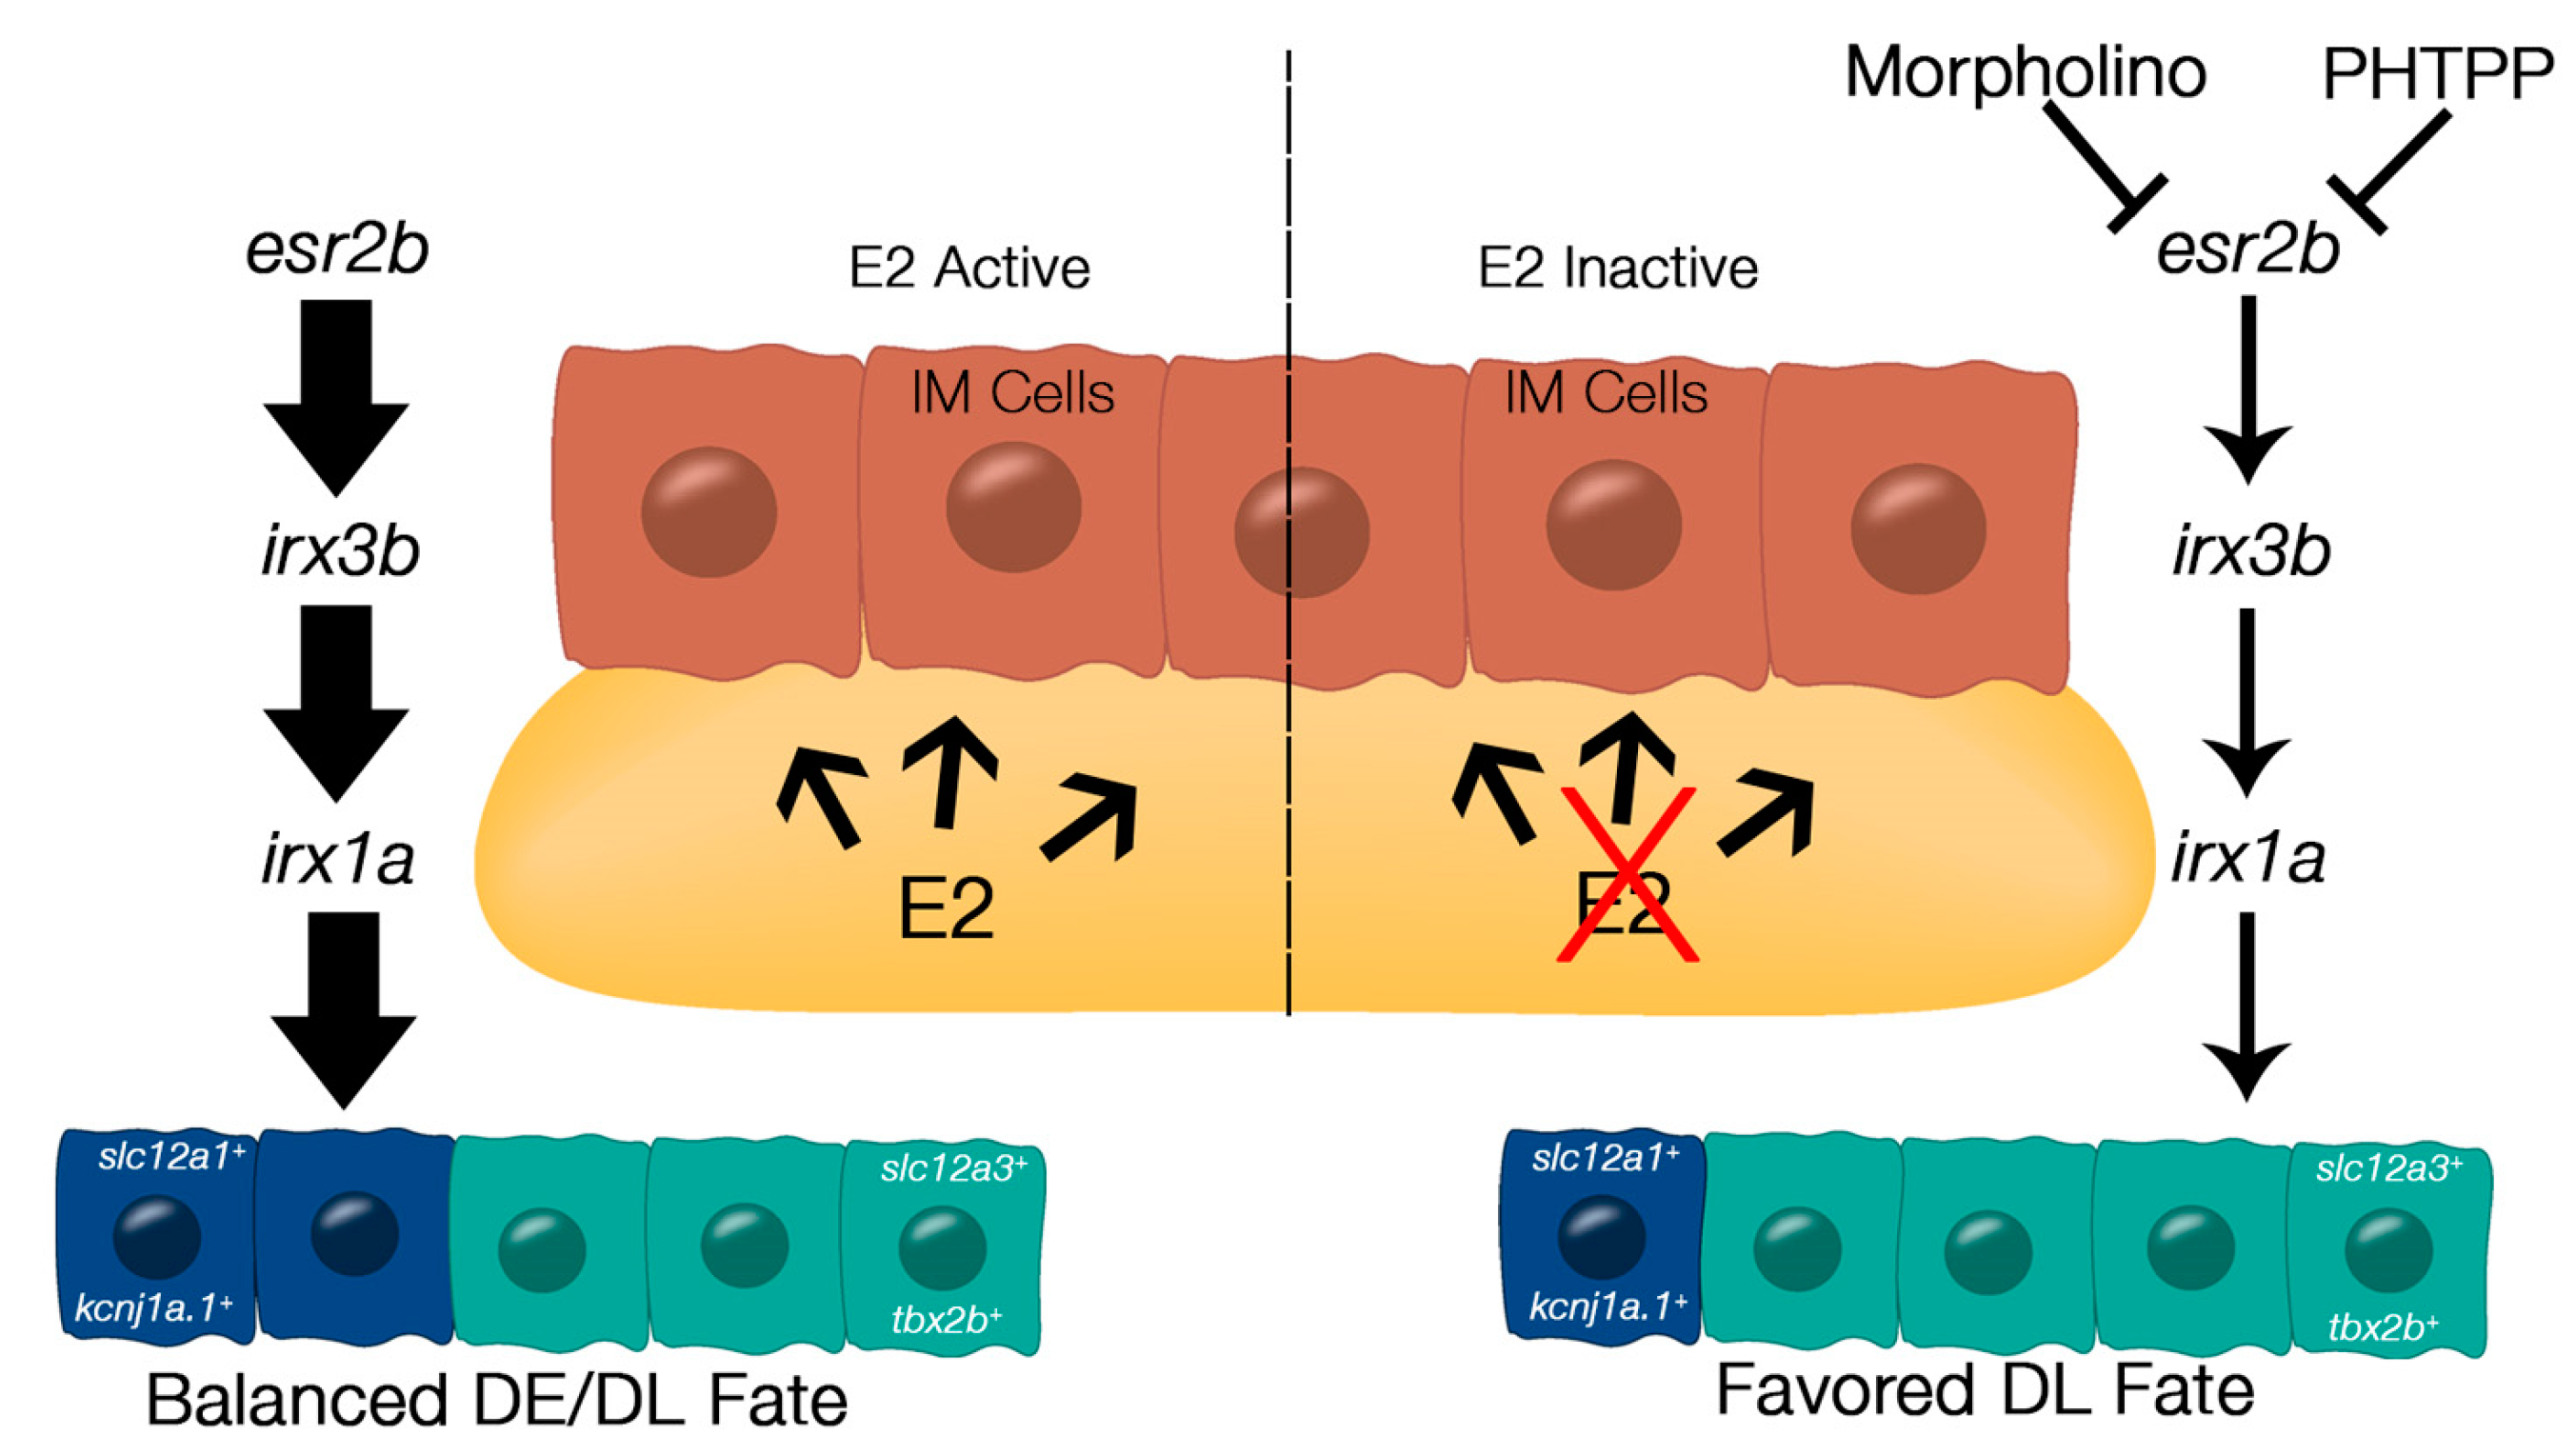
Proposed mechanism by which E2 signaling contributes to nephron segmentation. When E2 signaling is active (left), E2 diffuses from the yolk into the neighboring intermediate mesoderm (IM) cells. E2 binds to Esr2b, which activates irx3b and irx1a, ultimately resulting in balanced DE and DL fate. When E2 signaling is inactive (right) via morpholino knockdown or chemical inhibition by PHTPP, esr2b activity is diminished, as well as expression of downstream targets irx3b and irx1a, resulting in favored DL fate.
Figure 5.
Proposed mechanism by which E2 signaling contributes to nephron segmentation. When E2 signaling is active (left), E2 diffuses from the yolk into the neighboring intermediate mesoderm (IM) cells. E2 binds to Esr2b, which activates irx3b and irx1a, ultimately resulting in balanced DE and DL fate. When E2 signaling is inactive (right) via morpholino knockdown or chemical inhibition by PHTPP, esr2b activity is diminished, as well as expression of downstream targets irx3b and irx1a, resulting in favored DL fate.


Table 1.
Reagents and resources used in this study.
| Reagent or Resource | Name | Source | Catalog Number |
|---|---|---|---|
| Antibodies | Anti-Ph3 | Millipore | 06–570 |
| Anti-Caspase3 | BD Biosciences | 559565 | |
| Goat anti-Mouse, Alexa Fluor 568 | Invitrogen | A11031 | |
| Goat anti-Rabbit, Alexa Fluor 594 | Invitrogen | A11037 | |
| Goat anti-Mouse, Alexa Fluor 488 | Invitrogen | A11029 | |
| Goat anti-Rabbit, Alexa Fluor 488 | Invitrogen | A11034 | |
| Chemicals and Stains | 17β-Estradiol (E2) | Cayman Chemical | 50-28-2 |
| DPN | Santa Cruz | SC-203431 | |
| PHTPP | Santa Cruz | SC-204191 | |
| MPP | Santa Cruz | SC-204098 | |
| PPT | Santa Cruz | SC-297946 | |
| Genistein | Sigma Aldrich | 446-72-0 | |
| Ethinylestradiol | Sigma Aldrich | 47-63-6 | |
| BPA DAPI | Sigma Aldrich Invitrogen | 80-05-7 D1306 | |
| Commercial Assays | mMESSAGE mMACHINE SP6 kit | Ambion | AM1340 |
| TSA Plus Cyanine | Akoya Biosciences | NEL744001KT | |
| TSA Plus Fluorescein | Akoya Biosciences | NEL741001KT | |
| Software | https://www.graphpad.com, URL accessed on 15 April 2019 | Prism v9 | GraphPad |
| https://imagej.nih.gov/ij/, URL accessed on 2 August 2020 | ImageJ | Fiji |
Table 2.
Zebrafish embryo treatment dosages for chemical studies.
| Chemical | Dose |
|---|---|
| 17β-Estradiol (E2) | 20 µM or 25 µM |
| DPN | 400 µM |
| PHTPP | 18 µM |
| MPP | 400 µM |
| PPT | 75 µM |
| Genistein | 20 µM |
| Ethinylestradiol | 20 µM |
| BPA | 50 µM |
Disclaimer/Publisher’s Note: The statements, opinions and data contained in all publications are solely those of the individual author(s) and contributor(s) and not of MDPI and/or the editor(s). MDPI and/or the editor(s) disclaim responsibility for any injury to people or property resulting from any ideas, methods, instructions or products referred to in the content. |
© 2023 by the authors. Licensee MDPI, Basel, Switzerland. This article is an open access article distributed under the terms and conditions of the Creative Commons Attribution (CC BY) license (https://creativecommons.org/licenses/by/4.0/).
Share and Cite
MDPI and ACS Style
Wesselman, H.M.; Gatz, A.E.; Pfaff, M.R.; Arceri, L.; Wingert, R.A. Estrogen Signaling Influences Nephron Segmentation of the Zebrafish Embryonic Kidney. Cells 2023, 12, 666. https://doi.org/10.3390/cells12040666
AMA Style
Wesselman HM, Gatz AE, Pfaff MR, Arceri L, Wingert RA. Estrogen Signaling Influences Nephron Segmentation of the Zebrafish Embryonic Kidney. Cells. 2023; 12(4):666. https://doi.org/10.3390/cells12040666
Chicago/Turabian StyleWesselman, Hannah M., Allison E. Gatz, Mairead R. Pfaff, Liana Arceri, and Rebecca A. Wingert. 2023. "Estrogen Signaling Influences Nephron Segmentation of the Zebrafish Embryonic Kidney" Cells 12, no. 4: 666. https://doi.org/10.3390/cells12040666
Note that from the first issue of 2016, this journal uses article numbers instead of page numbers. See further details here.