
Compartmentation of cGMP Signaling in Induced Pluripotent Stem Cell Derived Cardiomyocytes during Prolonged Culture
 , , , and
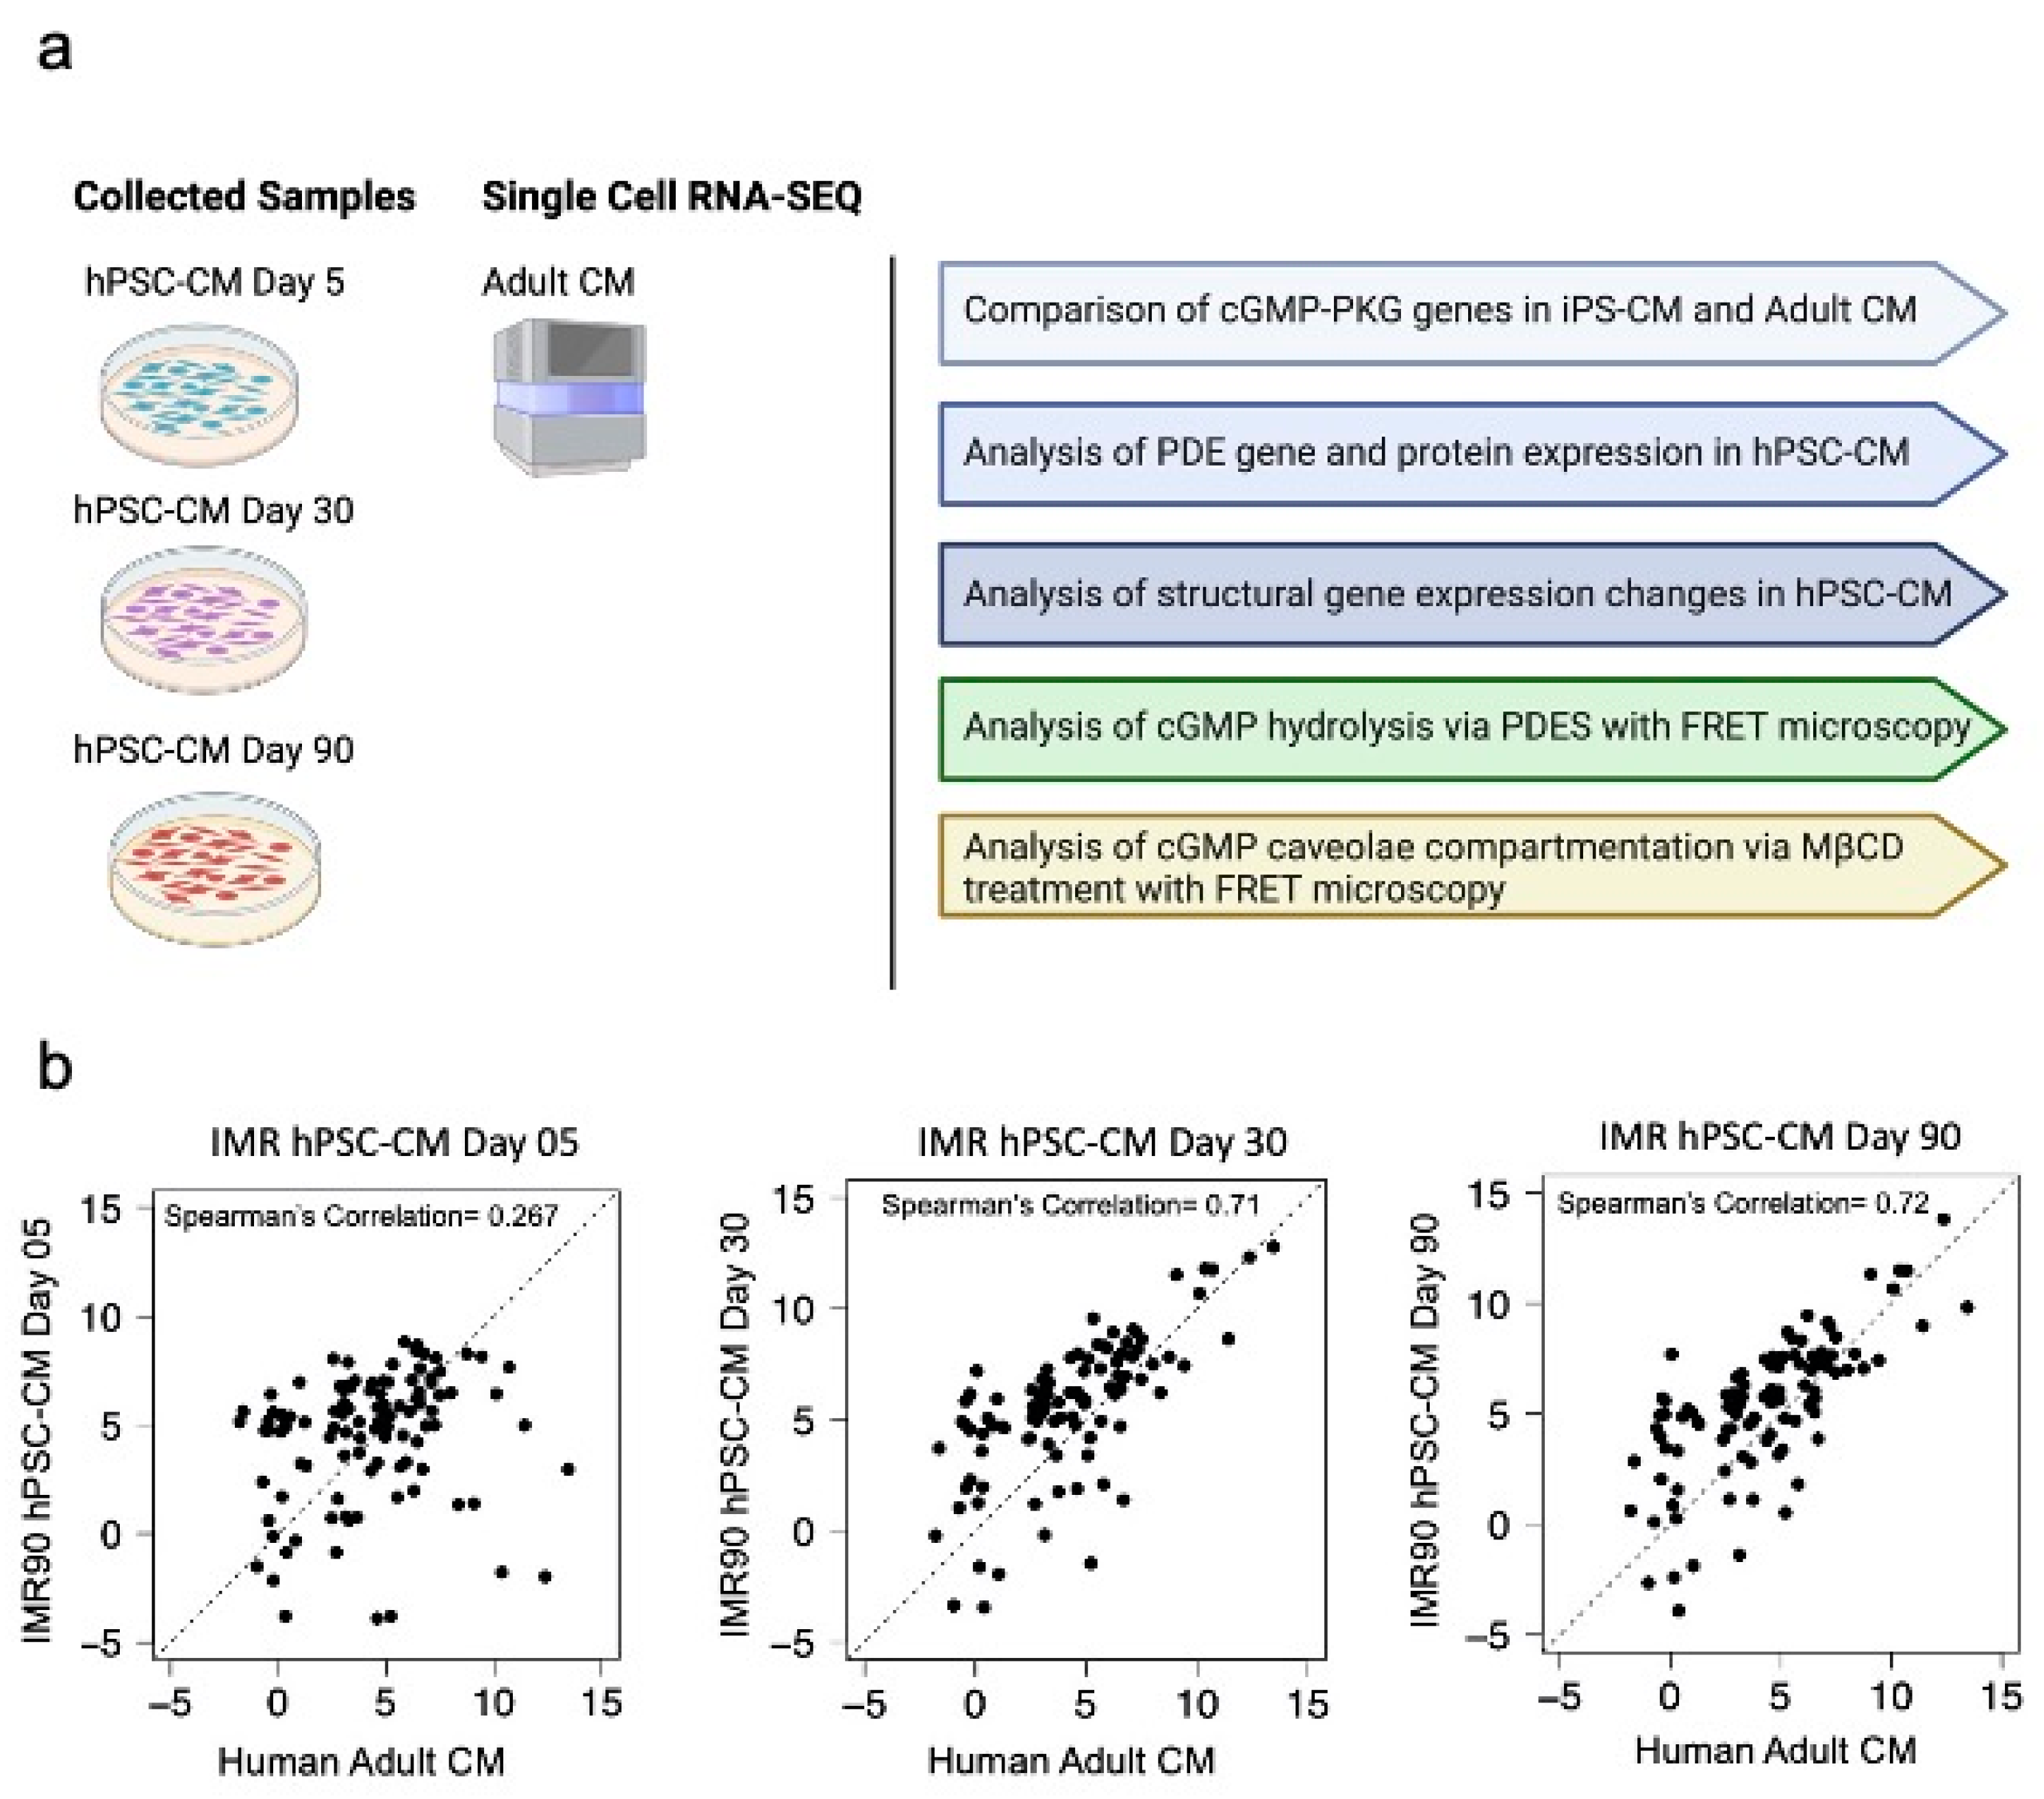
Abstract
:1. Introduction
2. Materials and Methods
2.1. Reagents
2.2. hPSC Differentiation
2.3. Quantitative Polymerase Chain Reaction (Q-PCR)
2.4. Western Blotting
2.5. Transmission Electron Microscopy
2.6. FRET Imaging
2.7. RNA-SEQ Analysis
2.8. Statistical Analysis:
3. Results
3.1. The cGMP-PKG Pathway Undergoes Maturation as hPSCs Are Cultured Up to Day 90
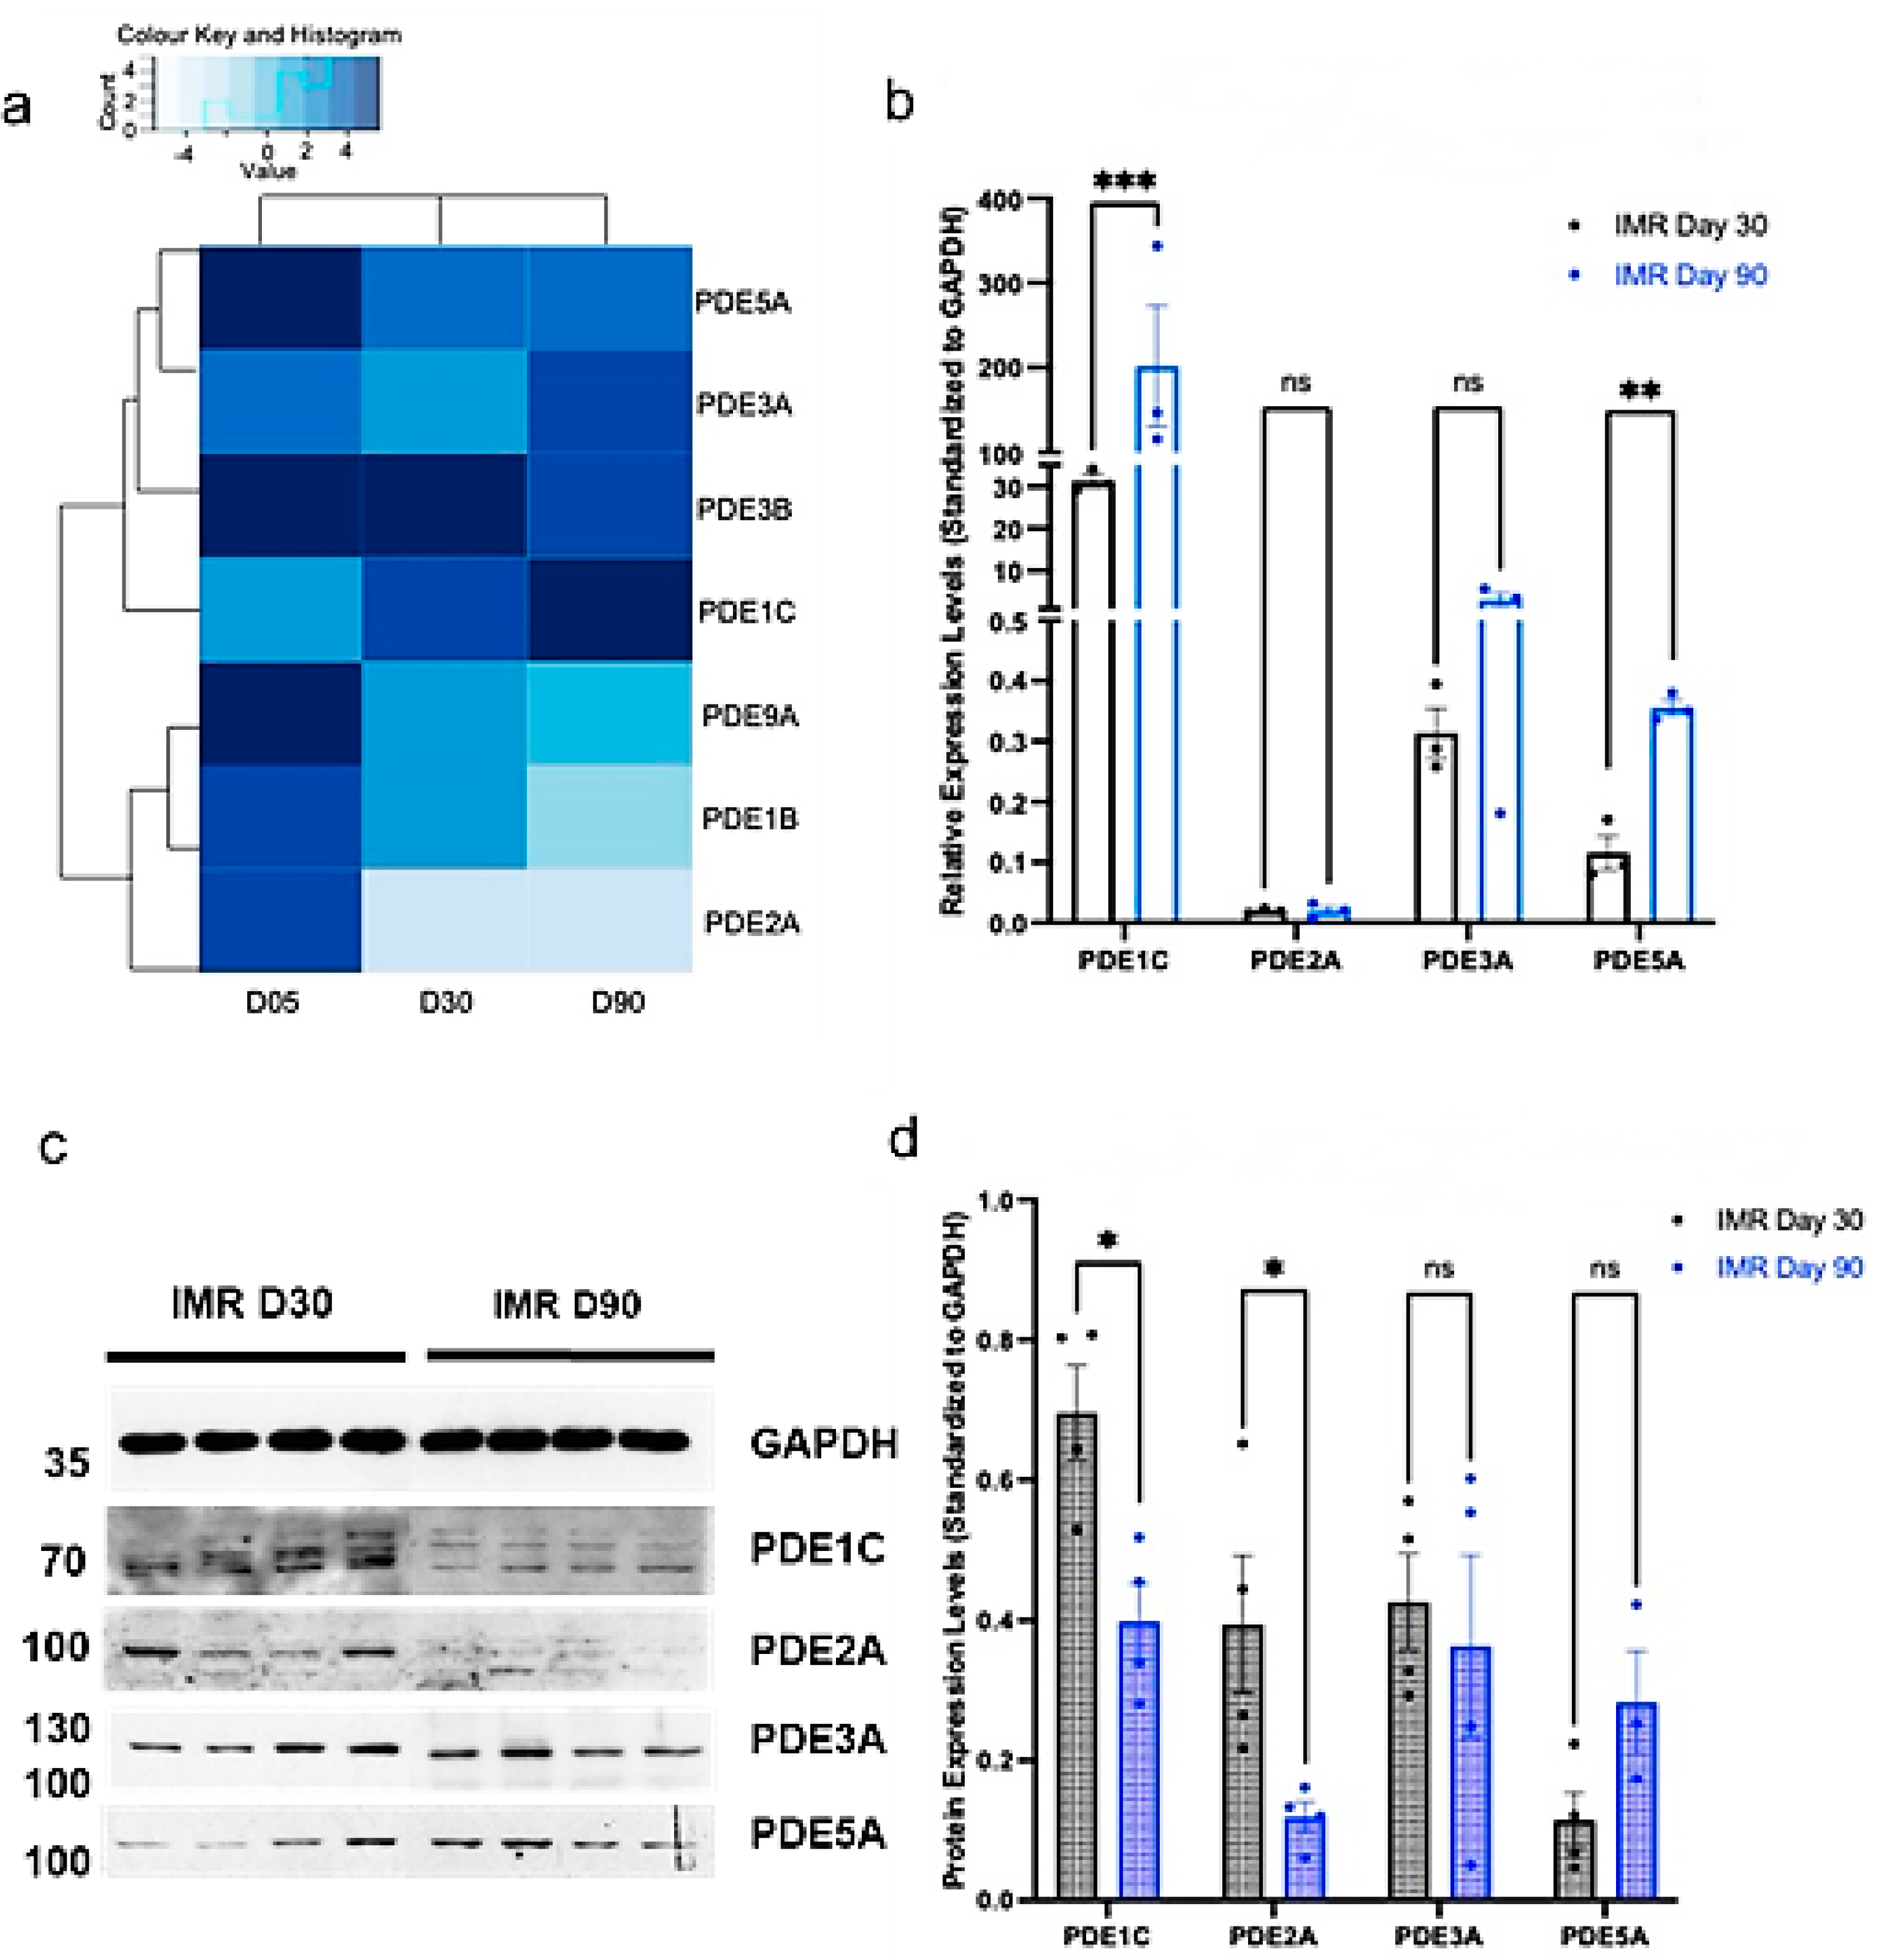
3.2. hPSC-CMs Modulate Their PDE Expression and Increase Their Structural Components throughout Ageing in Culture
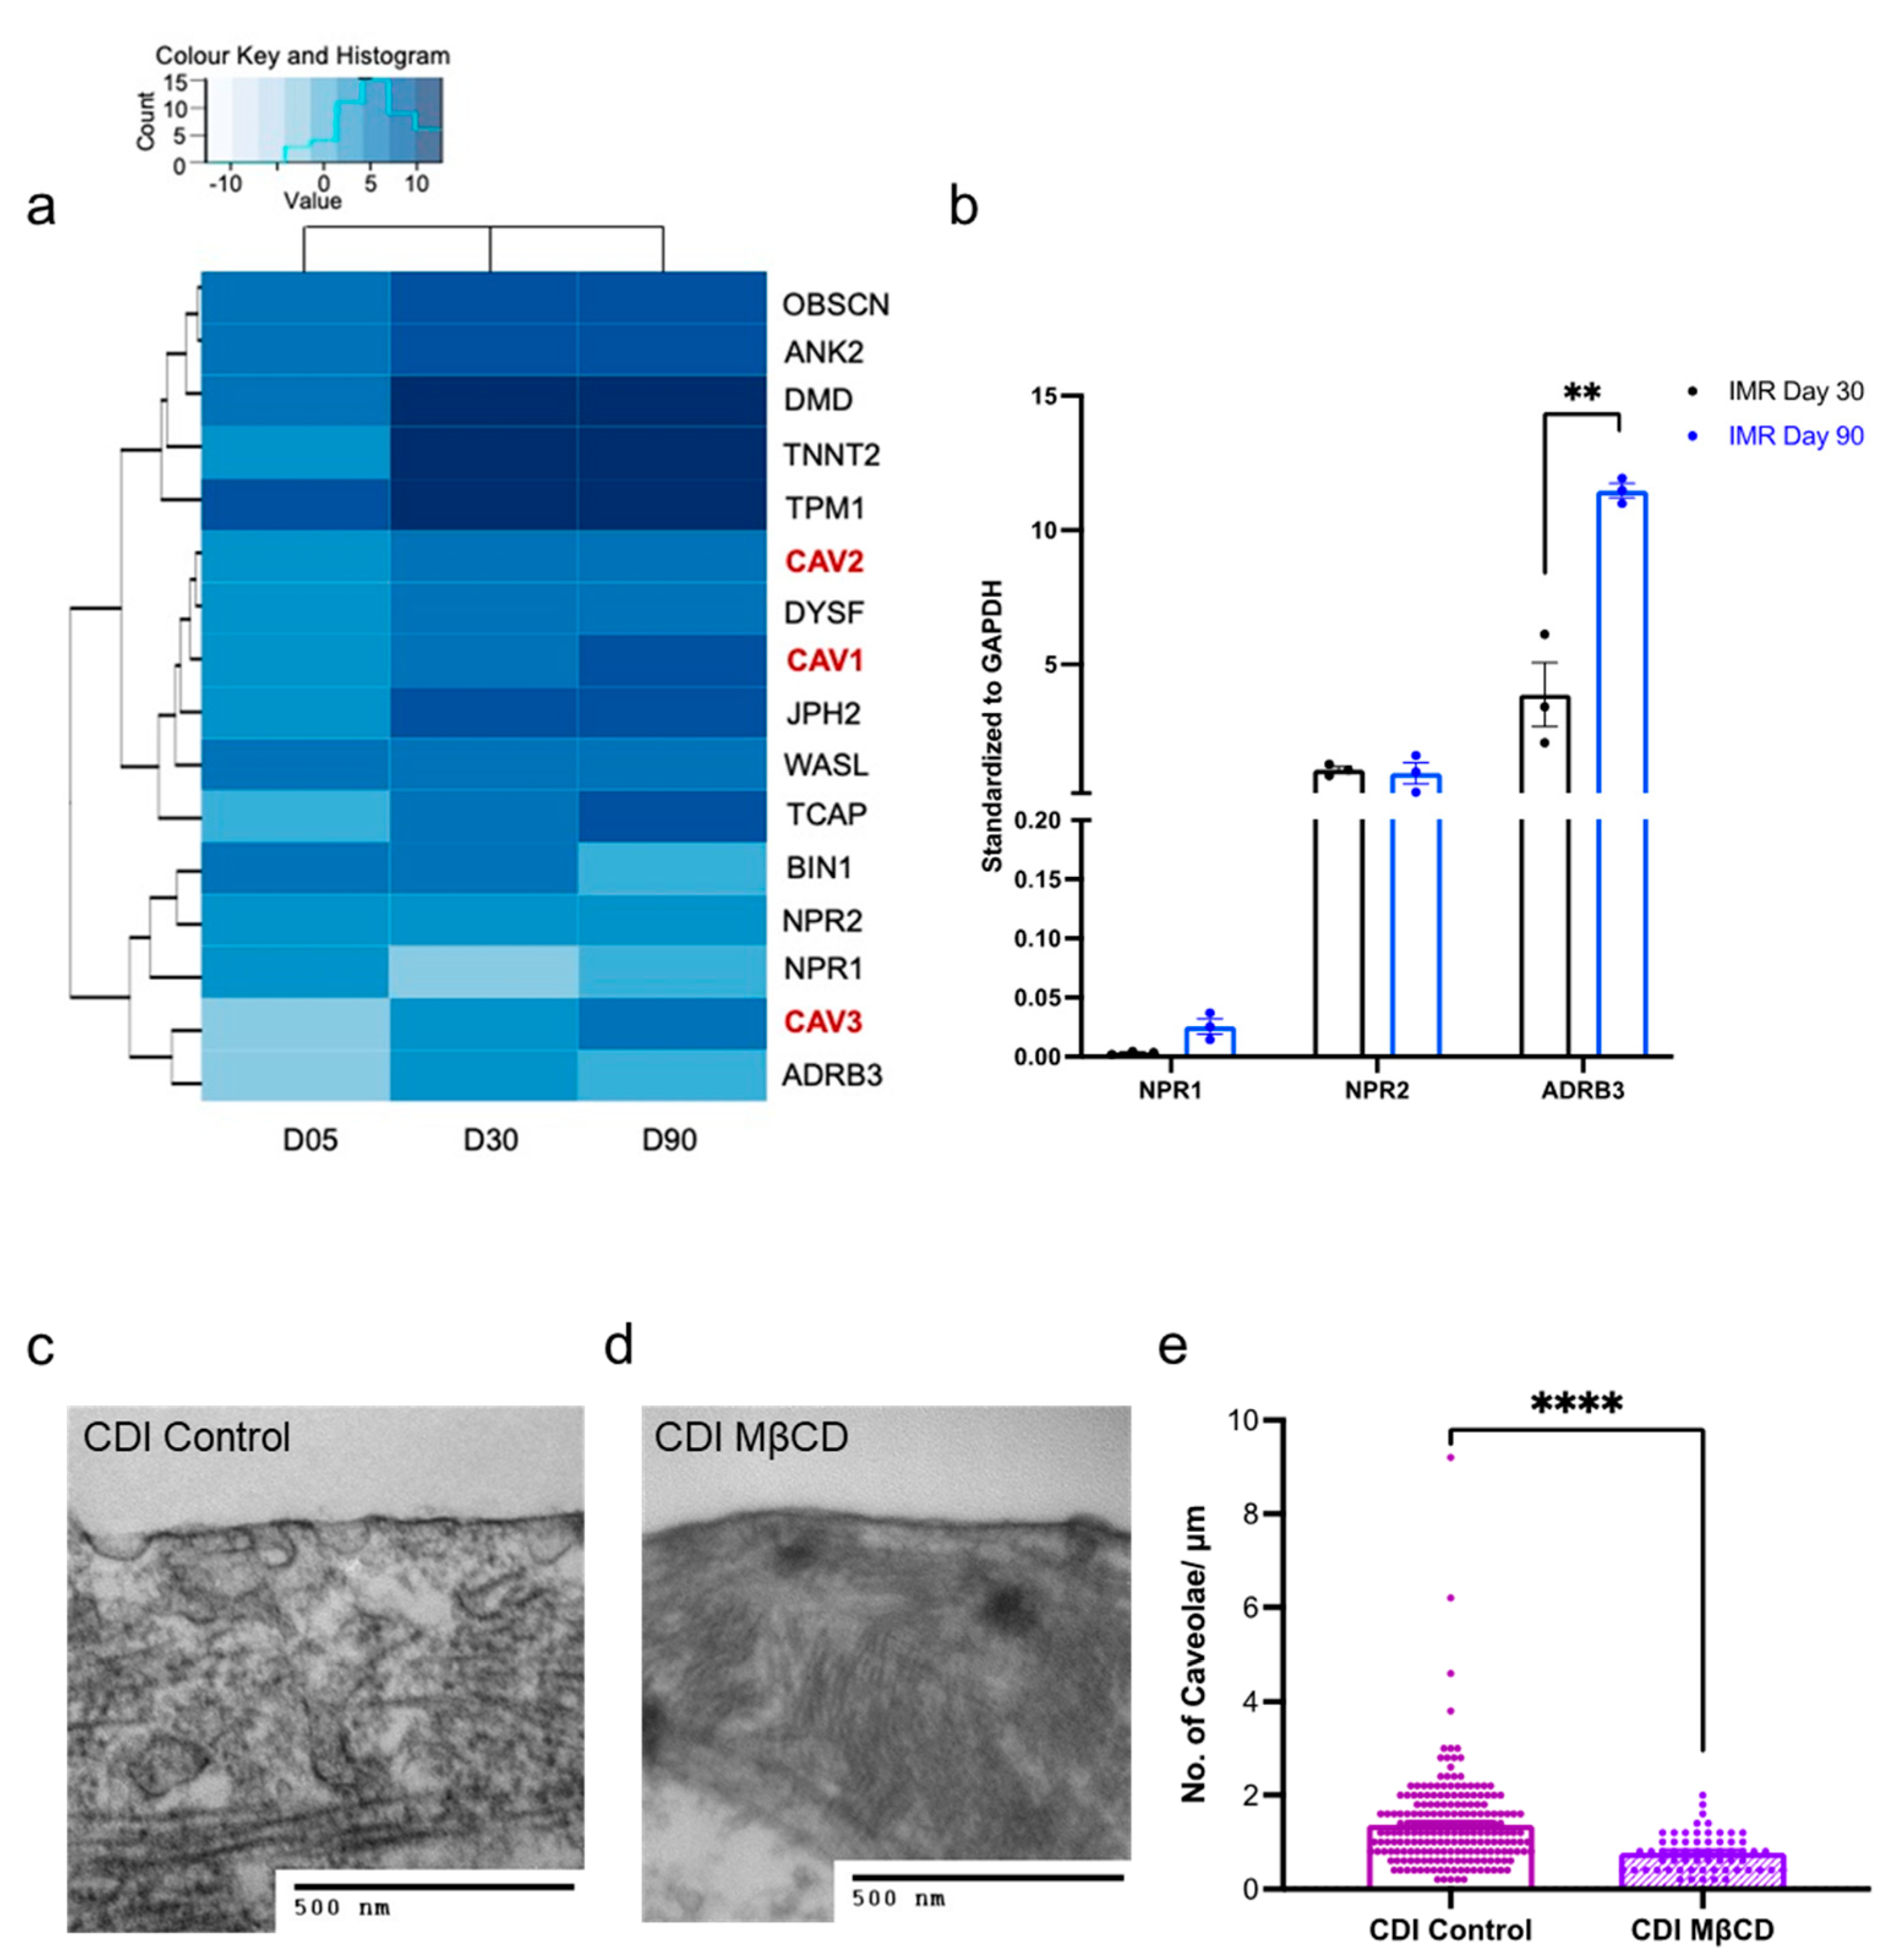
3.3. hPSC-CMs Increase Their Structural Components over Time in Culture
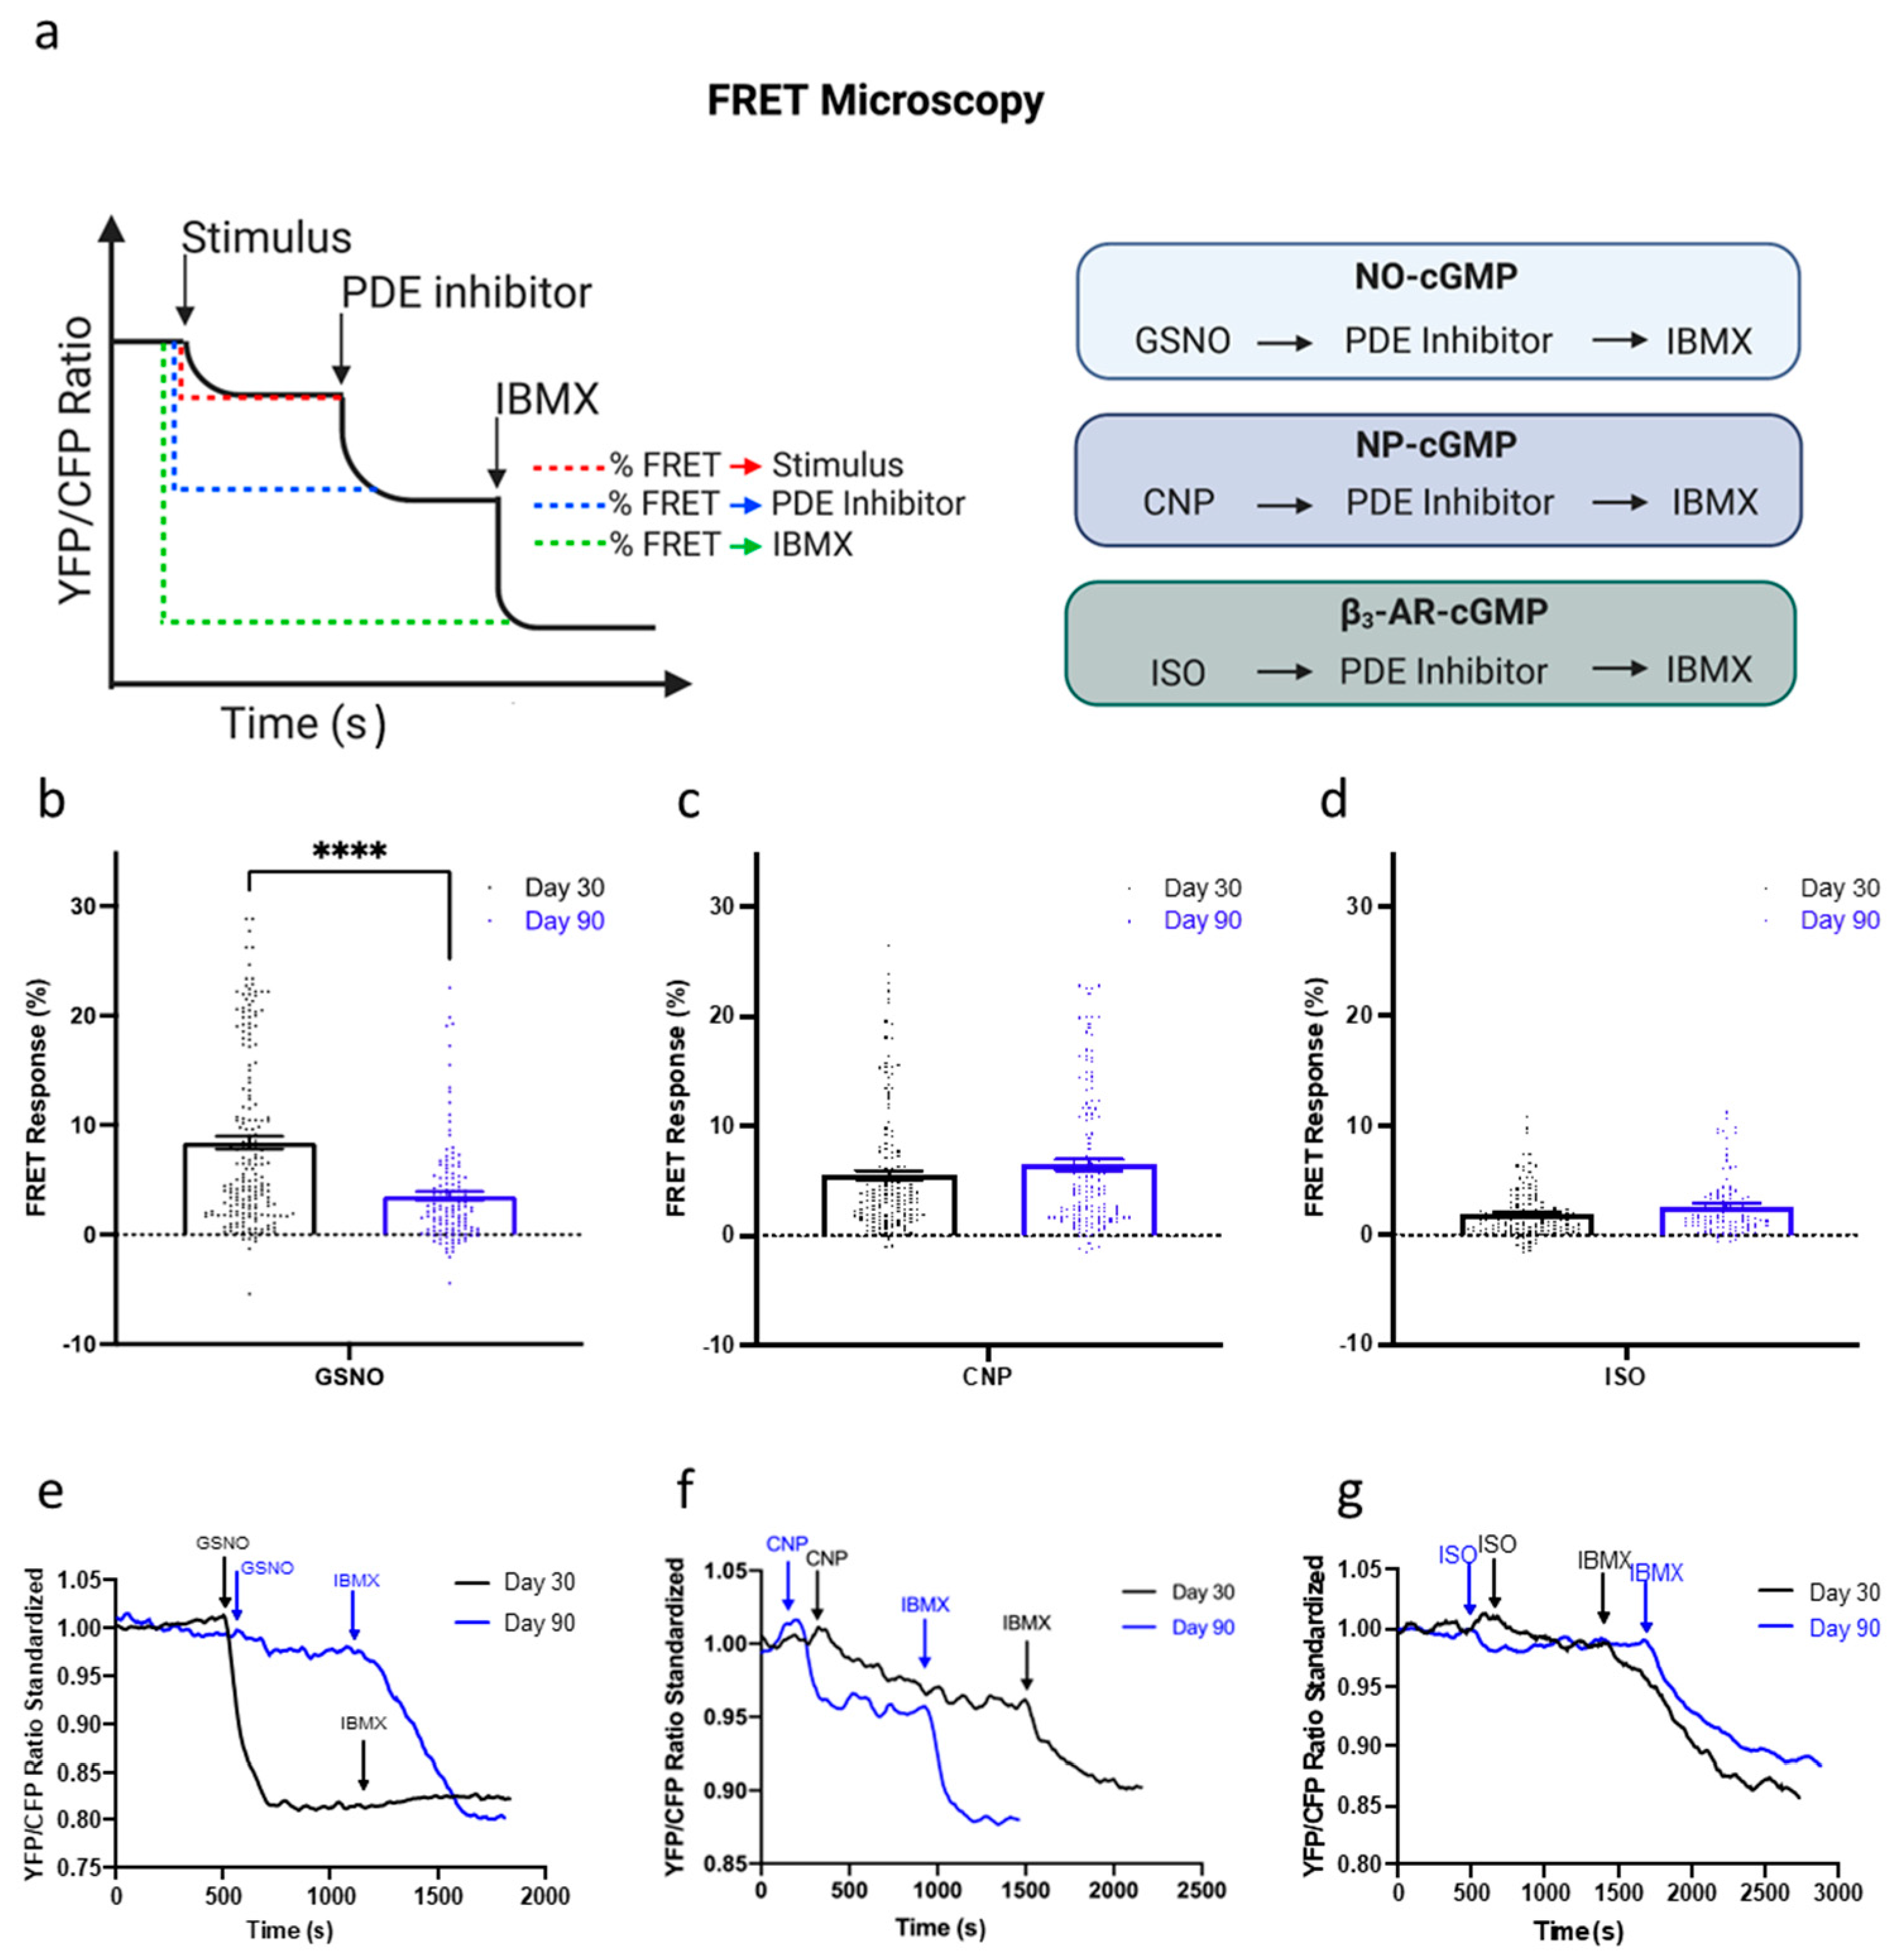
3.4. Levels of cGMP Synthesis Change Depending on the Pathway Stimulated and hPSC-CM Age
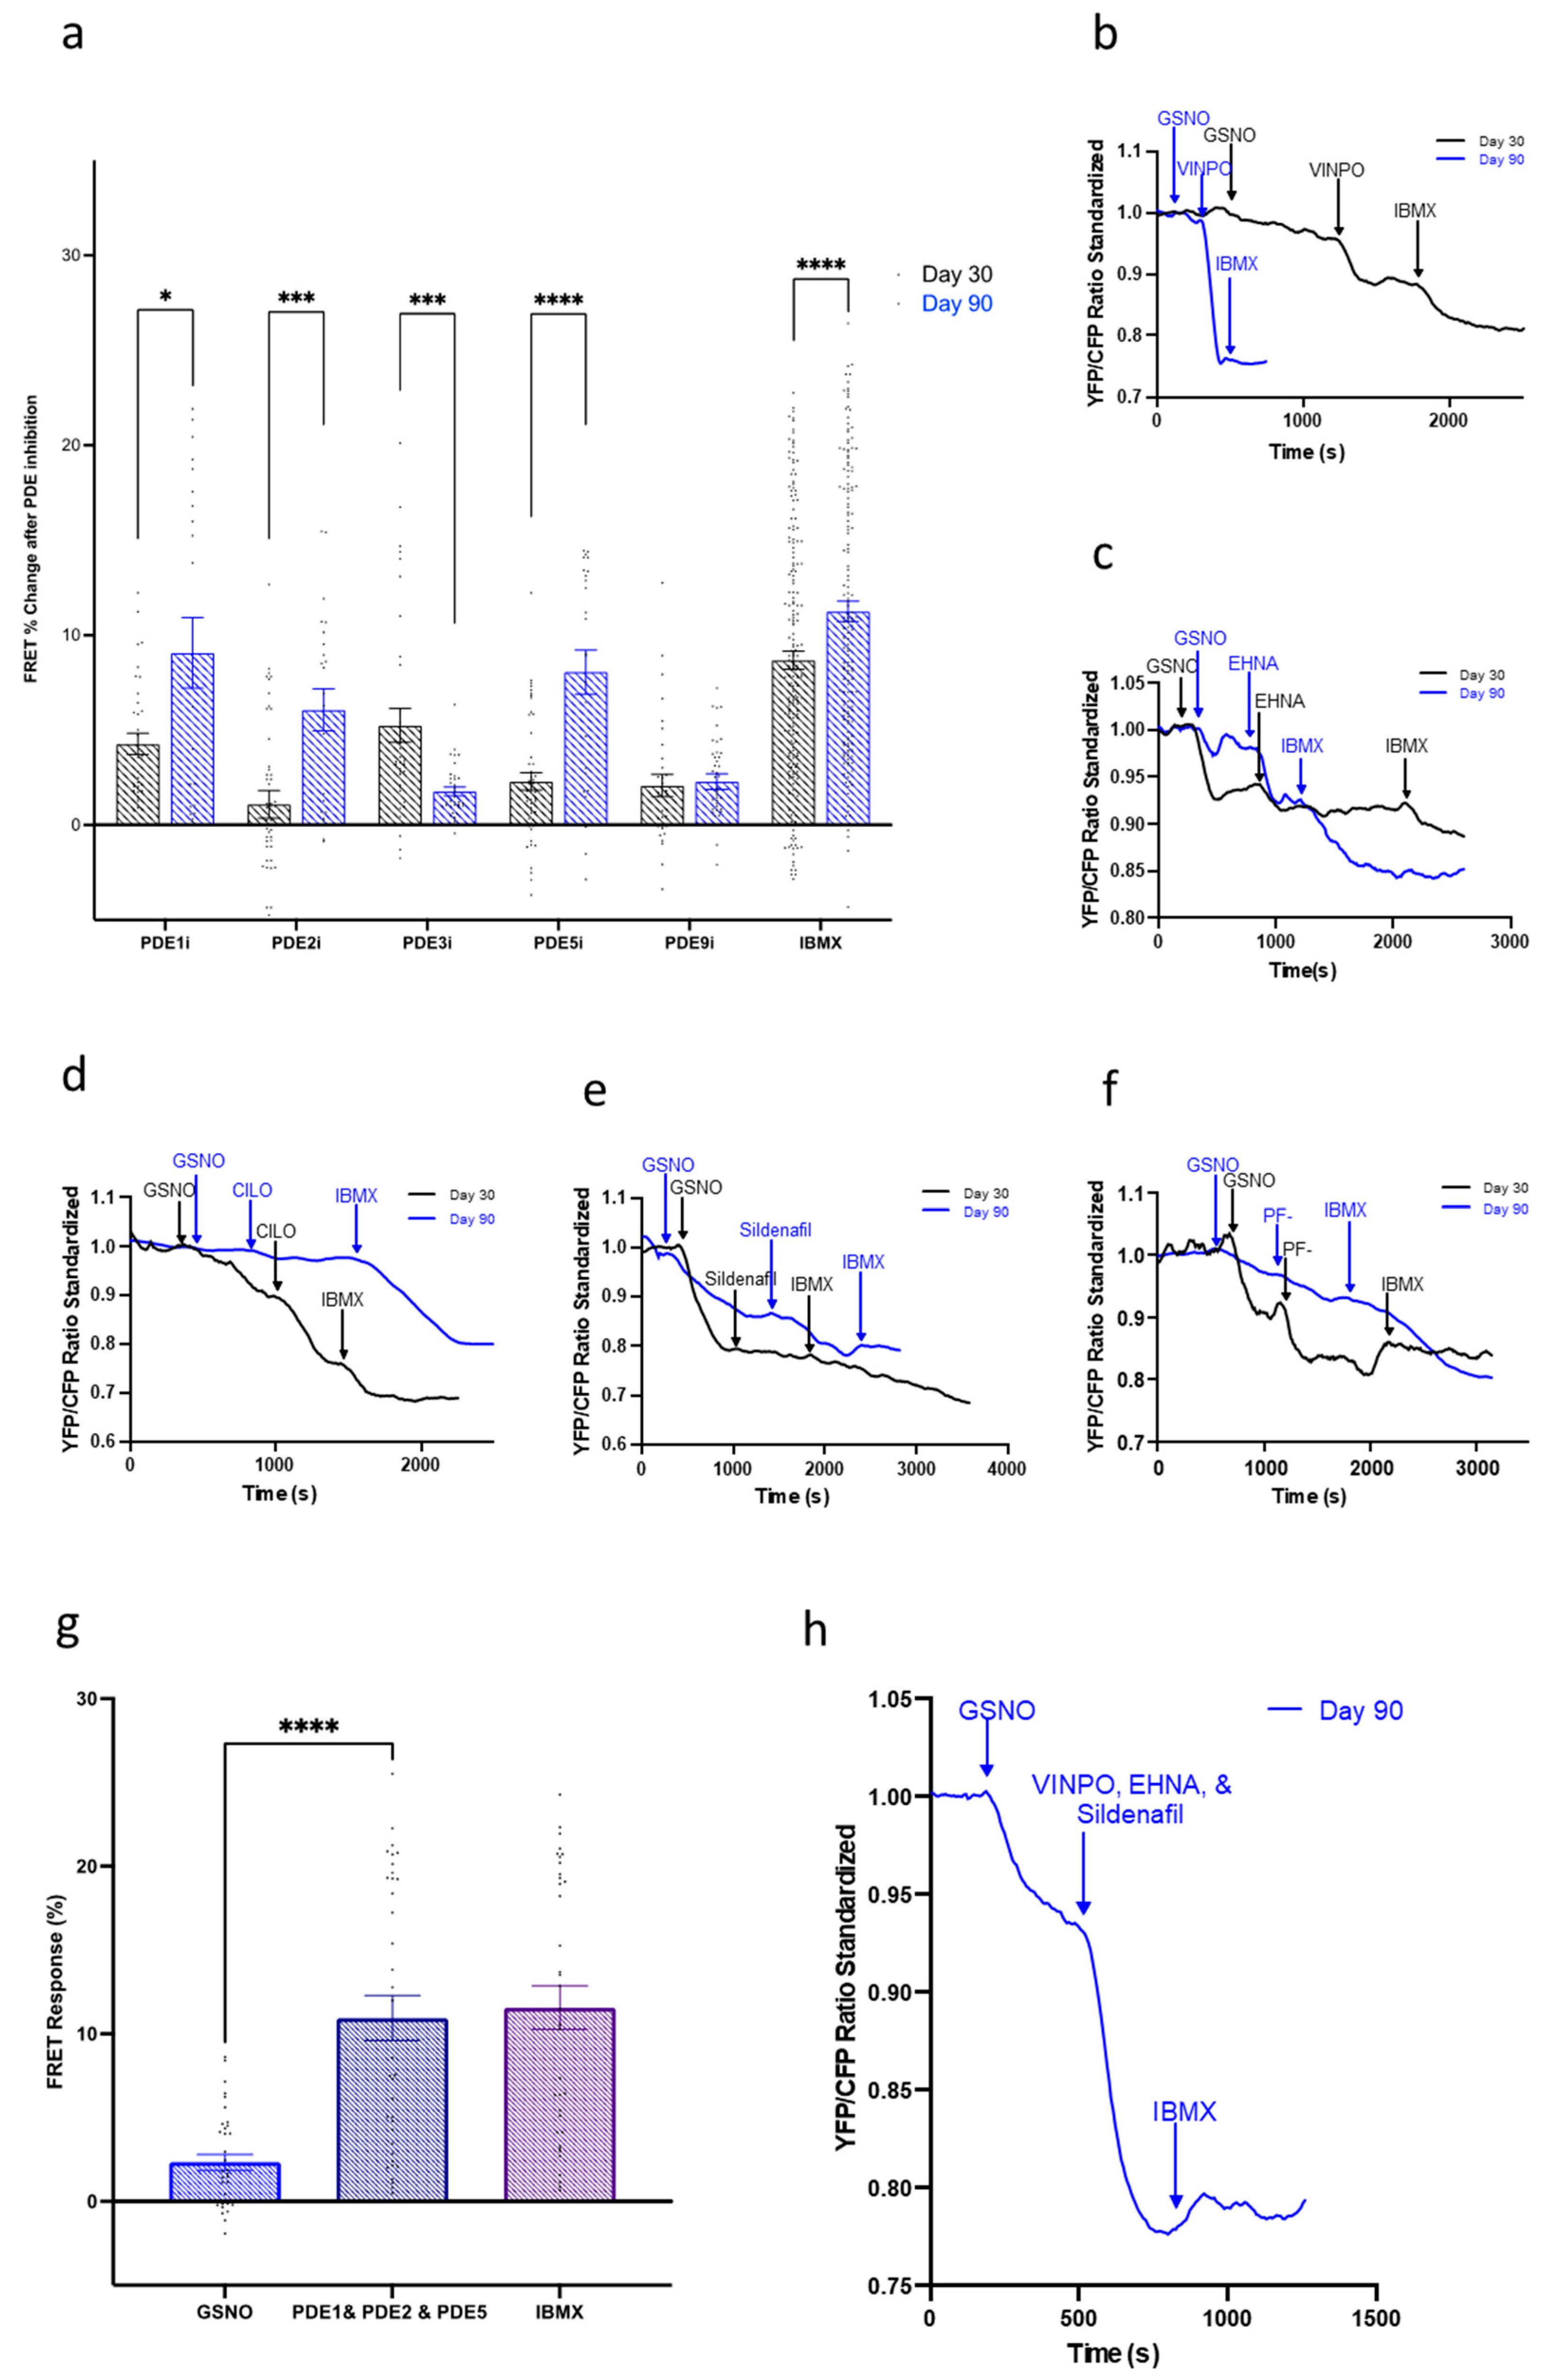
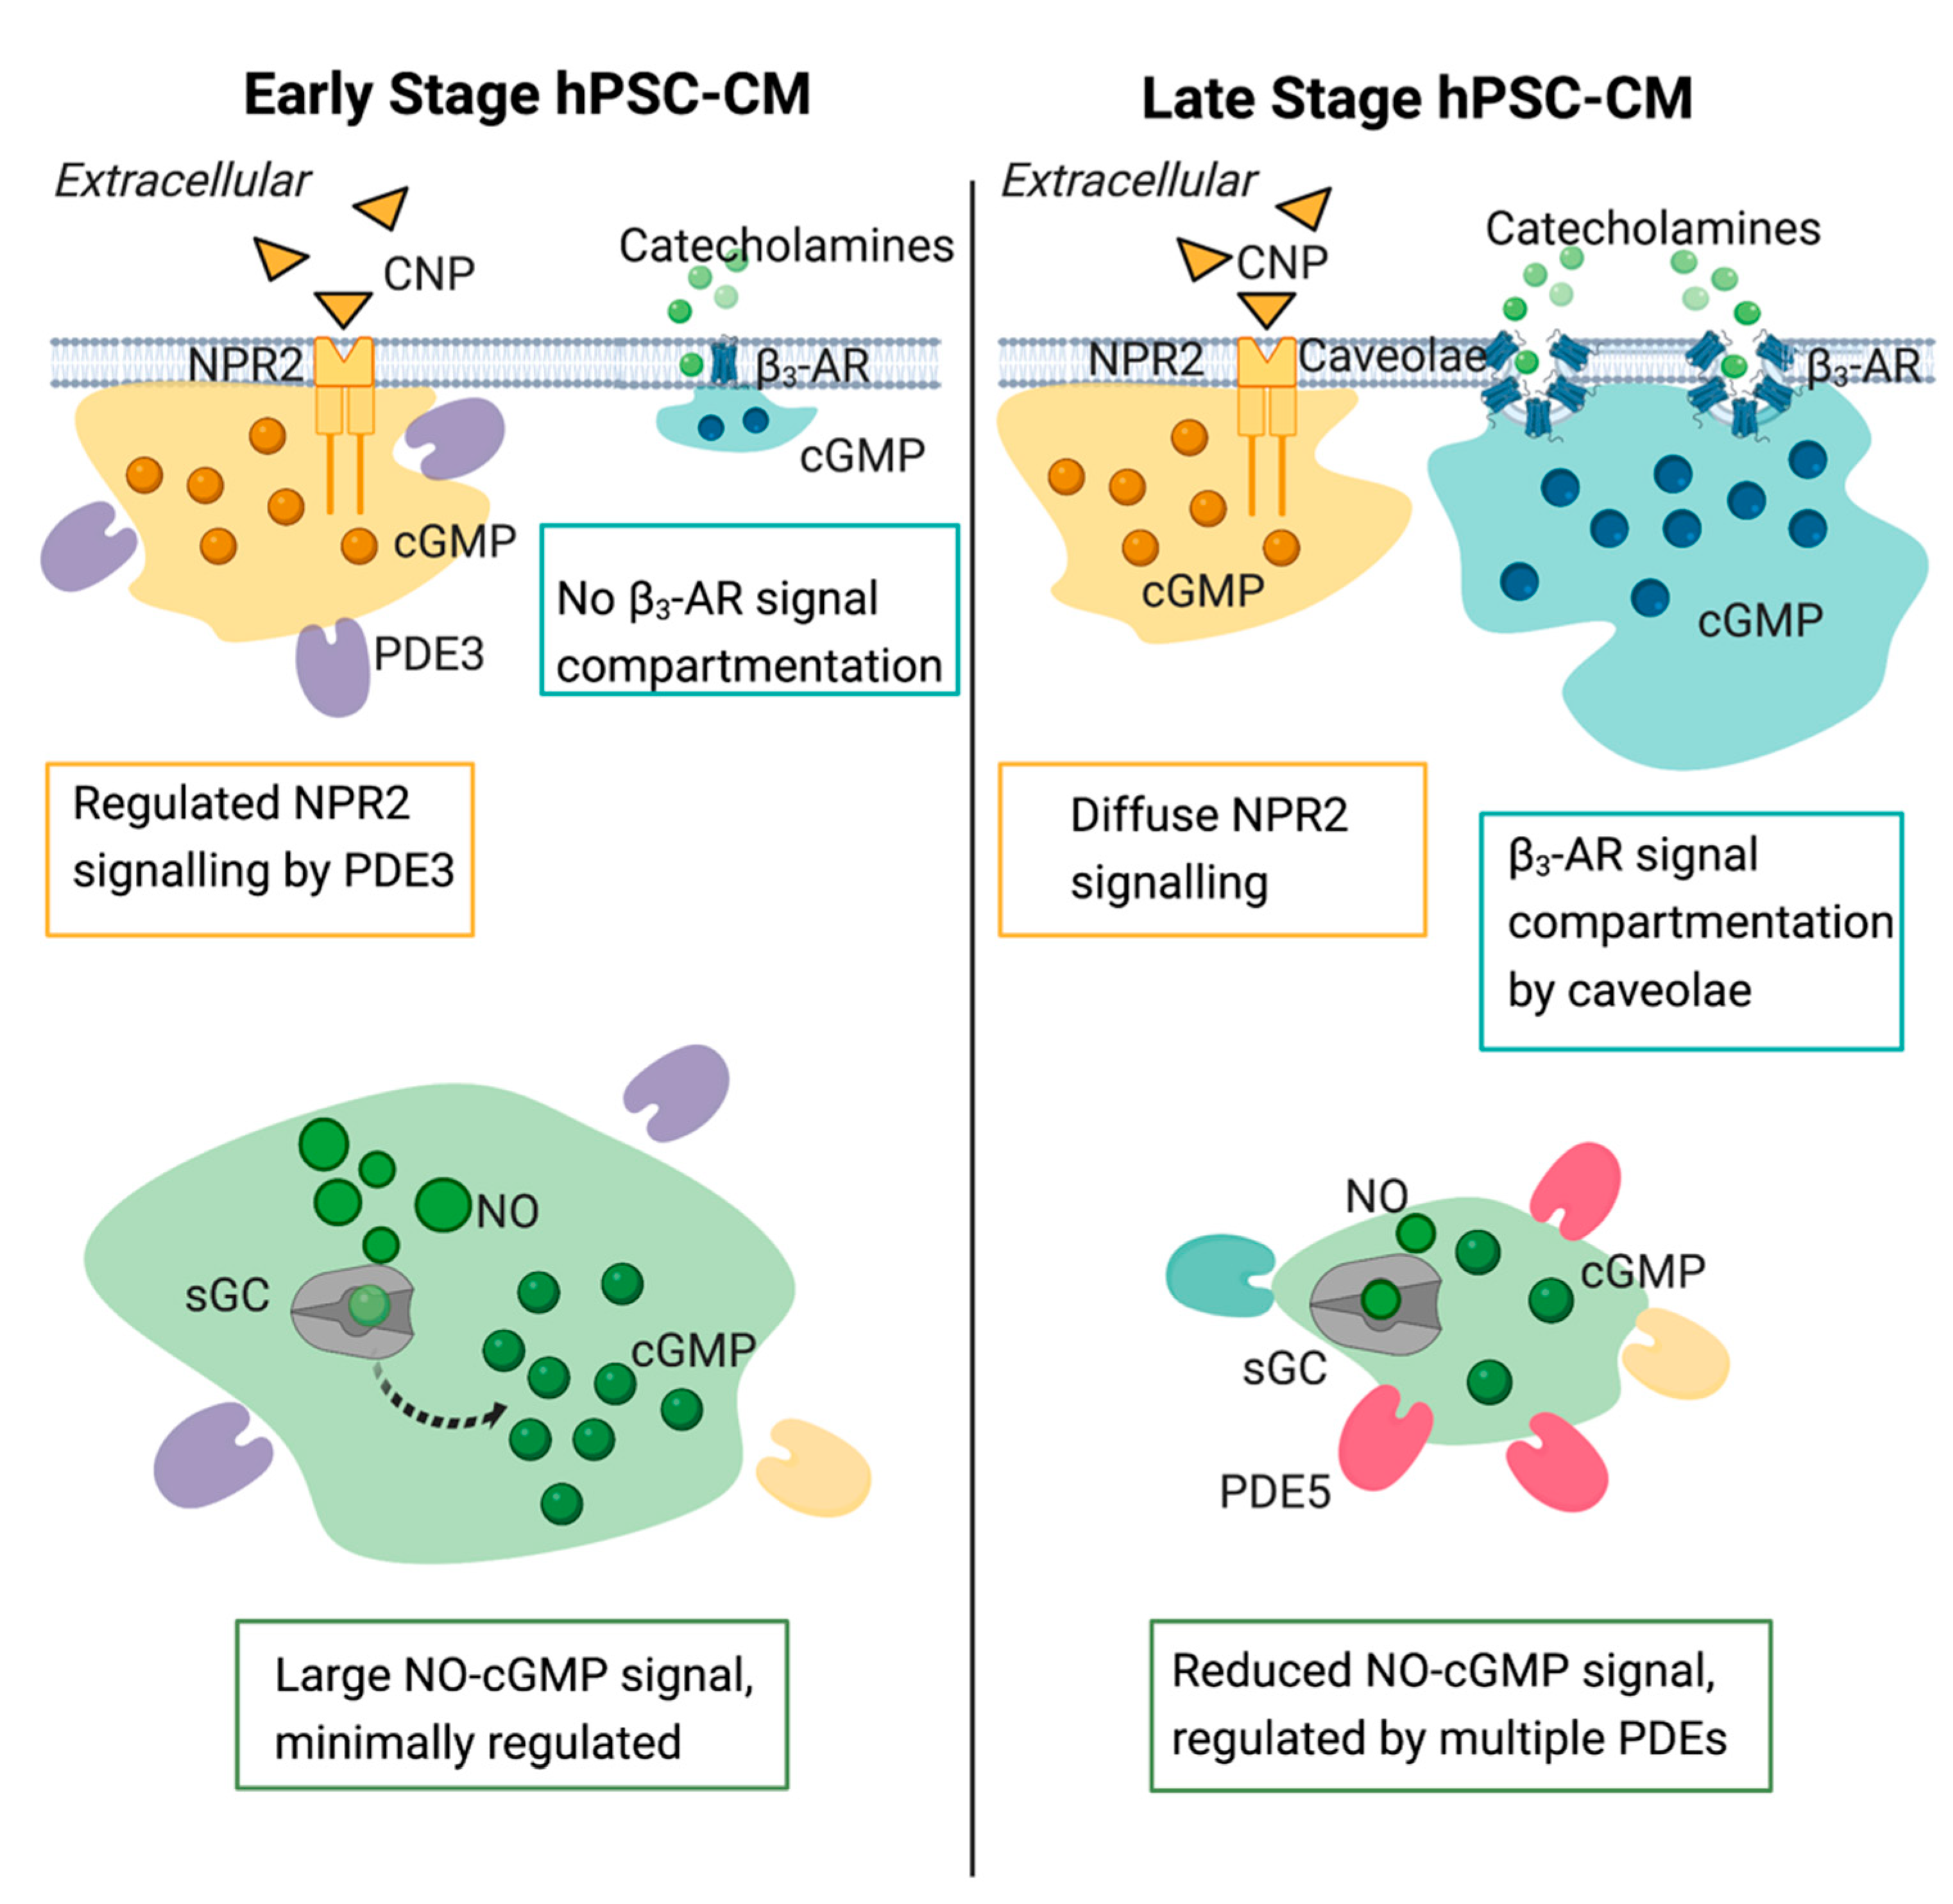
3.5. Compartmentation of the NO-cGMP Pathway Is Regulated via PDE Activity
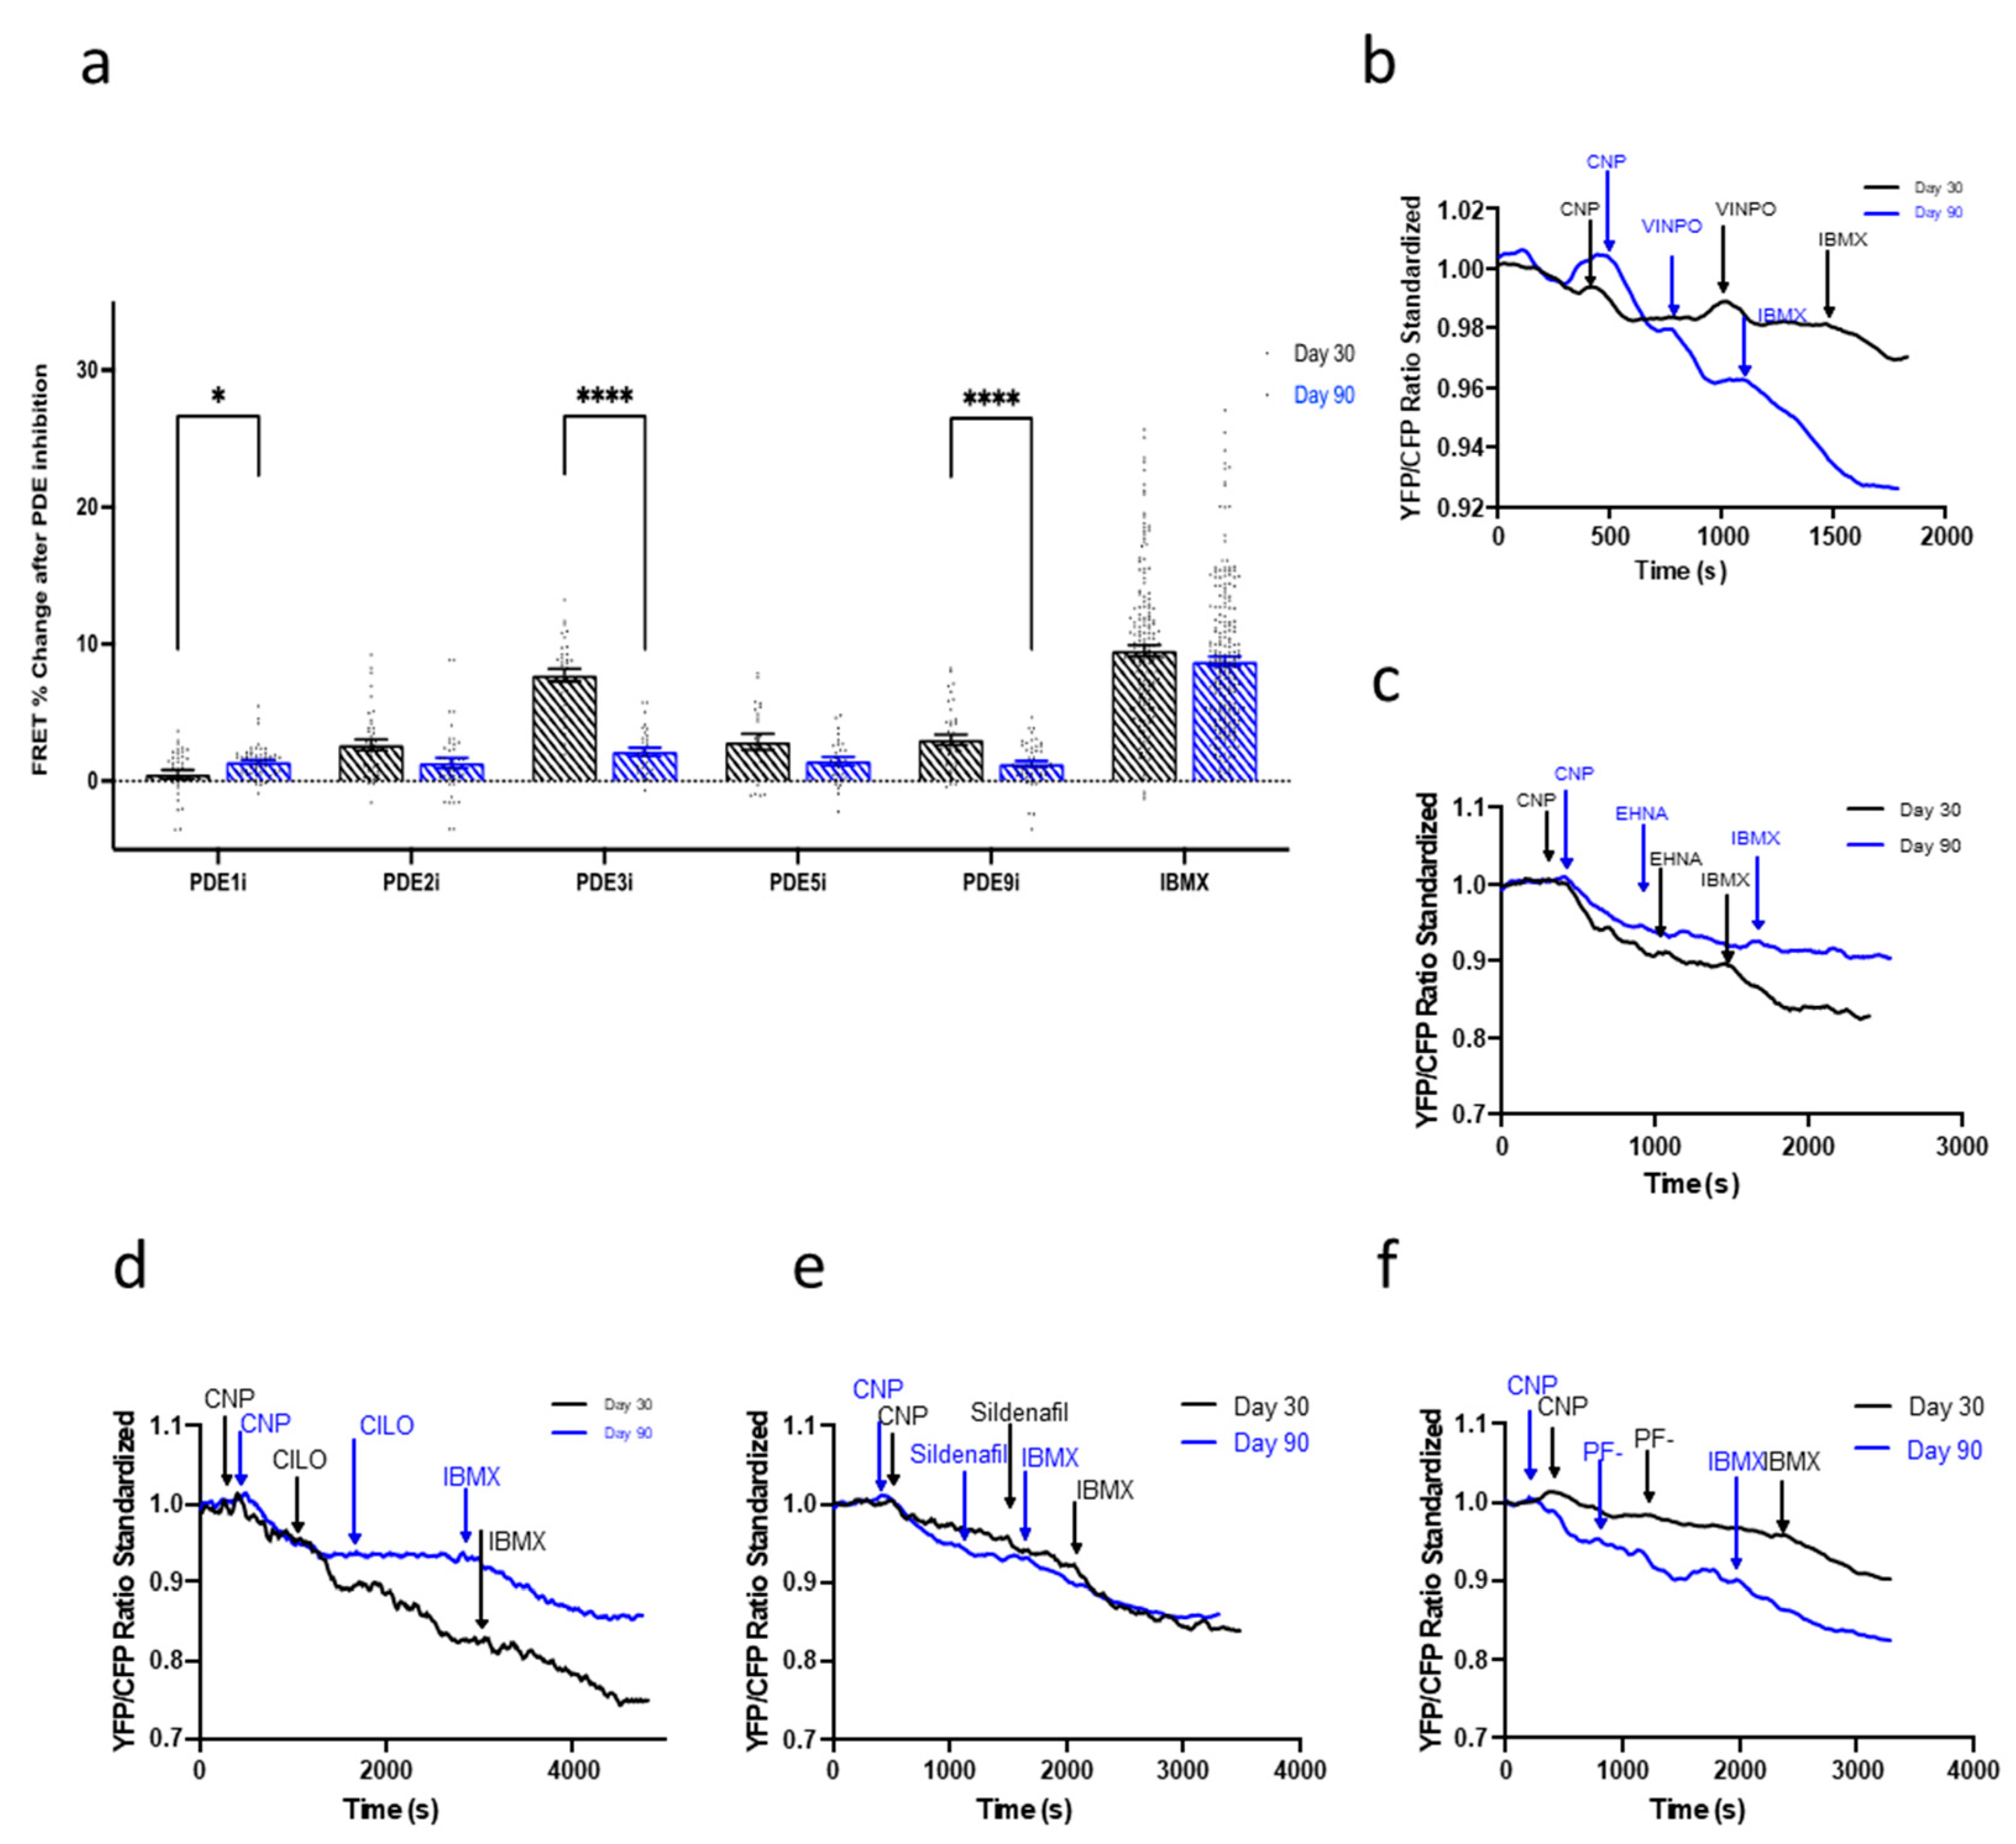
3.6. Maturation of the NP-cGMP Pathway Results in cGMP Signalling That Is Not Locally Restricted
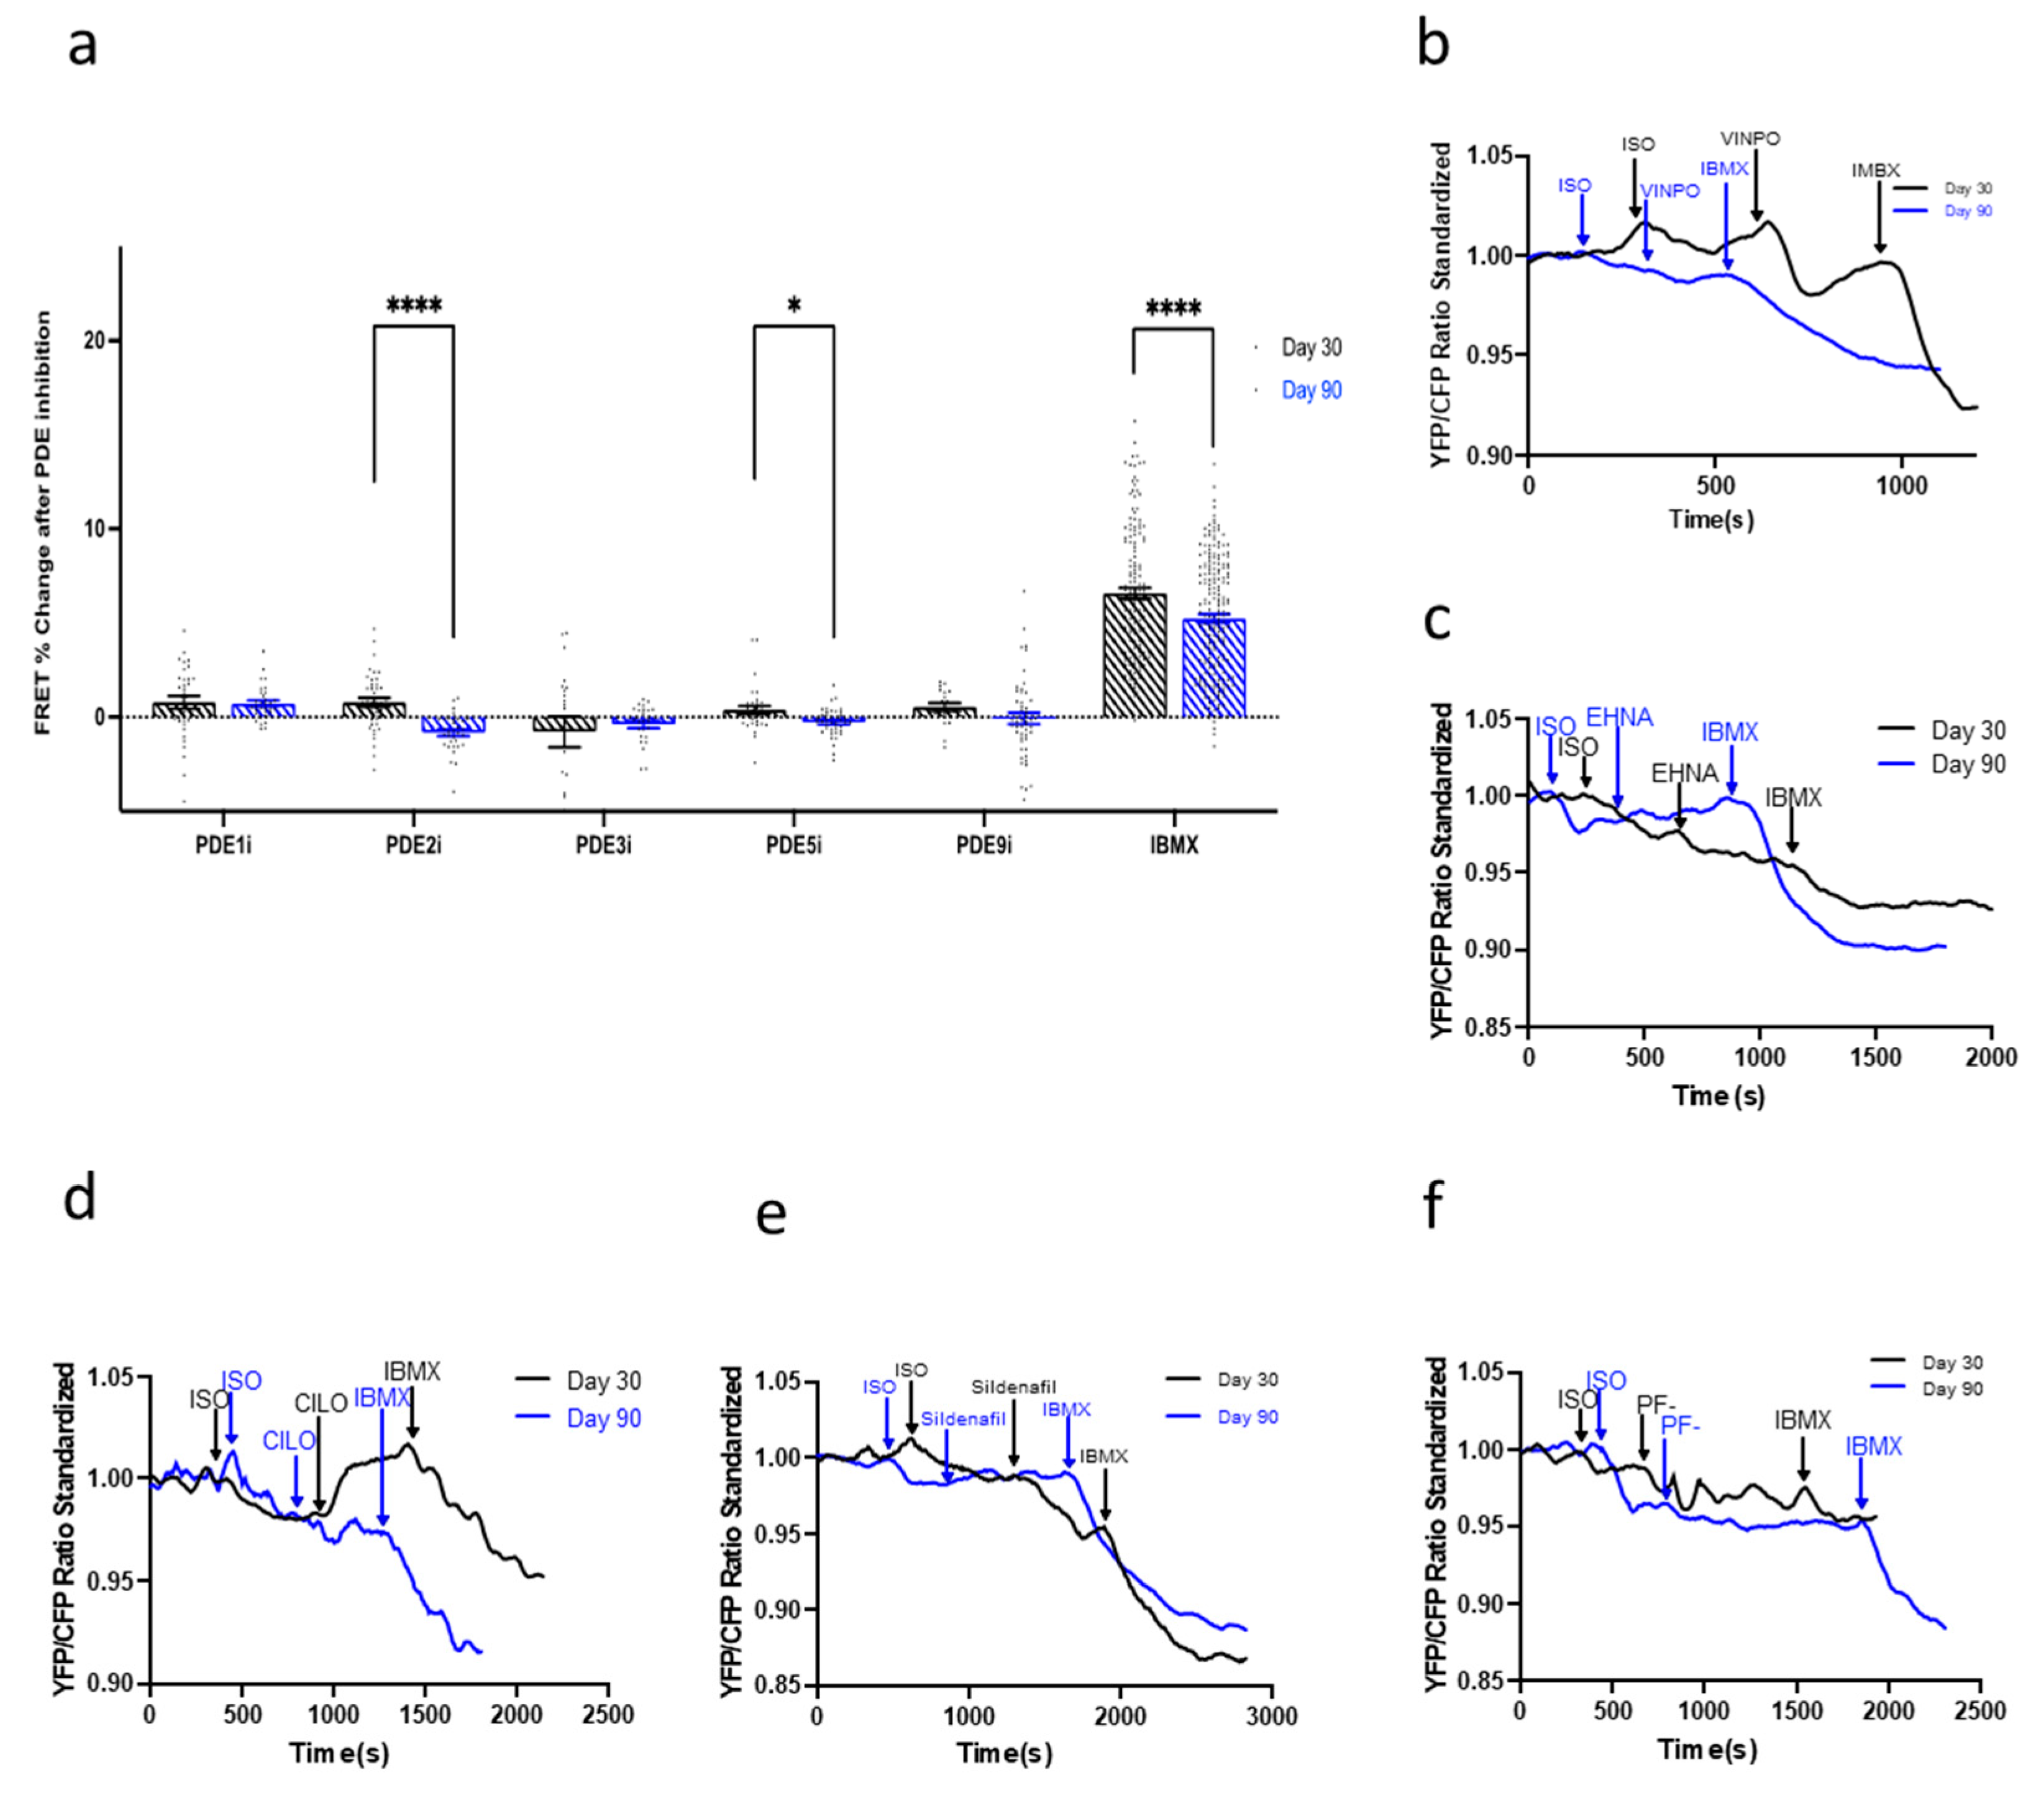
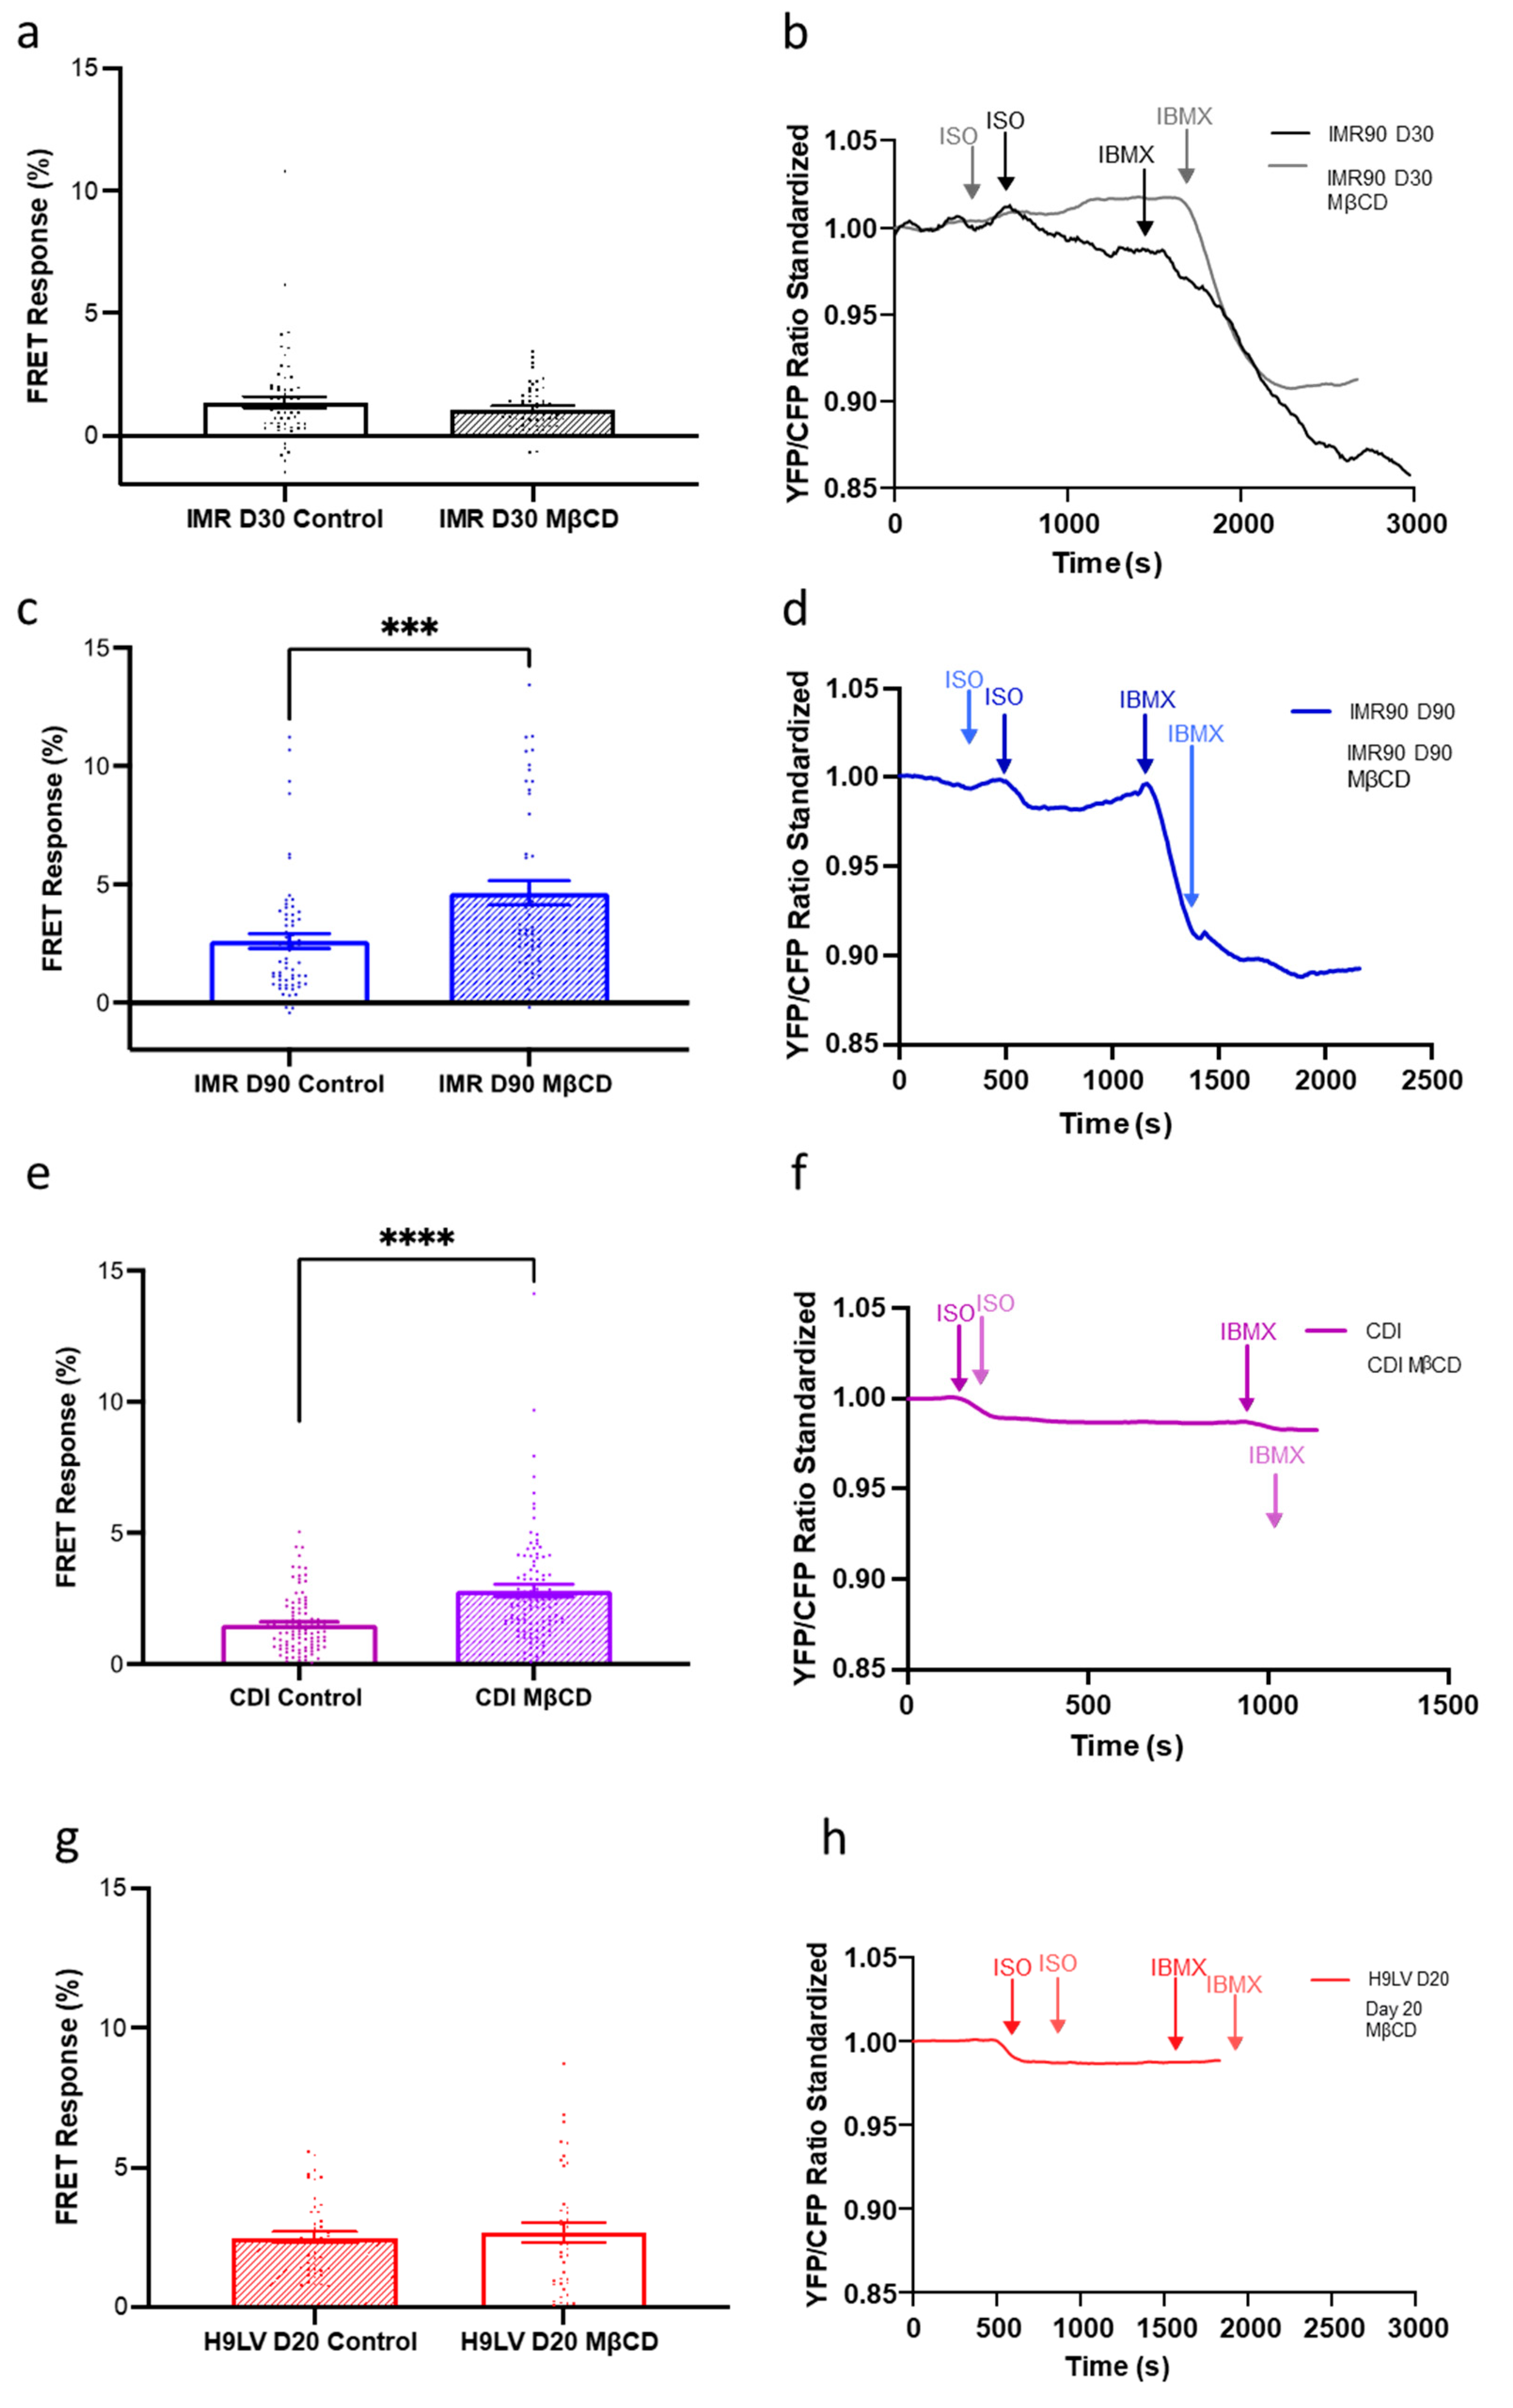
3.7. Compartmentation and Development of β3-AR-cGMP Pathway Is Dependent on Caveolae Structure Formation
4. Discussion
5. Conclusions
Supplementary Materials
Author Contributions
Funding
Acknowledgments
Conflicts of Interest
References
- Zaccolo, M. cAMP signal transduction in the heart: Understanding spatial control for the development of novel therapeutic strategies. J. Cereb. Blood Flow Metab. 2009, 158, 50–60. [Google Scholar] [CrossRef] [PubMed]
- Stangherlin, A.; Zaccolo, M. cGMP-cAMP interplay in cardiac myocytes: A local affair with far-reaching consequences for heart function. Biochem. Soc. Trans. 2012, 40, 11–14. [Google Scholar] [CrossRef] [PubMed]
- Pilz, R.B.; Casteel, D.E. Regulation of Gene Expression by Cyclic GMP. Circ. Res. 2003, 93, 1034–1046. [Google Scholar] [CrossRef]
- Mongillo, M.; Tocchetti, C.G.; Terrin, A.; Lissandron, V.; Cheung, Y.F.; Dostmann, W.R.; Pozzan, T.; Kass, D.A.; Paolocci, N.; Houslay, M.D.; et al. Compartmentalized phosphodiesterase-2 activity blunts β-adrenergic cardiac inotropy via an NO/cGMP-dependent pathway. Circ. Res. 2006, 98, 226–234. [Google Scholar] [CrossRef]
- Calamera, G.; Moltzau, L.R.; Levy, F.O.; Andressen, K.W. Phosphodiesterases and Compartmentation of cAMP and cGMP Signaling in Regulation of Cardiac Contractility in Normal and Failing Hearts. Int. J. Mol. Sci. 2022, 23, 2145. [Google Scholar] [CrossRef] [PubMed]
- Belge, C.; Hammond, J.; Dubois-Deruy, E.; Manoury, B.; Hamelet, J.; Beauloye, C.; Markl, A.; Pouleur, A.C.; Bertrand, L.; Esfahani, H.; et al. Enhanced expression of β3-adrenoceptors in cardiac myocytes attenuates neurohormone-induced hyper-trophic remodeling through nitric oxide synthase. Circulation 2014, 129, 451–462. [Google Scholar] [CrossRef] [PubMed]
- Schobesberger, S.; Wright, P.T.; Poulet, C.; Mardones, J.L.S.A.; Mansfield, C.; Friebe, A.; Harding, S.; Balligand, J.-L.; Nikolaev, O.V.; Gorelik, J. β3-Adrenoceptor redistribution impairs NO/cGMP/PDE2 signalling in failing cardiomyocytes. eLife 2020, 9, e10566. [Google Scholar] [CrossRef] [PubMed]
- Bork, N.I.; Nikolaev, V.O. cGMP Signaling in the Cardiovascular System—The Role of Compartmentation and Its Live Cell Imaging. Int. J. Mol. Sci. 2018, 19, 801. [Google Scholar] [CrossRef] [PubMed]
- Bhogal, N.K.; Hasan, A.; Gorelik, J. The Development of Compartmentation of cAMP Signaling in Cardiomyocytes: The Role of T-Tubules and Caveolae Microdomains. J. Cardiovasc. Dev. Dis. 2018, 5, 25. [Google Scholar] [CrossRef] [PubMed]
- Hasan, A.; Mohammadi, N.; Nawaz, A.; Kodagoda, T.; Diakonov, I.; Harding, S.E.; Gorelik, J. Age-Dependent Maturation of iPSC-CMs Leads to the Enhanced Compartmentation of β2AR-cAMP Signalling. Cells 2020, 9, 2275. [Google Scholar] [CrossRef]
- Nikolaev, V.O.; Moshkov, A.; Lyon, A.R.; Miragoli, M.; Novak, P.; Paur, H.; Lohse, M.J.; Korchev, Y.E.; Harding, S.E.; Gorelik, J. Beta2-adrenergic receptor redistribution in heart failure changes cAMP compartmentation. Science 2010, 327, 1653–1657. [Google Scholar] [CrossRef] [PubMed]
- Castro, L.R.V.; Verde, I.; Cooper, D.M.; Fischmeister, R. Cyclic Guanosine Monophosphate Compartmentation in Rat Cardiac Myocytes. Circulation 2006, 113, 2221–2228. [Google Scholar] [CrossRef]
- Lee, D.I.; Zhu, G.; Sasaki, T.; Cho, G.-S.; Hamdani, N.; Holewinski, R.J.; Jo, S.-H.; Danner, T.; Zhang, M.; Rainer, P.P.; et al. Phosphodiesterase 9A controls nitric-oxide-independent cGMP and hypertrophic heart disease. Nature 2015, 519, 472–476. [Google Scholar] [CrossRef]
- Yan, C.; Miller, C.L.; Abe, J.-I. Regulation of Phosphodiesterase 3 and Inducible cAMP Early Repressor in the Heart. Circ. Res. 2007, 100, 489–501. [Google Scholar] [CrossRef] [PubMed]
- Götz, K.R.; Sprenger, J.U.; Perera, R.K.; Steinbrecher, J.H.; Lehnart, S.E.; Kuhn, M.; Gorelik, J.; Balligand, J.L.; Nikolaev, V.O. Transgenic mice for real-time visualization of cGMP in intact adult cardiomyocytes. Circ Res. 2014, 114, 1235–1245. [Google Scholar] [CrossRef] [PubMed]
- Kenan, Y.; Murata, T.; Shakur, Y.; Degerman, E.; Manganiello, V.C. Functions of the N-terminal region of cyclic nucleotide phos-phodiesterase 3 (PDE 3) isoforms. J. Biol. Chem. 2000, 275, 12331–12338. [Google Scholar] [CrossRef] [PubMed]
- Movsesian, M.; Ahmad, F.; Hirsch, E. Functions of PDE3 Isoforms in Cardiac Muscle. J. Cardiovasc. Dev. Dis. 2018, 5, 10. [Google Scholar] [CrossRef] [PubMed]
- Pavlaki, N.; Nikolaev, V. Imaging of PDE2- and PDE3-Mediated cGMP-to-cAMP Cross-Talk in Cardiomyocytes. J Cardiovasc. Dev. Dis. 2018, 5, 4. [Google Scholar] [CrossRef] [PubMed]
- Evgenov, O.V.; Pacher, P.; Schmidt, P.M.; Haskó, G.; Schmidt, H.H.H.W.; Stasch, J.P. NO-independent stimulators and activators of soluble guanylate cyclase: Discovery and therapeutic potential. Nat. Rev. Drug Discov. 2006, 5, 755–768. [Google Scholar] [CrossRef]
- Barnes, H.; Brown, Z.; Burns, A.; Williams, T. Phosphodiesterase 5 inhibitors for pulmonary hypertension. Cochrane Database Syst. Rev. 2019, 2019, CD012621. [Google Scholar] [CrossRef] [PubMed]
- Sandner, P.; Stasch, J.P. Anti-fibrotic effects of soluble guanylate cyclase stimulators and activators: A review of the preclinical evidence. Respir. Med. 2017, 122, S1–S9. [Google Scholar] [CrossRef]
- Burnett, J.C. Vericiguat—Another Victory for Targeting Cyclic GMP in Heart Failure. N. Engl. J. Med. 2020, 382, 1952–1953. [Google Scholar] [CrossRef]
- Beyer, C.; Zenzmaier, C.; Palumbo-Zerr, K.; Mancuso, R.; Distler, A.; Dees, C.; Zerr, P.; Huang, J.; Maier, C.; Pachowsky, M.L.; et al. Stimulation of the soluble guanylate cyclase (sGC) inhibits fibrosis by blocking non-canonical TGFβ signalling. Ann. Rheum. Dis. 2014, 74, 1408–1416. [Google Scholar] [CrossRef]
- Chu, A.; Prasad, J. Up-regulation by human recombinant transforming growth factor β-1 of collagen production in cultured dermal fibroblasts is mediated by the inhibition of nitric oxide signaling. J. Am. Coll. Surg. 1999, 188, 271–280. [Google Scholar] [CrossRef]
- Burridge, P.W.; Keller, G.; Gold, J.D.; Wu, J.C. Production of de novo cardiomyocytes: Human pluripotent stem cell differen-tiation and direct reprogramming. Cell Stem Cell. 2012, 10, 16–28. [Google Scholar] [CrossRef]
- Germanguz, I.; Sedan, O.; Zeevi-Levin, N.; Shtrichman, R.; Barak, E.; Ziskind, A.; Eliyahu, S.; Meiry, G.; Amit, M.; Itskovitz-Eldor, J.; et al. Molecular characterization and functional properties of cardiomyocytes derived from human inducible pluripotent stem cells. J. Cell. Mol. Med. 2009, 15, 38–51. [Google Scholar] [CrossRef]
- Xu, X.Q.; Soo, S.Y.; Sun, W.; Zweigerdt, R. Global Expression Profile of Highly Enriched Cardiomyocytes Derived from Human Embryonic Stem Cells. Stem Cells 2009, 27, 2163–2174. [Google Scholar] [CrossRef] [PubMed]
- Park, I.-H.; Zhao, R.; West, J.A.; Yabuuchi, A.; Huo, H.; Ince, T.A.; Lerou, P.H.; Lensch, M.W.; Daley, G.Q. Reprogramming of human somatic cells to pluripotency with defined factors. Nature 2008, 451, 141–146. [Google Scholar] [CrossRef] [PubMed]
- Mummery, C.L.; Zhang, J.; Ng, E.S.; Elliott, D.A.; Elefanty, A.G.; Kamp, T.J. Differentiation of human embryonic stem cells and induced pluripotent stem cells to cardiomyocytes: A methods overview. Circ. Res. 2012, 111, 344–358. [Google Scholar] [CrossRef] [PubMed]
- Ramuz, M.; Hasan, A.; Gruscheski, L.; Diakonov, I.; Pavlaki, N.; Nikolaev, V.O.; Harding, S.; Dunsby, C.; Gorelik, J. A Software Tool for High-Throughput Real-Time Measurement of Intensity-Based Ratio-Metric FRET. Cells 2019, 8, 1541. [Google Scholar] [CrossRef]
- Calamera, G.; Ndongson-Dongmo, B.; Arunthavarajah, D.; Ovesen, M.; Kim, C.; Levy, F.O. Andressen KW and Moltzau LR. Natriuretic peptides protect against apoptosis and increase cGMP around cardiomyocyte mitochondria. Biorxiv 2022. [Google Scholar] [CrossRef]
- Ma, J.; Guo, L.; Fiene, S.J.; Anson, B.D.; Thomson, J.A.; Kamp, T.; Kolaja, K.; Swanson, B.J.; January, C.T. High purity human-induced pluripotent stem cell-derived cardiomyocytes: Electrophysiological properties of action potentials and ionic currents. Am. J. Physiol. Circ. Physiol. 2011, 301, H2006–H2017. [Google Scholar] [CrossRef] [PubMed]
- Rodal, S.K.; Skretting, G.; Garred, Ø.; Vilhardt, F.; Van Deurs, B.; Sandvig, K. Extraction of cholesterol with me-thyl-β-cyclodextrin perturbs formation of clathrin-coated endocytic vesicles. Mol. Biol. Cell. 1999, 10, 961–974. [Google Scholar] [CrossRef] [PubMed]
- Dobin, A.; Davis, C.A.; Schlesinger, F.; Drenkow, J.; Zaleski, C.; Jha, S.; Batut, P.; Chaisson, M.; Gingeras, T.R. STAR: Ultrafast universal RNA-seq aligner. Bioinformatics 2013, 29, 15–21. [Google Scholar] [CrossRef]
- Zhang, Y.; Parmigiani, G.; Johnson, W.E. ComBat-seq: Batch effect adjustment for RNA-seq count data. NAR Genom. Bioinform. 2020, 2, lqaa078. [Google Scholar] [CrossRef] [PubMed]
- Ewels, P.A.; Peltzer, A.; Fillinger, S.; Patel, H.; Alneberg, J.; Wilm, A.; Garcia, M.U.; Di Tommaso, P.; Nahnsen, S. The nf-core framework for community-curated bioinformatics pipelines. Nat. Biotechnol. 2020, 38, 276–278. [Google Scholar] [CrossRef] [PubMed]
- Li, B.; Dewey, C.N. RSEM: Accurate transcript quantification from RNA-Seq data with or without a reference genome. BMC Bioinform. 2011, 12, 323. [Google Scholar] [CrossRef] [PubMed]
- Dark, N.; Cosson, M.V.; Owen, T.J.; Tsansizi, L.I.; Ferraro, E.; Francis, A.J.; Tsai, S.; Bouissou, C.; Kodagoda, T.; Weston, A.; et al. Fast Generation of Left Ventricle-Like Cardiomyocytes with Mature Properties from Human Pluripotent Stem Cells. The Francis Crick Institute, London, UK. 2022, submitted, manuscript under review.
- Wang, L.; Yu, P.; Zhou, B.; Song, J.; Li, Z.; Zhang, M.; Guo, G.; Wang, Y.; Chen, X.; Han, L.; et al. Single-cell reconstruction of the adult human heart during heart failure and recovery reveals the cellular landscape underlying cardiac function. Nat. Cell Biol. 2020, 22, 108–119. [Google Scholar] [CrossRef]
- Vandeput, F.; Wolda, S.L.; Krall, J.; Hambleton, R.; Uher, L.; McCaw, K.N.; Radwanski, P.B.; Florio, V.; Movsesian, M.A. Cyclic Nucleotide Phosphodiesterase PDE1C1 in Human Cardiac Myocytes. J. Biol. Chem. 2007, 282, 32749–32757. [Google Scholar] [CrossRef] [PubMed]
- Zaccolo, M.; Movsesian, M.A. cAMP and cGMP signaling cross-talk: Role of phosphodiesterases and implications for cardiac pathophysiology. Circ Res. 2007, 100, 1569–1578. [Google Scholar] [CrossRef] [PubMed]
- Weston, M.C.; Degerman, E.; Manganiello, V.C.; Holst, L.S. CHAPTER 194—cAMP/cGMP Dual-Specificity Phosphodiesterases. In Handbook of Cell Signaling; Ralph, A., Edward, B., Dennis, A., Eds.; Academic Press: Cambridge, MA, USA, 2003; pp. 441–446. ISBN 9780121245467. [Google Scholar] [CrossRef]
- Mehel, H.; Emons, J.; Vettel, C.; Wittköpper, K.; Seppelt, D.; Dewenter, M.; Lutz, S.; Sossalla, S.; Maier, L.S.; Lechêne, P.; et al. Phosphodiesterase-2 Is Up-Regulated in Human Failing Hearts and Blunts β-Adrenergic Responses in Cardiomyocytes. J. Am. Coll. Cardiol. 2013, 62, 1596–1606. [Google Scholar] [CrossRef] [PubMed]
- Wagner, M.; Mehel, H.; Fischmeister, R.; El-Armouche, A. Phosphodiesterase 2: Anti-adrenergic friend or hypertrophic foe in heart disease? Naunyn-Schmiedeberg’s Arch. Pharmacol. 2016, 389, 1139–1141. [Google Scholar] [CrossRef]
- Zoccarato, A.; Surdo, N.C.; Aronsen, J.M.; Fields, L.A.; Mancuso, L.; Dodoni, G.; Stangherlin, A.; Livie, C.; Jiang, H.; Sin, Y.Y.; et al. Cardiac Hypertrophy Is Inhibited by a Local Pool of cAMP Regulated by Phosphodiesterase 2. Circ. Res. 2015, 117, 707–719. [Google Scholar] [CrossRef] [PubMed]
- Subramanian, H.; Froese, A.; Jönsson, P.; Schmidt, H.; Gorelik, J.; Nikolaev, V.O. Distinct submembrane localisation compartmentalises cardiac NPR1 and NPR2 signalling to cGMP. Nat. Commun. 2018, 9, 2446. [Google Scholar] [CrossRef]
- Manfra, O.; Calamera, G.; Froese, A.; Arunthavarajah, D.; Surdo, N.C.; Meier, S.; Melleby, A.O.; Aasrum, M.; Aronsen, J.M.; Nikolaev, O.V.; et al. CNP regulates cardiac contractility and increases cGMP near both SERCA and TnI: Difference from BNP visualized by targeted cGMP biosensors. Cardiovasc. Res. 2021, 118, 1506–1519. [Google Scholar] [CrossRef] [PubMed]
- Kim, G.E.; Kass, D.A. Cardiac Phosphodiesterases and Their Modulation for Treating Heart Disease. Handb Exp Pharmacol. 2017, 243, 249–269. [Google Scholar] [CrossRef] [PubMed]


Publisher’s Note: MDPI stays neutral with regard to jurisdictional claims in published maps and institutional affiliations. |
© 2022 by the authors. Licensee MDPI, Basel, Switzerland. This article is an open access article distributed under the terms and conditions of the Creative Commons Attribution (CC BY) license (https://creativecommons.org/licenses/by/4.0/).
Share and Cite
Faleeva, M.; Diakonov, I.; Srivastava, P.; Ramuz, M.; Calamera, G.; Andressen, K.W.; Bork, N.; Tsansizi, L.; Cosson, M.-V.; Bernardo, A.S.; et al. Compartmentation of cGMP Signaling in Induced Pluripotent Stem Cell Derived Cardiomyocytes during Prolonged Culture. Cells 2022, 11, 3257. https://doi.org/10.3390/cells11203257
Faleeva M, Diakonov I, Srivastava P, Ramuz M, Calamera G, Andressen KW, Bork N, Tsansizi L, Cosson M-V, Bernardo AS, et al. Compartmentation of cGMP Signaling in Induced Pluripotent Stem Cell Derived Cardiomyocytes during Prolonged Culture. Cells. 2022; 11(20):3257. https://doi.org/10.3390/cells11203257
Chicago/Turabian StyleFaleeva, Maria, Ivan Diakonov, Prashant Srivastava, Masoud Ramuz, Gaia Calamera, Kjetil Wessel Andressen, Nadja Bork, Lorenza Tsansizi, Marie-Victoire Cosson, Andreia Sofia Bernardo, and et al. 2022. "Compartmentation of cGMP Signaling in Induced Pluripotent Stem Cell Derived Cardiomyocytes during Prolonged Culture" Cells 11, no. 20: 3257. https://doi.org/10.3390/cells11203257