Article

Neuroinflammatory Gene Expression Analysis Reveals Pathways of Interest as Potential Targets to Improve the Recording Performance of Intracortical Microelectrodes

1
Department of Biomedical Engineering, Case Western Reserve University, 2071 Martin Luther King Jr. Drive, Cleveland, OH 44106, USA
2
Advanced Platform Technology Center, Louis Stokes Cleveland Veterans Affairs Medical Center, Cleveland, OH 44106, USA
3
Veteran Affairs Ann Arbor Healthcare System, Ann Arbor, MI 48105, USA
4
Department of Biomedical Engineering, University of Michigan, Ann Arbor, MI 48109, USA
5
Department of Neurology, University of Michigan, Ann Arbor, MI 48109, USA
6
Institute for Computational Biology, Case Western Reserve University, Cleveland, OH 44106, USA
*
Author to whom correspondence should be addressed.
Cells 2022, 11(15), 2348; https://doi.org/10.3390/cells11152348
Submission received: 21 June 2022 / Revised: 22 July 2022 / Accepted: 26 July 2022 / Published: 30 July 2022
(This article belongs to the Collection Toll-Like Receptors in Pathologies)

Abstract

:
Intracortical microelectrodes are a critical component of brain-machine interface (BMI) systems. The recording performance of intracortical microelectrodes used for both basic neuroscience research and clinical applications of BMIs decreases over time, limiting the utility of the devices. The neuroinflammatory response to the microelectrode has been identified as a significant contributing factor to its performance. Traditionally, pathological assessment has been limited to a dozen or so known neuroinflammatory proteins, and only a few groups have begun to explore changes in gene expression following microelectrode implantation. Our initial characterization of gene expression profiles of the neuroinflammatory response to mice implanted with non-functional intracortical probes revealed many upregulated genes that could inform future therapeutic targets. Emphasis was placed on the most significant gene expression changes and genes involved in multiple innate immune sets, including Cd14, C3, Itgam, and Irak4. In previous studies, inhibition of Cluster of Differentiation 14 (Cd14) improved microelectrode performance for up to two weeks after electrode implantation, suggesting CD14 can be explored as a potential therapeutic target. However, all measures of improvements in signal quality and electrode performance lost statistical significance after two weeks. Therefore, the current study investigated the expression of genes in the neuroinflammatory pathway at the tissue-microelectrode interface in Cd14−/− mice to understand better how Cd14 inhibition was connected to temporary improvements in recording quality over the initial 2-weeks post-surgery, allowing for the identification of potential co-therapeutic targets that may work synergistically with or after CD14 inhibition to improve microelectrode performance.

1. Introduction

Intracortical microelectrodes were initially developed as a tool to interpret the functional circuitry of the brain because of their ability to allow neuronal communication for analysis and functional outputs [1]. When implanted, intracortical microelectrodes can record the action potentials of single neurons or a group of neurons. This allows for advancing brain-machine interface (BMI) technology, which improves clinical applications [2,3,4,5,6]. BMIs aim to treat individuals suffering from neurological disorders and spinal cord injuries [7]. Clinical studies using chronically implanted electrodes for BMIs have enabled individuals to move a computer cursor in three dimensions [8,9], control a robotic arm [10,11,12], or restore function to their disabled limb [13].
Unfortunately, implanted microelectrode devices fail prematurely. Within months to years after implantation, the quantity and quality of signals obtained from intracortical microelectrodes decrease, as measured by metrics such as the number of channels capable of recording single-unit neuronal activity or signal-to-noise ratio [14]. Without quality signals, the clinical usefulness of the microelectrodes to patients who may benefit from the recording abilities of these devices is minimal.
Many labs have sought to prolong the lifespan of the intracortical microelectrodes by exploring many mechanisms to promote a reduction of the inflammatory response, including (but not limited to): minimizing the trauma associated with device implantation [15,16], minimizing the device/tissue stiffness mismatch [17,18,19,20,21,22,23,24,25], better understanding the effect of device sterility [26,27], reducing oxidative stress/damage [19,28,29,30,31,32,33,34], and mimicking the nano-architecture of the natural extracellular matrix [35]. The complexity of understanding so many different approaches to mitigate the self-perpetuating inflammatory response to intracortical microelectrodes has led us to focus our investigations on understanding the role of specific aspects of the inflammatory response.
To that end, we are interested in understanding the role of innate immune pathways and changes in the gene expression of inflammation-associated molecules after microelectrode implantation. Therefore, we recently characterized the gene expression profiles of the neuroinflammatory response to mice acutely implanted with non-functional intracortical probes [36]. Differential gene expression analysis identified that the most significant changes in gene expression occur 24-h post-surgery and in genes involved in multiple innate immune sets, including Cd14, C3, Itgam, and Irak4. While Cd14 showed upregulation throughout the 2-week study, it showed the most significant upregulation (~5–6 log2foldchange) in the initial 24-h post-implantation—indicating that downstream events following Cd14 expression may be an indicator of microelectrode performance. Due to its essential role in the innate immune system as a pattern recognition molecule that helps to initiate an innate immune response, we had already been interested in Cd14 (Cluster of Differentiation 14) and have been investigating its role in microelectrode performance before the gene expression study, including exploring its potential as a therapeutic target [18,37].
In response to injury or infection, the activation of first-responder microglial and macrophage cells is initiated through a signaling cascade that begins with cell surface receptors. These receptors recognize plasma proteins and damage-associated molecular patterns (DAMPs) in the damaged tissue or adsorbed on the surface of the implanted microelectrodes. CD14 is a primary receptor in the inflammatory response to implanted intracortical microelectrodes. CD14 is a co-receptor for many Toll-like receptor (TLR) subtypes, including TLR2 and TLR4. CD14 is expressed in many innate immune cells such as microglia, macrophages, dendritic cells, and to a lesser extent, nonimmune cells in the brain such as astrocytes and neurons [38,39,40,41], with a primary role of recognition of DAMPs; again suggesting that that downstream events following Cd14 activation may be an indicator of microelectrode performance.
We have investigated the TLR/CD14 pathway’s role in chronic recording performance and reduce inflammation around brain-electrode interfaces. Specifically, complete inhibition of Cd14 using a Cd14−/− mouse model improved recording during acute but not chronic time points [37,42]. Since CD14 is involved in the initial recognition and response to intracortical microelectrode implantation, eliciting a complex neuroinflammatory response, it is essential to better understand how inhibition of Cd14 through deletion resulted in initial improvements in recording performance to maintain chronic neural recordings.
Therefore, the goal of this study was to develop a gene expression-level understanding of how Cd14 inhibition was connected to temporary improvements in recording quality over the initial two weeks post-surgery and identify other genes in the inflammatory pathway that may be contributing to microelectrode failure and identify potential co-therapeutic targets with CD14 inhibition. Here, we evaluated the gene expression profiles of 791 genes isolated from the tissue around intracortical microelectrodes implanted in Cd14−/− mice. We compared gene expression profiles to genotype-matched naïve, non-surgical (NSCTR) mice.

2. Materials and Methods

2.1. Animals

All animal care, handling, and procedures were performed in compliance with a protocol approved by the Institutional Animal Care and Use Committee (IACUC) at Case Western Reserve University. A total of 25 male Cd14−/− (Jackson Laboratory Strain #003724) mice were used in this study. We have not found evidence of Cd14 being linked to sex-specific neuroinflammatory responses and thus started with male mice. Future studies will explore the potential for sex-specific effects of Cd14 inhibition. All mice were obtained from Jackson laboratory between 7–10 weeks of age. Animals were housed in ~3–5 per cage for 1–4 weeks before surgery. All animal handling was conducted in a class II sterile hood using microisolator techniques. Animals used in this study were randomly divided into endpoint groups (6-h, 24-h, 72-h, and two weeks), with additional animals used as NSCTR. Each group had five animals. NSCTR animals were all male, age-matched, and had no pre-, post-, or surgical procedures. After surgery, all animals were singly housed to prevent physical interactions that may displace implanted electrodes. Genotyping was confirmed after gene expression analysis was performed.

2.2. Microelectrodes

Non-functional, Michigan-style silicon shank probes (provided by Pancrazio Lab at the University of Texas at Dallas) were used in this study (15 µm thick, 123 µm at its widest part, and 2 mm long). All probes were washed by soaking in 95% ethanol solution three times, five minutes each, and sterilized with cold ethylene oxide gas, as previously described [26,35,43]. Non-functional probes were utilized in this study for consistency with our previous study using wild-type mice. Unfortunately, non-functional probes limited our ability to link our findings in the current study directly to device performance [36].

2.3. Surgical Procedure

Surgical procedures were performed following established laboratory protocols [36]. Briefly, mice were sedated with isoflurane; 3% in 1.0 L/min O2 for induction and ~2% during surgery. The surgical site was shaved. The animals were placed on a stereotaxic frame and given a single dose of 0.2 mL of 0.25% Marcaine subcutaneously (SQ) around the surgical site as a topical anesthetic. Next, the skin was sterilized using betadine and isopropanol dipped swaps, then incised at midline to expose the skull, and a hydrogen peroxide swab cleaned off tissue. A 0.45 mm dental drill was used for the craniotomy, pulsing the drill to allow heat to dissipate; a total of 4 holes were drilled at 1.5 mm lateral and 1.0 mm anterior and posterior to the bregma, pulsing the drill to allow heat to dissipate [15]. Nonfunctional probes were inserted manually perpendicular to the surface of the brain into each hole, taking care to avoid large visible vasculature. We chose manual insertion methods to be consistent with previous studies in our lab [36]. The same surgeon performed all implantations to mitigate the surgery variability between animals. Probes contain a section of the tab that is wider than the drilled hole, such that the tab will stay above the skull after implantation, ensuring that the depth of the microelectrode will be consistent between implant sites. Nonfunctional probes are held by fine tip forceps at the tab and slowly implanted into the cortex by hand (at an estimated rate of ~2–3 mm/s) until the 2 mm long shank was implanted. The craniotomy hole was sealed with Kwik-Sil, and dental cement (Flow-It) was used to tether the silicon probe to the skull. The incision was then closed with a 5–0 monofilament polypropylene suture. Post-operative pain management included daily Meloxicam (2 mg/kg, SQ) and Buprenorphine (0.05 mg/kg, SQ) for 3 days post-surgery. Since our veterinary care requires that we commonly use Meloxicam, we chose to be consistent with our prior and current practices and use it here, despite the potential to influence the more acute time points.

2.4. Tissue Extraction

All animals were anesthetized with a ketamine-xylazine cocktail (100 mg/Kg and 10 mg/Kg, respectively) and euthanized via cardiac perfusions with cold 1× phosphate-buffered saline (PBS). Brains were immediately extracted, and probes (if implanted) were explanted. Perfusion and explanation were done quickly to prevent excessive degradation of RNA. Brain tissue was flash frozen in optimal cutting temperature compound (OCT) on dry ice and stored at −80 °C until further processing. Using a cryostat, the cortical brain tissue surrounding the neural probes was sectioned into 150 μm thick frozen slices. A biopsy punch (1 mm diameter) was used to excise the tissue of the frozen tissue slices immediately. The resulting tissue samples 500 μm radii from the implant site. Six slices were collected per animal for a depth of 900 μm into the cortical tissue. Tissue collection started at ~150 μm depth, continuing down the length of the device, spanning most of the cortex.

2.5. RNA Isolation

Extracted brain tissue was homogenized by placing collected samples directly into 2.0 mL homogenization microtubes prefilled with 1.5 mm zirconium beads (Benchmark scientific D1032-15) and 1 mL Qiazol (RNA extraction lysate) [36]. The microtubes were then loaded onto a Bead Bug Homogenizer (Benchmark Scientific D1030) and shaken at 4000 rpm for 1 min.
The RNA was extracted and purified from homogenized tissue using RNeasy® Plus Universal Mini Kit (Qiagen 73404) at the Gene Expression and Genotyping Facility at Case Western Reserve University. RNA quality and quantity were determined using Nanodrop. Samples with low concentration were concentrated with Speedvac. Isolated RNA was stored at −80 °C for up to two months. Samples were shipped overnight on dry ice to NanoString Technologies (Seattle, WA, USA) for further quality control and quantification.

2.6. Gene Expression Assay

Gene expression is determined by counting individual genes using a digital color barcode technology developed by NanoString Technologies (Seattle, WA, USA) [43]. For each sample, 100 ng of RNA was hybridized with a codeset containing capture probes and reporter probes genes of interest. Here, we utilized a codeset containing 791 genes; 771 were from the nCounter® Mouse Neuroinflammation Panel, which included 13 housekeeping genes, and an additional 20 custom genes of interest (Table 1). Negative controls and positive controls were spiked in. Samples were incubated at 65 °C for 16 h, then loaded onto cartridges and processed with nCounter® Max Analyzer. Measurements were taken at 280 Field-of-View per sample, and the relative number of each gene was determined from absolute counts of fluorescent barcode reporters using the nCounter® MAX Analyzer.

2.7. Data Visualization and Statistical Analysis

2.7.1. Normalization

Normalization was performed with the software nSolver (v 4.0) and Advanced Analysis Plugin of nSolver (v 2.0.115), developed by Nanostring Technologies [44,45,46]. Raw counts for each sample were normalized to both the spiked-in positive controls and housekeeping gene controls. Ten housekeeping genes were used for normalization. Genes with counts below 25 in 85% of the samples were excluded from the analysis.

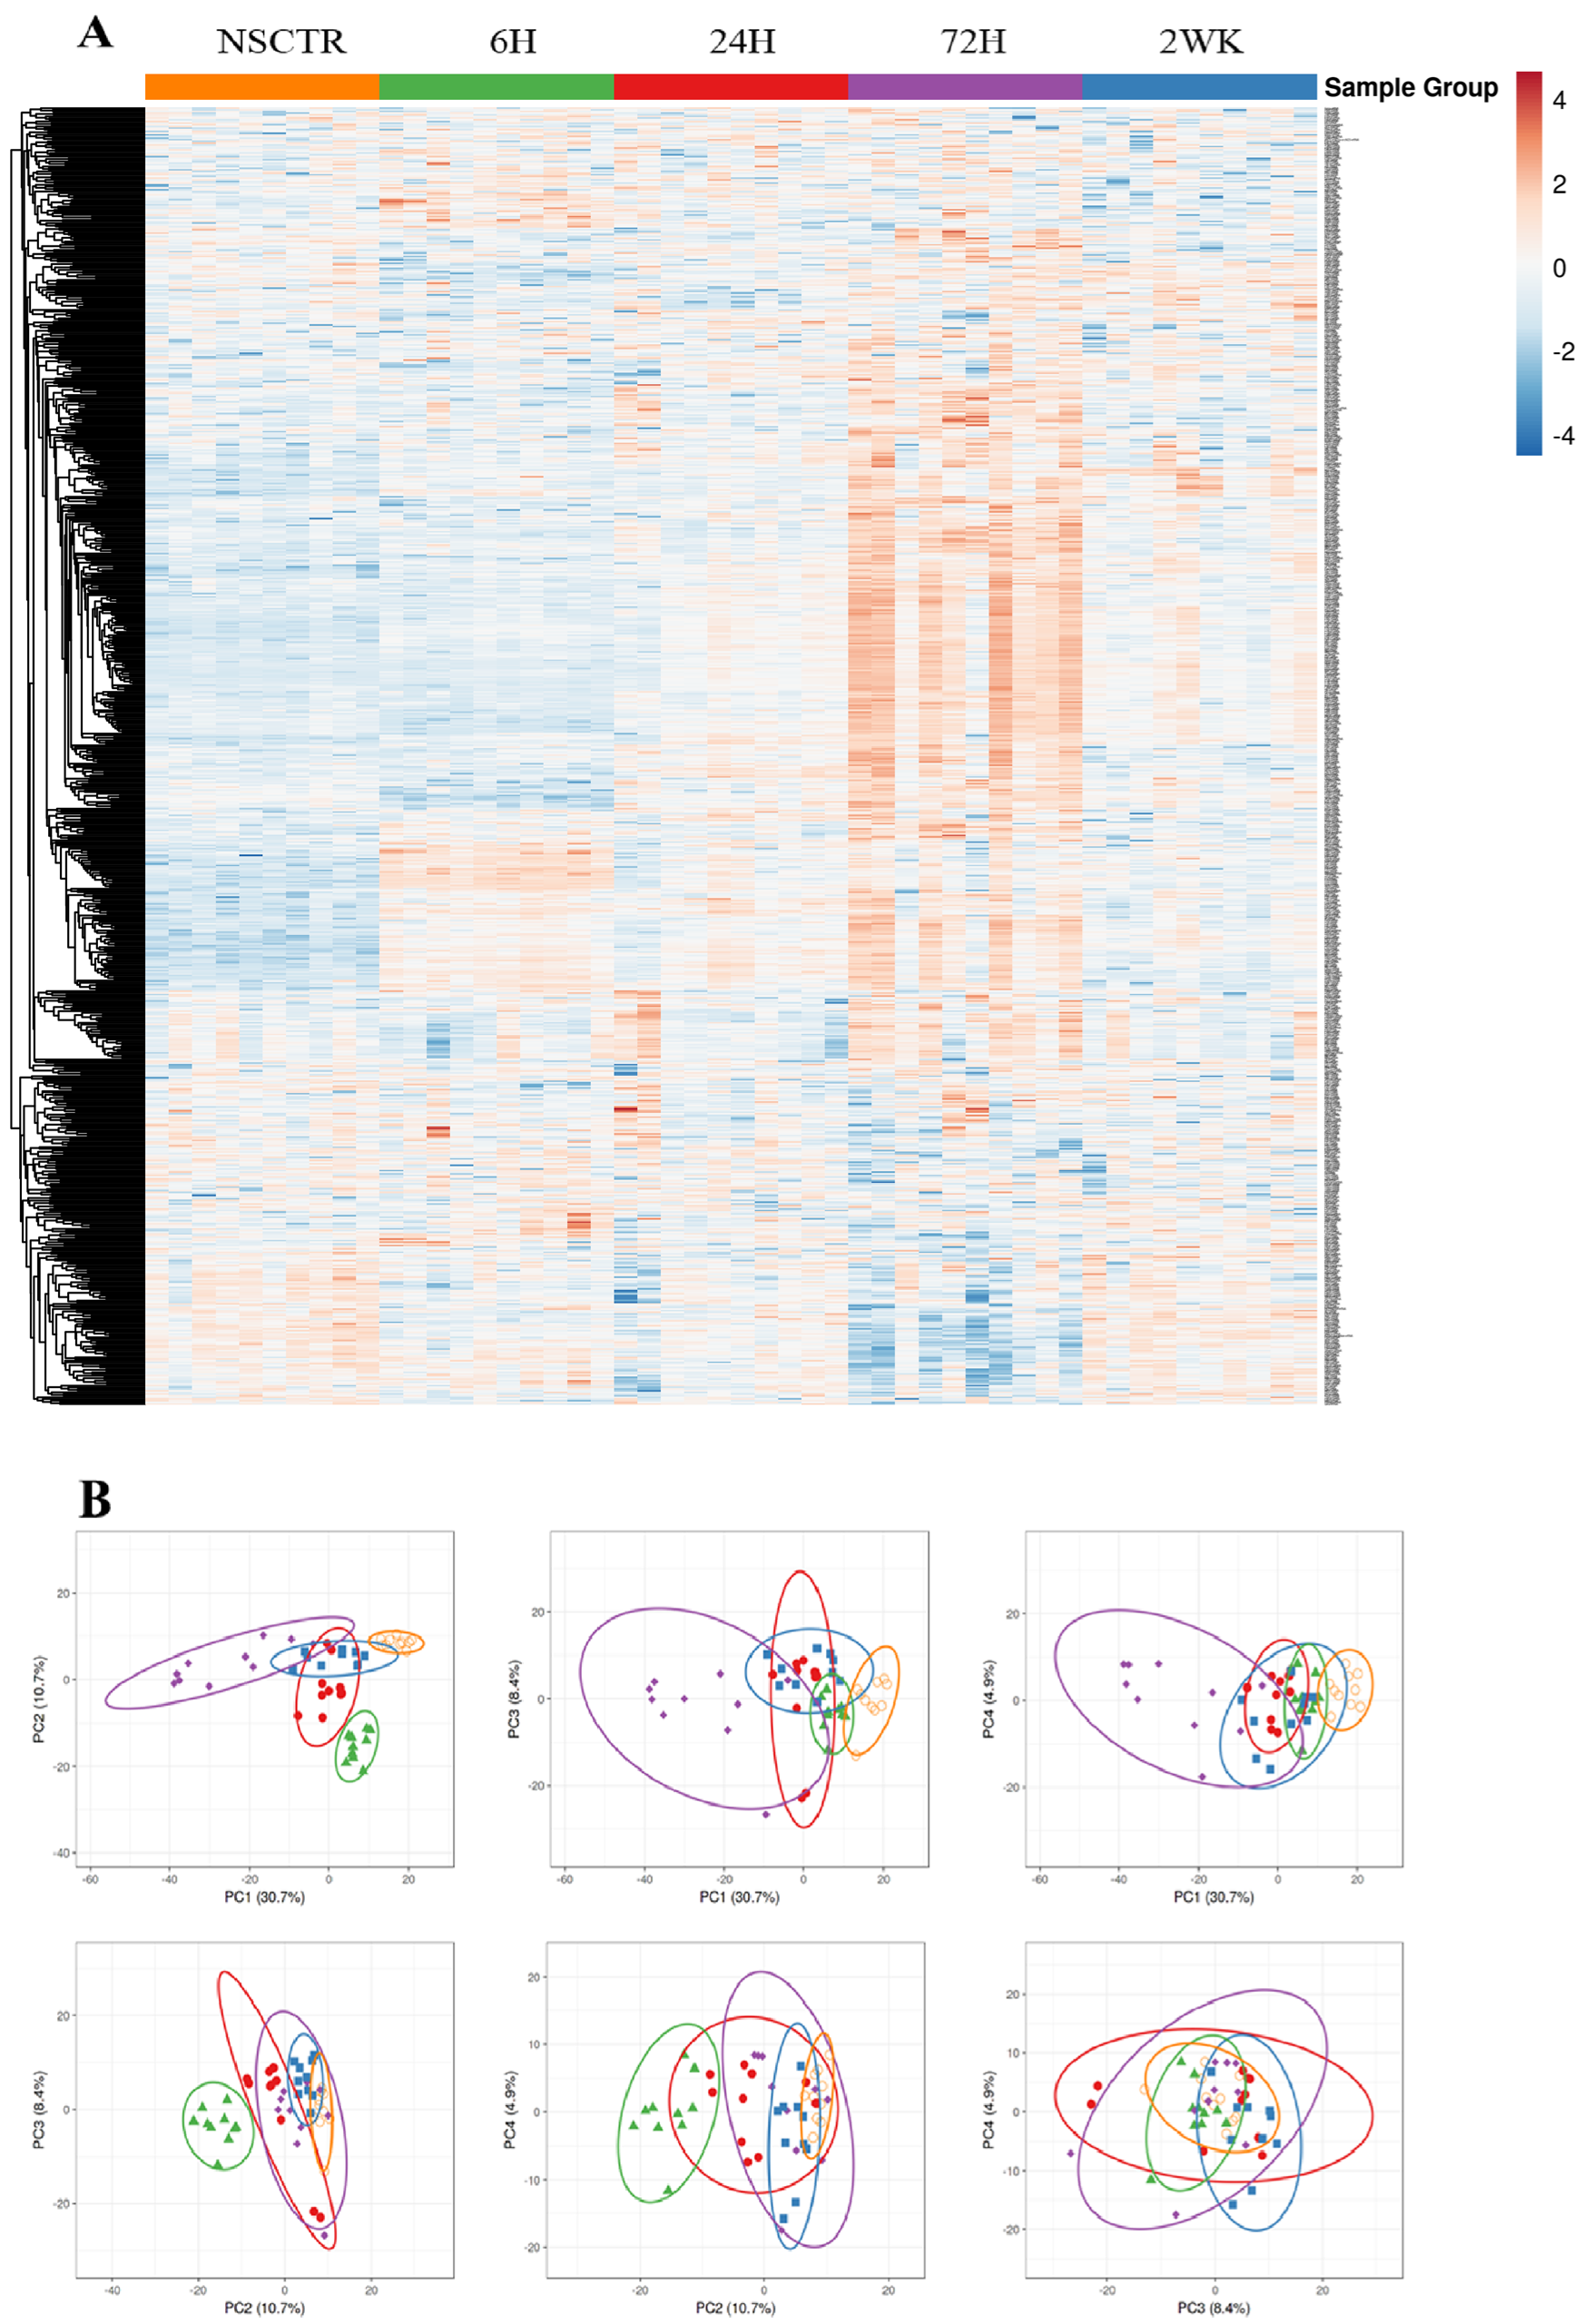
2.7.2. Heatmap and Principal Component Analysis

To visualize the overall variation in gene expression, heatmap and principal component analysis [47,48] was performed on the normalized and log2 transformed sample counts to help visualize the variation between samples using ClustVis [49].

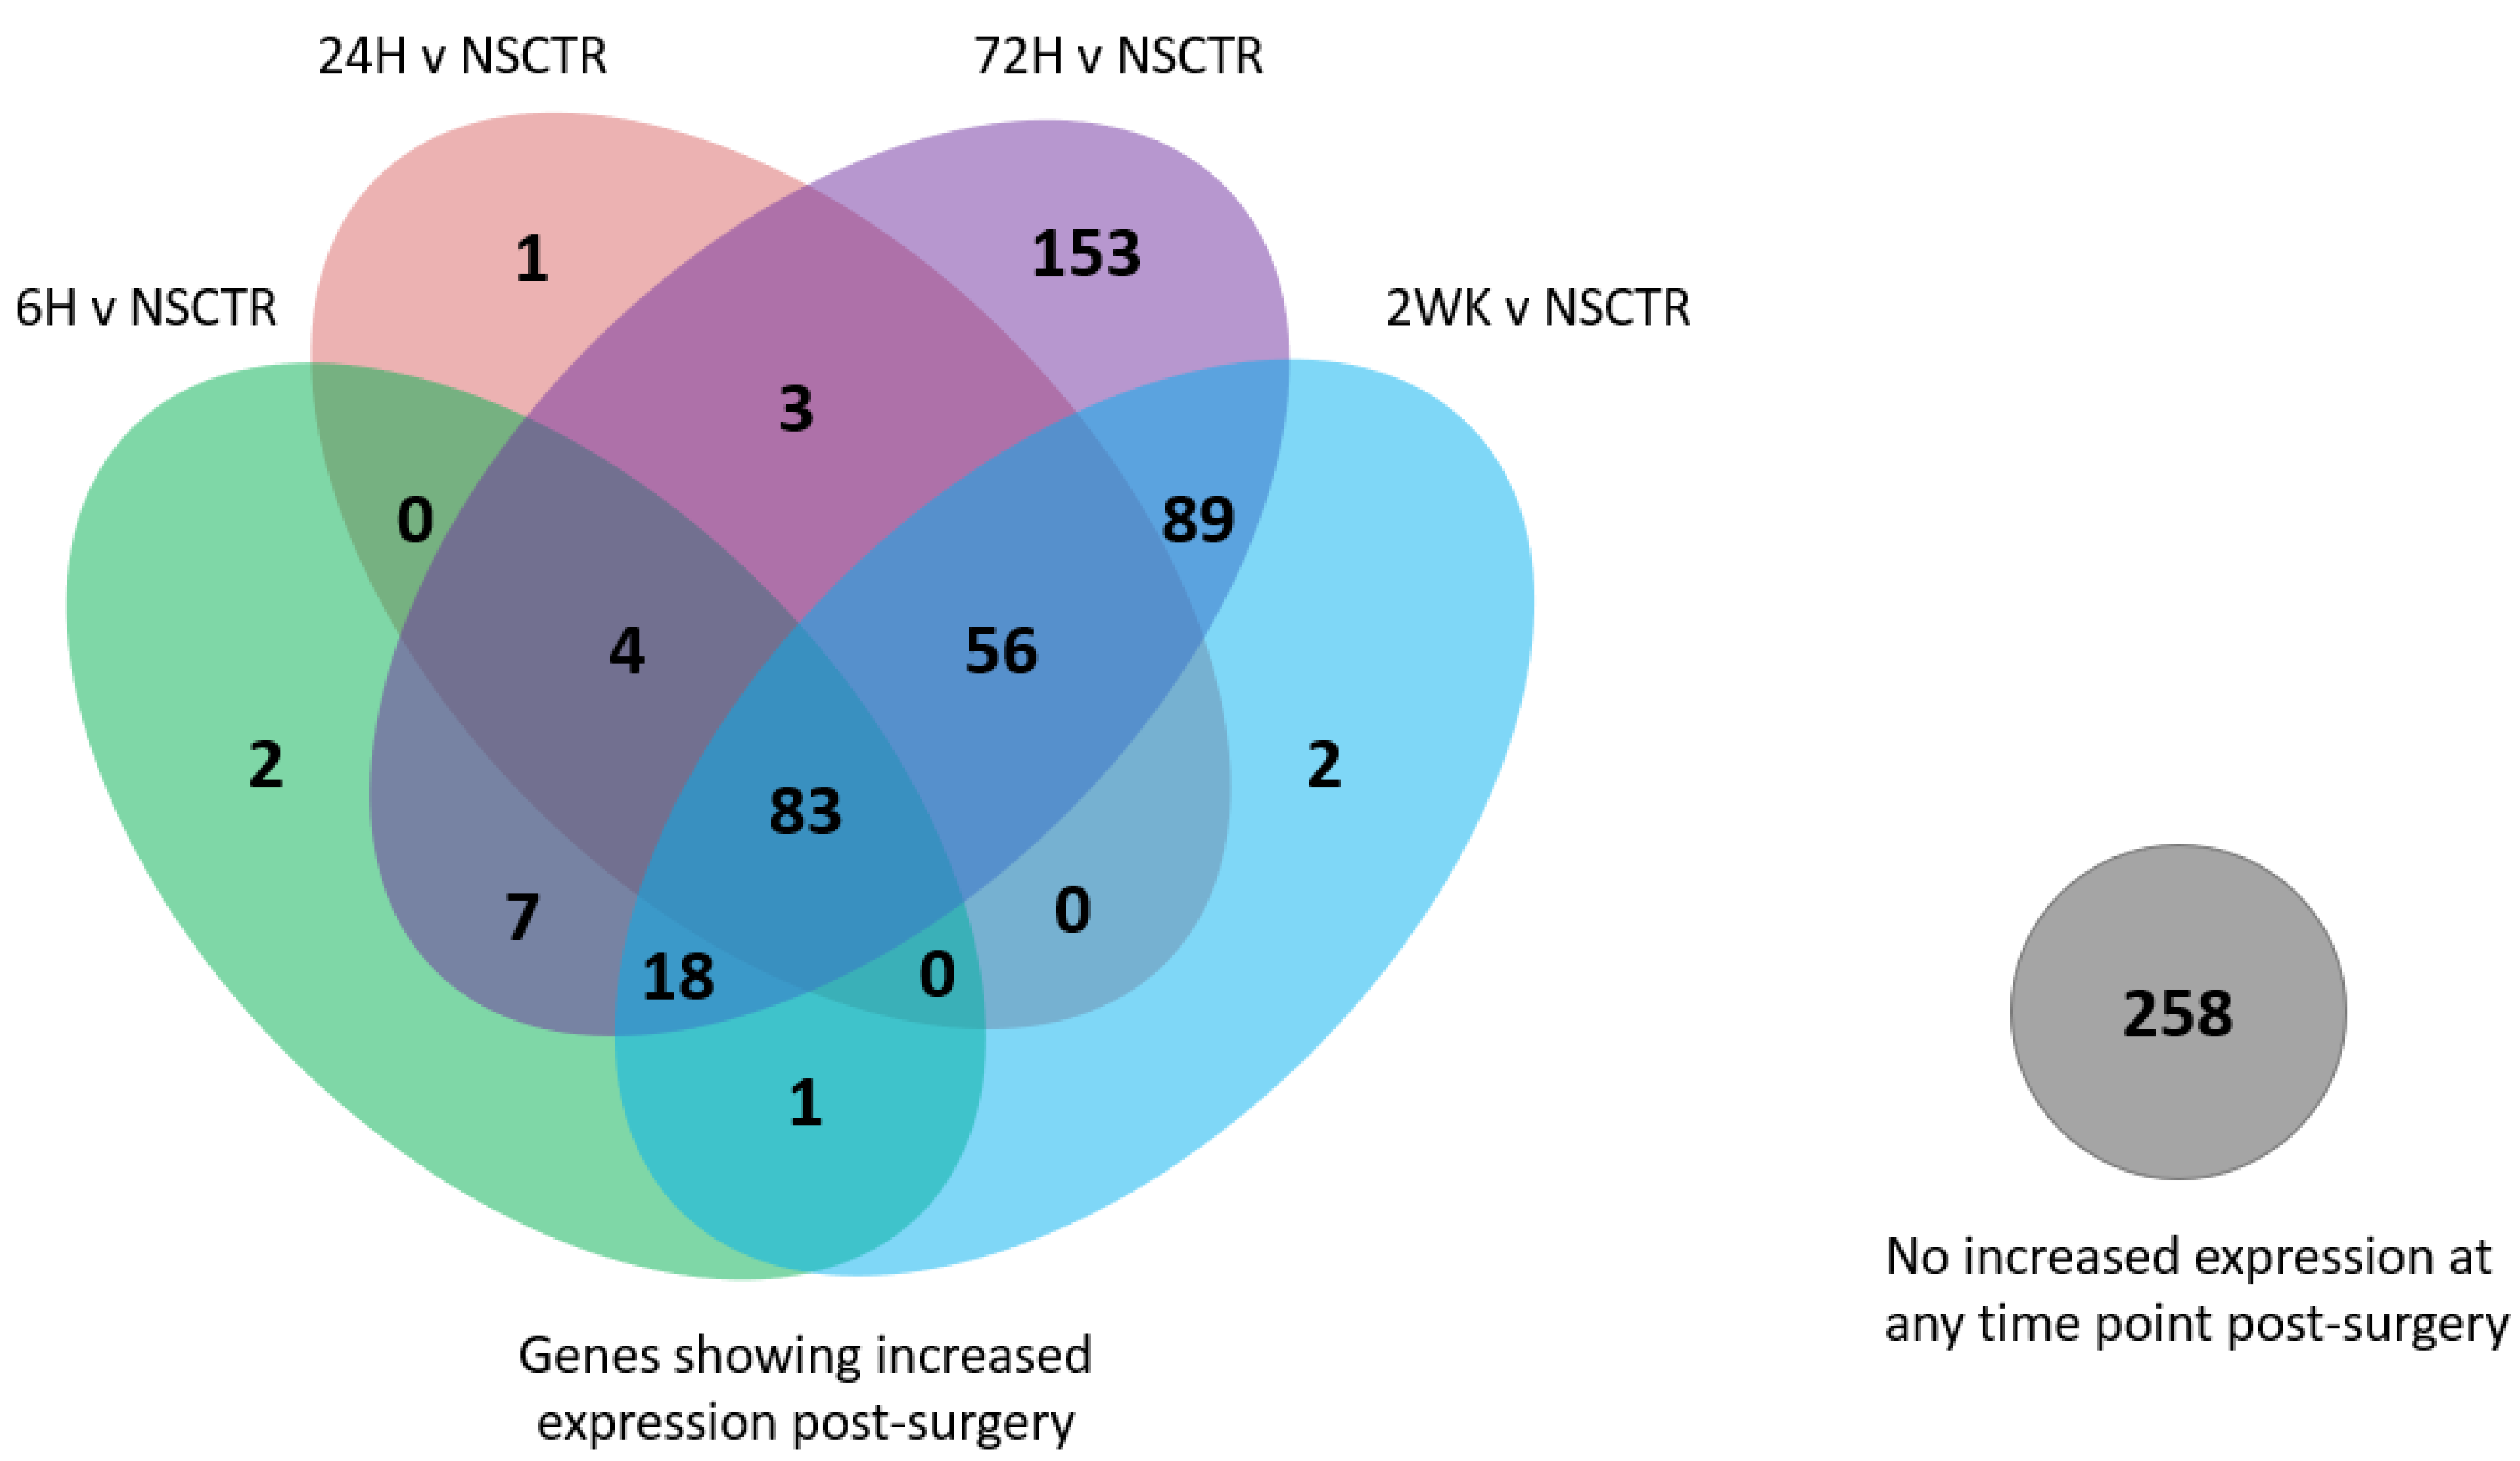
2.7.3. Comparison of Gene Expression at Each Post-Surgical Time Point to Naïve Non-Surgical Control

To examine the change in gene expression after implantation, nSolver and Advanced Analysis Plugin of nSolver, developed by Nanostring Technologies, were used to calculate the ratio between each time point (6-h, 24-h, 72-h, and two weeks) and the naïve non-surgical control [50]. The ratio was then plotted on a log2 scale (hereafter referred to as log2foldchange). The standard error of the mean between each time point and non-surgical control was calculated and plotted for each pair. Unpaired T-test with Benjamini-Yekutieli False-Discovery-Rate Correction is used to determine statistical significance. Significance is set at Padj < 0.05 [36].
Based on the analysis above, genes with altered expression at threshold log2foldchange > 1 or <−1, (or 2-fold increase or decrease in expression), Padj < 0.05, at overlapping time points, are counted and visualized with a Venn diagram. Volcano plot and bar graph [51,52] of altered expression of specific genes are generated using Matlab (R2021B, MathWorks, Natick, MA, USA).

3. Results

3.1. Overall Gene Expression

We have shown that complete inhibition of Cd14 resulted in temporary improvements in microelectrode performance [37,42]. Therefore, the goal of this study was to develop a gene expression-level understanding of the progression of the neuroinflammatory response to microelectrode implantation, to understand how inhibition of Cd14 expression improved microelectrode performance, and to identify potential therapeutic targets that can be inhibited alone or synergistically with Cd14 inhibition to improve microelectrode performance.
Here, we evaluated the gene expression profiles of 791 genes isolated from tissue surrounding intracortical microelectrodes implanted in Cd14−/− mice. We compared gene expression profiles to genotype-matched naïve, non-surgical control (NSCTR) mice. We began our analysis by generating a heatmap to visualize changes in gene expression with respect to time and variation between samples within a set using ClustVis [49]. To account for variability within the same animal, we used tissue adjacent to two of the four implant sites per animal for five animals (and ten implant sites) per condition/time point (Figure 1A). Visual inspection suggests that gene expression patterns within animal sets for a given time point are more consistent than across time points with some variation within time point groupings.
Therefore, we next performed Principal Component Analysis (PCA) to further visualize the overall gene expression variation on normalized log2 transformed sample counts (Figure 1B). The first four axes of principal component analysis are displayed. For the first four principal axes (of 791 axes), PC 1–4 has a combined score of 54.7% (or accounts for 54.7% of the variation in data). PC 1 score is 30.7%, while PC2, PC3, and PC4 scores are 10.7%, 8.4%, and 4.9%, respectively. The elliptical around each group shows a prediction space, where any new sample of the same group is predicted to fall within the elliptical with a probability of 0.95. The larger the elliptical, the greater gene expression variation within a sample group. Both the heat maps and PCA demonstrated that pre-surgery gene expression of the inflammatory pathway is similar across samples. The projection associated with gene expression at a 6-h post-surgical time point on PC2 decreases while the variation increases compared to the NSCTR. The projection associated with gene expression at the 24-h post-surgical time point decreases on the PC1 axis and continues to increase in variation compared to NSCTR. At 72-h post-surgery, gene expression showed the greatest variation, and the associated projections decreased further on PC1 compared to NSCTR. By two weeks post-surgery, the projections of gene expression are located close to that of NSCTR compared to 6–72-h post-surgical time points. However, expression at 2-week time points still showed increased variation compared to NSCTR.
We next created a Venn diagram to display the number of genes showing altered expression post-surgery compared to NSCTR mice (Figure 2). Only genes above the expression threshold of 25 counts in over 85% of the samples are included. Overall, two-hundred-and-fifty-eight genes did not show changes in the expression above the threshold (log2foldchange > 1 or <−1, or 2-fold increase or decrease in expression, Padj < 0.05) compared to NSCTR mice at any post-surgical time point, and only seven genes demonstrated a reduced expression (not shown in the figure). However, eighty-three genes showed changes in expression at all post-surgical time points compared to control. Genes showing increased expression above the threshold at early post-surgerical time points, 6-h, and 24-h post-surgery, tended to continue expression above the threshold until 72-h and 2-week post-surgical time points. Two genes showed changes in expression at only 6-h post-surgery. One gene showed changes in expression at only 24-h post-surgery. Four genes maintained increased expression from 6-h until 72-h post-surgery. Eighty-three genes maintained increased expression from 6-h to 2-weeks post-surgery. Fifty-six genes showed increased expression from 24-h to 2-weeks post-surgery. Additionally, one-hundred-and-fifty-three genes showed changes in expression at only 72-h post-surgery, two genes showed changes in expression at only 2-weeks post-surgery, and eighty-nine genes showed increased expression beginning at 72-h post-surgery and continued until 2-week post-surgical time point.
Most of the genes showed an increase in expression after surgery, which was expected when focusing on neuroinflammatory genes. The highest upregulation in gene expression occurs at the 72-h time point, as indicated by several genes upregulated at 72-h post-surgery (Figure 2). Compared to WT mice implanted with microelectrodes, where the highest gene expression level is at 24-h [36], delayed upregulation of proinflammatory genes may help improve microelectrode performance initially—indicating a possible reason for initial but not sustained improvements in microelectrode recording performance in Cd14−/− mice. Additionally, at 72-h post-surgery, the variability in gene expression within both Cd14−/− and WT mice reaches the maximum, corresponding to a transitional period in wound healing [53]. The cellular responses transition from predominantly neutrophils to predominantly macrophages [54]. Lempka et al. also showed that impedance transitions from low to high between days 3–5 post-implantation of deep brain stimulating electrodes [55]. Therefore, the neuroinflammatory response at 72-h post-surgery may correlate and predict long-term microelectrode variability and performance, suggesting potential interest for future interventional research.

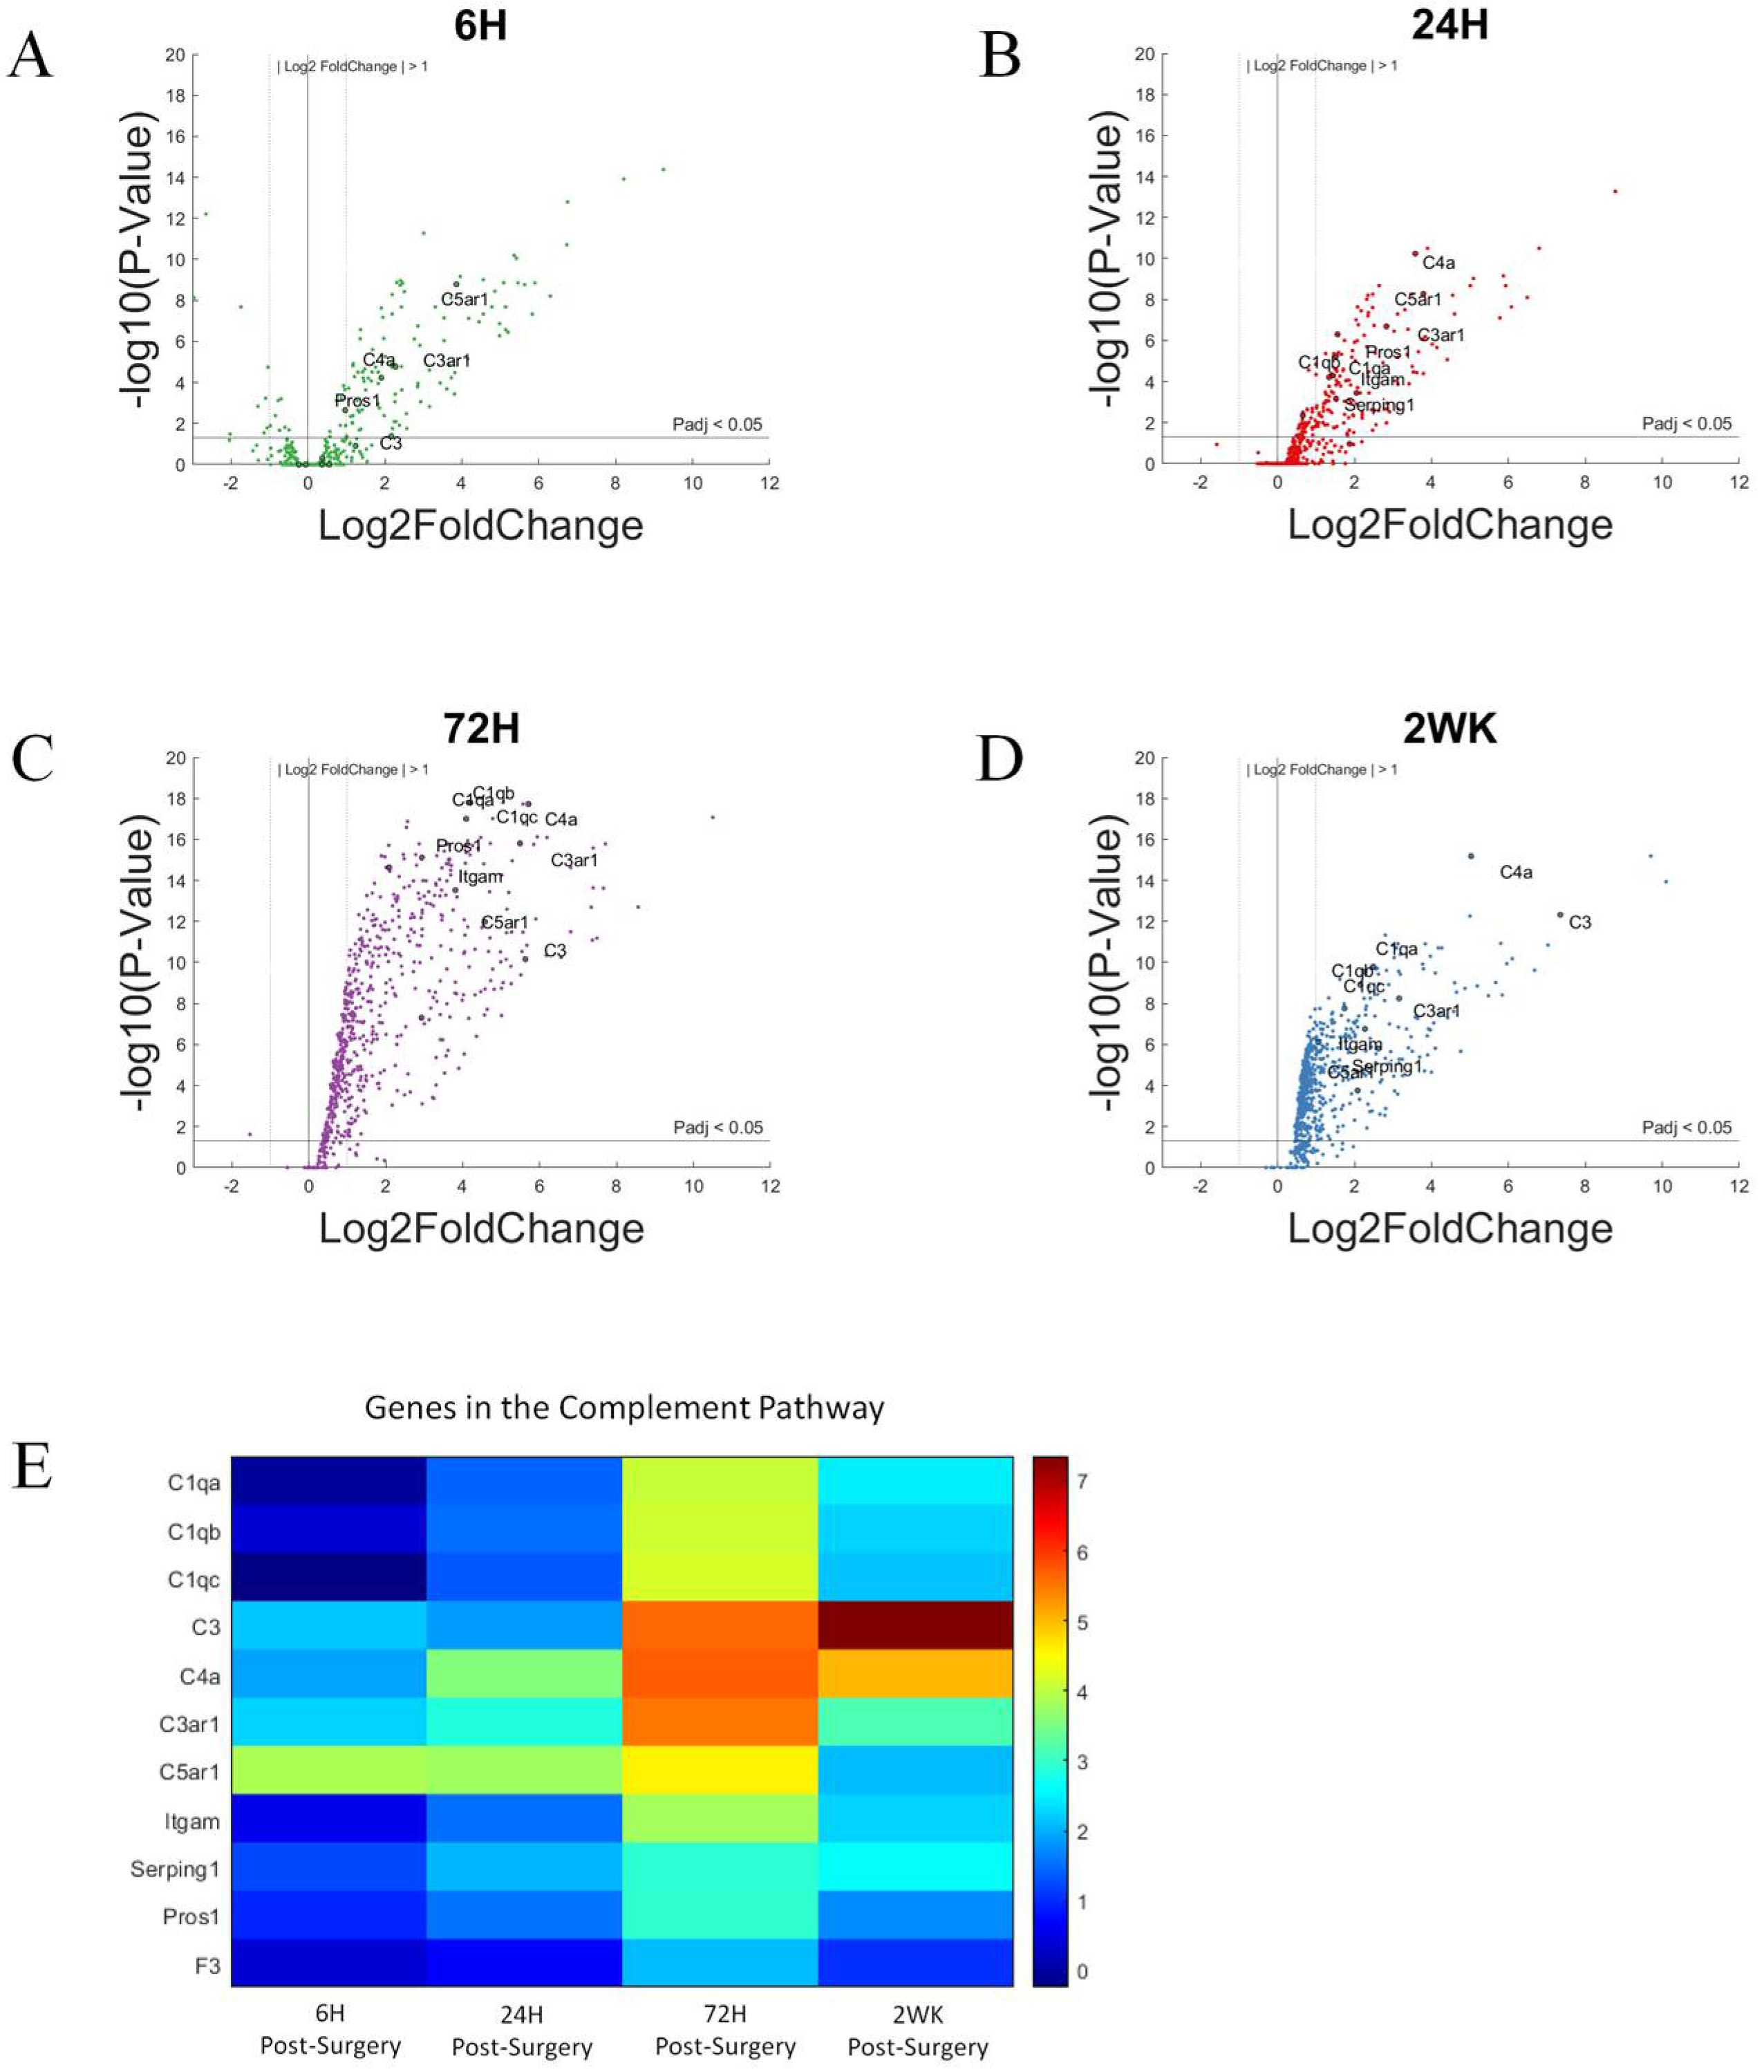
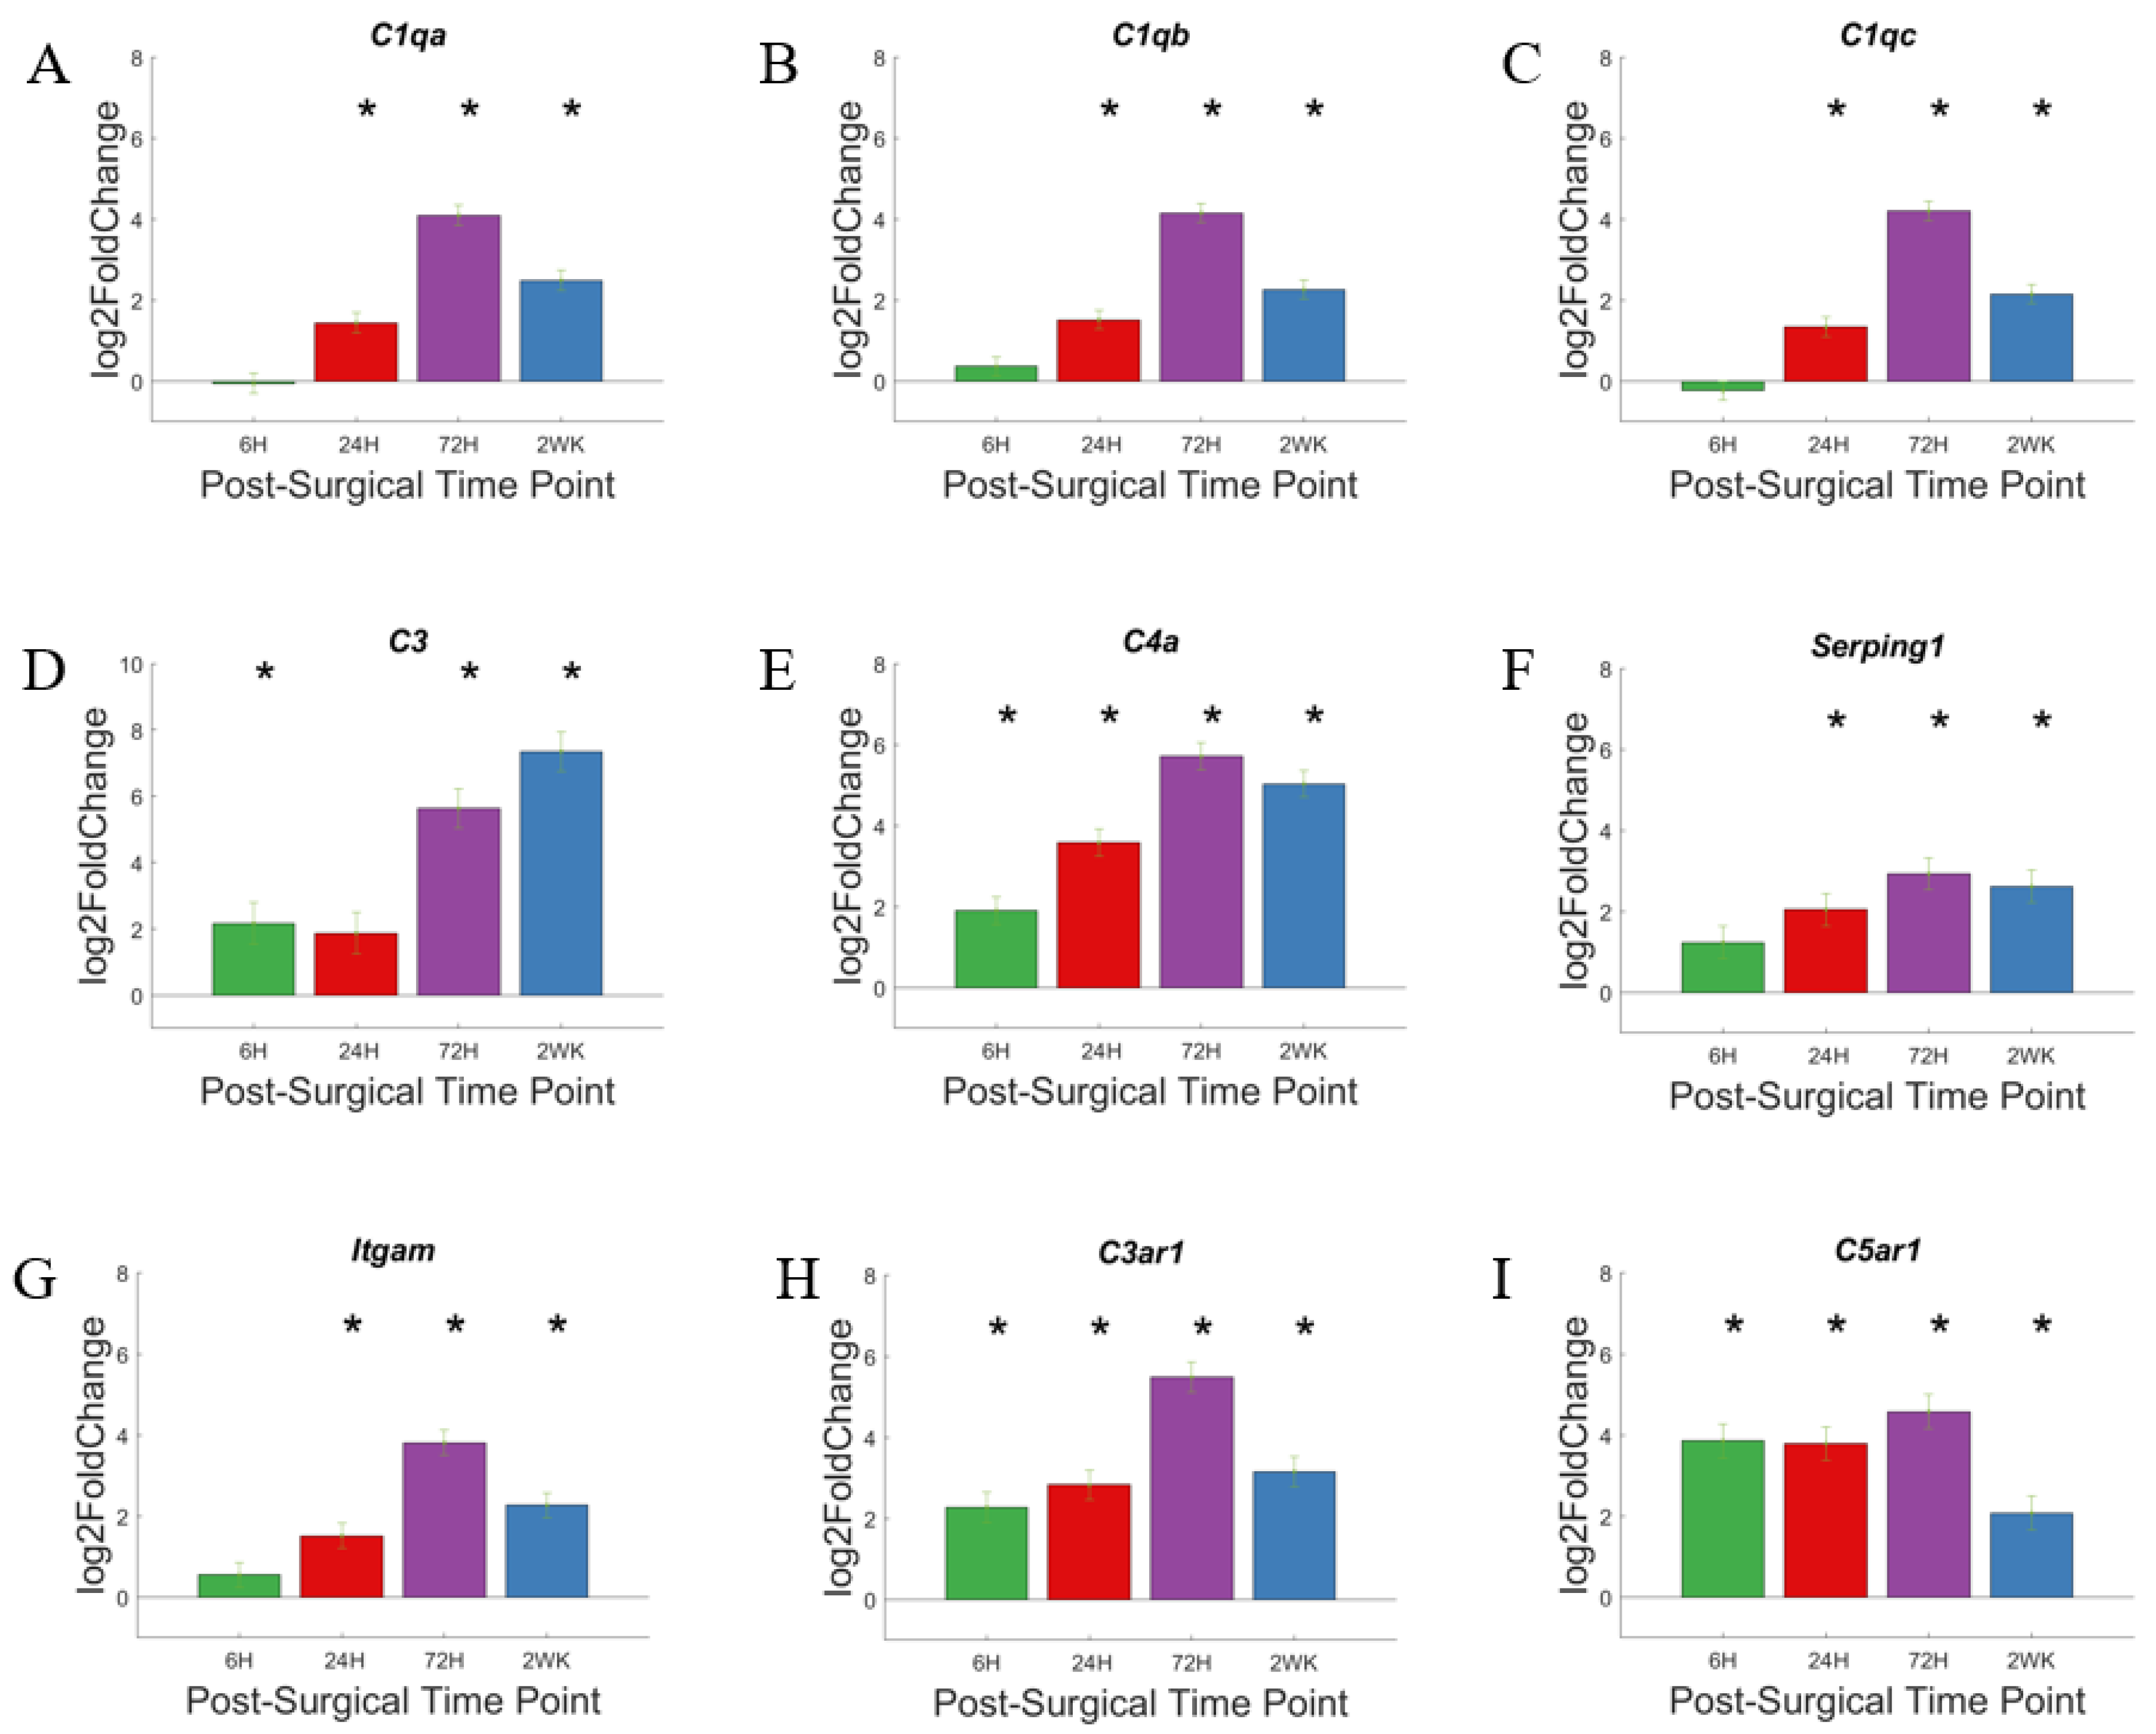
3.2. The Complement Pathway

The complement system is a component of the innate immune system. The complement system comprises both circulating and membrane-bound proteins and proteases and can opsonize foreign substances for clearance and destruction by phagocytes, such as microglia and macrophages [56]. We and others have previously shown that the complement system is upregulated when an intracortical microelectrode is implanted in mice [36,51].
Here, we generated volcano plots for each of the time points investigated. The volcano plots visualize increases in the gene expression for all the genes we examined within a given time point compared to NSCTR mice (Figure 3A–D). Here, we focus on the genes that participate in the complement cascade: C1qa, C1qb, C1qc, C3, C4a, C6, C3ar1, C5ar1, Itgam, Cd19, Serping1, Pros1, and F3. These genes are labeled in the volcano plot, if Padj < 0.05 and log2foldchange > 1 or <−1 (i.e., 2-fold increase or decrease in expression). Furthermore, due to the large number of gene in this grouping, only the top 10 genes with the largest log2foldchange at each time point within the group are labeled. At 6-h post-surgery, C4a, C3, C3ar1 and C5ar1 increased gene expression compared to non-surgical control (Figure 3A). At later time points, 24-h (Figure 3B), 72-h (Figure 3C), and 2-week (Figure 3D) post-surgery, most genes of the complement system showed increased gene expression and remained elevated throughout the first two weeks post-surgery. The relative increase in gene expression levels for each of these genes associated with the complement cascade are more readily depicted in heatmaps (Figure 3E).
Genes with the highest differential expression include C3, C4a, C3ar1, and C5ar1, which code genes for the amplification of the complement system (Figure 3E and Figure 4). C1qa, C1qb, and C1qc encode the protein C1q, which is a component of the C1 complex, which in turn initiates the activation of complement cascade via the Classic Pathway [57]. All three genes show a similar trend in their expression level throughout this study (Figure 4A–C): the expression levels increase after 24-h post-surgery, reaching a maximum at 72-h post-surgery, and remain elevated at 2-weeks post-surgery. C3 encodes complement factor 3, which marks both an activation and an amplification step in the complement cascade, as well as acting as a signaling molecule [56]. C3 (Figure 4D) shows a gradual upregulation over 2 weeks. C4a codes for a portion of complement factor 4, C4a; C4a, in turn, is a product of complement activation and acts as a signaling molecule to recruit other immune cells [56]. Both C3 (Figure 4D) and C4a (Figure 4E) show a gradual upregulation over the first 72-h time point, and while remaining highly expressed, decrease slightly by the 2-week time point. The inhibitor of the C1 complex, Serping1 (Figure 4F), follows the same trend as C4a, although more modest. Itgam, a subunit of C3 receptor, also showed gradually increased expression, not statistically significant at 6-h, but significant by 24-h, reaching maximum at 72-h post-surgery, and remains elevated at 2-week post-surgical time point (Figure 4G). C3ar1 (Figure 4H) and C5ar1 (Figure 4I) show increased expression relatively early and remain elevated. Together, the increased expression of the soluble proteases of the complement system, as well as its receptors, suggest that the complement system may be involved in the response to the implanted microelectrode.
The complement pathway can be initiated via the classical pathway, lectin-binding pathway, or alternative pathway. All three pathways converge on the amplification step of C3 [58,59]. While most of the members of the complement system begin to show less upregulation by 2-weeks post-surgery, C3 continues to show an increase in upregulation of gene expression, increasing with each time point evaluated here. Note that C3 itself can initiate the activation of complement cascade via the alternative pathway. Therefore, C3′s steadily increased upregulation may drive complement activity beyond the 2-week course of our study.
The complement system may be involved in the response to biomaterials [60,61,62]. Biomaterials surface adsorption of IgG or hydrophobic interaction with C3 may lead to the activation of the complement cascade. Cells of the innate immune system can recognize adsorbed IgG or C3 through cell surface receptors, activating the inflammatory cascade through the release of cytokines and chemokines—further recruiting additional immune cells to the implantation site [63,64,65]. While the complement system has been implicated in the foreign body response to devices used for extracorporeal circulation [66,67,68], few studies have begun to investigate the role of complement system in foreign body response against intracortical microelectrode implant [36,51]. The observation that the genes associated with the complement system are upregulated throughout the duration of this study does not correspond with the observation that intracortical microelectrode recording performance initially improves, then subsides to match wild-type mice in Cd14−/− mice [42]. Therefore, it is unlikely that the complement pathway is contributing to the temporal changes in recording performance in Cd14−/− mice, unless there is a threshold effect, as C3 expression continues to rise with time post-surgery (Figure 4D). However, the high upregulation of many members of the complement system in both Cd14−/− mice and WT mice [36] suggests it may play an important role in inflammatory response against implanted microelectrodes, and can be a potential target to improve microelectrode performance, either alone or as a co-therapeutic target with CD14. It is also important to point out that C3 has also been implicated as a marker of astrocyte maturation, and therefore we cannot overlook the possibility that C3 expression in this system may have downstream effects on microelectrode performance and the neuroinflammatory response, even if the timing of C3 expression seen here do not correlate with recording performance over the initial 2 weeks following microelectrode performance.

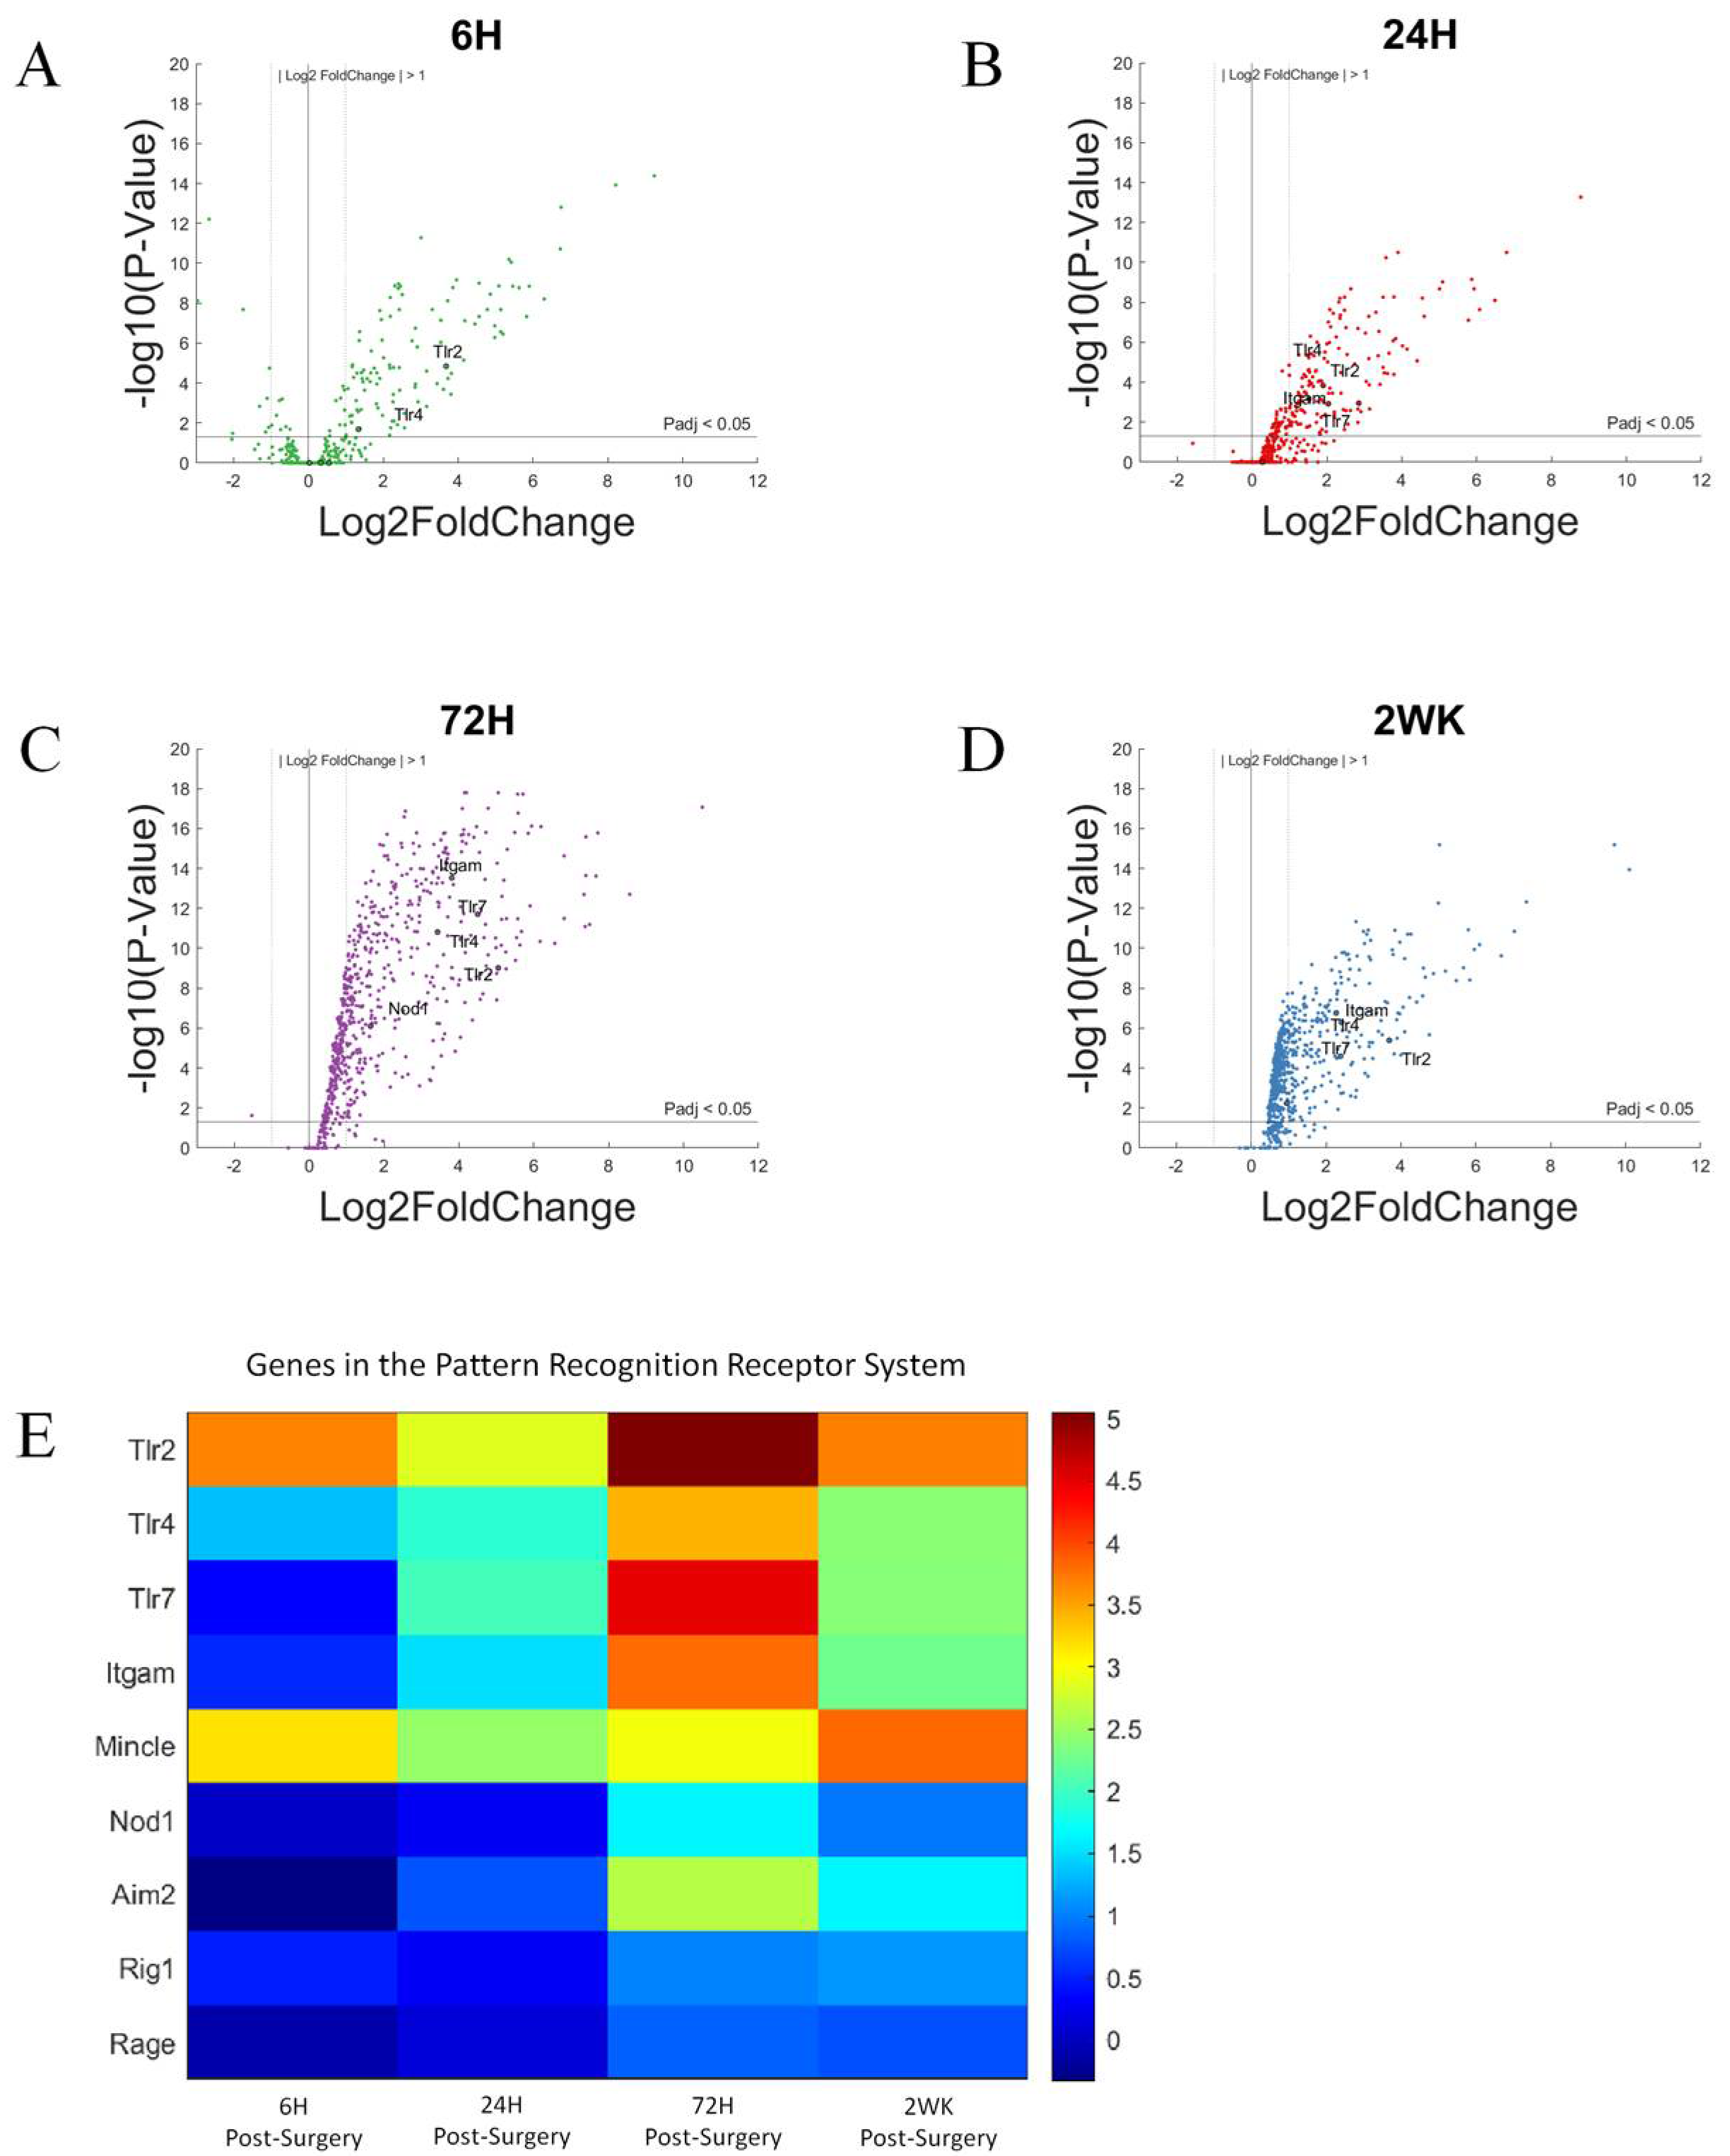
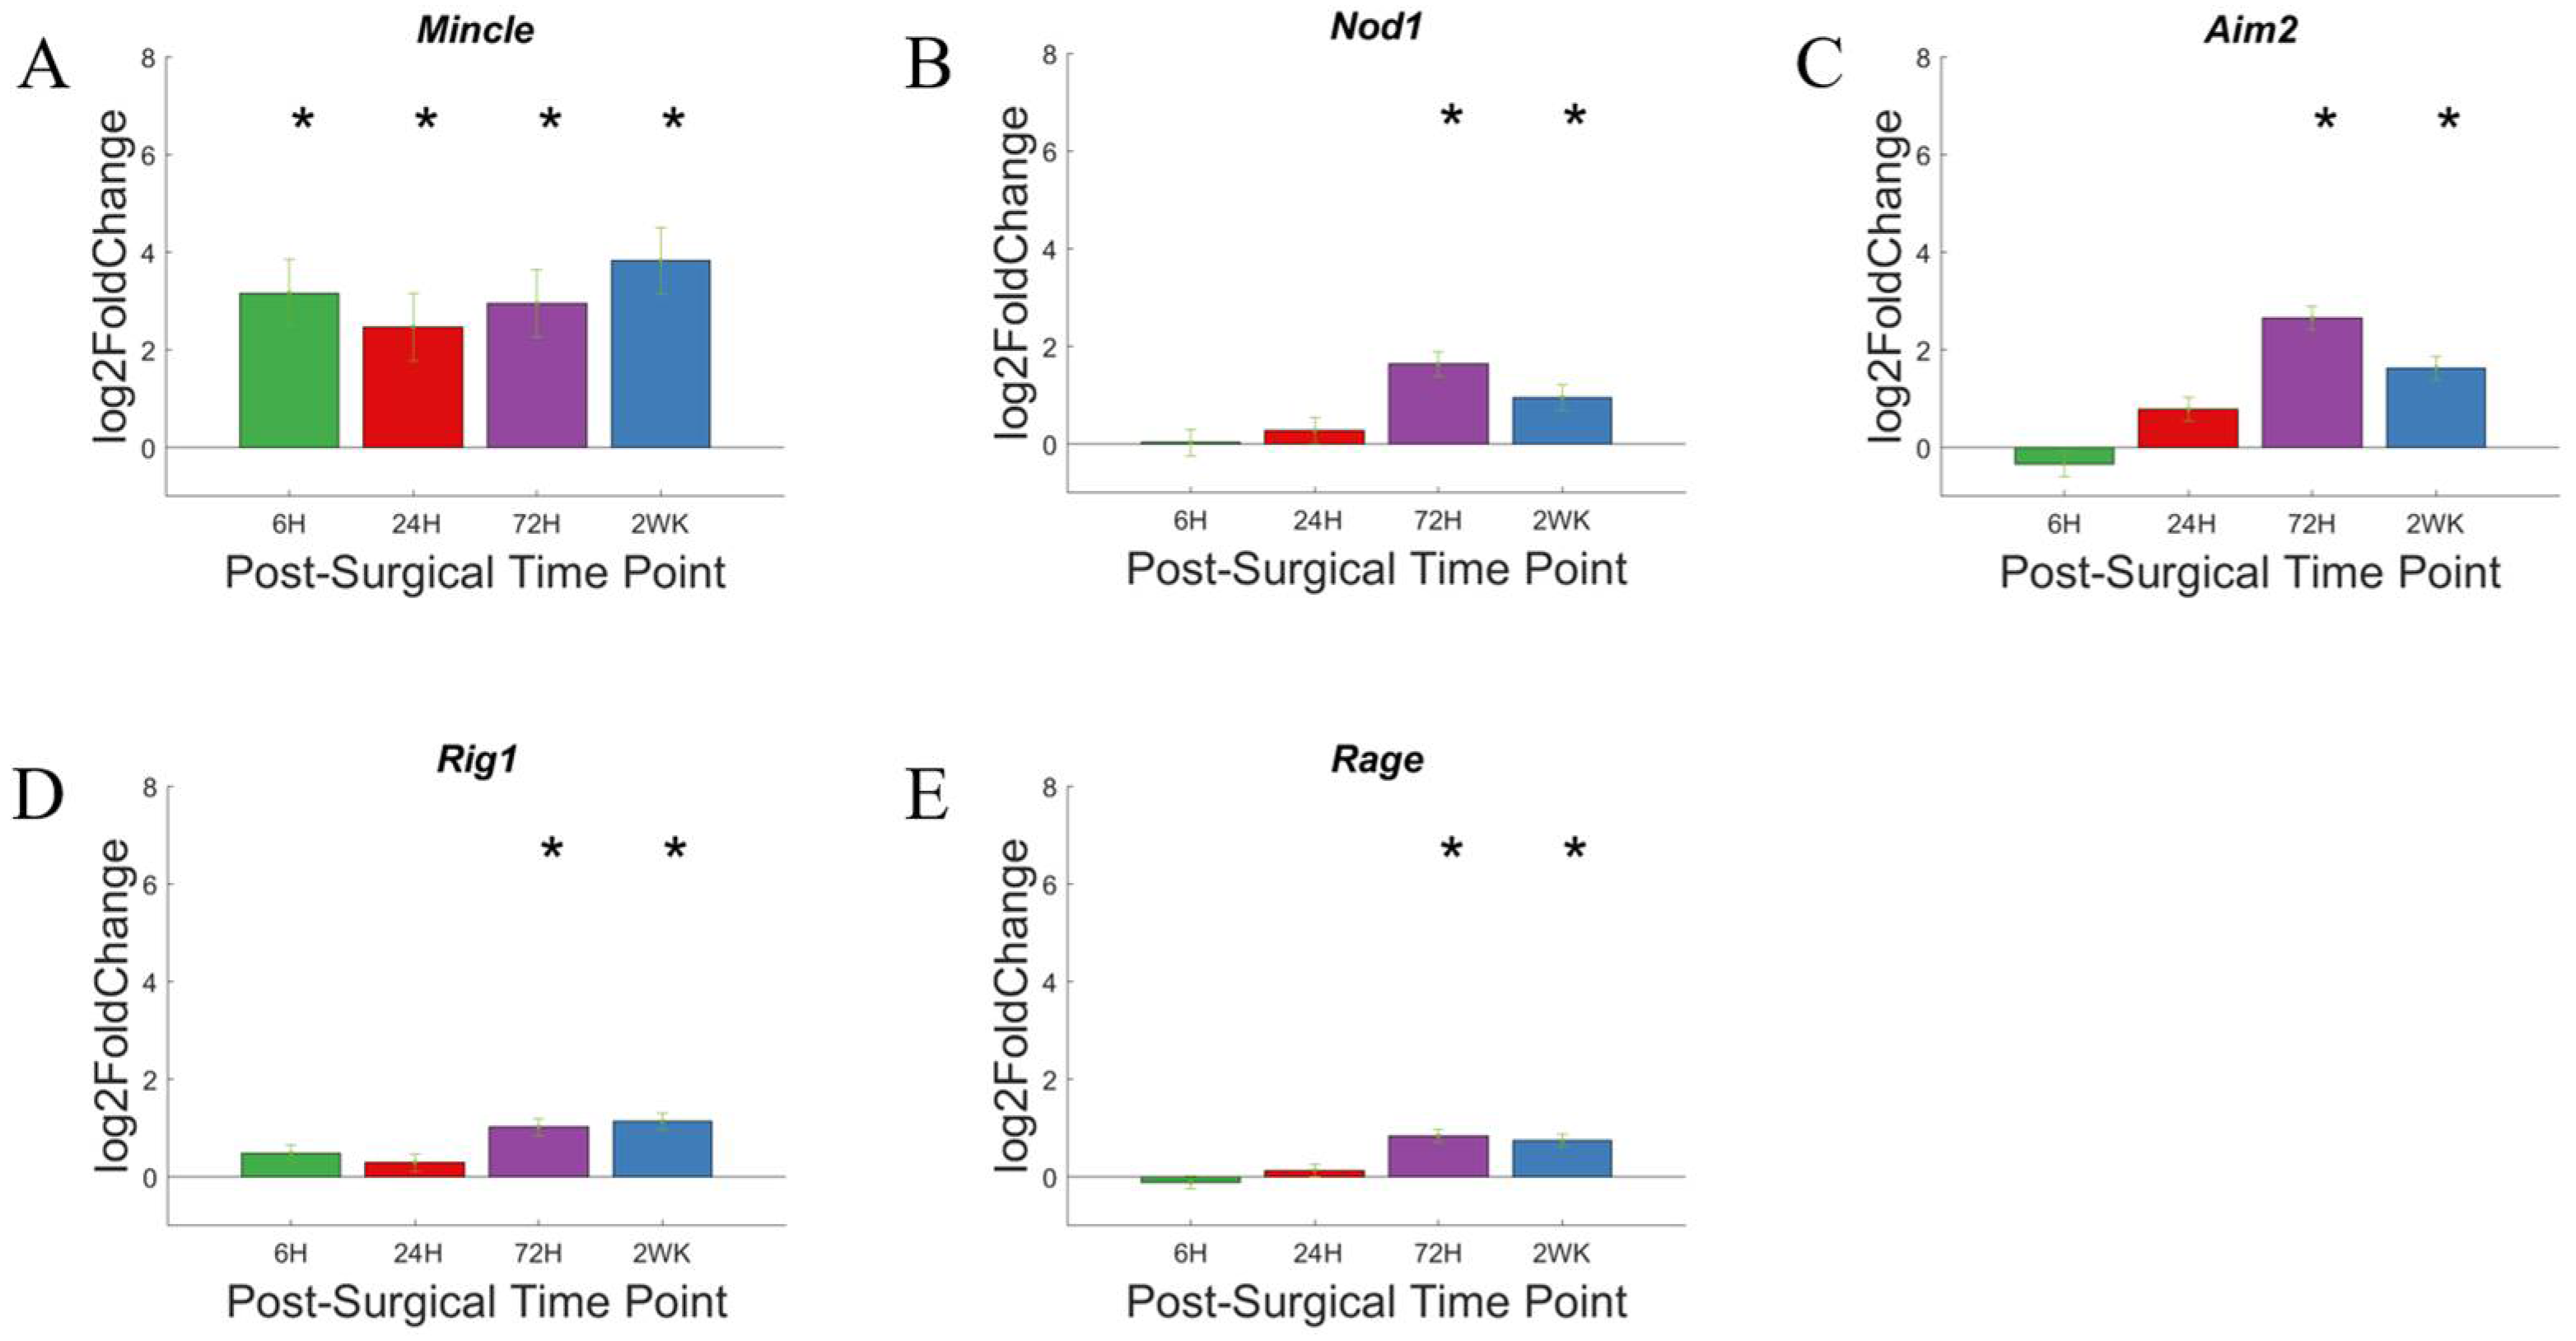
3.3. Pattern Recognition Receptors

Pattern recognition receptors (PRR) are part of the innate immune pathway that respond to evolutionarily conserved Pathogen Associated Molecular Patterns (PAMPs) and Damage Associated Molecular Patterns (DAMPs). The identification of PAMPs and DAMPs by PRRs indicates the presence of infection or injury, initiating the innate and adaptive immune responses [69]. PRRs can be broadly divided into membrane-bound or scavenger receptors [69,70,71,72,73]. The membrane-bound receptors include Toll-like receptors (TLRs) and C-Lectin receptors (CLRs), and cytoplasmic class: Nod-like receptors (NLRs), Aim2-like receptors (ALRS), and Rig-I like receptors (RLRs). TLRs will be discussed in depth in the next section.
Using the same volcano plots generated for all genes investigated for this study, we here (Figure 5A–D) labeled genes associated with the pattern recognition receptors, including: Tlr2, Tlr4, Tlr7, Itgam, Mincle, Nod1, Aim2, Rig1, and Rage. The given genes were only indicated on the volcano plot if Padj < 0.05 and log2foldchange > 1 or <−1 (i.e., 2-fold increase or decrease in expression). At 6-h post-surgery, Tlr2, Tlr4, and Mincle increased gene expression compared to non-surgical control. These genes remained elevated throughout all time points up to 2-weeks post-surgery. By 24-h post-surgery, Itgam expression increased to be included in the PRR associated gene expression. Itgam remained upregulated at each of the later time points investigated in this study (Figure 5B–D). At 72-h post-surgery, Nod1 and Tlr7 became upregulated, joining Tlr2, Tlr4, Mincle, and Itgam. By 2-weeks post-surgery, Nod1 expression is reduced to no longer be significantly upregulated compared to controls, while the other 5 genes remain elevated compared to control animals.
The relative increase in gene expression levels for each of these genes for the pattern recognition receptors are more readily depicted in heatmaps (Figure 5E), with statistical significance more clearly depicted in bar graphs (Figure 6). Tlr2, Tlr4, Tlr7, and Itgam are discussed in the next section, Toll-Like Receptors.
To look closer at changes in individual genes over time, we created bar graphs to better visualize statistically relevant changes. In the bar graphs (Figure 6) created for individual genes, we can see that Nod1, Aim2, Rig1, and Rage does not show statistically significant upregulation until 72-h post-surgery and remain so at 2-weeks post-surgery. The extent of upregulation of each of these genes is relatively low, compared to other genes associated with the PRR pathway. For example, Nod1, Aim2, Rig1, and Rage reach a high log2foldchange of ~2, ~2.5, ~1.5, and ~1, respectively. Nod1, Aim2, and Rig1 are representative genes in the Nod-like receptors (NLRs), Aim2-like receptors (ALRs), and Rig−1 like receptors (RLRs) class of pattern recognition receptors, encoding for cytoplasmic proteins [69]. However, Rage encodes for a scavenger receptor. The delayed response of these genes suggest that they could be potential co-therapeutic targets together with CD14, which displays a rapid response and can be targeted for microelectrode performance at acute time points. [42]. Inhibition can be given sequentially, targeting CD14 during the acute phase of post-surgical implantation of microelectrodes, and later switch to targeting a slower upregulated pattern recognition receptors.
Mincle, on the other hand, showed upregulation at 6-h post-surgery, and maintained similar expression throughout the 2-week study. Mincle codes for a protein in the CLR class of pattern recognition receptors and has been implicated in neuroinflammation and injury in the central nervous system [42,74]. Mincle could be further explored as either a solo therapeutic target or a co-therapeutic target together with CD14.

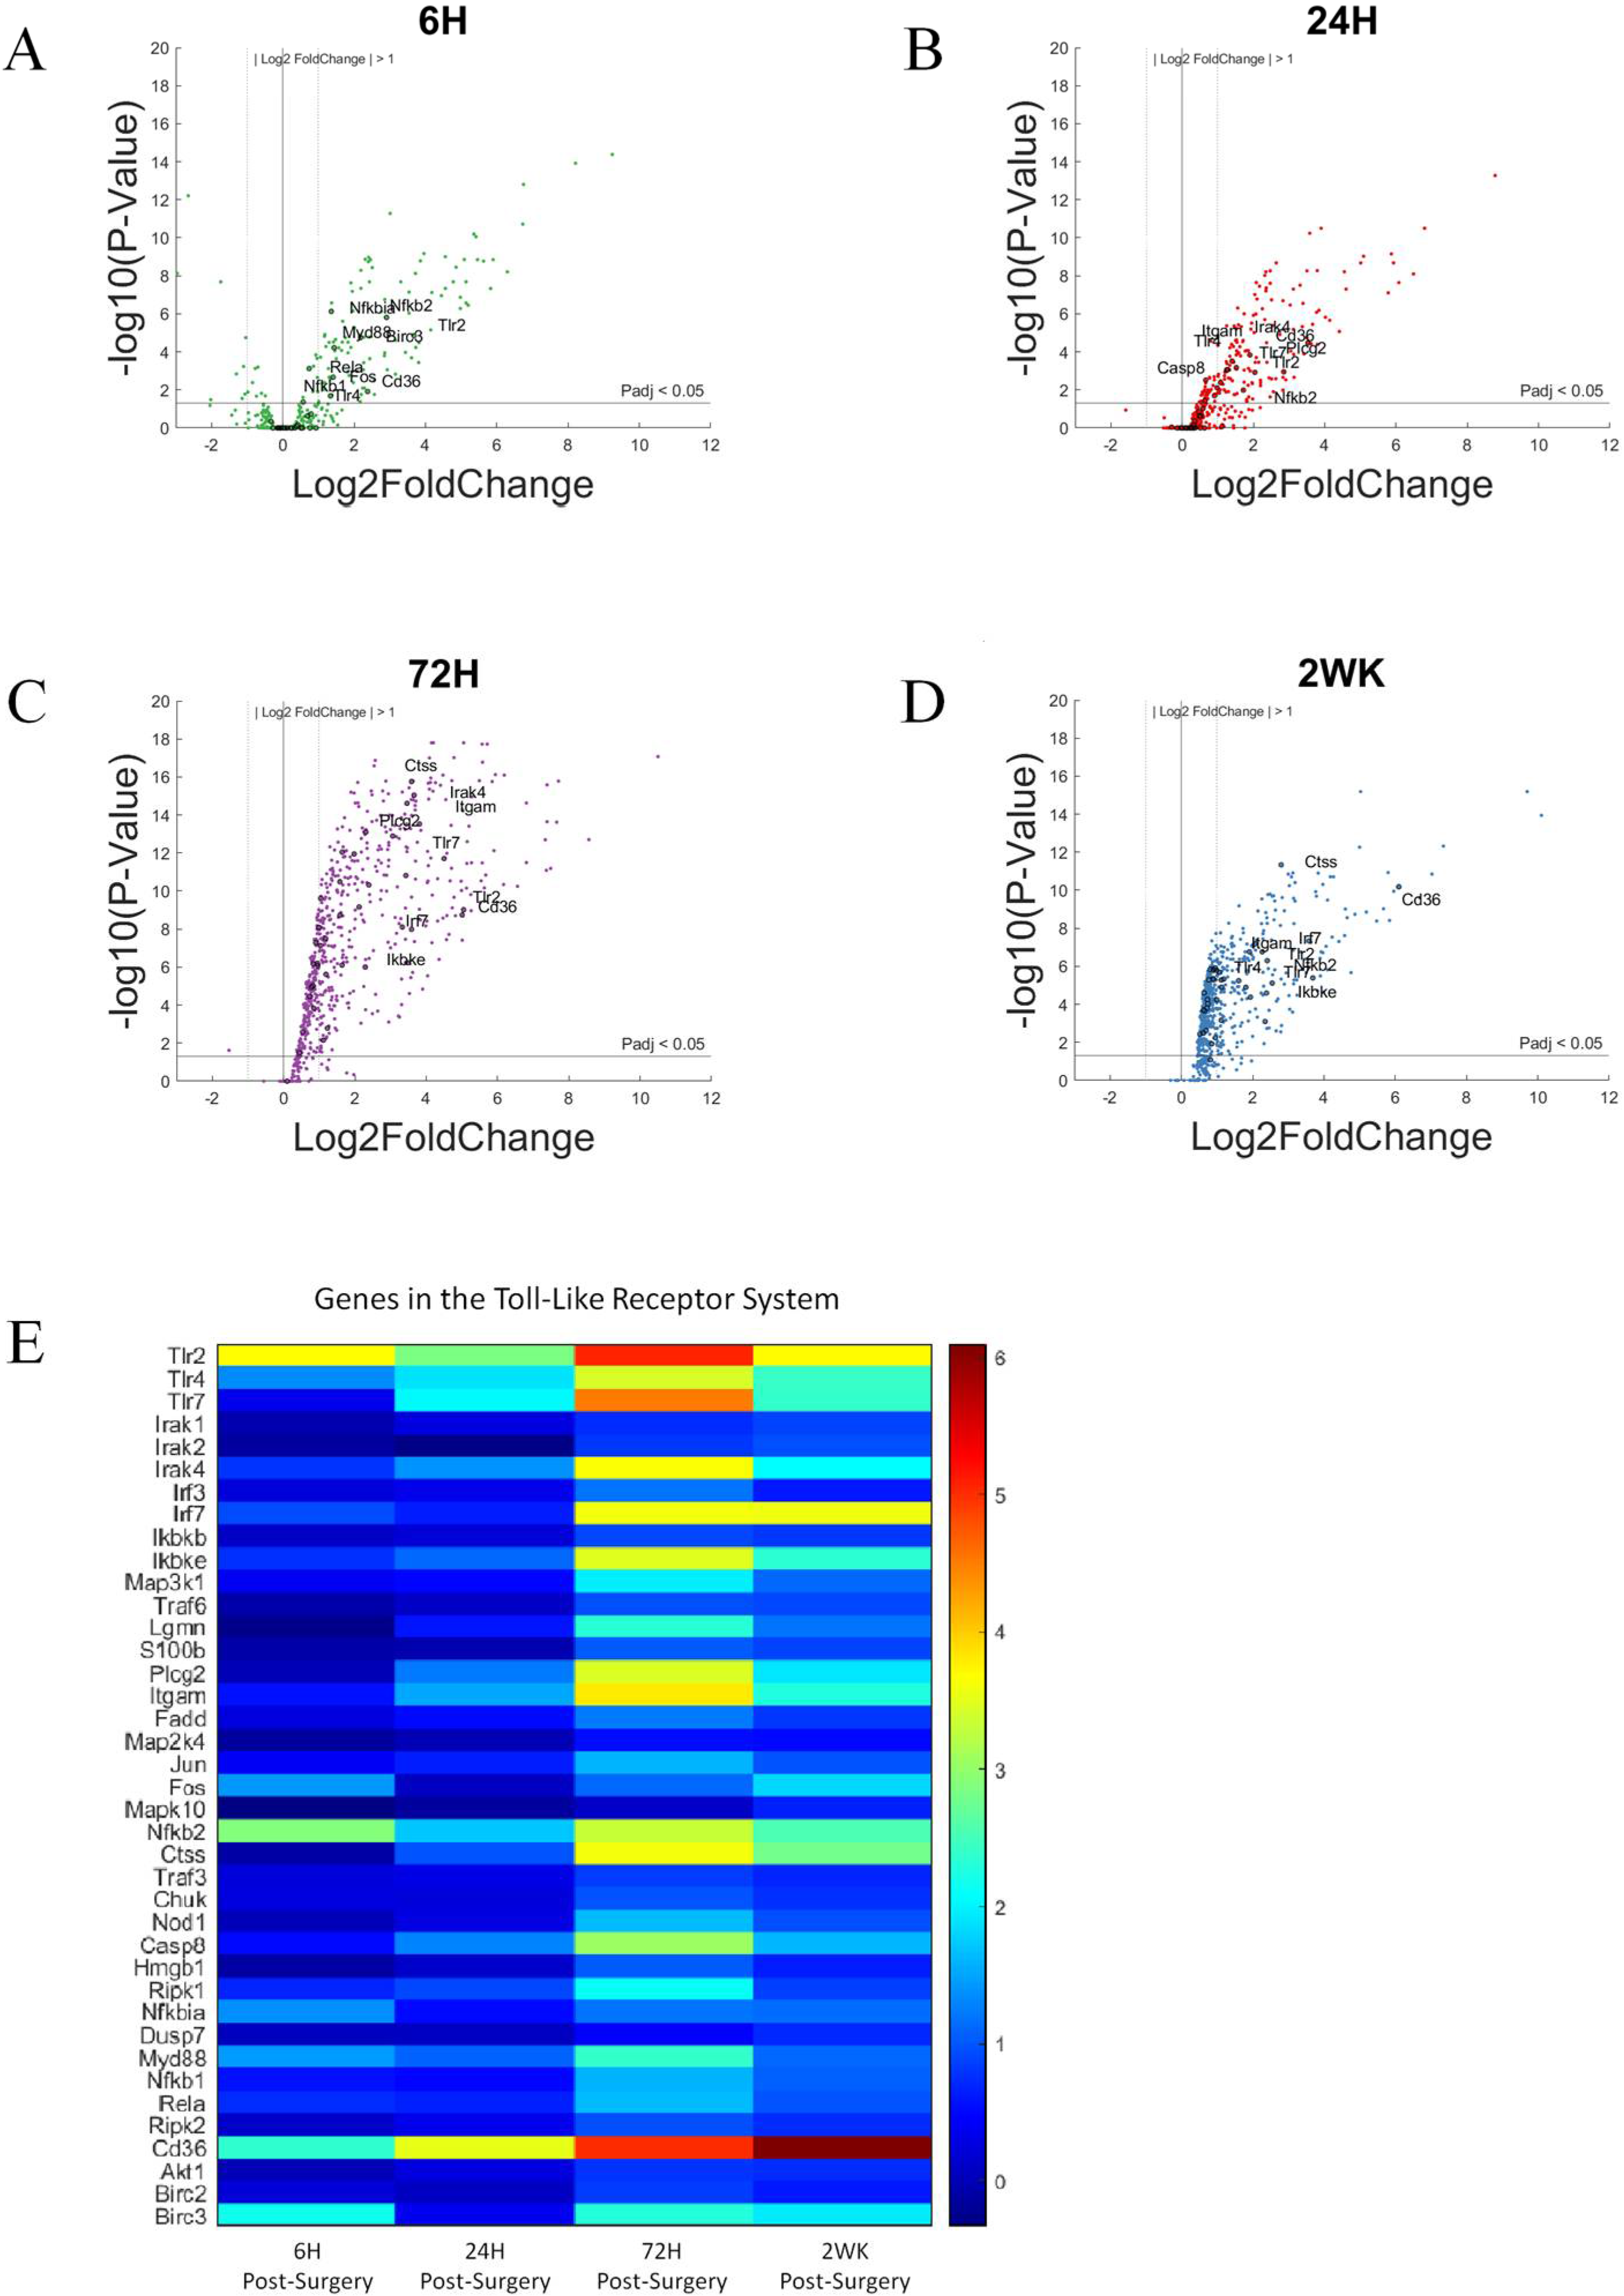
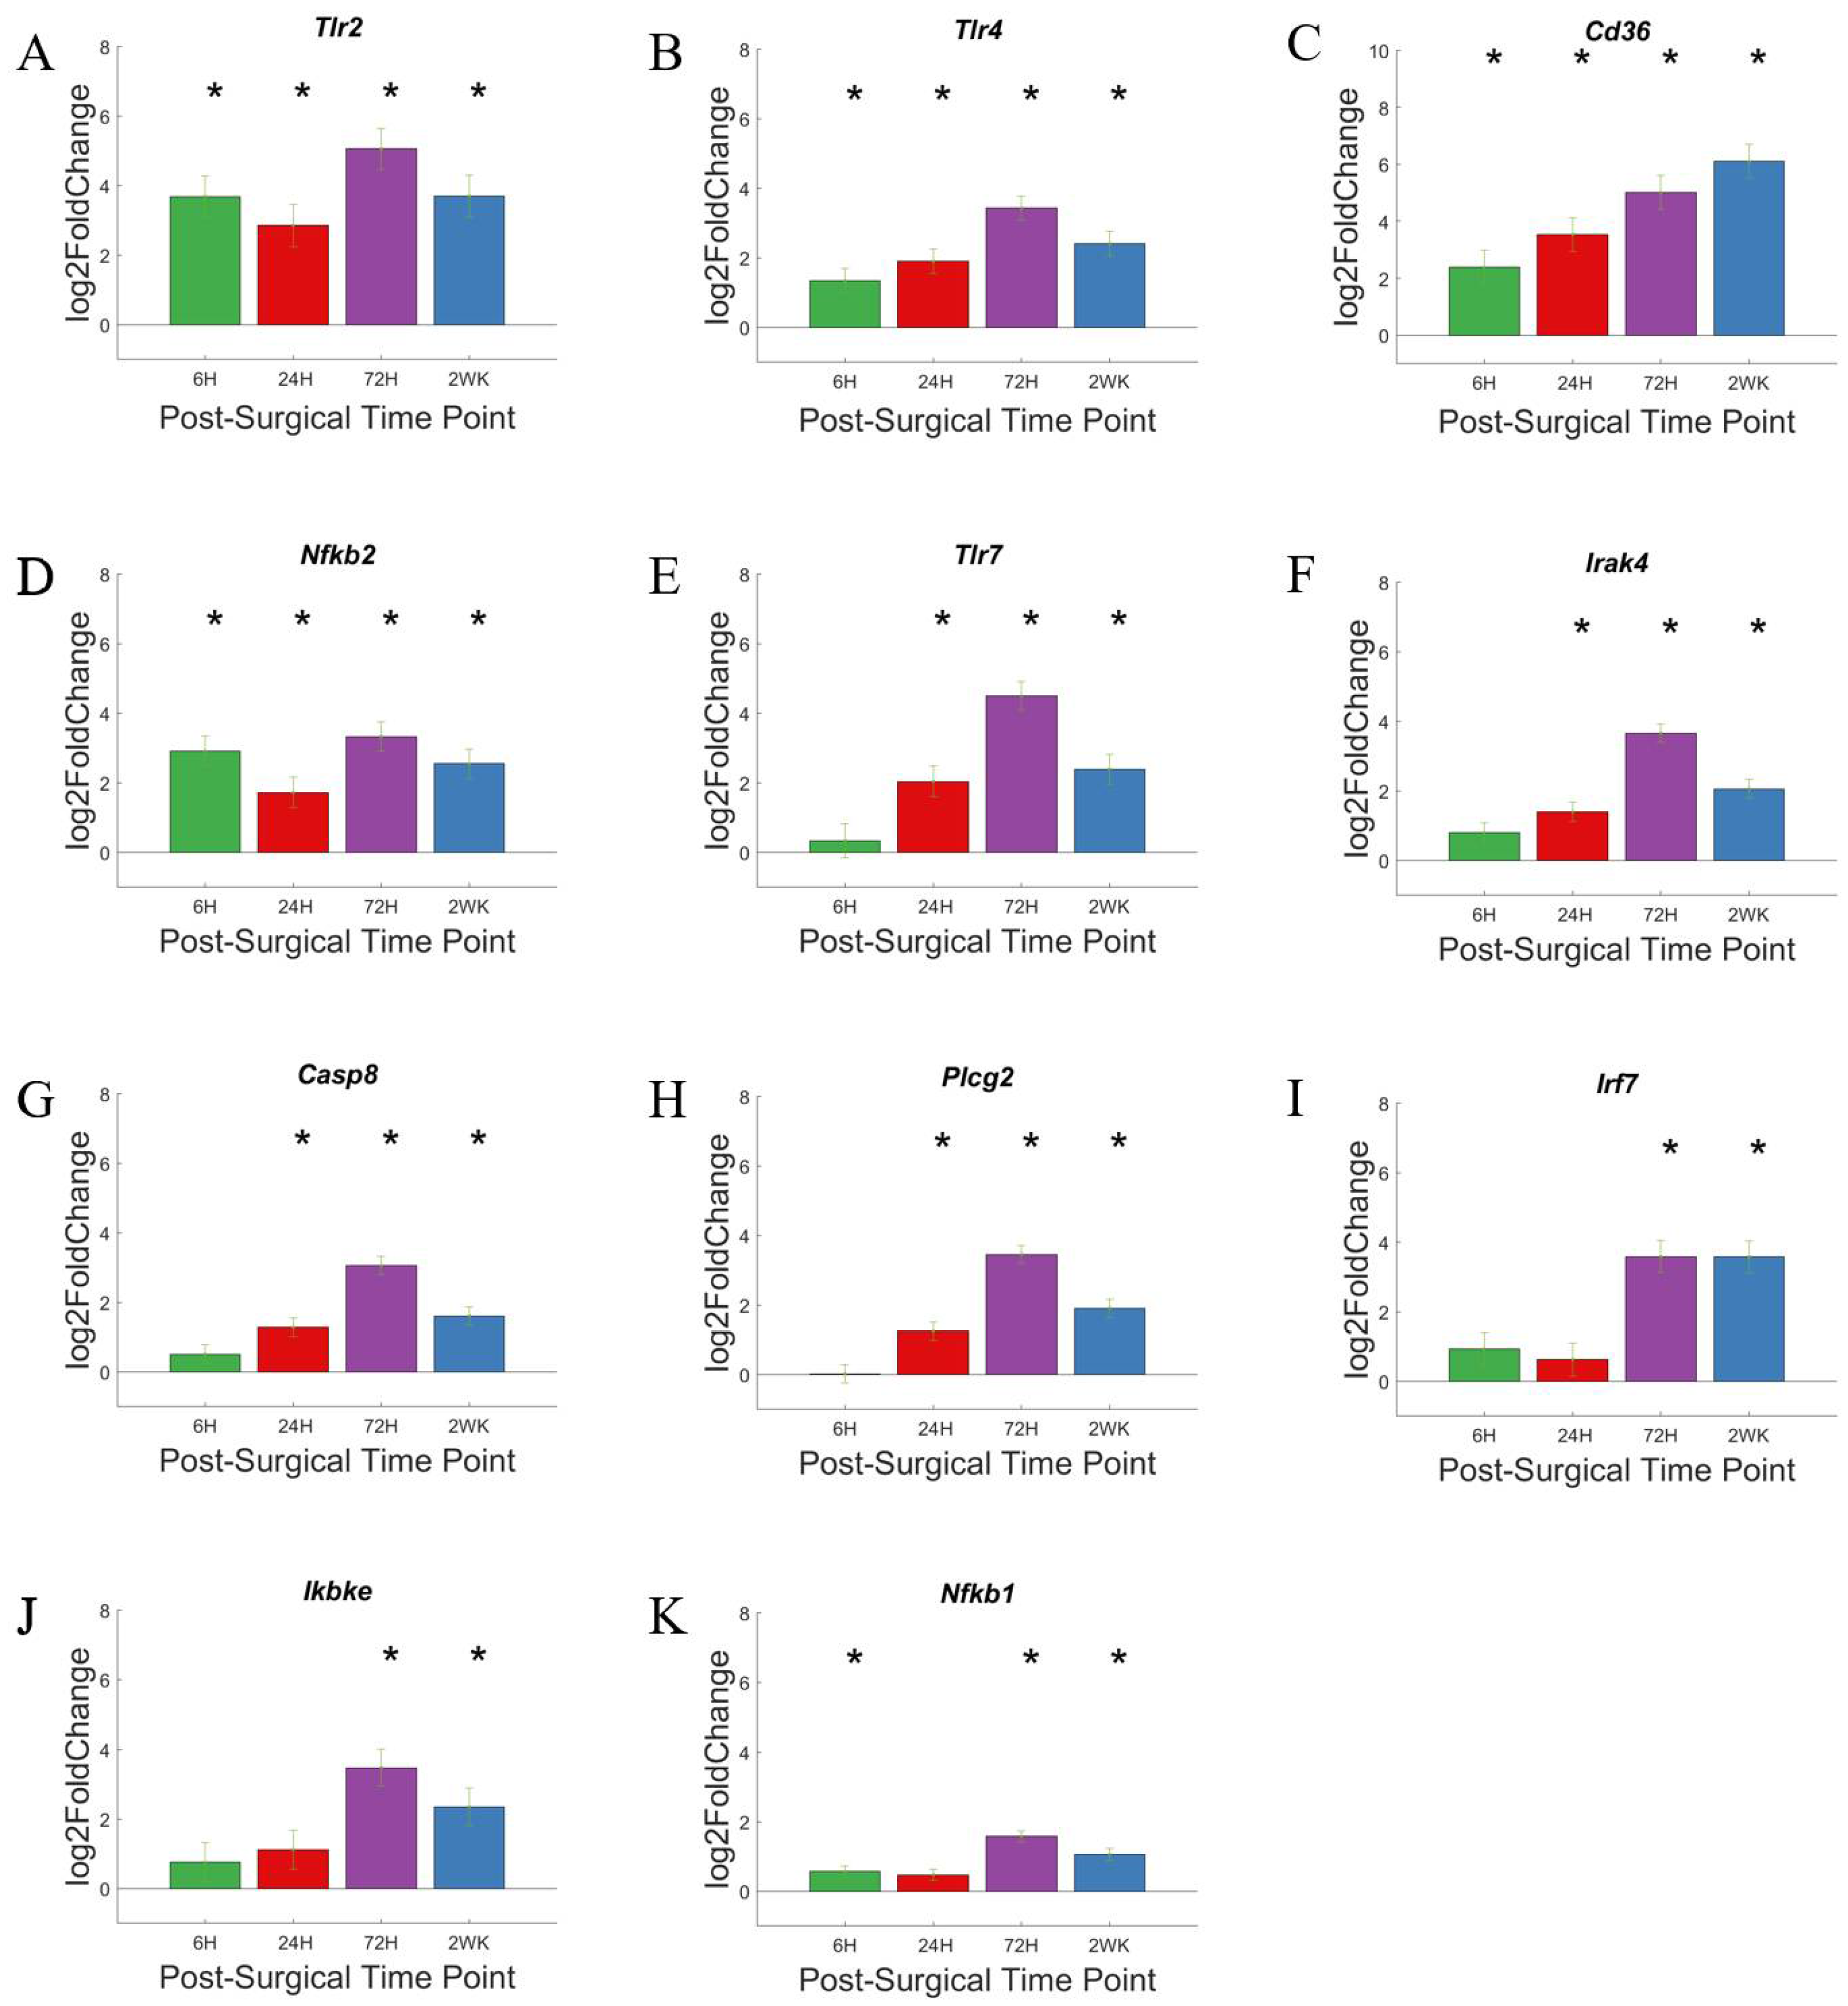
3.4. Toll-Like Receptors and Associated Pathways

Toll-like receptors are a subset of pattern recognition receptors that are membrane-bound. Some of its members, such as TLR 2 and TLR4, are bound to plasma membrane, while others, TLR3, TLR9, are bound to endosome membrane [75]. Note that the mice used in this study were Cd14−/−, and CD14 is a co-receptor for TLR2 and TLR4. Previously, our lab has investigated the role of Toll-like receptors in the neuroinflammatory response to intracortical microelectrodes and the associated recording performance. In our previous studies, we concluded that while complete inhibition of TLR2 had no impact on tissue response to microelectrode, complete inhibition of TLR4 worsened tissue response [76].
In the volcano plots (Figure 7A–D), genes associated with Toll-like receptor pathway are labelled if Padj < 0.05 and log2foldchange > 1 or <−1 (i.e., 2-fold increase or decrease in expression). Furthermore, due to the large number of gene in this grouping, only the top 10 genes with the largest log2foldchange at each time point within the group are labeled. With a few exceptions such as Tlr2, Nfk2, and Cd36, the genes of the Toll-like receptor pathway are slow to increase in expression. Whereas there are fewer genes showing upregulation at 6-h post-surgery, and more genes showing upregulation in gene expression at 72-h post-surgery. This is different than the time course of expression for genes in the Toll-like receptor pathway in WT animals. Specifically, we have demonstrated that in WT mice implanted with intracortical microelectrodes, the genes in the Toll-like receptor pathway show an upregulated expression early on [36]. This distinction in the Cd14−/− mice is most likely due to the lack of CD14 requiring a secondary mechanism to initiate the TLR-mediated neuroinflammatory response and could be directly linked to initial and short-lived improvements in recording performance in Cd14−/− mice [42].
Again, we created bar graphs to better visualize statistically relevant changes in gene expression as a function of time (Figure 8). Here, we see that the expression of Tlr2, Tlr4, Cd36, and Nfkb2 (Figure 8A–D) all displayed elevated gene expression at all four time points investigated. However, each of these four genes displays different levels and a different pattern of activation. For example, Tlr2 and Nfkb2 are relatively consistent over time, with slight fluctuations both up and down. Alternatively, Cd36 expression is the only gene in the TLR pathway that continues to increase with each subsequent time point that we evaluated. Therefore, the continuous increase in Cd36 expression suggests that increasing expression could be related to delayed activation or downstream compensation resulting from the lack of CD14.
Of note, Tlr7, Irak4, Casp8, Picg2, Irf7 and Ikbke (Figure 8E–J) all presented with an initial delay in activation but remained activated at the 2-week post-surgery time point. The delayed response of these six genes suggest that they could be potential co-therapeutic targets together with CD14, which displays a rapid response and can be targeted for microelectrode performance at acute time points [42]. Like many genes of the pattern recognition pathway, co-therapeutics with CD14 can be given sequentially, targeting first CD14 and later one of the TLRs. Nfkb1 (Figure 8K) expression demonstrated its own unique pattern within the TLR pathway. Specifically, gene expression was modestly elevated compared to control animals at all but the 24-h post-surgery time point. NFkb is a transcription factor encoded by Nfkb1. NFkb responds to immune activation signals and in turn regulate immune response. Although we expect Nfkb1 activity to play a role in the neuroinflammatory response against intracortical microelectrodes, it would be more important to evaluate the activity of NFkb rather than to conclude Nfkb1 role based on gene expression alone.

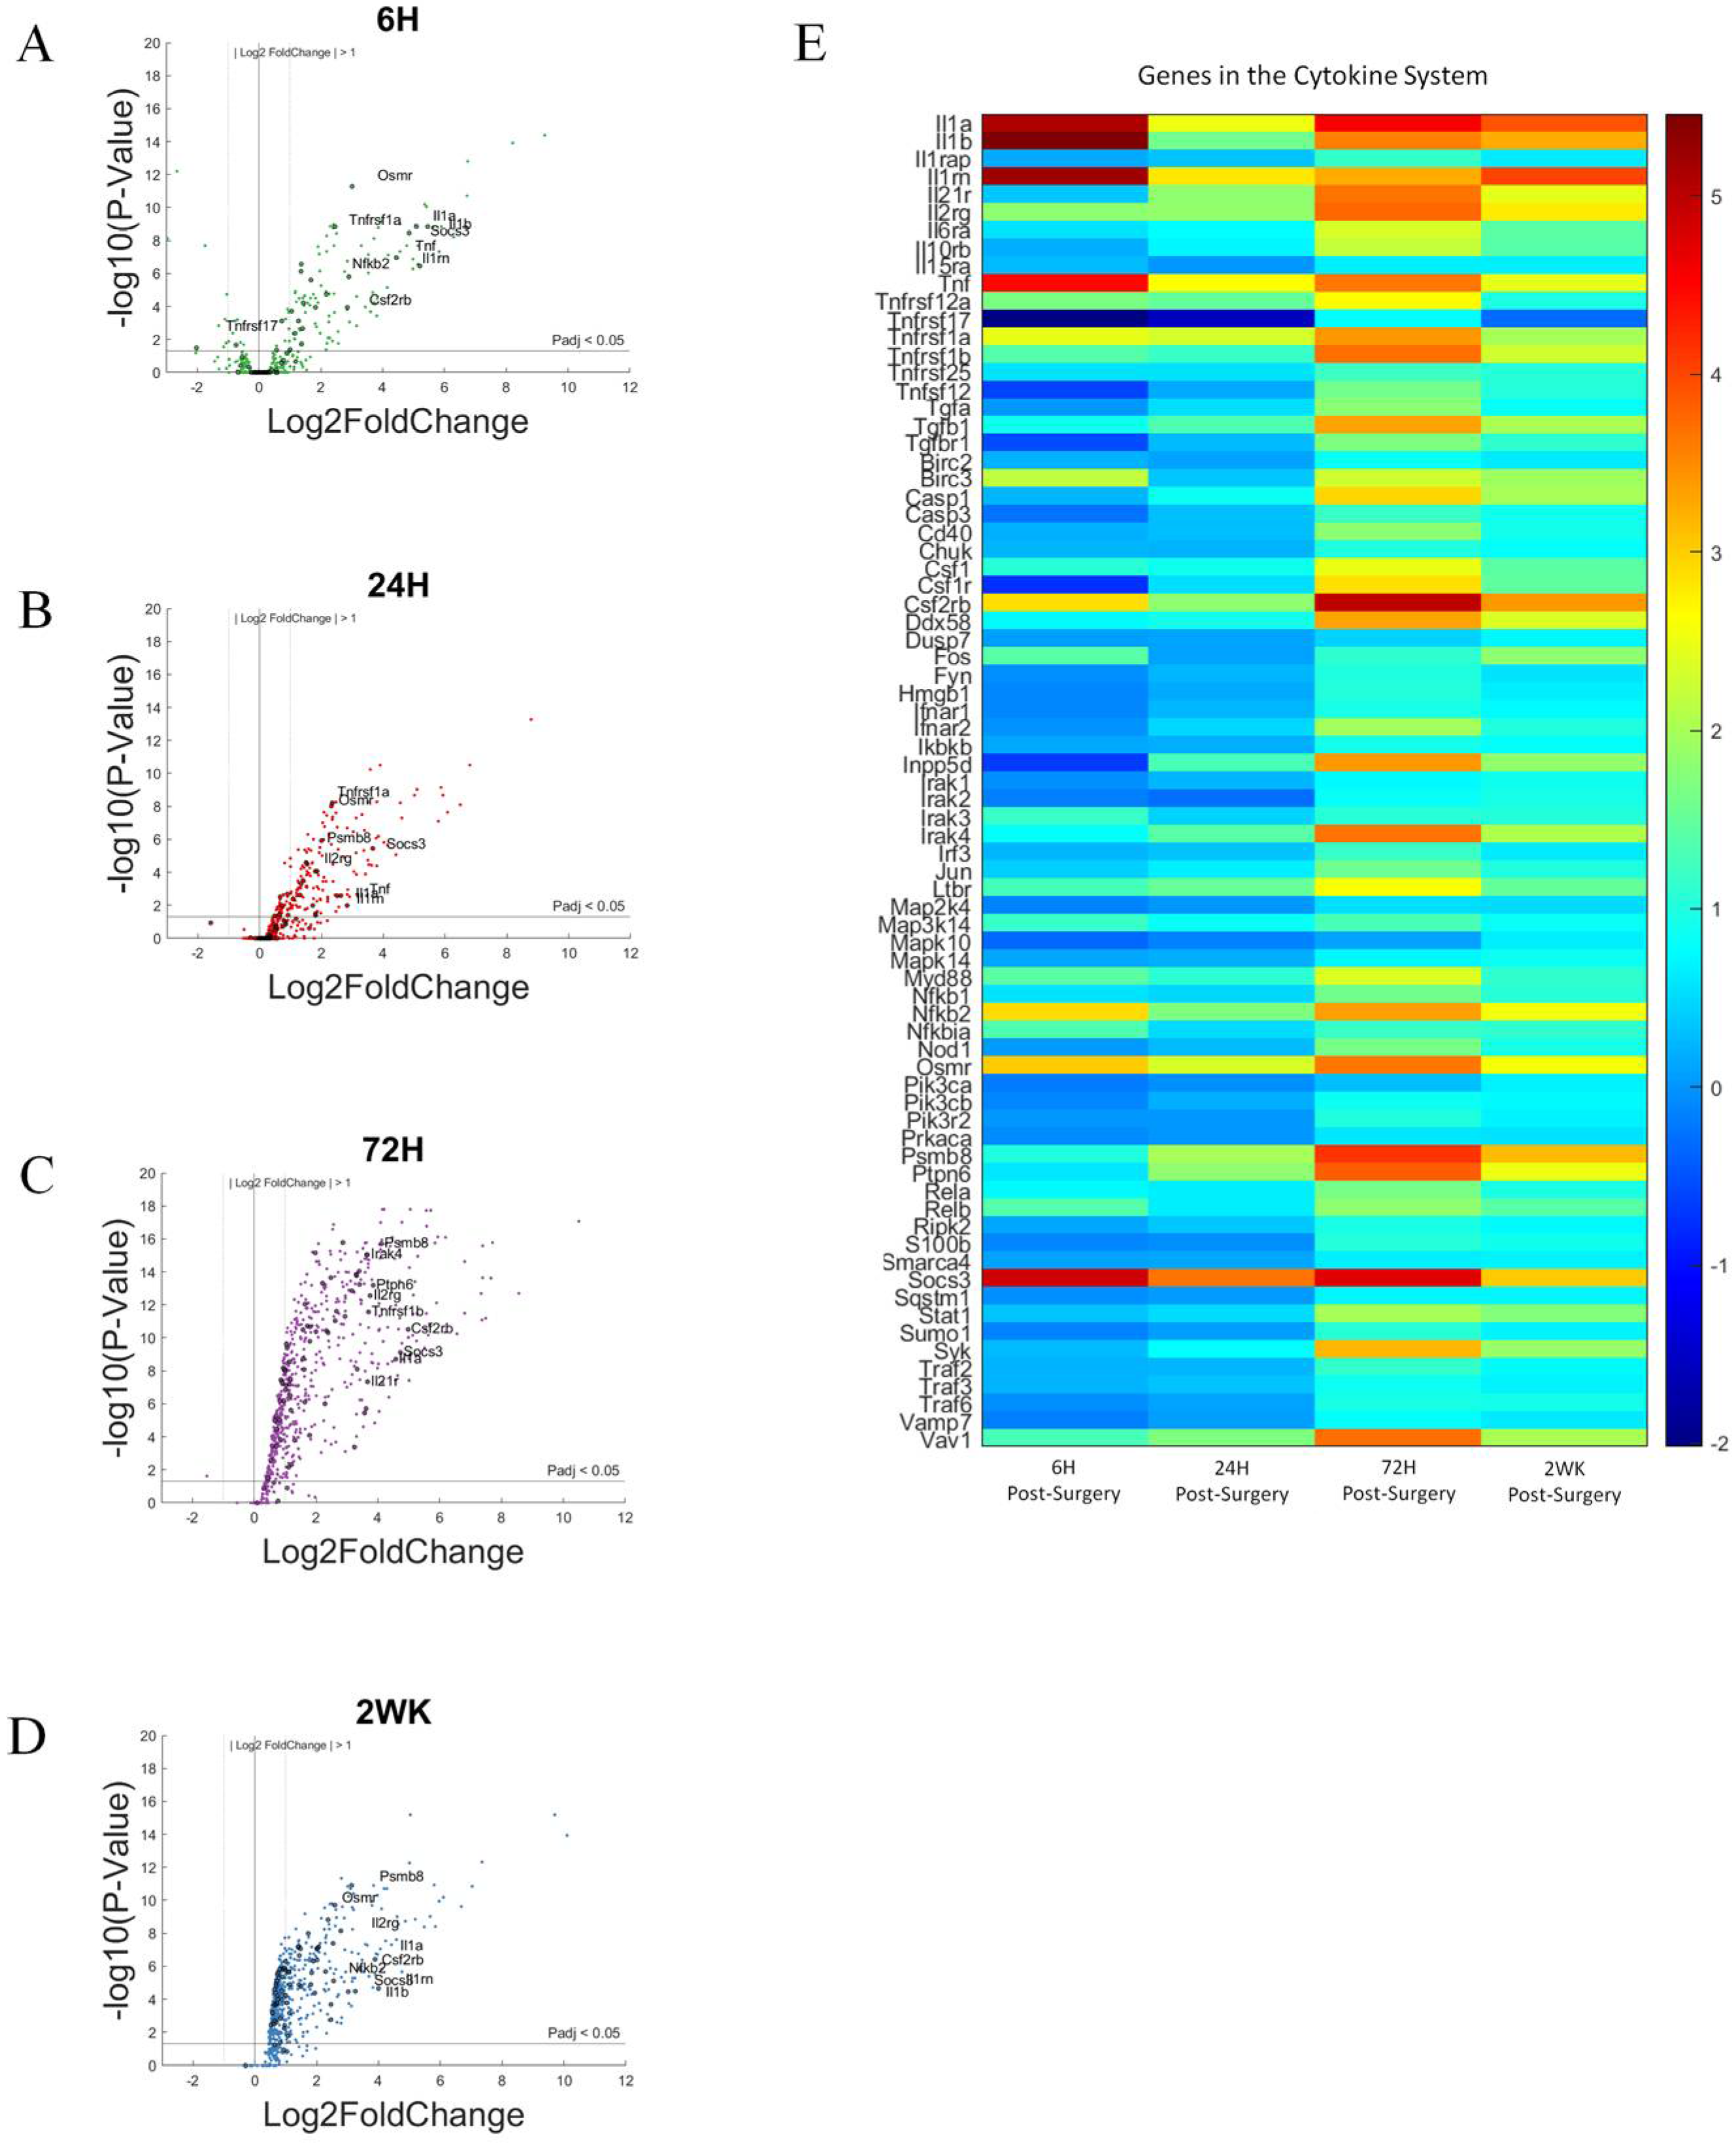
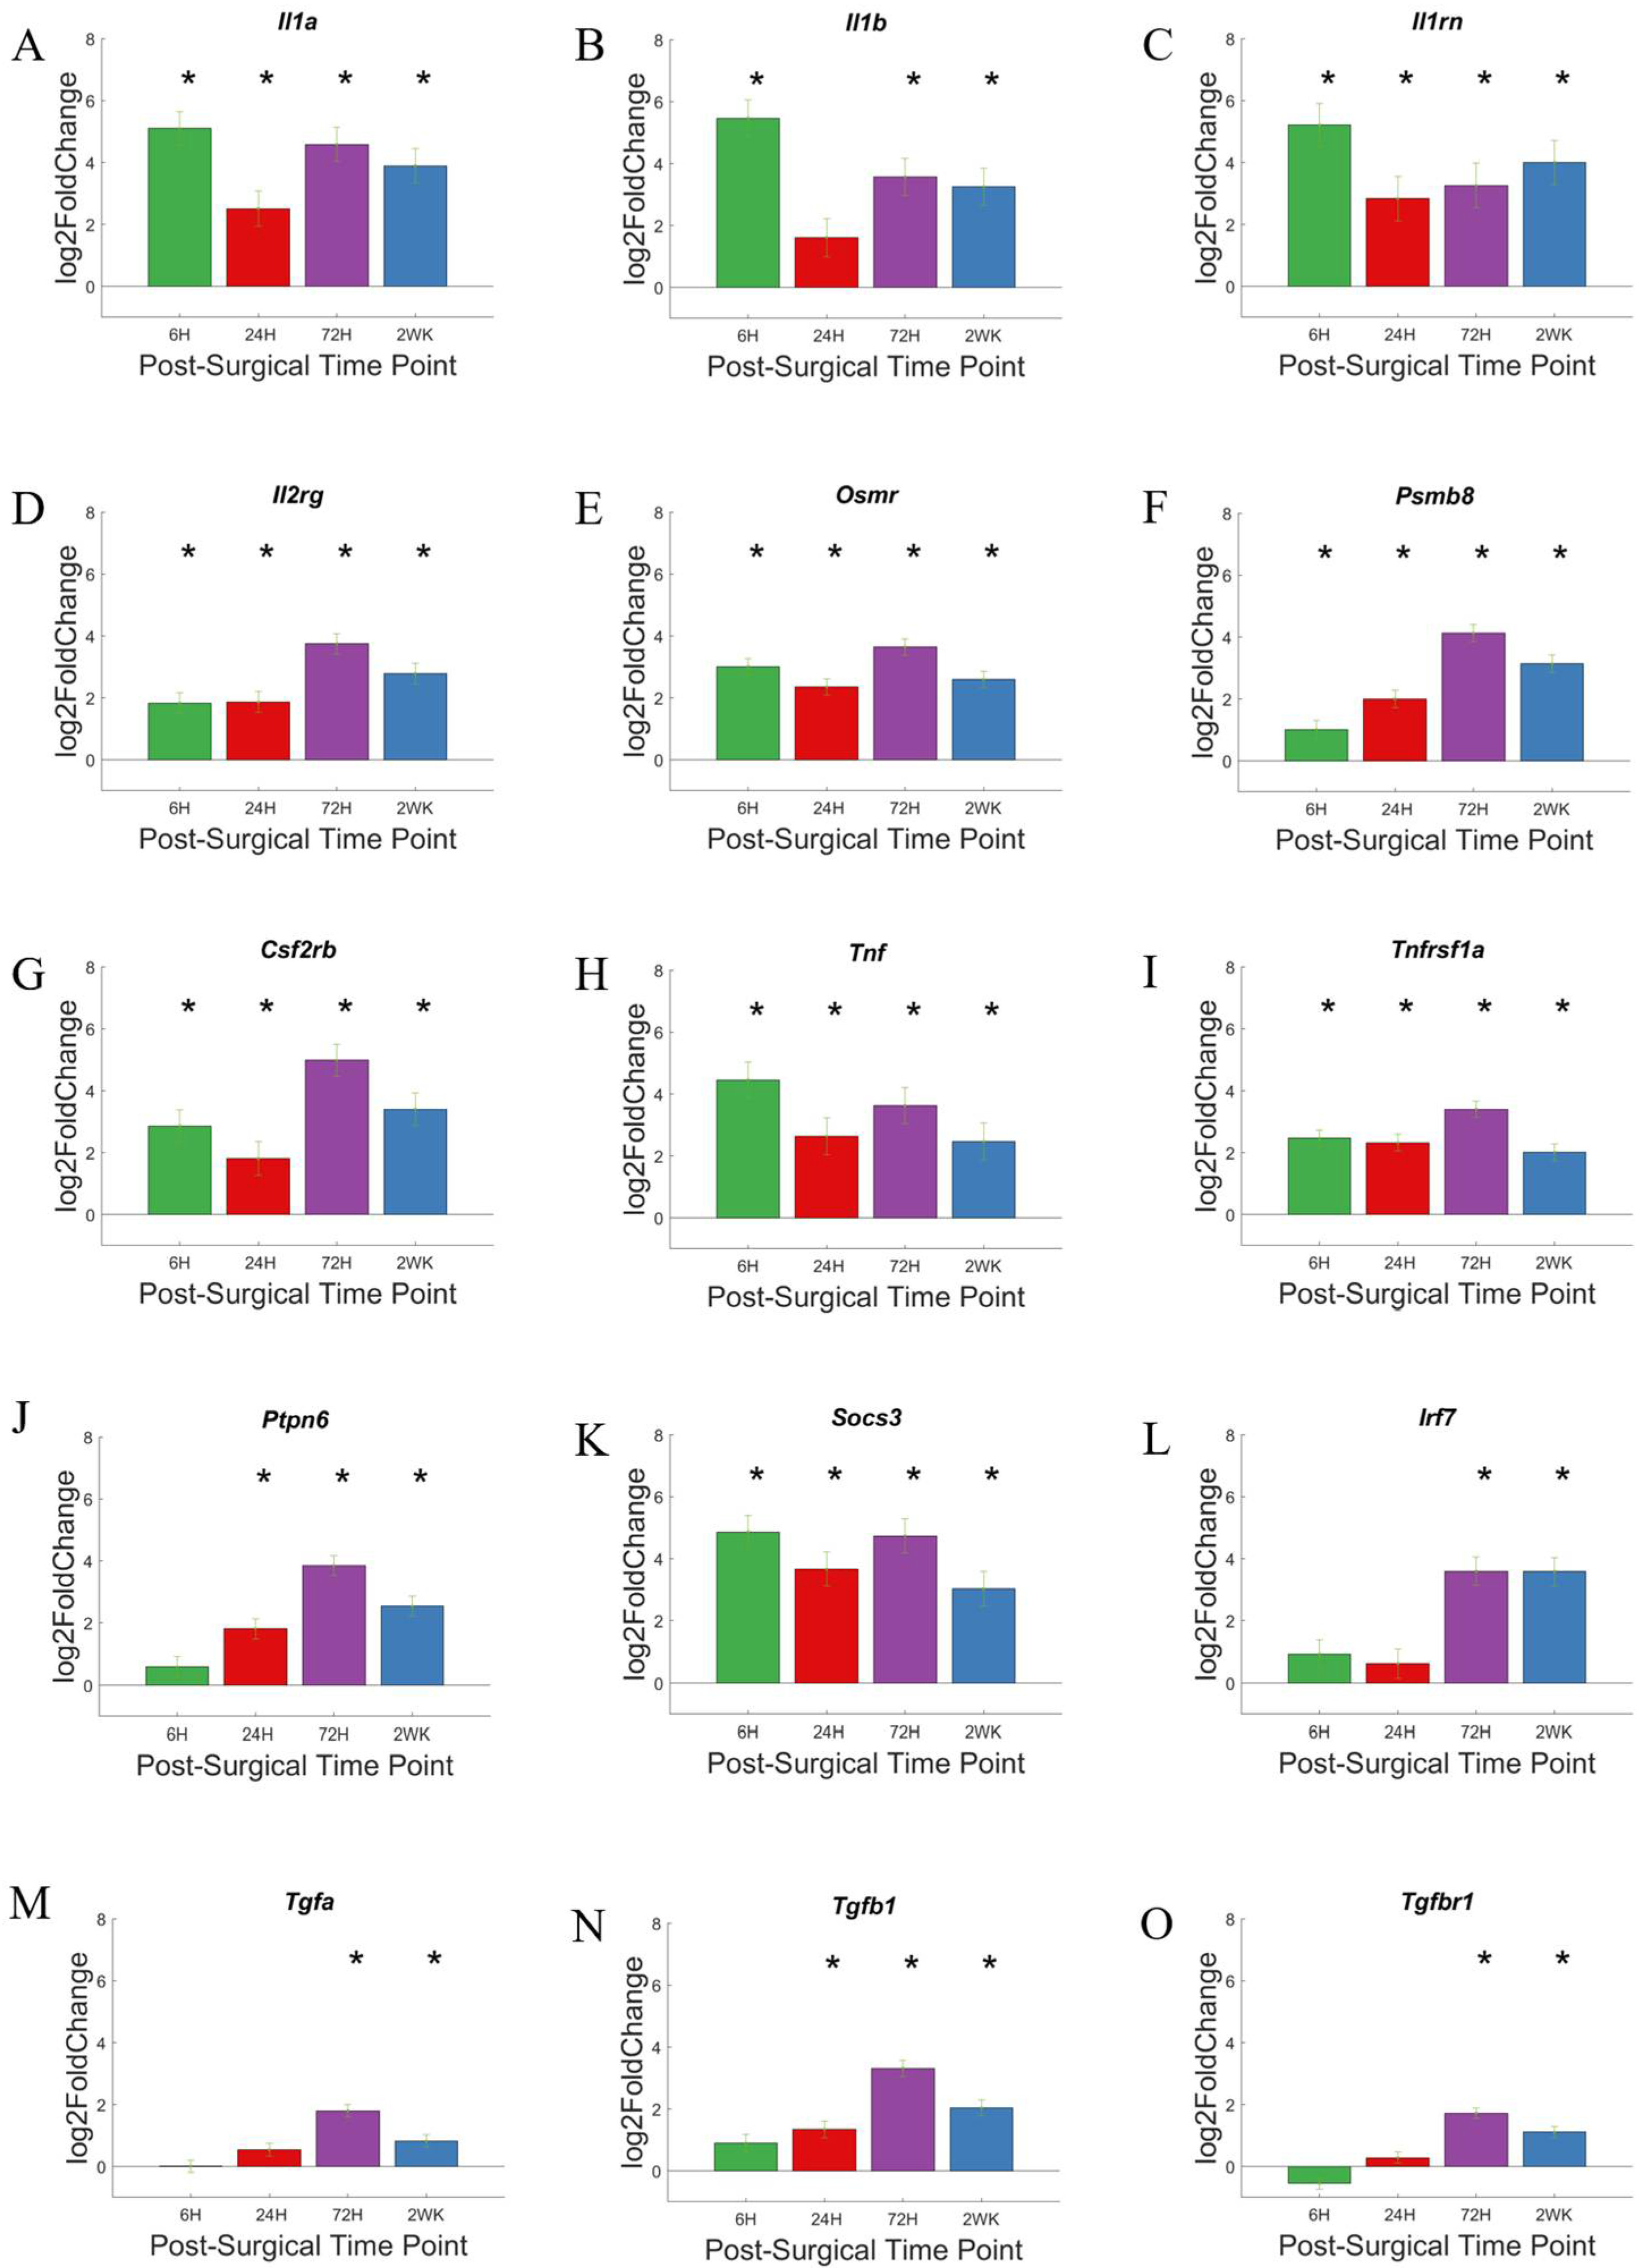
3.5. Cytokine Response
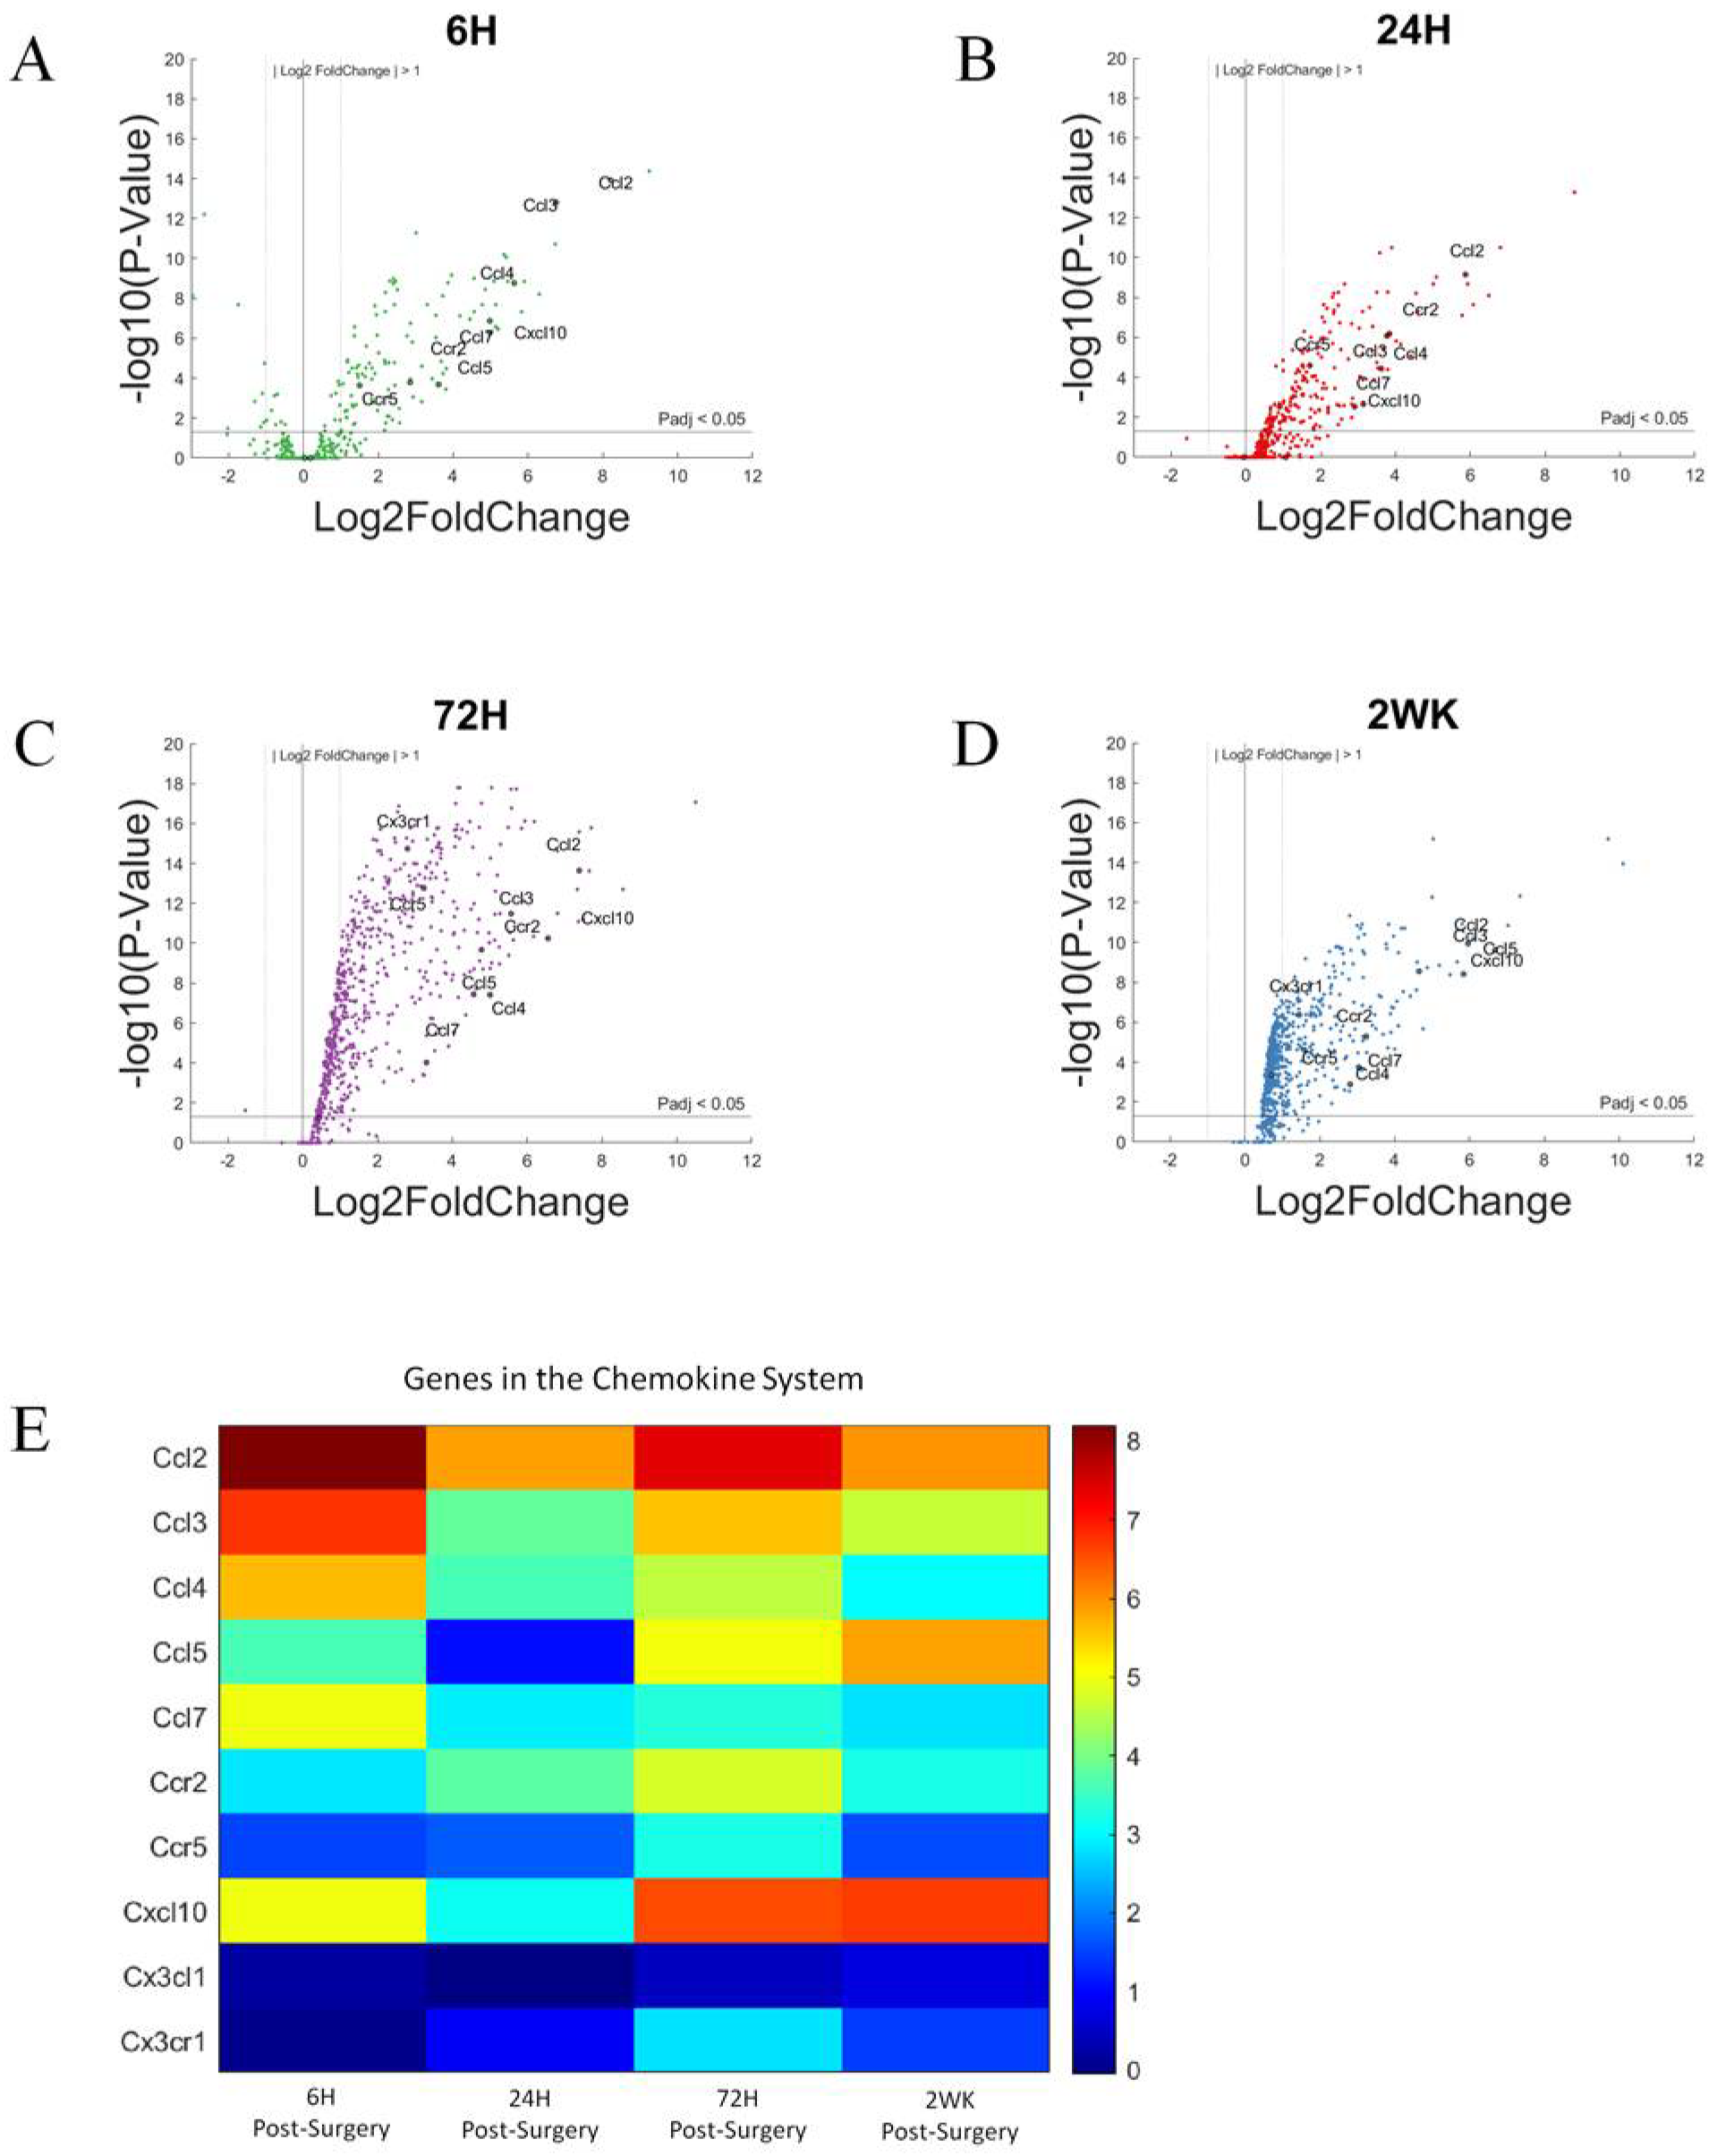
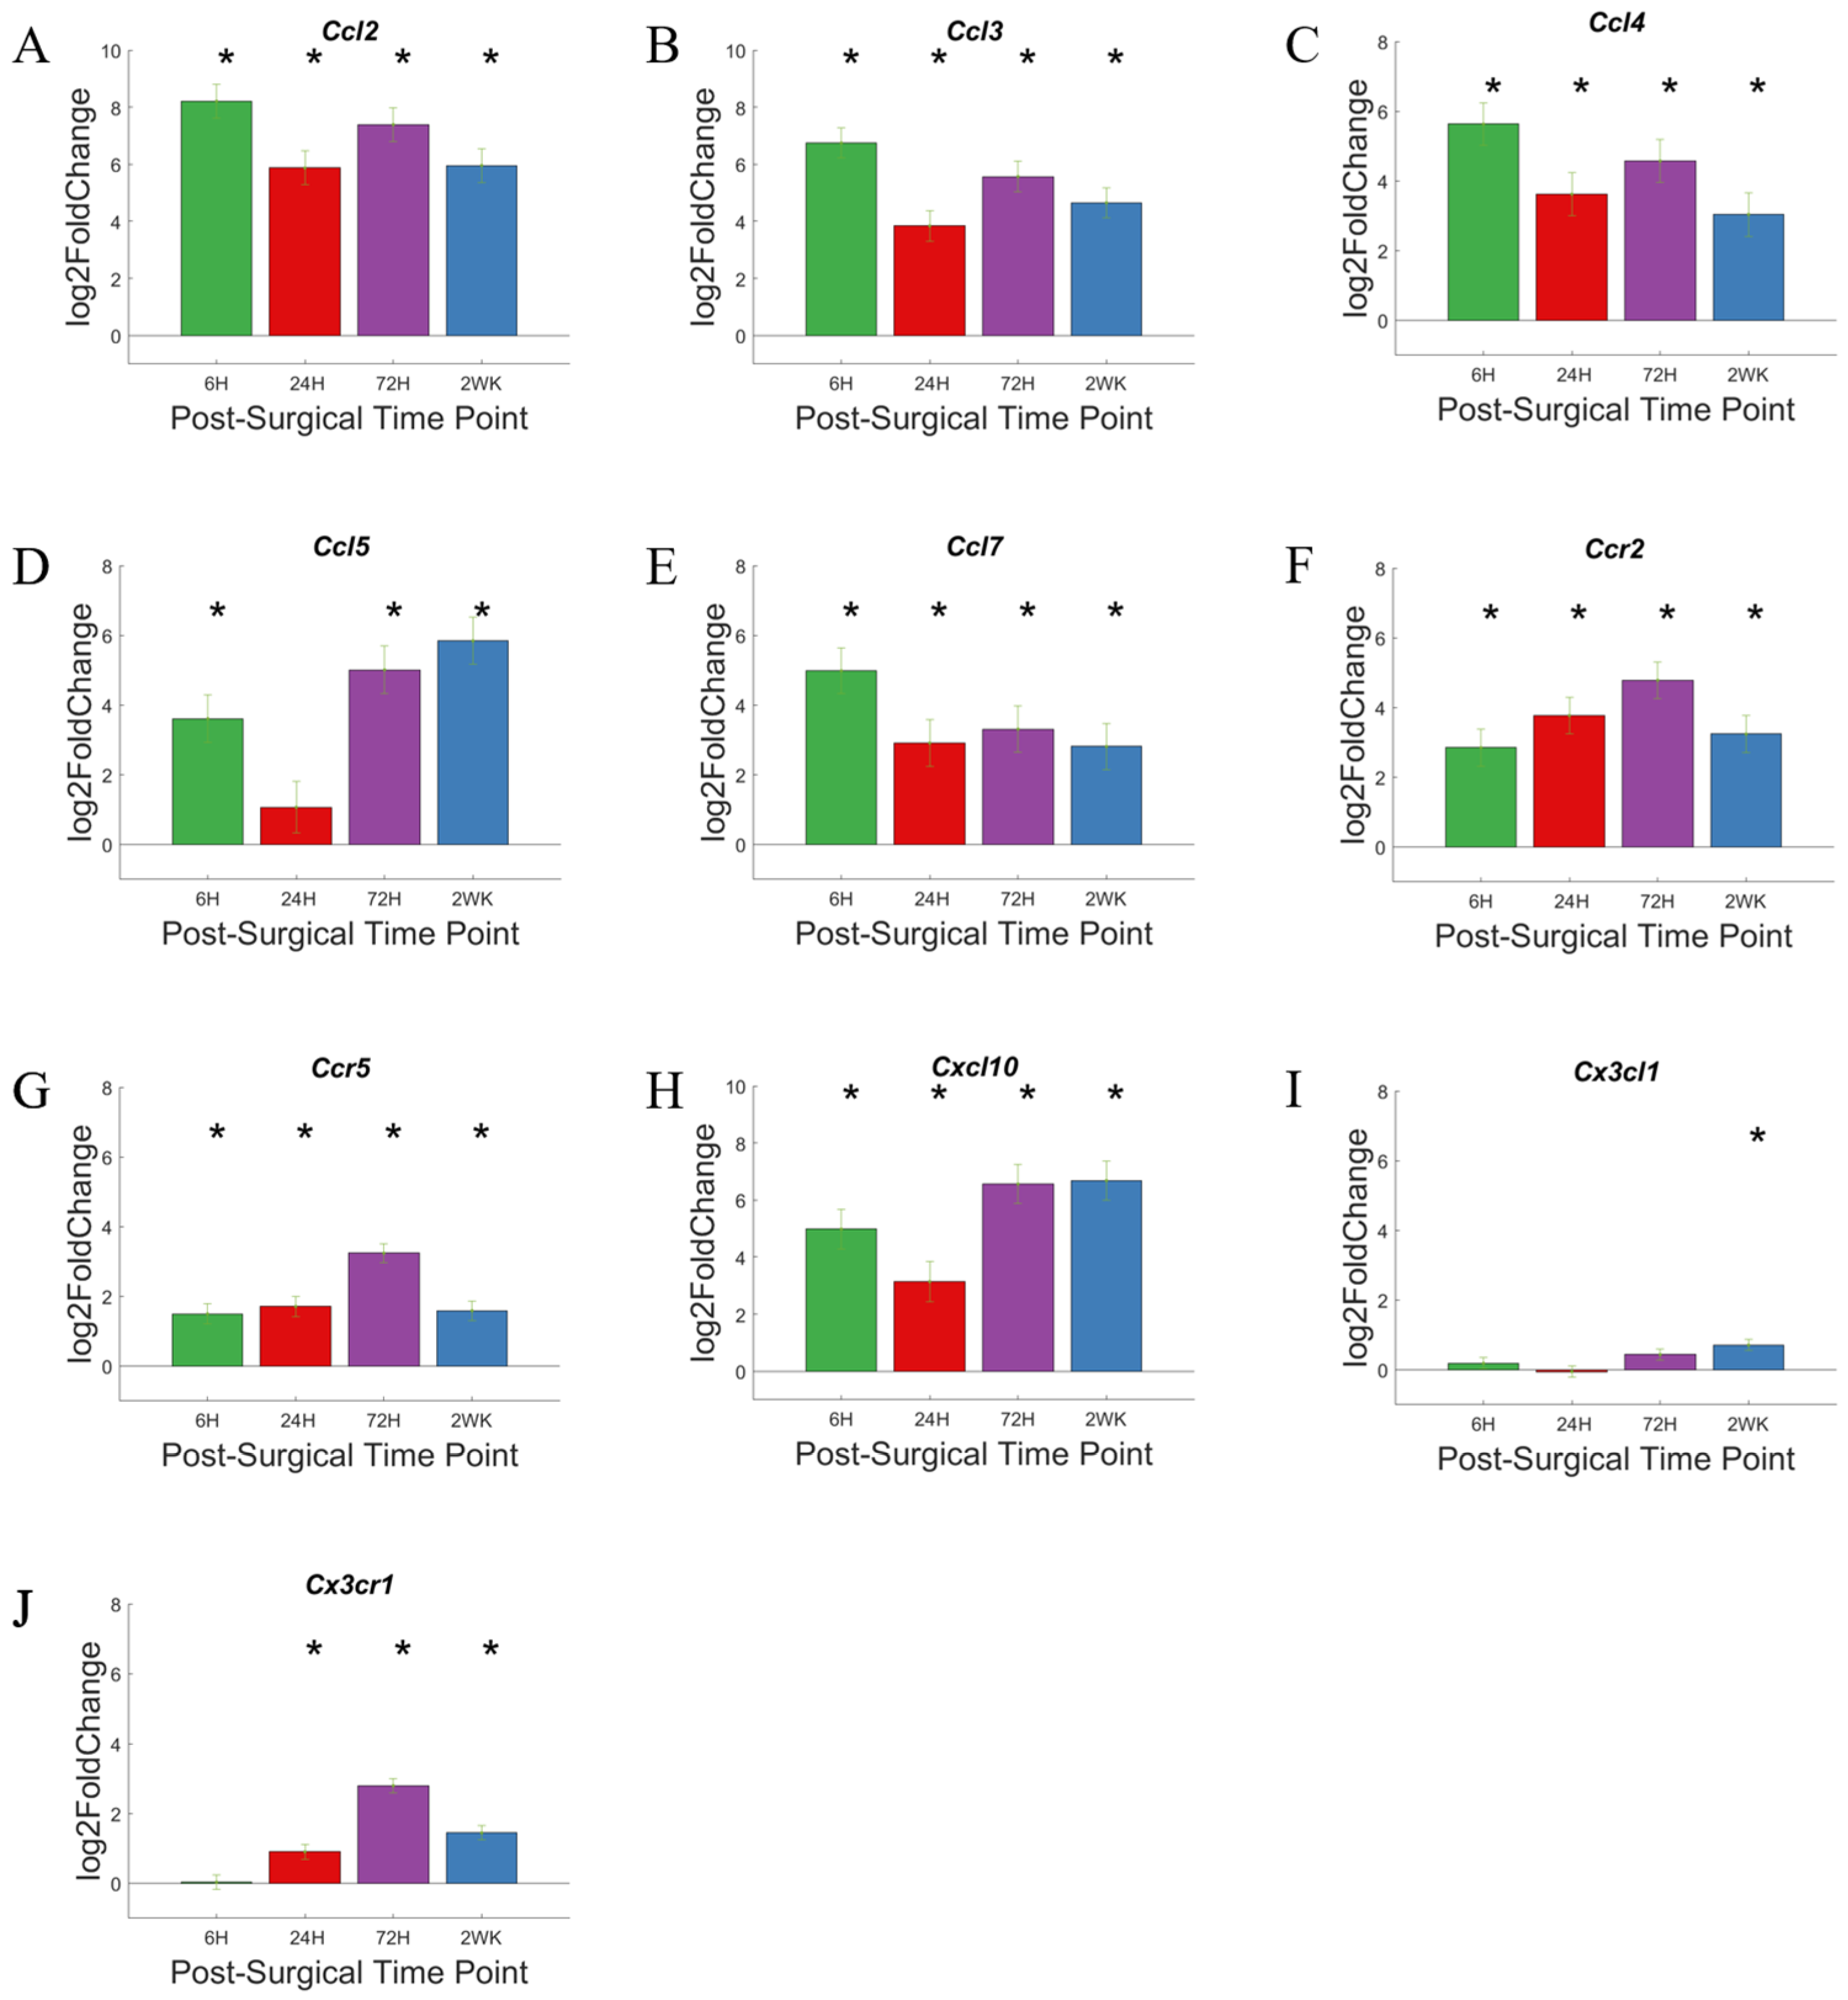
Cytokines are small soluble protein molecules (~8–26 kDa) produced as a signaling molecule to modulate the immune response against pathogens and injury. Several classes of cytokines include chemokines, interferons, colony stimulating factors, lymphokines, and interleukins, which can be further subdivided into many families. Some members of the complement cascade, such as C4a, also act as cytokines [77].
Roughly 86 genes associated with the cytokine response were included in our panel. The 72 cytokine-associated genes that showed the largest differential gene expression in our study were compiled here for analysis and discussion. Figure 9 presents results for all genes in volcano plots, highlighting cytokine associated genes (Figure 9A–D). Additionally, we used a heat map to present log2foldchanges in gene expression for each time point examined, compared to NSCTR mice (Figure 9E).
In the volcano plots (Figure 9A–D), cytokine-associated genes are labeled if Padj < 0.05 and log2foldchange > 1 or <−1 (i.e., 2-fold increase or decrease in expression), furthermore, due to the large number of gene in this grouping, only the top 10 genes with the largest log2foldchange at each time point within the group are labeled. All 72 cytokine associated genes are shown in Figure 9E which displays the relative gene expression levels of each time point compared to control in heatmaps.
In Figure 10, we highlighted 12 cytokine-associated genes that were elevated for either 3 of the 4 times points we examined (IL1b and Ptpn6), or all 4 of the 4 times points we examined (IL1a, IL1rn, IL2rg, Osmr, Psmb8, Csf2rb, Tnf, Tnfrsf1a, Socs3, and Vav1), and 3 genes that showed elevation of 2 or 3 of the later time points that we examined (Tgfa, Tgfb1, and Tgfbr1). Each gene within this set shows a slightly different level of expression at each time point evaluated. Since we only ran statistical analysis between the time point and control mice, no statistical comparison will be made between individual time points, and only qualitative trends are warranted here.
Members of the chemokine family will be discussed in the next section. Members of Interleukin family of cytokines, such as Il1a, Il1b, Il1rn, and Il2rg (Figure 10A–D), and members of the Tumor Necrosis Factor (TNF) family, such as Tnf and Tnfrs1a (Figure 10H,I), showed increased expression at our earliest time point, with continued upregulation throughout the duration of this study. The Transforming Growth Factor (TGF) Family of genes, Tgfa, Tgfb, Tgfbr1, (Figure 10M–O) all showed a delay in increase in expression with a more pronounced increased in expression at the 72-h and/or 2-week time point.
Although cytokines do not directly interact with the microelectrode, cytokines do promote an inflammatory state in the tissue-microelectrode interface that may lead to a prolonged blood–brain barrier breakdown, production of damaging molecules such as reactive oxygen species, and reduced healing [78]. For example, Tnfs (Figure 10H,I) and Ils (Figure 10A–D) encodes pro-inflammatory molecules and rapid responders to injury [77].
Rapidly produced and accumulated high levels of cytokines reflect their role as key modulators and coordinators of the immune system. CD14 is an early detector of tissue damage and infection, and a lack of CD14 could potentially disrupt the gene-expression of cytokines. As cytokines form a complex and dynamic system of interactions, initial disruptions in expression of some of the cytokines may lead to altered inflammatory response at early time points post-implantation, and the system may recover at later time points. Members of the cytokine families may be great targets to improve recording performance, either alone or in combination with targeting CD14.
Gene encoding receptor for cytokine TGFβ, such as Tgfbr1 (Figure 10O), showed no increase in expression until 72-h post-surgery and continue to show increased expression at 2-weeks post-surgery. The increase in expression later is consistent with the role of TGFβ as an anti-inflammatory molecule and its role in wound healing, which lags acute inflammation [79]. Due to its anti-inflammatory properties, TGFβ may not be a potential inhibitory therapeutic target in microelectrode implantation. However, TGFβ may represent be a biomarker to evaluate the inflammatory process in the tissue-microelectrode interface for research purposes.

3.6. Chemokines

Chemokines, or chemotactic cytokines, are a superfamily subgroup of cytokines. The main role of chemokines involves the promotion of migration of white blood cells to the site of injury or infection. Members of the chemokine superfamily are further divided into 4 families based on their protein structural motif: XC, CC, CXC, and CX3C [80,81]. Note: XC motif chemokines has one cysteine near its amino terminus, CC motif chemokines has two cysteine adjacent to each other, CXC motif chemokines has two cysteines separated by an amino acid in between, and CX3C motif chemokines has two cysteines separated by 3 amino acids in between.
Volcano plot presentation of changes of gene expression identified numerous chemokine associated genes that were upregulated following microelectrode implantation (Figure 11A–D). Specifically, the chemokines and associated genes: Ccl2, Ccl3, Ccl4, Ccl5, Ccl7, Ccr2, Ccr5, Cxcl10, Cx3cl1, and Cx3cr1, were labeled in Figure 11 if Padj < 0.05 and log2foldchange > 1 or <−1 (i.e., 2-fold increase or decrease in expression). Chemokines display increased expression quickly after microelectrode implantation, with many of its members show upregulation in expression starting 6-h post-surgery and maintain high expression level throughout the 2-week period of this study. Specifically, at 6-h post-surgery, all chemokines studied excluding Cx3cl1 and Cx3ccr1 showed increased expression and remain elevated for the reminder of the 2-week study. However, Cx3cr1 showed low levels of upregulation in expression at 72-h and 2-weeks post-surgery. The relative increase in gene expression levels for each of these genes for chemokine associated genes are more readily depicted in heatmaps (Figure 11E) and bar graphs (Figure 12). The latter also indicate statistical significance compared to non-surgical controls
Differential expression of individual genes (Figure 12A–J) plotted as bar graphs with distinction for significance versus the NSCTR mice allows us to note changes in activity versus time. Interestingly, most of the genes showing increased activity early on are of the CCL chemokine family (CC motif chemokine ligands): Ccl2, Ccl3, Ccl4, Ccl5, Ccl7 (Figure 12A–E); and one member of the CXCL chemokine family (CXC motif chemokine ligands): Cxcl10 (Figure 12H). After 6-h post-surgery, the genes are highly upregulated, at ~4–8-fold increase on log2 scale. In many cases the expression level of these genes remains high, although in Ccl5 the expression level decreases at 24-h post-surgery, just to recover to higher expression levels. Genes encoding receptors for the CCL family, the CC-Receptors Ccr2 and Ccr5 (Figure 12F,G), demonstrate a slow increase in expression with time, and are upregulated to a lesser degree than the CCL chemokine family.
Genes for the CX3C family ligand Cx3cl1 and receptor Cx2cr1 (Figure 12I,J) showed low levels of upregulation in expression level compared to the CC an CXC family of cytokines. Cx3xl1 showed slight upregulation in gene expression, and while statistically significant only at 2-week post-surgery, with less than 1 log2foldchange. Cx3cr1(receptor for protein encoded by Cx3cl) showed a slightly higher upregulation in expression compared to its ligand, but still lower compared to genes encoding CC family of receptors.
In addition to recruiting cells of the immune system to the site of injury, chemokines are also involved in the proliferation, differentiation, activation, degranulation, and respiratory burst of white blood cells; their activities alter the microenvironment of the site of infection and injury. Respiratory burst, especially, leads to the production of reactive oxygen species that may damage implanted microelectrode as well as the tissue in the implant site. The CC subfamily of chemokines are involved in chemoattraction and induce the migration of immune cells such as monocytes [82]. The rapid and high upregulation of the CC chemokines suggest large numbers of monocytes would be recruited to the site of injury. The CXC subfamily of chemokines is also involved in the chemoattraction of immune cells such as neutrophiles [83]. The lone CX3C subfamily member of chemokines are involved in both chemoattraction and adhesion [84]. The high expression level of CCL and CXCL family present them as good potential targets in reducing inflammation and improving chronic microelectrode recording performance, either alone or in combination with CD14 inhibition.

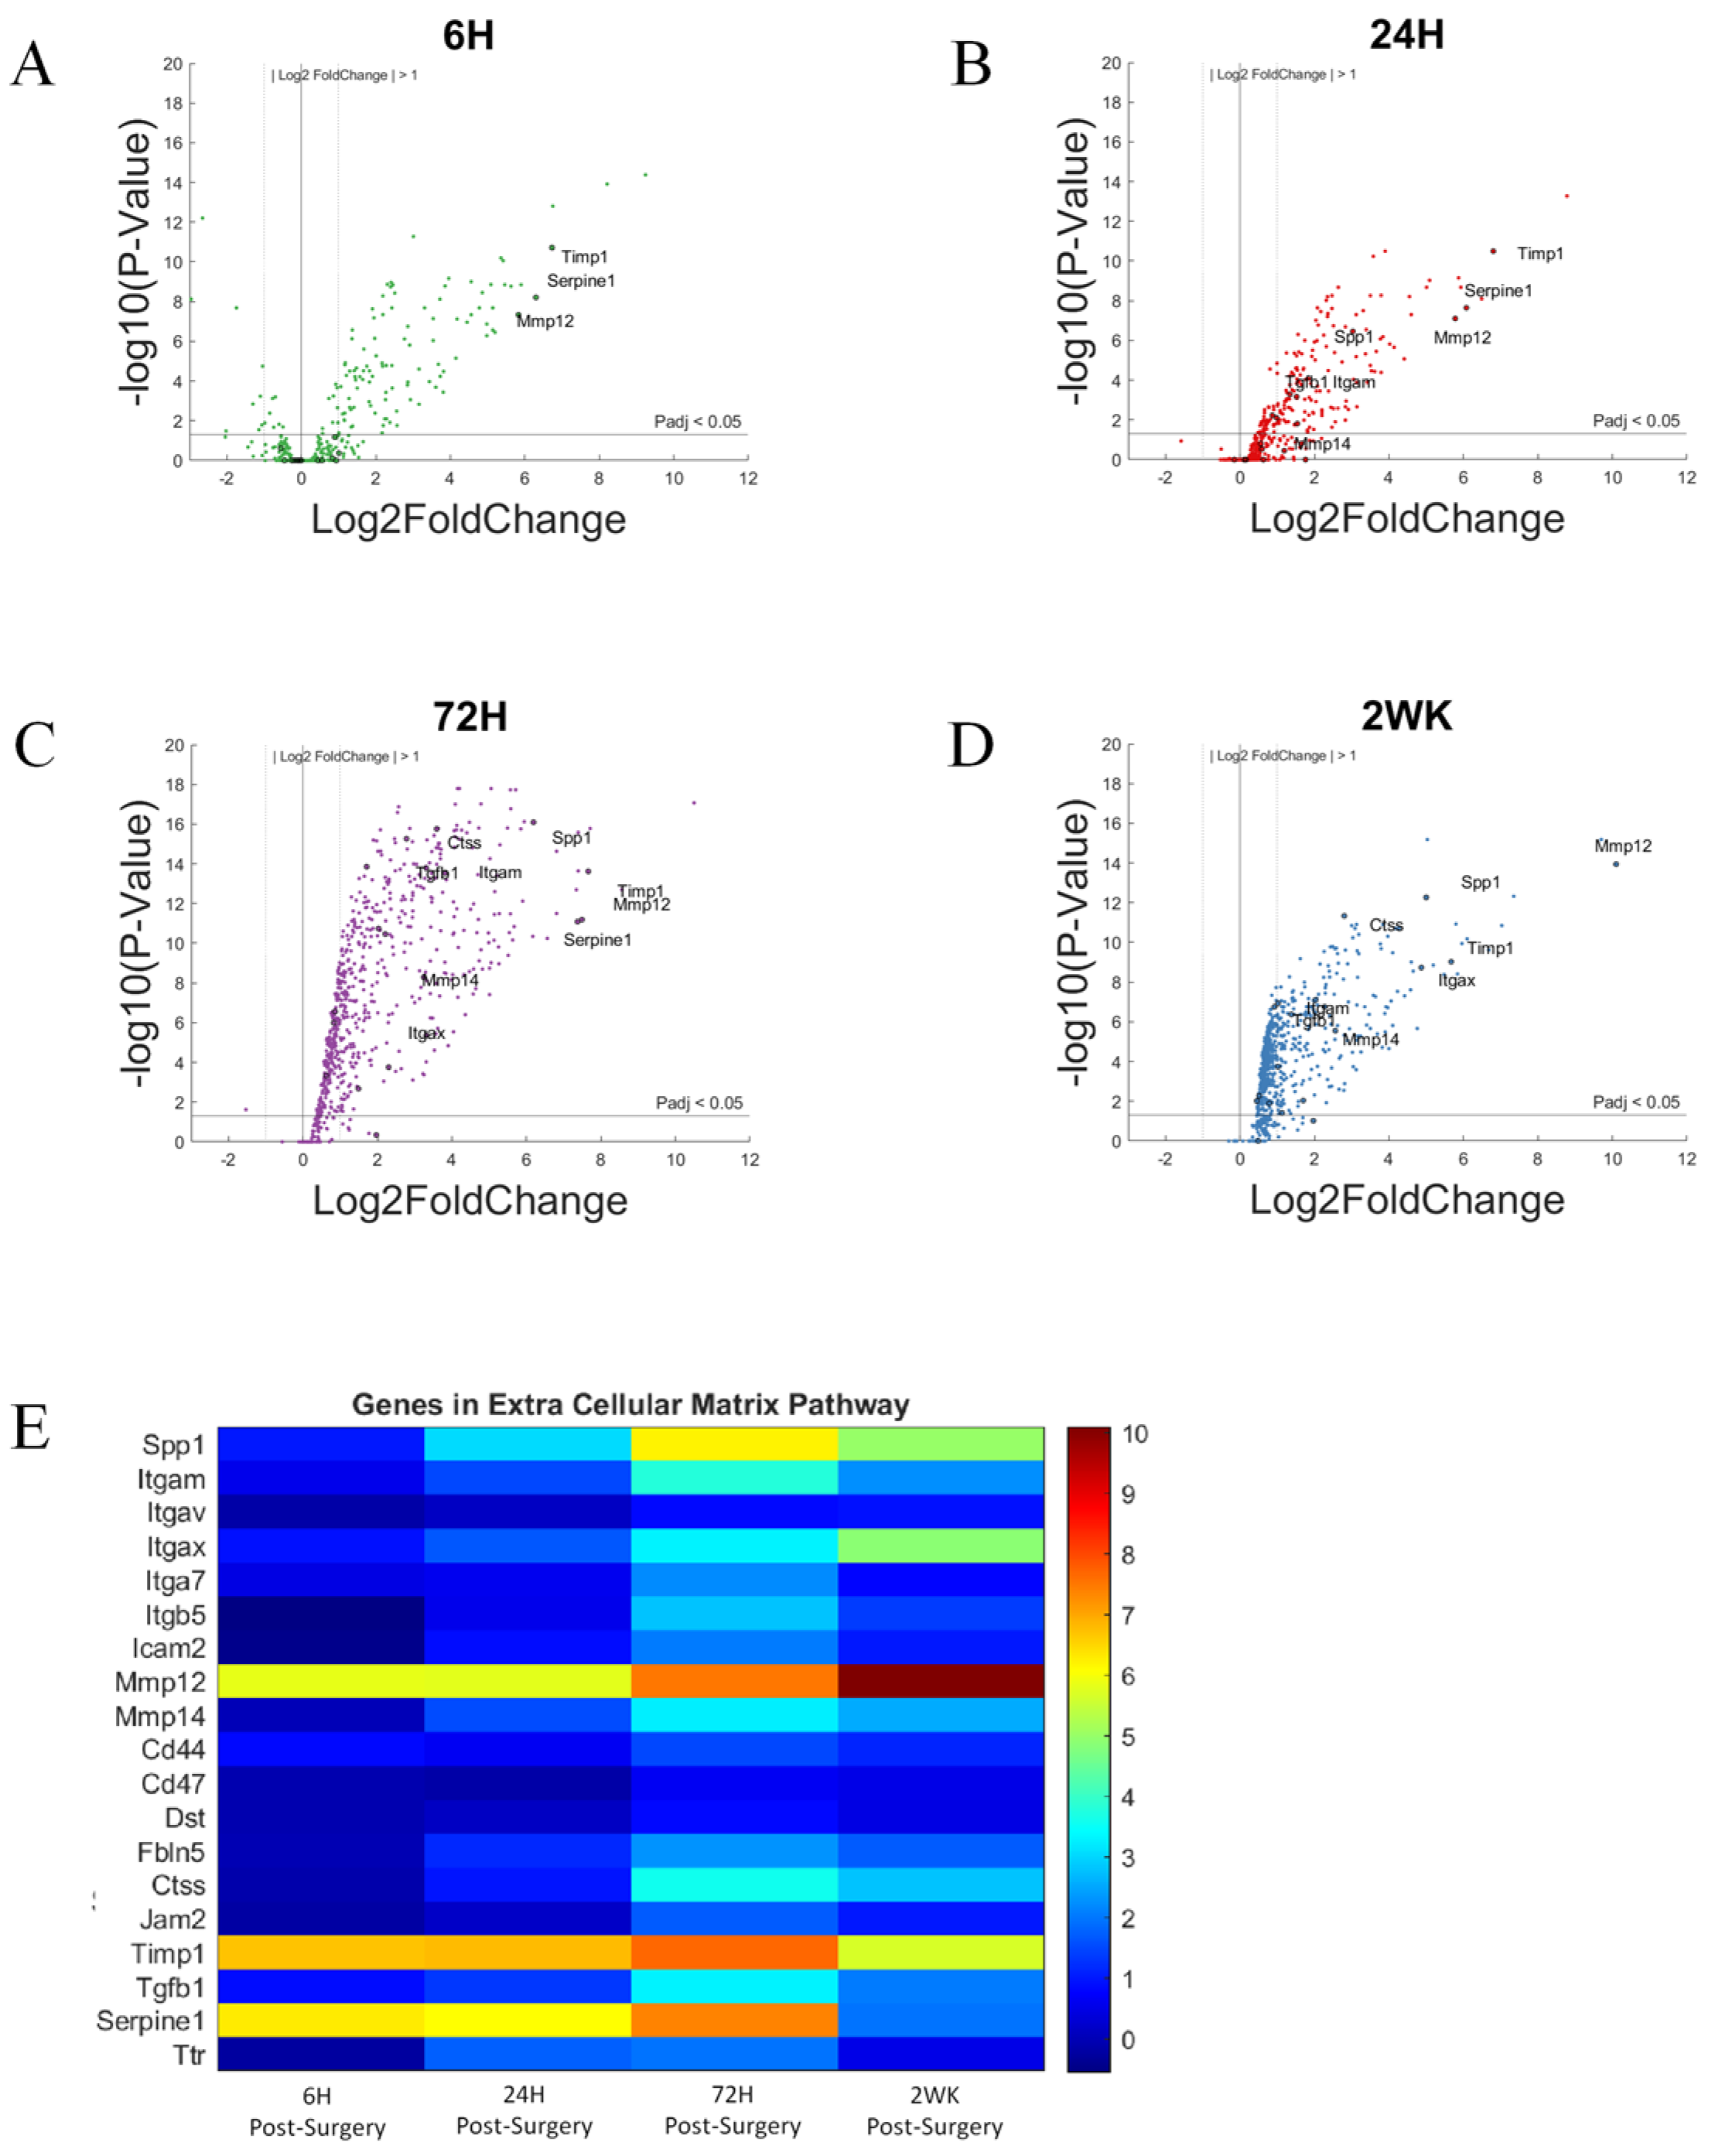
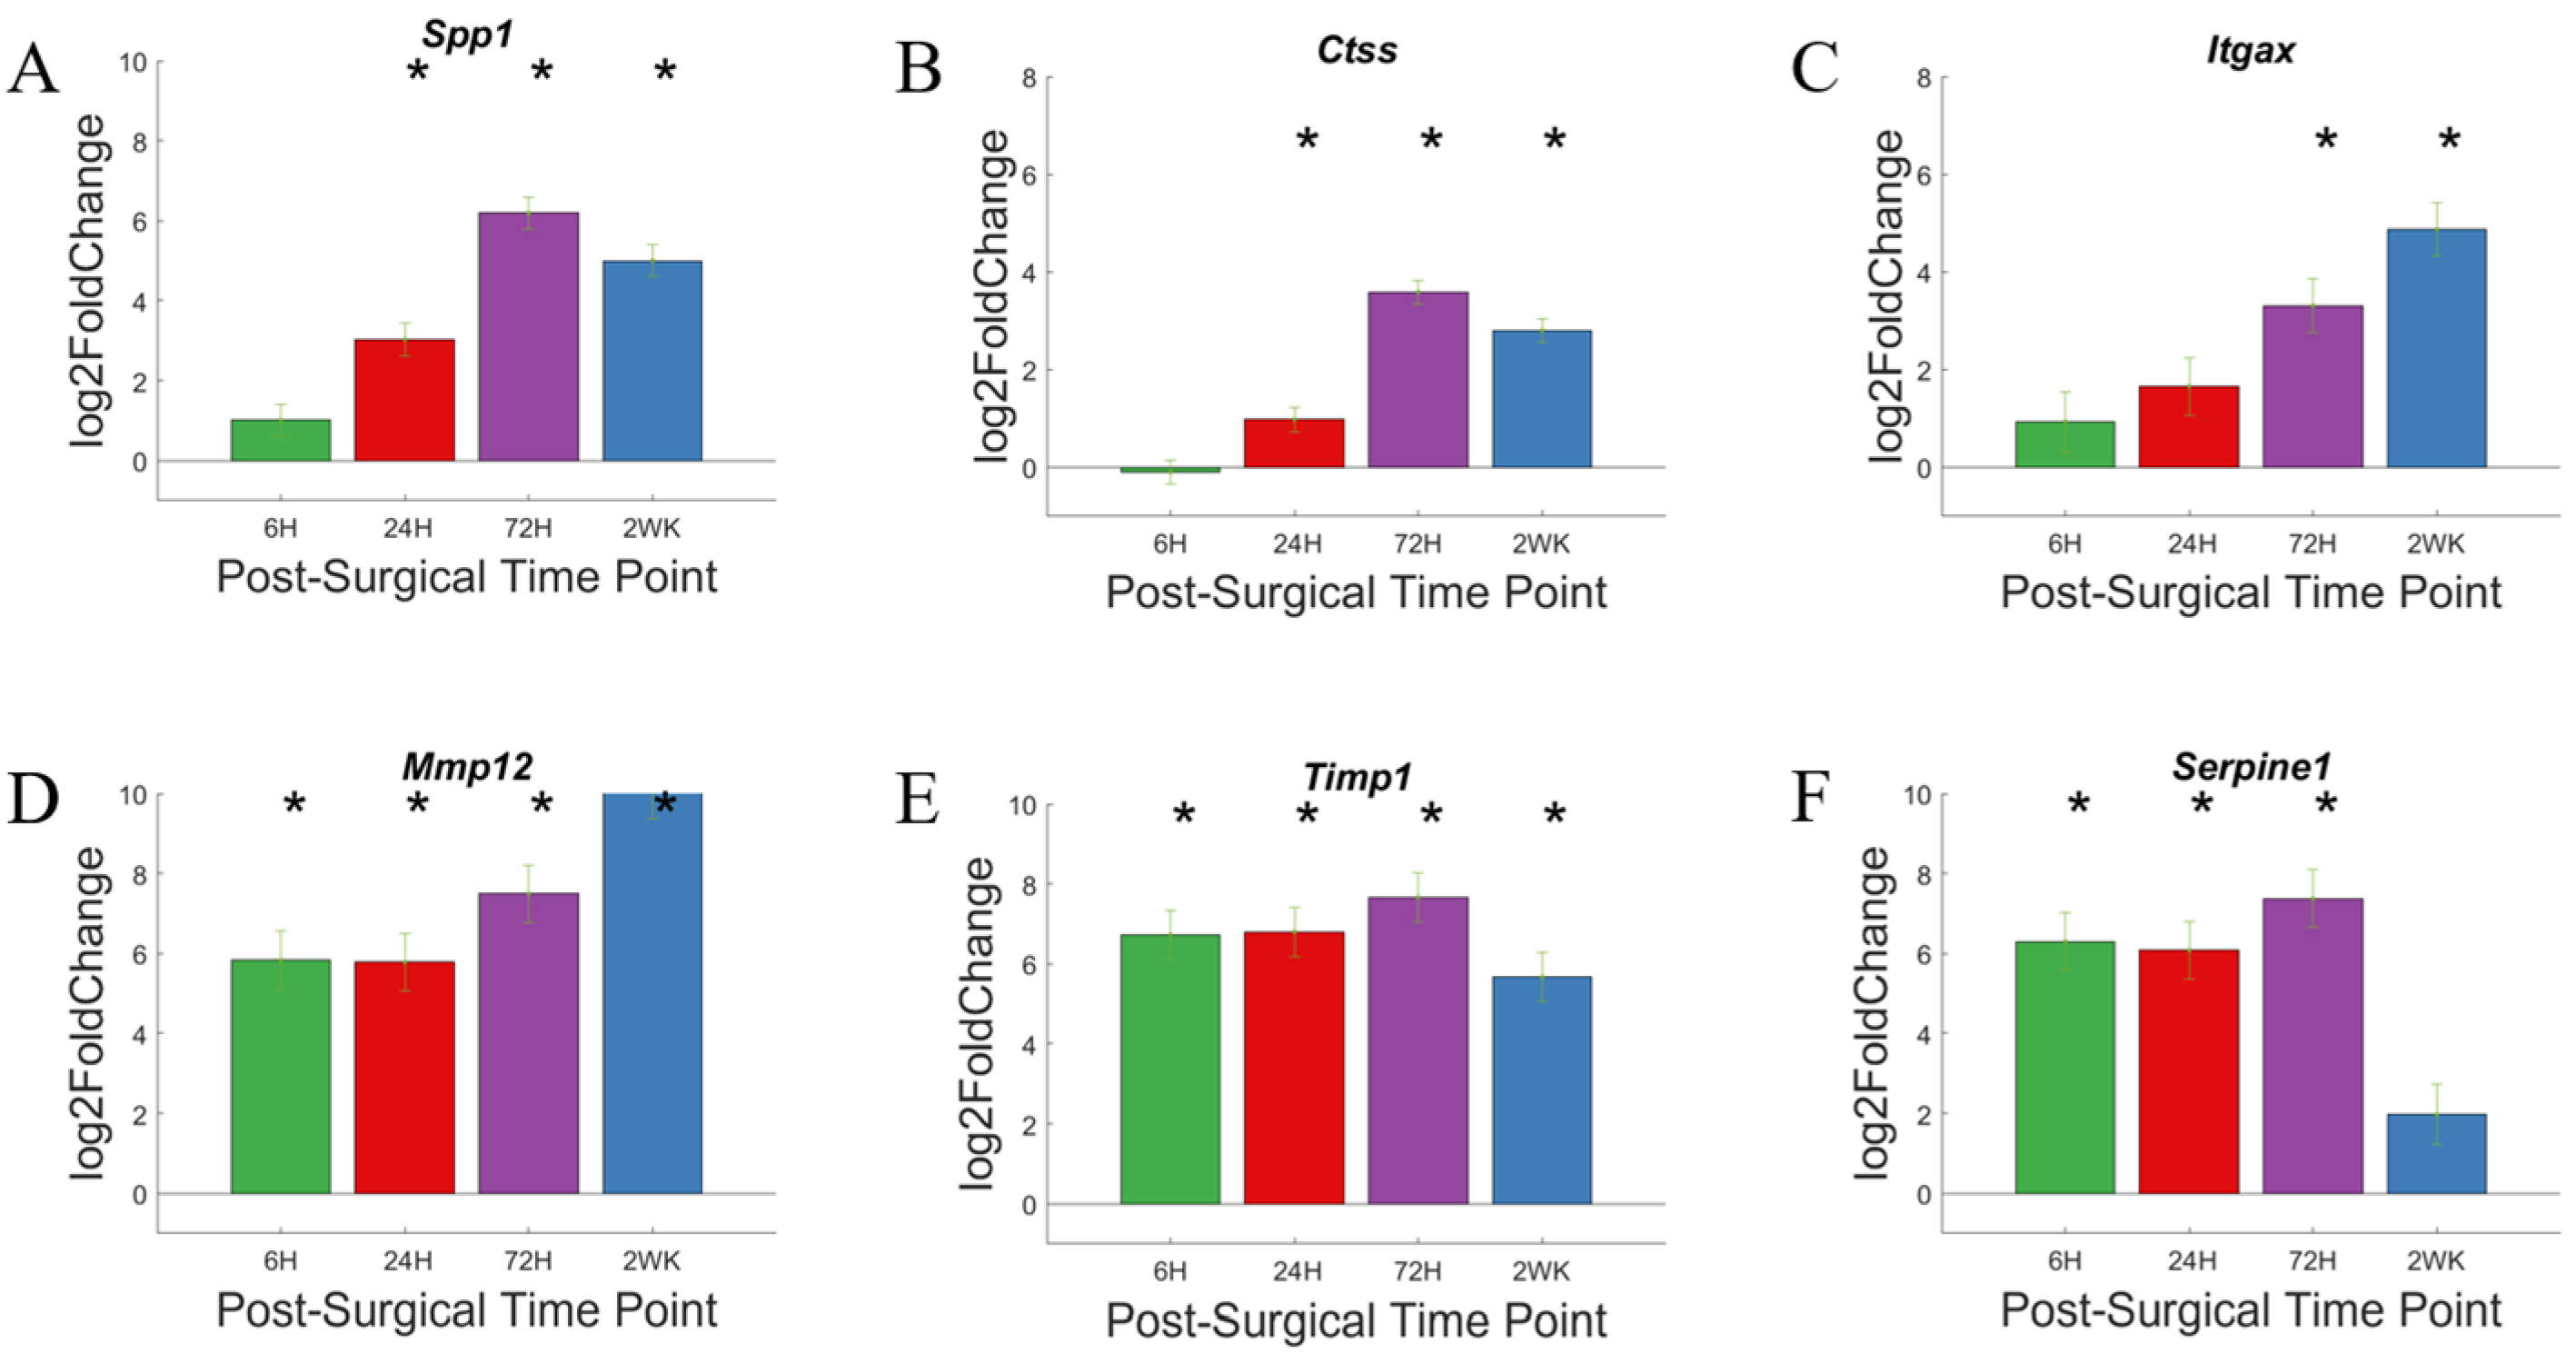
3.7. Extracellular Matrix

The extracellular matrix (ECM) in the brain consists of insoluble proteins that forms a scaffold around the cells. The ECM helps to maintain the structural integrity of the tissue, mediate communication, stabilize synaptic contacts, and is important in neuroinflammation and wound healing [85].
In Figure 13A–D, we labeled genes associated with ECM if Padj < 0.05 and log2foldchange > 1 or <−1 (i.e., 2-fold increase or decrease in expression). Furthermore, due to the large number of gene in this grouping, only the top 10 genes with the largest log2foldchange at each time point within the group are labeled. Most of the genes in the ECM pathway did not show increased expression at 6-h post-surgery. The genes showing increased expression at 6-h were Mmp12, Timp1, and Serpine1, and they remain elevated for the 2-week study. Some genes became upregulated steadily over the course of the 2-week study; these genes include Spp1 and Itgax. Other genes remain lowly expressed over the course of the study; these genes include cell surface adhesion molecules Itga7, Itgav, Itgam. The relative increase in gene expression levels for each of these genes are more readily depicted in heatmaps (Figure 13E).
Expression of individual genes at specific time points are depicted in bar graphs (Figure 14). Spp1, Itgax, and Ctss are genes that showed no significant upregulation at 6-h time point, and steadily increase their expression over the course of 2 weeks. Spp1 and Ctss upregulation becomes significant by 24-h time point and reaches the maximum expression level by 72-h time point, before falling slightly by 2-week time point. Itgax expression level becomes significantly upregulated at 24-h time point and continue to increase over the 2 week study. A few genes, Mmp12, Timp1, and serpine1, showed rapid and high upregulation starting at 6-h post-surgery. Mmp12 showed further upregulation in expression level over the course of the study. Timp1 maintained an upregulation of gene expression until 72-h time point and begin to show a decrease in upregulation of gene expression by 2-week post-surgery. Serpine1 maintained an upregulation of gene expression at 6–8 log2foldchange until 72-h time point and drops to below statistical significance by 2-weeks post-surgery.
The extracellular matrix in the central nervous system is produced by both neurons and glial cells and thought to occupy 20% of the volume of the brain. The structure of the ECM within the brain is unique: it consists of minimal collagen and fibronectin, and mainly consist of proteoglycans, glycoproteins, linker proteins, and matricellular proteins [85]. EMC undergoes constant modification during developmental and aging process, and the structure is thought to be heterogenous throughout the brain [86,87]. The brain’s ECM is thought to be involved in learning and memory [88,89], while alternations in ECM protein expression has been associated a variety of disorders such as Schizophrenia, Alzheimer’s, and epilepsy [90]. During injury and neural inflammation, ECM is actively remodeled to form scar tissue (in combination with astroglia scar) to prevent further damage to nearby neurons and promote recovery [91,92].
Matrix metalloproteases (MMPs) are zinc-containing endopeptidases involved in ECM maintenance. MMPs facilitate the breakdown and remodeling of extracellular matrix structural proteins and proteoglycans. The gene Mmp12 codes for the protein matrix metalloproteases 12, which has been associated with injury and diseases such as stroke, spinal cord injury, and multiple scoliosis [93]. Minocycline, a non-specific MMP inhibitor that has demonstrated antibiotic and immune-modulating activities [94,95], has been shown to correlate with improved intracortical recording performances in rats provided minocycline in their drinking water for four weeks [96].
Tissue Inhibitor of Metalloproteases 1 (TIMP1) is an inhibitor of matrix metalloproteases, including MMP12. Therefore, Timp1/Mmp12 ratio could be viewed as an indicator of proteolytic activity to the extracellular matrix [97,98]. Between 6-h and 72-h post-surgery, the Timp1/Mmp12 ratio remains relatively steady: with both being upregulated. At 2-weeks post-surgery, the Timp1 expression begin to decrease, while Mmp12 expression keeps increasing. This may suggest a tip toward degradation and remodeling of extracellular matrix, an important step in wound healing.
Serpine1 encodes for plasminogen activator inhibitor-1 (PAI-1) an inhibitor of tissue plasminogen activators (tPA) and urokinase plasminogen activators (uPA) [99]. tPA may generate plasmin, which may degrade laminin of the ECM as well as activate MMPs [100,101]. Hence, SERPINE1 may be considered a regulator of ECM remodeling. Decreased upregulation of Serpine1 at 2-weeks post-surgery may indicated an increase in tPA activity, increased plasmin, and increased degradation and remodeling of extracellular matrix.
The continued upregulation of Mmp12 over the course of the 2-week study and the upregulation of Timp1 and Serpine1 until 72-h time point and decline by 2-week time point, together, likely leads to an increased degradation and remodeling of the ECM. While ECM remodeling may affect the architecture of the tissue-microelectrode interface, leading to decreased recording quality of microelectrodes implanted in Cd14−/− mice after the acute phase; it is more likely that the over-expression of degradative MMPs results in uncontrollable non-specific protein degradation which could impact membrane bound proteins in healthy neurons as well. Therefore, inhibition of MMPs may be a potential method to increase the recording performance at chronic time points, through increased cell viability. This hypothesis is still speculative and requires further investigation to confirm suspicions. Extracellular matrix remodeling is important for tissue integrity. Therefore, it may contribute to tissue architecture that reduces microelectrode performance. Thus, while not all the genes that encode for extracellular matrix proteins examined here show delayed response, when exploring genes of the extracellular matrix as potential therapeutic targets, we must consider the time course of inhibition, whether as a solo therapeutic target or as co-therapeutic targets with CD14.

4. Conclusions

The current study examined the expression of 791 genes in the neuroinflammatory pathway following microelectrode implantation into the cortex of Cd14−/− mice. Gene expression for tissue within 500 µm of the microelectrode-tissue interface was analyzed. Previous studies have shown CD14 to be a potential therapeutic target in improving microelectrode recording performances over the same period described in this study. Here, our goal was to investigate the changes in expression of genes in the neuroinflammatory pathways in Cd14−/− mice, detect gene-expression patterns that may confer its ability to improve microelectrode recording performance at acute time points, and identify potential therapeutic target that could be used in combination or succession of CD14 inhibition to improve the microelectrode performance.
We found that the greatest variation and the highest level of gene expression upregulation occurs at 72-h time point post-surgery, which coincides with the time of transition from a “inflammatory phase’ to a “healing phase” in tissue injury. Note that this is delayed compared to WT mice from a previous study, where the greatest variation and the highest level of gene expression upregulation occurs at 24-h time point post-surgery [36]. The time course of upregulation of gene expression may prove important for the dynamics of inflammation, which may hold the key to the initial and short-lived improvements of microelectrode performance in Cd14−/− animals.
Previous studies in our lab have shown that partial inhibition of CD14 had improved microelectrode performance and is a potential therapeutic target. The current study strengthens our understanding of the molecular level tissue response to microelectrode implant over the first two weeks post-surgery in Cd14−/− animals, over the same duration in which Cd14 inhibition improved microelectrode performance. We have found the genes of the complement and chemokine system to be highly and rapidly upregulated, while genes in the cytokine system (non-chemokine), pattern recognition receptors, and Toll-like receptors to be less upregulated. Genes in the extracellular matrix system consist of a few highly upregulated proteolytic enzymes and their inhibitors. Rapidly and highly upregulated genes, such as C3 of the complement system, CXCL10 of the chemokine system, and Mincle of the pattern recognition system are potential therapeutic target in improving microelectrode performance, either alone or in combination with Cd14. Genes showing delayed upregulation such as Aim2 of pattern recognition pathway, Itgax which is involved in extracellular matrix remodeling, can be potential co-therapeutic targets that may be targeted with Cd14 sequentially. The suggestions for targets provided here will require further validation of protein expression levels to determine the best means to attenuate or silence gene and proteins of importance.
One limitation of this study is that we did not look at protein expression. Gene expression is a proxy for protein expression, which are the machinery that controls tissue response. Another limitation is the lack of precise spatial resolution. We expect the largest changes in gene expression to be closer to implant site, while for this study we pooled together all gene expression within 500 µm of the implant site based on the methods available to us at the onset of the study. Future studies should investigate both the gene and protein expression on a cell-specific, spatially defined level with increased resolution, like that offered in the NanoString GeoMx platform, while also utilizing functional microelectrode arrays to assess device performance.

Author Contributions

J.R.C. contributed to the conception and design of the work. S.S. and E.S.E. contributed to the methodology, software analysis, validation, formal analysis, investigation and data curation, and statistical analysis. E.R.C. guided and statistical analysis of the work. B.R. performed some of the statistical analysis. S.S. wrote the original draft and figures preparation as well as the review and editing along with E.S.E. and J.R.C. J.R.C. provided the funding and resources to conduct the study. All authors have read and agreed to the published version of the manuscript.

Funding

This study was supported in part by Career Development Award—2 #RX002628-01A1 (Ereifej), Merit Review Award GRANT12418820 (Capadona), and Research Career Scientist Award # GRANT12635707 (Capadona) from the United States (US) Department of Veterans Affairs Rehabilitation Research and Development Service. Additionally, this work was also supported in part by the National Institute of Health, National Institute of Neurological Disorders and Stroke GRANT12635723 (Capadona), the National Institute for Biomedical Imaging and Bioengineering, T32EB004314, (Capadona/Kirsch), and National Institute for General Medical Sciences, T32GM007250 (Harding).

Institutional Review Board Statement

All animal care, handling and procedures were performed in compliance with a protocol approved by the Institutional Animal Care and Use Committee (IACUC) at Case Western Reserve University.

Data Availability Statement

Please send request to [email protected].

Acknowledgments

We thank Alexandra Joshi-Imre and Negar Geramifard in the Lab of Joseph J. Pancrazio at the University of Texas at Dallas for providing Non-functional Silicon Microelectrodes used in surgery.

Conflicts of Interest

The authors declare no conflict of interest.

Disclaimer

The contents do not represent the views of the U.S. Department of Veterans Affairs, the National Institutes of Health, or the United States Government.

References

  1. Donoghue, J. Bridging the Brain to the World: A Perspective on Neural Interface Systems. Neuron 2008, 60, 511–521. [Google Scholar] [CrossRef] [PubMed] [Green Version]
  2. Nicolelis, M.A. Brain-machine interfaces to restore motor function and probe neural circuits. Nat. Rev. Neurosci. 2003, 4, 417–422. [Google Scholar] [CrossRef] [PubMed]
  3. Schwartz, A.B. Cortical neural prosthetics. Annu. Rev. Neurosci. 2004, 27, 487–507. [Google Scholar] [CrossRef] [PubMed] [Green Version]
  4. Hubel, D.H. Single unit activity in striate cortex of unrestrained cats. J. Physiol. 1959, 147, 226–238. [Google Scholar] [CrossRef]
  5. Yuste, R. From the neuron doctrine to neural networks. Nat. Rev. Neurosci. 2015, 16, 487–497. [Google Scholar] [CrossRef]
  6. Szostak, K.M.; Grand, L.; Constandinou, T.G. Neural Interfaces for Intracortical Recording: Requirements, Fabrication Methods, and Characteristics. Front. Neurosci. 2017, 11, 665. [Google Scholar] [CrossRef] [Green Version]
  7. Mak, J.N.; Wolpaw, J.R. Clinical Applications of Brain-Computer Interfaces: Current State and Future Prospects. IEEE Rev. Biomed. Eng. 2009, 2, 187–199. [Google Scholar] [CrossRef] [Green Version]
  8. McFarland, D.J.; Sarnacki, W.A.; Wolpaw, J.R. Electroencephalographic (EEG) control of three-dimensional movement. J. Neural Eng. 2010, 7, 036007. [Google Scholar] [CrossRef] [Green Version]
  9. Wolpaw, J.R.; McFarland, D.J. Control of a two-dimensional movement signal by a noninvasive brain-computer interface in humans. Proc. Natl. Acad. Sci. USA 2004, 101, 17849–17854. [Google Scholar] [CrossRef] [Green Version]
  10. Bell, C.J.; Shenoy, P.; Chalodhorn, R.; Rao, R.P. Control of a humanoid robot by a noninvasive brain-computer interface in humans. J. Neural Eng. 2008, 5, 214–220. [Google Scholar] [CrossRef]
  11. Hochberg, L.R.; Bacher, D.; Jarosiewicz, B.; Masse, N.Y.; Simeral, J.D.; Vogel, J.; Haddadin, S.; Liu, J.; Cash, S.S.; van der Smagt, P.; et al. Reach and grasp by people with tetraplegia using a neurally controlled robotic arm. Nature 2012, 485, 372–375. [Google Scholar] [CrossRef] [Green Version]
  12. Collinger, J.L.; Wodlinger, B.; Downey, J.E.; Wang, W.; Tyler-Kabara, E.C.; Weber, D.J.; McMorland, A.J.; Velliste, M.; Boninger, M.L.; Schwartz, A.B. High-performance neuroprosthetic control by an individual with tetraplegia. Lancet 2013, 381, 557–564. [Google Scholar] [CrossRef] [Green Version]
  13. Ajiboye, A.B.; Willett, F.R.; Young, D.R.; Memberg, W.D.; Murphy, B.A.; Miller, J.P.; Walter, B.L.; Sweet, J.A.; Hoyen, H.A.; Keith, M.W.; et al. Restoration of reaching and grasping movements through brain-controlled muscle stimulation in a person with tetraplegia: A proof-of-concept demonstration. Lancet 2017, 398, 1821–1830. [Google Scholar] [CrossRef] [Green Version]
  14. Barrese, J.C.; Rao, N.; Paroo, K.; Triebwasser, C.; Vargas-Irwin, C.; Franquemont, L.; Donoghue, J.P. Failure mode analysis of silicon-based intracortical microelectrode arrays in non-human primates. J. Neural Eng. 2013, 10, 066014. [Google Scholar] [CrossRef]
  15. Shoffstall, A.J.; Paiz, J.E.; Miller, D.M.; Rial, G.M.; Willis, M.T.; Menendez, D.M.; Hostler, S.R.; Capadona, J.R. Potential for thermal damage to the blood-brain barrier during craniotomy: Implications for intracortical recording microelectrodes. J. Neural Eng. 2018, 15, 034001. [Google Scholar] [CrossRef]
  16. Bjornsson, C.S.; Oh, S.J.; Al-Kofahi, Y.A.; Lim, Y.J.; Smith, K.L.; Turner, J.N.; De, S.; Roysam, B.; Shain, W.; Kim, S.J. Effects of insertion conditions on tissue strain and vascular damage during neuroprosthetic device insertion. J. Neural Eng. 2006, 3, 196–207. [Google Scholar] [CrossRef]
  17. Money, B.; Hess-Dunning, A.; Gloth, P.; Capadona, J.R.; Weder, C. Mechanically adaptive implants fabricated with poly(2-hydroxy¬ethyl methacrylate)-based negative photoresists. J. Mater. Chem. B 2020, 8, 6357–6365. [Google Scholar] [CrossRef]
  18. Bedell, H.W.; Song, S.; Li, X.; Molinich, E.; Lin, S.; Voit, W.E.; Pancrazio, J.J.; Capadona, J.R. Understanding the effects of both CD14-meditated innate immunity and device/tissue mechanical mismatch in the neuroinflammatory response to intracortical microelectrodes. Front. Neurosci. 2018, 12, 772. [Google Scholar] [CrossRef]
  19. Nguyen, J.K.; Jorfi, M.; Buchanan, K.L.; Park, D.J.; Foster, E.J.; Tyler, D.J.; Rowan, S.J.; Weder, C.; Capadona, J.R. Influence of resveratrol release on the tissue response to mechanically adaptive cortical implants. Acta Biomater. 2016, 29, 81–93. [Google Scholar] [CrossRef] [Green Version]
  20. Sridharan, A.; Nguyen, J.K.; Capadona, J.R.; Muthuswamy, J. Compliant intracortical implants reduce strains and strain rates in brain tissue in vivo. J. Neural Eng. 2015, 12, 036002. [Google Scholar] [CrossRef] [Green Version]
  21. Nguyen, J.K.; Park, D.J.; Skousen, J.L.; Hess-Dunning, A.; Tyler, D.J.; Rowan, S.J.; Weder, C.; Capadona, J.R. Mechanically-compliant intracortical implants reduce the neuroinflammatory response. J. Neural Eng. 2014, 11, 056014. [Google Scholar] [CrossRef] [PubMed] [Green Version]
  22. Harris, J.P.; Capadona, J.R.; Miller, R.H.; Healy, B.C.; Shanmuganathan, K.; Rowan, S.J.; Weder, C.; Tyler, D.J. Mechanically adaptive intracortical implants improve the proximity of neuronal cell bodies. J. Neural Eng. 2011, 8, 066011. [Google Scholar] [CrossRef] [PubMed]
  23. Simon, D.M.; Charkhkar, H.; St John, C.; Rajendran, S.; Kang, T.; Reit, R.; Arreaga-Salas, D.; McHail, D.G.; Knaack, G.L.; Sloan, A.; et al. Design and demonstration of an intracortical probe technology with tunable modulus. J. Biomed. Mater. Res. A 2017, 105, 159–168. [Google Scholar] [CrossRef] [PubMed]
  24. Ware, T.; Simon, D.; Arreaga-Salas, D.E.; Reeder, J.; Rennaker, R.; Keefer, E.W.; Voit, W. Fabrication of responsive, softening neural interfaces. Adv. Funct. Mater. 2012, 22, 3470–3479. [Google Scholar] [CrossRef]
  25. Welle, E.J.; Patel, P.R.; Woods, J.E.; Petrossians, A.; Della Valle, E.; Vega-Medina, A.; Richie, J.M.; Cai, D.; Weiland, J.D.; Chestek, C.A. Ultra-small carbon fiber electrode recording site optimization and improved in vivo chronic recording yield. J. Neural Eng. 2020, 17, 026037. [Google Scholar] [CrossRef]
  26. Ravikumar, M.; Hageman, D.J.; Tomaszewski, W.H.; Chandra, G.M.; Skousen, J.L.; Capadona, J.R. The effect of residual endotoxin contamination on the neuroinflammatory response to sterilized intracortical microelectrodes. J. Mater. Chem. B 2014, 2, 2517–2529. [Google Scholar] [CrossRef] [Green Version]
  27. Shoffstall, A.J.; Ecker, M.; Danda, V.; Joshi-Imre, A.; Stiller, A.; Yu, M.; Paiz, J.E.; Mancuso, E.; Bedell, H.W.; Voit, W.E.; et al. Characterization of the Neuroinflammatory Response to Thiol-ene Shape Memory Polymer Coated Intracortical Microelectrodes. Micromachines 2018, 9, 486. [Google Scholar] [CrossRef] [Green Version]
  28. Ereifej, E.S.; Rial, G.; Hermann, J.K.; Smith, C.S.; Meade, S.; Rayyan, J.; Chen, K.; Feng, H.; Capadona, J.R. Implantation of Neural Probes in the Brain Elicits Oxidative Stress. Front. Bioeng. Biotechnol. 2018, 6, 1–12. [Google Scholar] [CrossRef]
  29. Potter, K.A.; Buck, A.C.; Self, W.K.; Callanan, M.E.; Sunil, S.; Capadona, J.R. The effect of resveratrol on neurodegeneration and blood brain barrier stability surrounding intracortical. microelectrodes. Biomaterials 2013, 34, 7001–7015. [Google Scholar] [CrossRef]
  30. Potter, K.A.; Jorfi, M.; Householder, K.T.; Foster, E.J.; Weder, C.; Capadona, J.R. Curcumin-releasing mechanically-adaptive intracortical implants improve the proximal neuronal density and blood-brain barrier stability. Acta Biomater. 2014, 10, 2209–2222. [Google Scholar] [CrossRef]
  31. Potter-Baker, K.A.; Capadona, J.R. Reducing the “Stress”: Antioxidative Therapeutic and Material Approaches May Prevent Intracortical Microelectrode Failure. ACS Macro Lett. 2015, 4, 275–279. [Google Scholar] [CrossRef]
  32. Potter-Baker, K.A.; Nguyen, J.K.; Kovach, K.M.; Gitomer, M.M.; Srail, T.W.; Stewart, W.G.; Skousen, J.L.; Capadona, J.R. Development of Superoxide Dismutase Mimetic Surfaces to Reduce Accumulation of Reactive Oxygen Species Surrounding Intracortical Microelectrodes. J. Mater. Chem. B 2014, 2, 2248–2258. [Google Scholar] [CrossRef] [Green Version]
  33. Potter-Baker, K.A.; Stewart, W.G.; Tomaszewski, W.H.; Wong, C.T.; Meador, W.D.; Ziats, N.P.; Capadona, J.R. Implications of chronic daily anti-oxidant administration on the inflammatory response to intracortical microelectrodes. J. Neural Eng. 2015, 12, 046002. [Google Scholar] [CrossRef] [Green Version]
  34. Bennett, C.; Mohammed, F.; Alvarez-Ciara, A.; Nguyen, M.A.; Dietrich, W.D.; Rajguru, S.M.; Streit, W.J.; Prasad, A. Neuroinflammation, oxidative stress, and blood-brain barrier (BBB) disruption in acute Utah electrode array implants and the effect of deferoxamine as an iron chelator on acute foreign body response. Biomaterials 2019, 188, 144–159. [Google Scholar] [CrossRef]
  35. Ereifej, E.S.; Smith, C.S.; Meade, S.M.; Chen, K.; Feng, H.; Capadona, J.R. The neuroinflammatory response to nanopatterning parallel grooves into the surface structure of intracortical microelectrodes. Adv. Funct. Mater. 2018, 28, 1704420. [Google Scholar] [CrossRef]
  36. Bedell, H.W.; Schaub, N.J.; Capadona, J.R.; Ereifej, E.S. Differential expression of genes involved in the acute innate immune response to intracortical microelectrodes. Acta Biomater. 2020, 102, 205–219. [Google Scholar] [CrossRef]
  37. Bedell, H.W.; Hermann, J.K.; Ravikumar, M.; Lin, S.; Rein, A.; Li, X.; Molinich, E.; Smith, P.; Sidik, S.; Taylor, D.M.; et al. Targeting CD14 on blood derived cells improves intracortical microelectrode performance. Biomaterials 2018, 163, 163–173. [Google Scholar] [CrossRef]
  38. Jersmann, H.P. Time to abandon dogma: CD14 is expressed by non-myeloid lineage cells. Immunol. Cell Biol. 2005, 83, 462–467. [Google Scholar] [CrossRef]
  39. Haziot, A.; Chen, S.; Ferrero, E.; Low, M.G.; Silber, R.; Goyert, S.M. The monocyte differentiation antigen, CD14, is anchored to the cell membrane by a phosphatidylinositol linkage. J. Immunol. 1988, 141, 547–552. [Google Scholar]
  40. Tarassishin, L.; Suh, H.S.; Lee, S.C. LPS and IL-1 differentially activate mouse and human astrocytes: Role of CD14. Glia 2014, 62, 999–1013. [Google Scholar] [CrossRef] [Green Version]
  41. Widera, D.; Martinez Aguilar, R.; Cottrell, G.S. Toll-like receptor 4 and protease-activated receptor 2 in physiology and pathophysiology of the nervous system: More than just receptor cooperation? Neural Regen. Res. 2019, 14, 1196–1201. [Google Scholar] [CrossRef] [PubMed]
  42. Hermann, J.K.; Ravikumar, M.; Shoffstall, A.J.; Ereifej, E.S.; Kovach, K.M.; Chang, J.; Soffer, A.; Wong, C.; Srivastava, V.; Smith, P.; et al. Inhibition of the cluster of differentiation 14 innate immunity pathway with IAXO-101 improves chronic microelectrode performance. J. Neural Eng. 2018, 15, 025002. [Google Scholar] [CrossRef] [PubMed]
  43. Kulkarni, M.M. Digital Multiplexed Gene Expression Analysis Using the NanoString nCounter System. Curr. Protoc. Mol. Biol. 2011, 94, 25B-10. [Google Scholar]
  44. Gene Expression Data Analysis Guidelines. Available online: https://nanostring.com/wp-content/uploads/Gene_Expression_Data_Analysis_Guidelines.pdf (accessed on 20 June 2022).
  45. nSolver™ 4.0 Analysis Software User Manual. Available online: https://nanostring.com/wp-content/uploads/MAN-C0019-08_nSolver_4.0_Analysis_Software_User_Manual.pdf (accessed on 20 June 2022).
  46. NanoString Technologies®. Inc. nCounter Advanced Analysis 2.0 Plugin for nSolver Software. Available online: https://nanostring.com/wp-content/uploads/MAN-10030-03_nCounter_Advanced_Analysis_2.0_User_Manual.pdf (accessed on 20 June 2022).
  47. Brown, E.A.; Lautz, J.D.; Davis, T.R.; Gniffke, E.P.; VanSchoiack, A.A.W.; Neier, S.C.; Tashbook, N.; Nicolini, C.; Fahnestock, M.; Schrum, A.G.; et al. Clustering the autisms using glutamate synapse protein interaction networks from cortical and hippocampal tissue of seven mouse models. Mol. Autism 2018, 9, 48. [Google Scholar] [CrossRef]
  48. Sarkozy, C.; Chong, L.; Takata, K.; Chavez, E.A.; Miyata-Takata, T.; Duns, G.; Telenius, A.; Boyle, M.; Slack, G.W.; Laurent, C.; et al. Gene expression profiling of gray zone lymphoma. Blood Adv. 2020, 4, 2523–2535. [Google Scholar] [CrossRef]
  49. Metsalu, T.; Vilo, J. ClustVis: A web tool for visualizing clustering of multivariate data using Principal Component Analysis and heatmap. Nucleic Acids Res. 2015, 43, W566–W570. [Google Scholar] [CrossRef]
  50. Falcone, J.D.; Carroll, S.L.; Saxena, T.; Mandavia, D.; Clark, A.; Yarabarla, V.; Bellamkonda, R.V. Correlation of mRNA Expression and Signal Variability in Chronic Intracortical Electrodes. Front. Bioeng. Biotechnol. 2018, 6, 26. [Google Scholar] [CrossRef] [Green Version]
  51. Thompson, C.H.; Saxena, A.; Heelan, N.; Salatino, J.; Purcell, E.K. Spatiotemporal patterns of gene expression around implanted silicon electrode arrays. J. Neural Eng. 2021, 18, 045005. [Google Scholar] [CrossRef]
  52. Song, S.G.; Kim, S.; Koh, J.; Yim, J.; Han, B.; Kim, Y.A.; Jeon, Y.K.; Chung, D.H. Comparative analysis of the tumor immune-microenvironment of primary and brain metastases of non-small-cell lung cancer reveals organ-specific and EGFR mutation-dependent unique immune landscape. Cancer Immunol. Immunother. 2021, 70, 2035–2048. [Google Scholar] [CrossRef]
  53. Anderson, J.M.; Rodriguez, A.; Chang, D.T. Foreign body reaction to biomaterials. Semin. Immunol. 2008, 20, 86–100. [Google Scholar] [CrossRef] [Green Version]
  54. Park, J.E.; Barbul, A. Understanding the role of immune regulation in wound healing. Am. J. Surg. 2004, 187, 11S–16S. [Google Scholar] [CrossRef]
  55. Lempka, S.F.; Miocinovic, S.; Johnson, M.D.; Vitek, J.L.; McIntyre, C.C. In vivo impedance spectroscopy of deep brain stimulation electrodes. J. Neural Eng. 2009, 6, 046001. [Google Scholar] [CrossRef] [Green Version]
  56. Orsini, F.; De Blasio, D.; Zangari, R.; Zanier, E.R.; De Simoni, M.G. Versatility of the complement system in neuroinflammation, neurodegeneration and brain homeostasis. Front. Cell. Neurosci. 2014, 8, 380. [Google Scholar] [CrossRef] [Green Version]
  57. Garcia, B.L.; Zwarthoff, S.A.; Rooijakkers, S.H.; Geisbrecht, B.V. Novel Evasion Mechanisms of the Classical Complement Pathway. J. Immunol. 2016, 197, 2051–2060. [Google Scholar] [CrossRef]
  58. Lubbers, R.; van Essen, M.F.; van Kooten, C.; Trouw, L.A. Production of complement components by cells of the immune system. Clin. Exp. Immunol. 2017, 188, 183–194. [Google Scholar] [CrossRef] [Green Version]
  59. Mathern, D.R.; Heeger, P.S. Molecules Great and Small: The Complement System. Clin. J. Am. Soc. Nephrol. 2015, 10, 1636–1650. [Google Scholar] [CrossRef] [Green Version]
  60. Moghimi, S.M.; Andersen, A.J.; Ahmadvand, D.; Wibroe, P.P.; Andresen, T.L.; Hunter, A.C. Material properties in complement activation. Adv. Drug Deliv. Rev. 2011, 63, 1000–1007. [Google Scholar] [CrossRef]
  61. Arima, Y.; Toda, M.; Iwata, H. Surface plasmon resonance in monitoring of complement activation on biomaterials. Adv. Drug Deliv. Rev. 2011, 63, 988–999. [Google Scholar] [CrossRef] [Green Version]
  62. Bergseth, G.; Lambris, J.D.; Mollnes, T.E.; Lappegard, K.T. Artificial surface-induced inflammation relies on complement factor 5: Proof from a deficient person. Ann. Thorac. Surg. 2011, 91, 527–533. [Google Scholar] [CrossRef] [Green Version]
  63. Nilsson, B.; Ekdahl, K.N.; Mollnes, T.E.; Lambris, J.D. The role of complement in biomaterial-induced inflammation. Mol. Immunol. 2007, 44, 82–94. [Google Scholar] [CrossRef]
  64. Tang, L.; Liu, L.; Elwing, H.B. Complement activation and inflammation triggered by model biomaterial surfaces. J. Biomed. Mater. Res. 1998, 41, 333–340. [Google Scholar] [CrossRef]
  65. Ekdahl, K.N.; Lambris, J.D.; Elwing, H.; Ricklin, D.; Nilsson, P.H.; Teramura, Y.; Nicholls, I.A.; Nilsson, B. Innate immunity activation on biomaterial surfaces: A mechanistic model and coping strategies. Adv. Drug Deliv. Rev. 2011, 63, 1042–1050. [Google Scholar] [CrossRef] [PubMed] [Green Version]
  66. Lappegard, K.T.; Fung, M.; Bergseth, G.; Riesenfeld, J.; Lambris, J.D.; Videm, V.; Mollnes, T.E. Effect of complement inhibition and heparin coating on artificial surface-induced leukocyte and platelet activation. Ann. Thorac. Surg. 2004, 77, 932–941. [Google Scholar] [CrossRef]
  67. Lappegard, K.T.; Fung, M.; Bergseth, G.; Riesenfeld, J.; Mollnes, T.E. Artificial surface-induced cytokine synthesis: Effect of heparin coating and complement inhibition. Ann. Thorac. Surg. 2004, 78, 38–44; discussion 35–44. [Google Scholar] [CrossRef]
  68. Watkins, N.J.; Braidley, P.; Bray, C.J.; Savill, C.M.; White, D.J. Coating of human decay accelerating factor (hDAF) onto medical devices to improve biocompatibility. Immunopharmacology 1997, 38, 111–118. [Google Scholar] [CrossRef]
  69. Kumar, H.; Kawai, T.; Akira, S. Pathogen recognition by the innate immune system. Int. Rev. Immunol. 2011, 30, 16–34. [Google Scholar] [CrossRef]
  70. Lupfer, C.R.; Anand, P.K.; Qi, X.; Zaki, H. Editorial: Role of NOD-Like Receptors in Infectious and Immunological Diseases. Front. Immunol. 2020, 11, 923. [Google Scholar] [CrossRef]
  71. Nakaya, Y.; Lilue, J.; Stavrou, S.; Moran, E.A.; Ross, S.R. AIM2-Like Receptors Positively and Negatively Regulate the Interferon Response Induced by Cytosolic DNA. mBio 2017, 8, e00944-17. [Google Scholar] [CrossRef] [Green Version]
  72. Fekete, T.; Bencze, D.; Szabo, A.; Csoma, E.; Biro, T.; Bacsi, A.; Pazmandi, K. Regulatory NLRs Control the RLR-Mediated Type I Interferon and Inflammatory Responses in Human Dendritic Cells. Front. Immunol. 2018, 9, 2314. [Google Scholar] [CrossRef] [Green Version]
  73. Geijtenbeek, T.B.; Gringhuis, S.I. Signalling through C-type lectin receptors: Shaping immune responses. Nat. Rev. Immunol. 2009, 9, 465–479. [Google Scholar] [CrossRef]
  74. Arumugam, T.V.; Manzanero, S.; Furtado, M.; Biggins, P.J.; Hsieh, Y.H.; Gelderblom, M.; MacDonald, K.P.; Salimova, E.; Li, Y.I.; Korn, O.; et al. An atypical role for the myeloid receptor Mincle in central nervous system injury. J. Cereb. Blood Flow Metab. 2017, 37, 2098–2111. [Google Scholar] [CrossRef] [Green Version]
  75. Fitzgerald, K.A.; Kagan, J.C. Toll-like Receptors and the Control of Immunity. Cell 2020, 180, 1044–1066. [Google Scholar] [CrossRef]
  76. Hermann, J.K.; Lin, S.; Soffer, A.; Wong, C.; Srivastava, V.; Chang, J.; Sunil, S.; Sudhakar, S.; Tomaszewski, W.H.; Protasiewicz, G.; et al. The Role of Toll-Like Receptor 2 and 4 Innate Immunity Pathways in Intracortical Microelectrode-Induced Neuroinflammation. Front. Bioeng. Biotechnol. 2018, 6, 113. [Google Scholar] [CrossRef]
  77. Dinarello, C.A. Historical insights into cytokines. Eur. J. Immunol. 2007, 37 (Suppl. S1), S34–S45. [Google Scholar] [CrossRef] [Green Version]
  78. Jorfi, M.; Skousen, J.L.; Weder, C.; Capadona, J.R. Progress towards biocompatible intracortical microelectrodes for neural interfacing applications. J. Neural Eng. 2015, 12, 011001. [Google Scholar] [CrossRef]
  79. Kaplani, K.; Koutsi, S.; Armenis, V.; Skondra, F.G.; Karantzelis, N.; Champeris Tsaniras, S.; Taraviras, S. Wound healing related agents: Ongoing research and perspectives. Adv. Drug Deliv. Rev. 2018, 129, 242–253. [Google Scholar] [CrossRef]
  80. Hughes, C.E.; Nibbs, R.J.B. A guide to chemokines and their receptors. FEBS J. 2018, 285, 2944–2971. [Google Scholar] [CrossRef]
  81. Miller, M.C.; Mayo, K.H. Chemokines from a Structural Perspective. Int. J. Mol. Sci. 2017, 18, 2088. [Google Scholar] [CrossRef] [Green Version]
  82. White, G.E.; Iqbal, A.J.; Greaves, D.R. CC chemokine receptors and chronic inflammation—Therapeutic opportunities and pharmacological challenges. Pharmacol. Rev. 2013, 65, 47–89. [Google Scholar] [CrossRef] [Green Version]
  83. Antonelli, A.; Ferrari, S.M.; Giuggioli, D.; Ferrannini, E.; Ferri, C.; Fallahi, P. Chemokine (C-X-C motif) ligand (CXCL)10 in autoimmune diseases. Autoimmun. Rev. 2014, 13, 272–280. [Google Scholar] [CrossRef]
  84. Han, X. Constitutively active chemokine CXC receptors. Adv. Pharmacol. 2014, 70, 265–301. [Google Scholar] [CrossRef]
  85. Song, I.; Dityatev, A. Crosstalk between glia, extracellular matrix and neurons. Brain Res. Bull. 2018, 136, 101–108. [Google Scholar] [CrossRef] [PubMed]
  86. Krishnaswamy, V.R.; Benbenishty, A.; Blinder, P.; Sagi, I. Demystifying the extracellular matrix and its proteolytic remodeling in the brain: Structural and functional insights. Cell. Mol. Life Sci. 2019, 76, 3229–3248. [Google Scholar] [CrossRef] [PubMed]
  87. Morawski, M.; Filippov, M.; Tzinia, A.; Tsilibary, E.; Vargova, L. ECM in brain aging and dementia. Prog. Brain Res. 2014, 214, 207–227. [Google Scholar] [CrossRef] [PubMed]
  88. Tsien, R.Y. Very long-term memories may be stored in the pattern of holes in the perineuronal net. Proc. Natl. Acad. Sci. USA 2013, 110, 12456–12461. [Google Scholar] [CrossRef] [PubMed] [Green Version]
  89. Tsilibary, E.; Tzinia, A.; Radenovic, L.; Stamenkovic, V.; Lebitko, T.; Mucha, M.; Pawlak, R.; Frischknecht, R.; Kaczmarek, L. Neural ECM proteases in learning and synaptic plasticity. Prog. Brain Res. 2014, 214, 135–157. [Google Scholar] [CrossRef] [PubMed]
  90. Soleman, S.; Filippov, M.A.; Dityatev, A.; Fawcett, J.W. Targeting the neural extracellular matrix in neurological disorders. Neuroscience 2013, 253, 194–213. [Google Scholar] [CrossRef]
  91. Jang, D.G.; Sim, H.J.; Song, E.K.; Kwon, T.; Park, T.J. Extracellular matrixes and neuroinflammation. BMB Rep. 2020, 53, 491–499. [Google Scholar] [CrossRef]
  92. Suttkus, A.; Morawski, M.; Arendt, T. Protective Properties of Neural Extracellular Matrix. Mol. Neurobiol. 2016, 53, 73–82. [Google Scholar] [CrossRef]
  93. Chelluboina, B.; Nalamolu, K.R.; Klopfenstein, J.D.; Pinson, D.M.; Wang, D.Z.; Vemuganti, R.; Veeravalli, K.K. MMP-12, a Promising Therapeutic Target for Neurological Diseases. Mol. Neurobiol. 2018, 55, 1405–1409. [Google Scholar] [CrossRef]
  94. Hahn, J.N.; Kaushik, D.K.; Mishra, M.K.; Wang, J.; Silva, C.; Yong, V.W. Impact of Minocycline on Extracellular Matrix Metalloproteinase Inducer, a Factor Implicated in Multiple Sclerosis Immunopathogenesis. J. Immunol. 2016, 197, 3850–3860. [Google Scholar] [CrossRef] [Green Version]
  95. Suzuki, H.; Sugimura, Y.; Iwama, S.; Suzuki, H.; Nobuaki, O.; Nagasaki, H.; Arima, H.; Sawada, M.; Oiso, Y. Minocycline prevents osmotic demyelination syndrome by inhibiting the activation of microglia. J. Am. Soc. Nephrol. 2010, 21, 2090–2098. [Google Scholar] [CrossRef] [Green Version]
  96. Rennaker, R.L.; Miller, J.; Tang, H.; Wilson, D.A. Minocycline increases quality and longevity of chronic neural recordings. J. Neural Eng. 2007, 4, L1–L5. [Google Scholar] [CrossRef] [Green Version]
  97. Moore, C.S.; Crocker, S.J. An alternate perspective on the roles of TIMPs and MMPs in pathology. Am. J. Pathol. 2012, 180, 12–16. [Google Scholar] [CrossRef]
  98. Gardner, J.; Ghorpade, A. Tissue inhibitor of metalloproteinase (TIMP)-1: The TIMPed balance of matrix metalloproteinases in the central nervous system. J. Neurosci. Res. 2003, 74, 801–806. [Google Scholar] [CrossRef] [Green Version]
  99. Lin, M.; Griessenauer, C.J.; Starke, R.M.; Tubbs, R.S.; Shoja, M.M.; Foreman, P.M.; Vyas, N.A.; Walters, B.C.; Harrigan, M.R.; Hendrix, P.; et al. Haplotype analysis of SERPINE1 gene: Risk for aneurysmal subarachnoid hemorrhage and clinical outcomes. Mol. Genet. Genom. Med. 2019, 7, e737. [Google Scholar] [CrossRef] [Green Version]
  100. Bonneh-Barkay, D.; Wiley, C.A. Brain extracellular matrix in neurodegeneration. Brain Pathol. 2009, 19, 573–585. [Google Scholar] [CrossRef]
  101. Gur-Wahnon, D.; Mizrachi, T.; Wald-Altman, S.; Al-Roof Higazi, A.; Brenner, T. Tissue plasminogen activator involvement in experimental autoimmune myasthenia gravis: Aggravation and therapeutic potential. J. Autoimmun. 2014, 52, 36–43. [Google Scholar] [CrossRef]
Figure 1. Heat map and principal component analysis. (A) Heatmap of gene expression after normalization and log2 transformation. (B) principal Component Analysis of normalized log2 transformed data. PC1—PC4 is displayed, and sample groups are marked. The first 4 Principal Component axes account for a total of 55.7% variation in the data. Specifically, PC1 accounts for 30.7% of the variation in data, PC2 accounts for 10.7% of the variation in data, PC3 accounts for 8.4% of the variation in data, and PC4 accounts for 4.9% of the variation in data. New samples are predicted to fall within the elliptical with a probability of 0.95. Orange (open circles) = NSCTR; Green (triangles) = 6-h; Red (circles) = 24-h; Purple (diamonds) = 72-h; and Blue (squares) = 2-week.
Cells 11 02348 g001
Figure 2. Venn diagram of the number of genes showing altered expression post-surgery compared to Non-Surgical Control (NSCTR). Only genes above the expression threshold of 25 counts in over 85% of the samples are included. (log2foldchange > 1 or <−1, Padj < 0.05). Overlapping points on the diagram (blended color) indicate the same genes demonstrating altered expression across both time points.
Cells 11 02348 g002
Figure 3. Differential expression of gene set involved in the complement pathway compared to NSCTR mice: (AD) volcano plot with genes in the complement pathway shown in black circles. Top 10 genes by differential expression level and Padj < 0.05 are labeled. Each time point post-surgery is on a separate volcano plot. (A) =6-h, (B) =24-h, (C) =72-h, and (D) =2-weeks. Color in (AD) corresponds to time post-surgery color coding in other figures. (E) heatmap showing differential expressions of genes of the complement system at each time point post-surgery compared to NSCTR.
Cells 11 02348 g003
Figure 4. Differential expression of specific genes involved in the complement pathway compared to NSCTR mice: Top differentially expressed genes for the complement pathway displayed as bar graphs of individual genes as a function of time post-surgery (AI). For each time point, gene expression levels are compared to the NSCTR mice. Error bars indicate the standard error of the mean between NSCTR and each time point. Asterisks indicate that Padj < 0.05. Note (D), which depicts the upregulation of C3, has a y-axis log2foldchange scale of −1 to 10, because of its high upregulation.
Cells 11 02348 g004
Figure 5. Differential expression of gene set involved in the pattern recognition system compared to NSCTR mice: (A) volcano plot with genes in the PRR pathway are shown in black. Genes in the pattern recognition system with Padj < 0.05 and log2foldchange > 1 or <−1 are labeled. Each time point post-surgery is on a separate volcano plot. (A) =6-h, (B) =24-h, (C) =72-h, and (D) =2-weeks. Color in (AD) corresponds to time post-surgery color coding in other figures. (E) heatmap showing differential expressions of genes of the chemokine system at each time point post-surgery compared to NSCTR.
Cells 11 02348 g005
Figure 6. Differential expression of specific genes in the pattern recognition receptor family compared to NSCTR mice: All genes for the pattern recognition receptor except Toll-like receptors, which will be described in Figure 8. Gene set displayed as bar graphs of individual genes as a function of time post-surgery (AE). For each time point, gene expression levels are compared to the NSCTR mice. Error bars indicate the standard error of the mean between NSCTR and each time point. Asterisks indicate that Padj < 0.05.
Cells 11 02348 g006
Figure 7. Differential expression of gene set involved in the Toll-like receptor pathway compared to NSCTR mice: (A) volcano plot with genes in the TLR group shown in black circles. Top 10 genes by differential expression level and Padj < 0.05 are labeled. Each time point post-surgery is on a separate volcano plot. (A) =6-h, (B) =24-h, (C) =72-h, and (D) =2-weeks. Color in (AD) corresponds to time post-surgery color coding in other figures. (E) heatmap showing differential expressions of genes of the TLR system at each time point post-surgery compared to NSCTR.
Cells 11 02348 g007
Figure 8. Differential expression of specific genes involved in the Toll-like receptor pathway compared to NSCTR mice: Bar graph of selected genes in the Toll-like Receptor’s pathway (AK), alterations in expression are displayed as bar graphs of individual genes as a function of time post-surgery. For each time point, gene expression levels are compared to the NSCTR mice. Error bars indicate the standard error of the mean between NSCTR and each time point. Asterisks indicate that Padj < 0.05. Note (C), depicting the upregulation of Cd36, has a y-axis log2foldchange scale of −1 to 10, because of its high upregulation.
Cells 11 02348 g008
Figure 9. Differential expression of gene set involved in cytokine response compared to NSCTR mice: (AD) volcano plot with genes in the cytokine system shown in black. Top 10 genes by differential expression level and Padj < 0.05 are labeled. Each time point post-surgery is on a separate volcano plot. (A) =6-h, (B) =24-h, (C) =72-h, and (D) =2-weeks. Color in (AD) corresponds to time post-surgery color coding in other figures. (E) heatmap showing differential expressions of genes of the cytokine system at each time point post-surgery compared to NSCTR.
Cells 11 02348 g009
Figure 10. Differential expression of specific genes involved in the cytokine pathway compared to NSCTR mice: (AL) Top differentially expressed genes for the cytokine gene set displayed as bar graphs of individual genes as a function of time post-surgery. For each time point, gene expression levels are compared to the NSCTR mice. (MO) bar graph for TGF signaling pathways, which may be important for wound healing deemed important in the cytokine pathway. Error bars indicate the standard error of the mean between NSCTR and each time point. Asterisks indicate that Padj < 0.05.
Cells 11 02348 g010
Figure 11. Differential expression of gene set involved in chemokine response compared to NSCTR mice: (AD) volcano plot with genes in the chemokine system in black. Genes in the chemokine response system with Padj < 0.05 and log2foldchange > 1 or <−1 are labeled. Each time point post-surgery is on a separate volcano plot. (A) =6-h, (B) =24-h, (C) =72-h, and (D) =2-weeks. Color in (AD) corresponds to time post-surgery color coding in other figures. (E) heatmap showing differential expressions of genes of the chemokine system at each time point post-surgery compared to NSCTR.
Cells 11 02348 g011
Figure 12. Differential expression of specific genes involved in the chemokine pathway compared to NSCTR mice: (AJ) Top differentially expressed genes for the chemokine gene set displayed as bar graphs of individual genes as a function of time post-surgery. For each time point, gene expression levels are compared to the NSCTR mice. Error bars indicate the standard error of the mean between NSCTR and each time point. Asterisks indicate that Padj < 0.05. Note (A,B,H), which depicts the upregulation of Ccl2, Ccl3, and Cxcl10, respectively, has a y-axis log2foldchange scale of −1 to 10, because of their high upregulation.
Cells 11 02348 g012
Figure 13. Differential expression of gene set involved in the extracellular matrix group compared to NSCTR mice: (AD) volcano plot with genes in the extracellular matrix group in black. Top 10 genes by differential expression level and Padj < 0.05. are labeled. Each time point post-surgery is on a separate volcano plot. (A) =6-h, (B) =24-h, (C) =72-h, and (D) =2-weeks. Color in (AD) corresponds to time post-surgery color coding in other figures. (E) heatmap showing differential expressions of genes of the extracellular matrix group at each time point post-surgery compared to NSCTR.
Cells 11 02348 g013
Figure 14. Differential expression of specific genes involved in the extracellular matrix pathway compared to NSCTR mice (AF) Top differentially expressed genes for the extracellular matrix gene set displayed as bar graphs of individual genes as a function of time post-surgery. For each time point, gene expression levels are compared to the NSCTR mice. Error bars indicate the standard error of the mean between NSCTR and each time point. Asterisks indicate that Padj < 0.05. Note (A,D,E,F) which depicts the upregulation of Spp1, Mmp12, Timp1, and Serpine1, respectively, has a y-axis log2foldchange scale of −1 to 10, because of their high upregulation.
Cells 11 02348 g014
Table 1. A comprehensive list of genes investigated in this study.
Abcc3Bnip3lCdc7Dock2GfapIl1rl2Lcn2MycPlcg2Ripk1SpibTopbp1
Abcc8BokCdk20Dot1lGja1Il1rnLdhaMyct1Pld1Ripk2Spint1Tpd52
Abl1Bola2Cdkn1aDstGjb1Il21rLdlrad3Myd88Pld2Rnf8Spp1Tpsb2
Adamts16BrafCdkn1cDuoxa1Gna15Il2rgLfngMyrfPlekhb1Rpa1Sqstm1Tradd
Ago4Brca1Ceacam3Dusp7Gpr183Il3LgmnNbnPlekhm1Rpl28SrgnTraf1
AgtBrd2CflarE2f1Gpr34Il36raLig1NcaphPllpRpl29Srxn1Traf2
AI464131Brd3Ch25hEedGpr62Il3raLilrb4aNcf1Plp1Rpl36alSt3gal6Traf3
Aim2Brd4Chek1Eef2kGpr84Il6raLingo1Ncor1Plxdc2Rpl9St8sia6Traf6
Ak1BtkChek2EgfrGrapiNosLmnaNcor2Plxnb3Rps10Stat1Trat1
Akt1C1qaChn2Egr1Gria1Inpp5dLmnb1Ncr1Pmp22Rps2Steap4Trem1
Akt2C1qbChst8Ehd2Gria2Iqsec1Lrg1NeflPms2Rps21Stmn1Trem2
Aldh1l1C1qcChukEhmt2Gria4Irak1Lrrc25Nfe2l2PnocRps3Stx18Trem3
Ambra1C3CideaEif1Grin2aIrak2Lrrc3Nfkb1PoleRps9Sumo1Trim47
Amigo2C3ar1CidebEmcnGrin2bIrak3LsrNfkb2Ppfia4Rrm2Suv39h1Trp53
Anapc15C4aCks1bEmp1Grm2Irak4Lst1NfkbiaPpp3caRsad2Suv39h2Trp53bp2
Anxa1C5ar1Clcf1eNosGrm3Irf1LtaNfkbiePpp3cbRtn4rl1Suz12Trp73
ApcC6Cldn5Enpp6GrnIrf2LtbNgfPpp3r1S100a10SykTrpa1
Apex1Cables1Clec7aEntpd2GsnIrf3LtbrNgfrPpp3r2S100bSyn2Trpm4
ApoeCalcoco2Clic4EomesGstm1Irf4Ltc4sNinj2Prdx1S1pr3SypTspan18
AppCalrCln3Ep300GzmaIrf6Ly6aNkg7Prf1S1pr4Tarbp2Ttr
Aqp4Camk4Clstn1EpcamGzmbIrf7Ly6gNlgn1PrkacaS1pr5Tbc1d4Tubb3
ArcCasp1Cnn2Epg5H2afxIrf8Ly9Nlgn2PrkacbSall1Tbr1Tubb4a
Arg1Casp2CnpEpsti1H2-T23Islr2LynNlrp2Prkar1aScd1Tbx21Txnrd1
Arhgap24Casp3Cntnap2Erbb3Hat1Itga6MafbNlrp3Prkar2aSellTcirg1Tyrobp
Arid1aCasp4Coa5Ercc2Hcar2Itga7MaffnNosPrkar2bSerpina3nTcl1Ugt8a
Asb2Casp6Col6a3Ercc6Hdac1ItgamMagNod1PrkceSerpine1Tet1Ulk1
Ash2lCasp7Cotl1EsamHdac2ItgavMalNostrinPrkcqSerpinf1TfgUng
AsphCasp8Cox5bEts2Hdac4ItgaxMan2b1Noxa1PrkdcSerping1TgfaUty
Atf3Casp9CpExo1Hdac6Itgb5Map1lc3aNplPrnpSesn1Tgfb1Vamp7
Atg14Cass4Cpa3Ezh1HdcJag1Map2k1NpntPros1Sesn2Tgfbr1Vav1
Atg3Ccl2Creb1Ezh2HellsJam2Map2k4Nptx1Psen2Setd1aTgm1Vegfa
Atg5Ccl3CrebbpF3Hif1aJarid2Map3k1Nqo1Psmb8Setd1bTgm2Vim
Atg7Ccl4CremFa2hHilpdaJunMap3k14NrgnPtenSetd2Tie1Vps4a
Atg9aCcl5Crip1Fabp5HiraKat2aMapk10NrmPtger3Setd7TimelessVps4b
AtmCcl7Cryba4FaddHist1h1dKat2bMapk12Nrp2Ptger4Setdb1Timp1Was
Atp6v0eCcng2Csf1FanccHmgb1Kcnd1Mapk14Nthl1Ptgs2SftpdTle3Wdr5
Atp6v1aCcniCsf1rFancd2Hmox1Kcnj10MaptNwd1PtmsSh2d1aTlr2Xcl1
AtrCcr2Csf2rbFancgHomer1Kcnk13MarcoOas1gPtpn6Shank3Tlr4Xiap
AxlCcr5Csf3rFasHpgdsKdm1aMavsOgg1PtprcSiglec1Tlr7Xrcc6
B3gnt5Cd109CskFaslHprtKdm1bMb21d1Olfml3Pttg1SiglecfTm4sf1Zbp1
BadCd14Cst7Fbln5Hps4Kdm2aMbd2OpalinPtx3Sin3aTmc7Zfp367
Bag3Cd163CtseFcer1gHrkKdm2bMbd3OptnPycardSirt1Tmcc3Aars
Bag4Cd19CtsfFcgr1Hsd11b1Kdm3aMcm2Osgin1Rab6bSlamf8Tmem100Asb10
Bak1Cd209eCtssFcgr2bHspb1Kdm3bMcm5OsmrRab7Slamf9Tmem119Ccdc127
Bard1Cd244CtswFcgr3Hus1Kdm4aMcm6P2rx7Rac1Slc10a6Tmem144Cnot10
BaxCd24aCx3cl1FcrlaIcam2Kdm4bMdc1P2ry12Rac2Slc17a6Tmem173Csnk2a2
Bbc3Cd300lfCx3cr1FcrlbIfi30Kdm4cMdm2Pacsin1Rad1Slc17a7Tmem204Fam104a
Bcas1Cd33Cxcl10FcrlsIfih1Kdm4dMef2cPadi2Rad17Slc1a3Tmem206Gusb
Bcl10Cd36Cxcl9FdxrIfitm2Kdm5aMertkPak1Rad50Slc2a1Tmem37Lars
Bcl2Cd3dCycsFen1Ifitm3Kdm5bMfge8Parp1Rad51Slc2a5Tmem64Mto1
Bcl2a1aCd3eCyp27a1Fgd2Ifnar1Kdm5cMgmtParp2Rad51bSlc44a1Tmem88bSupt7l
Bcl2l1Cd3gCyp7b1Fgf13Ifnar2Kdm5dMinclePcnaRad51cSlc6a1TnfTada2b
Bcl2l11Cd40CytipFgl2Igf1Kdm6aMmp12PdpnRad9aSlco2b1Tnfrsf10bTbp
Bcl2l2Cd44Dab2Fkbp5Igf1rKif2cMmp14Pecam1Rag1Slfn8Tnfrsf11bXpnpep1
BdnfCd47Dapk1Flt1Igf2rKir3dl1MobpPex14RageSmarca4Tnfrsf12a
Becn1Cd6Ddb2FosIgsf10Kir3dl2MogPik3caRalaSmarca5Tnfrsf13c
BidCd68Ddx58Foxp3Igsf6KitMpeg1Pik3cbRalbSmarcd1Tnfrsf17
BikCd69Dicer1Fpr1IkbkbKlrb1MpgPik3cdRapgef3Smc1aTnfrsf1a
Bin1Cd70Dlg1Fscn1IkbkeKlrd1Mr1Pik3cgRb1cc1SncaTnfrsf1b
Birc2Cd72Dlg4FynIkbkgKlrk1Mre11aPik3r1Rbfox3Socs3Tnfrsf25
Birc3Cd74Dlx1Gadd45aIl10rbKmt2aMs4a1Pik3r2RelaSod1Tnfrsf4
Birc5Cd83Dlx2Gadd45gIl15raKmt2cMs4a2Pik3r5RelbSod2Tnfsf10
BlkCd84Dna2Gal3st1Il1aLacc1Ms4a4aPilraRelnSod3Tnfsf12
BlmCd86Dnmt1GbaIl1bLag3Msh2Pilrb1ReservedSox10Tnfsf13b
BlnkCd8aDnmt3aGbp2Il1r1Lair1MsnPink1Rgl1Sox4Tnfsf4
Bmi1Cd8b1Dnmt3bGclcIl1r2Lamp1Msr1Pla2g4aRhoaSox9Tnfsf8
Bnip3Cdc25aDock1Gdpd2Il1rapLamp2MvpPla2g5Rig1Sphk1Top2a
List of genes investigated in the study. A total of 791 genes are listed (6 control sequences are excluded in the analysis): genes from the nCounter® Mouse Neuroinflammation Panel are in black, 20 custom genes of interest are in blue, and housekeeping genes are in red.
Publisher’s Note: MDPI stays neutral with regard to jurisdictional claims in published maps and institutional affiliations.

