
Pls1 Is a Peroxisomal Matrix Protein with a Role in Regulating Lysine Biosynthesis

 , , , , and
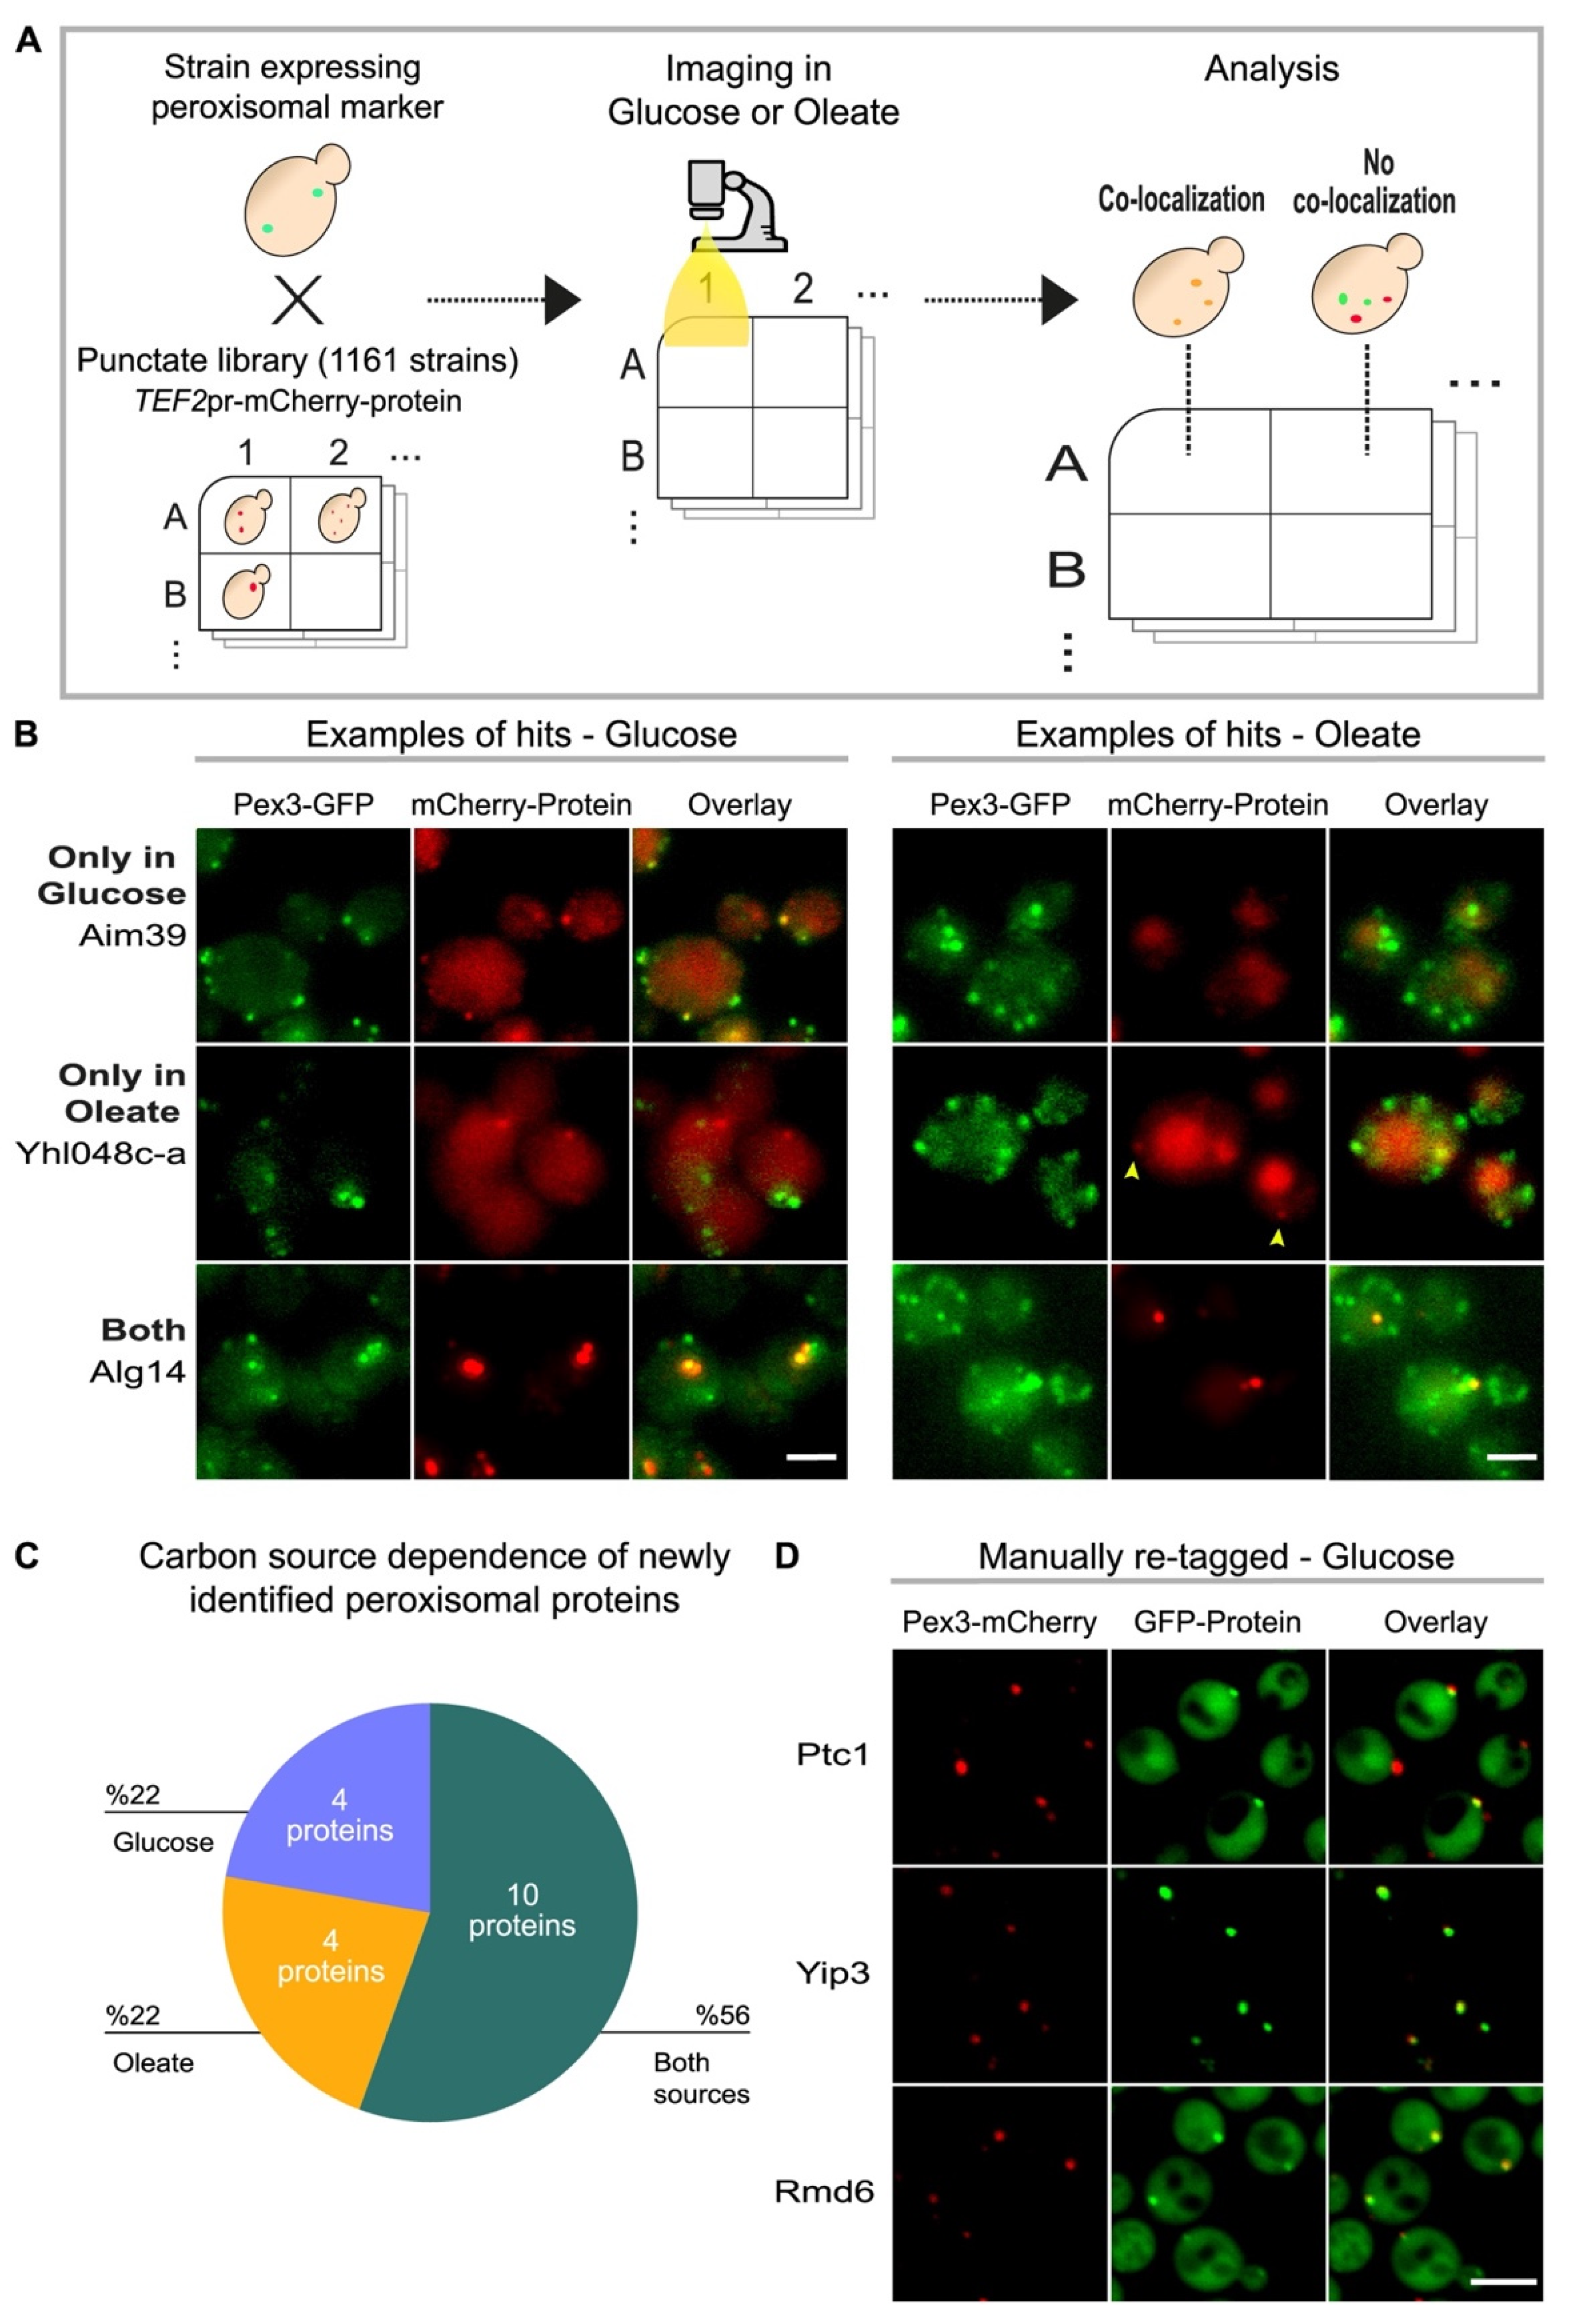
Abstract
:1. Introduction
2. Materials and Methods
2.1. Yeast Strains and Strain Construction
2.2. Yeast Growth Media
2.3. Yeast Library Preparation
2.4. Automated High-Throughput Fluorescence Microscopy
2.5. Manual and High-Resolution Microscopy
2.6. Image Analysis and Statistical Analysis
2.7. Western Blotting and Quantitative Analysis
2.8. Whole Cell Metabolomics
2.9. Binding Predictions Using ANCHORSmap
2.10. Computational Phylogenomics
3. Results
3.1. A High Content Screen Reveals Condition-Specific Peroxisomal Proteins
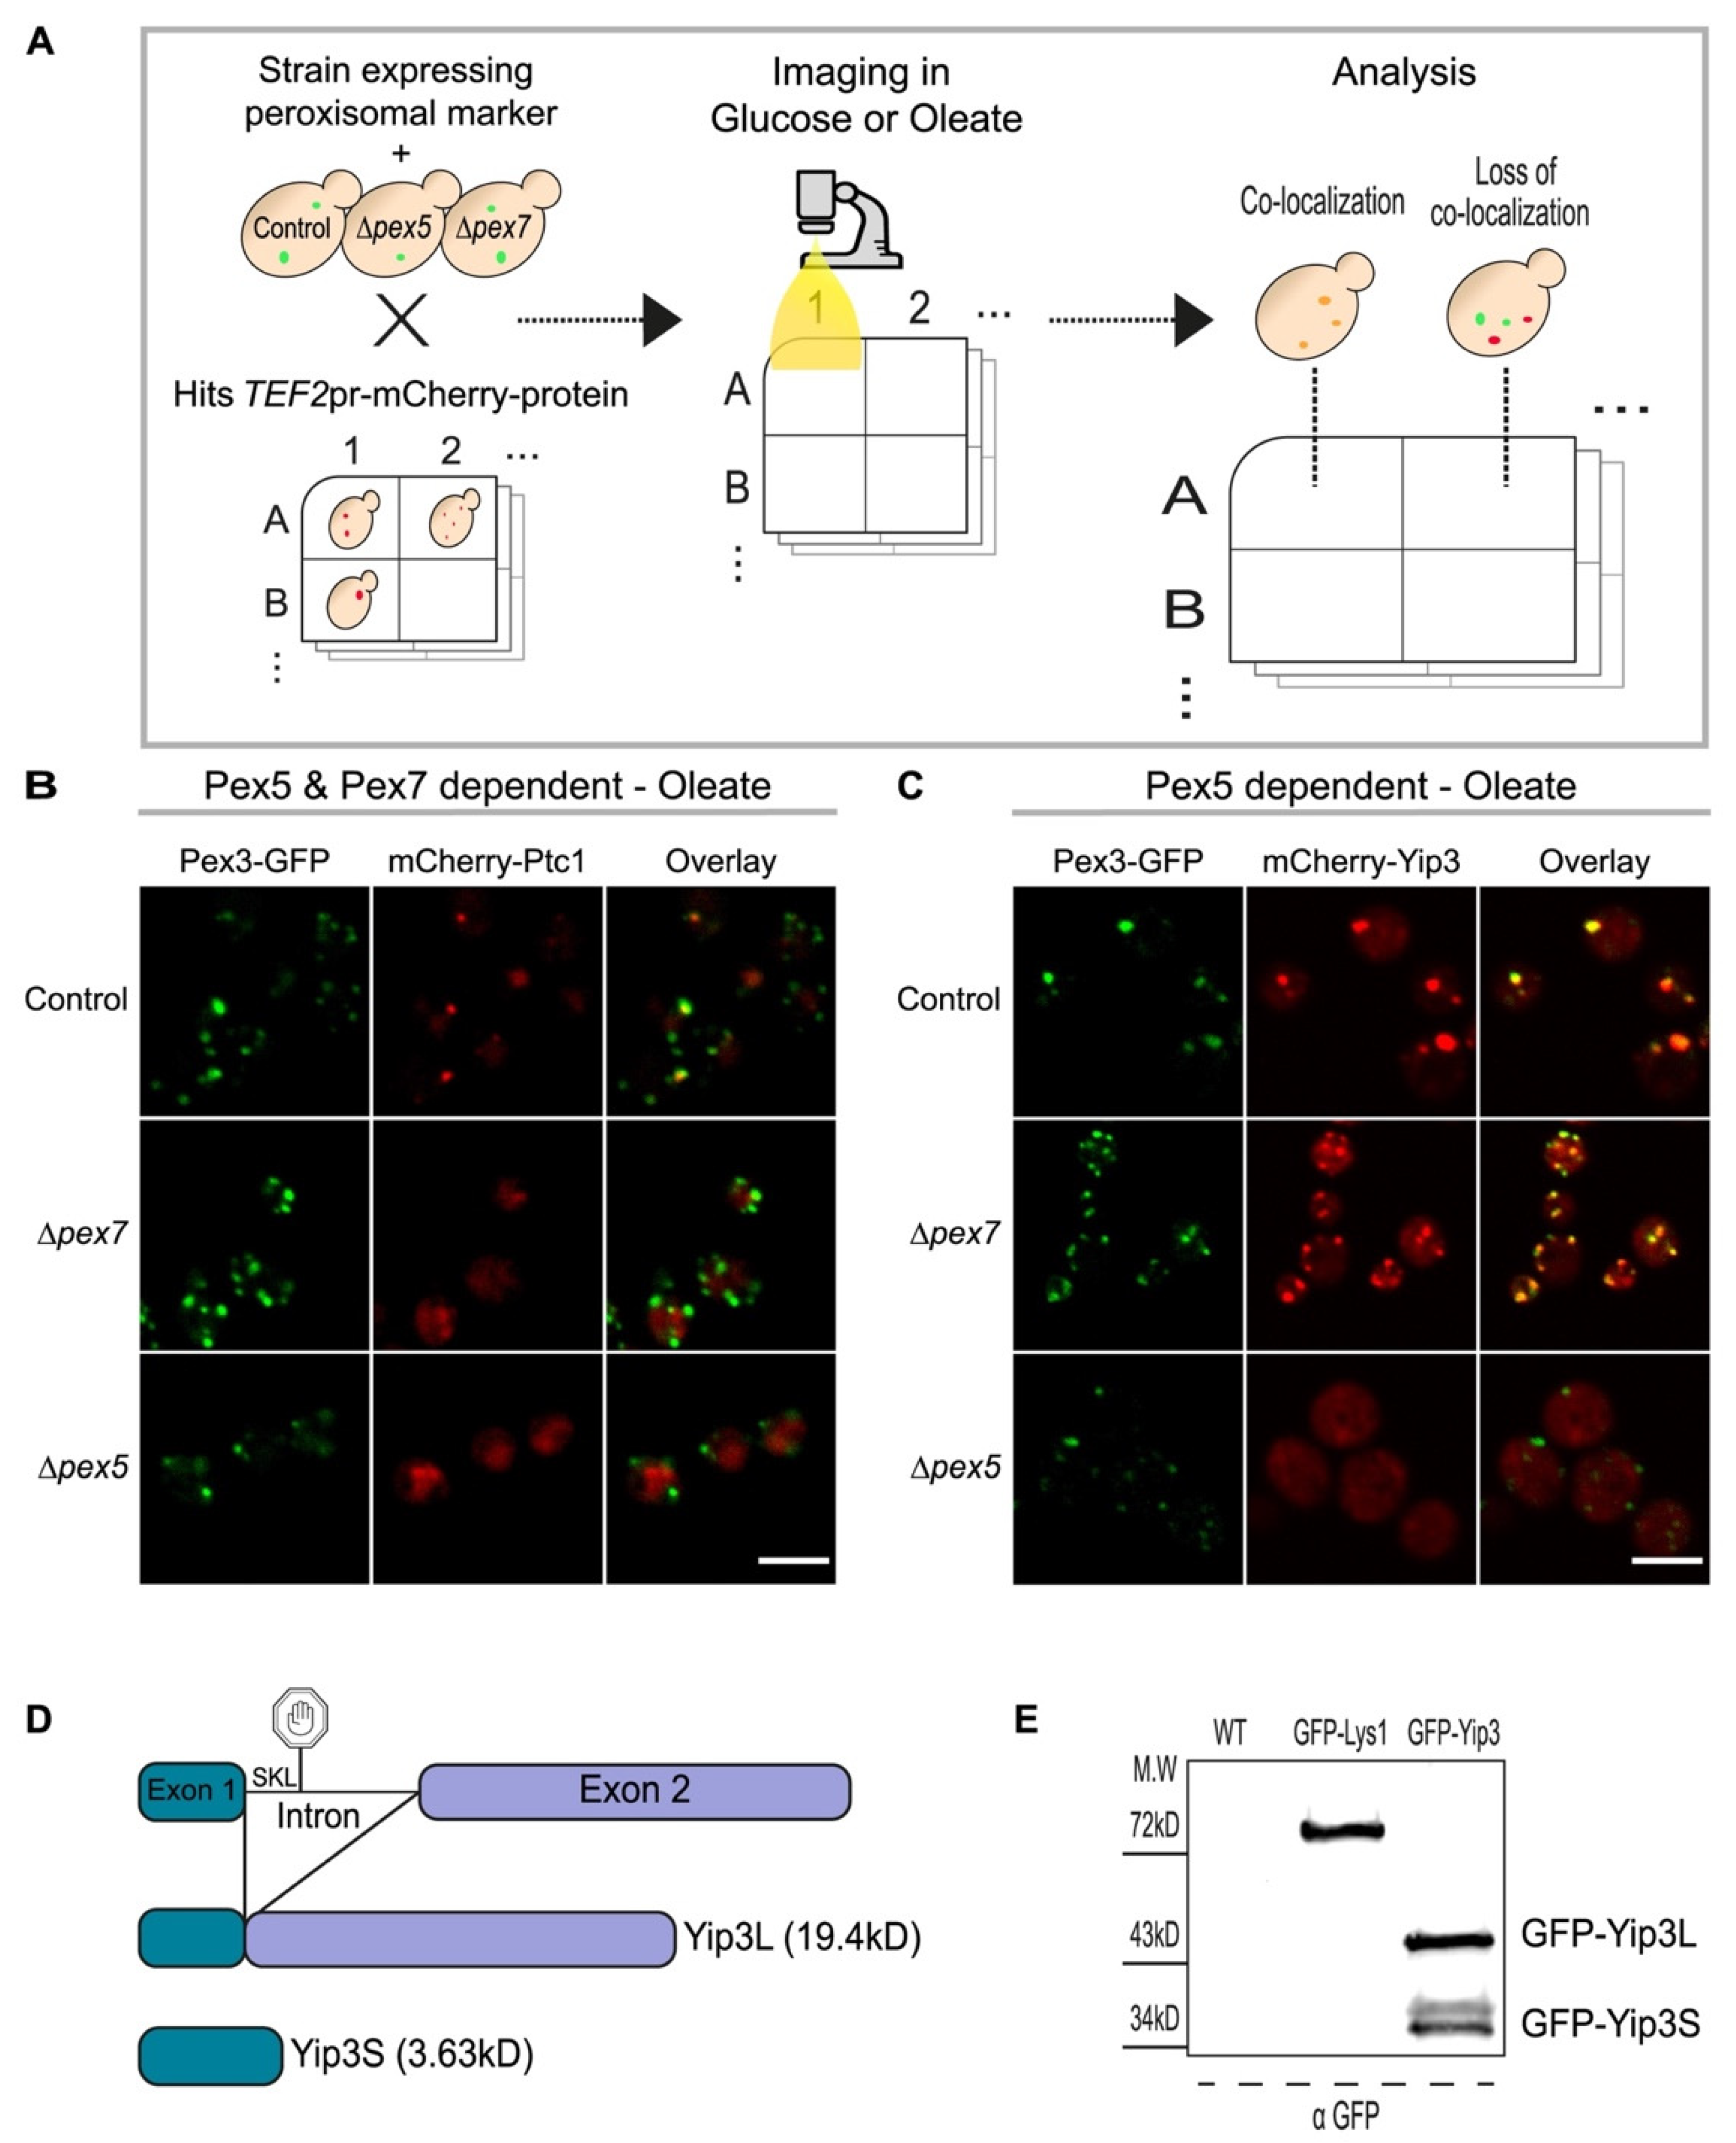
3.2. A Systematic Approach Uncovers Targeting Factor Dependency of the Newly Identified Peroxisomal Proteins
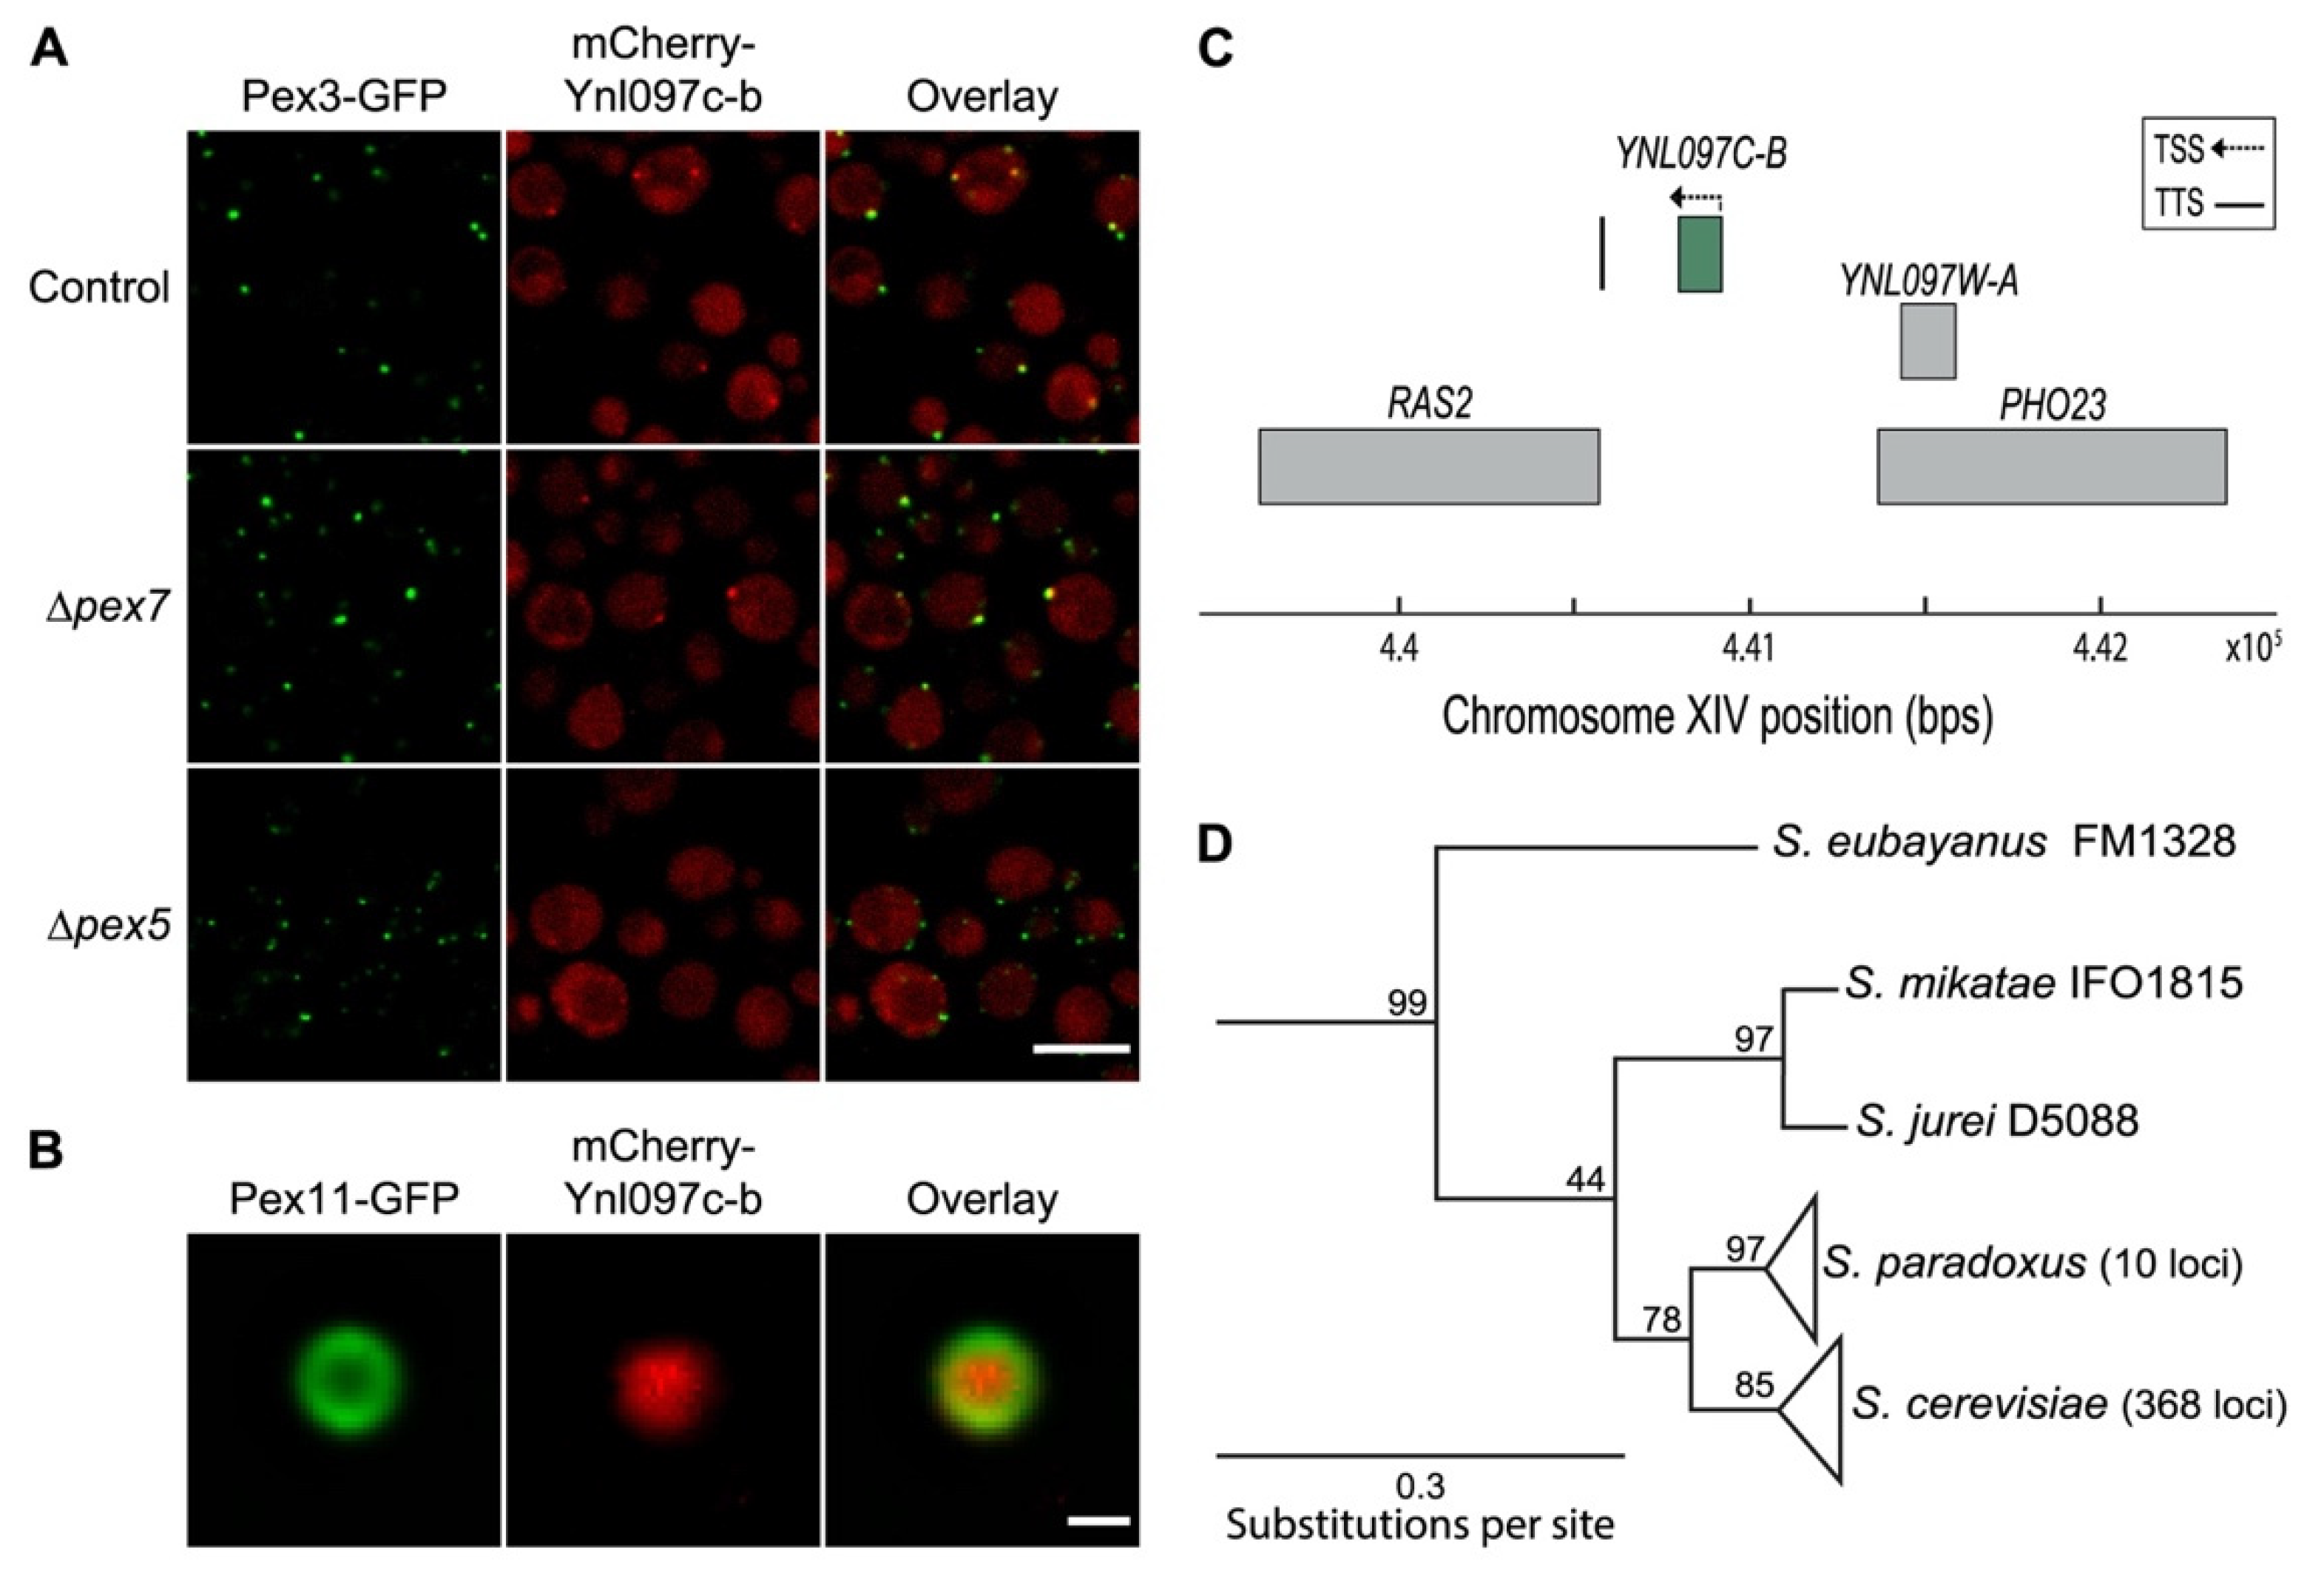
3.3. Ynl097c-b Is a Newly Identified Peroxisomal Protein That Is Unique to Saccharomyces cerevisiae
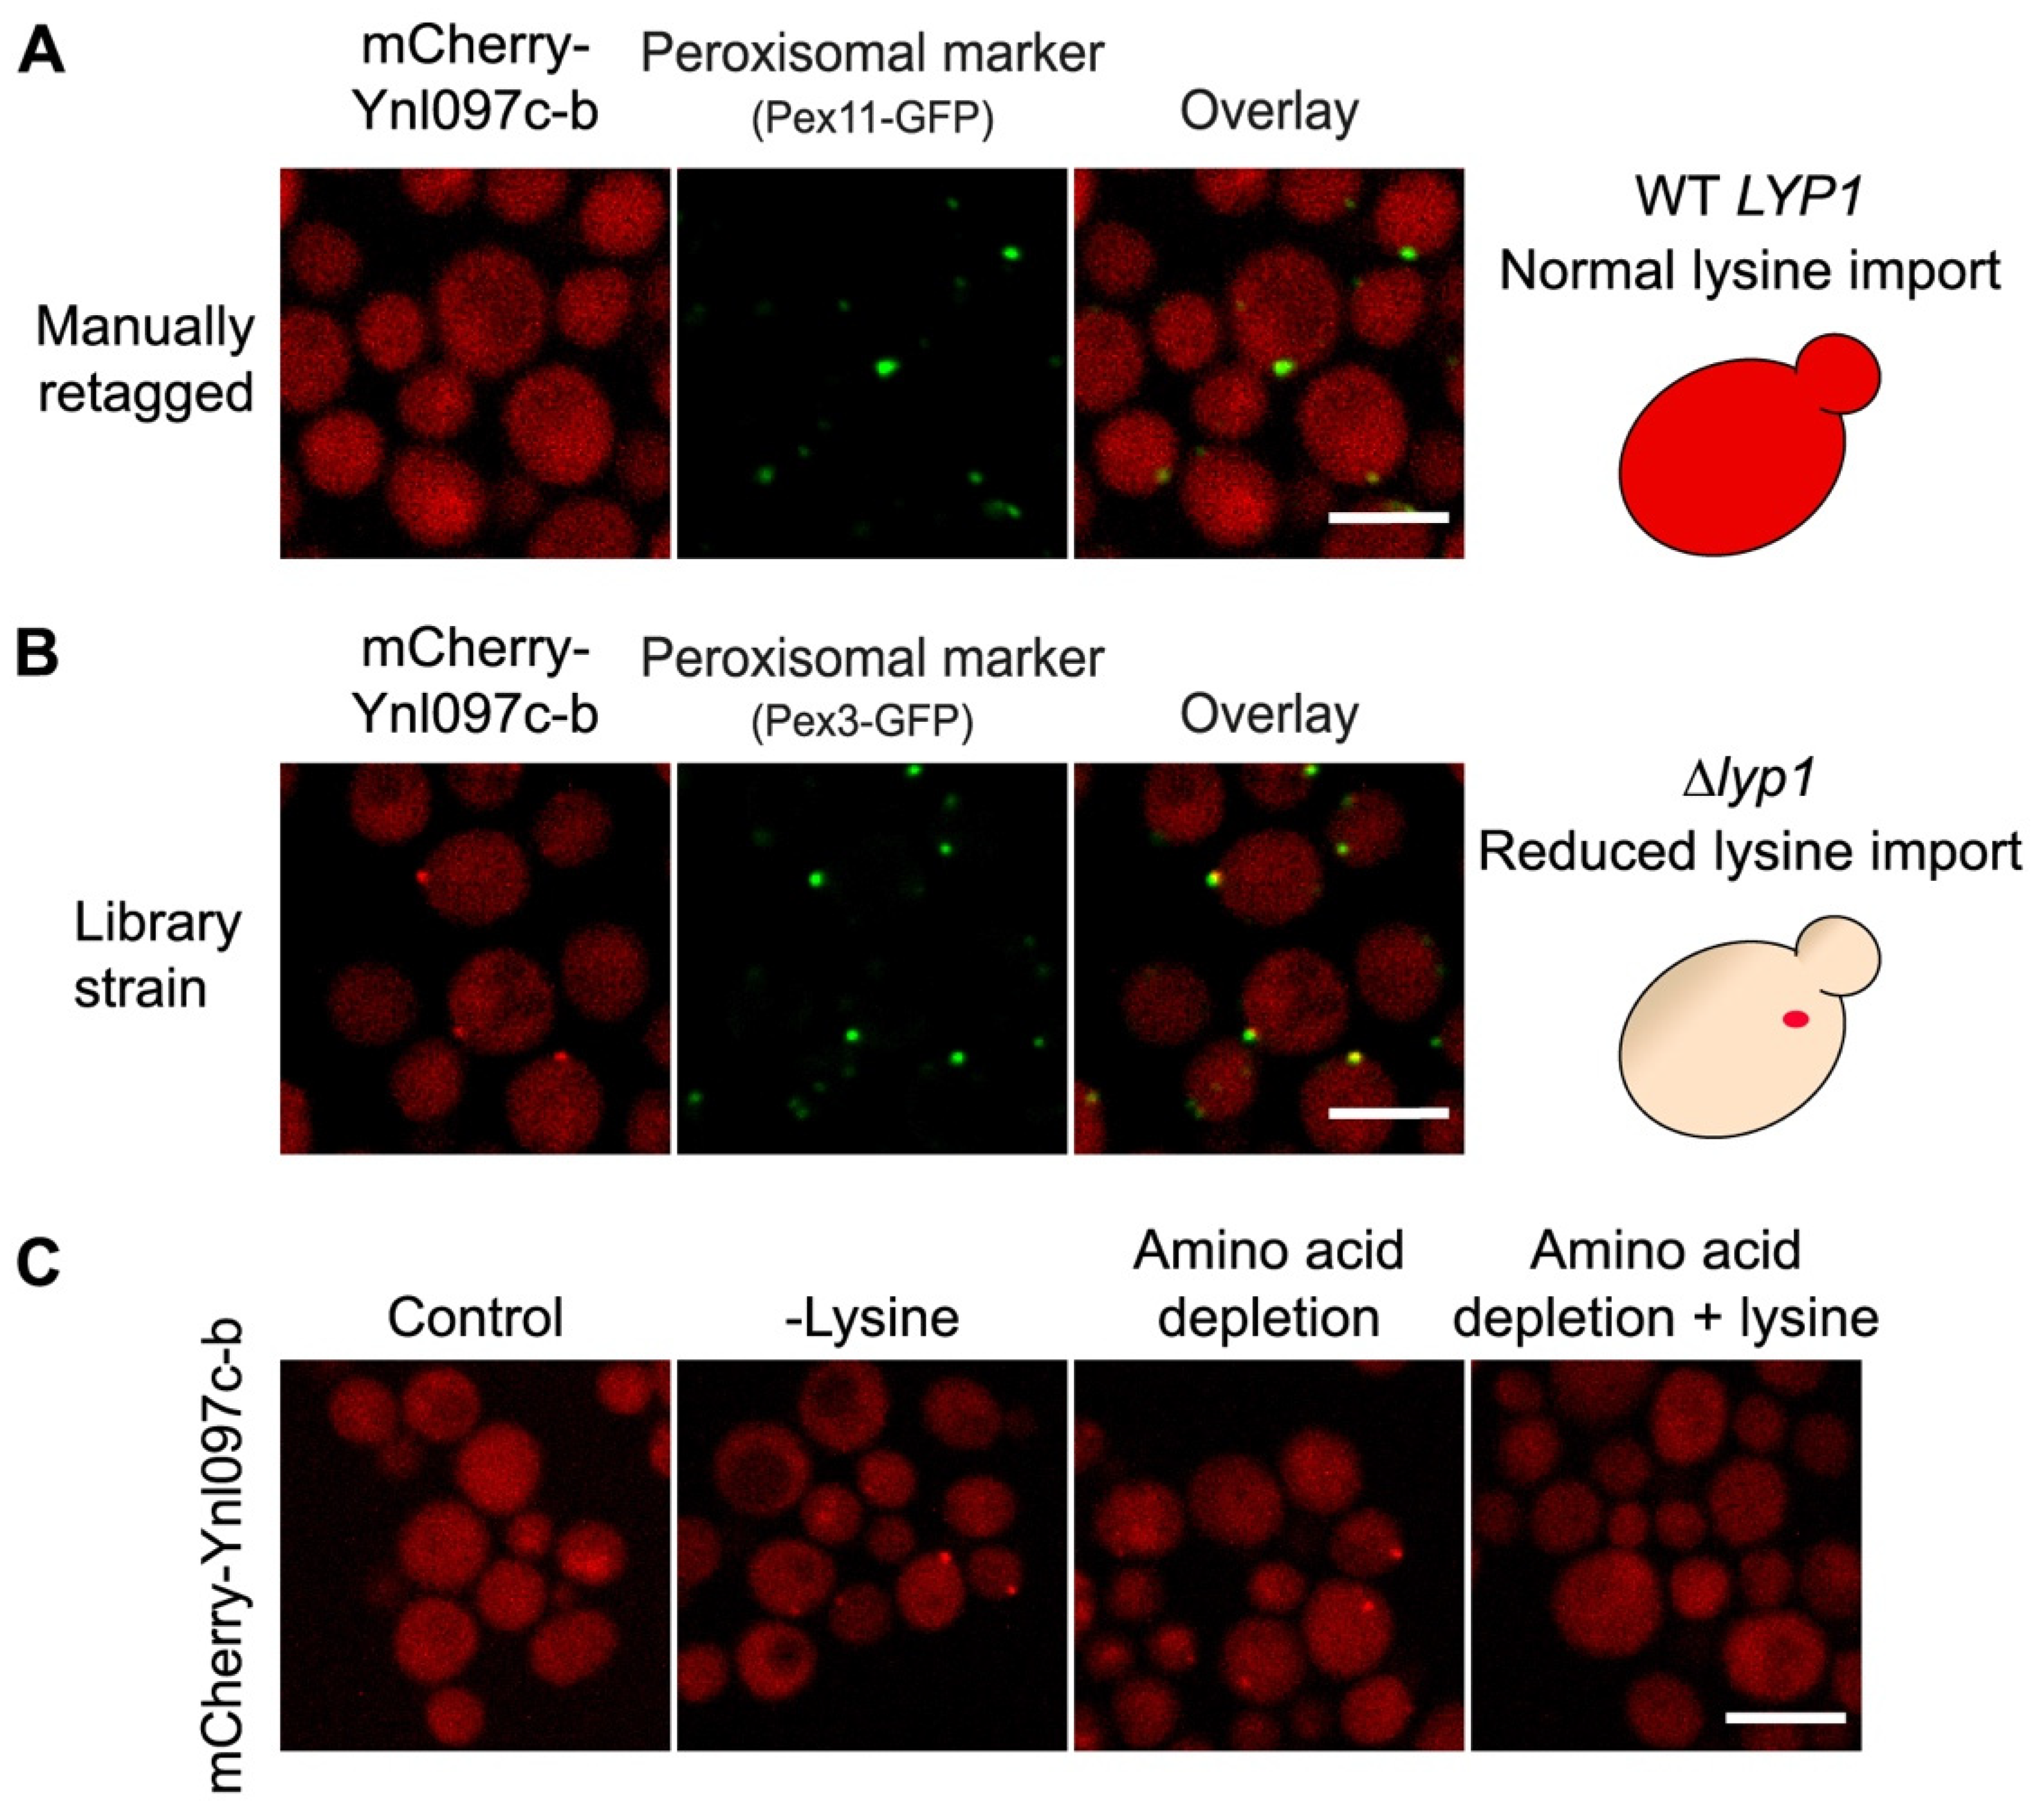
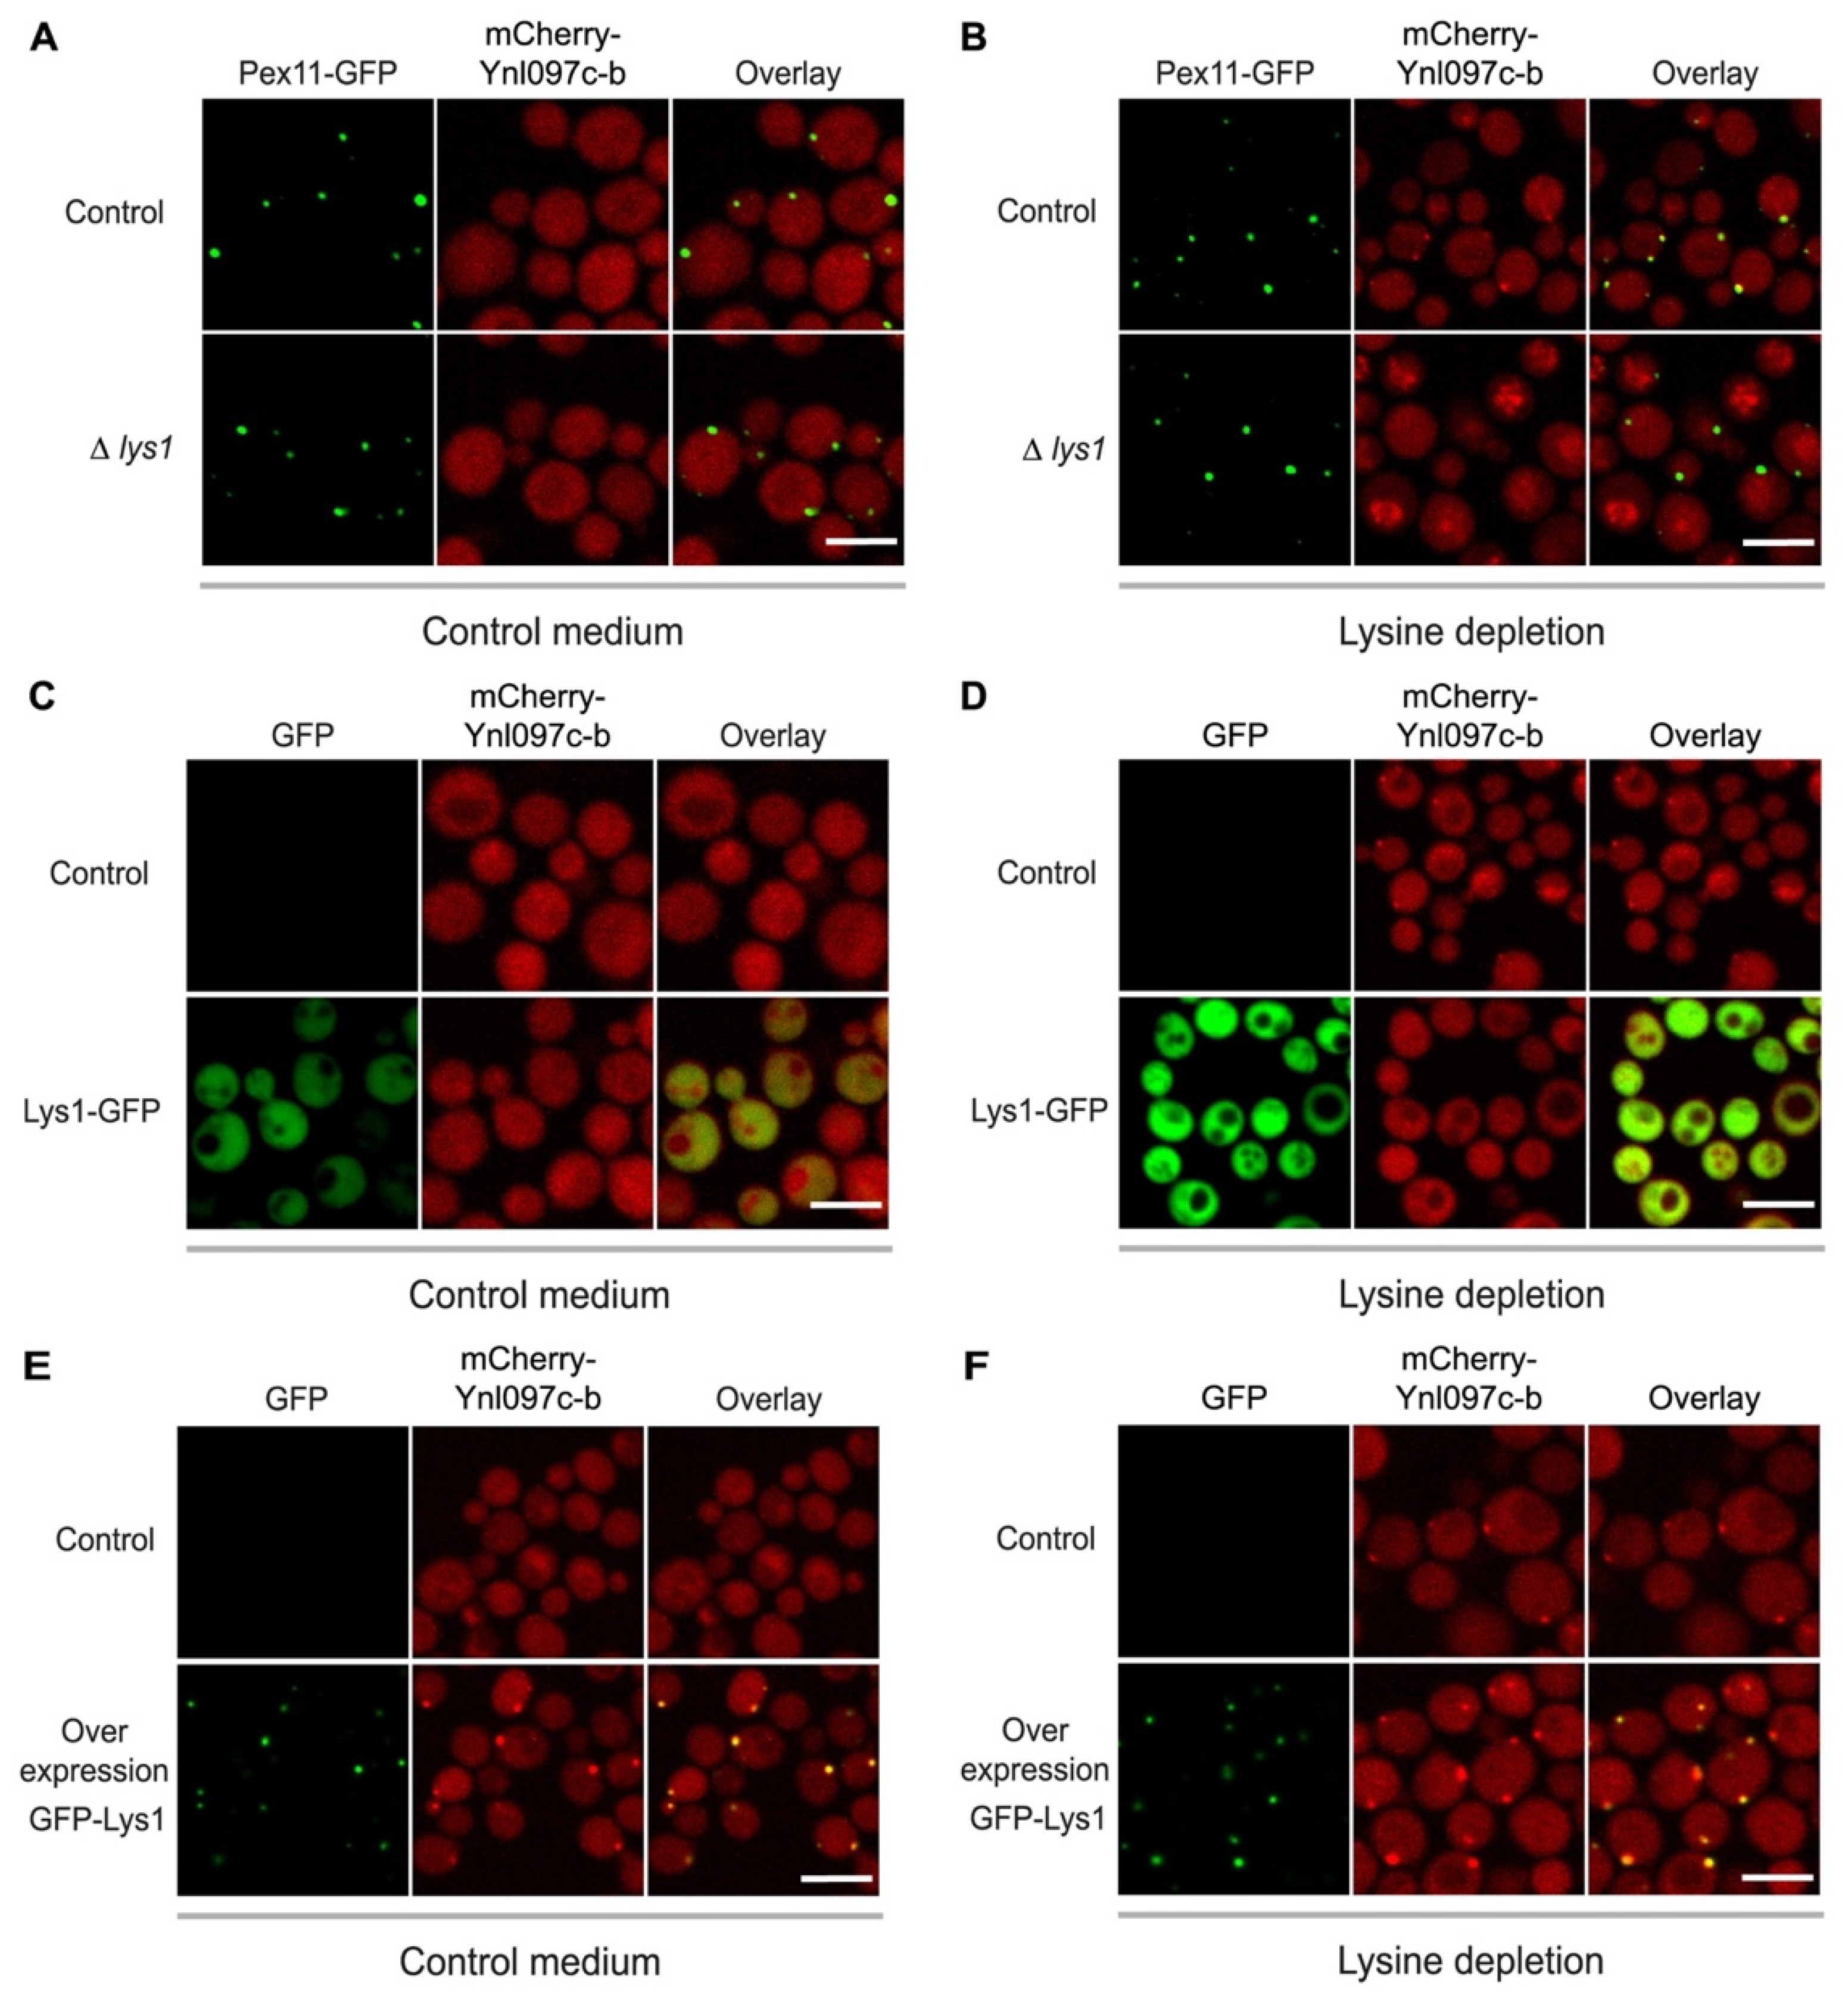
3.4. The Peroxisomal Localization of Ynl097c-b Is Dependent on Lysine Levels
3.5. The Peroxisomal Localization of Ynl097c-b Depends on Lys1
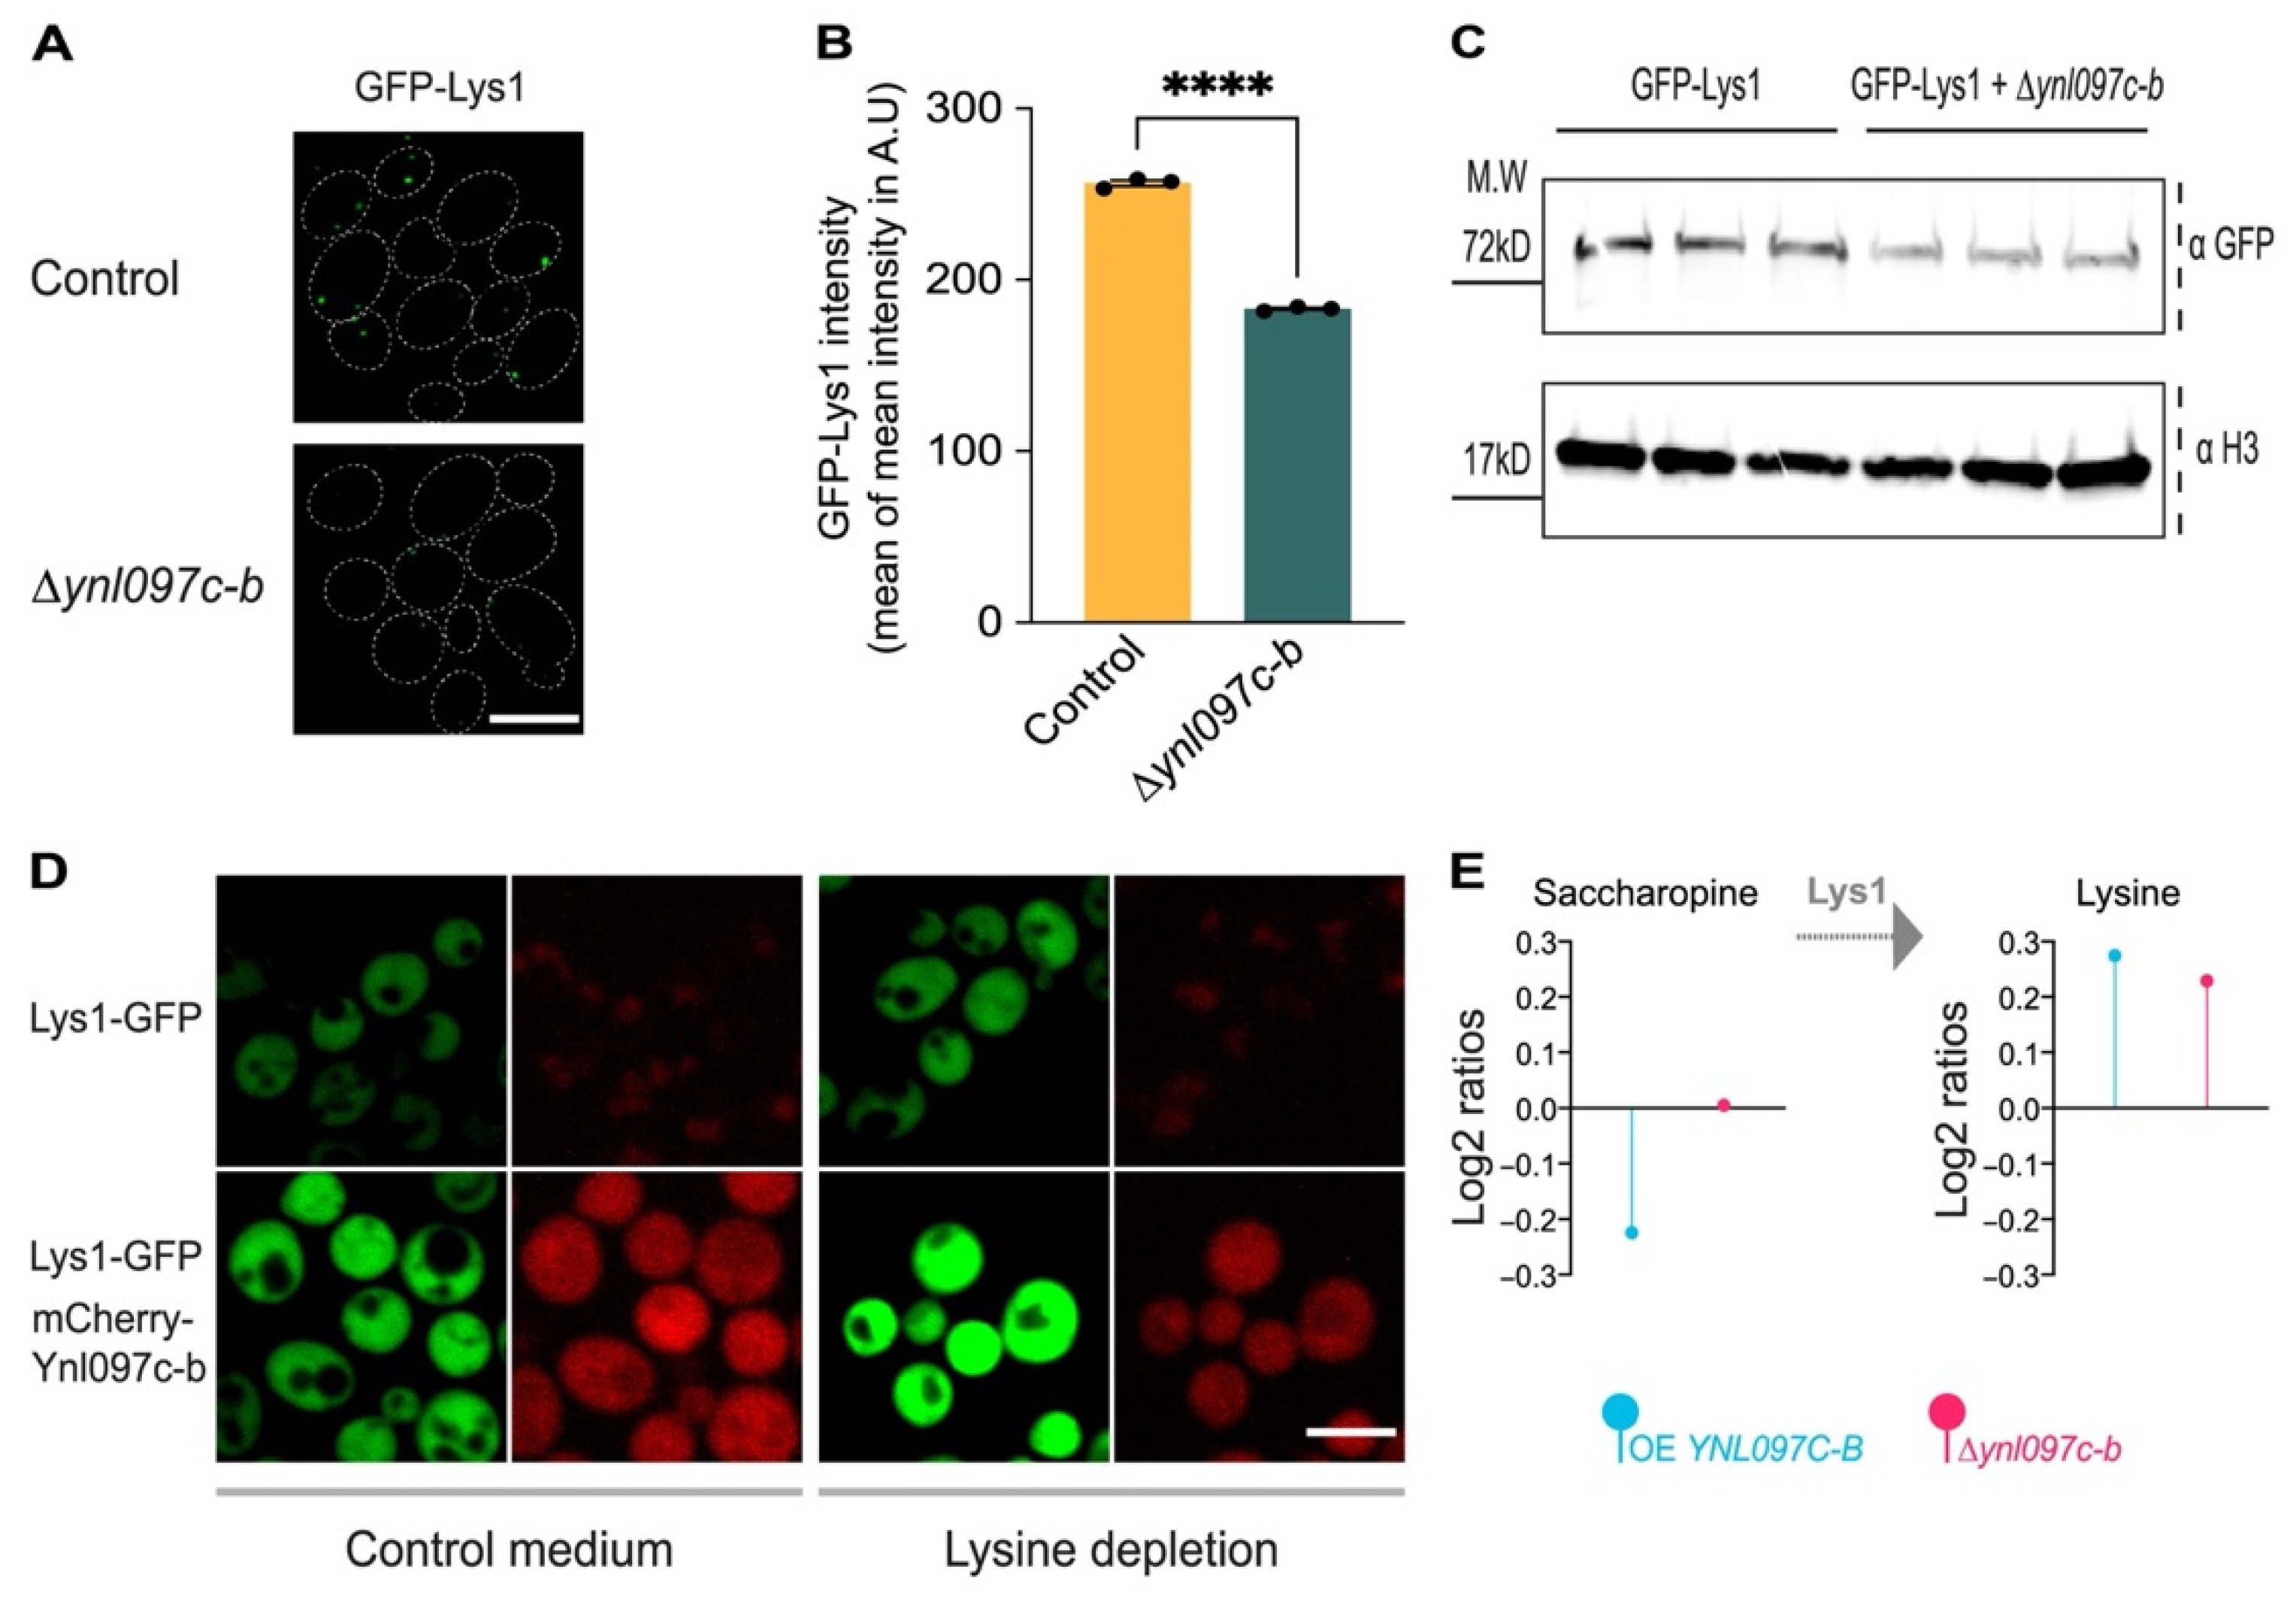
3.6. Ynl097c-b Affects Lys1 Abundance and Lysine Biosynthesis
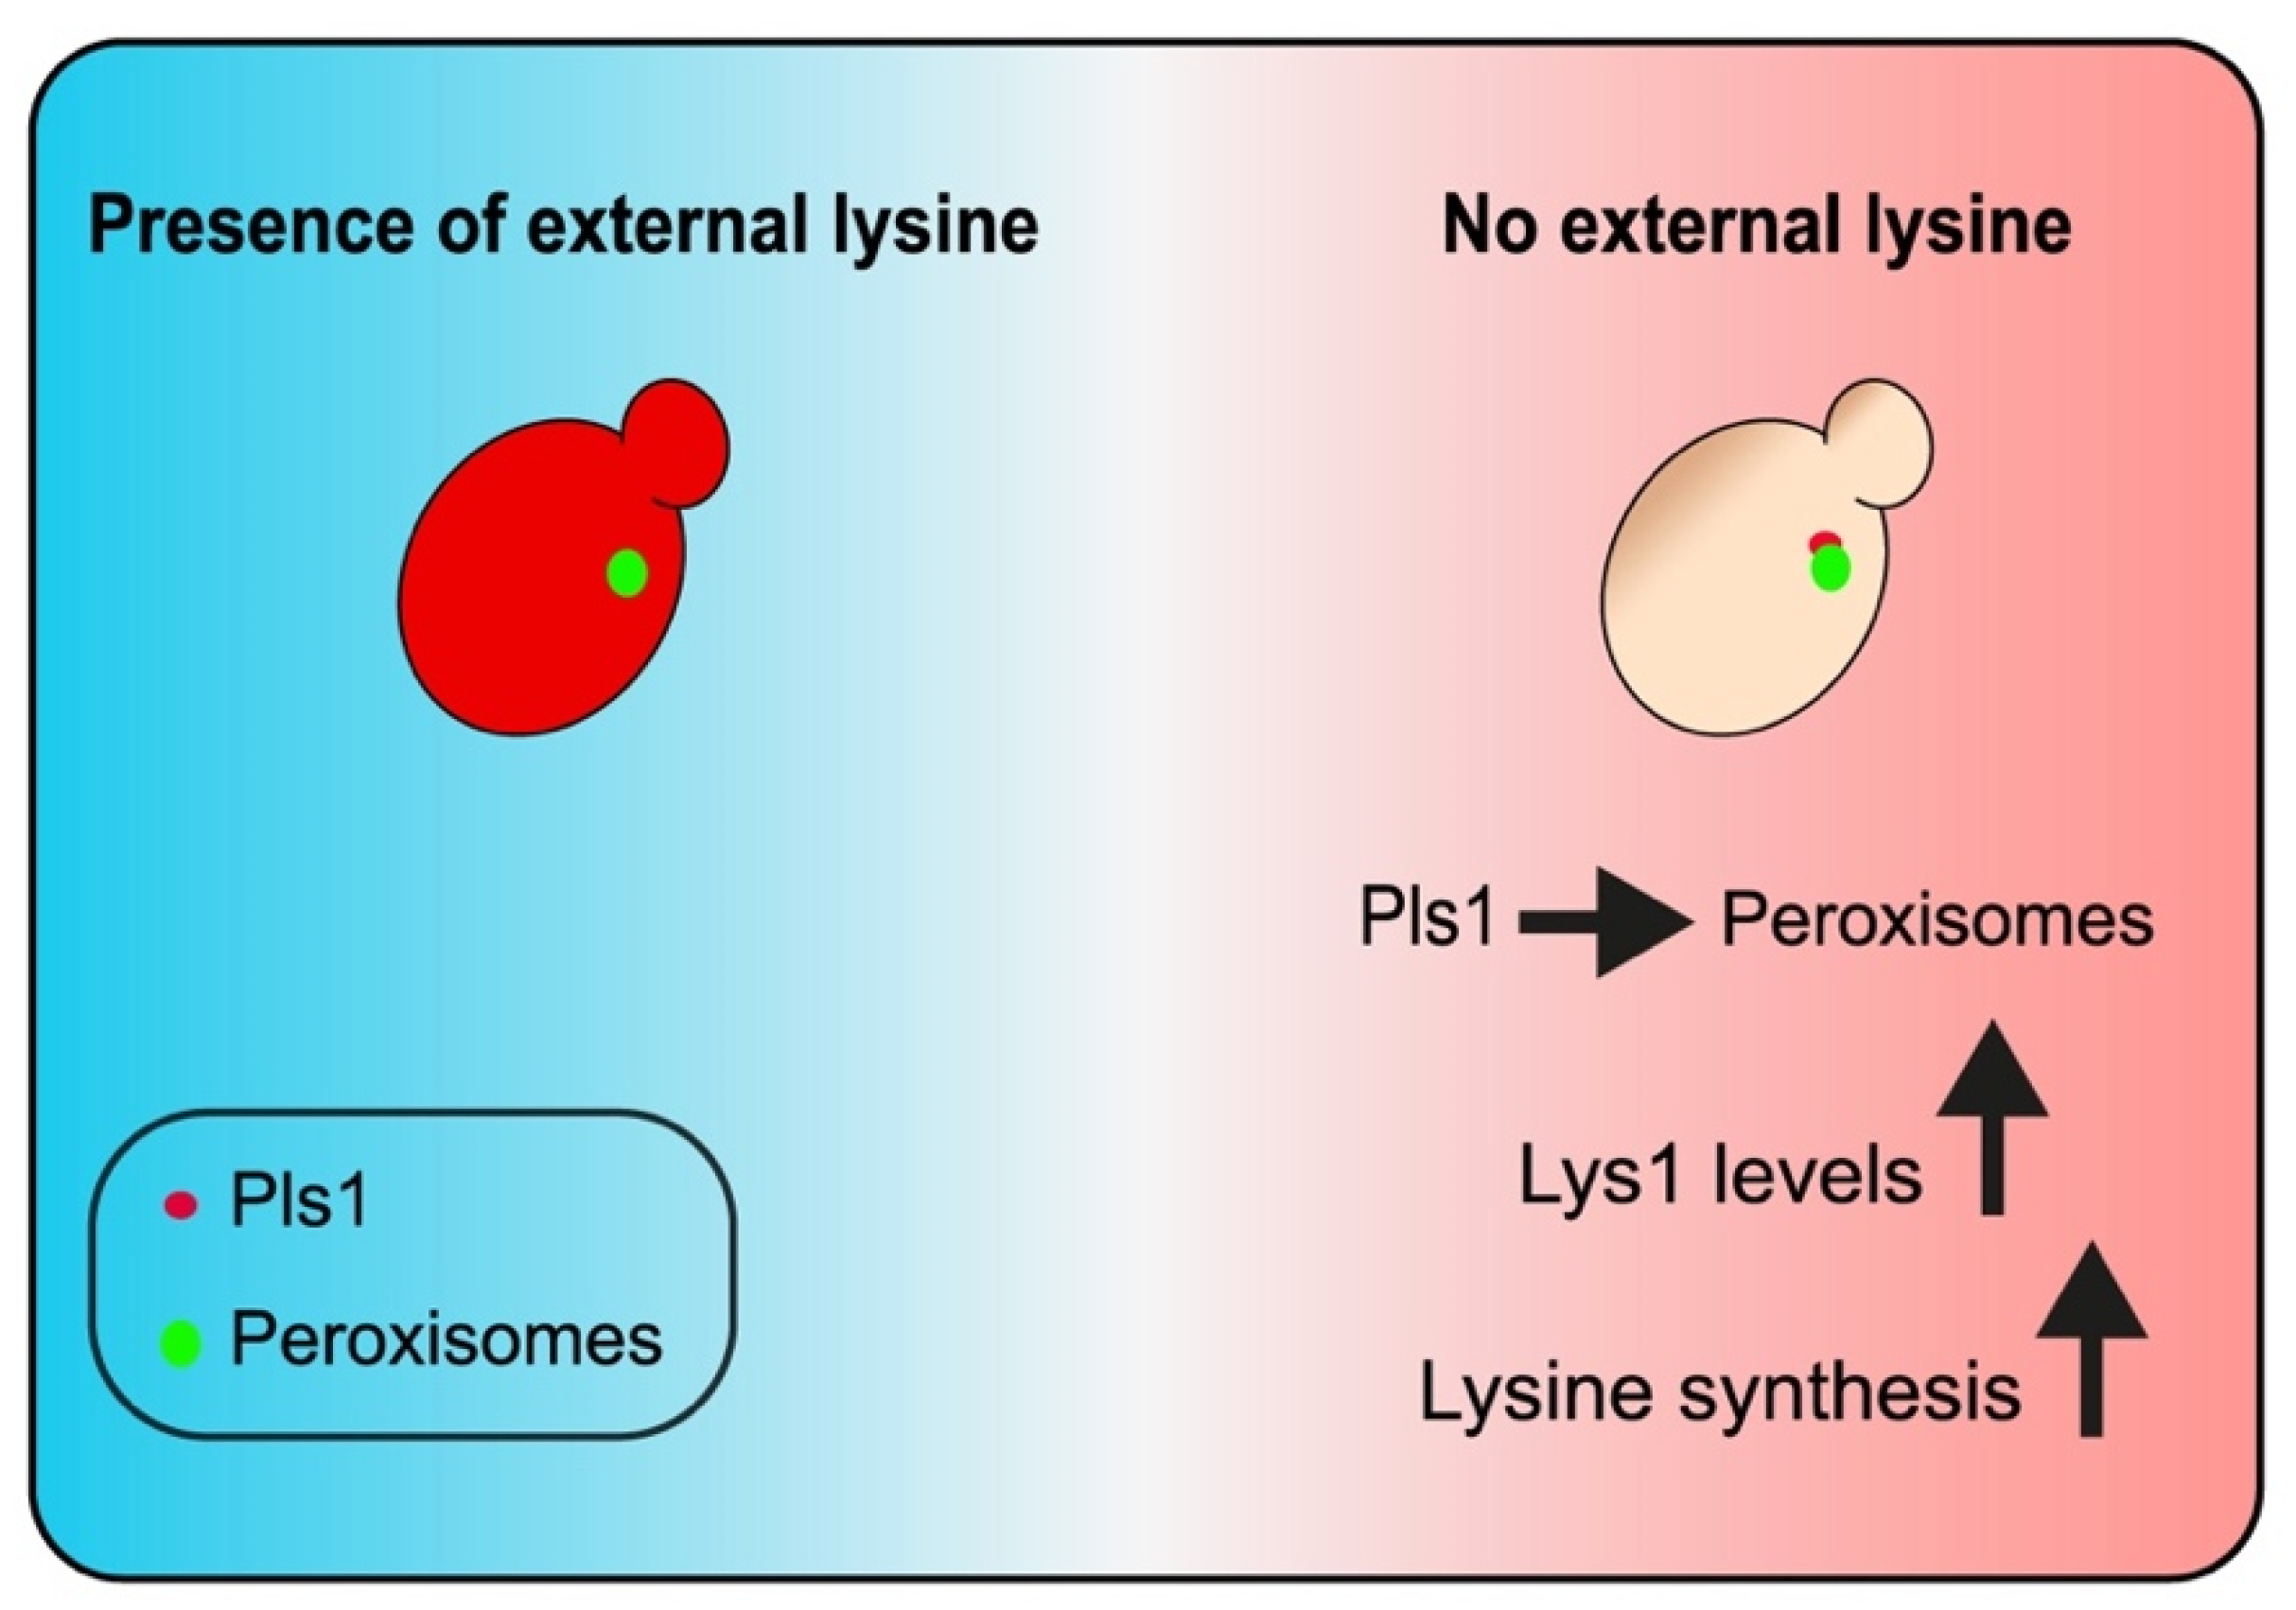
4. Discussion
Supplementary Materials
Author Contributions
Funding
Institutional Review Board Statement
Informed Consent Statement
Data Availability Statement
Acknowledgments
Conflicts of Interest
References
- Islinger, M.; Voelkl, A.; Fahimi, H.D.; Schrader, M. The Peroxisome: An Update on Mysteries 2.0. Histochem. Cell Biol. 2018, 150, 443–471. [Google Scholar] [CrossRef] [Green Version]
- Wanders, R.J.A.; Waterham, H.R.; Ferdinandusse, S. Metabolic Interplay between Peroxisomes and Other Subcellular Organelles Including Mitochondria and the Endoplasmic Reticulum. Front. Cell Dev. Biol. 2016, 3, 83. [Google Scholar] [CrossRef] [Green Version]
- Lodhi, I.J.; Semenkovich, C.F. Peroxisomes: A Nexus for Lipid Metabolism and Cellular Signaling. Cell Metab. 2014, 19, 380–392. [Google Scholar] [CrossRef] [Green Version]
- Yifrach, E.; Chuartzman, S.G.; Dahan, N.; Maskit, S.; Zada, L.; Weill, U.; Yofe, I.; Olender, T.; Schuldiner, M.; Zalckvar, E. Characterization of Proteome Dynamics during Growth in Oleate Reveals a New Peroxisome-Targeting Receptor. J. Cell Sci. 2016, 129, 4067–4075. [Google Scholar]
- Yifrach, E.; Holbrook-Smith, D.; Bürgi, J.; Othman, A.; Eisenstein, M.; Van Roermund, C.W.; Visser, W.; Tirosh, A.; Bibi, C.; Galor, S.; et al. Systematic Multi-Level Analysis of an Organelle Proteome Reveals New Peroxisomal Functions. bioRxiv 2021. [Google Scholar] [CrossRef]
- Walter, T.; Erdmann, R. Current Advances in Protein Import into Peroxisomes. Protein J. 2019, 38, 351–362. [Google Scholar] [CrossRef]
- Shai, N.; Yifrach, E.; van Roermund, C.W.T.; Cohen, N.; Bibi, C.; Ijlst, L.; Cavellini, L.; Meurisse, J.; Schuster, R.; Zada, L.; et al. Systematic Mapping of Contact Sites Reveals Tethers and a Function for the Peroxisome-Mitochondria Contact. Nat. Commun. 2018, 9, 1761. [Google Scholar] [CrossRef]
- Baker Brachmann, C.; Davies, A.; Cost, G.J.; Caputo, E.; Li, J.; Hieter, P.; Boeke, J.D. Designer Deletion Strains Derived from Saccharomyces Cerevisiae S288C: A Useful Set of Strains and Plasmids for PCR-Mediated Gene Disruption and Other Applications. Yeast 1998, 14, 115–132. [Google Scholar] [CrossRef]
- Breslow, D.K.; Cameron, D.M.; Collins, S.R.; Schuldiner, M.; Stewart-Ornstein, J.; Newman, H.W.; Braun, S.; Madhani, H.D.; Krogan, N.J.; Weissman, J.S. A Comprehensive Strategy Enabling High-Resolution Functional Analysis of the Yeast Genome. Nat. Methods 2008, 5, 711–718. [Google Scholar] [CrossRef] [Green Version]
- Yofe, I.; Schuldiner, M. Primers-4-Yeast: A Comprehensive Web Tool for Planning Primers for Saccharomyces Cerevisiae. Yeast 2014, 31, 77–80. [Google Scholar] [CrossRef]
- Gietz, R.D.; Woods, R.A. Yeast Transformation by the LiAc/SS Carrier DNA/PEG Method. Methods Mol. Biol. 2006, 313, 107–120. [Google Scholar]
- Hanscho, M.; Ruckerbauer, D.E.; Chauhan, N.; Hofbauer, H.F.; Krahulec, S.; Nidetzky, B.; Kohlwein, S.D.; Zanghellini, J.; Natter, K. Nutritional Requirements of the BY Series of Saccharomyces Cerevisiae Strains for Optimum Growth. FEMS Yeast Res. 2012, 12, 796–808. [Google Scholar] [CrossRef] [Green Version]
- Tong, A.H.Y.; Boone, C. Synthetic Genetic Array Analysis in Saccharomyces Cerevisiae. Methods Mol. Biol. 2006, 313, 171–191. [Google Scholar]
- Cohen, Y.; Schuldiner, M. Advanced Methods for High-Throughput Microscopy Screening of Genetically Modified Yeast Libraries. In Network Biology; Humana Press: Totowa, NJ, USA, 2011; pp. 127–159. [Google Scholar]
- Castro, I.G.; Shortill, S.P.; Dziurdzik, S.K.; Cadou, A.; Ganesan, S.; Fenech, E.J.; Meyer, H.; Fadel, A.; David, Y.; Davey, M.; et al. Systematic Analysis of Membrane Contact Sites in Saccharomyces Cerevisiae Uncovers Modulators of Cellular Lipid Distribution. bioRxiv 2021, 2021. [Google Scholar] [CrossRef]
- Yofe, I.; Weill, U.; Meurer, M.; Chuartzman, S.; Zalckvar, E.; Goldman, O.; Ben-Dor, S.; Schütze, C.; Wiedemann, N.; Knop, M.; et al. One Library to Make Them All: Streamlining the Creation of Yeast Libraries via a SWAp-Tag Strategy. Nat. Methods 2016, 13, 371–378. [Google Scholar] [CrossRef] [Green Version]
- Weill, U.; Yofe, I.; Sass, E.; Stynen, B.; Davidi, D.; Natarajan, J.; Ben-Menachem, R.; Avihou, Z.; Goldman, O.; Harpaz, N.; et al. Genome-Wide SWAp-Tag Yeast Libraries for Proteome Exploration. Nat. Methods 2018, 15, 617–622. [Google Scholar] [CrossRef]
- Breker, M.; Gymrek, M.; Schuldiner, M. A Novel Single-Cell Screening Platform Reveals Proteome Plasticity during Yeast Stress Responses. J. Cell Biol. 2013, 200, 839–850. [Google Scholar] [CrossRef] [Green Version]
- Schindelin, J.; Arganda-Carreras, I.; Frise, E.; Kaynig, V.; Longair, M.; Pietzsch, T.; Preibisch, S.; Rueden, C.; Saalfeld, S.; Schmid, B.; et al. Fiji: An Open-Source Platform for Biological-Image Analysis. Nat. Methods 2012, 9, 676–682. [Google Scholar] [CrossRef] [Green Version]
- Hsiao, J.J.; Potter, O.G.; Chu, T.W.; Yin, H. Improved LC/MS Methods for the Analysis of Metal-Sensitive Analytes Using Medronic Acid as a Mobile Phase Additive. Anal. Chem. 2018, 90, 9457–9464. [Google Scholar] [CrossRef]
- Adams, K.J.; Pratt, B.; Bose, N.; Dubois, L.G.; St John-Williams, L.; Perrott, K.M.; Ky, K.; Kapahi, P.; Sharma, V.; Maccoss, M.J.; et al. Skyline for Small Molecules: A Unifying Software Package for Quantitative Metabolomics. J. Proteome Res. 2020, 19, 1447–1458. [Google Scholar] [CrossRef]
- Camacho, C.; Coulouris, G.; Avagyan, V.; Ma, N.; Papadopoulos, J.; Bealer, K.; Madden, T.L. BLAST+: Architecture and Applications. BMC Bioinform. 2009, 10, 421. [Google Scholar] [CrossRef] [Green Version]
- Guindon, S.; Dufayard, J.F.; Lefort, V.; Anisimova, M.; Hordijk, W.; Gascuel, O. New Algorithms and Methods to Estimate Maximum-Likelihood Phylogenies: Assessing the Performance of PhyML 3.0. Syst. Biol. 2010, 59, 307–321. [Google Scholar] [CrossRef] [Green Version]
- Schneider, T.D.; Stephens, R.M. Sequence Logos: A New Way to Display Consensus Sequences. Nucleic Acids Res. 1990, 18, 6097–6100. [Google Scholar] [CrossRef]
- Henikoff, S.; Henikoff, J.G.; Alford, W.J.; Pietrokovski, S. Automated Construction and Graphical Presentation of Protein Blocks from Unaligned Sequences. Gene 1995, 163, GC17–GC26. [Google Scholar] [CrossRef]
- Venne, A.S.; Vögtle, F.N.; Meisinger, C.; Sickmann, A.; Zahedi, R.P. Novel Highly Sensitive, Specific, and Straightforward Strategy for Comprehensive N-Terminal Proteomics Reveals Unknown Substrates of the Mitochondrial Peptidase Icp55. J. Proteome Res. 2013, 12, 3823–3830. [Google Scholar] [CrossRef]
- Jin, Y.; Eves, P.T.; Tang, F.; Weisman, L.S. PTC1 Is Required for Vacuole Inheritance and Promotes the Association of the Myosin-V Vacuole-Specific Receptor Complex. Mol. Biol. Cell 2009, 20, 1312–1323. [Google Scholar] [CrossRef] [Green Version]
- Roeder, A.D.; Hermann, G.J.; Keegan, B.R.; Thatcher, S.A.; Shaw, J.M. Mitochondrial Inheritance Is Delayed in Saccharomyces Cerevisiae Cells Lacking the Serine/Threonine Phosphatase PTC1. Mol. Biol. Cell 1998, 9, 917–930. [Google Scholar] [CrossRef] [Green Version]
- Nötzel, C.; Lingner, T.; Klingenberg, H.; Thoms, S. Identification of New Fungal Peroxisomal Matrix Proteins and Revision of the PTS1 Consensus. Traffic 2016, 17, 1110–1124. [Google Scholar] [CrossRef]
- Stehlik, T.; Kremp, M.; Kahnt, J.; Bölker, M.; Freitag, J. Peroxisomal Targeting of a Protein Phosphatase Type 2C via Mitochondrial Transit. Nat. Commun. 2020, 11, 2355. [Google Scholar] [CrossRef]
- Sivars, U.; Aivazian, D.; Pfeffer, S.R. Yip3 Catalyses the Dissociation of Endosomal Rab–GDI Complexes. Nature 2003, 425, 856–859. [Google Scholar] [CrossRef]
- Huber, P.A.J.; Birdsey, G.M.; Lumb, M.J.; Prowse, D.T.R.; Perkins, T.J.; Knight, D.R.; Danpure, C.J. Peroxisomal Import of Human Alanine:Glyoxylate Aminotransferase Requires Ancillary Targeting Information Remote from Its C Terminus. J. Biol. Chem. 2005, 280, 27111–27120. [Google Scholar] [CrossRef] [PubMed] [Green Version]
- Weill, U.; Cohen, N.; Fadel, A.; Ben-Dor, S.; Schuldiner, M. Protein Topology Prediction Algorithms Systematically Investigated in the Yeast Saccharomyces Cerevisiae. BioEssays 2019, 41, 1800252. [Google Scholar] [CrossRef] [PubMed] [Green Version]
- Gould, S.J.; Keller, G.A.; Subramani, S. Identification of a Peroxisomal Targeting Signal at the Carboxy Terminus of Firefly Luciferase. J. Cell Biol. 1987, 105, 2923–2931. [Google Scholar] [CrossRef] [Green Version]
- Pransens, M.; Breese, C.; Baumgart, E.; Vanhoorenj, J.C.T.; Baes, M.; Mannaerts, G.P.; Van Veldhoven, P.P. Identification and Characterization of the Putative Human Peroxisomal C-Terminal Targeting Signal Import Receptor. J. Biol. Chem. 1995, 270, 7731–7736. [Google Scholar]
- Swinkels, B.W.; Gould, S.J.; Bodnar, A.G.; Rachubinski, R.A.; Subramani, S. A Novel, Cleavable Peroxisomal Targeting Signal at the Amino-Terminus of the Rat 3-Ketoacyl-CoA Thiolase. EMBO J. 1991, 10, 3255–3262. [Google Scholar] [CrossRef]
- Effelsberg, D.; Cruz-Zaragoza, L.D.; Schliebs, W.; Erdmann, R. Pex9p Is a New Yeast Peroxisomal Import Receptor for PTS1-Containing Proteins. J. Cell Sci. 2016, 129, 4057–4066. [Google Scholar]
- Purdue, P.E.; Yang, X.; Lazarow, P.B. Pex18p and Pex21p, a Novel Pair of Related Peroxins Essential for Peroxisomal Targeting by the PTS2 Pathway. J. Cell Biol. 1998, 143, 1859–1869. [Google Scholar] [CrossRef] [Green Version]
- Kempiński, B.; Chełstowska, A.; Poznański, J.; Król, K.; Rymer, Ł.; Frydzińska, Z.; Girzalsky, W.; Skoneczna, A.; Erdmann, R.; Skoneczny, M. The Peroxisomal Targeting Signal 3 (PTS3) of the Budding Yeast Acyl-CoA Oxidase Is a Signal Patch. Front. Cell Dev. Biol. 2020, 8, 198. [Google Scholar] [CrossRef]
- Montilla-Martinez, M.; Beck, S.; Klümper, J.; Meinecke, M.; Schliebs, W.; Wagner, R.; Erdmann, R. Distinct Pores for Peroxisomal Import of PTS1 and PTS2 Proteins. Cell Rep. 2015, 13, 2126–2134. [Google Scholar] [CrossRef] [Green Version]
- Kong, J.; Ji, Y.; Jeon, Y.G.; Han, J.S.; Han, K.H.; Lee, J.H.; Lee, G.; Jang, H.; Choe, S.S.; Baes, M.; et al. Spatiotemporal Contact between Peroxisomes and Lipid Droplets Regulates Fasting-Induced Lipolysis via PEX5. Nat. Commun. 2020, 11, 578. [Google Scholar] [CrossRef]
- Pfeffer, S.; Aivazian, D. Targeting Rab GTPases to Distinct Membrane Compartments. Nat. Rev. Mol. Cell Biol. 2004, 5, 886–896. [Google Scholar] [CrossRef] [PubMed]
- Parenteau, J.; Maignon, L.; Berthoumieux, M.; Catala, M.; Gagnon, V.; Abou Elela, S. Introns Are Mediators of Cell Response to Starvation. Nature 2019, 565, 612–617. [Google Scholar] [CrossRef] [PubMed]
- Abdul-Ghani, M.; Gougeon, P.Y.; Prosser, D.C.; Da-Silva, L.F.; Ngsee, J.K. PRA Isoforms Are Targeted to Distinct Membrane Compartments. J. Biol. Chem. 2001, 276, 6225–6233. [Google Scholar] [CrossRef] [PubMed] [Green Version]
- Malagnac, F.; Fabret, C.; Prigent, M.; Rousset, J.P.; Namy, O.; Silar, P. Rab-GDI Complex Dissociation Factor Expressed through Translational Frameshifting in Filamentous Ascomycetes. PLoS ONE 2013, 8, e73772. [Google Scholar] [CrossRef] [PubMed]
- Parky, D.; Morrisy, A.R.; Battenhouse, A.; Iyer, V.R. Simultaneous Mapping of Transcript Ends at Single-Nucleotide Resolution and Identification of Widespread Promoter-Associated Non-Coding RNA Governed by TATA Elements. Nucleic Acids Res. 2014, 42, 3736–3749. [Google Scholar] [CrossRef] [PubMed]
- Johnson, L.J.; Koufopanou, V.; Goddard, M.R.; Hetherington, R.; Schäfer, S.M.; Burt, A. Population Genetics of the Wild Yeast Saccharomyces Paradoxus. Genetics 2004, 166, 43–52. [Google Scholar] [CrossRef] [Green Version]
- Glover, J.R.; Andrews, D.W.; Rachubinski, R.A. Saccharomyces Cerevisiae Peroxisomal Thiolase Is Imported as a Dimer. Proc. Natl. Acad. Sci. USA 1994, 91, 10541–10545. [Google Scholar] [CrossRef] [Green Version]
- McNew, J.A.; Goodman, J.M. An Oligomeric Protein Is Imported into Peroxisomes in Vivo. J. Cell Biol. 1994, 127, 1245–1257. [Google Scholar] [CrossRef] [Green Version]
- Al-Saryi, N.A.; Al-Hejjaj, M.Y.; Van Roermund, C.W.T.; Hulmes, G.E.; Ekal, L.; Payton, C.; Wanders, R.J.A.; Hettema, E.H. Two NAD-Linked Redox Shuttles Maintain the Peroxisomal Redox Balance in Saccharomyces Cerevisiae. Sci. Rep. 2017, 7, 11868. [Google Scholar] [CrossRef] [Green Version]
- Rosenthal, M.; Metzl-Raz, E.; Bürgi, J.; Yifrach, E.; Drwesh, L.; Fadel, A.; Peleg, Y.; Rapaport, D.; Wilmanns, M.; Barkai, N.; et al. Uncovering Targeting Priority to Yeast Peroxisomes Using an In-Cell Competition Assay. Proc. Natl. Acad. Sci. USA 2020, 117, 21432–21440. [Google Scholar] [CrossRef]
- Xu, H.; West, A.H.; Cook, P.F. Overall Kinetic Mechanism of Saccharopine Dehydrogenase from Saccharomyces Cerevisiae. Biochemistry 2006, 45, 12156–12166. [Google Scholar] [CrossRef] [PubMed]
- Chen, X.; Williams, C.; Chen, X.; Williams, Á.C. Fungal Peroxisomes Proteomics. Subcell. Biochem. 2018, 89, 67–83. [Google Scholar] [PubMed]
- Erpf, P.E.; Fraser, J.A. The Long History of the Diverse Roles of Short ORFs: SPEPs in Fungi. Proteomics 2018, 18, 1700219. [Google Scholar] [CrossRef] [PubMed]
- Guerra-Almeida, D.; Tschoeke, D.A.; Nunes-Da-Fonseca, R. Understanding Small ORF Diversity through a Comprehensive Transcription Feature Classification. DNA Res. 2021, 28, dsab007. [Google Scholar] [CrossRef] [PubMed]
- Makarewich, C.A.; Olson, E.N. Mining for Micropeptides. Trends Cell Biol. 2017, 27, 685–696. [Google Scholar] [CrossRef]
- Chubukov, V.; Zuleta, I.A.; Li, H. Regulatory Architecture Determines Optimal Regulation of Gene Expression in Metabolic Pathways. Proc. Natl. Acad. Sci. USA 2012, 109, 5127–5132. [Google Scholar] [CrossRef] [Green Version]
- Mashahreh, B.; Armony, S.; Johansson, K.E.; Chapelbaum, A.; Friedman, N.; Gardner, R.G.; Hartmann-Petersen, R.; Lindorff-Larsen, K.; Ravid, T. Conserved Degronome Features Governing Quality Control-Associated Proteolysis. bioRxiv 2022. [Google Scholar] [CrossRef]
- Mayor, T.; Lipford, J.R.; Graumann, J.; Smith, G.T.; Deshaies, R.J. Analysis of Polybiquitin Conjugates Reveals That the Rpn10 Substrate Receptor Contributes to the Turnover of Multiple Proteasome Targets. Mol. Cell. Proteom. 2005, 4, 741–751. [Google Scholar] [CrossRef] [Green Version]
- Mayor, T.; Graumann, J.; Bryan, J.; MacCoss, M.J.; Deshaies, R.J. Quantitative Profiling of Ubiquitylated Proteins Reveals Proteasome Substrates and the Substrate Repertoire Influenced by the Rpn10 Receptor Pathway. Mol. Cell. Proteom. 2007, 6, 1885–1895. [Google Scholar] [CrossRef] [Green Version]
- Kumar, V.P.; Thomas, L.M.; Bobyk, K.D.; Andi, B.; Cook, P.F.; West, A.H. Evidence in Support of Lysine 77 and Histidine 96 as Acid–Base Catalytic Residues in Saccharopine Dehydrogenase from Saccharomyces Cerevisiae. Biochemistry 2012, 51, 857–866. [Google Scholar] [CrossRef] [Green Version]
- Jumper, J.; Evans, R.; Pritzel, A.; Green, T.; Figurnov, M.; Ronneberger, O.; Tunyasuvunakool, K.; Bates, R.; Žídek, A.; Potapenko, A.; et al. Highly Accurate Protein Structure Prediction with AlphaFold. Nature 2021, 596, 583–589. [Google Scholar] [CrossRef] [PubMed]
- Varadi, M.; Anyango, S.; Deshpande, M.; Nair, S.; Natassia, C.; Yordanova, G.; Yuan, D.; Stroe, O.; Wood, G.; Laydon, A.; et al. AlphaFold Protein Structure Database: Massively Expanding the Structural Coverage of Protein-Sequence Space with High-Accuracy Models. Nucleic Acids Res. 2022, 50, D439–D444. [Google Scholar] [CrossRef] [PubMed]
- Ben-Shimon, A.; Eisenstein, M. Computational Mapping of Anchoring Spots on Protein Surfaces. J. Mol. Biol. 2010, 402, 259–277. [Google Scholar] [CrossRef] [PubMed]
- Ekanayake, D.K.; Andi, B.; Bobyk, K.D.; West, A.H.; Cook, P.F. Glutamates 78 and 122 in the Active Site of Saccharopine Dehydrogenase Contribute to Reactant Binding and Modulate the Basicity of the Acid-Base Catalysts. J. Biol. Chem. 2010, 285, 20756–20768. [Google Scholar] [CrossRef] [PubMed] [Green Version]
- Ljungdahl, P.O.; Daignan-Fornier, B. Regulation of Amino Acid, Nucleotide, and Phosphate Metabolism in Saccharomyces Cerevisiae. Genetics 2012, 190, 885–929. [Google Scholar] [CrossRef] [PubMed] [Green Version]
- Olin-Sandoval, V.; Yu, J.S.L.; Miller-Fleming, L.; Alam, M.T.; Kamrad, S.; Correia-Melo, C.; Haas, R.; Segal, J.; Peña Navarro, D.A.; Herrera-Dominguez, L.; et al. Lysine Harvesting Is an Antioxidant Strategy and Triggers Underground Polyamine Metabolism. Nature 2019, 572, 249–253. [Google Scholar] [CrossRef]
- O’Doherty, P.J.; Lyons, V.; Tun, N.M.; Rogers, P.J.; Bailey, T.D.; Wu, M.J. Transcriptomic and Biochemical Evidence for the Role of Lysine Biosynthesis against Linoleic Acid Hydroperoxide-Induced Stress in Saccharomyces Cerevisiae. Free Radic. Res. 2014, 48, 1454–1461. [Google Scholar] [CrossRef]
- Stephen, D.W.S.; Jamieson, D.J. Amino Acid-Dependent Regulation of the Saccharomyces Cerevisiae GSH1 Gene by Hydrogen Peroxide. Mol. Microbiol. 1997, 23, 203–210. [Google Scholar] [CrossRef]
- Eisler, H.; Fröhlich, K.U.; Heidenreich, E. Starvation for an Essential Amino Acid Induces Apoptosis and Oxidative Stress in Yeast. Exp. Cell Res. 2004, 300, 345–353. [Google Scholar] [CrossRef]
- Takagi, H.; Iwamoto, F.; Nakamori, S. Isolation of Freeze-Tolerant Laboratory Strains of Saccharomyces Cerevisiae from Proline-Analogue-Resistant Mutants. Appl Microbiol. Biotechnol. 1997, 47, 405–411. [Google Scholar] [CrossRef]
- Ehmann, D.E.; Gehring, A.M.; Walsh, C.T. Lysine Biosynthesis in Saccharomyces Cerevisiae: Mechanism of α-Aminoadipate Reductase (Lys2) Involves Posttranslational Phosphopantetheinylation by Lys5. Biochemistry 1999, 38, 6171–6177. [Google Scholar] [CrossRef] [PubMed]
- Natarajan, K.; Meyer, M.R.; Jackson, B.M.; Slade, D.; Roberts, C.; Hinnebusch, A.G.; Marton, M.J. Transcriptional Profiling Shows That Gcn4p Is a Master Regulator of Gene Expression during Amino Acid Starvation in Yeast. Mol. Cell. Biol. 2001, 21, 4347–4368. [Google Scholar] [CrossRef] [PubMed] [Green Version]
- Nishida, H.; Nishiyama, M. What Is Characteristic of Fungal Lysine Synthesis Through The-Aminoadipate Pathway? J. Mol. Evol. 2000, 51, 299–302. [Google Scholar] [CrossRef] [PubMed]
- Quezada, H.; Aranda, C.; DeLuna, A.; Hernández, H.; Calcagno, M.L.; Marín-Hernández, Á.; González, A. Specialization of the Paralogue LYS21 Determines Lysine Biosynthesis under Respiratory Metabolism in Saccharomyces Cerevisiae. Microbiology 2008, 154, 1656–1667. [Google Scholar] [CrossRef] [PubMed] [Green Version]
- Longtine, M.S.; Iii, K.; Demarini, D.J.; Shah, N.G.; Wach, A.; Brachat, A.; Philippsen, P.; Pringle, J.R. Additional Modules for Versatile and Economical PCR-Based Gene Deletion and Modification in Saccharomyces Cerevisiae. Yeast 1998, 14, 953–961. [Google Scholar] [CrossRef]
- Janke, C.; Magiera, M.M.; Rathfelder, N.; Taxis, C.; Reber, S.; Maekawa, H.; Moreno-Borchart, A.; Doenges, G.; Schwob, E.; Schiebel, E.; et al. A Versatile Toolbox for PCR-Based Tagging of Yeast Genes: New Fluorescent Proteins, More Markers and Promoter Substitution Cassettes. Yeast 2004, 21, 947–962. [Google Scholar] [CrossRef]


Publisher’s Note: MDPI stays neutral with regard to jurisdictional claims in published maps and institutional affiliations. |
© 2022 by the authors. Licensee MDPI, Basel, Switzerland. This article is an open access article distributed under the terms and conditions of the Creative Commons Attribution (CC BY) license (https://creativecommons.org/licenses/by/4.0/).
Share and Cite
David, Y.; Castro, I.G.; Yifrach, E.; Bibi, C.; Katawi, E.; Yahav Har-Shai, D.; Brodsky, S.; Barkai, N.; Ravid, T.; Eisenstein, M.; et al. Pls1 Is a Peroxisomal Matrix Protein with a Role in Regulating Lysine Biosynthesis. Cells 2022, 11, 1426. https://doi.org/10.3390/cells11091426
David Y, Castro IG, Yifrach E, Bibi C, Katawi E, Yahav Har-Shai D, Brodsky S, Barkai N, Ravid T, Eisenstein M, et al. Pls1 Is a Peroxisomal Matrix Protein with a Role in Regulating Lysine Biosynthesis. Cells. 2022; 11(9):1426. https://doi.org/10.3390/cells11091426
Chicago/Turabian StyleDavid, Yotam, Inês Gomes Castro, Eden Yifrach, Chen Bibi, Enas Katawi, Dekel Yahav Har-Shai, Sagie Brodsky, Naama Barkai, Tommer Ravid, Miriam Eisenstein, and et al. 2022. "Pls1 Is a Peroxisomal Matrix Protein with a Role in Regulating Lysine Biosynthesis" Cells 11, no. 9: 1426. https://doi.org/10.3390/cells11091426