Article

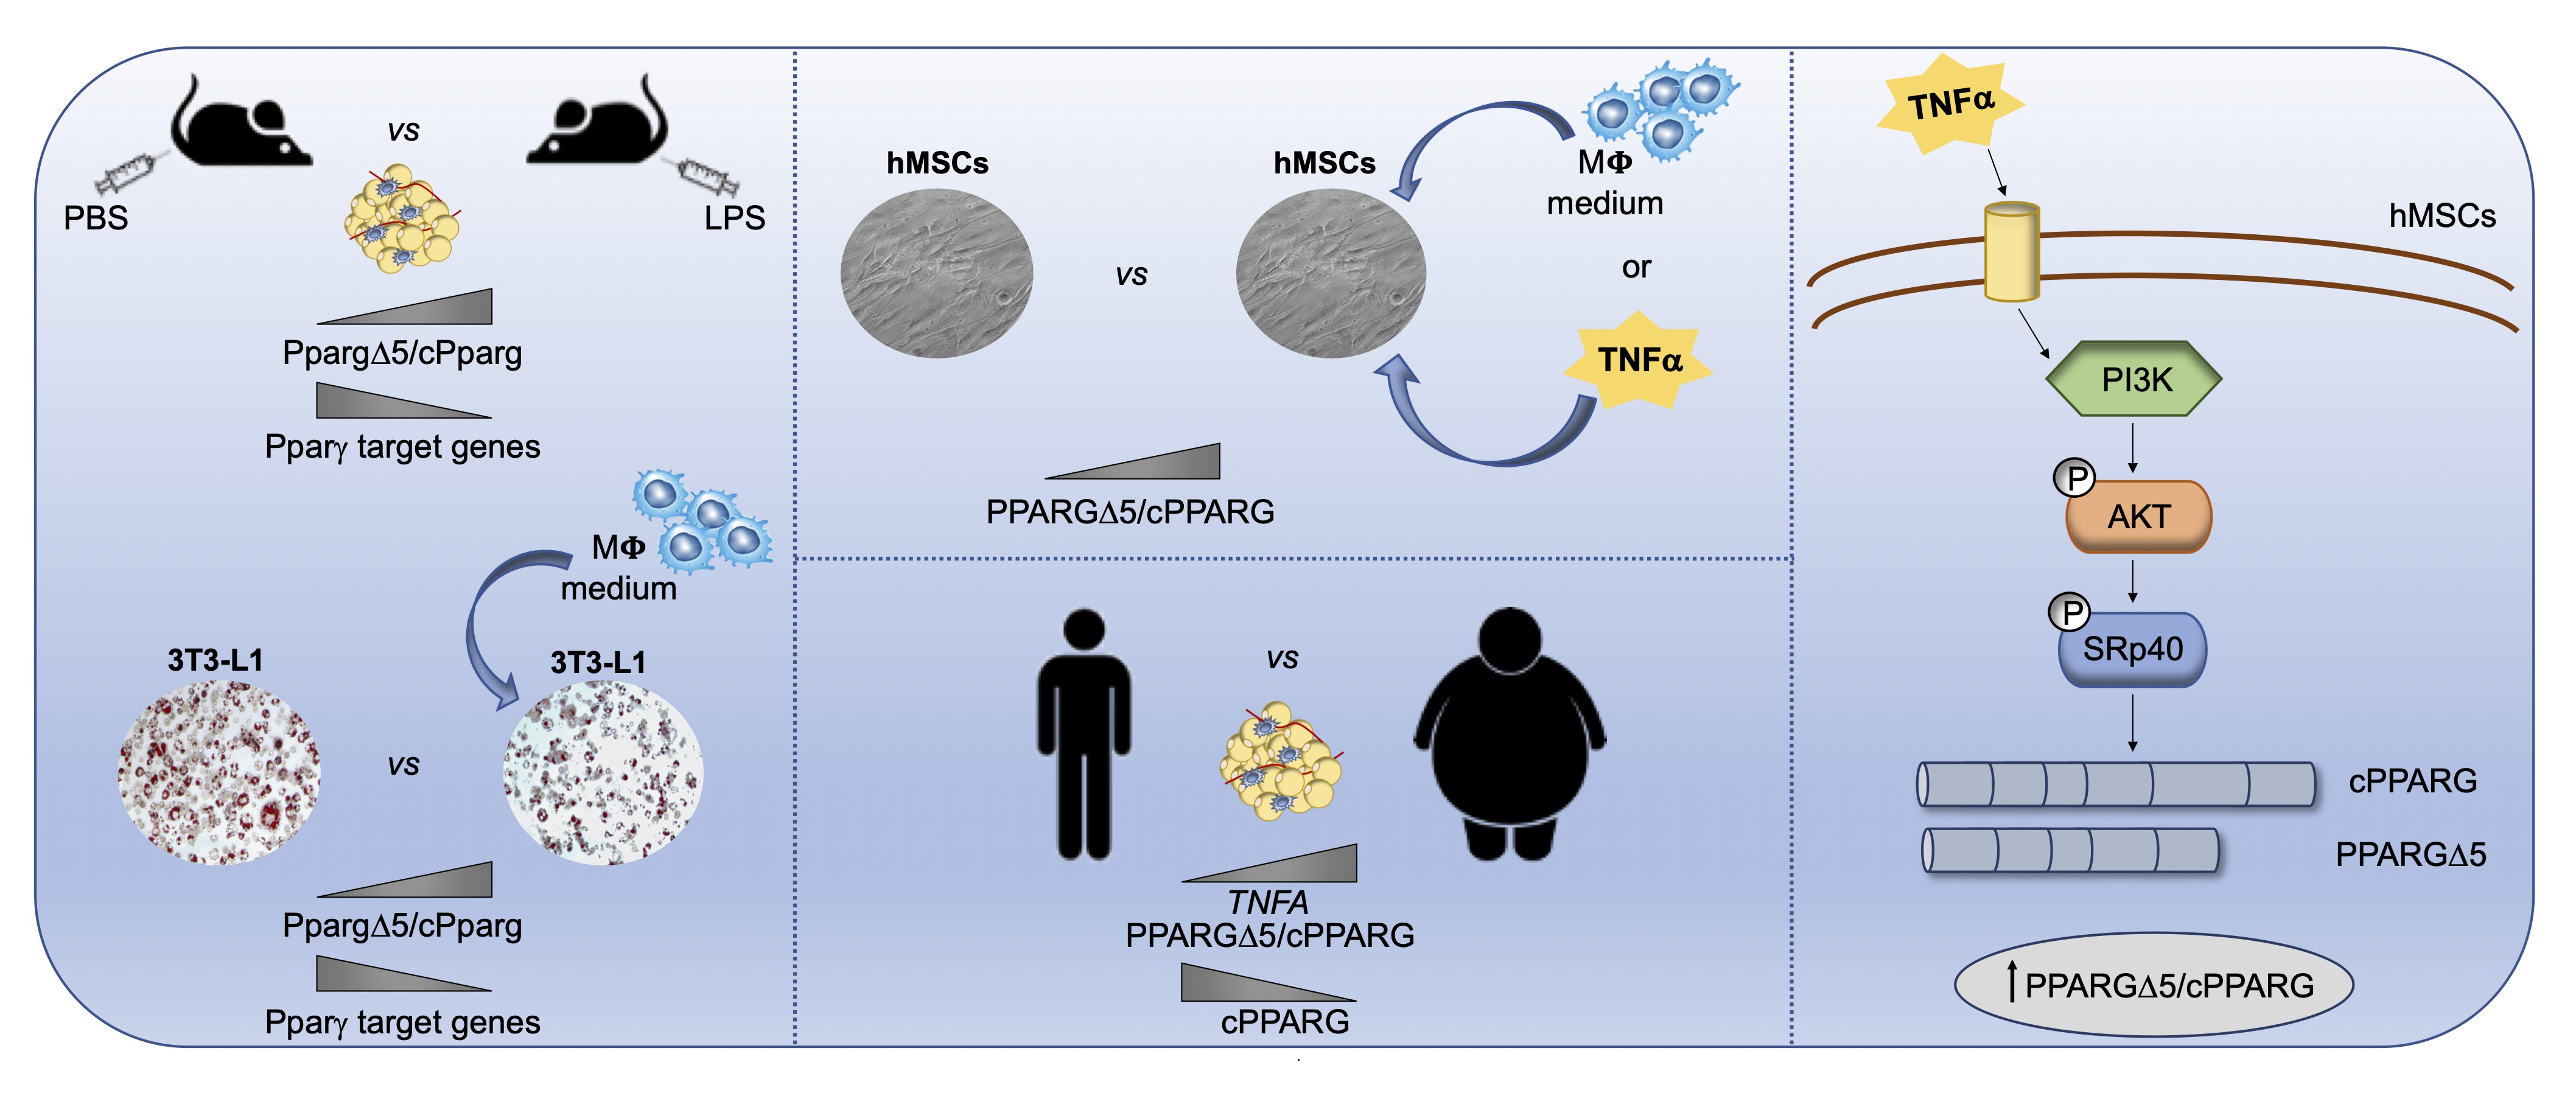
TNFα Mediates Inflammation-Induced Effects on PPARG Splicing in Adipose Tissue and Mesenchymal Precursor Cells

1
Institute of Genetics and Biophysics ‘‘Adriano Buzzati-Traverso’’, CNR, Via P. Castellino 111, 80131 Naples, Italy
2
Institute of Biochemistry and Cell Biology, CNR, Via P. Castellino 111, 80131 Naples, Italy
3
Université Côte d’Azur, Inserm UMR1065, C3M, Team Cellular and Molecular Pathophysiology of Obesity, 06204 Nice, France
4
Medical Department III-Endocrinology, Nephrology and Rheumatology, University of Leipzig, 04103 Leipzig, Germany
5
Helmholtz Institute for Metabolic, Obesity and Vascular Research (HI-MAG) of the Helmholtz Zentrum München at the University of Leipzig and University Hospital Leipzig, Philipp-Rosenthal-Str. 27, 04103 Leipzig, Germany
6
Department of Science and Technology, University of Naples ‘‘Parthenope’’, 80143 Naples, Italy
*
Author to whom correspondence should be addressed.
These authors contributed equally to this work.
Cells 2022, 11(1), 42; https://doi.org/10.3390/cells11010042
Submission received: 10 August 2021 / Revised: 16 December 2021 / Accepted: 20 December 2021 / Published: 24 December 2021
(This article belongs to the Collection Research on Adipose Stem Cells)

Abstract

:
Low-grade chronic inflammation and reduced differentiation capacity are hallmarks of hypertrophic adipose tissue (AT) and key contributors of insulin resistance. We identified PPARGΔ5 as a dominant-negative splicing isoform overexpressed in the AT of obese/diabetic patients able to impair adipocyte differentiation and PPARγ activity in hypertrophic adipocytes. Herein, we investigate the impact of macrophage-secreted pro-inflammatory factors on PPARG splicing, focusing on PPARGΔ5. We report that the epididymal AT of LPS-treated mice displays increased PpargΔ5/cPparg ratio and reduced expression of Pparg-regulated genes. Interestingly, pro-inflammatory factors secreted from murine and human pro-inflammatory macrophages enhance the PPARGΔ5/cPPARG ratio in exposed adipogenic precursors. TNFα is identified herein as factor able to alter PPARG splicing—increasing PPARGΔ5/cPPARG ratio—through PI3K/Akt signaling and SRp40 splicing factor. In line with in vitro data, TNFA expression is higher in the SAT of obese (vs. lean) patients and positively correlates with PPARGΔ5 levels. In conclusion, our results indicate that inflammatory factors secreted by metabolically-activated macrophages are potent stimuli that modulate the expression and splicing of PPARG. The resulting imbalance between canonical and dominant negative isoforms may crucially contribute to impair PPARγ activity in hypertrophic AT, exacerbating the defective adipogenic capacity of precursor cells.

Graphical Abstract

1. Introduction

Obesity is a chronic, relapsing progressive disease considered a driving force for insulin resistance and type-2 diabetes (T2D) [1,2]. Low-grade chronic inflammation in adipose tissue (AT) crucially contributes to obesity-related metabolic dysfunctions [3,4,5]. Indeed, the energy surplus can induce the enlargement of adipocyte size (hypertrophy), in turn leading to hypoxia, mechanical stress of the extracellular matrix, cell death and the secretion of pro-inflammatory cytokines [6,7,8,9]. These events trigger a chronic inflammatory response, stimulating the infiltration of macrophages (MΦ), T and dendritic cells [3,4,5,9,10]. In turn, the substantial accumulation and polarization of MΦ into pro-inflammatory and metabolically activated cells—associated with qualitative and quantitative genetic and epigenetic remodeling—increases local and systemic levels of cytokines and chemokines, correlated with insulin resistance and T2D (e.g., TNFα, IL-6, IL1β, CCL4) [11,12,13,14,15]. Indeed, MΦ-secreted factors impair the insulin-responsiveness of AT-residing adipocytes [16,17] and the differentiation capacity of mesenchymal adipogenic precursors [12,18]. These molecules reduce the expression and activity of the peroxisome proliferator-activated receptor γ (PPARγ) [19,20,21,22], the master regulator of adipogenesis and metabolic homeostasis [23,24,25,26,27,28]. However, the exact molecular mechanisms determining the functional impairment of PPARγ in insulin-resistant AT have not been fully elucidated. Our recent identification and characterization of PPARγΔ5, a naturally occurring dominant negative isoform of PPARγ generated by exon 5 skipping, revealed a new layer in the regulation of PPARG [29]. Indeed, increased levels of PPARγΔ5—measured in the subcutaneous AT (SAT) of patients with overweight and obesity—impairs the in vitro differentiation ability of adipocyte precursor cells [29]. Increased PPARGΔ5/cPPARG ratio was also measured in our recently generated in vitro model of human hypertrophic-like adipocytes [30]. Moreover, the PPARGΔ5/cPPARG relative amount in the SAT of overweight and obese patients correlated positively with BMI [29] and negatively with SLC2A4 (i.e., GLUT4) mRNA levels [30], suggesting a contribution of PPARγΔ5 in hypertrophic obesity.
Hence, in this work, we investigated whether the balance between canonical and dominant negative PPARγ isoforms is affected by pro-inflammatory factors and if such alteration contributes to the impaired neo-adipogenesis and insulin-resistance in hypertrophic AT. Herein, we demonstrate that MΦ-secreted pro-inflammatory factors affect PPARG splicing, increasing the PPARGΔ5/cPPARG ratio. Notably, we report that TNFα induces the activation of the serine/arginine-rich protein 40 (SRp40) and PI3K/Akt signaling, representing the most powerful inflammatory stimulus able to modulate PPARG expression and splicing. Moreover, TNFA and PPARGΔ5 mRNA levels show a positive correlation in the SAT of obese patients, further supporting PPARG splicing alteration as a feature of inflamed AT. Our work reveals a previously unrecognized role of macrophage-secreted factors on PPARG regulation, indicating the inflammation-mediated alteration of PPARG splicing in adipogenic precursors as a new potential contributor to the defective neo-adipogenesis of hypertrophic adipose tissue.

2. Materials and Methods

2.1. Human Samples

Adipose tissue samples were obtained from donors to the Leipzig Obesity Bio Bank (n = 55; mean age = 57.6 ± 16.7 years; mean BMI = 32.3 ± 9.9 kg/m2) undergoing bariatric surgery [31,32] and available through previously reported collaborations [29,30]. The study has been reviewed and approved by the ethics committee of Leipzig University, Germany (approval numbers: 159-12-21052012 and 017-12-23012012), and carried out in accordance with the Declaration of Helsinki, the Bioethics Convention (Oviedo) and the EU Directive on Clinical Trials (Directive 2001/20/EC). Patients were randomly selected from the human tissue biopsy bank held by Prof. Bluher, with more than 3700 subjects having a wide range of overweight and obesity (BMI range: 13–129 kg/m2), body fat distribution, insulin sensitivity and glucose tolerance. The random selection of samples, as well as the exclusion criteria of individuals were applied as described in Aprile et al. (2018). Briefly, individuals with the following criteria were excluded: age <18 years, obesity secondary to endocrine diseases, gastrointestinal inflammatory diseases, risk of upper gastrointestinal bleeding, mental disorders, previous or current malignancies, habitual consumption of alcohol or drugs. Patients were categorized according to their BMI into three subgroups: lean (BMI ≤ 25 kg/m2; n = 14), overweight (25 < BMI < 30 kg/m2; n = 17) and obesity (BMI ≥ 30 kg/m2; n = 24).

2.2. Animals

Epididymal AT samples were isolated from C57BL/6J mice ip-injected with LPS (2 µg/g of body weight, InvivoGen, San Diego, USA) or with vehicle (NaCL 0.9%) for 5 h. Mice and adipose tissue samples were already described in a previous publication [33]. The study was conducted according to the Principles of Laboratory Animal Care (NIH publication no. 85–23, revised 1985) and the European Union guidelines on animal laboratory care. All procedures were approved by Animal Care Committee of the Faculty of Medicine of Nice-Sophia Antipolis University, Nice, France, and the French ministry of national education (#05116.02 and #201505&9143792_v2).

2.3. Cell Cultures

Human in vitro monocytes, i.e., THP-1 (Cat#TIB-202), hTERT immortalized adipose-derived mesenchymal stem cells (hMSCs; Cat# SCRC4000)were purchased from the American Type Culture Collection (ATCC). HMSCs were cultured in DMEM-F12 (1:1) supplemented with 10% American fetal bovine serum (FBS), 2 mM glutamine, 30 units/mL penicillin and 30 µg/mL streptomycin. THP-1 cells were grown in suspension with RPMI supplemented with 10% American fetal bovine serum (FBS), 2 mmol/L glutamine, 100 units/mL penicillin and 100 units/mL streptomycin.
Human monocytes were isolated from the fresh buffy coats of healthy donors recruited at the Transfusional Center of the Hospital Policlinico at “Federico II” University of Naples (Italy) after informed consent according to the Declaration of Helsinki. PBMCs were obtained by density centrifugation over Ficoll-Paque plus (GE Healthcare, Bio-sciences AB, Uppsala, Sweden), and, subsequently, CD14+ monocytes were isolated from PBMCs using anti-CD14 antibody-bearing magnetic microbeads (Miltenyi Biotec, Bergisch-Gladbach, Germany), according to the manufacturer’s instructions. Primary monocytes were resuspended in RPMI-1640 medium (GIBCO, Life Technologies, Carlsband, CA, USA) containing 5% heat-inactivated human AB serum (Lonza, Pearland, TX, USA) and 50 mg/mL gentamicin (Sigma-Aldrich Inc., St. Louis, MO, USA) and cultured at a density of 0.5 × 10⁶ cells/mL/well in 24-well culture plates (Costar, Corning, NY, USA). The purity of isolated cells was determined microscopically after cytocentrifugation and differential staining with a modified Wright-Giemsa dye (Diff Quik, Medion Diagnostics AG, Düdingen, Switzerland), while viability was determined by trypan blue dye exclusion. Only preparations with >98% purity was used.
The J774A.1 mouse macrophage cell line (Cat#85011428) was obtained from the European Collection of Authenticated Cell Culture and 3T3-L1 mouse fibroblasts (Cat#CL-173TM) from ATCC. J774A.1 cells were cultured in DMEM supplemented with 5% American fetal bovine serum (FBS), 2 mmol/L glutamine, 100 units/mL penicillin and 100 units/mL streptomycin. 3T3-L1 fibroblasts were cultured in DMEM supplemented with 10% of newborn calf serum, 2 mmol/L glutamine, 100 units/mL penicillin and 100 units/mL streptomycin.
All above-mentioned cell cultures, except for 3T3-L1 cells, were maintained in a humidified atmosphere of 95% air and 5% CO2 at 37 °C. 3T3-L1 cells were maintained in a humidified atmosphere of 95% air and 7% CO2 at 37 °C.
All media, sera and antibiotics were purchased from Thermo Fisher Scientific (Waltham, MA, USA).

2.4. Human Adipocyte Differentiation

HMSCs were differentiated in mature adipocytes as previously described [29,30]. Briefly, cells were plated at 3 to 4 × 10³/cm2 density and grown to maximum confluence (i.e., timepoint, T = 0 h). Adipocyte differentiation was induced by alternatively using two different mixes: an adipocyte differentiation induction mix and a maintaining mix (AIM and AMM, respectively). AIM contains insulin 850 nM (Humulin R, Lilly, Indianapolis, IN, USA, Cat#AIC025707011/M), dexamethasone 10 µM (Sigma-Aldrich Inc., St. Louis, MO, USA, Cat#D4902), 3-isobutyl-1-methylXanthine 0.5 µM (Sigma-Aldrich Inc., St. Louis, MO, USA, Cat#I7018), biotin 33 µM (Sigma-Aldrich Inc., St. Louis, MO, USA, Cat#B4639), pantothenate 17 µM (Sigma-Aldrich Inc., St. Louis, MO, USA, Cat#P5155) and rosiglitazone 1 µM (Sigma-Aldrich Inc., St. Louis, MO, USA, Cat#R2408). AMM consists of 850 nM insulin and 1 µM rosiglitazone. Cells reached complete adipocyte differentiation within 19–21 days after the first induction (T = 21 d).

2.5. Differentiation of Primary and InVitro Human Macrophages

THP-1 human monocytes were seeded in a complete culture medium supplemented with 50ng/mL of Phorbol 12-Myristate 13-Acetate (PMA, Sigma-Aldrich Inc, St. Louis, MO, USA, Cat#P8139) at 10 × 106/10 mL density in a 10 cm plate. The medium, containing 50 ng/mL of PMA, was replaced every two days until a complete macrophage differentiation was reached (i.e., 6 days after induction).
In order to generate in vitro monocyte-derived macrophages, fresh primary monocytes—isolated as described above—were cultured for 7 days in complete medium supplemented with 50 ng/mL M-CSF (R&D Systems, Minneapolis, MN) and replaced at day 3. Terminally differentiated macrophages (i.e., 8 days after differentiation induction) were incubated for 24 h in fresh complete medium (i.e., control cells) or supplemented with LPS (10 ng/mL) of Escherichia coli O55:B5 (Sigma-Aldrich Inc., St. Louis, MO, USA) and IFNγ 20 ng/mL (R&D Systems, Minneapolis, MN, USA) for cell activation in pro-inflammatory macrophages or supplemented with IL-10 (20 ng/mL; R&D Systems, Minneapolis, MN, USA) to obtain anti-inflammatory macrophages.

2.6. Conditioned Medium Preparation

The conditioned medium of human macrophages differentiated from THP-1 was obtained stimulating—or not—the cells with LPS (20 ng/mL; Sigma-Aldrich Inc, St. Louis, MO, USA, Cat# L2630) in RPMI supplemented with 0.5% bovine serum albumin. After 24 h, the medium was collected and centrifuged at 1000× g rpm for 10 min, and cell-free supernatant was used for treating hMSCs, as described below. Similarly, the conditioned media of primary macrophages—both pro-inflammatory (i.e., LPS/IFNγ-induced macrophages) and anti-inflammatory (IL10-induced macrophages)—were obtained by collecting supernatants after 24 h of stimulation (as described above) and centrifugation at 1000× g rpm for 10 min at 4 °C. Finally, J774A.1 mouse macrophages were stimulated or not with 0.5 ng/mL of LPS in DMEM supplemented with 5% FBS for 24 h, and the medium was collected and centrifuged at 1300× g rpm for 5 min.

2.7. Murine Adipocyte Differentiation

3T3-L1 mouse fibroblasts were cultured at confluence and induced to differentiate in mature adipocytes by two differentiation mixes. Thus, control (i.e., DMEM-5% FBS or DMEM-5% FBS plus LPS 0.5 ng/mL) or conditioned media (collected from LPS stimulating and not J774A.1 macrophages) were supplemented by isobutyl methylxanthine 0.5 µM (Sigma-Aldrich Inc., St. Louis, MO, USA, Cat# I5879), dexamethasone 0.25 µM (Sigma-Aldrich Inc., St. Louis, MO, USA, Cat# D1756), rosiglitazone 10 µM (Enzo Life Science, Farmingdale, NY, USA, Cat# ALX-350-125) and insulin 5 µg/mL (Humulin, Lilly, Indianapolis, IN, USA, Cat# HI0290). After two days, the cells were treated with insulin (5 µg/mL) and rosiglitazone (10 µM) for an additional two days. Then, fresh medium—i.e., without the adipogenic cocktail—was added until the adipocyte phenotype appeared in more than 90% of the cells (i.e., 8 days after induction) by microscopic visualization.

2.8. Oil Red O Staining

Lipid accumulation was measured by Oil red O staining, as previously described [20,29]. In detail, murine adipocytes (i.e., 8 days after adipogenesis induction) were fixed with 4% paraformaldehyde for 20 min, washed three times with PBS and then stained with Oil red O (Sigma-Aldrich Inc., St. Louis, MO, USA, Cat# O0625) for 15 min. Cells were washed, and Oil red O was eluted by isopropanol 100%. The quantification of accumulated lipids was performed by optical density measurement at 510 nm using the spectrophotometer. The background signal was estimated in undifferentiated cells and subtracted from optical density values. The significance of the differences between the samples was calculated by a two-tailed one sample Student’s t test.

2.9. Cell Treatments

HMSCs (i.e., T = 0 h) or hMSCs-derived mature adipocytes (i.e., T = 21 d after adipocyte-differentiation induction) were treated for 24 h with conditioned medium collected by human macrophages (differentiated from THP-1 as above described) or with RPMI 0.5% BSA supplemented or not with 20 ng/mL LPS, used as control. Moreover, hMSCs (i.e., T = 0 h) were treated for 24 h with culture supernatants of primary not-polarized macrophages or were activated by LPS/IFNγ or IL-10.
To investigate PPARG mRNA half-life, hMSCs were treated for 3 h with 2 or 5 mg/mL of actinomycin D (Sigma-Aldrich Inc., St. Louis, MO, USA, Cat# A1410) in complete culture medium. Cells treated with the vehicle (i.e., dimethyl sulfoxide, DMSO) were used as control.
HMSCs were treated with human recombinant cytokines or with the vehicle (i.e., PBS) in DMEM-F12 supplemented with 1% FBS. Specifically, cells were treated for 24 h (for gene expression analysis) or for 30 min (for protein assays) with 10 ng/mL of IL-6 (Thermo Fisher Scientific, Waltham, MA, USA, Cat# PHC0066), IL-8 (Preprotech, Rocky Hill, NJ, USA, Cat#200-08), IL-1β (Preprotech, Rocky Hill, NJ, USA, Cat# 200-01B) cytokines or increasing doses of TNFα protein (i.e., 5, 10 or 20 ng/mL; SinoBiological, Beijing, China, Cat# 10602-HNAE-50).
Conditioned medium collected by THP-1-derived macrophages was incubated with 0.5 mg/mL of human neutralizing antibody against TNFα (R&D system, Minneapolis, USA, Cat# MAB610-SP) or anti-IgG1 Isotype (R&D system, Minneapolis, MN, USA, Cat# MAB002) for 2 h at 4 °C. Then, the medium supplemented with antibodies was added to hMSCs for 24 h for mRNA expression analysis and 30 min for protein assays. Cells treated with RPMI 0.5% BSA plus anti-IgG1 Isotype were used as control.
Moreover, hMSCs were treated for 2 h with DMEM 1% FBS supplemented with 300nM of Wortmannin (Thermo Fisher Scientific, Waltham, Massachusetts, USA, Cat# PHZ1301), KHCB19 (Santa Cruz Biotechnology, Dallas, TX, USA, Cat# 1354037-26-5) or the vehicle (i.e., DMSO). Then, cells were exposed to fresh medium supplemented with 10 nM of Wortmannin/KHCB19/vehicle and human recombinant TNFα protein (10 or 20 ng/mL) for an additional 30 min to analyze protein phosphorylation or 24 h for mRNA expression analysis.
In addition, hMSCs were treated for 24 h with conditioned medium collected from THP-1-derived macrophages plus SRPIN340 10 µM (StressMarq Biosciences Inc., Victoria, Canada, SIH-514, Cat# 218156-96-8) or with the vehicle (i.e., DMSO).
3T3-L1 mouse fibroblasts (i.e., T = 0 h) were exposed for 24 h to DMEM-1% FBS supplemented with 10 µg/mL of mouse recombinant TNFα (Preprotech, Rocky Hill, NJ, USA, Cat# 315-01A), IL-1β (Preprotech, Rocky Hill, NJ, USA, Cat# 211-11B) cytokines or with the vehicle (i.e., PBS).
For all treatments, cells were starved for 18 h with culture medium without serum.

2.10. Cell Transfection

HMSCs were transfected with two different siRNAs designed against SRSF5 (IDT, Coralville, Johnson County, IA, USA, hs.Ri.SRSF5.13.1) or with scrambled siRNAs, by using Lipofectamine 3000 (Thermo Fisher Scientific, Waltham, Massachusetts, MN, USA, Cat# L3000001), according to the manufacturer’s instructions. Cell transfection was carried out in culture medium without antibiotics and serum. After 6 h, transfected cells were fed with medium supplemented with 10% FBS. The efficiency of silencing was calculated by quantitative PCR assays (qPCR) after 24 and 48 h of cell transfection, using different siRNAs in single or in combination. The siRNA hs.Ri.SRSF5.13.1 (40 nM) induced the silencing of SRSF5 with estimated efficiency of about 75% and was selected for further analysis. After 18 h of transfection, SRSF5-knockdown cells were treated for 24 h with human recombinant TNFα cytokine (10 or 20 ng/mL) or with the conditioned medium of THP-1-derived macrophages.

2.11. RNA Isolation, RT-PCR and Quantitative PCR

Epididymal adipose tissue from C57BL/6J mice was homogenized by using Precellys tissue homogenizer. Total RNA was isolated from homogenized tissues and cell lines byTRIzol Reagent (Thermo Fisher Scientific, Waltham, Massachusetts, MN, USA, Cat# 15596026), according to the manufacturer’s instructions. Isolated RNA was quantified with NanoDrop spectrophotometer and was reverse transcribed using “High-Capacity cDNA Reverse Transcription kit” (Thermo Fisher Scientific, Waltham, Massachusetts, MN, USA, Cat# 4368813). Gene expression analysis was performed by quantitative PCR assays using iTaq Universal Sybr Green Supermix (Bio-Rad, Hercules, CA, USA, Cat# 1725125), according to the manufacturer’s instructions, on a CFX Connect Detection System (Bio-Rad, Hercules, CA, USA). The specific primer pairs were designed using the Oligo 4.0 program and are listed in Table S1. The specificity of the amplification reaction was confirmed by melt curve analysis. PPIA, RPS23 and 36b4 were selected as reference genes for analyzing human and mouse samples, respectively. Relative expression analysis was performed using the 2ΔΔCt method, except for the analysis of TNFA expression levels assessedin the Leipzig cohort by the ΔCt method. All reactions were performed in duplicate in at least three independent experiments.

2.12. Western Blot

Lysates were harvested from hMSCs by a RIPA lysis buffer containing Halt Protease and Phosphatase Inhibitor Cocktail (Thermo Fisher Scientific, Waltham, Massachusetts, USA). Protein content was determined using the Bradford protein assay (BioRad, Hercules, CA, USA, Cat# 5000205), and 60 µg of lysates were separated on 12% SDS-PAGE and transferred to PDVF membranes. Membranes were blocked with Tris-buffered saline–Tween (TBST) containing 4% non-fat dried milk and incubated overnight with primary antibodies against the phospho-epitope of SR proteins (1:500, Merck Millipore, Darmstadt, Germany, clone 1H4, Cat# MABE50), the phospho-Akt at Ser473 residue (1:800; Biolegend, San Diego, CA, USA, Cat# 649001) or total Akt1 (1:1000; Biolegend, San Diego, CA, USA, Cat# 680302). After incubation for 1.5 h at room temperature with anti-IgG (HRP)-conjugated secondary antibody (1:4000, Bio-Rad, Hercules, CA, USA, Cat# 170-6515/A28175), signal detection was performed by Pierce ECL Western Blotting Substrate (Thermo Fisher Scientific, Waltham, MA, USA). The shown autoradiographs are representative of at least three independent experiments. Densitometric data analysis was performed on pixel density by GelQuant.NET software (www.biochemlabsolutions.com (accessed on 31 January 2021)). Intensity values were normalized using Hsp90 as the housekeeping gene and compared to signals detected in reference samples.

2.13. ELISA

Levels of the inflammatory cytokines were determined by ELISA (R&D Systems, MN, USA) in cell-free supernatants according to the manufacturer’s instructions. The absorbance of assay wavelength was measured at 450 nm using a Cytation 3 imaging reader (BioTek, Winooski, VT, USA).

2.14. Statistics

All data are expressed as means ± SEM, except for expression data in human biopsies that are expressed as median ± DEVST. All assays were performed at least in triplicate. A Shapiro–Wilk test (“shapiro.test function”) implemented in R language was used for assessing the normal distribution of data. Statistical significance of differences between testing and control samples was evaluated by a two-tailed (one or two sample) Student’s t test (GraphPad Software Inc., La Jolla, CA, USA). Gene expression differences in the German cohort were analyzed by a Mann–Whitney U test. A linear model implemented in R language (lmp function) was used for correlation analysis, as described elsewhere [29]. Boxplots showing TNFA mRNA expression analysis were generated in R using the ggplot2 library and custom scripts. Differences between testing and control samples were defined as significant as p value ≤ 0.05.

3. Results

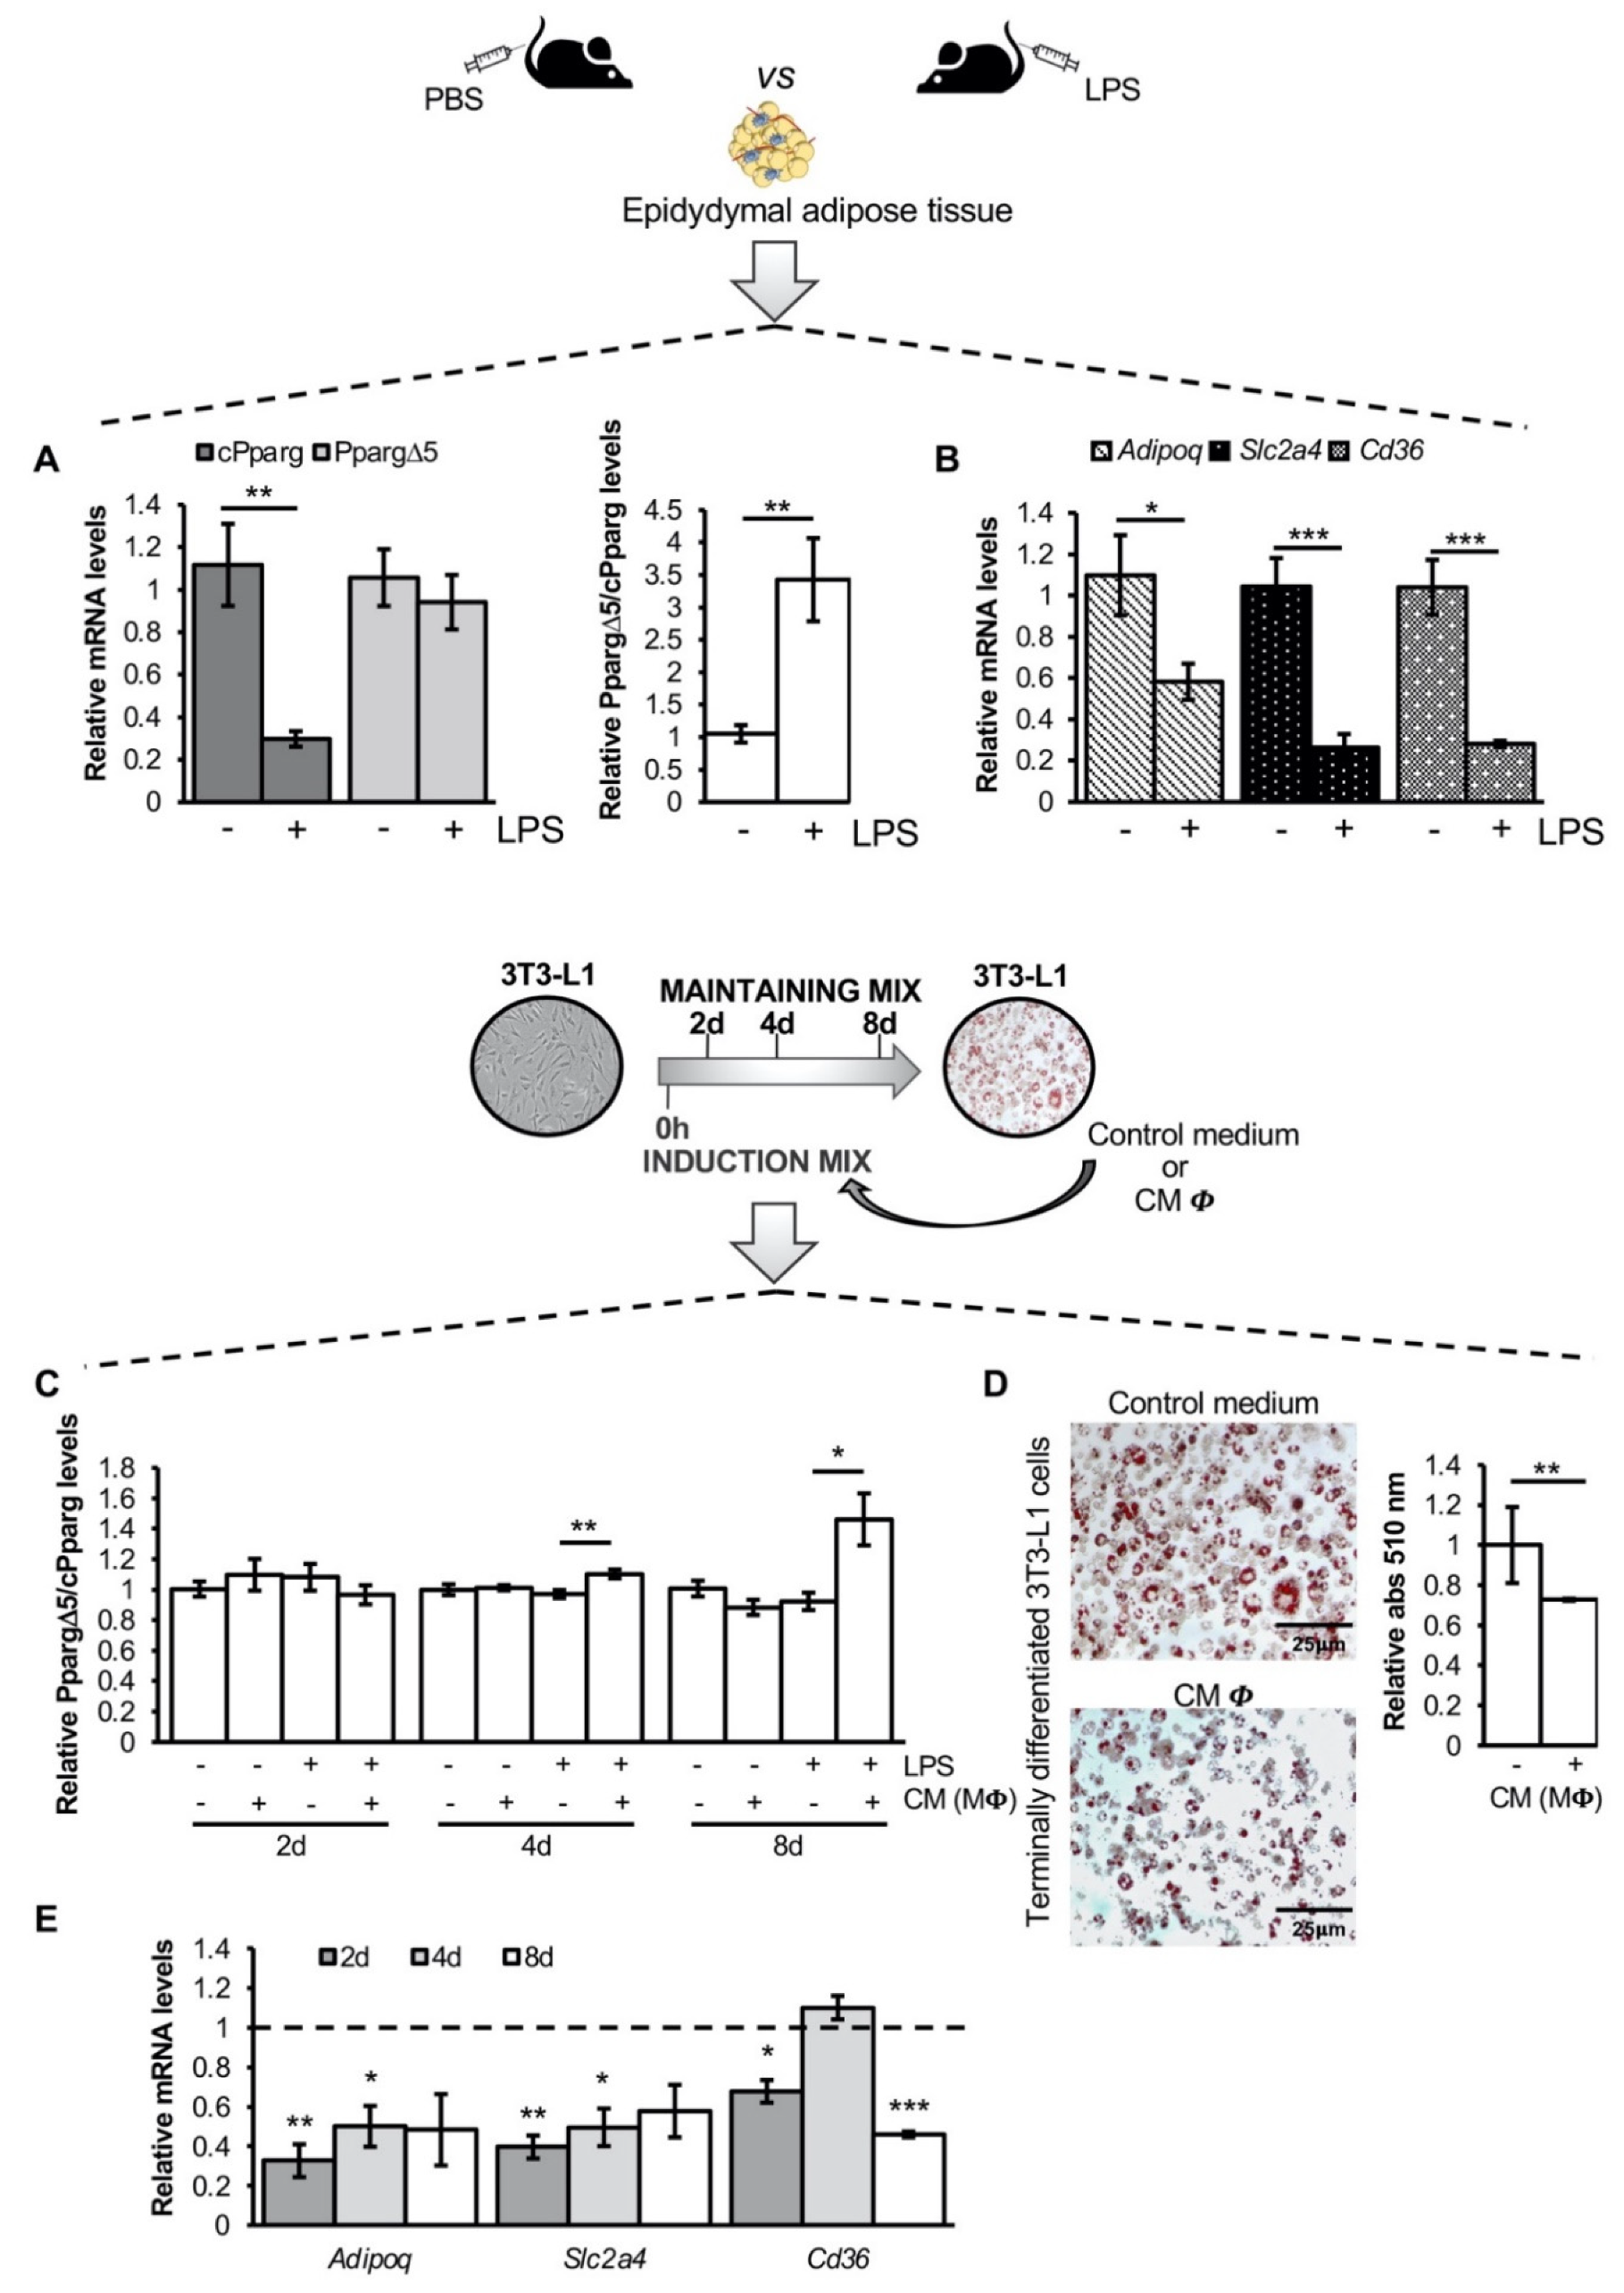
3.1. The Inflammatory Milieu Affects Pparg Expression and Splicing In Vitro and In Vivo

Pro-inflammatory stimuli suppress PPARγ transcriptional activity in murine primary adipocytes and pre-adipocyte cell lines linking the inflammation of AT to insulin resistance in obese patients [19]. We recently reported the increase of PPARGΔ5 and of the PPARGΔ5/cPPARG ratio in the SAT of obese patients [29], and a tight association with hypertrophic—rather than “metabolically-healthy” hyperplastic—obesity and its related metabolic alterations [30].
To assess in vivo whether inflammation—hallmark of hypertrophic obesity—affects PPARG splicing, we measured the relative abundance of canonical (cPparg) and dominant negative (PpargΔ5) Pparg transcripts in the epididymal AT of a well-established mouse model of systemic inflammation (previously described in Pastor et al., 2017) [33]. As expected, Pparg transcription is markedly repressed (about 70%; p = 0.0027) in the epididymal fat of LPS-injected lean mice (Figure 1A, left panel) in line with previous findings [19]. Conversely, PpargΔ5 mRNA levels are not affected (Figure 1A, left panel), determining in turn a 3.5-fold increase (p = 0.024) of PpargΔ5/cPparg ratio (Figure 1A, right panel). This finding points out a previously unrecognized effect of inflammation on Pparg splicing in the AT. Accordingly, in line with the downregulation of cPparg levels and increased PpargΔ5/cPparg ratio, the expression of Adipoq, Slc2a4 and Cd36—validated Pparγ target genes—is significantly reduced (Figure 1B), as we similarly observed in human lipid-engulfed hypertrophic adipocytes [30].
Moreover, our previous findings indicate that high PPARγΔ5 levels are associated with impaired adipogenic capacity of precursor cells [29], which represents a hallmark of hypertrophic obesity. Therefore, we explored Pparg splicing in murine precursor cells differentiating toward mature adipocytes in presence of a pro-inflammatory microenvironment. Hence, 3T3-L1 cells were induced to differentiate in the presence of conditioned media (CM) collected from murine J774.A1 (macrophage-like, MΦ cell line) activated and not with LPS. Interestingly, the analysis of the relative variation of all Pparg transcripts along the adipogenic process reveals that only the secretome of LPS-activated MΦ markedly affects Pparg splicing, inducing an increase of PpargΔ5/cPparg ratio in terminally differentiated adipocytes (1.5-fold, p = 0.03; Figure 1C and Figure S1A,B). As a consequence, pro-inflammatory microenvironment induces an impairment of the adipogenic differentiation (Figure 1D) paralleled by the downregulation of Pparγ target genes (Figure 1E), according to in vivo data (Figure 1B).
These results indicate that the inflammatory microenvironment of the AT affects Pparg splicing, altering the relative amount between canonical and dominant negative isoforms.

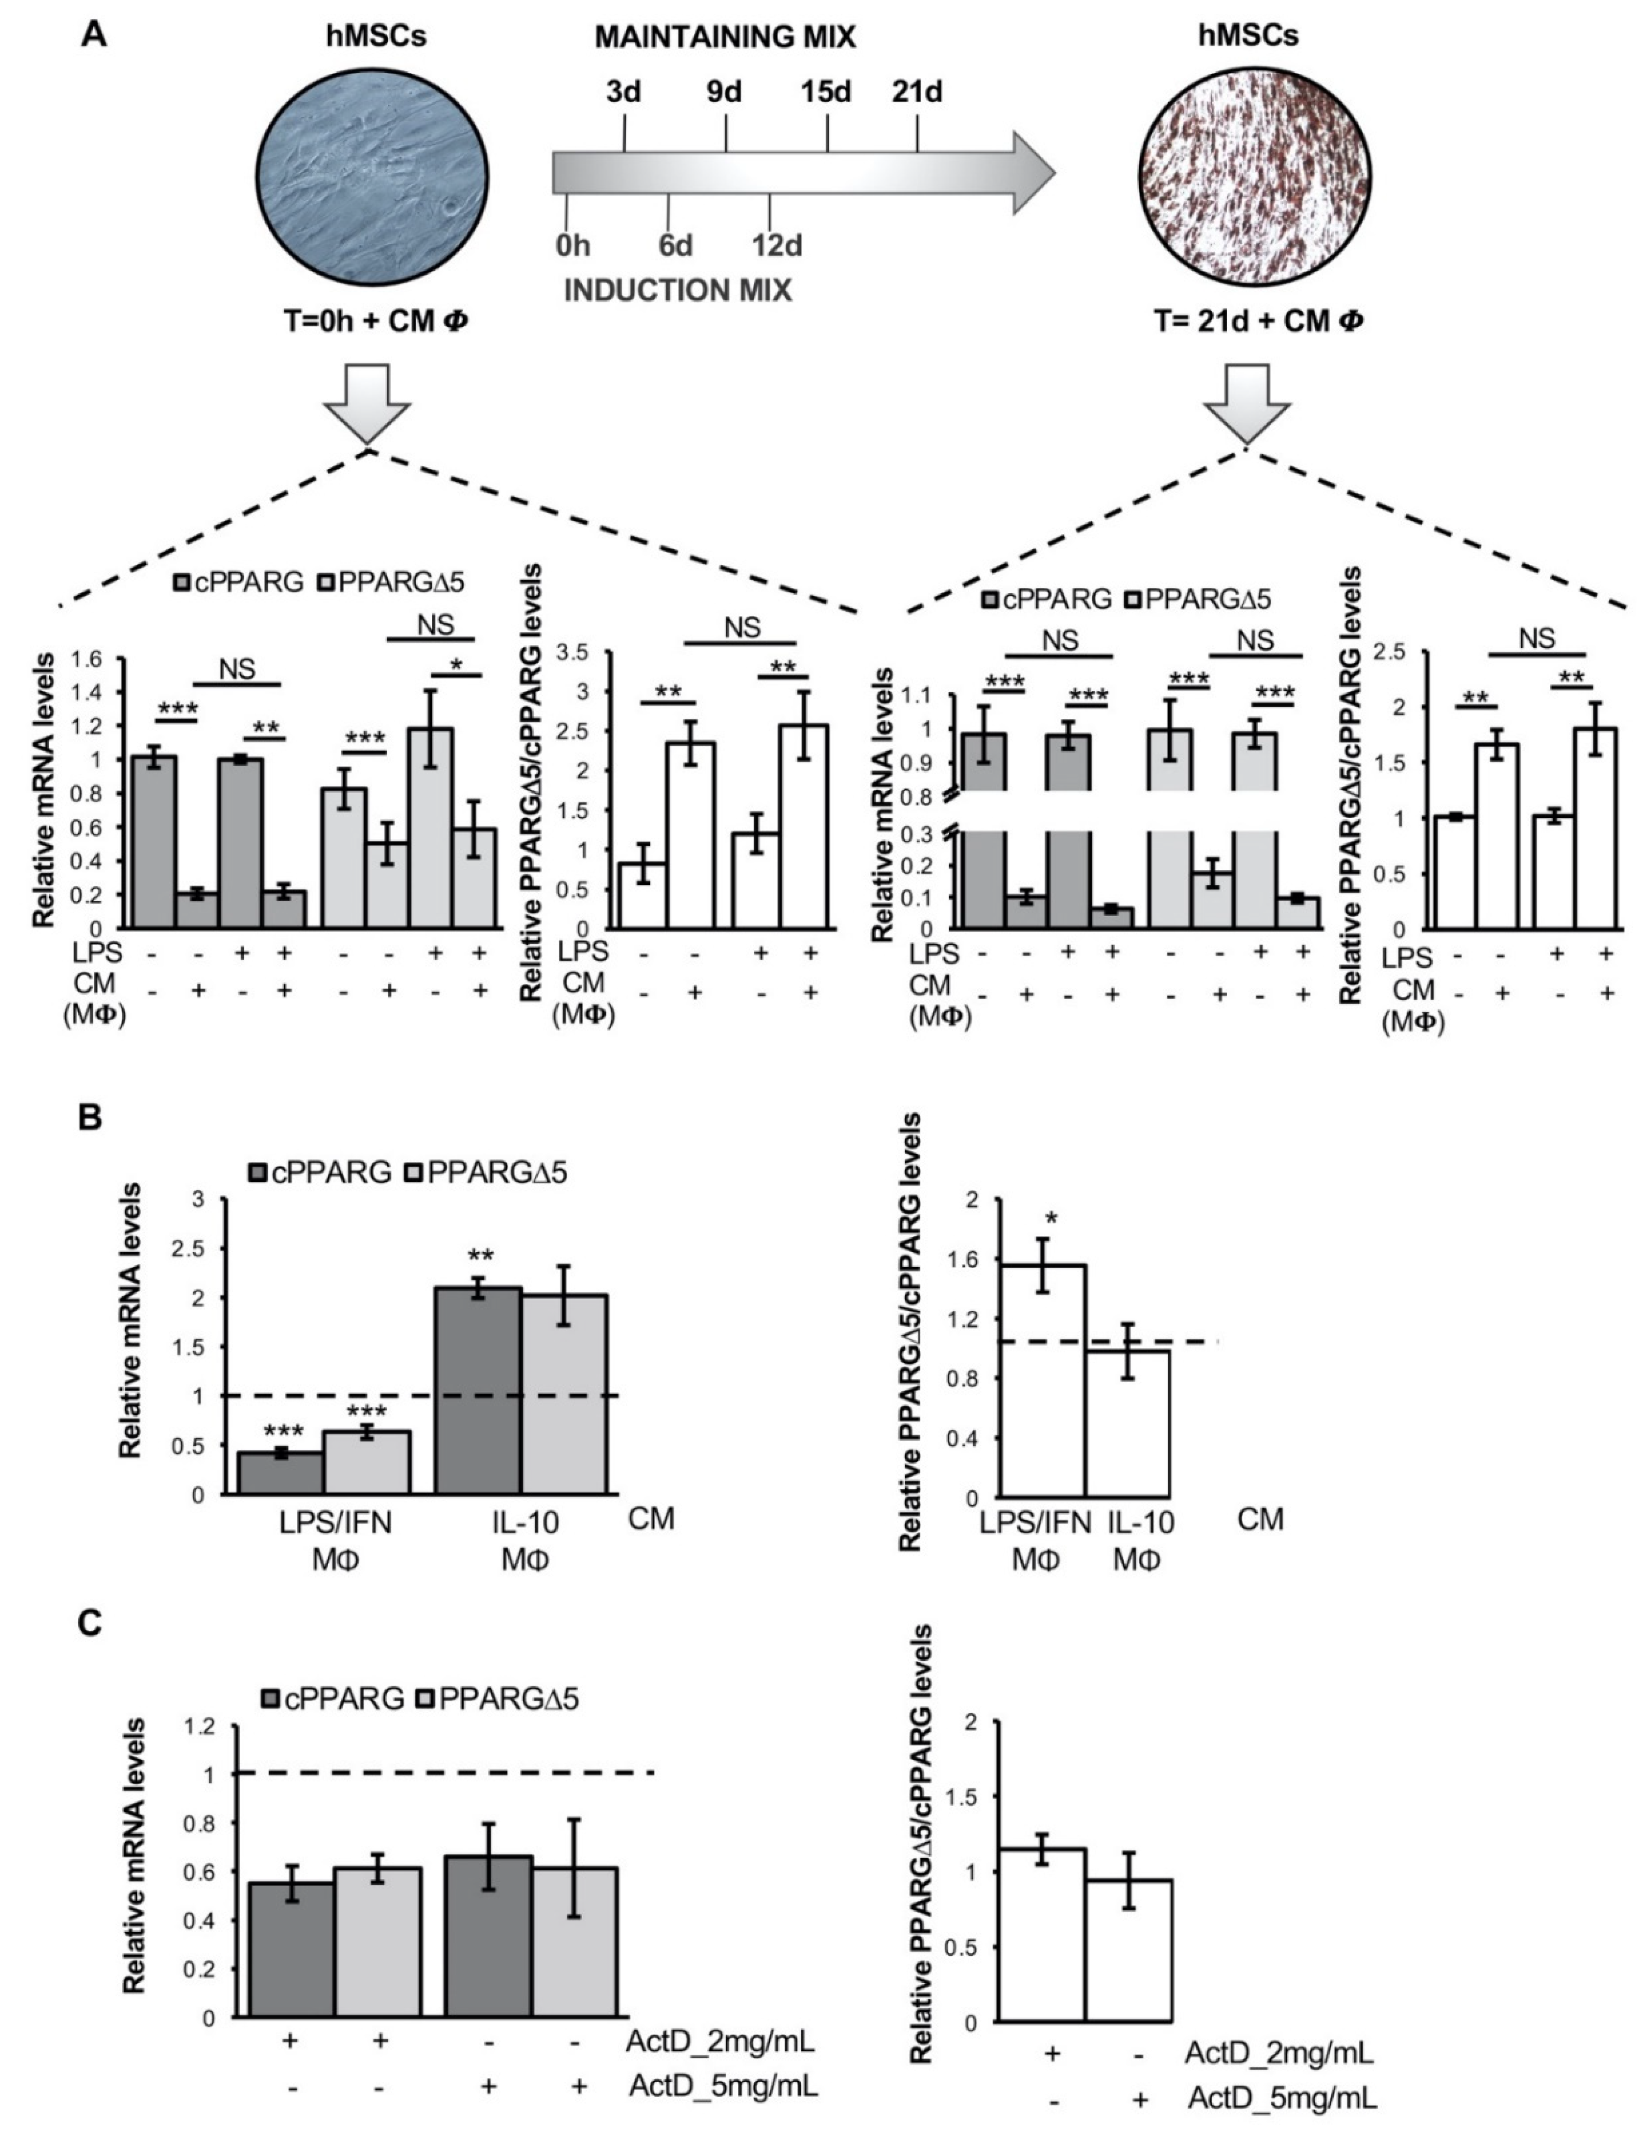
3.2. Pro-Inflammatory Macrophage Secretome Perturbs PPARG Splicing in Human Mesenchymal Stem Cells

To determine whether inflammation also affects the PPARG splicing pattern in humans—similarly to that observed in mouse models—the relative abundance of canonical and dominant negative PPARG transcripts was measured in hMSCs and in vitro-differentiated adipocytes exposed to the conditioned media of human MΦ differentiated from THP-1 monocytes activated and not with LPS (Figure 2A, upper panel). As shown in Figure 2A (lower left panel), the exposure of undifferentiated hMSCs to conditioned media of LPS-activated MΦ (THP-1) causes a drop in the expression of all PPARG mRNAs, but with a more pronounced downregulation (about 80% reduction) of canonical transcripts (p = 0.0001). Accordingly, PPARGΔ5/cPPARG ratio shows a 2.6-fold increase in exposed cells (Figure 2A, p = 0.0214; lower left panel). In mature adipocytes—differentiated in vitro from hMSCs (T = 21d)—exposed to LPS-activated MΦ (THP-1)-conditioned media, a significant drop in the levels of cPPARG (about 95% reduction; p = 0.0038) and PPARGΔ5 (about 91% reduction; p = 0.0004) transcripts is observed (Figure 2A, lower right panel). However, likewise mature murine adipose cells (Figure 1C), PPARGΔ5/cPPARG ratio markedly increases (about 2-fold; p = 0.0115; Figure 2A, lower right panel).
Considering that PPARGΔ5 inversely correlates with the adipogenic capacity of hMSCs [29] and that inflammation perturbs PPARG splicing in these cells (Figure 2A), we investigated which inflammatory stimuli may account for the unbalanced PPARGΔ5/cPPARG ratio. Hypertrophic AT is characterized by reduced adipogenesis and massive increase of pro-inflammatory macrophages by both infiltration and local proliferation [34]. Thus, we exposed hMSCs to the conditioned media of ex vivo-isolated human primary monocytes polarized toward two opposite distinct fates: pro-inflammatory (i.e., LPS/IFNγ-induced MΦ) or anti-inflammatory (IL10-induced MΦ) macrophages. As expected by our previous observation (Figure 2A), hMSCs exposed to the secretome of human primary pro-inflammatory MΦ display a strong transcriptional repression of the entire PPARG locus (Figure 2B). Strikingly, a more pronounced reduction is observed for canonical PPARG transcripts (about 60% reduction; p = 0.0001; Figure 2B, left panel), resulting in a 1.5-fold increase of PPARGΔ5/cPPARG ratio (p = 0.0208; Figure 2B, right panel). On the other hand, the secretome of primary anti-inflammatory MΦ—known to promote adipocyte differentiation [35]—induces a 2-fold increase of both canonical and dominant negative PPARG transcripts (p = 0.0061 and p = 0.076 respectively; Figure 2B, left panel), with no effects on their relative ratio (p = 0.9228; Figure 2B, right panel).
To exclude that any variation observed in PPARG transcripts’ abundance is due to a different half-life, a mRNA stability assay was performed by culturing hMSCs in the presence of growing amounts of the transcription inhibitor actinomycin D (ActD). Even at higher ActD doses, a similar degradation kinetic is observed for all PPARG transcripts (Figure 2C, left panel), without any effect on their relative ratio (Figure 2C, right panel), thus excluding differential mRNA decay as a possible source of bias.
Overall, our in vitro settings reveal that a pro-inflammatory microenvironment affects both PPARG expression and splicing, providing new insights into the mechanisms underlying the link between impaired adipogenesis and inflammation in AT.

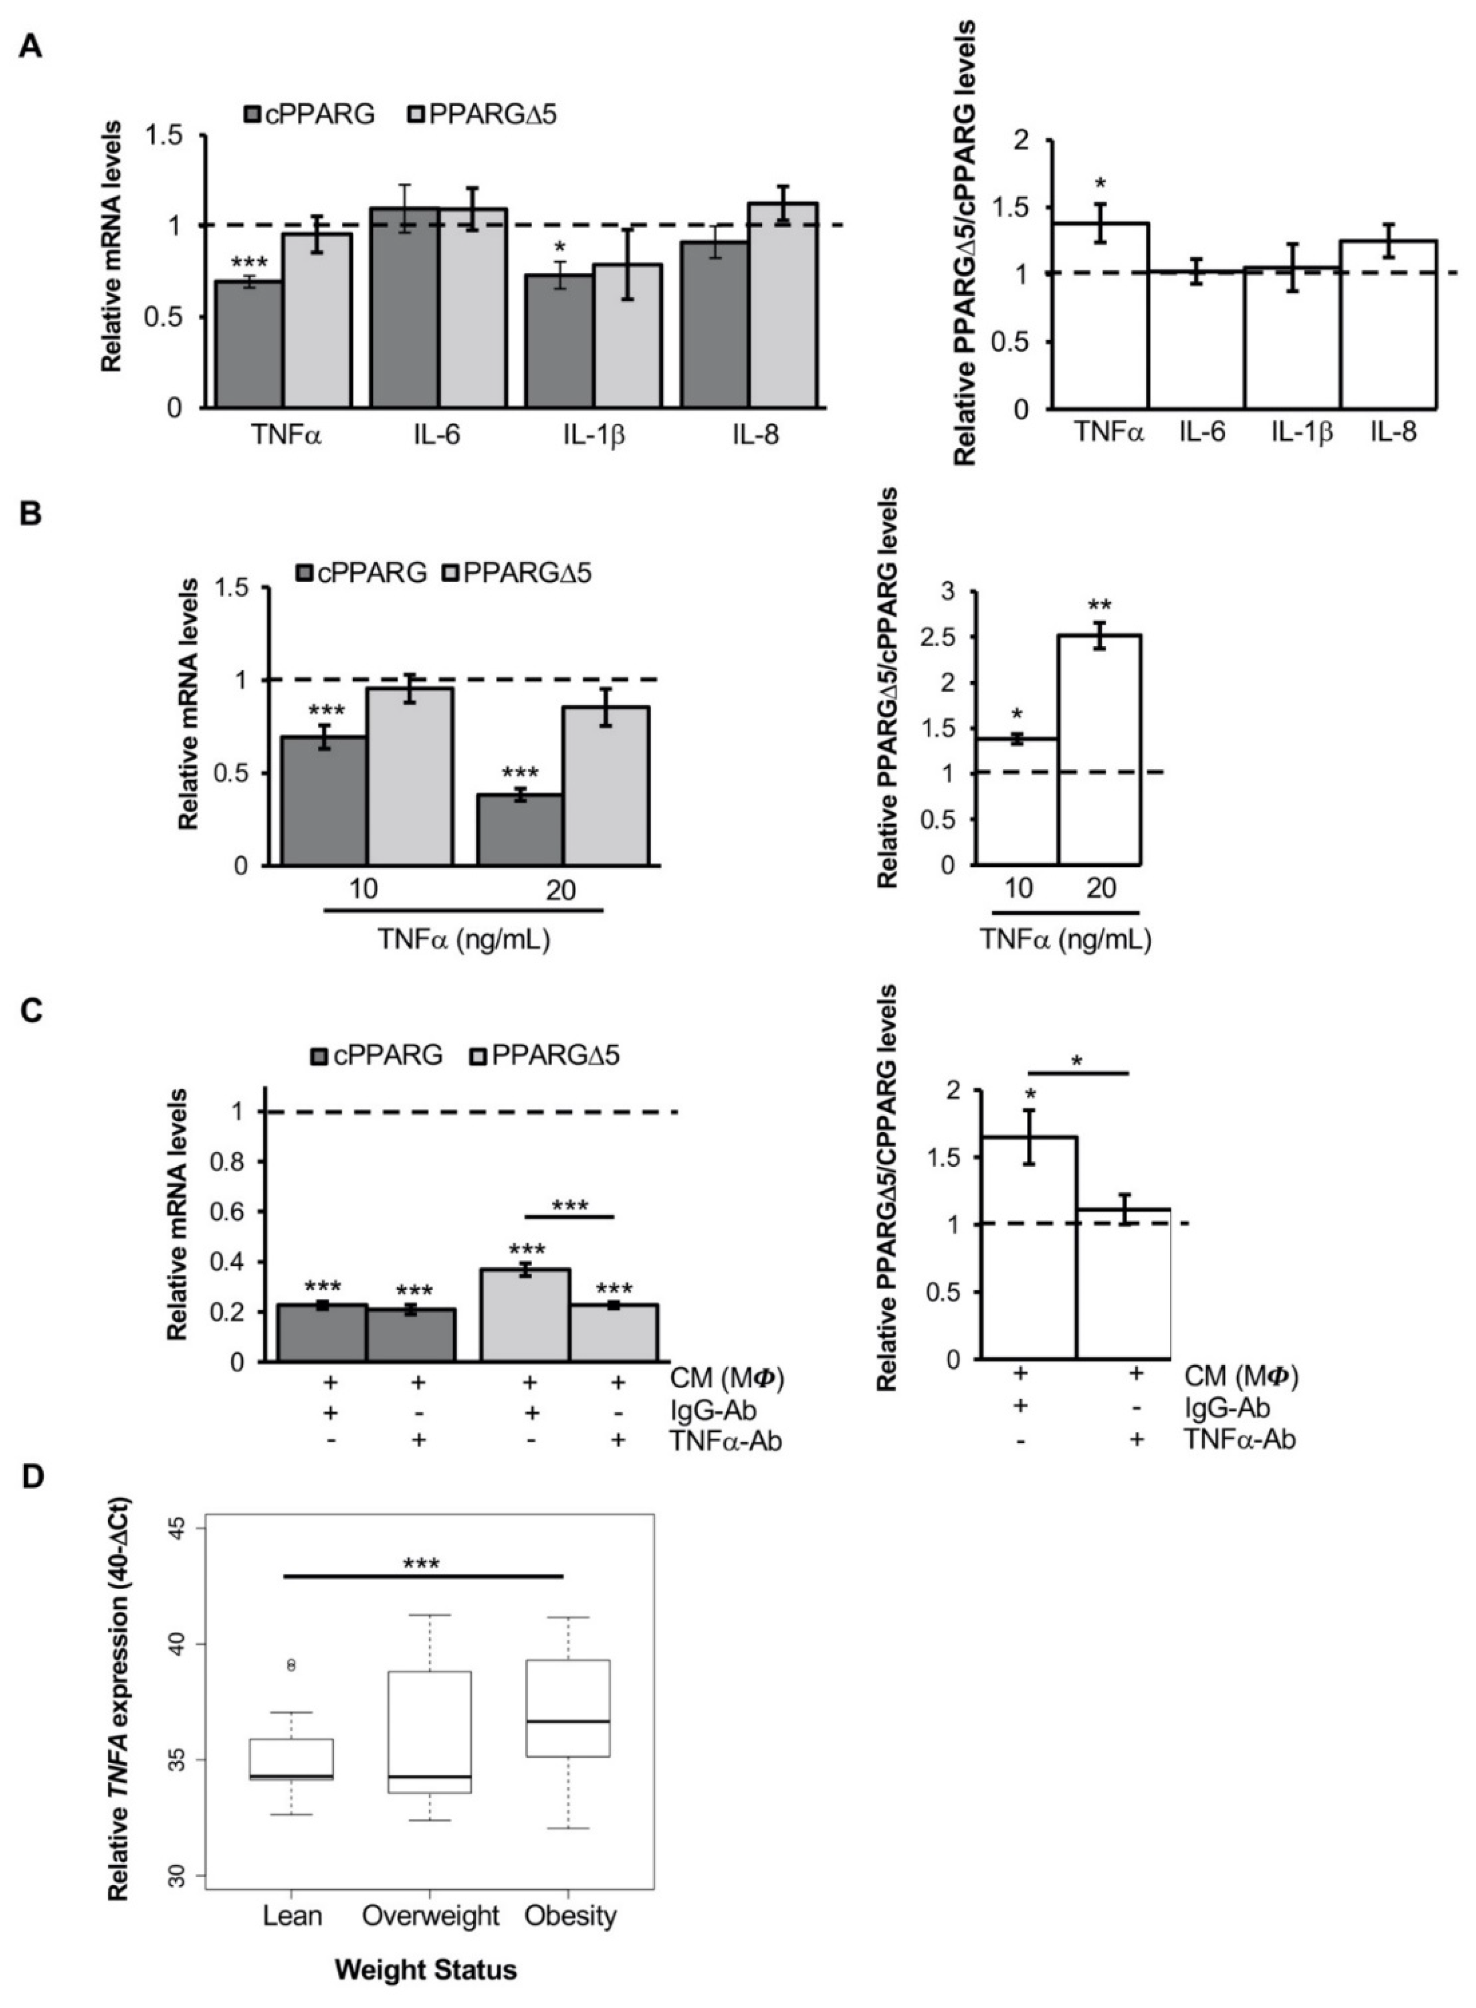
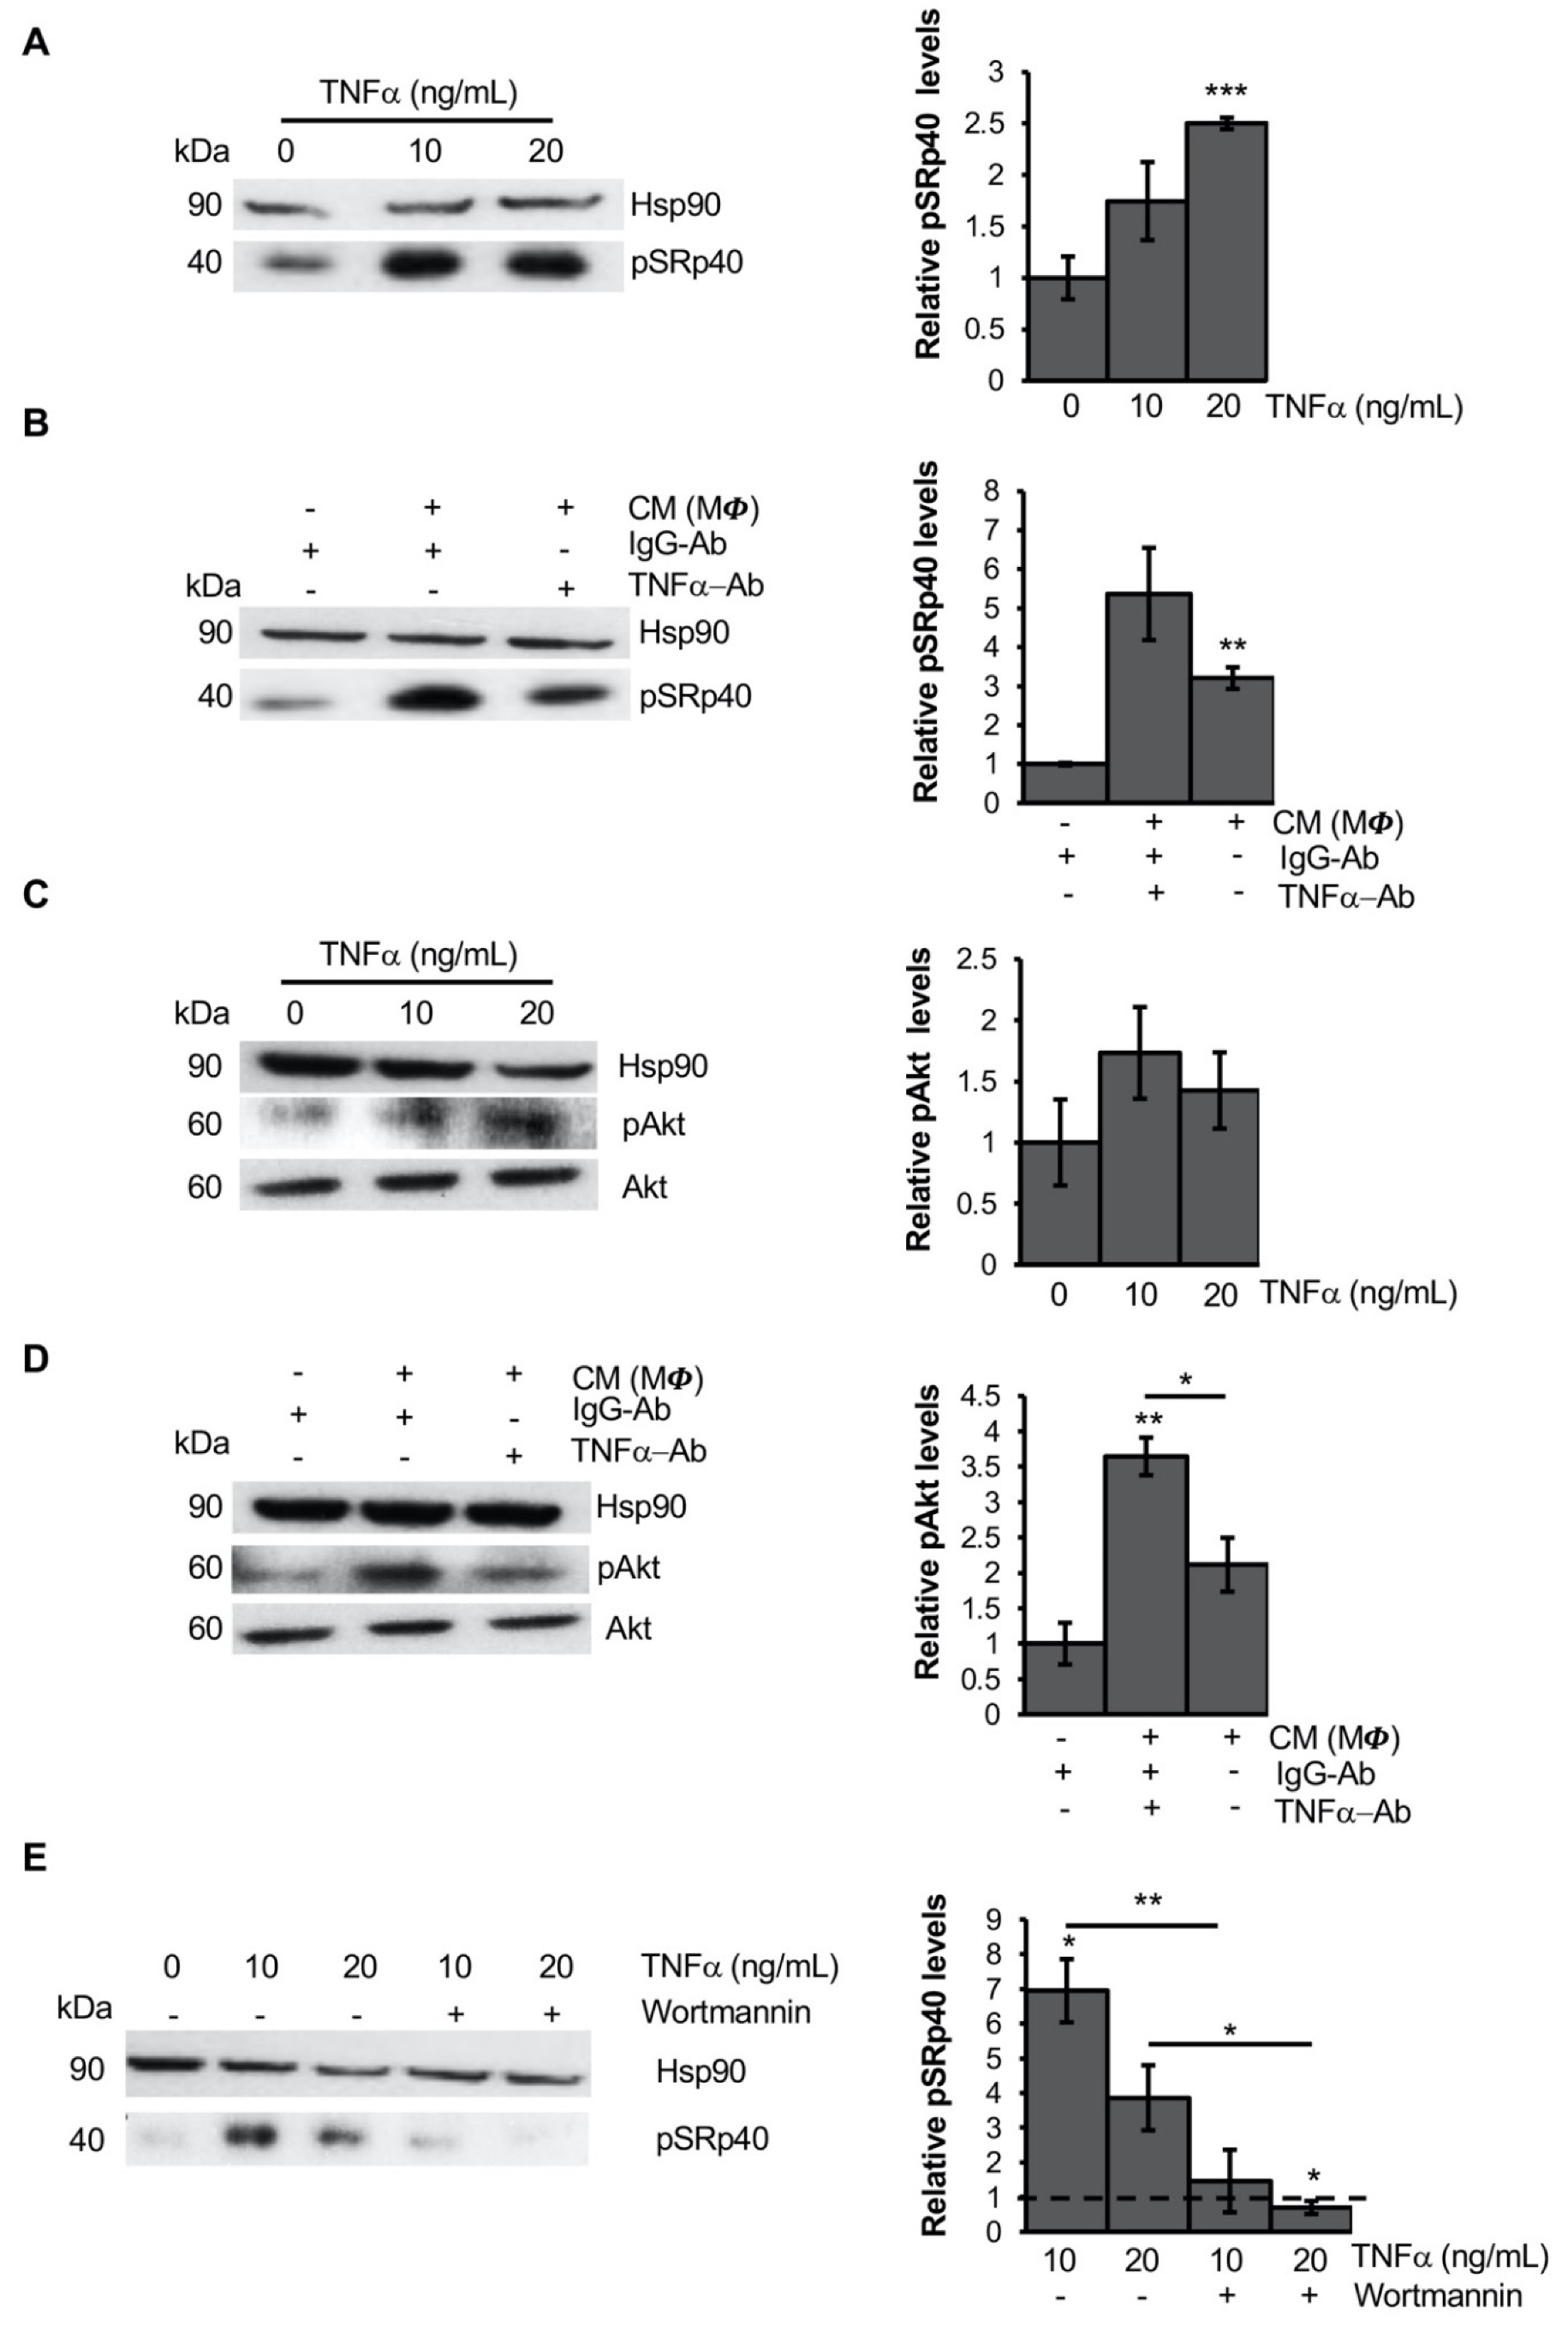
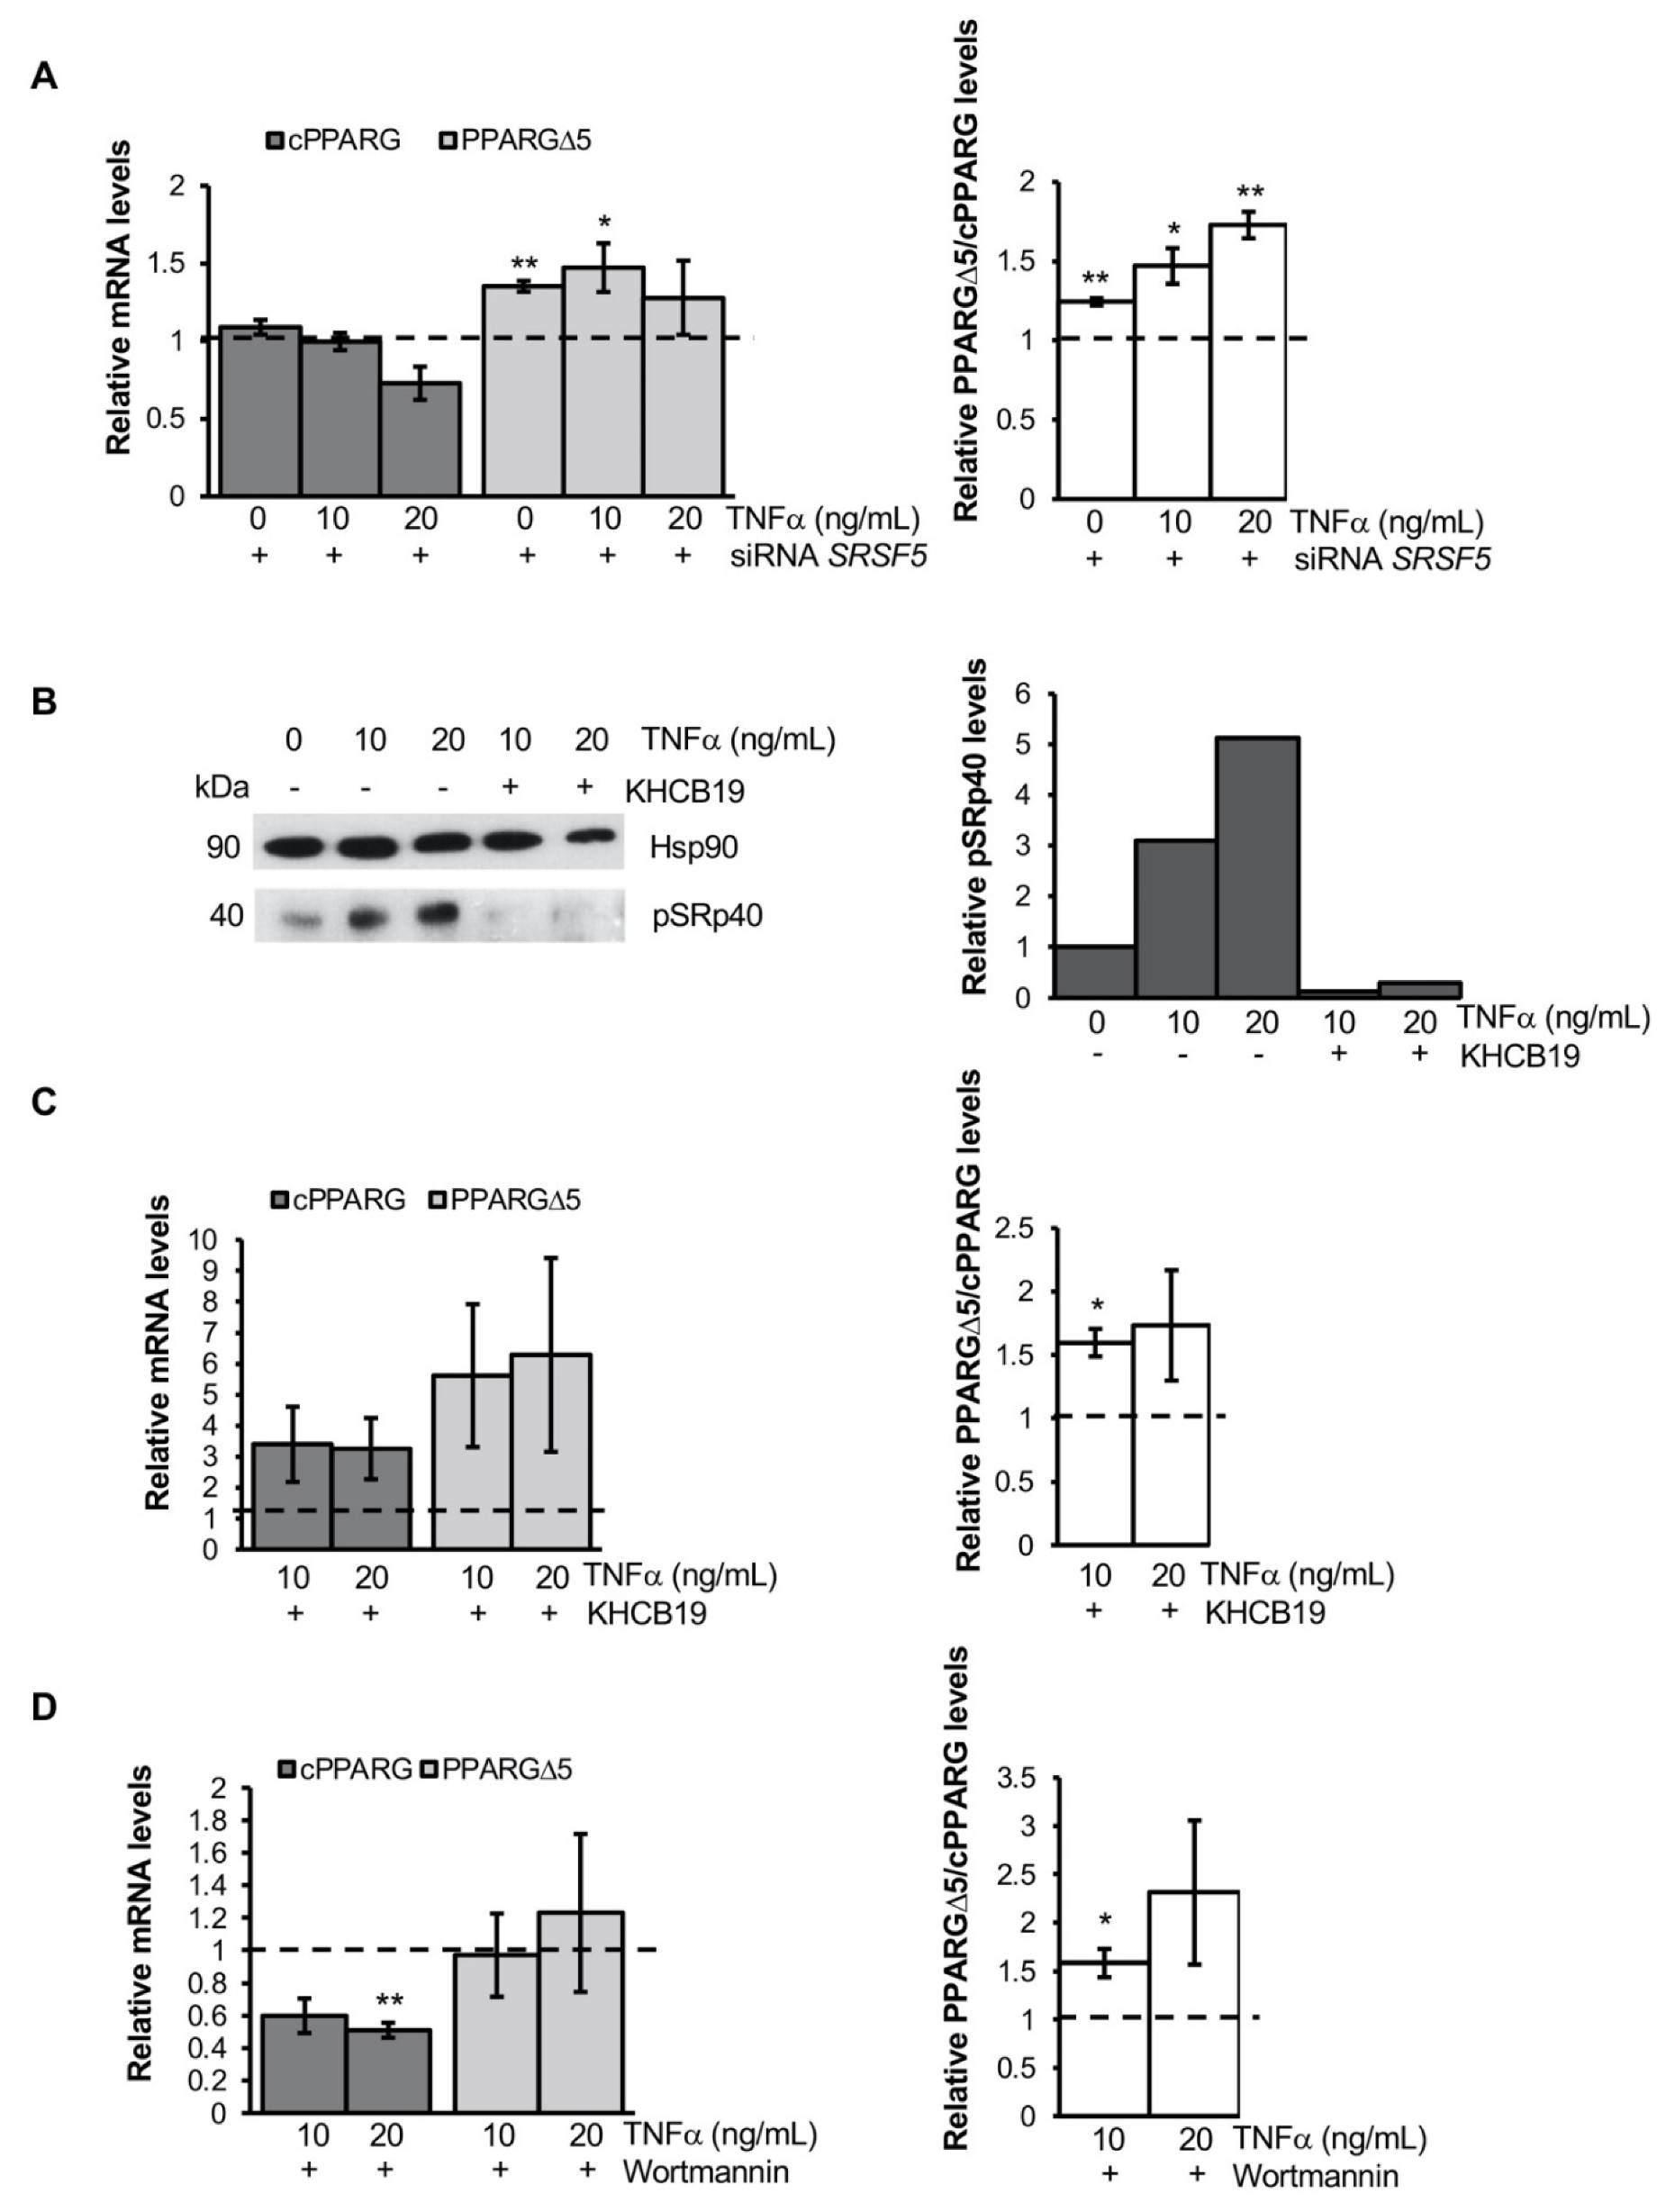
3.3. TNFα Alters PPARG Splicing in Human Mesenchymal Stem Cells

To identify which soluble factors released by pro-inflammatory macrophages are able to affect PPARG splicing, primary human monocytes were differentiated into macrophages and then polarized into pro-inflammatory and anti-inflammatory by LPS/IFNγ or IL-10 treatments, respectively. In line with previous studies [13,16,33,36], as shown in Figure S2A, we assessed higher levels of IL-1β, IL-6, IL-8 and TNFα in the conditioned media of LPS/IFNγ-induced MΦ (both vs. not polarized and IL10-induced MΦ),. Thus, PPARG expression and splicing pattern were analyzed in human mesenchymal precursors treated with all the above-mentioned cytokines. HMSCs exposed to human recombinant IL-6 or IL-8 do not display any variation in the expression—nor in the splicing pattern—of PPARG (Figure 3A, left panel). Differently, cPPARG mRNA is significantly reduced upon treatment with TNFα or IL-1β (about 40%, p = 0.001, and 30%, p = 0.0221, reduction respectively; Figure 3A, left panel). Thus, it is noteworthy that only TNFα significantly affects PPARG splicing, increasing the PPARGΔ5/cPPARG ratio (1.4-fold, p = 0.0272; Figure 3A, right panel). Similar results have been obtained by treating 3T3-L1 cells with murine recombinant TNFα and IL-1β (Figure S2B). Moreover, an high amount of TNFα was observed only in the conditioned media of mouse and human in vitro cultured macrophages (Figure S2C,D), able to increase PPARGΔ5/cPPARG ratio in adipocyte precursor cells and mature adipocytes (Figure 1C and Figure 2A). Interestingly, a suppressive dose-dependent effect is observed on cPPARG expression—but not on PPARGΔ5—when hMSCs are exposed to increasing TNFα doses (Figure 3B, left panel). Whereas the exposure to the highest TNFα amount (50ng/mL) causes massive cell death (data not shown), TNFα sublethal dose (20ng/mL) markedly increases the PPARGΔ5/cPPARG ratio (2.5-fold, p = 0.0123; Figure 3B, right panel). Notably, the addition of recombinant neutralizing anti-TNFα antibody (IgG) to the conditioned media of LPS-activated MΦ (THP-1) does not restore the expression of cPPARG, but reduces PPARGΔ5 levels (Figure 3C, left panel) reverting the TNFα-induced alteration on PPARG splicing in hMSCs (Figure 3C, right panel).
Moreover, to investigate ex vivo the correlation between TNFα and PPARG splicing alteration, we evaluated TNFA expression in the subcutaneous adipose tissue (SAT) biopsies of a subset of lean, overweight and obese individuals (n = 56) from a German cohort, described in our previous studies [29,30]. As expected, TNFA mRNA expression was markedly higher in the obese group (vs. lean individuals; p = 0.0018; Figure 3D), in line with the increasing accumulation of pro-inflammatory macrophages in AT. Of note, we observed a mild positive correlation between TNFA expression and PPARGΔ5 mRNA levels (r = 0.45, p = 0.027; Figure S3A) only in the SAT of obese individuals, whereas no correlation was observed between TNFA and PPARG canonical transcripts (r = 0.19, p = 0.37; Figure S3B). These data reveal a previously unrecognized effect of TNFα on PPARG splicing, suggesting it as a relevant pro-inflammatory molecule able to negatively affect the transcription and splicing at the PPARG locus. Thus, although the transcriptional repression induced by TNFα on the PPARG gene has already been reported [21,22], our data reveal that TNFα does not equally affect all PPARG transcripts, determining an altered balance of canonical and dominant negative isoforms.

3.4. TNFα Modifies PPARG Splicing through PI3K/Akt Signaling

Since TNFα does not equally repress all PPARG transcripts—affecting only cPPARG levels—(Figure 3A,B) and canonical and alternative PPARG mRNAs have similar stability (Figure 2C), we hypothesized a direct effect of TNFα on members of the splicing machinery. In line with this hypothesis, TNFα is known to induce the splicing of different genes by phosphorylating multiple SR proteins [37,38,39]. Moreover, we previously reported the contribution of ASF2/SF2 to PPARG exon 5 skipping [29]. Therefore, we evaluated SR proteins phosphorylation in hMSCs exposed to TNFα, observing a pronounced phosphorylation of SRp40 (alias SRSF5; Figure 4A). Otherwise, we did not detect marked ASF/SF2 phosphorylation levels. Moreover, a dose-dependent increase of pSRp40 was observed (Figure 4A). Similarly, the conditioned media collected from LPS-activated MΦ (THP-1) are able to induce SRp40 phosphorylation (Figure 4B), which is reduced—but not completely abolished—by the addition of neutralizing anti-TNFα IgG (Figure 4B). This finding suggests that other MΦ-secreted pro-inflammatory factors may sustain SRp40 phosphorylation in the AT.
Furthermore, we attempted to verify how TNFα promotes SRp40 phosphorylation in hMSCs. Interestingly, PI3K/Akt signaling—a known target of TNFα [40,41]—has been reported to induce alternative splicing of PKCbII gene via SRp40 phosphorylation [42]. Hence, we hypothesized that the stimulation of the PI3K/Akt pathway may mediate the effects of TNFα on SRp40. According to this hypothesis, pAkt levels (Ser473) significantly increase upon TNFα exposure (Figure 4C). Moreover, the addition of neutralizing TNFα antibody to the conditioned media of LPS-activated MΦ (THP-1) is able to reduce Akt phosphorylation (Figure 4D). Accordingly, PI3K inhibition – induced by cell treatment with wortmannin—blocks Akt phosphorylation and in turn TNFα-mediated phosphorylation of SRp40 (Figure 4E and Figure S4A).
In light of these data, we first evaluated the impact of SRp40 silencing on TNFα-mediated PPARG splicing in hMSCs. Surprisingly, SRSF5 knockdown (Figure 5A and Figure S4B,C), in cells treated with TNFα or the conditioned media of LPS-activated MΦ (THP-1), significantly increases PPARG exon 5 skipping and, in turn, the PPARGΔ5/cPPARG ratio. This unexpected result suggests that SRp40 is required to balance the inclusion/exclusion rate of PPARG exon 5 in the presence of inflammatory stimuli.
Moreover, it is documented that different SR proteins may cooperatively work to regulate the alternative splicing [43,44,45]. Hence, to explore whether other SR proteins may account for PPARG exon 5 skipping, we simultaneously blocked the activity of multiple SR proteins, including SRp40. TNFα-treated hMSCs were exposed to drugs (i.e., KHCB19 and SRPIN340) inhibiting two distinct classes of protein kinases—i.e., Cyclin-dependent kinases 1–4 (Clk) and Serine/arginine rich protein kinases 1–2 (Srpk)—which phosphorylate (and activate) SR proteins. Moreover, using wortmannin, we blocked PI3K/Akt signaling, responsible for Clk- and Srpk-mediated SR phosphorylation [44]. Interestingly, the inhibition of Clk by KHCB19 in TNFα-treated hMSCs, induces a strong increase of PPARGΔ5 levels and of PPARGΔ5/cPPARG ratio (Figure 5B,C), likewise the inhibition of Srpk1 and Srpk2 proteins by SRPIN340 (Figure S4D). Similarly, PI3K inhibition by wortmannin in presence of TNFα was sufficient to increase the PPARGΔ5/cPPARG ratio (Figure 5D).
Thus, these results further support the role of PI3K/Akt signaling in linking inflammation to PPARG splicing and suggest that the inhibition of SR proteins facilitates the activity of other competing splicing factors—such as heterogeneous nuclear ribonucleoproteins (hnRNPs) [46,47,48]—in the modulation of PPARG exon 5 inclusion/exclusion.

4. Discussion

Insulin resistance in individuals with hypertrophic obesity is causally associated with low-grade chronic inflammation, characterized by the infiltration of T cells, macrophages and other immune cells [4,5,6,7,8,9,10]. The release of cytokines and chemokines by pro-inflammatory and metabolically activated macrophages [12,14,15] has a negative impact on the expression and activity of PPARγ [19,20,21,22]. This nuclear receptor has a well-recognized central role in differentiating new insulin-sensitive adipocytes, in keeping the metabolic homeostasis of adipose tissue, in repressing inflammatory genes (e.g., TNFα, iNOS, MMP9) [23,24,25,26,27,28,49] and in dictating monocyte polarization toward an anti-inflammatory phenotype [50,51,52]. Hence, the repressing effect induced by the inflammation on PPARγ generates a self-sustained vicious cycle, contributing to the impairment of neo-adipogenesis, which in turn promotes adipocyte hypertrophy, as well as local and global inflammation [12,18]. We previously described a marked overexpression of the dominant-negative isoform of PPARγ, PPARγΔ5, in the AT of obese/diabetic patients and its ability to impair adipocyte differentiation and PPARγ activity in hypertrophic adipocytes [29,30]. Moreover, the increased PPARGΔ5/cPPARG ratio in SAT enriched of large adipocytes, as well as in our recently generated in vitro model of human hypertrophic-like adipocytes [30], further encouraged us to investigate the putative contribution of pro-inflammatory factors—highly secreted in hypertrophic AT—to the unbalance of PPARG isoforms.
Herein, we aimed to dissect the impact of inflammatory stimuli on PPARG expression and splicing, considering that the relevance of the latter has been often underestimated. The identification, for the first time, that inflammatory factors, other than repressing PPARG expression can modulate—in vitro and in vivo—its splicing pattern, adds an interesting piece to the puzzling regulation of PPARG. In this regard, our results provide evidence of a marked increase of the PpargΔ5/cPparg ratio—paralleled by the repression of Pparg-regulated adipocyte markers—in the epididymal fat of LPS-treated mice, as well as in murine and human adipocytes exposed to macrophages-secreted pro-inflammatory factors. A similar effect on PPARG splicing is also observed in human mesenchymal stem cells, in which we recently described a role for PPARGΔ5 in reducing their adipogenic capacity [29]. Taken together, our data provide an intriguing insight in the molecular mechanisms through which the proinflammatory microenvironment contributes to the impaired neo-adipogenesis in hypertrophic AT, suggesting for PPARG splicing a role as a hub. The increased PPARGΔ5/cPPARG ratio in the SAT of overweight/obese individuals [29] and in lipid-engulfed adipocytes [30] further support this hypothesis. However, we cannot discern the relative contributions of functional isoforms, whose levels are reduced, and of increased dominant negative isoforms to the impairment of PPARγ activity leading to a diminished adipogenic differentiation.
Moreover, in line with the suggested role of TNFα as a key mediator of the effects induced by inflammation on preadipocytes and adipocyte differentiation [53,54], herein we reported TNFα—known to inhibit PPARγ activity through distinct mechanisms [21,22]—as a major pro-inflammatory cytokine able to alter PPARG splicing pattern. Ex vivo analyses on SAT biopsies revealed higher TNFA expression and a positive correlation with PPARGΔ5 levels only in obese (but not in lean) individuals, further supporting also in human hypertrophic adipocytes the link between inflammation and PPARG splicing alteration. Interestingly, the finding that canonical and alternative PPARG transcripts have the same half-life but respond differently to TNFα, as well as to the conditioned media of proinflammatory macrophages, supports a direct effect of inflammation on the splicing machinery. Of note, the alteration of spliceosome machinery due to altered levels of phosphorylated proteins involved in mRNA splicing has been recently reported even in the context of obesity and T2D [55,56,57]. Moreover, TNFα is known to dynamically modulate the inclusion/exclusion rate of alternative exons by enhancing the phosphorylation of multiple SR proteins [37,38,39]. In our experimental settings—i.e., in hMSCs exposed to MΦ-secreted pro-inflammatory factors—we found a TNFα-mediated increase of SRp40 phosphorylation, suggesting a still unexplored role for this splicing factor in PPARG exon 5 inclusion/exclusion. However, as we did not definitely establish the exact role of SRp40 in PPARG splicing, we cannot exclude that multiple SR proteins may cooperate in the modulation of PPARG exon 5 inclusion/exclusion balance and in turn to the generation of the truncated PPARγ isoform.
The finding that MΦ-secreted TNFα impairs PPARγ functionality by promoting the generation of dominant negative isoforms over canonical ones has relevance also from a therapeutic perspective. Indeed, the recently developed anti-inflammatory drugs, which specifically targeting pro-inflammatory MΦ, revealed to be very promising to ameliorate obesity-related inflammation and metabolic dysfunctions [58]. Moreover, the mechanisms underlying polarization of MΦ into pro-inflammatory and metabolically activated cells – rather than in anti-inflammatory MΦ—in the AT of obese patients [12,14,15] remain to be elucidated. Of note, human monocytes/macrophages express PPARγ dominant negative isoforms [29,59]. Hence, given the key role of PPARγ in monocyte polarization, we might speculate that autocrine (or paracrine) signaling in a hypertrophic AT microenvironment may affect PPARG transcripts abundance in AT-resident MΦ, contributing to disease etiology.
In conclusion, our results demonstrate a novel mechanism through which inflammation impairs PPARγ activity in the AT. The imbalance among functional and dominant negative PPARG transcripts is likely to contribute to establishing healthy and unhealthy AT under positive energy intake. These data further indicate the relevance to target inflammation in adipose tissue of patients with hypertrophic obesity to minimize the detrimental effects that pro-inflammatory molecules have on PPARγ functionality in this tissue.

Supplementary Materials

The following are available online at https://www.mdpi.com/article/10.3390/cells11010042/s1, Figure S1: Conditioned media from mouse macrophages modulate the expression of cPparg and PpargΔ5 transcripts. Figure S2: Cytokines secretions by ex vivo and in vitro macrophages and their effects on Pparg splicing in 3T3-L1 cells. Figure S3: TNFA mRNA levels positive correlate with PPARGΔ5 levels in obese individuals. Figure S4: Inflammatory stimuli modulate PPARG splicing through SRp40 phosphorylation. Table S1: List of primers sequence of gene analyzed by qPCR.

Author Contributions

V.C. and S.C. designed the experiments; S.C., M.A. and I.M. performed experiments; V.C., S.C. and M.A. analyzed data; J.-F.T., S.G.-P. and M.C. conducted in vivo experiments; P.I. and D.M. carried out differentiation and polarization of human primary macrophages; M.B. provided patient biopsy specimens and was involved in interpretation of ex vivo data. V.C. and S.C. processed data; V.C. and S.C. wrote the paper, with significant contributions from M.A.; V.C. and A.C. supervised all the experiments and coordinated the interactions among the collaborators. All the authors contributed to data interpretation and discussion, edited and approved the final manuscript. All authors have read and agreed to the published version of the manuscript.

Funding

This work was funded by PON Ricerca e Innovazione 2014–2020, PON Ars01_01270 “Innovative Device For SHAping the Risk of Diabetes” (IDF SHARID) to V.C. and EFSD/Boehringer Ingelheim European Research Programme in Microvascular Complications of Diabetes to A.C. Theresearch contract of S.C. and publication fees were in part supported by Project SATIN—POR Campania FESR 2014/2020, funded to V.C.

Institutional Review Board Statement

The study was conducted according to the Principles of Laboratory Animal Care (NIH publication no. 85-23, revised 1985) and the European Union guidelines on animal laboratory care. All procedures were approved by Animal Care Committee of the Faculty of Medicine of the Nice-Sophia Antipolis University, Nice, France, and the French ministry of national education (#05116.02 and #201505&9143792_v2). The study has been reviewed and approved by the ethics committee of Leipzig University, Germany (approval numbers: 159-12-21052012 and 017-12-23012012) and carried out in accordance with the Declaration of Helsinki, the Bioethics Convention (Oviedo) and the EU Directive on Clinical Trials (Directive 2001/20/EC).

Informed Consent Statement

Informed consent was obtained from all subjects involved in the study.

Acknowledgments

We express our gratitude to Caterina Perfetto for helping with experimental settings.

Conflicts of Interest

The authors declare no conflict of interests.

References

  1. Blüher, M. Metabolically Healthy Obesity. Endocr. Rev. 2020, 41, 405–420. [Google Scholar] [CrossRef] [PubMed] [Green Version]
  2. Bray, G.A.; Kim, K.K.; Wilding, J.P.H.; World Obesity Federation. Obesity: A chronic relapsing progressive disease process. A position statement of the World Obesity Federation. Obes. Rev. 2017, 18, 715–723. [Google Scholar] [CrossRef] [Green Version]
  3. Lumeng, C.N.; Saltiel, A. Inflammatory links between obesity and metabolic disease. J. Clin. Investig. 2011, 121, 2111–2117. [Google Scholar] [CrossRef] [PubMed] [Green Version]
  4. Olefsky, J.M.; Glass, C.K. Macrophages, Inflammation, and Insulin Resistance. Annu. Rev. Physiol. 2010, 72, 219–246. [Google Scholar] [CrossRef] [PubMed]
  5. Hotamisligil, G.S. Inflammation and metabolic disorders. Nature 2006, 444, 860–867. [Google Scholar] [CrossRef] [PubMed]
  6. Reilly, S.M.; Saltiel, A.R. Adapting to obesity with adipose tissue inflammation. Nat. Rev. Endocrinol. 2017, 13, 633–643. [Google Scholar] [CrossRef] [PubMed]
  7. Kanda, H.; Tateya, S.; Tamori, Y.; Kotani, K.; Hiasa, K.I.; Kitazawa, R.; Kitazawa, S.; Miyachi, H.; Maeda, S.; Egashira, K.; et al. MCP-1 contributes to macrophageinfiltration into adipose tissue, insulin resistance, and hepatic steatosis in obesity. J. Clin. Investig. 2006, 116, 1494–1505. [Google Scholar] [CrossRef] [PubMed]
  8. Cinti, S.; Mitchell, G.; Barbatelli, G.; Murano, I.; Ceresi, E.; Faloia, E.; Wang, S.; Fortier, M.; Greenberg, A.S.; Obin, M.S. Adipocyte death defines macrophage localization and function in adipose tissue of obese mice and humans. J. Lipid Res. 2005, 46, 2347–2355. [Google Scholar] [CrossRef] [PubMed] [Green Version]
  9. Wellen, K.E.; Hotamisligil, G.S. Obesity-induced inflammatory changes in adipose tissue. J. Clin. Investig. 2003, 112, 1785–1788. [Google Scholar] [CrossRef]
  10. Wensveen, F.; Valentić, S.; Šestan, M.; Wensveen, T.T.; Polić, B. The “Big Bang” in obese fat: Events initiating obesity-induced adipose tissue inflammation. Eur. J. Immunol. 2015, 45, 2446–2456. [Google Scholar] [CrossRef] [PubMed]
  11. Russo, L.; Muir, L.; Geletka, L.; Delproposto, J.; Baker, N.; Flesher, C.; O’Rourke, R.; Lumeng, C.N. Cholesterol 25-hydroxylase (CH25H) as a promoter of adipose tissue inflammation in obesity and diabetes. Mol. Metab. 2020, 39, 100983. [Google Scholar] [CrossRef]
  12. Gustafson, B.; Gogg, S.; Hedjazifar, S.; Jenndahl, L.; Hammarstedt, A.; Smith, U. Inflammation and impaired adipogenesis in hypertrophic obesity in man. Am. J. Physiol. Metab. 2009, 297, E999–E1003. [Google Scholar] [CrossRef] [PubMed] [Green Version]
  13. Suganami, T.; Nishida, J.; Ogawa, Y. A paracrine loop between adipocytes and macrophages aggravates inflammatory changes: Role of free fatty acids and tumor necrosis factor alpha. Arterioscler. Thromb. Vasc. Biol. 2005, 25, 2062–2068. [Google Scholar] [CrossRef] [Green Version]
  14. Weisberg, S.P.; McCann, D.; Desai, M.; Rosenbaum, M.; Leibel, R.L.; Ferrante, A.W., Jr. Obesity is associated with macrophage accumulation in adipose tissue. J. Clin. Investig. 2003, 12, 1796–1808. [Google Scholar] [CrossRef]
  15. Xu, H.; Barnes, G.T.; Yang, Q.; Tan, G.; Yang, D.; Chou, C.J.; Sole, J.; Nichols, A.; Ross, J.S.; Tartaglia, L.A.; et al. Chronic inflammation in fat plays a crucial role in the de-velopment of obesity-related insulin resistance. J. Clin. Investig. 2003, 12, 1821–1830. [Google Scholar] [CrossRef]
  16. Lumeng, C.N.; Deyoung, S.M.; Saltiel, A.R. Macrophages block insulin action in adipocytes by altering expression of signal-ing and glucose transport proteins. Am. J. Physiol. Endocrinol. Metab. 2007, 292, E166–E174. [Google Scholar] [CrossRef] [PubMed] [Green Version]
  17. Armoni, M.; Harel, C.; Karnieli, E. Transcriptional regulation of the GLUT4 gene: From PPAR-gamma and FOXO1 to FFA and inflammation. Trends Endocrinol. Metab. 2007, 18, 100–107. [Google Scholar] [CrossRef] [PubMed]
  18. Liu, L.F.; Craig, C.; Tolentino, L.L.; Choi, O.; Morton, J.; Rivas, H.; Cushman, S.W.; Engleman, E.G.; McLaughlin, T. Adipose tissue macrophages impair preadipocyte differentiation in humans. PLoS ONE 2017, 12, e0170728. [Google Scholar] [CrossRef] [Green Version]
  19. Yin, R.; Fang, L.; Li, Y.; Xue, P.; Li, Y.; Guan, Y.; Chang, Y.; Chen, C.; Wang, N. Pro-inflammatory Macrophages suppress PPARγ activity in Adipocytes via S-nitrosylation. Free Radic. Biol. Med. 2015, 89, 895–905. [Google Scholar] [CrossRef]
  20. Isakson, P.; Hammarstedt, A.; Gustafson, B.; Smith, U. Impaired Preadipocyte Differentiation in Human Abdominal Obesity: Role of Wnt, Tumor Necrosis Factor-, and Inflammation. Diabetes 2009, 58, 1550–1557. [Google Scholar] [CrossRef] [PubMed] [Green Version]
  21. Ruan, H.; Hacohen, N.; Golub, T.R.; Van Parijs, L.; Lodish, H.F. Tumor Necrosis Factor-α Suppresses Adipocyte-Specific Genes and Activates Expression of Preadipocyte Genes in 3T3-L1 Adipocytes: Nuclear Factor-κ B Activation by TNF-α Is Obligatory. Diabetes 2002, 51, 1319–1336. [Google Scholar] [CrossRef] [PubMed] [Green Version]
  22. Zhang, B.; Berger, J.; Hu, E.; Szalkowski, D.; White-Carrington, S.; Spiegelman, B.M.; Moller, D.E. Negative regulation of peroxisome proliferator-activated receptor-gamma gene expression contributes to the antiadipogenic effects of tumor necrosis factor-alpha. Mol. Endocrinol. 1996, 10, 1457–1466. [Google Scholar] [CrossRef] [PubMed] [Green Version]
  23. Lefterova, M.I.; Haakonsson, A.K.; Lazar, M.A.; Mandrup, S. PPARγ and the global map of adipogenesis and beyond. Trends Endocrinol. Metab. 2014, 25, 293–302. [Google Scholar] [CrossRef] [Green Version]
  24. Ahmadian, M.; Suh, J.M.; Hah, N.; Liddle, C.; Atkins, A.R.; Downes, M.; Evans, R.M. PPARγ signaling and metabolism: The good, the bad and the future. Nat. Med. 2013, 19, 557–566. [Google Scholar] [CrossRef] [PubMed] [Green Version]
  25. Rosen, E.D.; MacDougald, O.A. Adipocyte differentiation from the inside out. Nat. Rev. Mol. Cell Biol. 2006, 7, 885–896. [Google Scholar] [CrossRef]
  26. Lehrke, M.; Lazar, M.A. The many faces of PPARgamma. Cell. Rev. 2005, 123, 993–999. [Google Scholar] [CrossRef] [Green Version]
  27. Imai, T.; Takakuwa, R.; Marchand, S.; Dentz, E.; Bornert, J.-M.; Messaddeq, N.; Wendling, O.; Mark, M.; Desvergne, B.; Wahli, W.; et al. Peroxisome proliferator-activated receptor is required in mature white and brown adipocytes for their survival in the mouse. Proc. Natl. Acad. Sci. USA 2004, 101, 4543–4547. [Google Scholar] [CrossRef] [PubMed] [Green Version]
  28. Tontonoz, P.; Hu, E.; Spiegelman, B.M. Stimulation of adipogenesis in fibroblasts by PPAR gamma 2, a lipid-activated transcription factor. Cell 1995, 79, 1147–1156. [Google Scholar] [CrossRef]
  29. Aprile, M.; Cataldi, S.; Ambrosio, M.R.; D’Esposito, V.; Lim, K.; Dietrich, A.; Blüher, M.; Savage, D.B.; Formisano, P.; Ciccodicola, A.; et al. PPARγΔ5, a Naturally Occurring Dominant-Negative Splice Isoform, Impairs PPARγ Function and Adipocyte Differentiation. Cell Rep. 2018, 25, 1577–1592.e6. [Google Scholar] [CrossRef] [PubMed] [Green Version]
  30. Aprile, M.; Cataldi, S.; Perfetto, C.; Ambrosio, M.R.; Italiani, P.; Tatè, R.; Blüher, M.; Ciccodicola, A.; Costa, V. In Vitro-Generated Hypertrophic-Like Adipocytes Displaying PPARG Isoforms Unbalance Recapitulate Adipocyte Dysfunctions In Vivo. Cells 2020, 9, 1284. [Google Scholar] [CrossRef]
  31. Keller, M.; Hopp, L.; Liu, X.; Wohland, T.; Rohde, K.; Cancello, R.; Klös, M.; Bacos, K.; Kern, M.; Eichelmann, F.; et al. Genome-wide DNA promoter methylation and transcriptome analysis in human adipose tissue unravels novel candidate genes for obesity. Mol. Metab. 2016, 6, 86–100. [Google Scholar] [CrossRef] [PubMed]
  32. Guiu-Jurado, E.; Unthan, M.; Böhler, N.; Kern, M.; Landgraf, K.; Dietrich, A.; Schleinitz, D.; Ruschke, K.; Klöting, N.; Faßhauer, M.; et al. Bone morphogenetic protein 2 (BMP2) may contribute to partition of energy storage into visceral and subcutaneous fat depots. Obesity 2016, 24, 2092–2100. [Google Scholar] [CrossRef] [PubMed] [Green Version]
  33. Pastor, F.; Dumas, K.; Barthélémy, M.-A.; Regazzetti, C.; Druelle, N.; Peraldi, P.; Cormont, M.; Tanti, J.-F.; Giorgetti-Peraldi, S. Implication of REDD1 in the activation of inflammatory pathways. Sci. Rep. 2017, 7, 7023. [Google Scholar] [CrossRef] [PubMed]
  34. Appari, M.; Channon, K.M.; McNeill, E. Metabolic Regulation of Adipose Tissue Macrophage Function in Obesity and Diabetes. Antioxid. Redox Signal. 2018, 29, 297–312. [Google Scholar] [CrossRef] [PubMed]
  35. Nawaz, A.; Tobe, K. M2-like macrophages serve as a niche for adipocyte progenitors in adipose tissue. J. Diabetes Investig. 2019, 10, 1394–1400. [Google Scholar] [CrossRef] [PubMed]
  36. Arango Duque, G.; Descoteaux, A. Macrophage Cytokines: Involvement in Immunity and Infectious Diseases. Front. Immunol. 2014, 5, 491. [Google Scholar] [CrossRef] [PubMed] [Green Version]
  37. Batson, J.; Toop, H.D.; Redondo, C.; Babaei-Jadidi, R.; Chaikuad, A.; Wearmouth, S.; Gibbons, B.; Allen, C.; Tallant, C.; Zhang, J.; et al. Development of Potent, Selective SRPK1 Inhibitors as Potential Topical Therapeutics for Neovascular Eye Disease. ACS Chem. Biol. 2017, 12, 825–832. [Google Scholar] [CrossRef]
  38. Nowak, D.G.; Amin, E.M.; Rennel, E.S.; Hoareau-Aveilla, C.; Gammons, M.; Damodoran, G.; Hagiwara, M.; Harper, S.J.; Woolard, J.; Ladomery, M.R.; et al. Regulation of Vascular Endothelial Growth Factor (VEGF) Splicing from Pro-angiogenic to Anti-angiogenic Isoforms: A novel therapeutic strategy for angiogenesis. J. Biol. Chem. 2010, 285, 5532–5540. [Google Scholar] [CrossRef] [Green Version]
  39. Nowak, D.G.; Woolard, J.; Amin, E.M.; Konopatskaya, O.; Saleem, M.A.; Churchill, A.J.; Ladomery, M.R.; Harper, S.J.; Bates, D.O. Expression of pro- and anti-angiogenic isoforms of VEGF is differentially regulated by splicing and growth factors. J. Cell Sci. 2008, 121, 3487–3495. [Google Scholar] [CrossRef] [Green Version]
  40. Zhou, Z.; Gengaro, P.; Wang, W.; Wang, X.-Q.; Li, C.; Faubel, S.; Rivard, C.; Schrier, R.W. Role of NF-κB and PI 3-kinase/Akt in TNF-α-induced cytotoxicity in microvascular endothelial cells. Am. J. Physiol. Physiol. 2008, 295, F932–F941. [Google Scholar] [CrossRef]
  41. Faurschou, A.; Gniadecki, R. TNF-α stimulates Akt by a distinct aPKC-dependent pathway in premalignant keratinocytes. Exp. Dermatol. 2008, 17, 992–997. [Google Scholar] [CrossRef]
  42. Patel, N.A.; Kaneko, S.; Apostolatos, H.S.; Bae, S.S.; Watson, J.E.; Davidowitz, K.; Chappell, D.S.; Birnbaum, M.; Cheng, J.Q.; Cooper, D.R. Molecular and Genetic Studies Imply Akt-mediated Signaling Promotes Protein Kinase CβII Alternative Splicing via Phosphorylation of Serine/Arginine-rich Splicing Factor SRp40. J. Biol. Chem. 2005, 280, 14302–14309. [Google Scholar] [CrossRef] [PubMed] [Green Version]
  43. Sahebi, M.; Hanafi, M.M.; van Wijnen, A.J.; Azizi, P.; Abiri, R.; Ashkani, S.; Taheri, S. Towards understanding pre-mRNA splicing mechanisms and the role of SR proteins. Gene 2016, 587, 107–119. [Google Scholar] [CrossRef] [PubMed]
  44. Zhou, Z.; Fu, X.-D. Regulation of splicing by SR proteins and SR protein-specific kinases. Chromosoma 2013, 122, 191–207. [Google Scholar] [CrossRef] [PubMed]
  45. Gonçalves, V.; Matos, P.; Jordan, P. Antagonistic SR proteins regulate alternative splicing of tumor-related Rac1b downstream of the PI3-kinase and Wnt pathways. Hum. Mol. Genet. 2009, 18, 3696–3707. [Google Scholar] [CrossRef] [PubMed]
  46. Erkelenz, S.; Mueller, W.F.; Evans, M.S.; Busch, A.; Schöneweis, K.; Hertel, K.J.; Schaal, H. Position-dependent splicing activation and repression by SR and hnRNP proteins rely on common mechanisms. RNA 2012, 19, 96–102. [Google Scholar] [CrossRef] [PubMed] [Green Version]
  47. Cáceres, J.F.; Stamm, S.; Helfman, D.M.; Krainer, A.R. Regulation of Alternative Splicing in Vivo by Overexpression of Antagonistic Splicing Factors. Science 1994, 265, 1706–1709. [Google Scholar] [CrossRef] [Green Version]
  48. Mayeda, A.; Krainer, A.R. Regulation of alternative pre-mRNA splicing by hnRNP A1 and splicing factor SF2. Cell 1992, 68, 365–375. [Google Scholar] [CrossRef]
  49. Pascual, G.; Fong, A.L.; Ogawa, S.; Gamliel, A.; Li, A.C.; Perissi, V.; Rose, D.W.; Willson, T.M.; Rosenfeld, M.G.; Glass, C.K. A SUMOylation-dependent pathway mediates transrepression of inflammatory response genes by PPAR-γ. Nature 2005, 437, 759–763. [Google Scholar] [CrossRef] [PubMed]
  50. Bassaganya-Riera, J.; Misyak, S.; Guri, A.J.; Hontecillas, R. PPAR γ is highly expressed in F4/80hi adipose tissue macrophages and dampens adipose-tissue inflammation. Cell. Immunol. 2009, 258, 138–146. [Google Scholar] [CrossRef] [PubMed] [Green Version]
  51. Charo, I.F. Macrophage Polarization and Insulin Resistance: PPARγ in Control. Cell Metab. 2007, 6, 96–98. [Google Scholar] [CrossRef] [PubMed] [Green Version]
  52. Wong, N.H.; Kwang Tan, A.Y.; Chen, Y.; Sekar, K.; Tan, P.Y.; Chan, D.; Chiang, K.; Wong, N.C. Thermal evaluation of vertical greenery systems for building walls. Build. Environ. 2010, 45, 663–672. [Google Scholar] [CrossRef]
  53. Viglietti, A.I.P.; Giambartolomei, G.H.; Quarleri, J.; Delpino, M.V. Brucella abortus Infection Modulates 3T3-L1 Adipocyte Inflammatory Response and Inhibits Adipogenesis. Front. Endocrinol. 2020, 11, 755. [Google Scholar] [CrossRef] [PubMed]
  54. Lacasa, D.; Taleb, S.; Keophiphath, M.; Miranville, A.; Clement, K. Macrophage-Secreted Factors Impair Human Adipogenesis: Involvement of Proinflammatory State in Preadipocytes. Endocrinology 2007, 148, 868–877. [Google Scholar] [CrossRef] [Green Version]
  55. Batista, T.M.; Jayavelu, A.K.; Albrechtsen, N.J.W.; Iovino, S.; Lebastchi, J.; Pan, H.; Dreyfuss, J.M.; Krook, A.; Zierath, J.R.; Mann, M.; et al. A Cell-Autonomous Signature of Dysregulated Protein Phosphorylation Underlies Muscle Insulin Resistance in Type 2 Diabetes. Cell Metab. 2020, 32, 844–859.e5. [Google Scholar] [CrossRef]
  56. Vernia, S.; Edwards, Y.J.; Han, M.S.; Cavanagh-Kyros, J.; Barrett, T.; Kim, J.K.; Davis, R.J. An alternative splicing program promotes adipose tissue thermogenesis. eLife 2016, 5, e17672. [Google Scholar] [CrossRef] [PubMed]
  57. Pihlajamäki, J.; Lerin, C.; Itkonen, P.; Boes, T.; Floss, T.; Schroeder, J.; Dearie, F.; Crunkhorn, S.; Burak, F.; Jimenez-Chillaron, J.C.; et al. Expression of the Splicing Factor Gene SFRS10 Is Reduced in Human Obesity and Contributes to Enhanced Lipogenesis. Cell Metab. 2011, 14, 208–218. [Google Scholar] [CrossRef] [Green Version]
  58. Prabhu, S.; Deng, H.; Cross, T.-W.L.; Shahoei, S.H.; Konopka, C.J.; Medina, N.G.; Applegate, C.C.; Wallig, M.A.; Dobrucki, L.W.; Nelson, E.R.; et al. Nanocarriers targeting adipose macrophages increase glucocorticoid anti-inflammatory potency to ameliorate metabolic dysfunction. Biomater. Sci. 2020, 9, 506–518. [Google Scholar] [CrossRef]
  59. Aprile, M.; Ambrosio, M.R.; D’Esposito, V.; Beguinot, F.; Formisano, P.; Costa, V.; Ciccodicola, A. PPARGin Human Adipogenesis: Differential Contribution of Canonical Transcripts and Dominant Negative Isoforms. PPAR Res. 2014, 2014, 537865. [Google Scholar] [CrossRef] [Green Version]
Figure 1. Inflammation affects Pparg expression and splicing in vitro and in vivo: (A) Relative mRNA quantification (qPCR) of canonical Pparg transcripts (cPparg), PpargΔ5 (left panel), PpargΔ5/cPparg ratio (right panel) and Pparγ target genes (i.e., Adipoq, Slc2a4 and Cd36, (B)) in epididymal adipose tissue of C57BL/6JB-LPS injected mice (n = 6). Epididymal adipose tissue from control mice (n = 7) was used as reference samples and 36b4 as reference gene. Data are reported as mean ± SEM of independent experiments. * p ≤0.05, ** p ≤ 0.01 and *** p ≤ 0.001. (C) Relative mRNA quantification (qPCR) of the PpargΔ5/cPparg ratio at different time points of 3T3-L1 adipocyte differentiation (i.e., 2, 4 and 8 days upon differentiation induction) carried out in presence of conditioned medium (CM) of J774.A1 macrophages (MΦ) activated and not with LPS. 3T3-L1 differentiated in mature adipocytes with control medium with or without LPS were used as reference samples. 36b4 was used as reference gene. Data are reported as mean ± SEM of at least six independent experiments. * p ≤ 0.05, ** p ≤ 0.01. (D) Representative images of 3T3-L1 differentiated in mature adipocytes (i.e., 8 days upon differentiation induction) in presence and not of CM collected from LPS activated J774.A1 MΦ (scale bar 25 µm). Lipid accumulation was measured by optical determination of Oil red O staining and reported in the bar graph. 3T3-L1 terminally differentiated in mature adipocytes with control medium plus LPS were used as reference samples. Data are reported as mean ± SEM of three independent experiments. ** p ≤ 0.01. (E) Relative mRNA quantification (qPCR) of Pparγ target genes (i.e., Adipoq, Slc2a4 and Cd36) at different time points of 3T3-L1 adipocyte differentiation (i.e., 2, 4 and 8 days upon differentiation induction) carried out in presence of CM of LPS activated J774.A1 cells. 3T3-L1 differentiated in mature adipocytes with control medium plus LPS were used as reference samples (dotted line) and 36b4 as reference gene. Data are reported as mean ± SEM of at least three independent experiments. * p ≤ 0.05, ** p ≤ 0.01 and *** p ≤ 0.001.
Cells 11 00042 g001
Figure 2. Human pro-inflammatory macrophages secretome perturbs PPARG splicing in human mesenchymal stem cells: (A) Representative images (upper panel) of human mesenchymal stem cells (hMSCs) at an undifferentiated stage (i.e., 0 h) and completely differentiated in mature adipocytes (i.e., 21 days upon differentiation induction) by using an induction and a maintaining mixes as reported on the timeline. hMSCs at 0 h and 21 d after adipocyte differentiation were treated for 24 h with conditioned medium (CM) of THP-1 macrophages (MΦ) activated and not with LPS. Below are reported relative mRNA levels (qPCR) of cPPARG, PPARGΔ5 and the PPARGΔ5/cPPARG ratio in hMSCs at 0 h (left panel) and in hMSCs at 21 d (right panel) treated with CM of MΦ. hMSCs at 0 h or at 21 d treated with control medium supplemented or not with LPS were used as reference samples and PPIA as reference gene. Data are reported as mean ± SEM of at least three independent experiments. * p ≤ 0.05, ** p ≤0.01 and *** p ≤ 0.001. (B) Relative mRNA quantification (qPCR) of cPPARG, PPARGΔ5 (left panel) and the PPARGΔ5/cPPARG ratio (right panel) in hMSCs at the undifferentiated stage treated for 24 h with the CM of primary monocyte-derived macrophages polarized in the pro-inflammatory (i.e., LPS/IFNγ-inducedMΦ) or anti-inflammatory (IL10-induced MΦ) type. hMSCs at 0 h treated with the CM of non-polarized primary monocyte-derived macrophages were used as a reference sample (dotted lines) and PPIA as a reference gene. Data are reported as mean ± SEM of at least three independent experiments. * p ≤ 0.05, ** p ≤ 0.01 and *** p ≤ 0.001. (C) Relative mRNA quantification (qPCR) of cPPARG, PPARGΔ5 (left panel) and the PPARGΔ5/cPPARG ratio (right panel) in hMSCs at 0 h treated for 3 h with 2 or 5 mg/mL of actinomycin D. hMSCs at 0h treated with vehicle (i.e., DMSO) were used as a reference sample (dotted lines). PPIA was used as reference gene. Data are reported as mean ± SEM of at least three independent experiments.
Cells 11 00042 g002
Figure 3. TNFα increases the PPARGΔ5/cPPARG ratio in adipocyte precursor cells and correlates with PPARGΔ5 expression in obese patients: (A) Relative mRNA quantification (qPCR) of cPPARG, PPARGΔ5 (left panel) and the PPARGΔ5/cPPARG ratio (right panel) in undifferentiated hMSCs treated for 24 h with 10 ng/mL of human recombinant TNFα, IL-6, IL-1β or IL-8 cytokines. hMSCs treated with vehicle (i.e., PBS) were used as reference samples (dotted lines) and PPIA as reference gene. Data are reported as mean ± SEM of at least three independent experiments. * p ≤ 0.051 and *** p ≤ 0.001. (B) Relative mRNA quantification (qPCR) of cPPARG, PPARGΔ5 (left panel) and the PPARGΔ5/cPPARG ratio (right panel) in hMSCs at undifferentiated stage treated for 24 h with 10 or 20 ng/mL of human recombinant TNFα cytokine. hMSCs treated with vehicle (i.e., PBS) were used as reference samples (dotted lines) and PPIA as reference gene. Data are reported as mean ± SEM of at least three independent experiments. * p ≤ 0.05, ** p ≤ 0.01 and *** p ≤ 0.001. (C) Relative mRNA quantification (qPCR) of cPPARG, PPARGΔ5 (left panel) and the PPARGΔ5/cPPARG ratio (right panel) in undifferentiated hMSCs treated for 24 h with conditioned medium (CM) of LPS-activated MΦ (THP-1) plus 0.5 mg/mL of human neutralizing antibody against TNFα or anti-IgG1 Isotype. hMSCs treated with control medium supplemented with antibody against anti-IgG1 Isotype were used as reference samples (dotted lines). PPIA was used as the reference gene. Data are reported as mean ± SEM of at least three independent experiments. * p ≤ 0.05 and *** p ≤ 0.001. (D) Boxplot showing TNFA levels in three different subgroups of individuals from the German cohort, classified according to their BMI in lean (n = 14), overweight (n = 17) and obesity (n = 24). Data are reported as 40-ΔCt value ± DEVST. RPS23 was used as reference gene. *** p ≤ 0.001.
Cells 11 00042 g003
Figure 4. TNFα increases SRp40 phosphorylation through AKT: (A) Representative autoradiograph of Western blot analysis (left panel) of SRp40 phosphorylation (i.e., pSRp40) levels in hMSCSc at T = 0 h treated for 30 min with 10 or 20 ng/mL of TNFα cytokine or with vehicle (i.e., PBS). Hsp90 was used as a loading control. Bar graphs (right panel) report relative pSRp40 levels normalized on Hsp90 expression (pixel density analysis of Western blots). Data are representative of the mean ± SEM of three independent experiments. *** p ≤ 0.001. (B) Representative Western blot of pSRp40 (left panel) on lysates from undifferentiated hMSCs treated for 24 h with conditioned medium (CM) of LPS-activated MΦ (THP-1) or control medium plus 0.5 mg/mL of human neutralizing antibody against TNFα or anti-IgG1 Isotype. Hsp90 was used as loading control. Bar graphs (right panel) report relative pSRp40 levels normalized on Hsp90 expression (pixel density analysis of Western blots). Data are representative of the mean ±SEM of three independent experiments. ** p ≤ 0.01. (C) Representative immunoblotting of Akt phosphorylation (i.e., pAkt) and total Akt levels (right panel) in hMSCSc at T = 0 h treated for 30 min with 10 or 20 ng/mL of TNFα cytokine or with vehicle (i.e., PBS). Hsp90 was used as loading control. Bar graphs (right panel) report relative pAkt levels normalized on Hsp90 and total Akt expression (pixel density analysis of Western blots). Data are representative of the mean ± SEM of three independent experiments. (D) Representative autoradiograph of Western blot analysis (left panel) of pAkt and total Akt levels in undifferentiated hMScs treated for 24 h with the CM of LPS-activated MΦ (THP-1) or control medium plus 0.5 mg/mL of human neutralizing antibody against TNFα or anti-IgG1 Isotype. Hsp90 was used as loading control. Bar graphs (right panel) report relative pAkt levels normalized on Hsp90 and total Akt expression (pixel density analysis of Western blots). Data are representative of the mean ± SEM of at least three independent experiments. * p ≤ 0.05 and ** p ≤ 0.01. (E) Representative immunoblotting of pSRp40 (left panel) in undifferentiated hMSCs treated with Wortmannin or vehicle (i.e., DMSO) in combination and not with 10 or 20 ng/mL of TNFα cytokine. Hsp90 was used as loading control. Bar graphs (right panel) report relative pSRp40 levels normalized on Hsp90 expression (pixel density analysis of Western blots). Data are representative of the mean ± SEM of at least three independent experiments. * p ≤ 0.05 and ** p ≤ 0.01.
Cells 11 00042 g004
Figure 5. SRp40 is involved in the PPARG splicing modulation induced by TNFα: (A) Relative mRNA quantification (qPCR) of cPPARG, PPARGΔ5 (left panel) and the PPARGΔ5/cPPARG ratio (right panel) in hMSCs at the undifferentiated stage knock out for SRSF5 and treated for 24 h with 0, 10 or 20 ng/mL of human recombinant TNFα cytokine. hMSCs at 0 h transfected scrambled and treated for 24 h with 0, 10 or 20 ng/mL of human recombinant TNFα cytokine were used as reference samples (dotted lines). PPIA was used as the reference gene. Data are reported as mean ± SEM of at least three independent experiments. * p ≤ 0.05 and ** p ≤ 0.01. (B) Western blot of SRp40 phosphorylation (i.e., pSRp40; left panel) levels in hMSCs at T = 0 h treated with wortmannin or vehicle (i.e., DMSO) in combination and not with 10 or 20 ng/mL of TNFα cytokine. Hsp90 was used as loading control. Bar graphs (right panel) report relative pSRp40 levels normalized on Hsp90 expression (pixel density analysis of Western blot). (C) Relative mRNA quantification (qPCR) of cPPARG, PPARGΔ5 (left panel) and the PPARGΔ5/cPPARG ratio (right panel) in hMSCs at the undifferentiated stage treated with 10 or 20 ng/mL of human recombinant TNFα cytokine in combination or not with KHCB19 inhibitor. hMSCs at 0h treated for 24 h with 10 or 20 ng/mL of human recombinant TNFα cytokine and with vehicle (i.e., DMSO) were used as reference samples (dotted lines). PPIA was used as the reference gene. Data are reported as mean ±SEM of at least three independent experiments. * p ≤ 0.05. (D) Relative mRNA quantification (qPCR) of cPPARG, PPARGΔ5 (left panel) and the PPARGΔ5/cPPARG ratio (right panel) in hMSCs at the undifferentiated stage treated with 10 or 20 ng/mL of human recombinant TNFα cytokine and with or without Wortmannin inhibitor. hMSCs at 0 h treated for 24 h with 10 or 20 ng/mL of human recombinant TNFα cytokine and with vehicle (i.e., DMSO) were used as reference samples (dotted lines). PPIA was used as the reference gene. Data are reported as mean ± SEM of at least three independent experiments. * p ≤ 0.05 and ** p ≤ 0.01.
Cells 11 00042 g005
Publisher’s Note: MDPI stays neutral with regard to jurisdictional claims in published maps and institutional affiliations.

