
Integrative Analyses Reveal Tstd1 as a Potential Modulator of HDL Cholesterol and Mitochondrial Function in Mice


1
Department of Biomedical Sciences, University of Lausanne, Bugnon 7, 1005 Lausanne, Switzerland
2
Center for Mitochondrial Biology and Medicine, The Key Laboratory of Biomedical Information Engineering of Ministry of Education, School of Life Science and Technology, Xi’an Jiaotong University, Xi’an 710049, China
3
University of Health and Rehabilitation Sciences, Qingdao 266071, China
*
Authors to whom correspondence should be addressed.
Cells 2021, 10(11), 2976; https://doi.org/10.3390/cells10112976
Submission received: 2 September 2021
/
Revised: 25 October 2021
/
Accepted: 27 October 2021
/
Published: 1 November 2021
(This article belongs to the Special Issue Mitochondrial Dysfunction in Aging and Metabolic Diseases)
Abstract
:High-density lipoprotein (HDL) cholesterol levels are closely associated with human health and diseases. To identify genes modulating plasma HDL levels, we integrated HDL measurements and multi-omics data collected from diverse mouse cohorts and combined a list of systems genetics methods, including quantitative trait loci (QTL) mapping analysis, mediation analysis, transcriptome-wide association analysis (TWAS), and correlation analysis. We confirmed a significant and conserved QTL for plasma HDL on chromosome 1 and identified that Tstd1 liver transcript correlates with plasma HDL in several independent mouse cohorts, suggesting Tstd1 may be a potential modulator of plasma HDL levels. Correlation analysis using over 70 transcriptomics datasets in humans and mice revealed consistent correlations between Tstd1 and genes known to be involved in cholesterol and HDL regulation. Consistent with strong enrichment in gene sets related to cholesterol and lipoproteins in the liver, mouse strains with high Tstd1 exhibited higher plasma levels of HDL, total cholesterol and other lipid markers. GeneBridge using large-scale expression datasets identified conserved and positive associations between TSTD1/Tstd1 and mitochondrial pathways, as well as cholesterol and lipid pathways in human, mouse and rat. In summary, we identified Tstd1 as a new modulator of plasma HDL and mitochondrial function through integrative systems analyses, and proposed a new mechanism of HDL modulation and a potential therapeutic target for relevant diseases. This study highlights the value of such integrative approaches in revealing molecular mechanisms of complex traits or diseases.
1. Introduction
High-density lipoprotein (HDL), a type of cholesterol with beneficial effects, possesses diverse anti-inflammatory, anti-oxidative and anti-apoptotic properties. The dysregulation of HDL is related to many diseases including metabolic diseases [1,2,3], cardiovascular diseases [4,5,6,7,8], cancer [9,10,11], and kidney diseases [12]. Raising HDL levels has been considered an effective strategy to lower the risk of related diseases [2,5,11]. However, the detailed mechanism underpinning HDL metabolism is still poorly understood.
A mitochondrion is a dynamic organelle, and its dysfunction is related to many kinds of diseases [13,14,15]. HDL can help preserve mitochondrial structure and function [16], while genetic variants in mitochondrial DNA associate with HDL levels [17]. However, the intrinsic mechanism of the influence of mitochondria on HDL is unclear. Understanding the interplay between mitochondria and HDL will be useful for understanding the pathogenesis of relevant diseases.
The level of plasma HDL is a complex quantitative trait, which is controlled by many genes as well as external factors, such as diet [18] and exercise [19]. Quantitative trait loci (QTL) mapping is a common approach to identify chromosomal regions underlying complex traits, which has been used to identify the genes involved in the regulation of HDL levels [20]. A QTL is a genetic locus that associates with a quantitative phenotypic trait. Over 30 QTLs for HDL have been found in mice and humans. Interestingly, most QTLs for HDL levels in humans have homologous parts in mice, indicating a similar underlying mechanism of HDL modulation in humans and mice [20]. In addition, Gordon et al. showed that the protein diversity of the mouse plasma lipoproteome generally mirrors those in the human, supporting the use of mouse models for the studies of lipoprotein metabolism [21]. Therefore, the results from mouse models could potentially be used to infer results in humans [20,22,23]. Additionally, mouse models have proven to be valuable tools to increase our understanding of HDL metabolism, as well as its role in diseases such as atherosclerosis [24,25]. Knockout or transgenic mice have been widely used to evaluate the function of candidate genes in HDL regulation. Mouse genetics cohorts can also be used as additional resources to help interpret results from human genetic studies [26].
Many studies used different recombinant inbred mouse strains or F2 mice derived from two parental strains to study genetic loci associated with HDL levels [20,27,28,29]. Recently, outbred mouse populations were used to improve the resolution in mapping QTLs for HDL levels [30,31,32,33]. However, few genes underlying these QTLs have been identified due to the low recombination rate and mapping resolution of these cohorts [20,28]. Since QTL regions are usually quite broad and contain a long list of genes under the QTLs [34], narrowing down the candidate gene lists for QTLs is a great challenge in finally identifying causal genes that cause the variation of traits among individuals in cohorts.
Previous studies revealed that the locus on distal chromosome 1 was responsible for major variations in plasma HDL levels in mice [20,23,27,28,32,35,36,37]. Apoa2 was the first identified candidate gene under this QTL on chromosome 1 for HDL levels [35]. However, there are quite a large number of genes in this locus and most studies assumed Apoa2 is the causal gene without testing others. Systemic studies using unbiased approaches integrating molecular data are needed to investigate other candidate genes in this locus.
In the current study, we combined HDL measurements and transcriptomics data from established diversity outbred (DO) mice and other independent mouse cohorts and integrated a series of bioinformatic tools including mediation analysis, transcriptome-wide association analysis, and correlation analysis to identify candidate genes for the HDL QTL and identified Tstd1 as a new potential HDL modulator. Our study revealed Tstd1 as a new modulator of plasma HDL levels and mitochondrial function, and proposed a potential target for preventing and treating diseases related to HDL dysregulation.
2. Materials and Methods
2.1. DO Datasets
Phenotypic trait, liver transcript, and genotype data for the diversity outbred (DO) mice were downloaded from the Diversity Outbred Database (https://do.jax.org/) on 21 August 2020 [30,33]. In summary, 835 mice were used in the study, of which HDL measurements are available for 783 mice, liver RNA-seq data are available for 478 mice, and liver proteomics data are available for 192 mice.
QTL analysis was performed using the R/qtl2 package [38], and mediation analysis was performed using the R/Intermediate package (https://github.com/simecek/intermediate) on 21 May 2019 [39].
2.2. Data from Independent Mouse Cohorts
Data from 324 mice derived from the F2 cross between C57BL/6J and C3H/HeJ on ApoE null backgrounds were downloaded from genenetwork.org on 29 December 2020. All animals received a high-fat diet starting from 8 weeks of age. Mice were sacrificed at 24 weeks of age, and gene expression was measured from liver samples using microarray [40,41].
Data from 440 mice derived from the F2 cross between C57BL/6J and CAST/EiJ were downloaded from genenetwork.org on 29 December 2020. All mice were fed a high-fat Western diet starting from 10 weeks of age. Mice were sacrificed at 18 weeks of age, then liver gene expression was measured [42,43].
2.3. Transcriptome/Proteome-Wide Association Study (TWAS/PWAS)
TWAS/PWAS was performed by regressing plasma HDL levels on transcript or protein levels, while taking sex, diet, generation and the number of litters as covariates. The correction for multiple testing was performed using Bonferroni correction by taking into account the measured transcripts or proteins.
2.4. Correlation Analysis
Statistical correlations between Tstd1 expression in liver and plasma HDL levels as well as phenotypic traits were performed using Pearson’s product-moment correlation coefficient using the corAndPvalue function in the WGCNA package [44]. Correlations with p-values less than 0.05 were considered statistically significant.
2.5. The Hybrid Mouse Diversity Panel (HMDP) Data and Extreme Strain Analysis
Liver transcriptome data from the HMDP mouse cohort was downloaded from GEO (GSE16780) [45,46]. The phenotypic measurements of the HMDP mice were downloaded from the Mouse Phenome Database (MPD) [47]. Differences in the phenotypic data between the Tstd1-high and Tstd1-low strains were evaluated using a Student’s t-test. The 10 strains with the highest and lowest Tstd1 liver expression were used to calculate the fold-changes of gene expression in livers. Gene-set enrichment analysis (GSEA) was performed to identify the enriched gene sets between Tstd1-high and Tstd1-low strains using the R/fgsea package [48,49].
2.6. Correlation Heatmap
To identify the correlations between Tstd1 and other genes, 34 human and 37 mouse liver transcriptomics datasets have been retrieved from GEO (listed in Supplementary Table S1). Genes in cholesterol and lipoprotein gene sets were obtained from Reactome [50]. Heatmaps illustrating the correlations between Tstd1 expression and cholesterol/lipoprotein genes were generated using the heatmap.2 function in the R/gplots package.
All statistical analyses and data visualizations in this study were carried out using R (version 4.0.4).
3. Results
3.1. Influence of Sex and Diet on Plasma HDL Levels in Mice
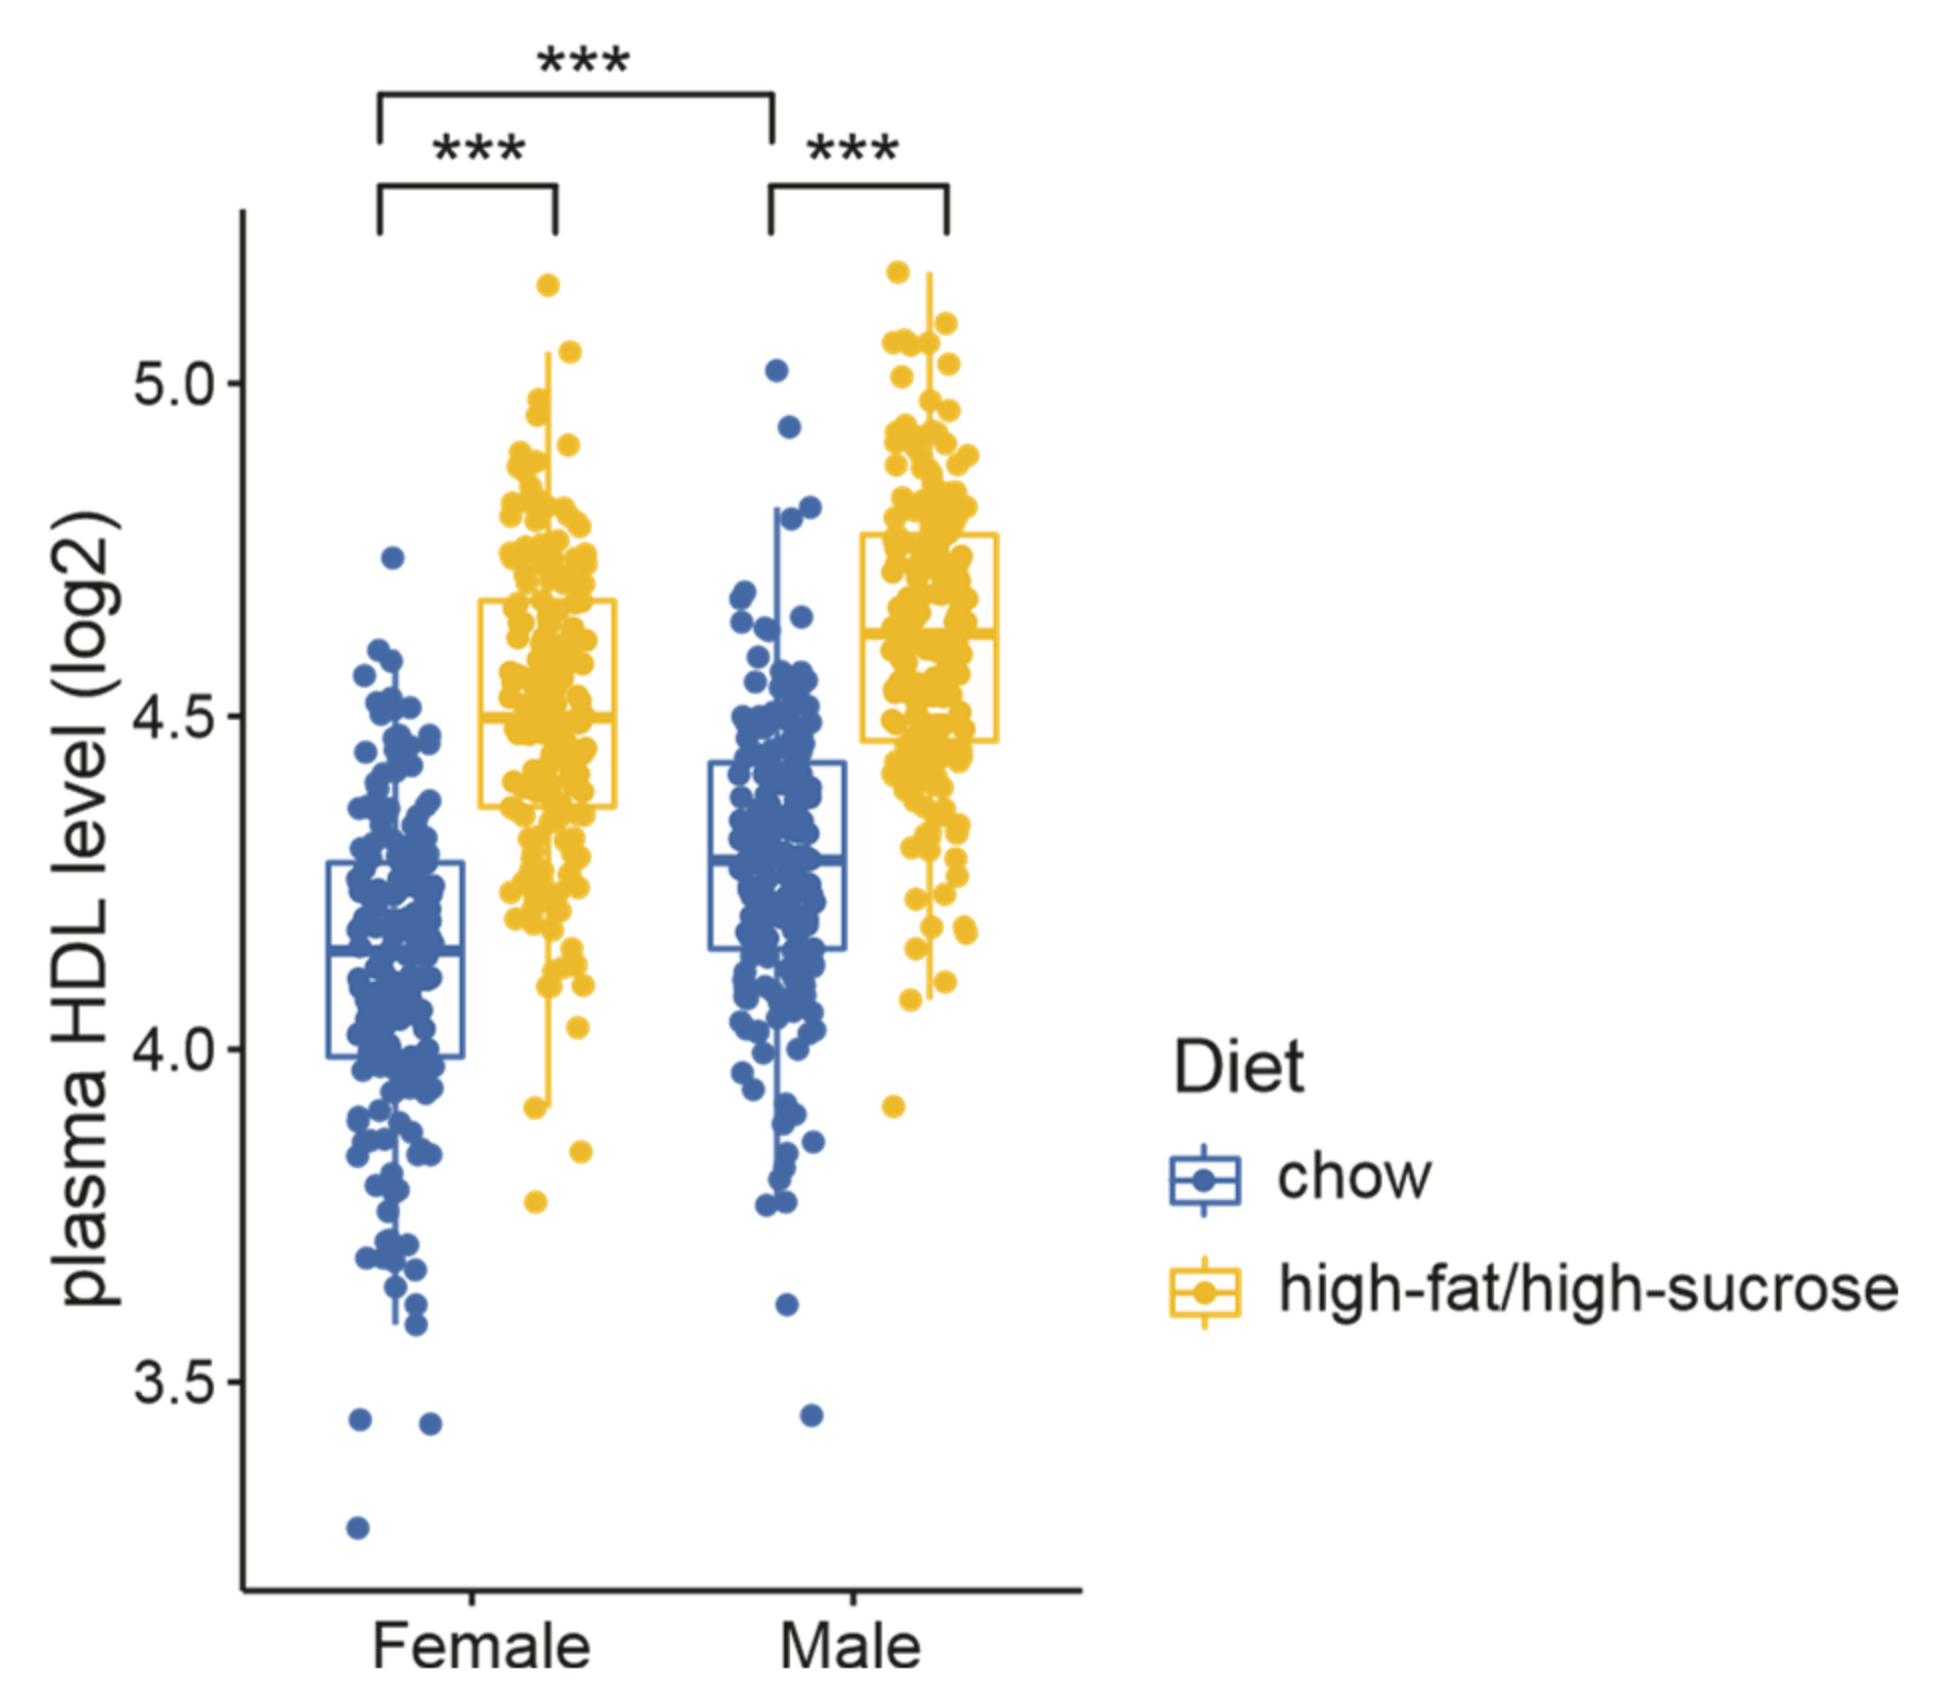
To investigate the potential genes modulating plasma HDL, we re-analyzed the HDL measurements from a recently established DO mouse cohort containing 835 animals (half were females and half were males) [30]. Mice were fed either chow or a high-fat/high-sucrose diet (HFHS) starting from weaning. Plasma HDL levels were measured at 8 weeks of age. As expected, sex and diet showed a strong influence on plasma HDL levels—males had higher HDL than females regardless of the diets, and mice fed with HFHS had higher HDLs than those on a normal diet (Figure 1). The increased HDL levels induced by HFHS feeding are consistent with other studies [51,52,53], probably as a defensive response to transport the increased lipids by HFHS.
We then mapped the QTL for plasma HDL levels using R/qtl2 with sex and diet as covariates [38], and found a significant and conserved QTL on chromosome 1 with the peak at 171.29 Mb (Figure 2A). This QTL has previously been discovered by several independent studies using different mouse cohorts [20,23,33,35,36], and Apoa2, a gene encoding a protein component of HDL, is commonly believed to be the causal gene in this locus [23,35]. However, there are many other genes in this locus that could also be of interest and relevant to the modulation of HDL, although studies investigating the involvement of these genes on HDL are not yet available [23].
To identify the candidate genes regulating HDL levels in an unbiased manner, we applied mediation analysis by integrating the HDL measurements from the DO mice with transcriptome data obtained from the same mouse cohort. Mediation analysis uses the expression levels of each gene individually as additive covariates to estimate the possibility that these genes are causal mediators of the physiological trait QTLs [39]. Including the expression of the mediator in the QTL mapping model should significantly decrease the QTL effect and, therefore, show a decrease in the log of the odds (LOD) score. Through mediation analysis, we found a few genes under the HDL QTL on chromosome 1 that reduced the LOD score of the HDL QTL when taken as covariates, including genes known to be relevant to the regulation of HDLs. In particular, Tstd1 stood out as the best candidate gene for the HDL QTL from the mediation analysis, while the known HDL-related gene Apoa2 was much less significant (Figure 2B). Tstd1 colocalizes with the HDL QTL on chromosome 1 and had a significant cis-eQTL (expression QTL) in the liver at the same locus (Figure 2C).
3.2. Transcriptome- and Proteome-Wide Associations Verifies the Association between Tstd1 and HDL
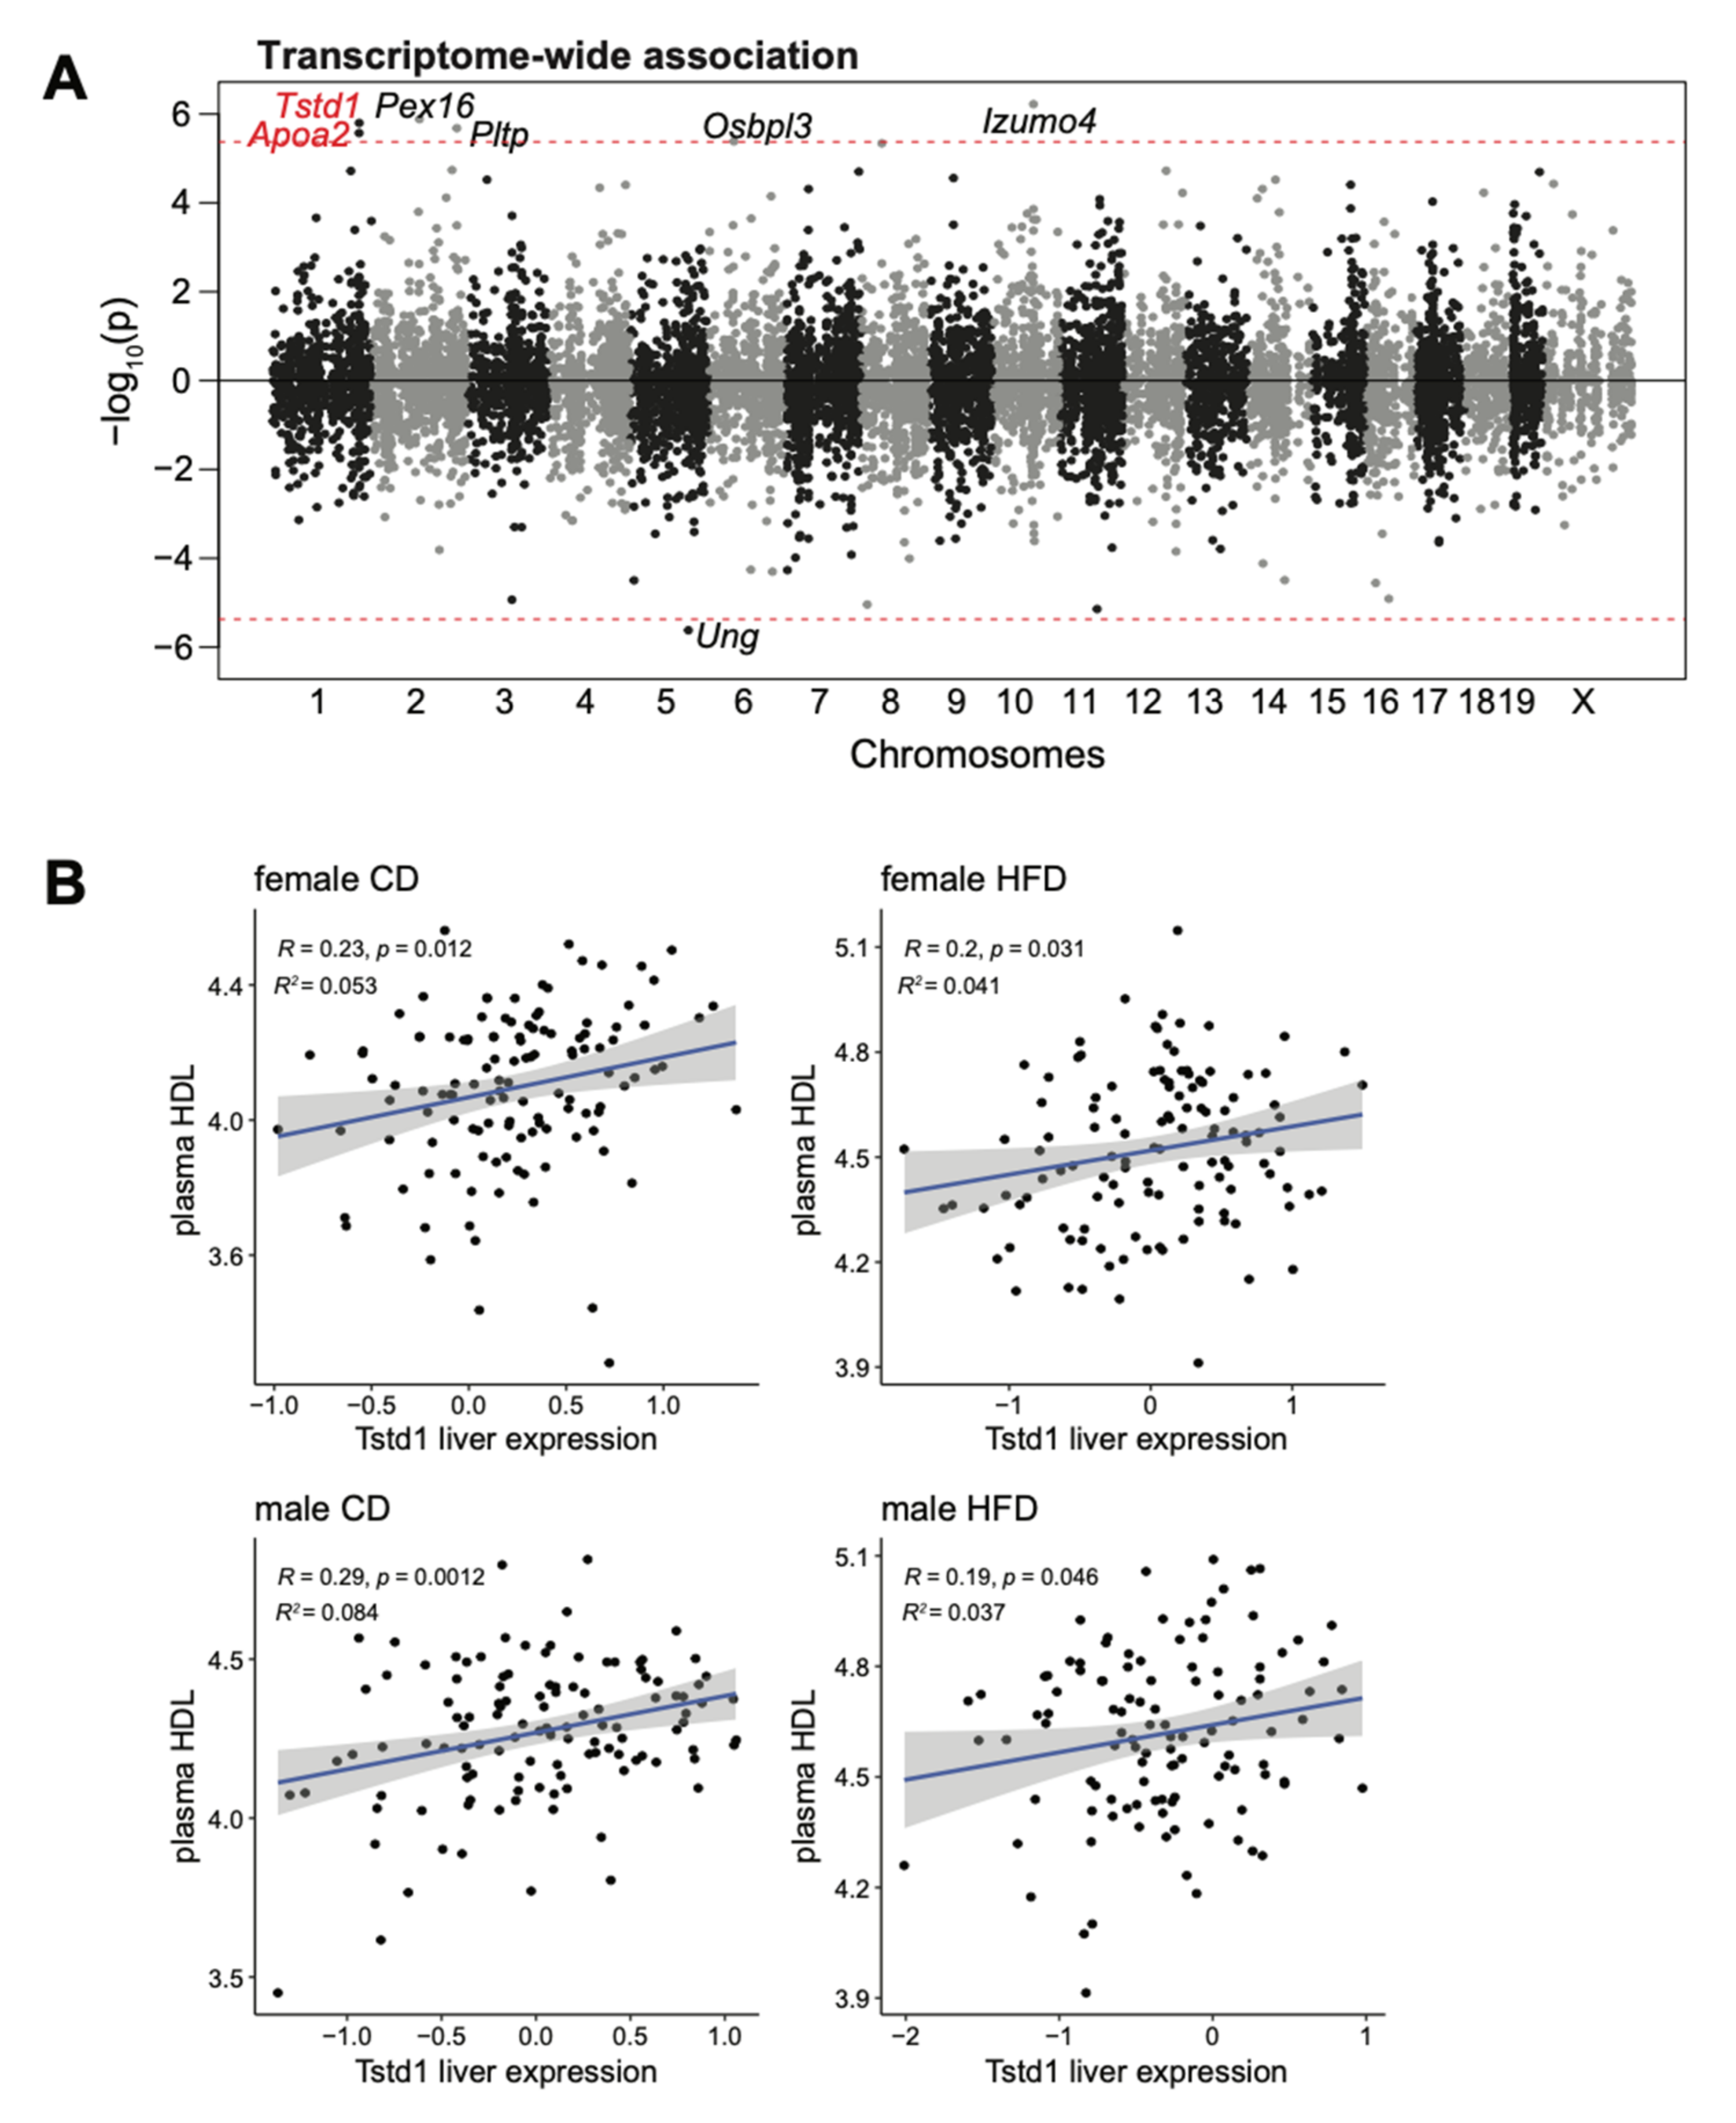
We then used TWAS to identify genes that strongly correlate with plasma HDL levels by controlling the intrinsic and external factors including sex and diet, and identified seven genes (Izumo4, Pex16, Tstd1, Pltp, Apoa2, Ung, and Osbpl3) at the transcriptome-wide significance (Figure 3A). Of these seven genes, Tstd1 and Apoa2 located under the HDL QTL on distal chromosome 1, with Tstd1 (p = 1.59 × 10⁻⁶), had a higher transcriptome-wide association than Apoa2 (p = 2.68 × 10⁻⁶). Indeed, the Tstd1 liver transcript was consistently, although mildly, correlated with plasma HDL levels in both male and female mice fed with either diet (Figure 3B).
Since proteomics data is available for 6740 proteins in the DO mice, we also performed proteome-wide association analysis (PWAS) to reveal the proteins associated with HDL levels in an unbiased manner. The protein measurements of APOA2 but not TSTD1 are available in the proteomics data. However, there were no associated proteins with HDLs at the proteome-wide significance, and APOA2 showed even slightly negative associations with HDL (Figure 4), which is in contrast to the results from TWAS in Figure 3.
In summary, Tstd1 stood out as the best candidate gene for the HDL QTL on chromosome 1 based on results from the mediation analysis, TWAS and PWAS.
3.3. Confirmation of the Tstd1-HDL Connection Using Independent Data Sets
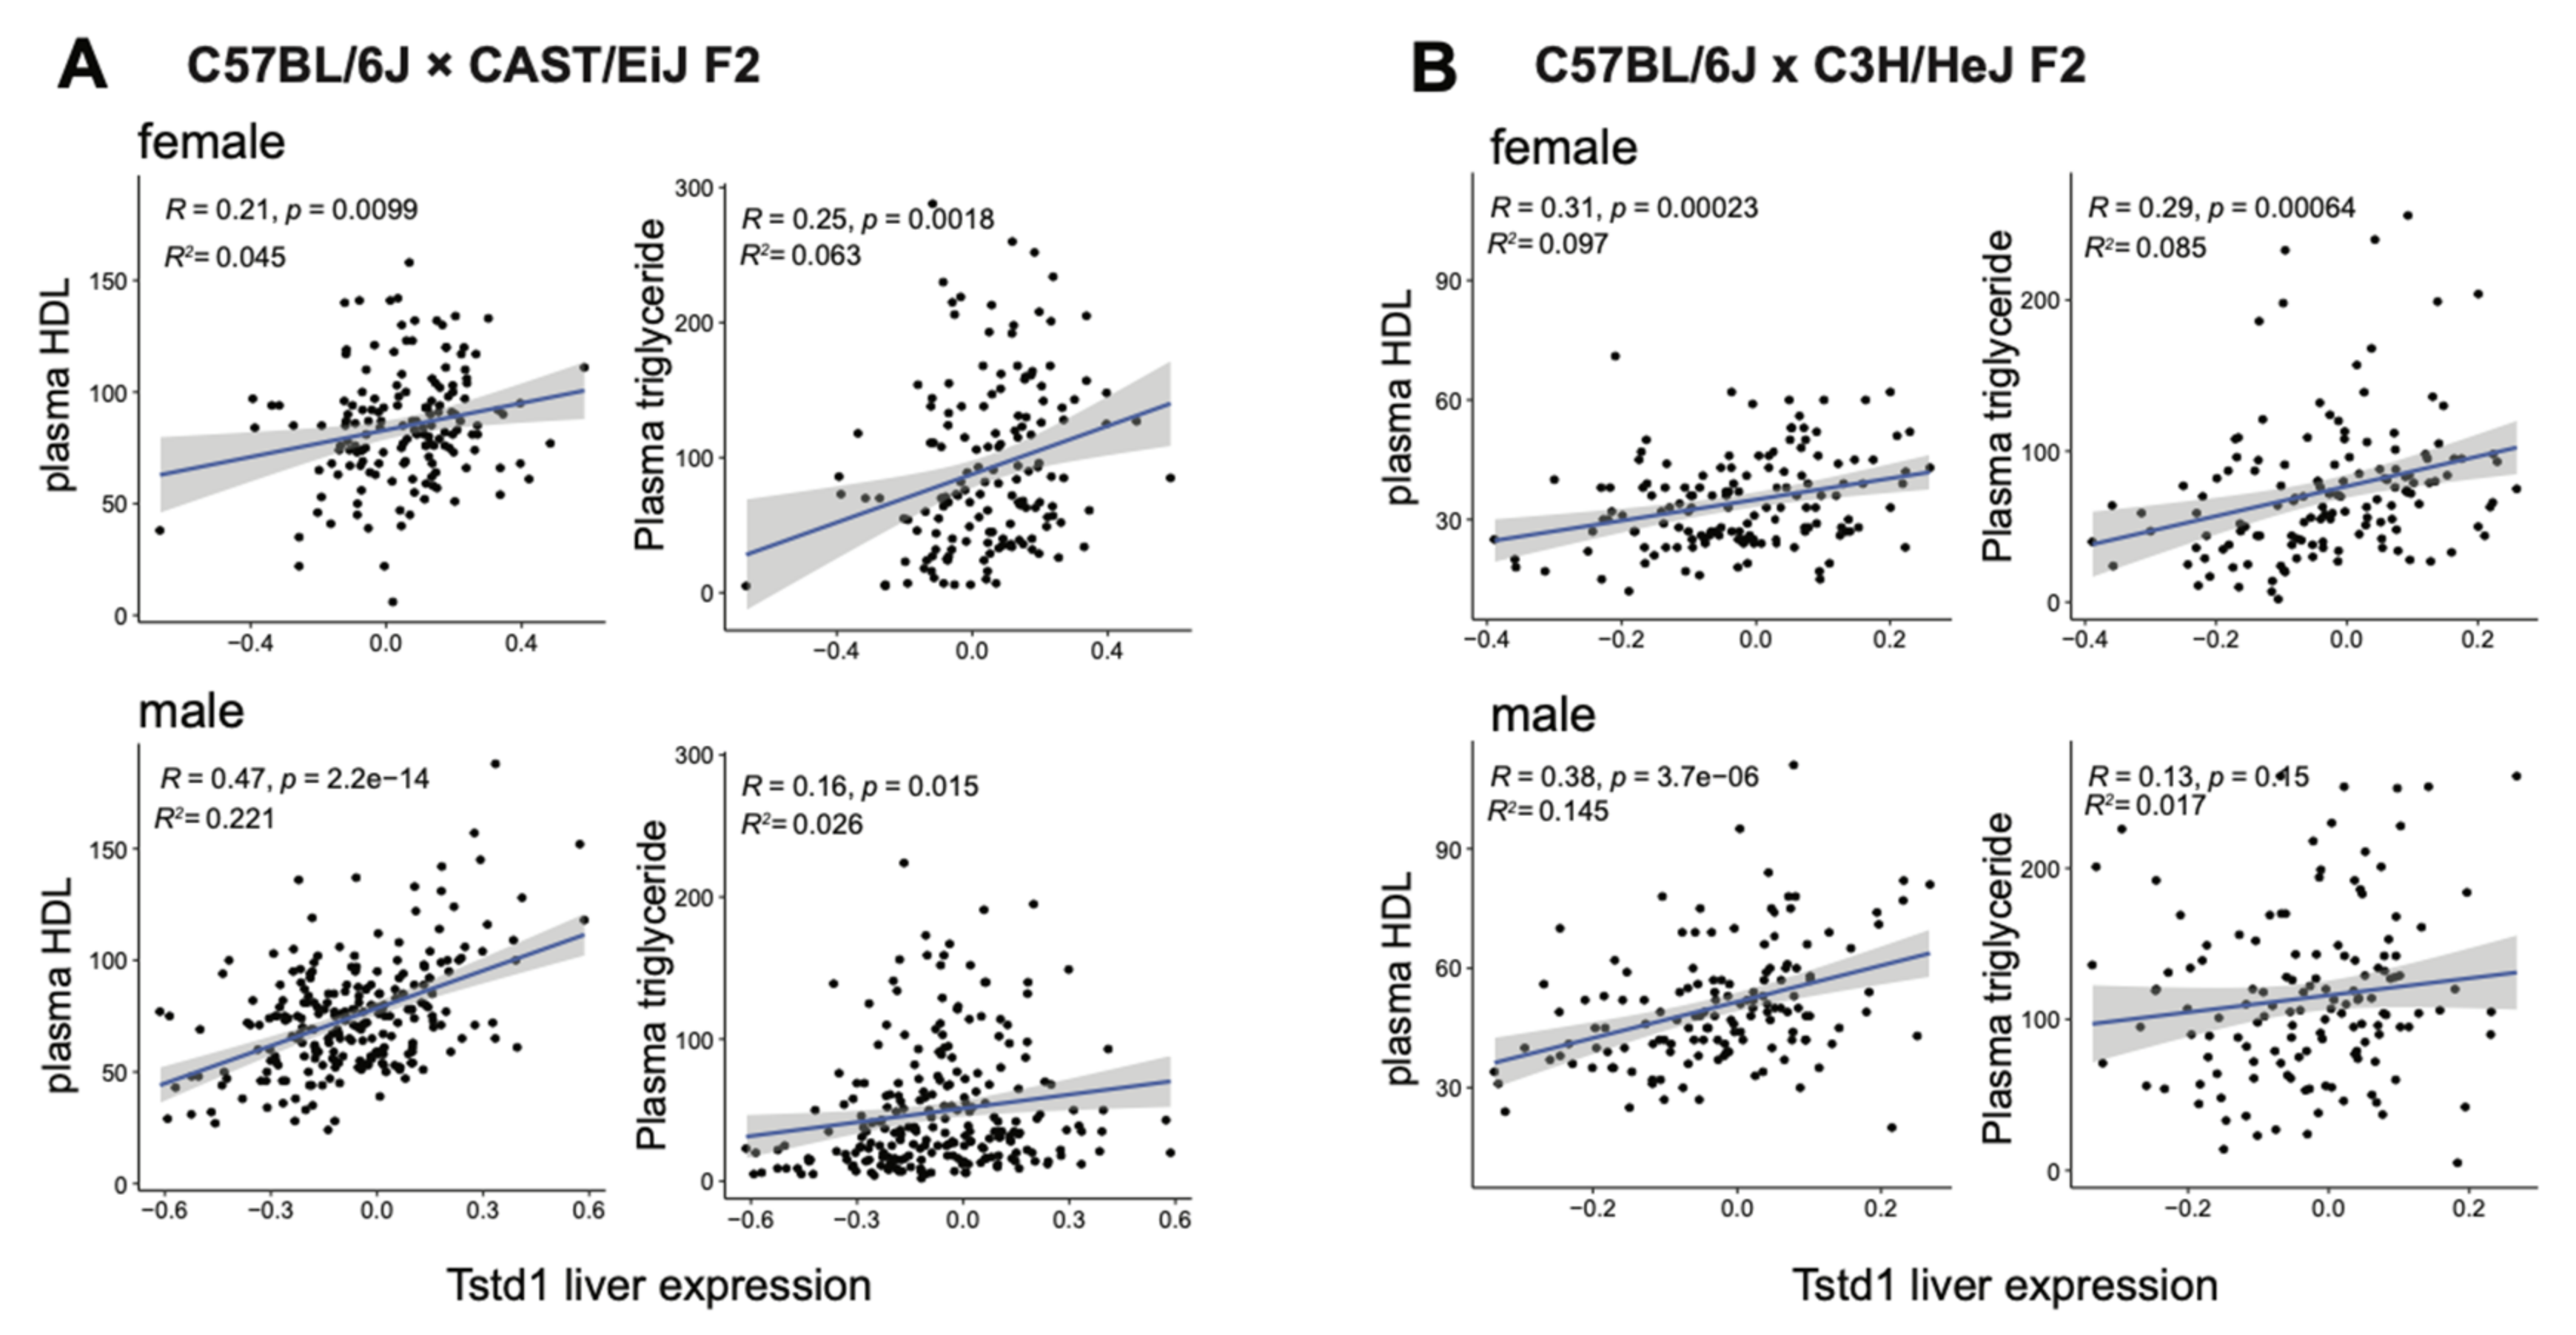
To support our findings from the DO mouse cohort, we validated the connection between Tstd1 and HDL levels using data from other independent mouse studies. As shown in Figure 5A, hepatic Tstd1 levels positively associated with plasma HDL levels in both male and female mice in an F2 cohort derived from C57BL/6J and CAST/EiJ [43]. The result could be further confirmed using another independent F2 mouse cohort derived from C57BL/6J and C3H/HeJ (Figure 5B) [41,54]. These results confirmed the conserved association between Tstd1 and HDL levels across mouse populations.
3.4. Tstd1 Correlates with Genes Involved in HDL and Cholesterol Synthesis
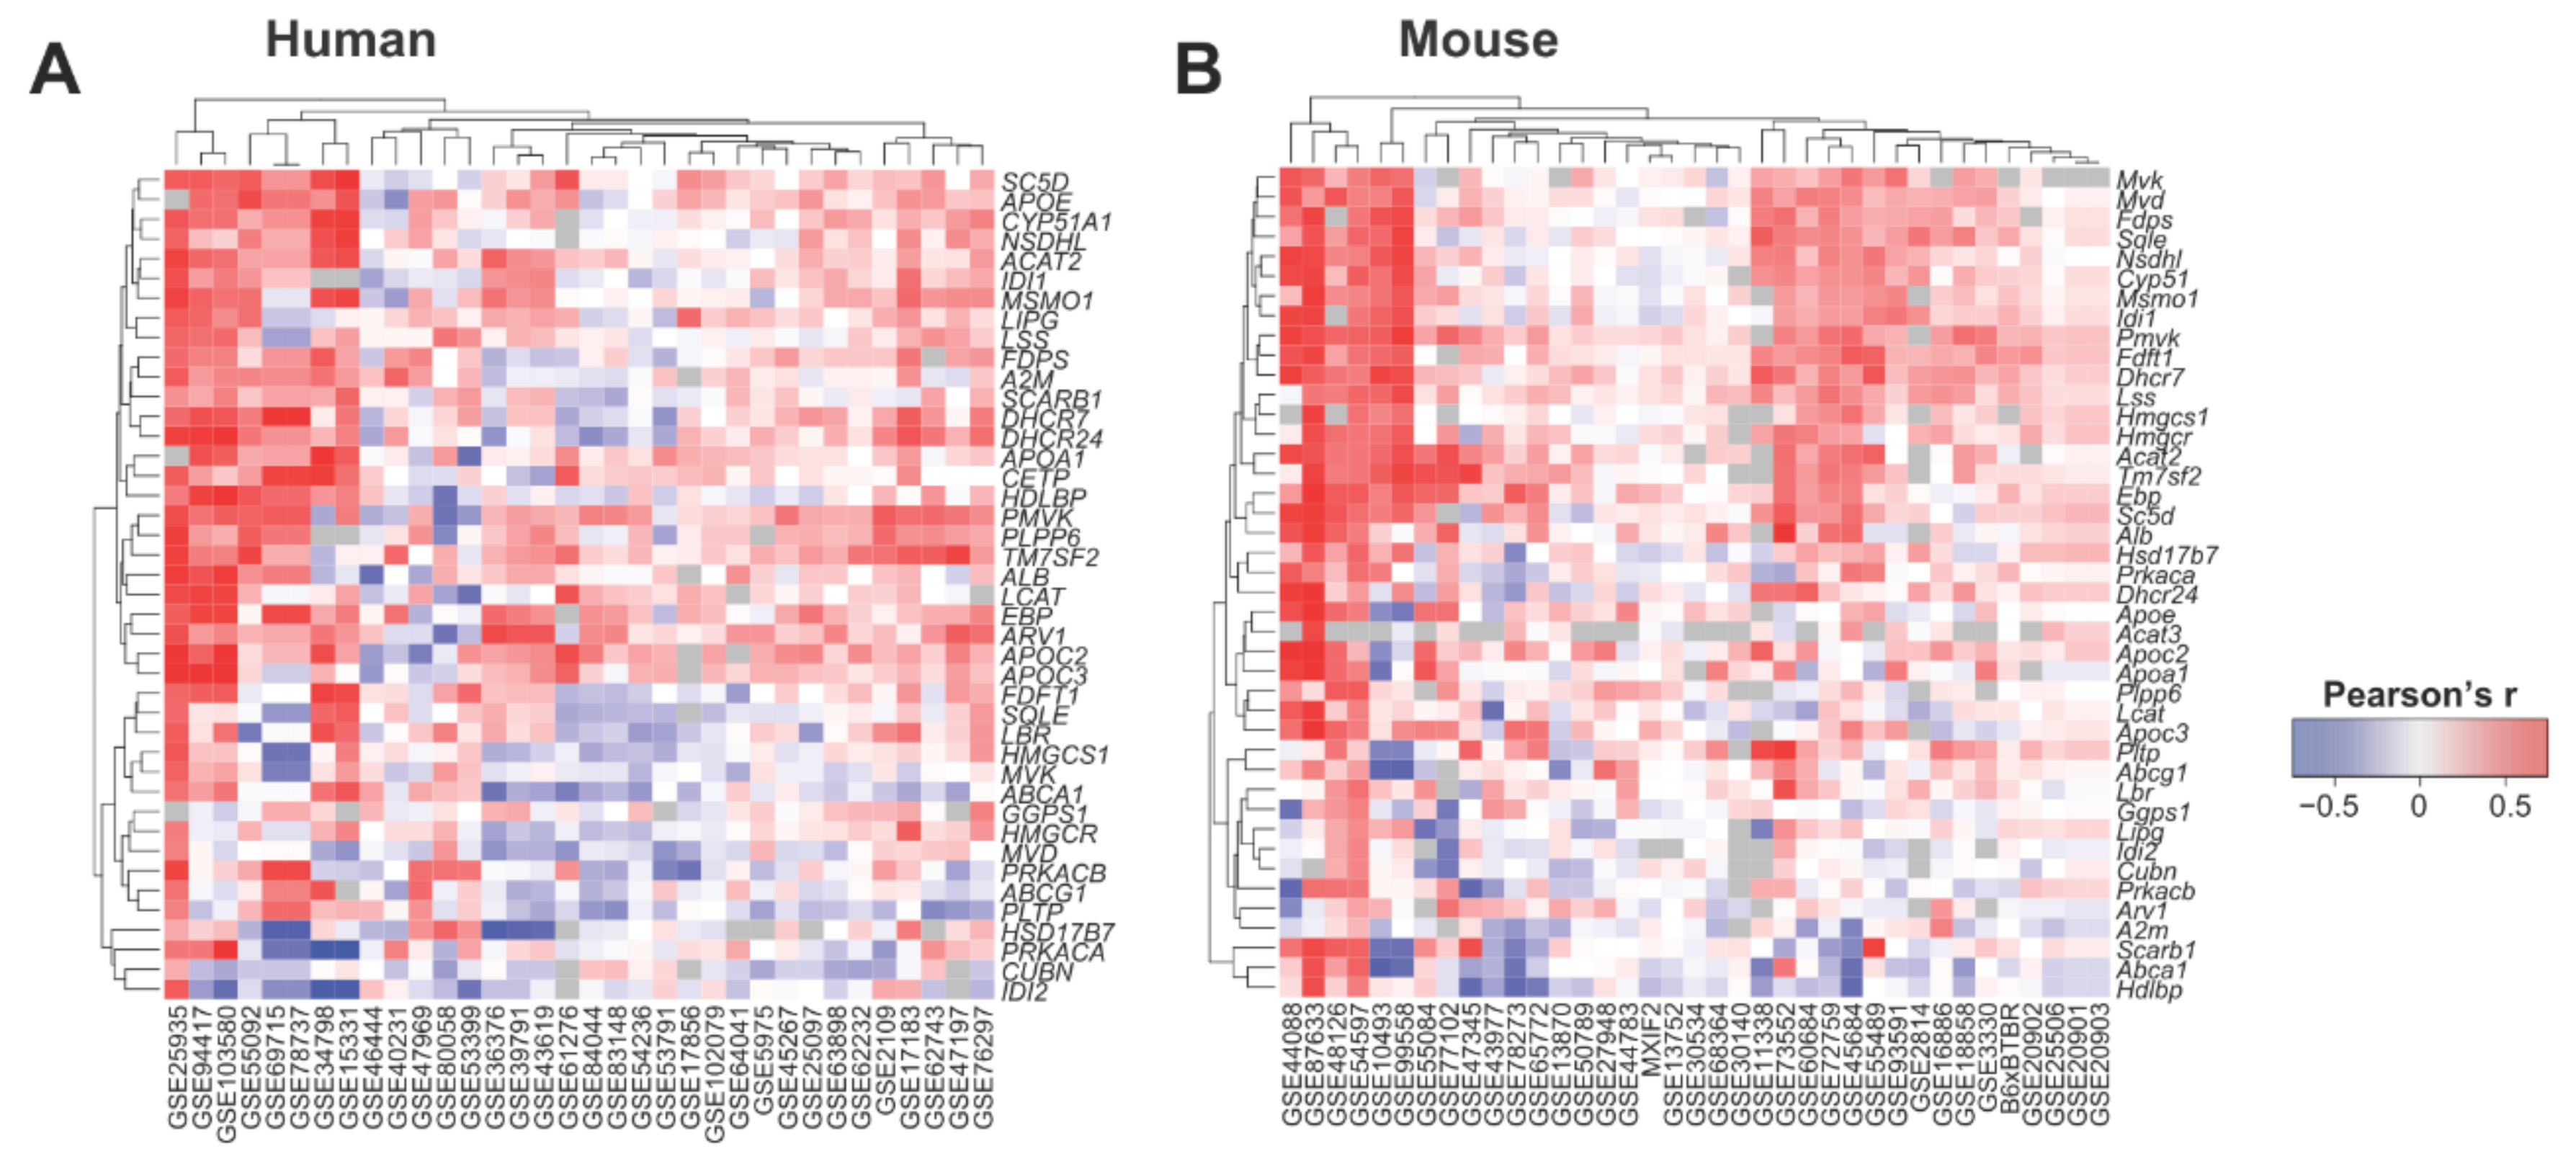
We then tested if the liver expression of TSTD1/Tstd1 correlated with key genes known to be relevant for HDL and cholesterol synthesis using 34 and 37 liver transcriptome datasets obtained from human and mouse, respectively. Indeed, we found consistent positive correlations between TSTD1/Tstd1 and relevant genes in HDL and cholesterol synthesis (Figure 6, Tables S1–S3), suggesting that Tstd1 could influence HDL levels through modulating the genes involved in the molecular processes of cholesterol and HDL synthesis.
3.5. Role of Tstd1 on Lipid Markers and Liver Transcript Profiles in Mice
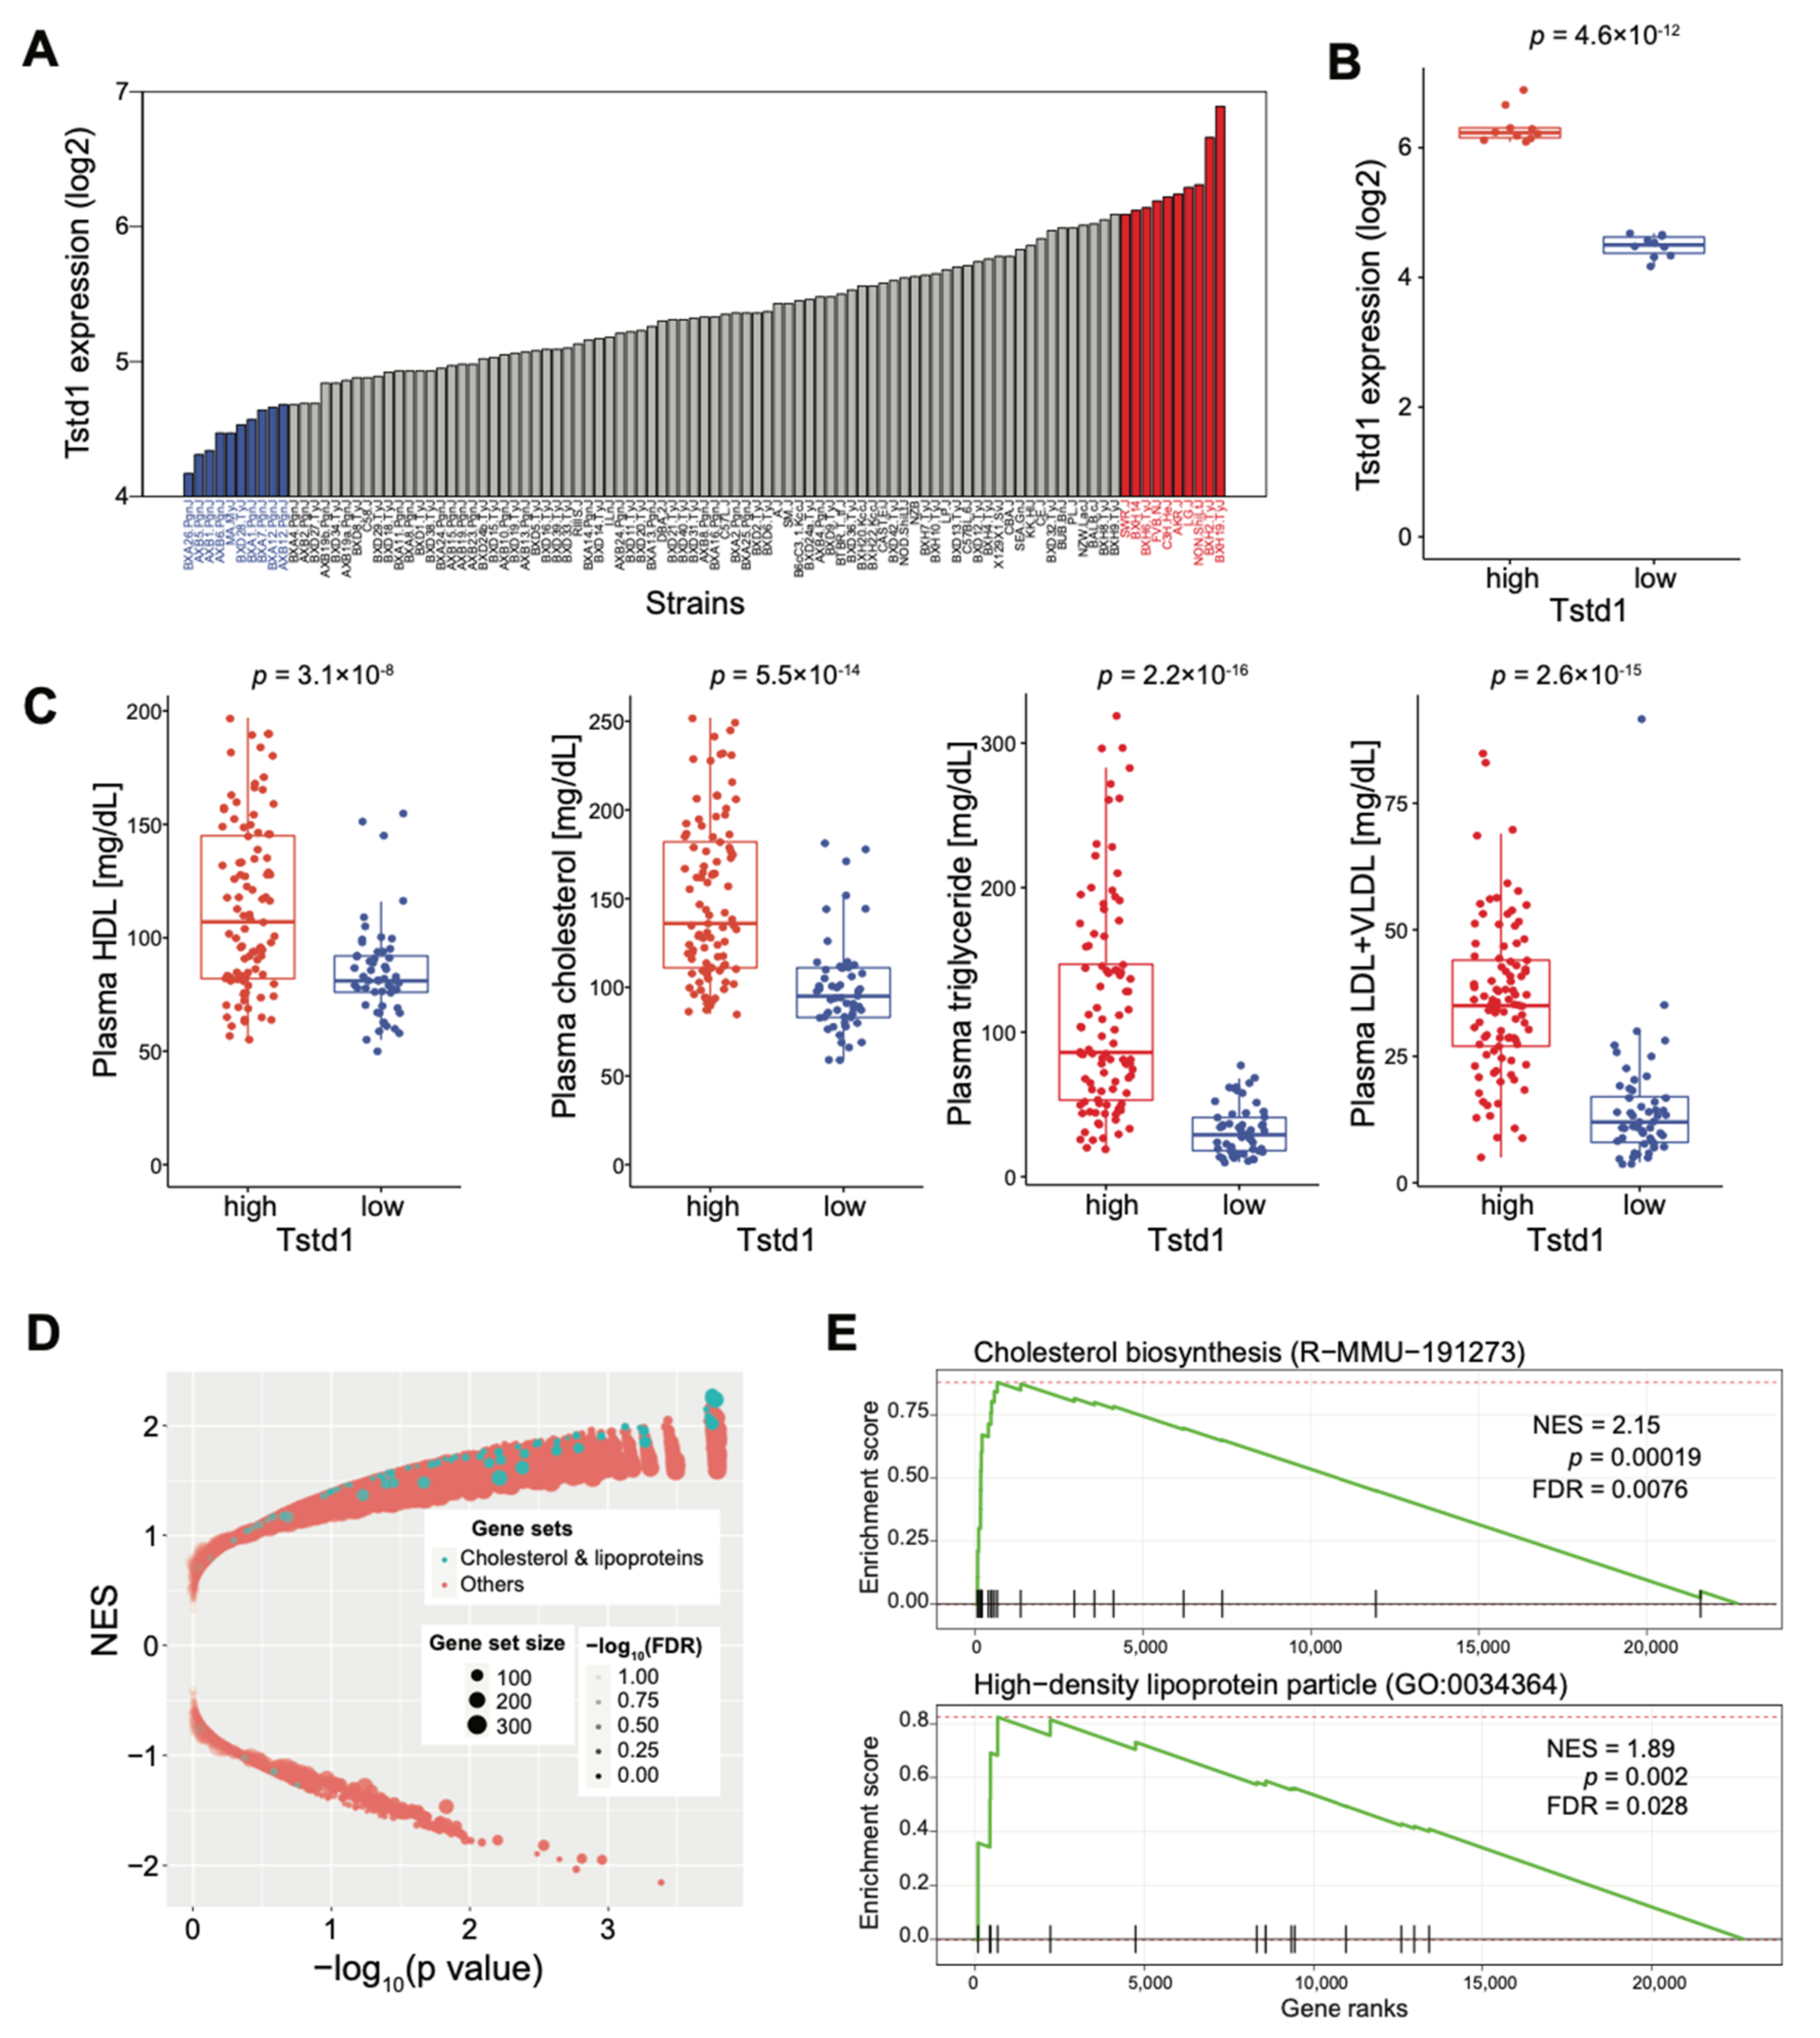
To further explore the link between Tstd1 and HDL, we examined the effect of Tstd1 in lipid-related markers in the Hybrid Mouse Diversity Panel (HMDP) mouse population, which is composed of approximately 100 well-characterized inbred strains [45,55,56]. We first checked the expression variation of Tstd1 in the livers of 99 strains of the HDMP cohort, and observed 6.6-fold differences across the HMDP strains (Figure 7A). We then used 10 strains with the highest or lowest hepatic Tstd1 expression to estimate the differences between lipid-related markers and expression patterns. There was a significant difference between 10 strains with low (blue) and 10 strains with high (red) Tstd1 expression in the livers (Figure 7B). HDL levels were significantly higher in strains with higher Tstd1 expression, as well as other lipid-related markers in the plasma, including total cholesterol, TG, and LDL + VLDL (Figure 7C). We compared the liver gene expression differences between Tstd1-high and Tstd1-low strains and performed gene set enrichment analysis (GSEA) to identify the enriched gene sets between the two groups [49]. We found that gene sets related to cholesterol and lipoproteins, for example, cholesterol biosynthesis and HDL particle gene sets were strongly enriched (Figure 7D,E). These data further confirmed the involvement of Tstd1 in cholesterol and HDL metabolism and a possible mechanism of Tstd1 in modulating HDL levels.
3.6. Tstd1 Associates with Cholesterol and Mitochondrial Pathways
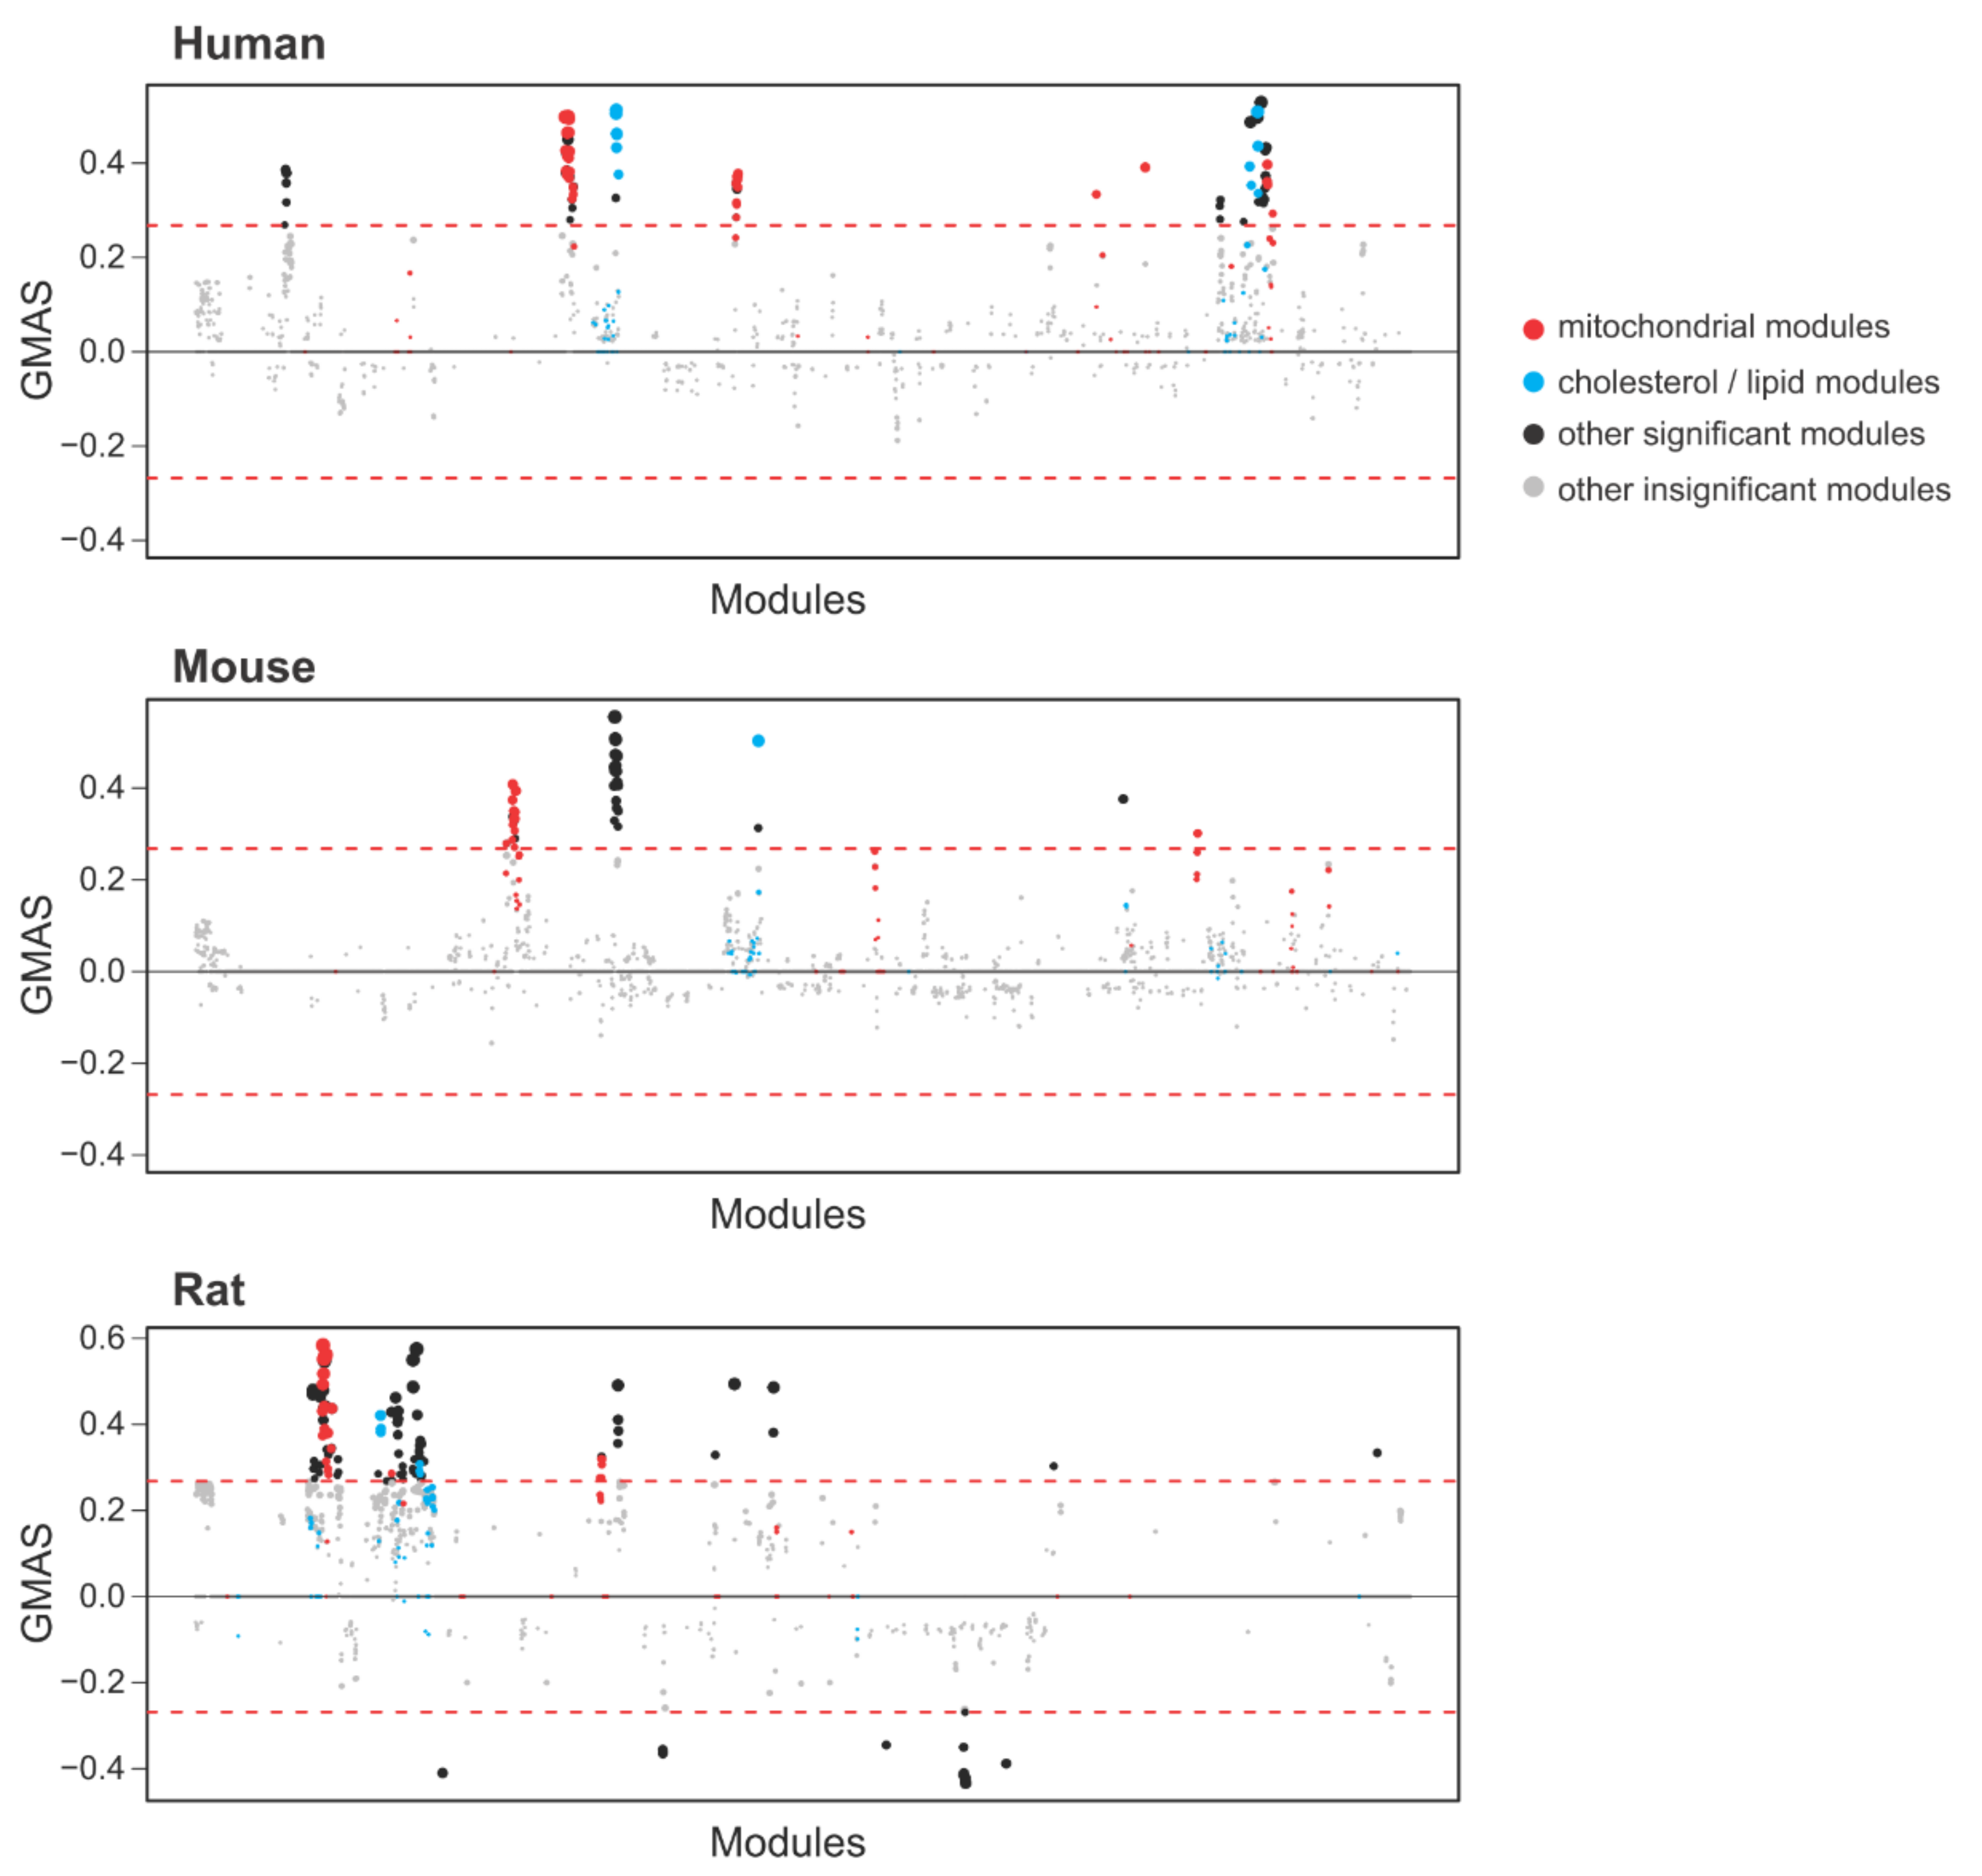
To identify the potential molecular functions of Tstd1, we applied the gene-module association determination (G-MAD) analysis in the GeneBridge toolkit (https://www.systems-genetics.org/genebridge/) on 25 March 2021 [57]. Liver expression data from 42 human datasets, 34 mouse datasets, and 27 rat datasets were used in the analysis. Consistently, we observed positive associations between TSTD1/Tstd1 and pathways related to cholesterol or lipid metabolism, validating our findings that Tstd1 modulates HDL levels (Figure 8, Tables S4–S6). In addition, we found that TSTD1/Tstd1 is significantly associated with mitochondrial pathways in human, mouse and rat, demonstrating the involvement of Tstd1 in regulating mitochondrial functions.
4. Discussion
HDL has been considered protective against many kinds of diseases, including metabolic diseases [1,2,3], cardiovascular diseases [4,5,6,7,8], and cancer [9,10,11]. More than 30 QTLs for HDL have been discovered in humans and mice [20]. However, identifying the causative genes based on only QTL information is challenging, because the number of chromosome recombination events is limited and the QTL regions are normally very broad and include a large number of genes. Most QTLs are located in the noncoding region of the genome, suggesting that these loci influence phenotypic traits by affecting gene expressions (so-called expression QTLs, or eQTLs) [58]. Integration of gene expression information helps to identify genes underlying QTL that are responsible for variances of the phenotypic traits. Many studies using mouse genetic populations identified a significant and conserved QTL on distal chromosome 1 for plasma HDL levels. Though there are many genes in this locus, Apoa2 has been commonly believed to be the causal gene for this QTL [20,23,27,28,32,35,36,37]. However, very limited efforts have been devoted to studying the possible involvement of other genes in this locus on HDL.
Through an unbiased mediation approach, we identified that Tstd1 from this region could be a candidate gene regulating HDL levels. Tstd1 has a cis-eQTL in the liver, which is colocalized with the HDL QTL, suggesting a link between Tstd1 and plasma HDL levels in mice. We further performed TWAS analysis and verified the connection between Tstd1 and plasma HDL. Notably, the association of Tstd1 to HDL is stronger than that of the known HDL-related gene Apoa2. PWAS analysis showed no significant association between liver APOA2 protein levels and plasma HDL. Therefore, these results suggest Tstd1 is a candidate gene for the HDL QTL on chromosome 1 in the DO cohort.
To substantiate our hypothesis, we further tested whether the expression differences in hepatic Tstd1 transcripts were associated with variations in plasma HDL and triglyceride levels using the correlation analysis. The results showed consistent positive correlations between Tstd1 liver transcripts and HDL levels regardless of sex and diet conditions, indicating overexpression of Tstd1 could increase HDL levels. In addition, we confirmed the positive association between Tstd1 and HDL using several independent mouse cohorts, including F2 mouse populations derived from C57BL/6J and CAST/EiJ, and C57BL/6J and C3H/HeJ, respectively. It should be noted that although the correlation between Tstd1 hepatic expression and HDL levels are consistently discovered across several independent mouse cohorts in both genders, Tstd1 expression only explains a small proportion of the total variance of HDL levels.
At the molecular level, Tstd1 correlated with genes involved in cholesterol and lipoprotein modulation, suggesting a potential molecular mechanism of Tstd1 on HDL. We examined the role of Tstd1 on lipid markers and liver profiles using strains from the HMDP cohort expressing high or low Tstd1 levels, and confirmed the involvement of Tstd1 in cholesterol metabolism. Mouse strains with high Tstd1 expression in the liver exhibited increased plasma HDL and cholesterol levels, supporting the potential role of Tstd1 in modulating HDL. Furthermore, Tstd1-high strains showed increased enriched gene sets related to cholesterol and lipoproteins, suggesting that Tstd1 regulates HDL by affecting genes involved in molecular processes for HDL metabolism.
GeneBridge analysis using large-scale expression datasets confirmed the conserved association between TSTD1/Tstd1 and cholesterol or lipid metabolism in human, mouse and rat, and predicted the involvement of TSTD1/Tstd1 in modulating mitochondrial functions. The crosstalk among Tstd1, mitochondria and HDL needs to be further explored. Tstd1 could be a potential linker between mitochondrial function and HDL modulation.
We noticed that Tstd1 was not detected in many earlier versions of microarrays, which could be one of the main reasons why its role in modulating HDL has not been well illustrated. Tstd1 encodes a putative thiosulfate:glutathione sulfurtransferase, but the understanding of its function is greatly limited. Further experiments to evaluate the role of Tstd1 in regulating HDL levels and metabolic status are warranted. Furthermore, validation of the TSTD1-HDL connection in humans is needed. In addition, Tstd1 showed conserved association with cholesterol and mitochondrial pathways, and the underlying mechanism remains to be studied.
In summary, we identified Tstd1 as a novel candidate gene regulating plasma HDL levels and mitochondrial function through integrative analyses, which could provide a potential therapeutic target for relevant diseases. Our study provides an efficient model for the identification of candidate genes involved in complex traits such as HDL levels.
Supplementary Materials
The following are available online at https://www.mdpi.com/article/10.3390/cells10112976/s1, Table S1. List of derived datasets derived from human or mouse liver used in this study. Table S2. Correlation coefficients between TSTD1 and all genes in 34 human liver transcriptomics datasets. Table S3. Correlation coefficients between Tstd1 and all genes in 37 mouse liver transcriptomics datasets. Table S4. G-MAD results for TSTD1 using 42 human liver expression datasets. Table S5. G-MAD results for Tstd1 using 34 mouse liver expression datasets. Table S6. G-MAD results for Tstd1 using 27 rat liver expression datasets.
Author Contributions
A.Z. and H.L. conceived the study and analyzed the data. A.Z. and H.L. wrote the original draft. Z.F. and J.L. reviewed and edited the manuscript. Z.F. and J.L. supervised the project and acquired funding. All authors have read and agreed to the published version of the manuscript.
Funding
This research was funded by the National Natural Science Foundation of China (81571050, 32071154 to Z.F.; 31770917, 31570777, 91649106 to J.L.) and the National Basic Research Program (2015CB553602 to J.L.). The APC was fully waived.
Data Availability Statement
Data was obtained and are available from Gene Expression Omnibus (https://www.ncbi.nlm.nih.gov/geo/), Diversity Outbred Database (https://do.jax.org/), Mouse Phenome Database (https://phenome.jax.org/), GeneBridge (https://www.systems-genetics.org/genebridge/), and GeneNetwork (http://genenetwork.org/).
Acknowledgments
We are grateful for the research groups that made their data publicly available.
Conflicts of Interest
The authors declare no conflict of interest.
References
- von Eckardstein, A.; Widmann, C. High-density lipoprotein, beta cells, and diabetes. Cardiovasc. Res. 2014, 103, 384–394. [Google Scholar] [CrossRef] [PubMed] [Green Version]
- Klancic, T.; Woodward, L.; Hofmann, S.M.; Fisher, E.A. High density lipoprotein and metabolic disease: Potential benefits of restoring its functional properties. Mol. Metab. 2016, 5, 321–327. [Google Scholar] [CrossRef]
- Drew, B.G.; Rye, K.A.; Duffy, S.J.; Barter, P.; Kingwell, B.A. The emerging role of HDL in glucose metabolism. Nat. Rev. Endocrinol. 2012, 8, 237–245. [Google Scholar] [CrossRef] [PubMed]
- Boekholdt, S.M.; Arsenault, B.J.; Hovingh, G.K.; Mora, S.; Pedersen, T.R.; Larosa, J.C.; Welch, K.M.; Amarenco, P.; Demicco, D.A.; Tonkin, A.M.; et al. Levels and changes of HDL cholesterol and apolipoprotein A-I in relation to risk of cardiovascular events among statin-treated patients: A meta-analysis. Circulation 2013, 128, 1504–1512. [Google Scholar] [CrossRef] [Green Version]
- Linsel-Nitschke, P.; Tall, A.R. HDL as a target in the treatment of atherosclerotic cardiovascular disease. Nat. Rev. Drug Discov. 2005, 4, 193–205. [Google Scholar] [CrossRef] [PubMed]
- Rader, D.J.; Hovingh, G.K. HDL and cardiovascular disease. Lancet 2014, 384, 618–625. [Google Scholar] [CrossRef]
- Rosenson, R.S.; Brewer, H.B., Jr.; Ansell, B.J.; Barter, P.; Chapman, M.J.; Heinecke, J.W.; Kontush, A.; Tall, A.R.; Webb, N.R. Dysfunctional HDL and atherosclerotic cardiovascular disease. Nat. Rev. Cardiol. 2016, 13, 48–60. [Google Scholar] [CrossRef] [PubMed]
- Rosenson, R.S.; Brewer, H.B., Jr.; Barter, P.J.; Bjorkegren, J.L.M.; Chapman, M.J.; Gaudet, D.; Kim, D.S.; Niesor, E.; Rye, K.-A.; Sacks, F.M.; et al. HDL and atherosclerotic cardiovascular disease: Genetic insights into complex biology. Nat. Rev. Cardiol. 2018, 15, 9–19. [Google Scholar] [CrossRef] [PubMed]
- Kucharska-Newton, A.M.; Rosamond, W.D.; Mink, P.J.; Alberg, A.J.; Shahar, E.; Folsom, A.R. HDL-cholesterol and incidence of breast cancer in the ARIC cohort study. Ann. Epidemiol. 2008, 18, 671–677. [Google Scholar] [CrossRef]
- Borgquist, S.; Butt, T.; Almgren, P.; Shiffman, D.; Stocks, T.; Orho-Melander, M.; Manjer, J.; Melander, O. Apolipoproteins, lipids and risk of cancer. Int. J. Cancer. 2016, 138, 2648–2656. [Google Scholar] [CrossRef] [PubMed]
- Morin, E.E.; Li, X.A.; Schwendeman, A. HDL in Endocrine Carcinomas: Biomarker, Drug Carrier, and Potential Therapeutic. Front. Endocrinol. 2018, 9, 715. [Google Scholar] [CrossRef] [Green Version]
- Vaziri, N.D.; Navab, M.; Fogelman, A.M. HDL metabolism and activity in chronic kidney disease. Nat. Rev. Nephrol. 2010, 6, 287–296. [Google Scholar] [CrossRef] [PubMed]
- Camara, A.K.; Lesnefsky, E.J.; Stowe, D.F. Potential therapeutic benefits of strategies directed to mitochondria. Antioxid. Redox Signal. 2010, 13, 279–347. [Google Scholar] [CrossRef] [PubMed] [Green Version]
- Murphy, M.P.; Hartley, R.C. Mitochondria as a therapeutic target for common pathologies. Nat. Rev. Drug Discov. 2018, 17, 865–886. [Google Scholar] [CrossRef] [PubMed] [Green Version]
- Gorman, G.S.; Chinnery, P.F.; DiMauro, S.; Hirano, M.; Koga, Y.; McFarland, R.; Suomalainen, A.; Thorburn, D.R.; Zeviani, M.; Turnbull, M.D. Mitochondrial diseases. Nat. Rev. Dis. Primers 2016, 2, 16080. [Google Scholar] [CrossRef] [PubMed]
- White, C.R.; Datta, G.; Giordano, S. High-Density Lipoprotein Regulation of Mitochondrial Function. Adv. Exp. Med. Biol. 2017, 982, 407–429. [Google Scholar] [PubMed] [Green Version]
- Flaquer, A.; Rospleszcz, S.; Reischl, E.; Zeilinger, S.; Prokisch, H.; Meitinger, T.; Meisinger, C.; Peters, A.; Waldenberger, M.; Grallert, H.; et al. Mitochondrial GWA Analysis of Lipid Profile Identifies Genetic Variants to Be Associated with HDL Cholesterol and Triglyceride Levels. PLoS ONE 2015, 10, e0126294. [Google Scholar] [CrossRef] [PubMed]
- Siri-Tarino, P.W. Effects of diet on high-density lipoprotein cholesterol. Curr. Atheroscler. Rep. 2011, 13, 453–460. [Google Scholar] [CrossRef]
- Ruiz-Ramie, J.J.; Barber, J.L.; Sarzynski, M.A. Effects of exercise on HDL functionality. Curr. Opin. Lipidol. 2019, 30, 16–23. [Google Scholar] [CrossRef] [PubMed]
- Wang, X.; Paigen, B. Genetics of variation in HDL cholesterol in humans and mice. Circ. Res. 2005, 96, 27–42. [Google Scholar] [CrossRef] [PubMed]
- Gordon, S.M.; Li, H.; Zhu, X.; Shah, A.S.; Lu, L.J.; Davidson, W.S. A comparison of the mouse and human lipoproteome: Suitability of the mouse model for studies of human lipoproteins. J. Proteome Res. 2015, 14, 2686–2695. [Google Scholar] [CrossRef] [Green Version]
- Li, H.; Auwerx, J. Mouse Systems Genetics as a Prelude to Precision Medicine. Trends Genet. 2020, 36, 259–272. [Google Scholar] [CrossRef] [Green Version]
- Kang, E.Y.; Han, B.; Furlotte, N.; Joo, J.W.; Shih, D.; Davis, R.C.; Lusis, A.J.; Eskin, E. Meta-analysis identifies gene-by-environment interactions as demonstrated in a study of 4,965 mice. PLoS Genet. 2014, 10, e1004022. [Google Scholar] [CrossRef] [Green Version]
- Hoekstra, M.; Van Eck, M. Mouse models of disturbed HDL metabolism. Handb. Exp. Pharmacol. 2015, 224, 301–336. [Google Scholar] [PubMed] [Green Version]
- Oppi, S.; Luscher, T.F.; Stein, S. Mouse Models for Atherosclerosis Research-Which Is My Line? Front. Cardiovasc. Med. 2019, 6, 46. [Google Scholar] [CrossRef] [Green Version]
- Leduc, M.S.; Lyons, M.; Darvishi, K.; Walsh, K.; Sheehan, S.; Amend, S.; Cox, A.; Orho-Melander, M.; Kathiresan, S.; Paigen, B.; et al. The mouse QTL map helps interpret human genome-wide association studies for HDL cholesterol. J. Lipid Res. 2011, 52, 1139–1149. [Google Scholar] [CrossRef] [PubMed] [Green Version]
- Wittenburg, H.; Lyons, M.A.; Li, R.; Kurtz, U.; Wang, X.; Mossner, J.; Carey, M.C.; Paigen, B. QTL mapping for genetic determinants of lipoprotein cholesterol levels in combined crosses of inbred mouse strains. J. Lipid Res. 2006, 47, 1780–1790. [Google Scholar] [CrossRef] [PubMed] [Green Version]
- Wang, X.; Paigen, B. Quantitative trait loci and candidate genes regulating HDL cholesterol: A murine chromosome map. Arterioscler. Thromb. Vasc. Biol. 2002, 22, 1390–1401. [Google Scholar] [CrossRef] [PubMed] [Green Version]
- Leduc, M.S.; Blair, R.H.; Verdugo, R.A.; Tsaih, S.W.; Walsh, K.; Churchill, G.A.; Paigen, B. Using bioinformatics and systems genetics to dissect HDL-cholesterol genetics in an MRL/MpJ x SM/J intercross. J. Lipid Res. 2012, 53, 1163–1175. [Google Scholar] [CrossRef] [PubMed] [Green Version]
- Gatti, D.M.; Simecek, P.; Somes, L.; Jeffrey, C.T.; Vincent, M.J.; Choi, K.; Chen, X.; Churchill, G.A.; Svenson, K.L. The Effects of Sex and Diet on Physiology and Liver Gene Expression in Diversity Outbred Mice. bioRxiv 2017, 098657. [Google Scholar] [CrossRef] [Green Version]
- Saul, M.C.; Philip, V.M.; Reinholdt, L.G. Center for Systems Neurogenetics of A, Chesler EJ. High-Diversity Mouse Populations for Complex Traits. Trends Genet. 2019, 35, 501–514. [Google Scholar] [CrossRef] [PubMed] [Green Version]
- Zhang, W.; Korstanje, R.; Thaisz, J.; Staedtler, F.; Harttman, N.; Xu, L.; Feng, M.; Yanas, L.; Yang, H.; Valdar, W.; et al. Genome-wide association mapping of quantitative traits in outbred mice. G3 2012, 2, 167–174. [Google Scholar] [CrossRef] [PubMed] [Green Version]
- Svenson, K.L.; Gatti, D.M.; Valdar, W.; Welsh, C.E.; Cheng, R.; Chesler, E.J.; Palmer, A.A.; McMillan, L.; Churchill, G.A. High-resolution genetic mapping using the Mouse Diversity outbred population. Genetics 2012, 190, 437–447. [Google Scholar] [CrossRef] [PubMed] [Green Version]
- Flint, J.; Eskin, E. Genome-wide association studies in mice. Nat. Rev. Genet. 2012, 13, 807–817. [Google Scholar] [CrossRef] [PubMed] [Green Version]
- Wang, X.; Korstanje, R.; Higgins, D.; Paigen, B. Haplotype analysis in multiple crosses to identify a QTL gene. Genome Res. 2004, 14, 1767–1772. [Google Scholar] [CrossRef] [PubMed] [Green Version]
- Ackert-Bicknell, C.; Paigen, B.; Korstanje, R. Recalculation of 23 mouse HDL QTL datasets improves accuracy and allows for better candidate gene analysis. J. Lipid Res. 2013, 54, 984–994. [Google Scholar] [CrossRef] [PubMed] [Green Version]
- Lu, Z.; Yuan, Z.; Miyoshi, T.; Wang, Q.; Su, Z.; Chang, C.C.; Shi, W. Identification of Soat1 as a quantitative trait locus gene on mouse chromosome 1 contributing to hyperlipidemia. PLoS ONE 2011, 6, e25344. [Google Scholar] [CrossRef] [PubMed]
- Broman, K.W.; Gatti, D.M.; Simecek, P.; Furlotte, N.A.; Prins, P.; Sen, S.; Yandell, B.S.; Churchill, G.A. R/qtl2: Software for Mapping Quantitative Trait Loci with High-Dimensional Data and Multiparent Populations. Genetics 2019, 211, 495–502. [Google Scholar] [CrossRef] [PubMed] [Green Version]
- Chick, J.M.; Munger, S.C.; Simecek, P.; Huttlin, E.L.; Choi, K.; Gatti, D.M.; Raghupathy, N.; Svenson, K.L.; Churchill, G.A.; Gygi, S.P. Defining the consequences of genetic variation on a proteome-wide scale. Nature 2016, 534, 500–505. [Google Scholar] [CrossRef] [PubMed] [Green Version]
- Wang, S.; Yehya, N.; Schadt, E.E.; Wang, H.; Drake, T.A.; Lusis, A.J. Genetic and genomic analysis of a fat mass trait with complex inheritance reveals marked sex specificity. PLoS Genet. 2006, 2, e15. [Google Scholar] [CrossRef] [Green Version]
- Yang, X.; Schadt, E.E.; Wang, S.; Wang, H.; Arnold, A.P.; Ingram-Drake, L.; Drake, T.A.; Lusis, A.J. Tissue-specific expression and regulation of sexually dimorphic genes in mice. Genome Res. 2006, 16, 995–1004. [Google Scholar] [CrossRef] [PubMed] [Green Version]
- Langfelder, P.; Castellani, L.W.; Zhou, Z.; Paul, E.; Davis, R.; Schadt, E.E.; Lusis, A.J.; Horvath, S.; Mehrabian, M. A systems genetic analysis of high density lipoprotein metabolism and network preservation across mouse models. Biochim. Biophys. Acta 2012, 1821, 435–447. [Google Scholar] [CrossRef] [PubMed] [Green Version]
- Schadt, E.E.; Molony, C.; Chudin, E.; Hao, K.; Yang, X.; Lum, P.Y.; Kasarskis, A.; Zhang, B.; Wang, S.; Suver, C.; et al. Mapping the genetic architecture of gene expression in human liver. PLoS Biol. 2008, 6, e107. [Google Scholar] [CrossRef] [Green Version]
- Langfelder, P.; Horvath, S. WGCNA: An R package for weighted correlation network analysis. BMC Bioinform. 2008, 9, 559. [Google Scholar] [CrossRef] [PubMed] [Green Version]
- Bennett, B.J.; Farber, C.R.; Orozco, L.; Kang, H.M.; Ghazalpour, A.; Siemers, N.; Neubauer, M.; Neuhaus, I.; Yordanova, R.; Guan, B.; et al. A high-resolution association mapping panel for the dissection of complex traits in mice. Genome Res. 2010, 20, 281–290. [Google Scholar] [CrossRef] [Green Version]
- Ghazalpour, A.; Bennett, B.J.; Shih, D.; Che, N.; Orozco, L.; Pan, C.; Hagopian, R.; He, A.; Kayne, P.; Yang, W.; et al. Genetic regulation of mouse liver metabolite levels. Mol. Syst. Biol. 2014, 10, 730. [Google Scholar] [CrossRef] [PubMed]
- Bogue, M.A.; Philip, V.M.; Walton, D.O.; Grubb, S.C.; Dunn, M.H.; Kolishovski, G.; Emerson, J.; Mukherjee, G.; Stearns, T.; He, H.; et al. Mouse Phenome Database: A data repository and analysis suite for curated primary mouse phenotype data. Nucleic Acids Res. 2020, 48, D716–D723. [Google Scholar] [CrossRef] [PubMed]
- Korotkevich, G.; Sukhov, V.; Budin, N.; Shpak, B.; Artyomov, M.N.; Sergushichev, A. Fast gene set enrichment analysis. bioRxiv 2021, 060012. [Google Scholar] [CrossRef] [Green Version]
- Subramanian, A.; Tamayo, P.; Mootha, V.K.; Mukherjee, S.; Ebert, B.L.; Gillette, M.A.; Paulovich, A.; Pomeroy, S.L.; Golub, T.R.; Lander, E.S.; et al. Gene set enrichment analysis: A knowledge-based approach for interpreting genome-wide expression profiles. Proc. Natl. Acad. Sci. USA 2005, 102, 15545–15550. [Google Scholar] [CrossRef] [Green Version]
- Jassal, B.; Matthews, L.; Viteri, G.; Gong, C.; Lorente, P.; Fabregat, A.; Sidiropoulos, K.; Cook, J.; Gillespie, M.; Haw, R.; et al. The reactome pathway knowledgebase. Nucleic Acids Res. 2020, 48, D498–D503. [Google Scholar] [CrossRef] [PubMed]
- Cao, K.; Xu, J.; Zou, X.; Li, Y.; Chen, C.; Zheng, A.; Li, H.; Li, H.; Szeto, I.M.-Y.; Shi, Y.; et al. Hydroxytyrosol prevents diet-induced metabolic syndrome and attenuates mitochondrial abnormalities in obese mice. Free Radic. Biol. Med. 2014, 67, 396–407. [Google Scholar] [CrossRef]
- Su, Z.; Leduc, M.S.; Korstanje, R.; Paigen, B. Untangling HDL quantitative trait loci on mouse chromosome 5 and identifying Scarb1 and Acads as the underlying genes. J. Lipid Res. 2010, 51, 2706–2713. [Google Scholar] [CrossRef] [PubMed] [Green Version]
- Wolf, G. High-fat, high-cholesterol diet raises plasma HDL cholesterol: Studies on the mechanism of this effect. Nutr. Rev. 1996, 54 Pt 1, 34–35. [Google Scholar] [CrossRef] [PubMed]
- Wang, S.S.; Schadt, E.E.; Wang, H.; Wang, X.; Ingram-Drake, L.; Shi, W.; Drake, T.A.; Lusis, A.J. Identification of pathways for atherosclerosis in mice: Integration of quantitative trait locus analysis and global gene expression data. Circ. Res. 2007, 101, e11–e30. [Google Scholar] [CrossRef] [PubMed] [Green Version]
- Lusis, A.J.; Seldin, M.M.; Allayee, H.; Bennett, B.J.; Civelek, M.; Davis, R.C.; Eskin, E.; Farber, C.; Hui, S.; Mehrabian, M.; et al. The Hybrid Mouse Diversity Panel: A resource for systems genetics analyses of metabolic and cardiovascular traits. J. Lipid Res. 2016, 57, 925–942. [Google Scholar] [CrossRef] [Green Version]
- Hui, S.T.; Parks, B.W.; Org, E.; Norheim, F.; Che, N.; Pan, C.; Castellani, L.W.; Charugundla, S.; Dirks, D.L.; Psychogios, N.; et al. The genetic architecture of NAFLD among inbred strains of mice. eLife 2015, 4, e05607. [Google Scholar] [CrossRef] [PubMed]
- Li, H.; Rukina, D.; David, F.P.A.; Li, T.Y.; Oh, C.M.; Gao, A.W.; Katsyuba, E.; Sleiman, M.B.; Komljenovic, A.; Huang, Q.; et al. Identifying gene function and module connections by the integration of multispecies expression compendia. Genome Res. 2019, 29, 2034–2045. [Google Scholar] [CrossRef] [PubMed] [Green Version]
- Albert, F.W.; Kruglyak, L. The role of regulatory variation in complex traits and disease. Nat. Rev. Genet. 2015, 16, 197–212. [Google Scholar] [CrossRef] [PubMed]
Figure 1.
Influence of diet and sex on plasma HDL levels in a diversity outbred (DO) mouse cohort. Plasma HDLs were measured for 835 mice at 8 weeks of age. Statistical significance between different groups was determined by two-way ANOVA. ***, p < 0.001.
Figure 1.
Influence of diet and sex on plasma HDL levels in a diversity outbred (DO) mouse cohort. Plasma HDLs were measured for 835 mice at 8 weeks of age. Statistical significance between different groups was determined by two-way ANOVA. ***, p < 0.001.

Figure 2.
QTL and mediation analysis revealed Tstd1 as a potential modulator for plasma HDL levels in the DO mouse cohort. (A) QTL plot showed the genome-wide linkage of plasma HDL levels in the DO mouse cohort. Chromosomes are represented across the x-axis and the significance of QTLs (log of odds, LOD) is represented on the y-axis. The vertical red dashed line indicates the QTL peak on chromosome 1. (B) Mediation analysis identified the possible mediators for the HDL QTL on chromosome 1. Genes are plotted across the x-axis based on their genetic positions on chromosomes. The conditional QTL scores for all genes in the mediation analysis are represented on the y-axis. The vertical red dashed line indicates the QTL peak for HDL on chromosome 1. (C) eQTL plot for Tstd1 in the liver of the DO mouse cohort. Tstd1 mapped a cis-eQTL at the same locus of the QTL for HDL levels.

Figure 3.
Transcriptome-wide association study (TWAS) further confirmed the association between the plasma HDL and Tstd1. (A) Manhattan plot depicting the associations of transcripts with positive effects (increased expression leads to higher HDL levels) and transcripts with negative effects (increased expression leads to lower HDLs). Transcripts were plotted across the chromosomes with x-axis as the chromosome coordinates and y-axis as the significance of the association. The threshold for transcriptome-wide significance was determined based on the number of transcripts tested (p < 4.2 × 10⁻⁶, red dashed line). (B) Correlations between Tstd1 liver expression and plasma HDL levels in the DO mouse cohort. Individual animals were divided into four groups based on their sex and diet conditions. The Pearson’s correlation coefficient and significance were indicated.

Figure 4.
Proteome-wide association study (PWAS) revealed a non-significant association between the plasma HDL and APOA2. Manhattan plot depicting the associations of proteins with positive effects (increased expression leads to higher HDL levels) and proteins with negative effects (increased expression leads to lower HDLs). Proteins were plotted across the chromosomes with x-axis as the chromosome coordinates and y-axis as the significance of the association. The threshold for proteome-wide significance was determined based on the number of proteins tested (p < 7.4 × 10⁻⁶, red dashed line).

Figure 5.
Validation of the link between Tstd1 and HDLs using independent mouse cohorts. Correlations between liver Tstd1 expression and plasma HDL and triglyceride levels were investigated in male and female mice from the F2 cohorts derived from C57BL/6J and CAST/EiJ (A) and C57BL/6J and C3H/HeJ (B) Pearson’s correlation coefficients and p-values were indicated.

Figure 6.
Tstd1 co-expressed with key genes involved in HDL and cholesterol synthesis in human and mouse. Heatmap showing the correlations between TSTD1/Tstd1 and key HDL and cholesterol genes in 34 and 37 liver transcriptome datasets from human (A) and mouse (B), respectively. Pearson’s correlation coefficients are indicated in the heatmap.

Figure 7.
Impact of Tstd1 on lipid levels in the HMDP mouse population. (A) The expression of hepatic Tstd1 in the mouse strains at 16 weeks of age. The 10 Tstd1-high (red) or Tstd1-low (blue) strains with the highest and lowest hepatic Tstd1 expression levels in the HMDP population, respectively. (B) The Tstd1 liver expression in the Tstd1-high and Tstd1-low strains. (C) The lipid levels of individual animals from the Tstd1-high and Tstd1-low strains. Data are represented as mean ± SEM. Significance was determined by Student’s t-test. (D) Gene set enrichment analysis (GSEA) results featured the expression changes of genes involved in cholesterol and lipoprotein relevant pathways (highlighted in blue dots) between the Tstd1-high and Tstd1-low strains. NES: normalized enrichment score. FDR: false discovery rate. (E) Enrichment plots showing the enrichment of genes in the Cholesterol biosynthesis (upper) and HDL particle (lower) gene sets.

Figure 8.
GeneBridge analysis identified the associations between TSTD1/Tstd1 and cholesterol metabolism as well as mitochondrial function. GeneBridge analysis was performed using liver datasets in human, mouse and rat. Pathway modules were arranged horizontally according to the similarity between modules, and the gene-module association scores (GMAS) were shown in the y-axis. The significance thresholds are indicated by the red dashed line. Modules related to mitochondrial function are indicated by red dots, while those related to cholesterol or lipid metabolism are indicated by blue dots.

Publisher’s Note: MDPI stays neutral with regard to jurisdictional claims in published maps and institutional affiliations. |
© 2021 by the authors. Licensee MDPI, Basel, Switzerland. This article is an open access article distributed under the terms and conditions of the Creative Commons Attribution (CC BY) license (https://creativecommons.org/licenses/by/4.0/).
Share and Cite
MDPI and ACS Style
Zheng, A.; Li, H.; Feng, Z.; Liu, J. Integrative Analyses Reveal Tstd1 as a Potential Modulator of HDL Cholesterol and Mitochondrial Function in Mice. Cells 2021, 10, 2976. https://doi.org/10.3390/cells10112976
AMA Style
Zheng A, Li H, Feng Z, Liu J. Integrative Analyses Reveal Tstd1 as a Potential Modulator of HDL Cholesterol and Mitochondrial Function in Mice. Cells. 2021; 10(11):2976. https://doi.org/10.3390/cells10112976
Chicago/Turabian StyleZheng, Adi, Hao Li, Zhihui Feng, and Jiankang Liu. 2021. "Integrative Analyses Reveal Tstd1 as a Potential Modulator of HDL Cholesterol and Mitochondrial Function in Mice" Cells 10, no. 11: 2976. https://doi.org/10.3390/cells10112976
Note that from the first issue of 2016, this journal uses article numbers instead of page numbers. See further details here.