
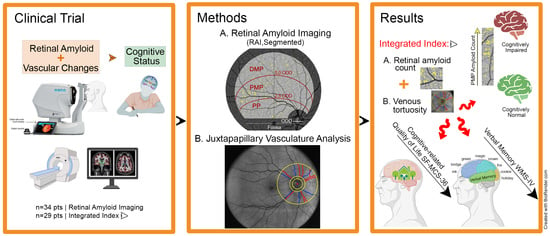
Retinal Venular Tortuosity Jointly with Retinal Amyloid Burden Correlates with Verbal Memory Loss: A Pilot Study

 , , ,
, , ,
Abstract
:
1. Introduction
2. Materials and Methods
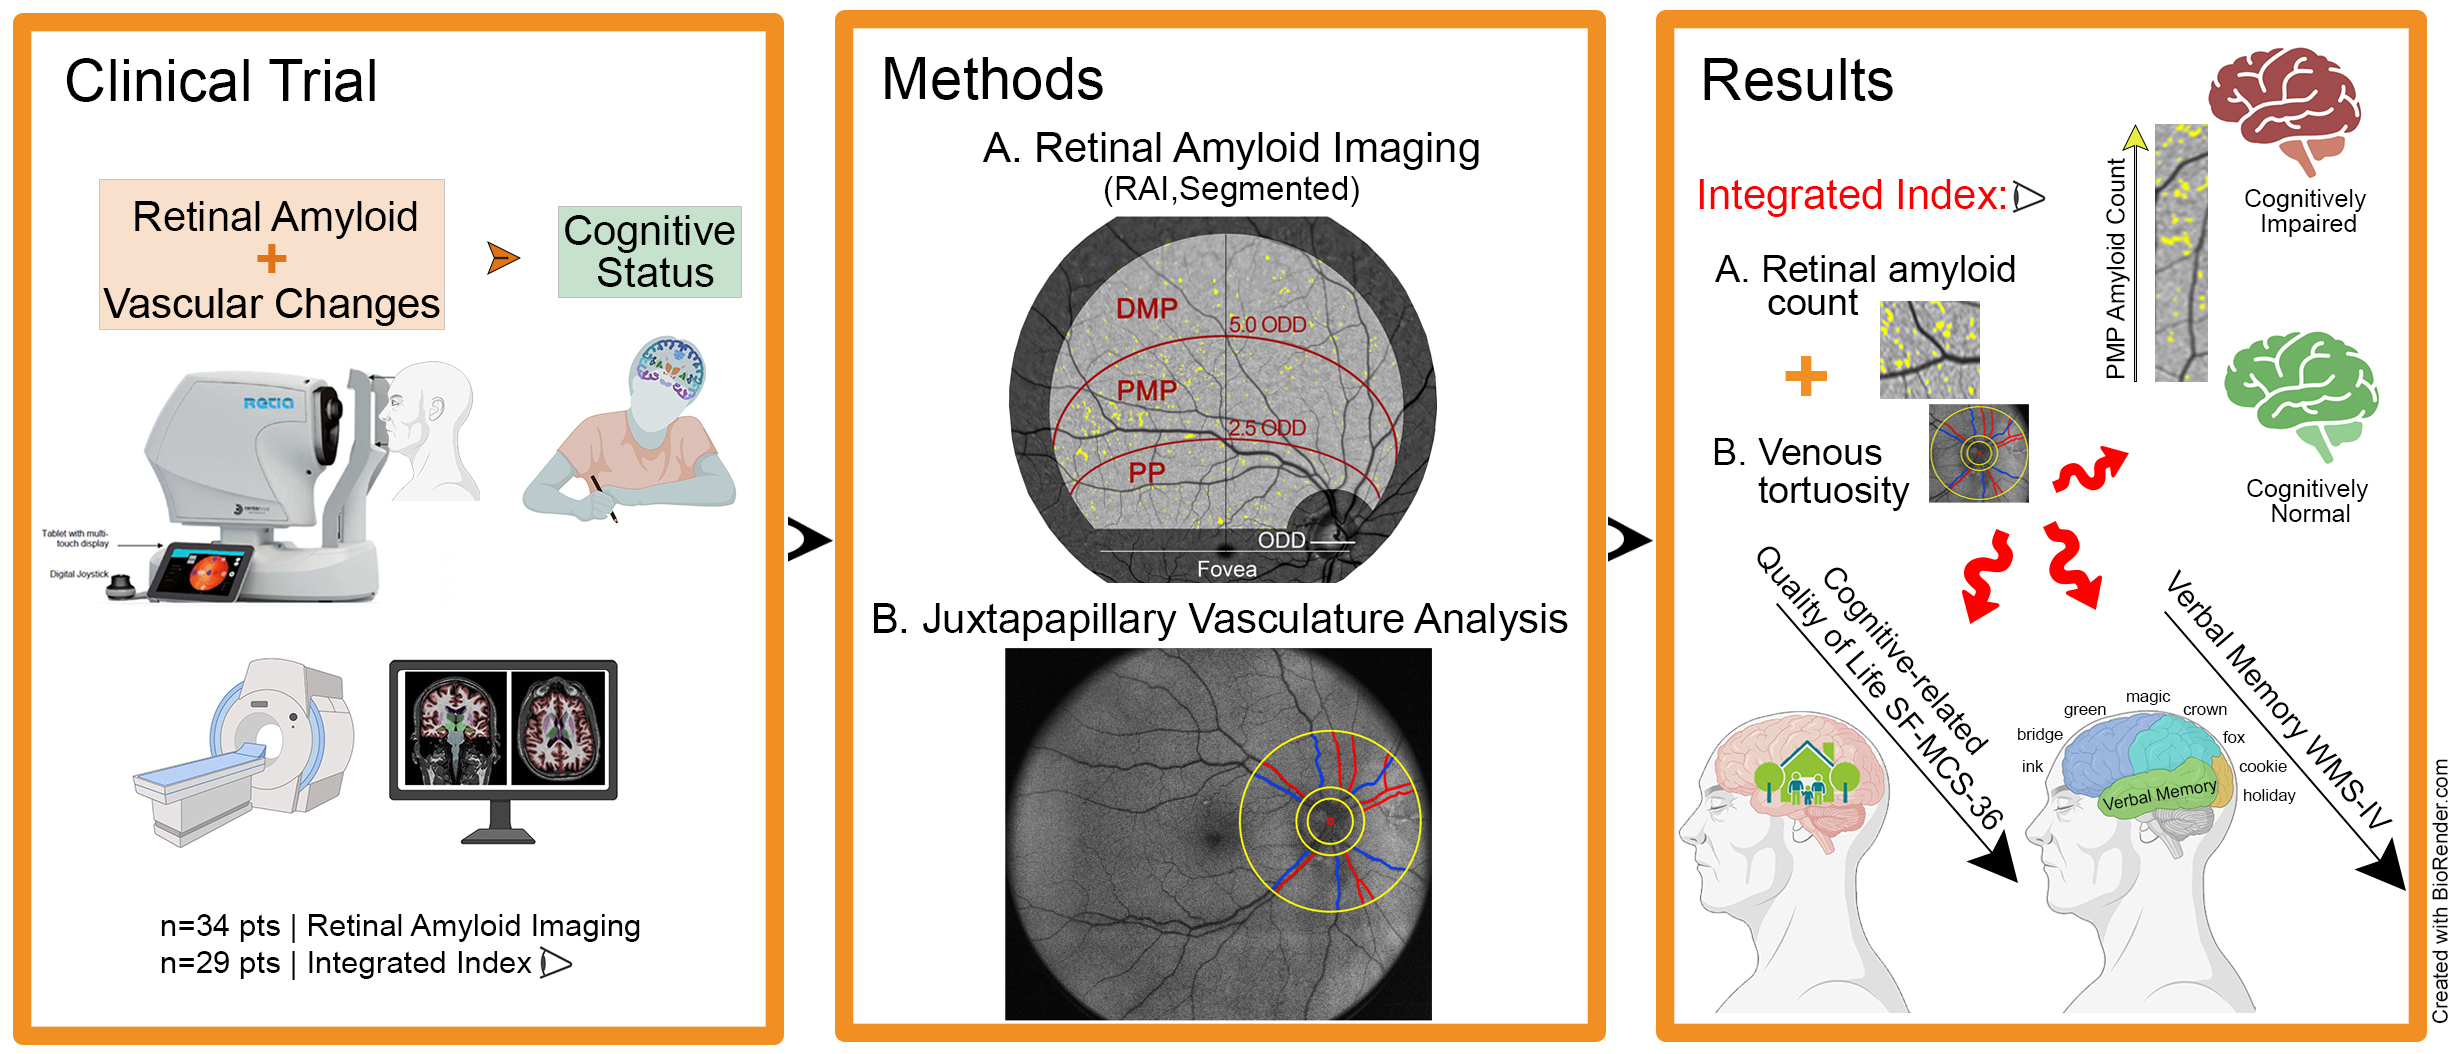
2.1. Participants
2.2. Retinal Imaging
2.3. Retinal Amyloid Quantification
2.4. Retinal Vascular Quantification
2.5. Cognitive Evaluation
2.6. Statistical Analysis
3. Results
4. Discussion
Supplementary Materials
Author Contributions
Funding
Institutional Review Board Statement
Informed Consent Statement
Data Availability Statement
Acknowledgments
Conflicts of Interest
References
- Hebert, L.E.; Weuve, J.; Scherr, P.A.; Evans, D.A. Alzheimer disease in the United States (2010–2050) estimated using the 2010 census. Neurology 2013, 80, 1778–1783. [Google Scholar] [CrossRef] [PubMed] [Green Version]
- 2020 Alzheimer’s disease facts and figures. Alzheimer’s Dement. 2020, 16, 391–460. [CrossRef] [PubMed]
- Bell, R.D.; Zlokovic, B.V. Neurovascular mechanisms and blood-brain barrier disorder in Alzheimer’s disease. Acta Neuropathol. 2009, 118, 103–113. [Google Scholar] [CrossRef] [PubMed] [Green Version]
- Montagne, A.; Nation, D.A.; Sagare, A.P.; Barisano, G.; Sweeney, M.D.; Chakhoyan, A.; Pachicano, M.; Joe, E.; Nelson, A.R.; D′Orazio, L.M.; et al. APOE4 leads to blood-brain barrier dysfunction predicting cognitive decline. Nature 2020, 581, 71–76. [Google Scholar] [CrossRef]
- He, J.T.; Zhao, X.; Xu, L.; Mao, C.Y. Vascular Risk Factors and Alzheimer’s Disease: Blood-Brain Barrier Disruption, Metabolic Syndromes, and Molecular Links. J. Alzheimer’s Dis. 2020, 73, 39–58. [Google Scholar] [CrossRef]
- Riphagen, J.M.; Ramakers, I.; Freeze, W.M.; Pagen, L.H.G.; Hanseeuw, B.J.; Verbeek, M.M.; Verhey, F.R.J.; Jacobs, H.I.L. Linking APOE-epsilon4, blood-brain barrier dysfunction, and inflammation to Alzheimer’s pathology. Neurobiol. Aging 2020, 85, 96–103. [Google Scholar] [CrossRef]
- Nikolakopoulou, A.M.; Montagne, A.; Kisler, K.; Dai, Z.; Wang, Y.; Huuskonen, M.T.; Sagare, A.P.; Lazic, D.; Sweeney, M.D.; Kong, P.; et al. Pericyte loss leads to circulatory failure and pleiotrophin depletion causing neuron loss. Nat. Neurosci. 2019, 22, 1089–1098. [Google Scholar] [CrossRef]
- Solis, E.; Hascup, K.N.; Hascup, E.R. Alzheimer’s Disease: The Link Between Amyloid-beta and Neurovascular Dysfunction. J. Alzheimer’s Dis. 2020, 76, 1179–1198. [Google Scholar] [CrossRef] [PubMed]
- Sweeney, M.D.; Montagne, A.; Sagare, A.P.; Nation, D.A.; Schneider, L.S.; Chui, H.C.; Harrington, M.G.; Pa, J.; Law, M.; Wang, D.J.J.; et al. Vascular dysfunction-The disregarded partner of Alzheimer’s disease. Alzheimer’s Dement. 2019, 15, 158–167. [Google Scholar] [CrossRef] [PubMed] [Green Version]
- Frost, S.; Kanagasingam, Y.; Sohrabi, H.; Vignarajan, J.; Bourgeat, P.; Salvado, O.; Villemagne, V.; Rowe, C.C.; Lance Macaulay, S.; Szoeke, C.; et al. Retinal vascular biomarkers for early detection and monitoring of Alzheimer’s disease. Transl. Psychiatry 2013, 3, e233. [Google Scholar] [CrossRef] [PubMed]
- Williams, M.A.; McGowan, A.J.; Cardwell, C.R.; Cheung, C.Y.; Craig, D.; Passmore, P.; Silvestri, G.; Maxwell, A.P.; McKay, G.J. Retinal microvascular network attenuation in Alzheimer’s disease. Alzheimer’s Dement. 2015, 1, 229–235. [Google Scholar] [CrossRef] [Green Version]
- Quinones, A.R.; Kaye, J.; Allore, H.G.; Botoseneanu, A.; Thielke, S.M. An Agenda for Addressing Multimorbidity and Racial and Ethnic Disparities in Alzheimer’s Disease and Related Dementia. Am. J. Alzheimer’s Dis. Other Dement. 2020, 35, 1533317520960874. [Google Scholar] [CrossRef]
- Sweeney, M.D.; Sagare, A.P.; Zlokovic, B.V. Blood-brain barrier breakdown in Alzheimer disease and other neurodegenerative disorders. Nat. Rev. Neurol. 2018, 14, 133–150. [Google Scholar] [CrossRef]
- Kisler, K.; Nelson, A.R.; Montagne, A.; Zlokovic, B.V. Cerebral blood flow regulation and neurovascular dysfunction in Alzheimer disease. Nat. Rev. Neurosci. 2017, 18, 419–434. [Google Scholar] [CrossRef] [PubMed] [Green Version]
- Shi, H.; Koronyo, Y.; Fuchs, D.T.; Sheyn, J.; Wawrowsky, K.; Lahiri, S.; Black, K.L.; Koronyo-Hamaoui, M. Retinal capillary degeneration and blood-retinal barrier disruption in murine models of Alzheimer’s disease. Acta Neuropathol. Commun. 2020, 8, 202. [Google Scholar] [CrossRef]
- Jack, C.R., Jr.; Bennett, D.A.; Blennow, K.; Carrillo, M.C.; Dunn, B.; Haeberlein, S.B.; Holtzman, D.M.; Jagust, W.; Jessen, F.; Karlawish, J.; et al. NIA-AA Research Framework: Toward a biological definition of Alzheimer’s disease. Alzheimer’s Dement. 2018, 14, 535–562. [Google Scholar] [CrossRef] [PubMed]
- Mantzavinos, V.; Alexiou, A. Biomarkers for Alzheimer’s Disease Diagnosis. Curr. Alzheimer Res. 2017, 14, 1149–1154. [Google Scholar] [CrossRef] [PubMed] [Green Version]
- Olsson, B.; Lautner, R.; Andreasson, U.; Ohrfelt, A.; Portelius, E.; Bjerke, M.; Holtta, M.; Rosen, C.; Olsson, C.; Strobel, G.; et al. CSF and blood biomarkers for the diagnosis of Alzheimer’s disease: A systematic review and meta-analysis. Lancet Neurol. 2016, 15, 673–684. [Google Scholar] [CrossRef]
- Allegri, R.F.; Chrem Mendez, P.; Calandri, I.; Cohen, G.; Martin, M.E.; Russo, M.J.; Crivelli, L.; Pertierra, L.; Tapajoz, F.; Clarens, M.F.; et al. Prognostic value of ATN Alzheimer biomarkers: 60-month follow-up results from the Argentine Alzheimer’s Disease Neuroimaging Initiative. Alzheimer’s Dement. 2020, 12, e12026. [Google Scholar] [CrossRef] [PubMed]
- Baldacci, F.; Mazzucchi, S.; Della Vecchia, A.; Giampietri, L.; Giannini, N.; Koronyo-Hamaoui, M.; Ceravolo, R.; Siciliano, G.; Bonuccelli, U.; Elahi, F.M.; et al. The path to biomarker-based diagnostic criteria for the spectrum of neurodegenerative diseases. Expert Rev. Mol. Diagn. 2020, 20, 421–441. [Google Scholar] [CrossRef] [PubMed]
- Hart, N.J.; Koronyo, Y.; Black, K.L.; Koronyo-Hamaoui, M. Ocular indicators of Alzheimer’s: Exploring disease in the retina. Acta Neuropathol. 2016, 132, 767–787. [Google Scholar] [CrossRef] [Green Version]
- Koronyo-Hamaoui, M.; Koronyo, Y.; Ljubimov, A.V.; Miller, C.A.; Ko, M.K.; Black, K.L.; Schwartz, M.; Farkas, D.L. Identification of amyloid plaques in retinas from Alzheimer’s patients and noninvasive in vivo optical imaging of retinal plaques in a mouse model. Neuroimage 2011, 54 (Suppl. 1), S204–S217. [Google Scholar] [CrossRef] [Green Version]
- Koronyo, Y.; Salumbides, B.C.; Black, K.L.; Koronyo-Hamaoui, M. Alzheimer’s disease in the retina: Imaging retinal abeta plaques for early diagnosis and therapy assessment. Neurodegener. Dis. 2012, 10, 285–293. [Google Scholar] [CrossRef]
- Tsai, Y.; Lu, B.; Ljubimov, A.V.; Girman, S.; Ross-Cisneros, F.N.; Sadun, A.A.; Svendsen, C.N.; Cohen, R.M.; Wang, S. Ocular changes in TgF344-AD rat model of Alzheimer’s disease. Invest. Ophthalmol. Vis. Sci. 2014, 55, 523–534. [Google Scholar] [CrossRef] [PubMed]
- La Morgia, C.; Ross-Cisneros, F.N.; Koronyo, Y.; Hannibal, J.; Gallassi, R.; Cantalupo, G.; Sambati, L.; Pan, B.X.; Tozer, K.R.; Barboni, P.; et al. Melanopsin retinal ganglion cell loss in Alzheimer disease. Ann. Neurol. 2016, 79, 90–109. [Google Scholar] [CrossRef] [PubMed]
- den Haan, J.; Morrema, T.H.J.; Verbraak, F.D.; de Boer, J.F.; Scheltens, P.; Rozemuller, A.J.; Bergen, A.A.B.; Bouwman, F.H.; Hoozemans, J.J. Amyloid-beta and phosphorylated tau in post-mortem Alzheimer’s disease retinas. Acta Neuropathol. Commun. 2018, 6, 147. [Google Scholar] [CrossRef]
- Grimaldi, A.; Pediconi, N.; Oieni, F.; Pizzarelli, R.; Rosito, M.; Giubettini, M.; Santini, T.; Limatola, C.; Ruocco, G.; Ragozzino, D.; et al. Neuroinflammatory Processes, A1 Astrocyte Activation and Protein Aggregation in the Retina of Alzheimer’s Disease Patients, Possible Biomarkers for Early Diagnosis. Front. Neurosci. 2019, 13, 925. [Google Scholar] [CrossRef] [PubMed] [Green Version]
- Shi, H.; Koronyo, Y.; Rentsendorj, A.; Regis, G.C.; Sheyn, J.; Fuchs, D.T.; Kramerov, A.A.; Ljubimov, A.V.; Dumitrascu, O.M.; Rodriguez, A.R. Identification of early pericyte loss and vascular amyloidosis in Alzheimer’s disease retina. Acta Neuropathol. 2020, 139, 813–836. [Google Scholar] [CrossRef] [Green Version]
- Habiba, U.; Merlin, S.; Lim, J.K.H.; Wong, V.H.Y.; Nguyen, C.T.O.; Morley, J.W.; Bui, B.V.; Tayebi, M. Age-Specific Retinal and Cerebral Immunodetection of Amyloid-beta Plaques and Oligomers in a Rodent Model of Alzheimer’s Disease. J. Alzheimer’s Dis. 2020, 76, 1135–1150. [Google Scholar] [CrossRef]
- Sharafi, S.M.; Sylvestre, J.P.; Chevrefils, C.; Soucy, J.P.; Beaulieu, S.; Pascoal, T.A.; Arbour, J.D.; Rheaume, M.A.; Robillard, A.; Chayer, C.; et al. Vascular retinal biomarkers improves the detection of the likely cerebral amyloid status from hyperspectral retinal images. Alzheimer’s Dement. 2019, 5, 610–617. [Google Scholar] [CrossRef]
- Vit, J.P.; Fuchs, D.T.; Angel, A.; Levy, A.; Lamensdorf, I.; Black, K.L.; Koronyo, Y.; Koronyo-hamaoui, M. Color and contrast vision in mouse models of aging and Alzheimer’s disease using a novel visual-stimuli four-arm maze. Sci. Rep. 2021, 11, 1255. [Google Scholar] [CrossRef]
- Mirzaei, N.; Shi, H.; Oviatt, M.; Doustar, J.; Rentsendorj, A.; Fuchs, D.T.; Sheyn, J.; Black, K.L.; Koronyo, Y.; Koronyo-Hamaoui, M. Alzheimer’s Retinopathy: Seeing Disease in the Eyes. Front. Neurosci. 2020, 14, 921. [Google Scholar] [CrossRef] [PubMed]
- Snyder, P.J.; Alber, J.; Alt, C.; Bain, L.J.; Bouma, B.E.; Bouwman, F.H.; DeBuc, D.C.; Campbell, M.C.W.; Carrillo, M.C.; Chew, E.Y.; et al. Retinal imaging in Alzheimer’s and neurodegenerative diseases. Alzheimer’s Dement. 2021, 17, 103–111. [Google Scholar] [CrossRef] [PubMed]
- Koronyo, Y.; Biggs, D.; Barron, E.; Boyer, D.S.; Pearlman, J.A.; Au, W.J.; Kile, S.J.; Blanco, A.; Fuchs, D.T.; Ashfaq, A.; et al. Retinal amyloid pathology and proof-of-concept imaging trial in Alzheimer’s disease. JCI Insight 2017, 2, e93621. [Google Scholar] [CrossRef] [PubMed]
- Dumitrascu, O.M.; Lyden, P.D.; Torbati, T.; Sheyn, J.; Sherzai, A.; Sherzai, D.; Sherman, D.S.; Rosenberry, R.; Cheng, S.; Johnson, K.O.; et al. Sectoral segmentation of retinal amyloid imaging in subjects with cognitive decline. Alzheimer’s Dement. 2020, 12, e12109. [Google Scholar] [CrossRef] [PubMed]
- Schultz, N.; Byman, E.; Netherlands Brain, B.; Wennstrom, M. Levels of Retinal Amyloid-beta Correlate with Levels of Retinal IAPP and Hippocampal Amyloid-beta in Neuropathologically Evaluated Individuals. J. Alzheimer’s Dis. 2020, 73, 1201–1209. [Google Scholar] [CrossRef] [PubMed] [Green Version]
- Lee, S.; Jiang, K.; McIlmoyle, B.; To, E.; Xu, Q.A.; Hirsch-Reinshagen, V.; Mackenzie, I.R.; Hsiung, G.R.; Eadie, B.D.; Sarunic, M.V.; et al. Amyloid Beta Immunoreactivity in the Retinal Ganglion Cell Layer of the Alzheimer’s Eye. Front. Neurosci. 2020, 14, 758. [Google Scholar] [CrossRef] [PubMed]
- Doustar, J.; Torbati, T.; Black, K.L.; Koronyo, Y.; Koronyo-Hamaoui, M. Optical Coherence Tomography in Alzheimer’s Disease and Other Neurodegenerative Diseases. Front. Neurol. 2017, 8, 701. [Google Scholar] [CrossRef] [PubMed]
- Hampel, H.; Toschi, N.; Babiloni, C.; Baldacci, F.; Black, K.L.; Bokde, A.L.W.; Bun, R.S.; Cacciola, F.; Cavedo, E.; Chiesa, P.A.; et al. Revolution of Alzheimer Precision Neurology. Passageway of Systems Biology and Neurophysiology. J. Alzheimer’s Dis. 2018, 64, S47–S105. [Google Scholar] [CrossRef] [Green Version]
- Carare, R.O.; Aldea, R.; Agarwal, N.; Bacskai, B.J.; Bechman, I.; Boche, D.; Bu, G.; Bulters, D.; Clemens, A.; Counts, S.E.; et al. Clearance of interstitial fluid (ISF) and CSF (CLIC) group-part of Vascular Professional Interest Area (PIA): Cerebrovascular disease and the failure of elimination of Amyloid-beta from the brain and retina with age and Alzheimer’s disease-Opportunities for Therapy. Alzheimer’s Dement. 2020, 12, e12053. [Google Scholar]
- Shi, H.; Koronyo, Y.; Rentsendorj, A.; Fuchs, D.T.; Sheyn, J.; Black, K.L.; Mirzaei, N.; Koronyo-Hamaoui, M. Retinal Vasculopathy in Alzheimer’s Disease. Front. Neurosci. 2021, 15, 1211. [Google Scholar] [CrossRef]
- Cabrera DeBuc, D.; Somfai, G.M.; Arthur, E.; Kostic, M.; Oropesa, S.; Mendoza Santiesteban, C. Investigating Multimodal Diagnostic Eye Biomarkers of Cognitive Impairment by Measuring Vascular and Neurogenic Changes in the Retina. Front. Physiol. 2018, 9, 1721. [Google Scholar] [CrossRef] [Green Version]
- Uemura, M.T.; Maki, T.; Ihara, M.; Lee, V.M.Y.; Trojanowski, J.Q. Brain Microvascular Pericytes in Vascular Cognitive Impairment and Dementia. Front. Aging Neurosci. 2020, 12, 80. [Google Scholar] [CrossRef] [Green Version]
- McGrory, S.; Cameron, J.R.; Pellegrini, E.; Warren, C.; Doubal, F.N.; Deary, I.J.; Dhillon, B.; Wardlaw, J.M.; Trucco, E.; MacGillivray, T.J. The application of retinal fundus camera imaging in dementia: A systematic review. Alzheimer’s Dement. 2017, 6, 91–107. [Google Scholar] [CrossRef] [Green Version]
- Deal, J.A.; Sharrett, A.R.; Rawlings, A.M.; Gottesman, R.F.; Bandeen-Roche, K.; Albert, M.; Knopman, D.; Selvin, E.; Wasserman, B.A.; Klein, B.; et al. Retinal signs and 20-year cognitive decline in the Atherosclerosis Risk in Communities Study. Neurology 2018, 90, e1158–e1166. [Google Scholar] [CrossRef]
- Deal, J.A.; Sharrett, A.R.; Albert, M.; Bandeen-Roche, K.; Burgard, S.; Thomas, S.D.; Gottesman, R.F.; Knopman, D.; Mosley, T.; Klein, B.; et al. Retinal signs and risk of incident dementia in the Atherosclerosis Risk in Communities study. Alzheimer’s Dement. 2019, 15, 477–486. [Google Scholar] [CrossRef]
- Jung, N.Y.; Han, J.C.; Ong, Y.T.; Cheung, C.Y.; Chen, C.P.; Wong, T.Y.; Kim, H.J.; Kim, Y.J.; Lee, J.; Lee, J.S.; et al. Retinal microvasculature changes in amyloid-negative subcortical vascular cognitive impairment compared to amyloid-positive Alzheimer’s disease. J. Neurol. Sci. 2019, 396, 94–101. [Google Scholar] [CrossRef]
- Frost, S.; Bhuiyan, A.; Offerman, D.; Doecke, J.D.; Macaulay, S.L.; Sohrabi, H.R.; Ames, D.; Masters, C.; Martins, R.N.; Kanagasingam, Y.; et al. Modulation of Retinal Arteriolar Central Reflection by APOE Genotype. Curr. Alzheimer Res. 2017, 14, 916–923. [Google Scholar] [CrossRef] [PubMed]
- Jinnouchi, H.; Kitamura, A.; Yamagishi, K.; Kiyama, M.; Imano, H.; Okada, T.; Cui, R.; Umesawa, M.; Muraki, I.; Hayama-Terada, M.; et al. Retinal Vascular Changes and Prospective Risk of Disabling Dementia: The Circulatory Risk in Communities Study (CIRCS). J. Atheroscler. Thromb. 2017, 24, 687–695. [Google Scholar] [CrossRef] [PubMed] [Green Version]
- Dumitrascu, O.M.; Demaerschalk, B.M.; Valencia Sanchez, C.; Almader-Douglas, D.; O’Carroll, C.B.; Aguilar, M.I.; Lyden, P.D.; Kumar, G. Retinal Microvascular Abnormalities as Surrogate Markers of Cerebrovascular Ischemic Disease: A Meta-Analysis. J. Stroke Cerebrovasc. Dis. 2018, 27, 1960–1968. [Google Scholar] [CrossRef] [PubMed]
- Golzan, S.M.; Goozee, K.; Georgevsky, D.; Avolio, A.; Chatterjee, P.; Shen, K.; Gupta, V.; Chung, R.; Savage, G.; Orr, C.F.; et al. Retinal vascular and structural changes are associated with amyloid burden in the elderly: Ophthalmic biomarkers of preclinical Alzheimer’s disease. Alzheimer’s Res. Ther. 2017, 9, 13. [Google Scholar] [CrossRef] [Green Version]
- Kobe, T.; Gonneaud, J.; Pichet Binette, A.; Meyer, P.F.; McSweeney, M.; Rosa-Neto, P.; Breitner, J.C.S.; Poirier, J.; Villeneuve, S. Association of Vascular Risk Factors With beta-Amyloid Peptide and Tau Burdens in Cognitively Unimpaired Individuals and Its Interaction With Vascular Medication Use. JAMA Netw. Open 2020, 3, e1920780. [Google Scholar] [CrossRef]
- Ngolab, J.; Donohue, M.; Belsha, A.; Salazar, J.; Cohen, P.; Jaiswal, S.; Tan, V.; Gessert, D.; Korouri, S.; Aggarwal, N.T.; et al. Feasibility study for detection of retinal amyloid in clinical trials: The Anti--Amyloid Treatment in Asymptomatic Alzheimer’s Disease (A4) trial. Alzheimer’s Dement. Diagn. Assess. Dis. Monit. 2021, 13, e12199. [Google Scholar]
- Sidiqi, A.; Wahl, D.; Lee, S.; Ma, D.; To, E.; Cui, J.; To, E.; Faisal Beg, M.; Sarunic, M.; Matsubara, J.A. In vivo Retinal Fluorescence Imaging with Curcumin in an Alzheimer Mouse Model. Front. Neurosci. 2020, 14, 713. [Google Scholar] [CrossRef] [PubMed]
- Tadokoro, K.; Yamashita, T.; Kimura, S.; Nomura, E.; Ohta, Y.; Omote, Y.; Takemoto, M.; Hishikaw, N.; Morihara, R.; Morizane, Y.; et al. Retinal Amyloid Imaging for Screening Alzheimer’s Disease. J. Alzheimer’s Dis. 2021, 83, 927–934. [Google Scholar] [CrossRef] [PubMed]
- Ryu, E.K.; Choe, Y.S.; Lee, K.H.; Choi, Y.; Kim, B.T. Curcumin and Dehydrozingerone Derivatives: Synthesis, Radiolabeling, and Evaluation for β-Amyloid Plaque Imaging. J. Med. Chem. 2006, 49, 6111–6119. [Google Scholar] [CrossRef]
- Mutsuga, M.; Chambers, J.K.; Uchida, K.; Tei, M.; Makibuchi, T.; Mizorogi, T.; Hishikawa, N.; Morihara, R.; Morizane, Y.; Abe, K. Binding of curcumin to senile plaques and cerebral amyloid angiopathy in the aged brain of various animals and to neurofibrillary tangles in Alzheimer’s brain. J. Vet. Med Sci. 2012, 74, 51–57. [Google Scholar] [CrossRef] [Green Version]
- Masuda, Y.; Fukuchi, M.; Yatagawa, T.; Tada, M.; Takeda, K.; Irie, K.; Akagi, K.; Monobe, Y.; Imazawa, T.; Takegoshi, K. Solid-state NMR analysis of interaction sites of curcumin and 42-residue amyloid beta-protein fibrils. Bioorg. Med. Chem. 2011, 19, 5967–5974. [Google Scholar] [CrossRef]
- Yanagisawa, D.; Taguchi, H.; Yamamoto, A.; Shirai, N.; Hirao, K.; Tooyama, I. Curcuminoid binds to amyloid-beta1-42 oligomer and fibril. J. Alzheimer’s Dis. 2011, 24 (Suppl. 2), 33–42. [Google Scholar] [CrossRef] [PubMed]
- Yang, F.; Lim, G.P.; Begum, A.N.; Ubeda, O.J.; Simmons, M.R.; Ambegaokar, S.S.; Chen, P.P.; Kayed, R.; Glabe, C.G.; Frautschy, S.A.; et al. Curcumin inhibits formation of amyloid beta oligomers and fibrils, binds plaques, and reduces amyloid in vivo. J. Biol. Chem. 2005, 280, 5892–5901. [Google Scholar] [CrossRef] [Green Version]
- Kumaraswamy, P.; Sethuraman, S.; Krishnan, U.M. Mechanistic insights of curcumin interactions with the core-recognition motif of beta-amyloid peptide. J. Agric. Food Chem. 2013, 61, 3278–3285. [Google Scholar] [CrossRef]
- Khansari, M.M.; Garvey, S.L.; Farzad, S.; Shi, Y.; Shahidi, M. Relationship between retinal vessel tortuosity and oxygenation in sickle cell retinopathy. Int. J. Retin. Vitr. 2019, 5, 47. [Google Scholar] [CrossRef]
- Frangi, F.A.N.W.; Vincken, K.L.; Viergever, M.A. Multiscale vessel enhancement filtering. In International Conference on Medical Image Computing and Computer-Assisted Intervention; Springer: Berlin/Heidelberg, Germany, 1998; pp. 130–137. [Google Scholar]
- Ayub, L.K.A.; Ayub, J.; Ayub, S.; Akram, S.; Irshad, S. Differentiation of blood vessels in retina into arteries and veins using neural network. In Proceedings of the 2016 International Conference on Computing, Electronic and Electrical Engineering (ICE Cube), Quetta, Pakistan, 11–12 April 2016; pp. 301–306. [Google Scholar]
- Khansari, M.M.; O’Neill, W.; Lim, J.; Shahidi, M. Method for quantitative assessment of retinal vessel tortuosity in optical coherence tomography angiography applied to sickle cell retinopathy. Biomed. Opt. Express 2017, 8, 3796–3806. [Google Scholar] [CrossRef] [PubMed]
- Bullitt, E.; Gerig, G.; Pizer, S.M.; Lin, W.; Aylward, S.R. Measuring tortuosity of the intracerebral vasculature from MRA images. IEEE Trans. Med. Imaging 2003, 22, 1163–1171. [Google Scholar] [CrossRef] [Green Version]
- Morris, J.C. The Clinical Dementia Rating (CDR): Current version and scoring rules. Neurology 1993, 43, 2412–2414. [Google Scholar] [CrossRef] [PubMed]
- Nasreddine, Z.S.; Phillips, N.A.; Bedirian, V.; Charbonneau, S.; Whitehead, V.; Collin, I.; Cummings, J.L.; Chertkow, H. The Montreal Cognitive Assessment, MoCA: A brief screening tool for mild cognitive impairment. J. Am. Geriatr. Soc. 2005, 53, 695–699. [Google Scholar] [CrossRef]
- Nation, D.A.; Sweeney, M.D.; Montagne, A.; Sagare, A.P.; D’Orazio, L.M.; Pachicano, M.; Sepehrband, F.; Nelson, A.R.; Buennagel, D.P.; Harrington, M.G.; et al. Blood-brain barrier breakdown is an early biomarker of human cognitive dysfunction. Nat. Med. 2019, 25, 270–276. [Google Scholar] [CrossRef]
- Goulay, R.; Mena Romo, L.; Hol, E.M.; Dijkhuizen, R.M. From Stroke to Dementia: A Comprehensive Review Exposing Tight Interactions between Stroke and Amyloid-beta Formation. Transl. Stroke Res. 2020, 11, 601–614. [Google Scholar] [CrossRef] [PubMed] [Green Version]
- O’Bryhim, B.E.; Apte, R.S.; Kung, N.; Coble, D.; Van Stavern, G.P. Association of Preclinical Alzheimer Disease With Optical Coherence Tomographic Angiography Findings. JAMA Ophthalmol. 2018, 136, 1242–1248. [Google Scholar] [CrossRef]
- Cheung, C.Y.; Ong, Y.T.; Ikram, M.K.; Ong, S.Y.; Li, X.; Hilal, S.; Catindig, J.A.; Venketasubramanian, N.; Yap, P.; Seow, D.; et al. Microvascular network alterations in the retina of patients with Alzheimer’s disease. Alzheimer’s Dement. 2014, 10, 135–142. [Google Scholar] [CrossRef]
- Csincsik, L.; MacGillivray, T.J.; Flynn, E.; Pellegrini, E.; Papanastasiou, G.; Barzegar-Befroei, N.; Csutak, A.; Bird, A.C.; Ritchie, C.W.; Peto, T.; et al. Peripheral Retinal Imaging Biomarkers for Alzheimer’s Disease: A Pilot Study. Ophthalmic. Res. 2018, 59, 182–192. [Google Scholar] [CrossRef] [PubMed]
- Jiang, H.; Liu, Y.; Wei, Y.; Shi, Y.; Wright, C.B.; Sun, X.; Rundek, T.; Baumel, B.S.; Landman, J.; Wang, J. Impaired retinal microcirculation in patients with Alzheimer’s disease. PLoS ONE 2018, 13, e0192154. [Google Scholar] [CrossRef] [Green Version]
- van de Kreeke, J.A.; Nguyen, H.T.; Konijnenberg, E.; Tomassen, J.; den Braber, A.; Ten Kate, M.; Yaqub, M.; van Berckel, B.; Lammertsma, A.A.; Boomsma, D.I.; et al. Optical coherence tomography angiography in preclinical Alzheimer’s disease. Br. J. Ophthalmol. 2020, 104, 157–161. [Google Scholar] [CrossRef] [PubMed]
- Bettermann, K.; Slocomb, J.E.; Shivkumar, V.; Lott, M.E. Retinal vasoreactivity as a marker for chronic ischemic white matter disease? J. Neurol. Sci. 2012, 322, 206–210. [Google Scholar] [CrossRef] [PubMed]
- den Haan, J.; van de Kreeke, J.A.; van Berckel, B.N.; Barkhof, F.; Teunissen, C.E.; Scheltens, P.; Verbraak, F.D.; Bouwman, F.H. Is retinal vasculature a biomarker in amyloid proven Alzheimer’s disease? Alzheimers Dement. 2019, 11, 383–391. [Google Scholar]


| N (% female) | 29 (55) |
| Age (years) | 64 ± 6 |
| Preexisting health conditions, N (%) | |
| Hypertension | 11 (38) |
| Hyperlipidemia | 15 (52) |
| Diabetes | 3 (10) |
| Hyperthyroidism | 8 (28) |
| Stroke/TIA | 1 (3) |
| Heart disease/CAD/CHF | 1 (3) |
| Smoking h/o | 2 (7) |
| Variable | Normal Cognition (n = 11) | Impaired Cognition (n = 18) | p |
|---|---|---|---|
| Age (years; mean ± SD) | 66.92 ± 7.7 | 67.06 ± 7.41 | 0.954 |
| Years of education (mean ± SD) | 16.05 ± 1.43 | 15.59 ± 2.76 | 0.432 |
| Arterial hypertension (%) | 6 (54.4) | 10 (55.55) | 0.633 |
| Dyslipidemia (%) | 6 (54.4) | 11 (61.11) | 0.924 |
| Diabetes Mellitus (%) | 0 (0) | 3 (16.66) | 0.563 |
| Hippocampal volume (cm3; mean ± SD) | 7.82 ± 0.78 | 6.12 (±0.87) | 0.051 |
| Arterial branching angle (mean ± SD) | 66.45 ± 13.0 | 63.3 ± 13.9 | 0.55 |
| Venous branching angle (mean ± SD) | 58.5 ± 6.1 | 59.0 ± 12.3 | 0.94 |
| Arterial vessel tortuosity Index (mean ± SD) | 0.15 ± 0.05 | 0.14 ± 0.06 | 0.42 |
| Venous vessel tortuosity index (mean ± SD) | 0.13 ± 0.02 | 0.12 ± 0.02 | 0.40 |
| Arterial length (mean ± SD) | 2687 ± 288 | 2706 ± 297 | 0.87 |
| Venous length (mean ± SD) | 2614 ± 270 | 2689 ± 276 | 0.50 |
| Arterial vessel inflexion index (mean ± SD) | 5.6 ± 0.80 | 5.5 ± 0.81 | 0.70 |
| Venous vessel inflexion index (mean ± SD) | 5.2 ± 0.91 | 5.3 ± 0.78 | 0.83 |
| Proximal mid-periphery amyloid count (mean ± SD) | 85 ± 32 | 144 ± 52 | 0.0012 |
| Distal mid-periphery amyloid count (mean ± SD) | 91.3 ± 63 | 93.1 ± 45 | 0.92 |
| Posterior pole amyloid count (mean ± SD) | 98 ± 60 | 106 ± 46 | 0.66 |
| Total amyloid count (mean ± SD) | 247 ± 82 | 343 ± 90 | 0.04 |
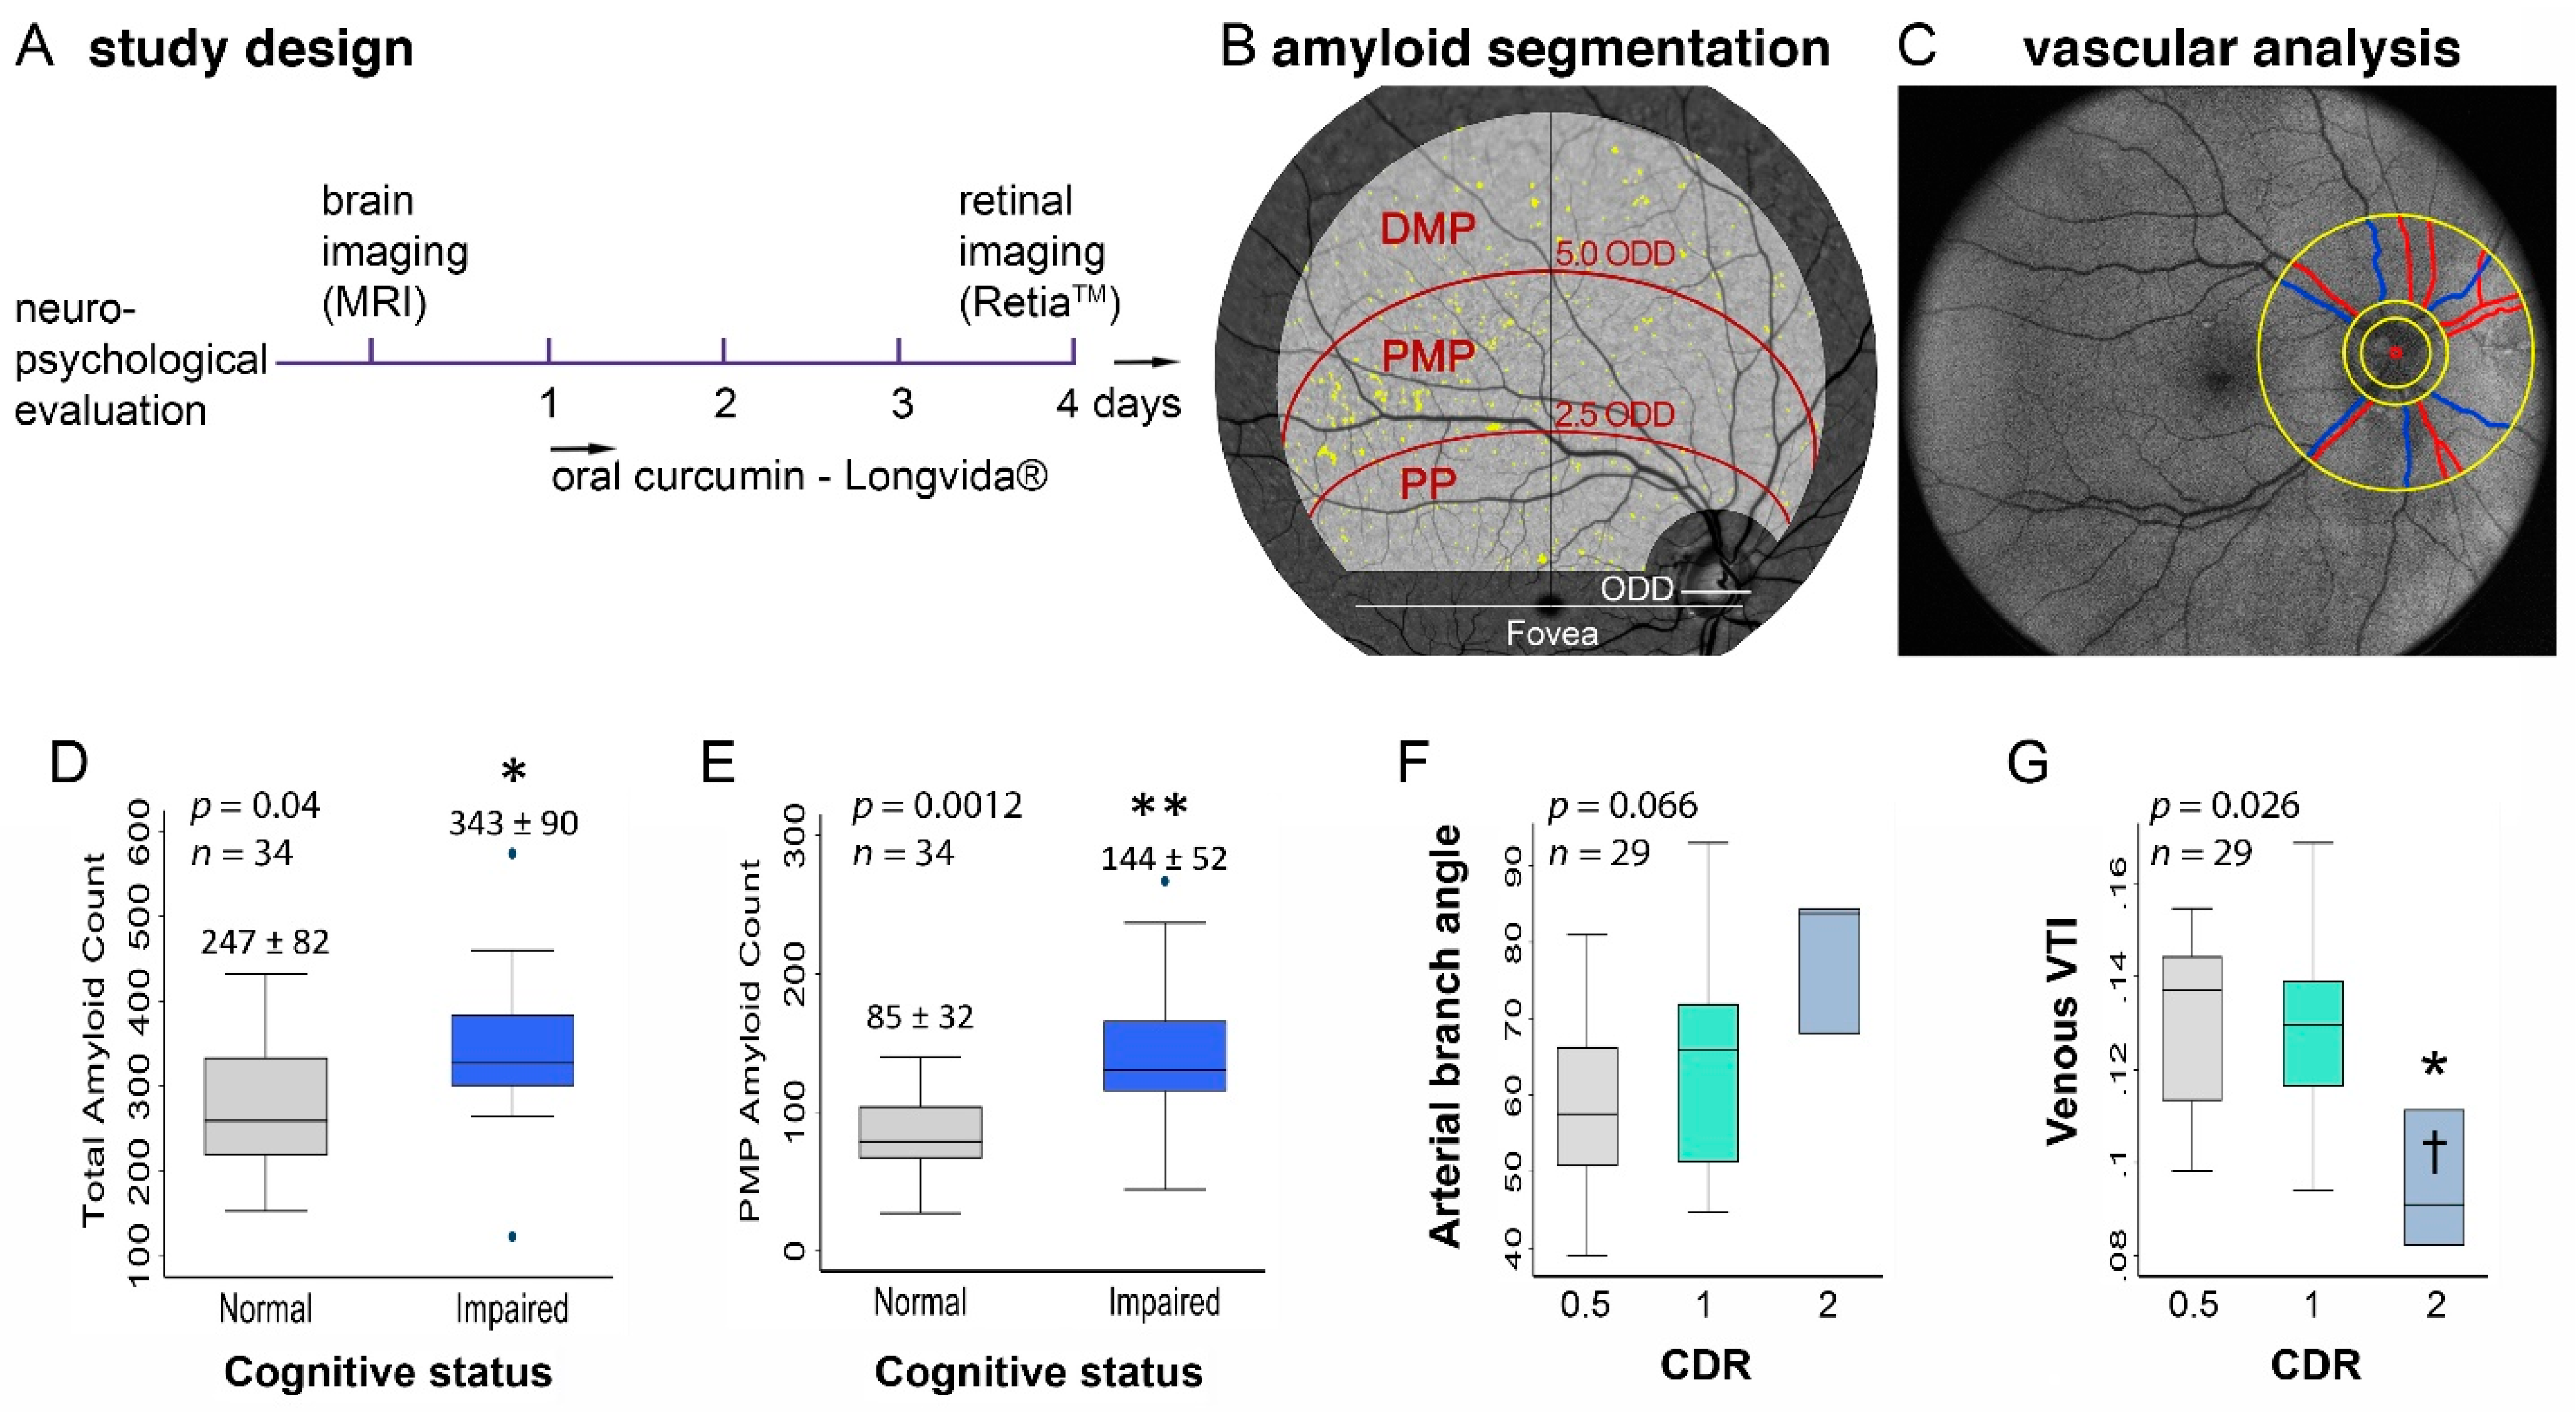
| Combined proximal mid-periphery amyloid count–arterial branching angle index (mean ± SD) | −0.56 ± 1.3 | 0.27 ± 1.4 | 0.11 |
| Combined proximal mid-periphery amyloid count–venous tortuosity index (mean ± SD) | −0.91 ± 1.4 | 0.49 ± 1.1 | 0.0068 |
| Combined total amyloid count–arterial branching angle index (mean ± SD) | −0.27 ± 1.3 | 0.08 ± 1.4 | 0.51 |
| Combined total amyloid count–venous tortuosity index (mean ± SD) | −0.62 ± 1.5 | 0.29 ± 1.3 | 0.09 |
| Retinal Parameter | Cognitive Measures’ Z-Score | Beta (Std. Err) | p |
|---|---|---|---|
| Venous branching angle | WAIS-IV | −0.045 (0.015) | 0.008 |
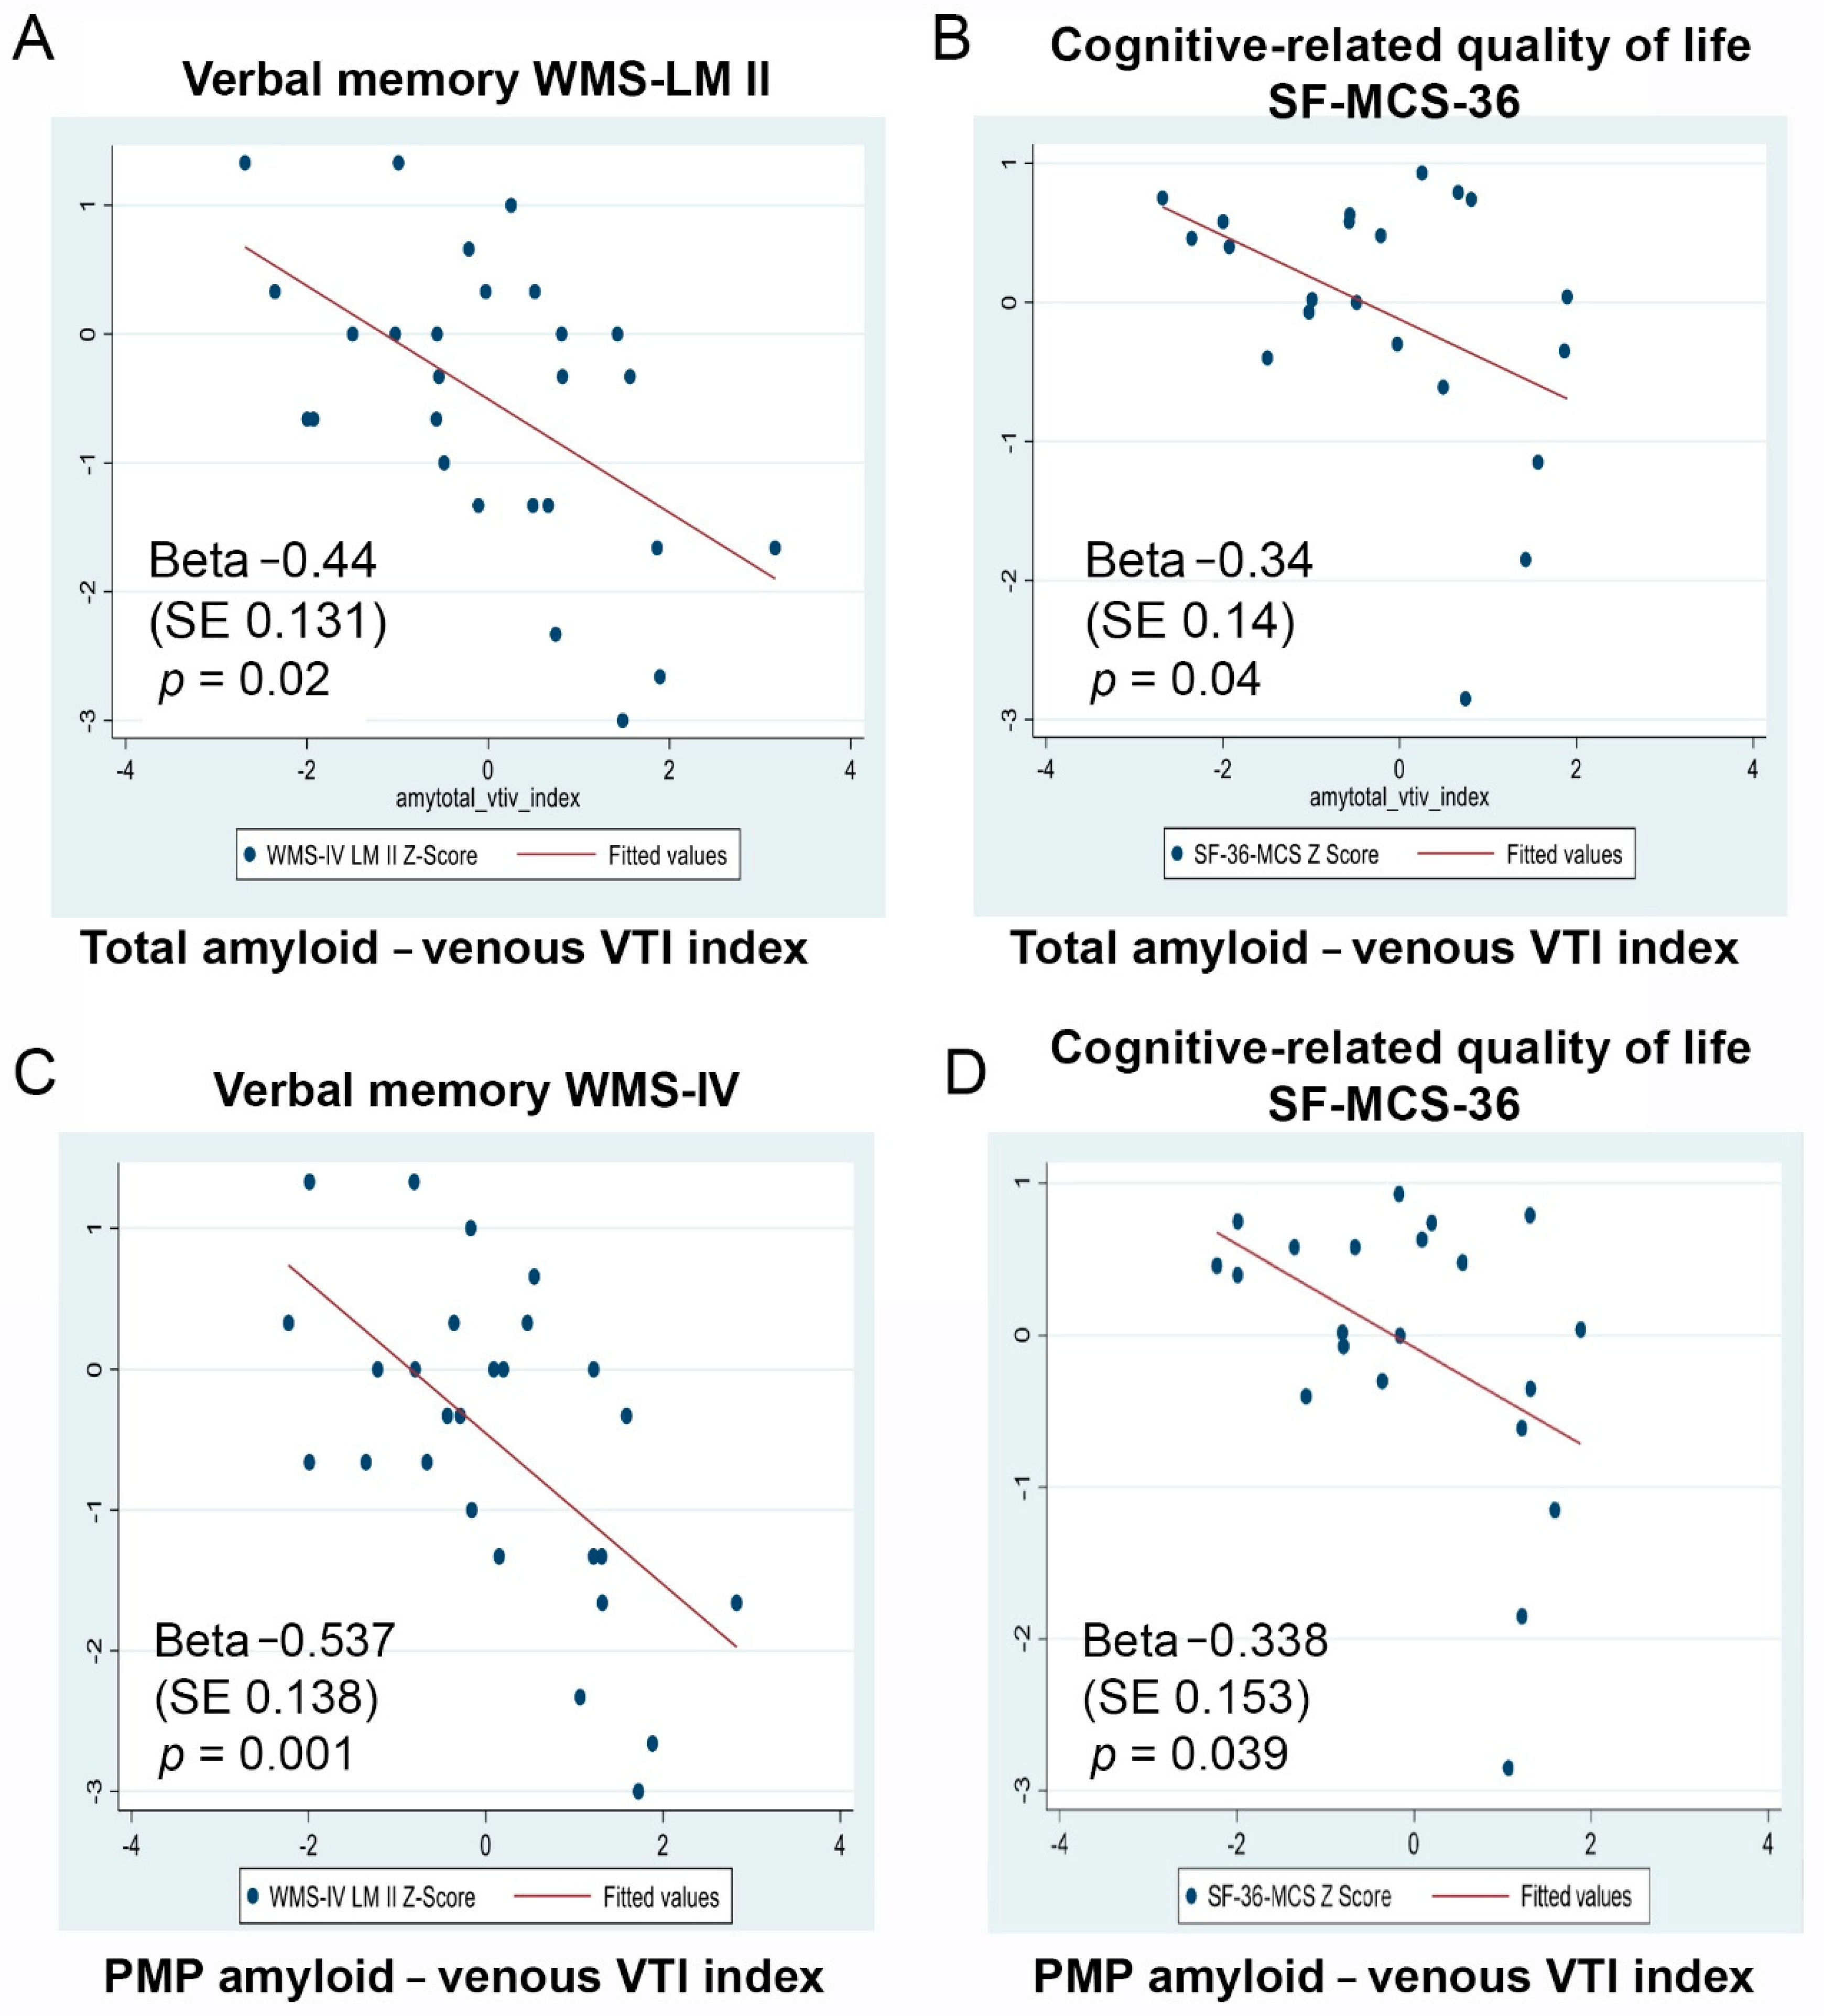
| PMP amyloid-venous VTI | CVLT Long Delay | −0.37 (0.17) | 0.04 |
| Total amyloid-venous VTI | WMS LM-II | −0.44 (0.13) | 0.03 |
| PMP amyloid-arterial branching angle | WMS LM-II | −0.35 (0.16) | 0.04 |
| PMP amyloid-venous VTI | WMS LM-II | −0.53 (0.13) | 0.001 |
| Total amyloid-venous VTI | MCS | −0.30 (0.14) | 0.04 |
| PMP amyloid-venous VTI | MCS | −0.33 (0.15) | 0.03 |
| PMP amyloid count | CVLT Long Delay | −0.009 (0.003) | 0.02 |
| PMP amyloid count | WMS LM-II | −0.007 (0.03) | 0.02 |
| DMP amyloid count | RCFT 30 min Recall | −0.010 (0.005) | 0.04 |
| DMP amyloid count | MCS | −0.014 (0.004) | 0.004 |
| Total amyloid count | MCS | −0.004 (0.002) | 0.04 |
Publisher’s Note: MDPI stays neutral with regard to jurisdictional claims in published maps and institutional affiliations. |
© 2021 by the authors. Licensee MDPI, Basel, Switzerland. This article is an open access article distributed under the terms and conditions of the Creative Commons Attribution (CC BY) license (https://creativecommons.org/licenses/by/4.0/).
Share and Cite
Dumitrascu, O.M.; Rosenberry, R.; Sherman, D.S.; Khansari, M.M.; Sheyn, J.; Torbati, T.; Sherzai, A.; Sherzai, D.; Johnson, K.O.; Czeszynski, A.D.; et al. Retinal Venular Tortuosity Jointly with Retinal Amyloid Burden Correlates with Verbal Memory Loss: A Pilot Study. Cells 2021, 10, 2926. https://doi.org/10.3390/cells10112926
Dumitrascu OM, Rosenberry R, Sherman DS, Khansari MM, Sheyn J, Torbati T, Sherzai A, Sherzai D, Johnson KO, Czeszynski AD, et al. Retinal Venular Tortuosity Jointly with Retinal Amyloid Burden Correlates with Verbal Memory Loss: A Pilot Study. Cells. 2021; 10(11):2926. https://doi.org/10.3390/cells10112926
Chicago/Turabian StyleDumitrascu, Oana M., Ryan Rosenberry, Dale S. Sherman, Maziyar M. Khansari, Julia Sheyn, Tania Torbati, Ayesha Sherzai, Dean Sherzai, Kenneth O. Johnson, Alan D. Czeszynski, and et al. 2021. "Retinal Venular Tortuosity Jointly with Retinal Amyloid Burden Correlates with Verbal Memory Loss: A Pilot Study" Cells 10, no. 11: 2926. https://doi.org/10.3390/cells10112926