
Single-Cell Transcriptional Heterogeneity of Lymphatic Endothelial Cells in Normal and Inflamed Murine Lymph Nodes

 , , and
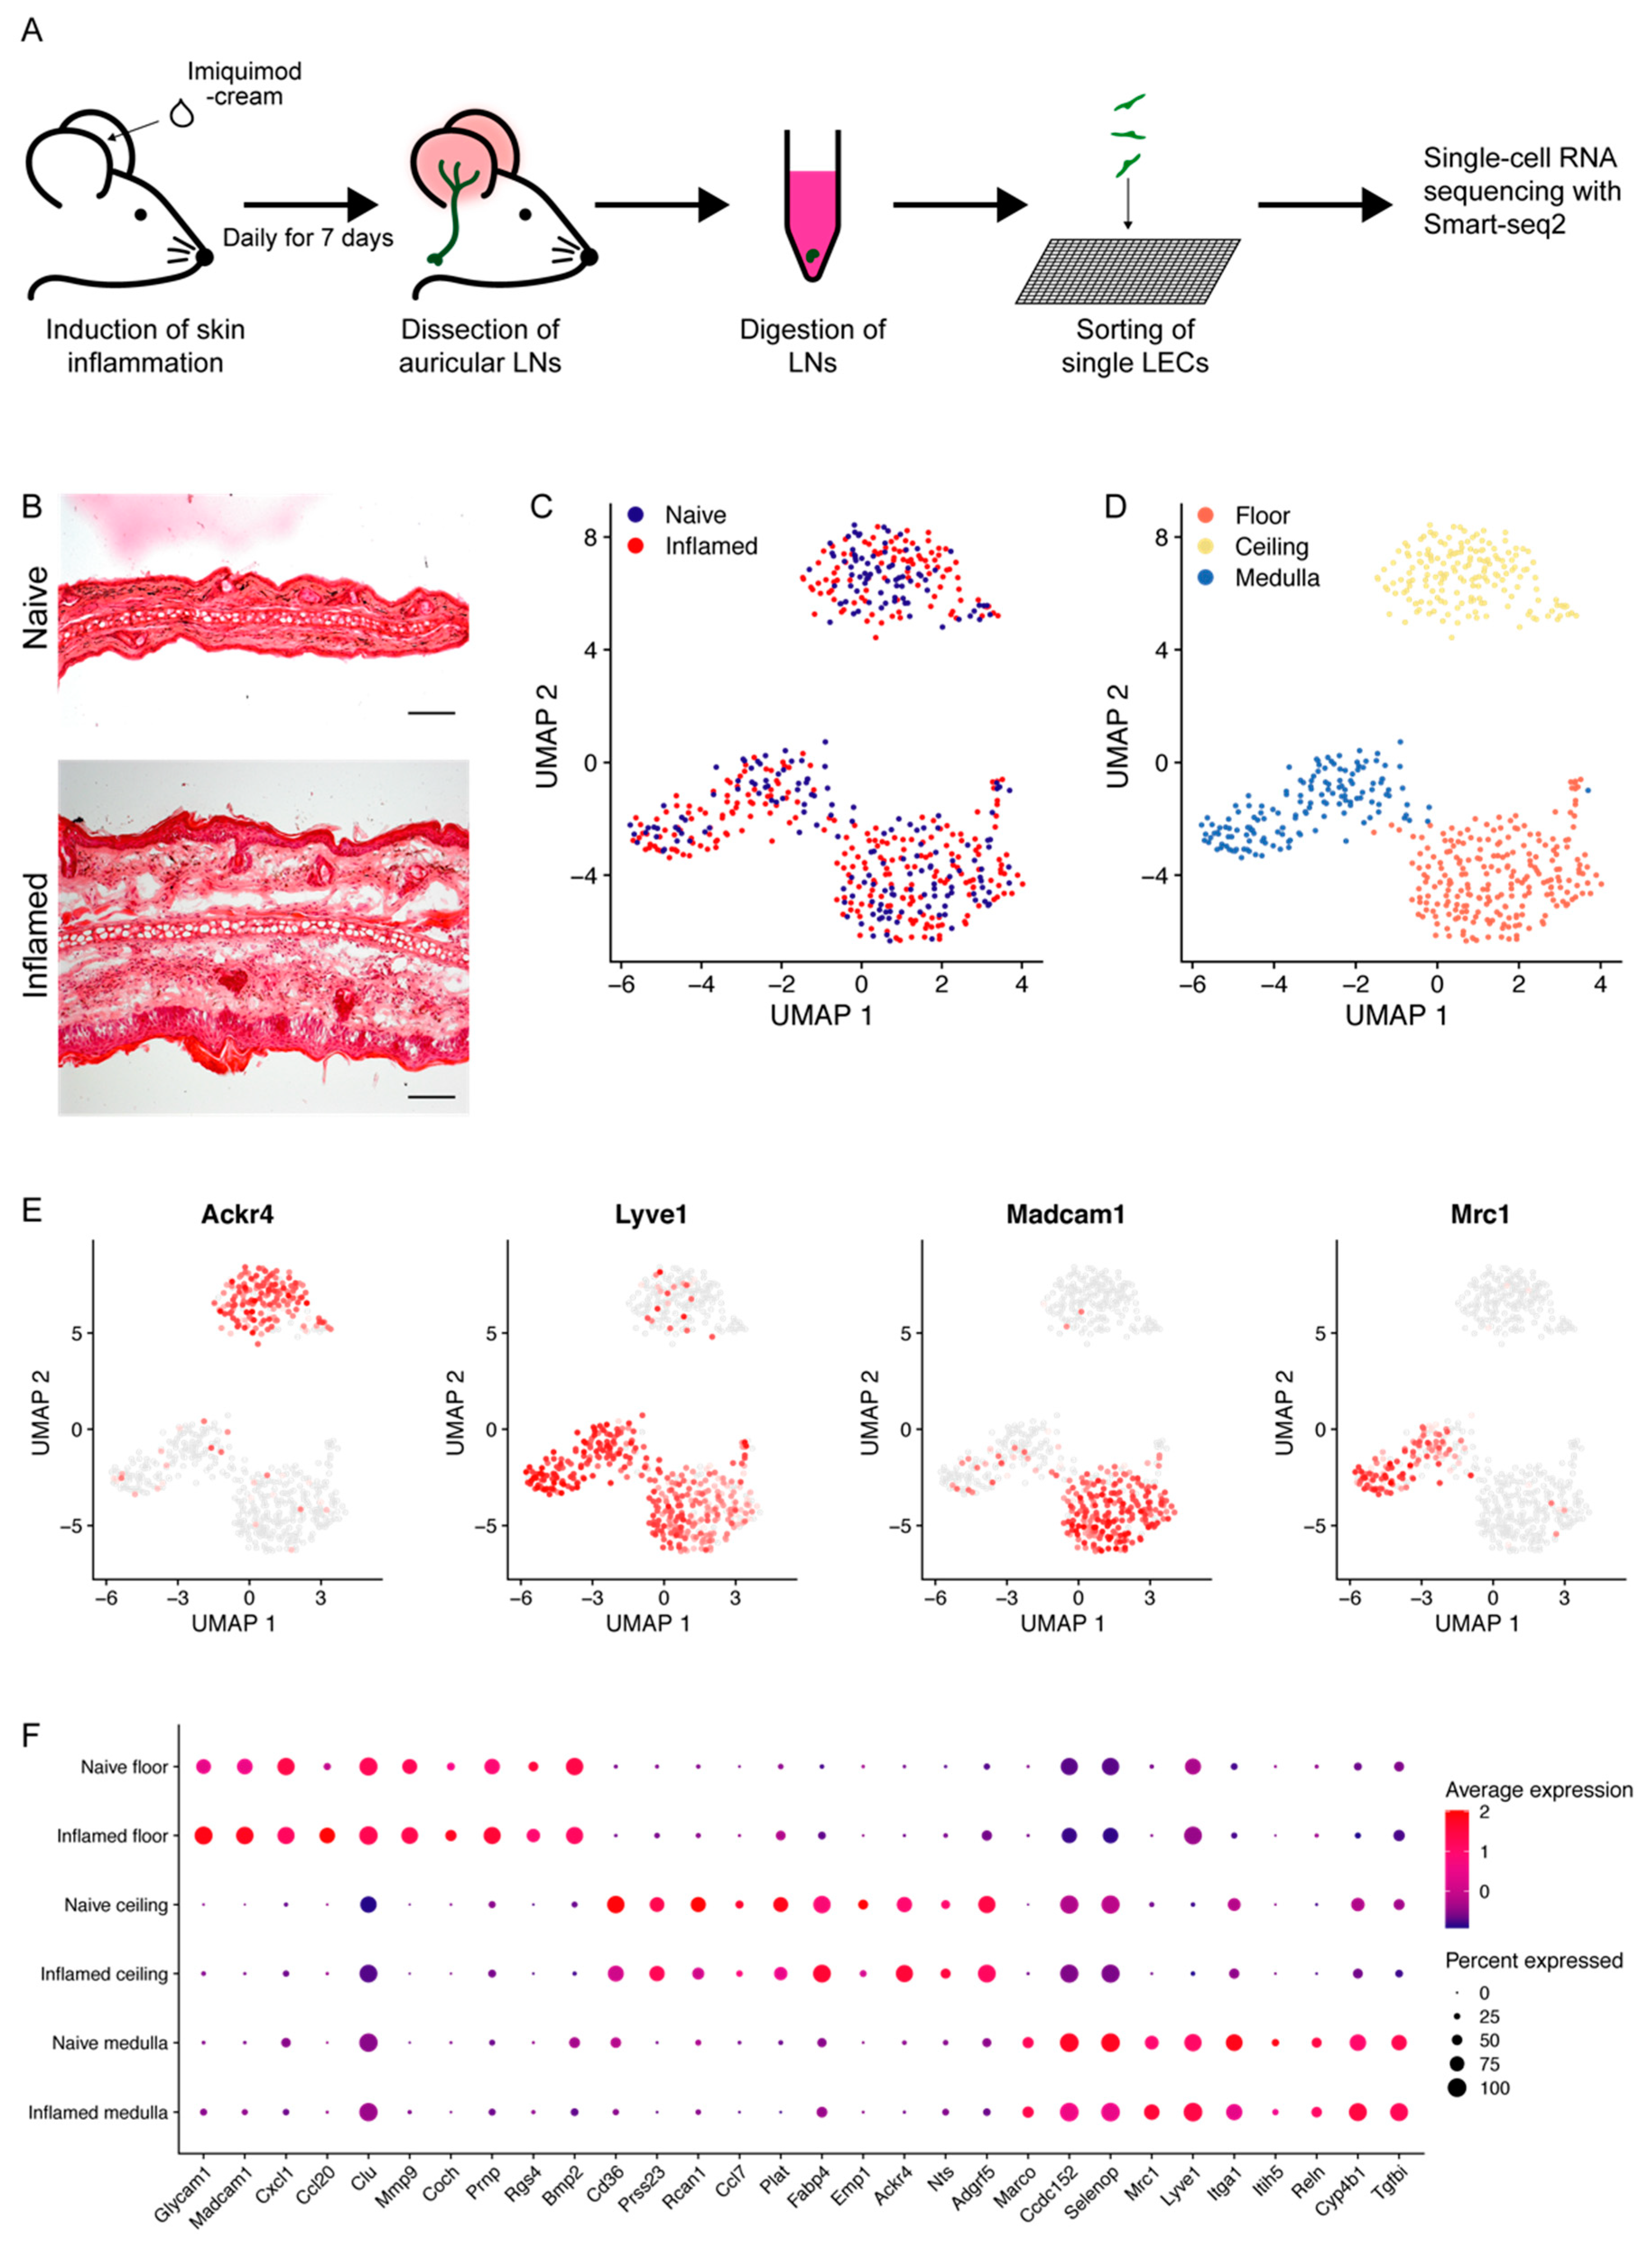
Abstract
:1. Introduction
2. Materials and Methods
2.1. Animals
2.2. Inflammation Mouse Model
2.3. Isolation of LECs from Lymph Nodes
2.4. Single-Cell RNA-Seq Data Processing
2.5. Differential Gene Expression and Gene Ontology Analysis
2.6. RNA Velocity
2.7. Intercellular Interactions in Naïve Lymph Nodes
2.8. Comparison to Inflammatory Responses in LN LECs under Cutaneous Oxazolone Challenge
2.9. Immunofluorescence Staining
2.10. FACS Analysis of Freshly Isolated LN LECs
2.11. Statistical Analysis
3. Results
3.1. Characterization of LN LEC Subtypes by Single-Cell RNA Sequencing
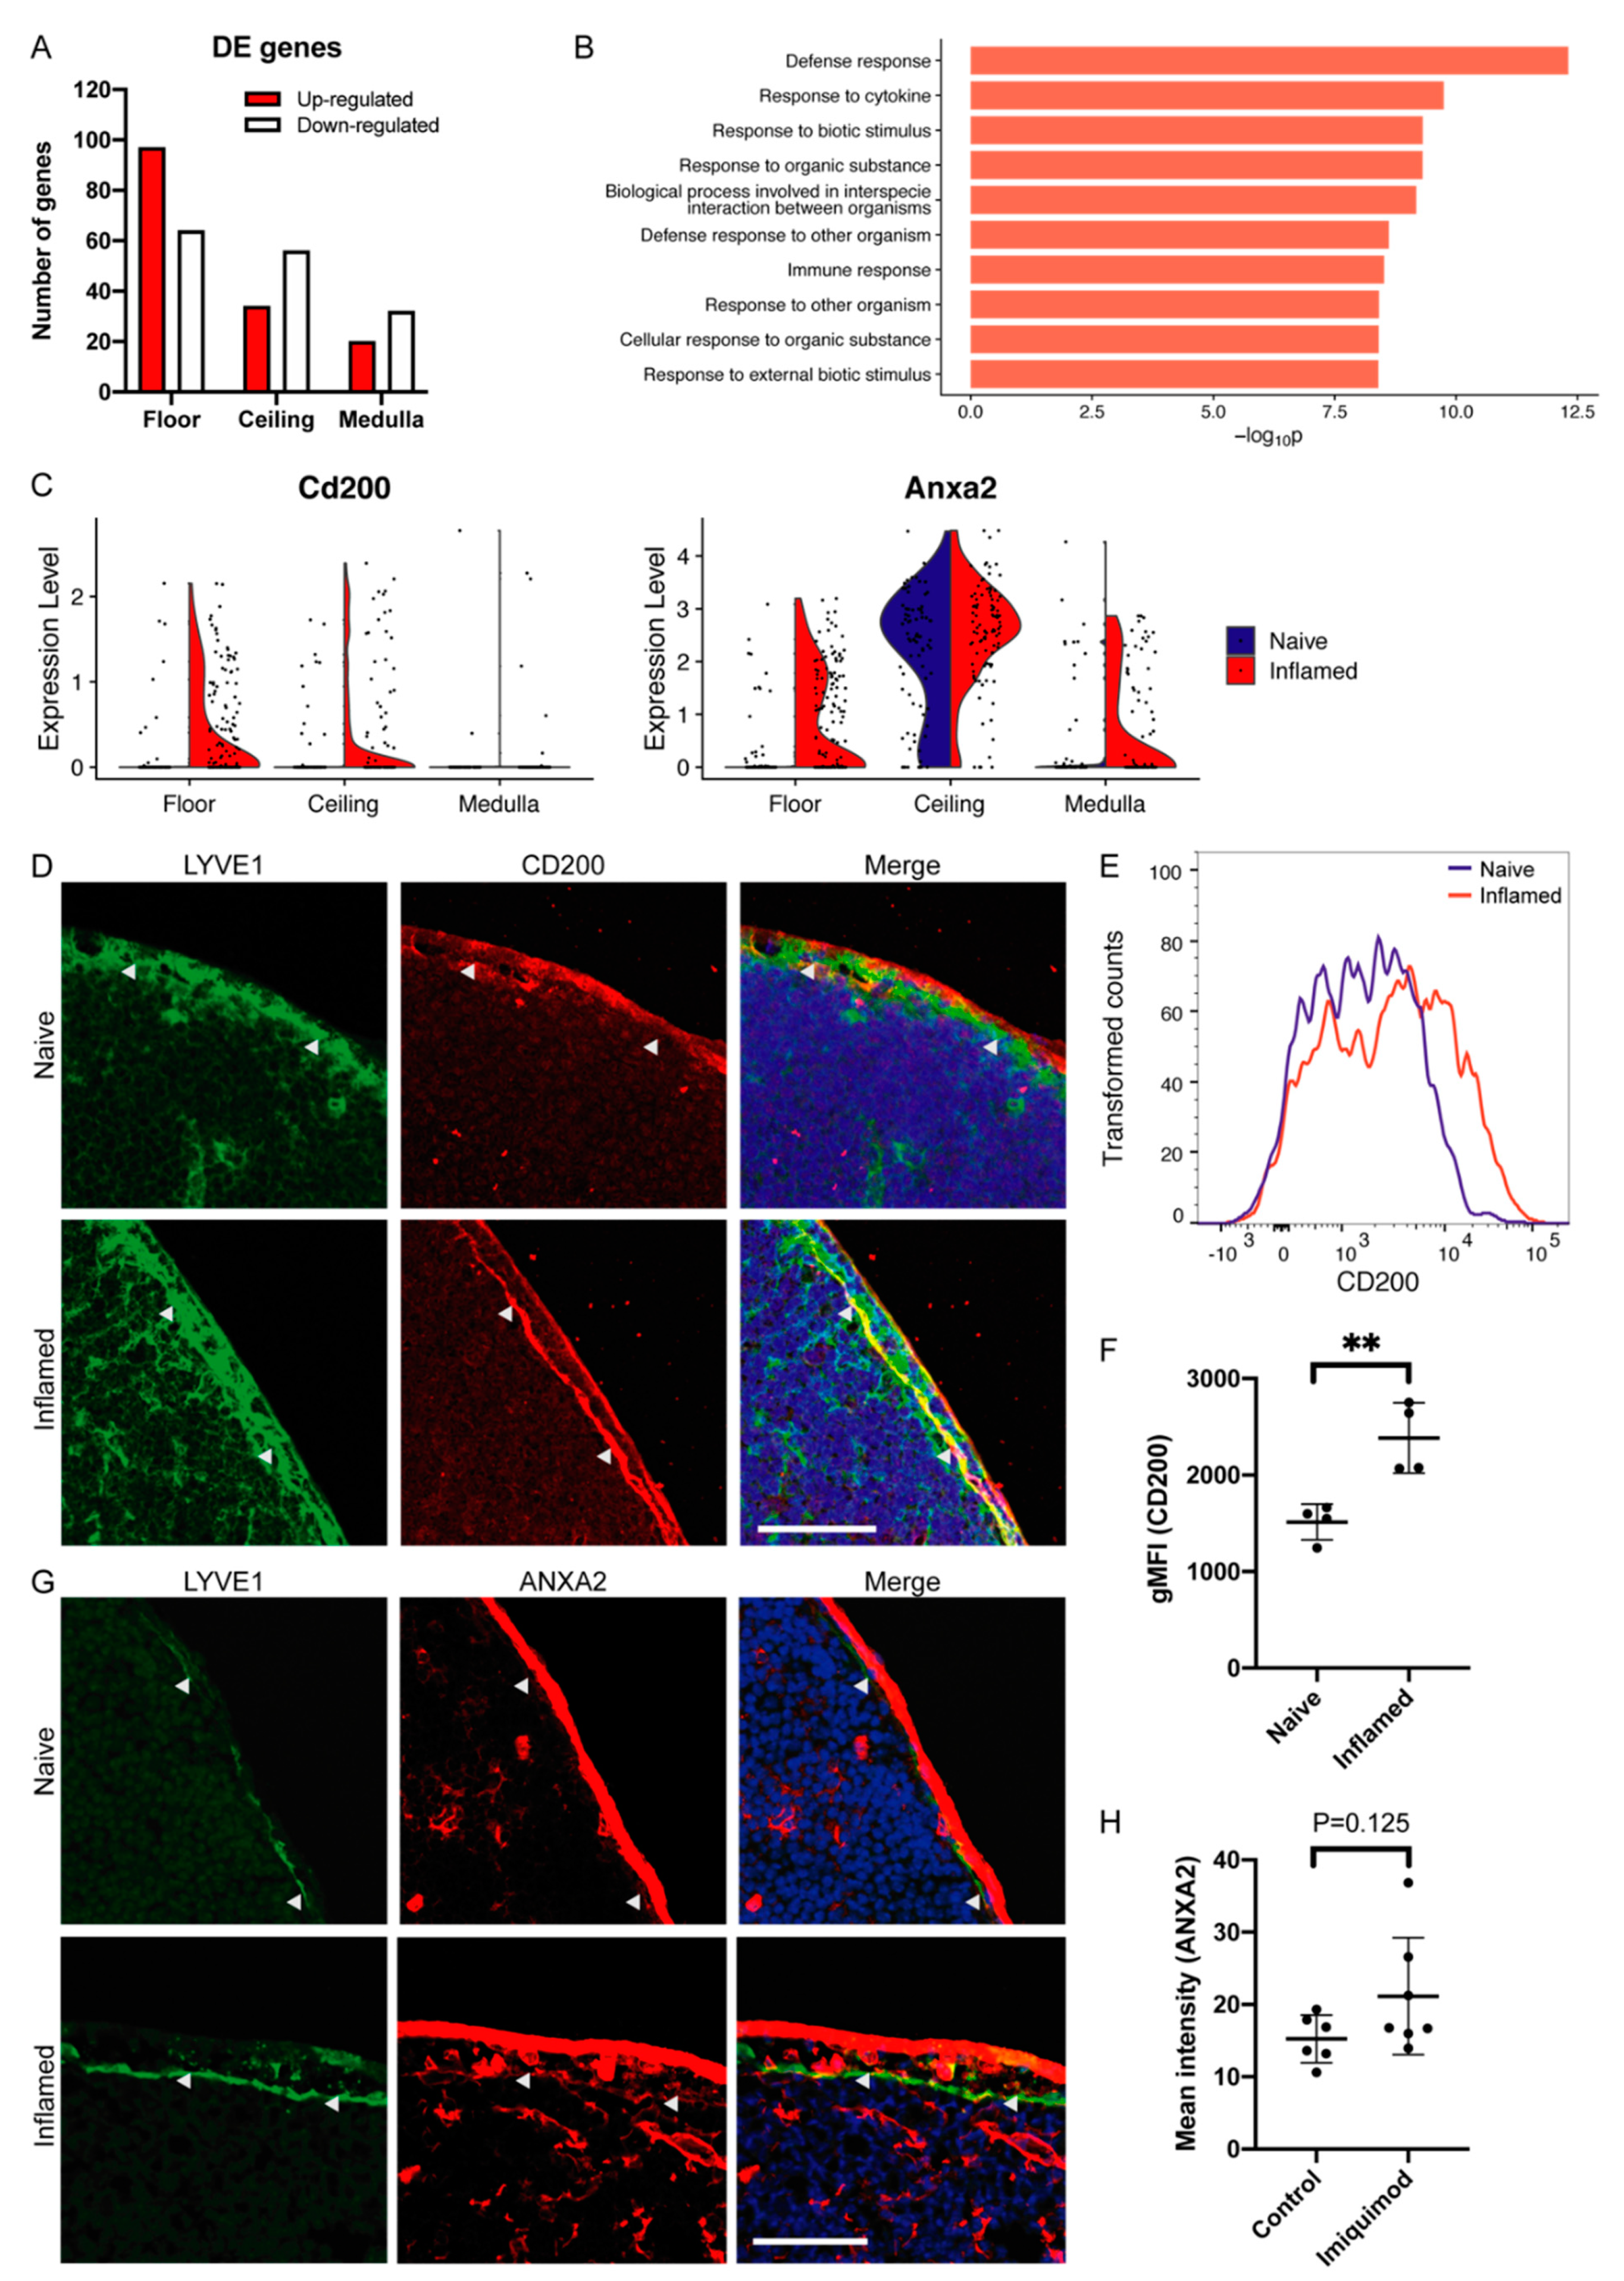
3.2. LN LEC Subtypes Display Distinct Gene Expression in Inflammation
3.3. Specific Up-Regulation of Cd200 and Anxa2 in Floor LECs during Inflammation
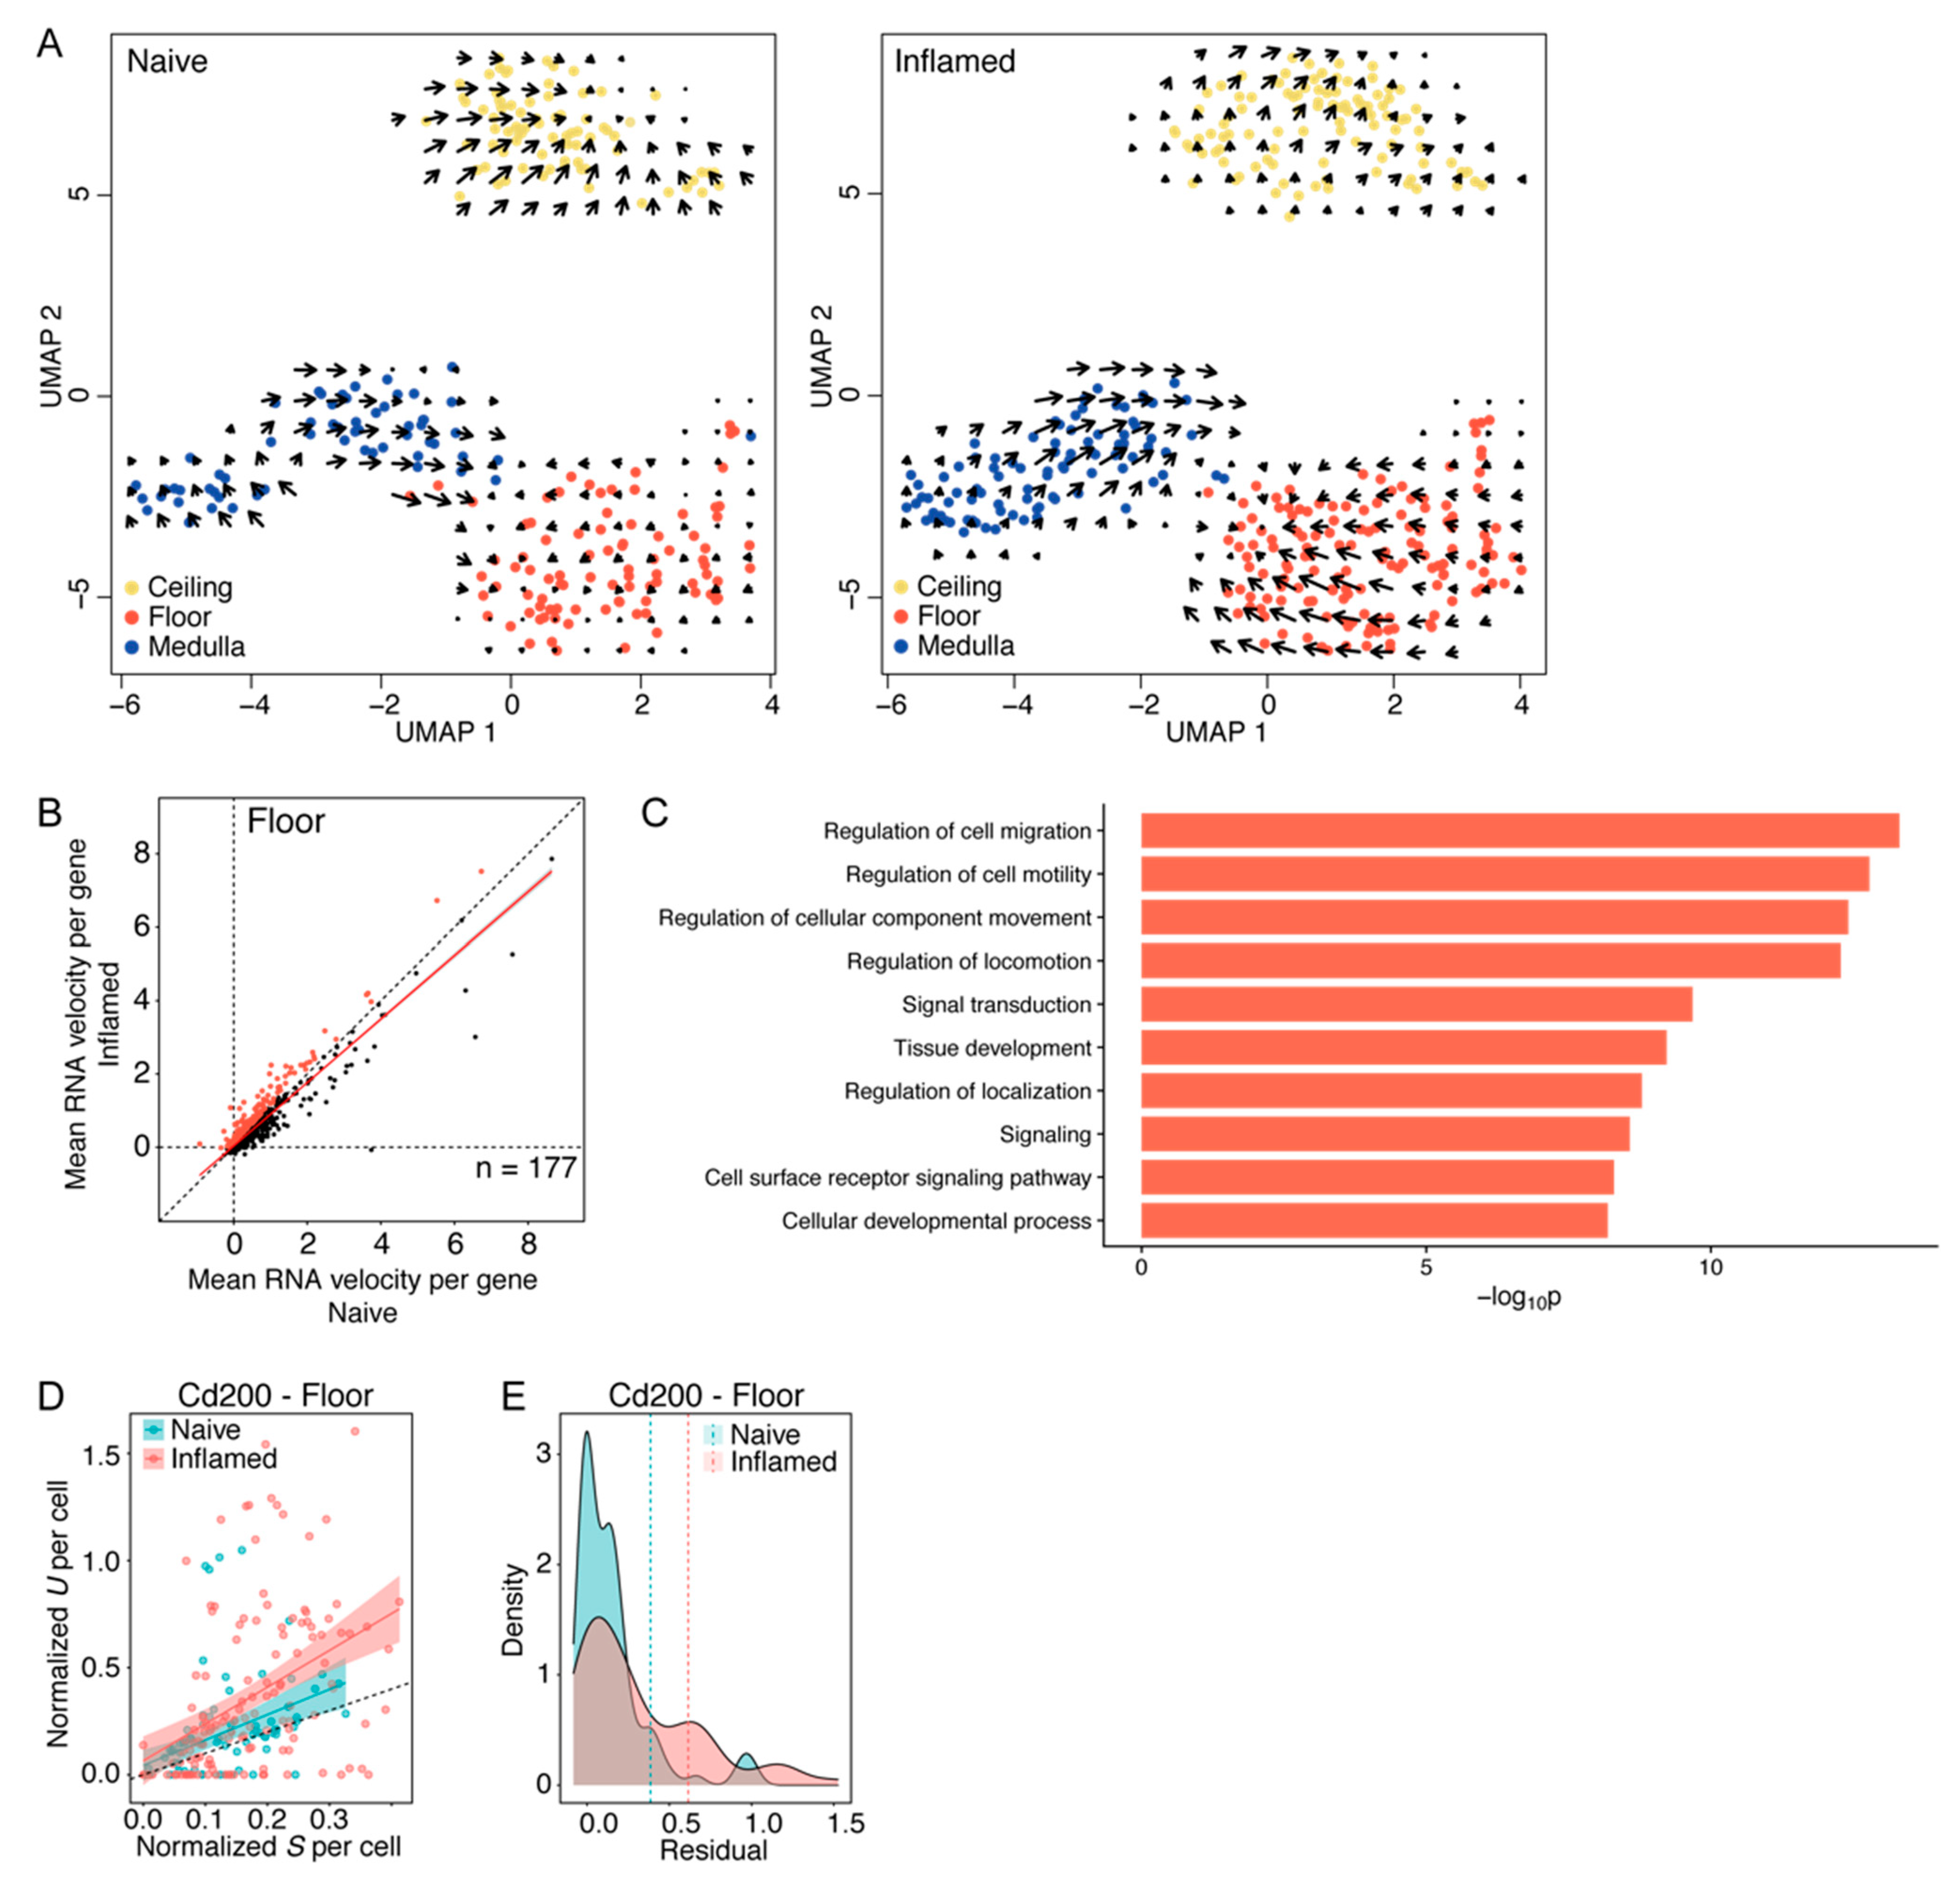
3.4. Floor LECs Display a Distinct RNA “Velocity” Pattern in Inflammation
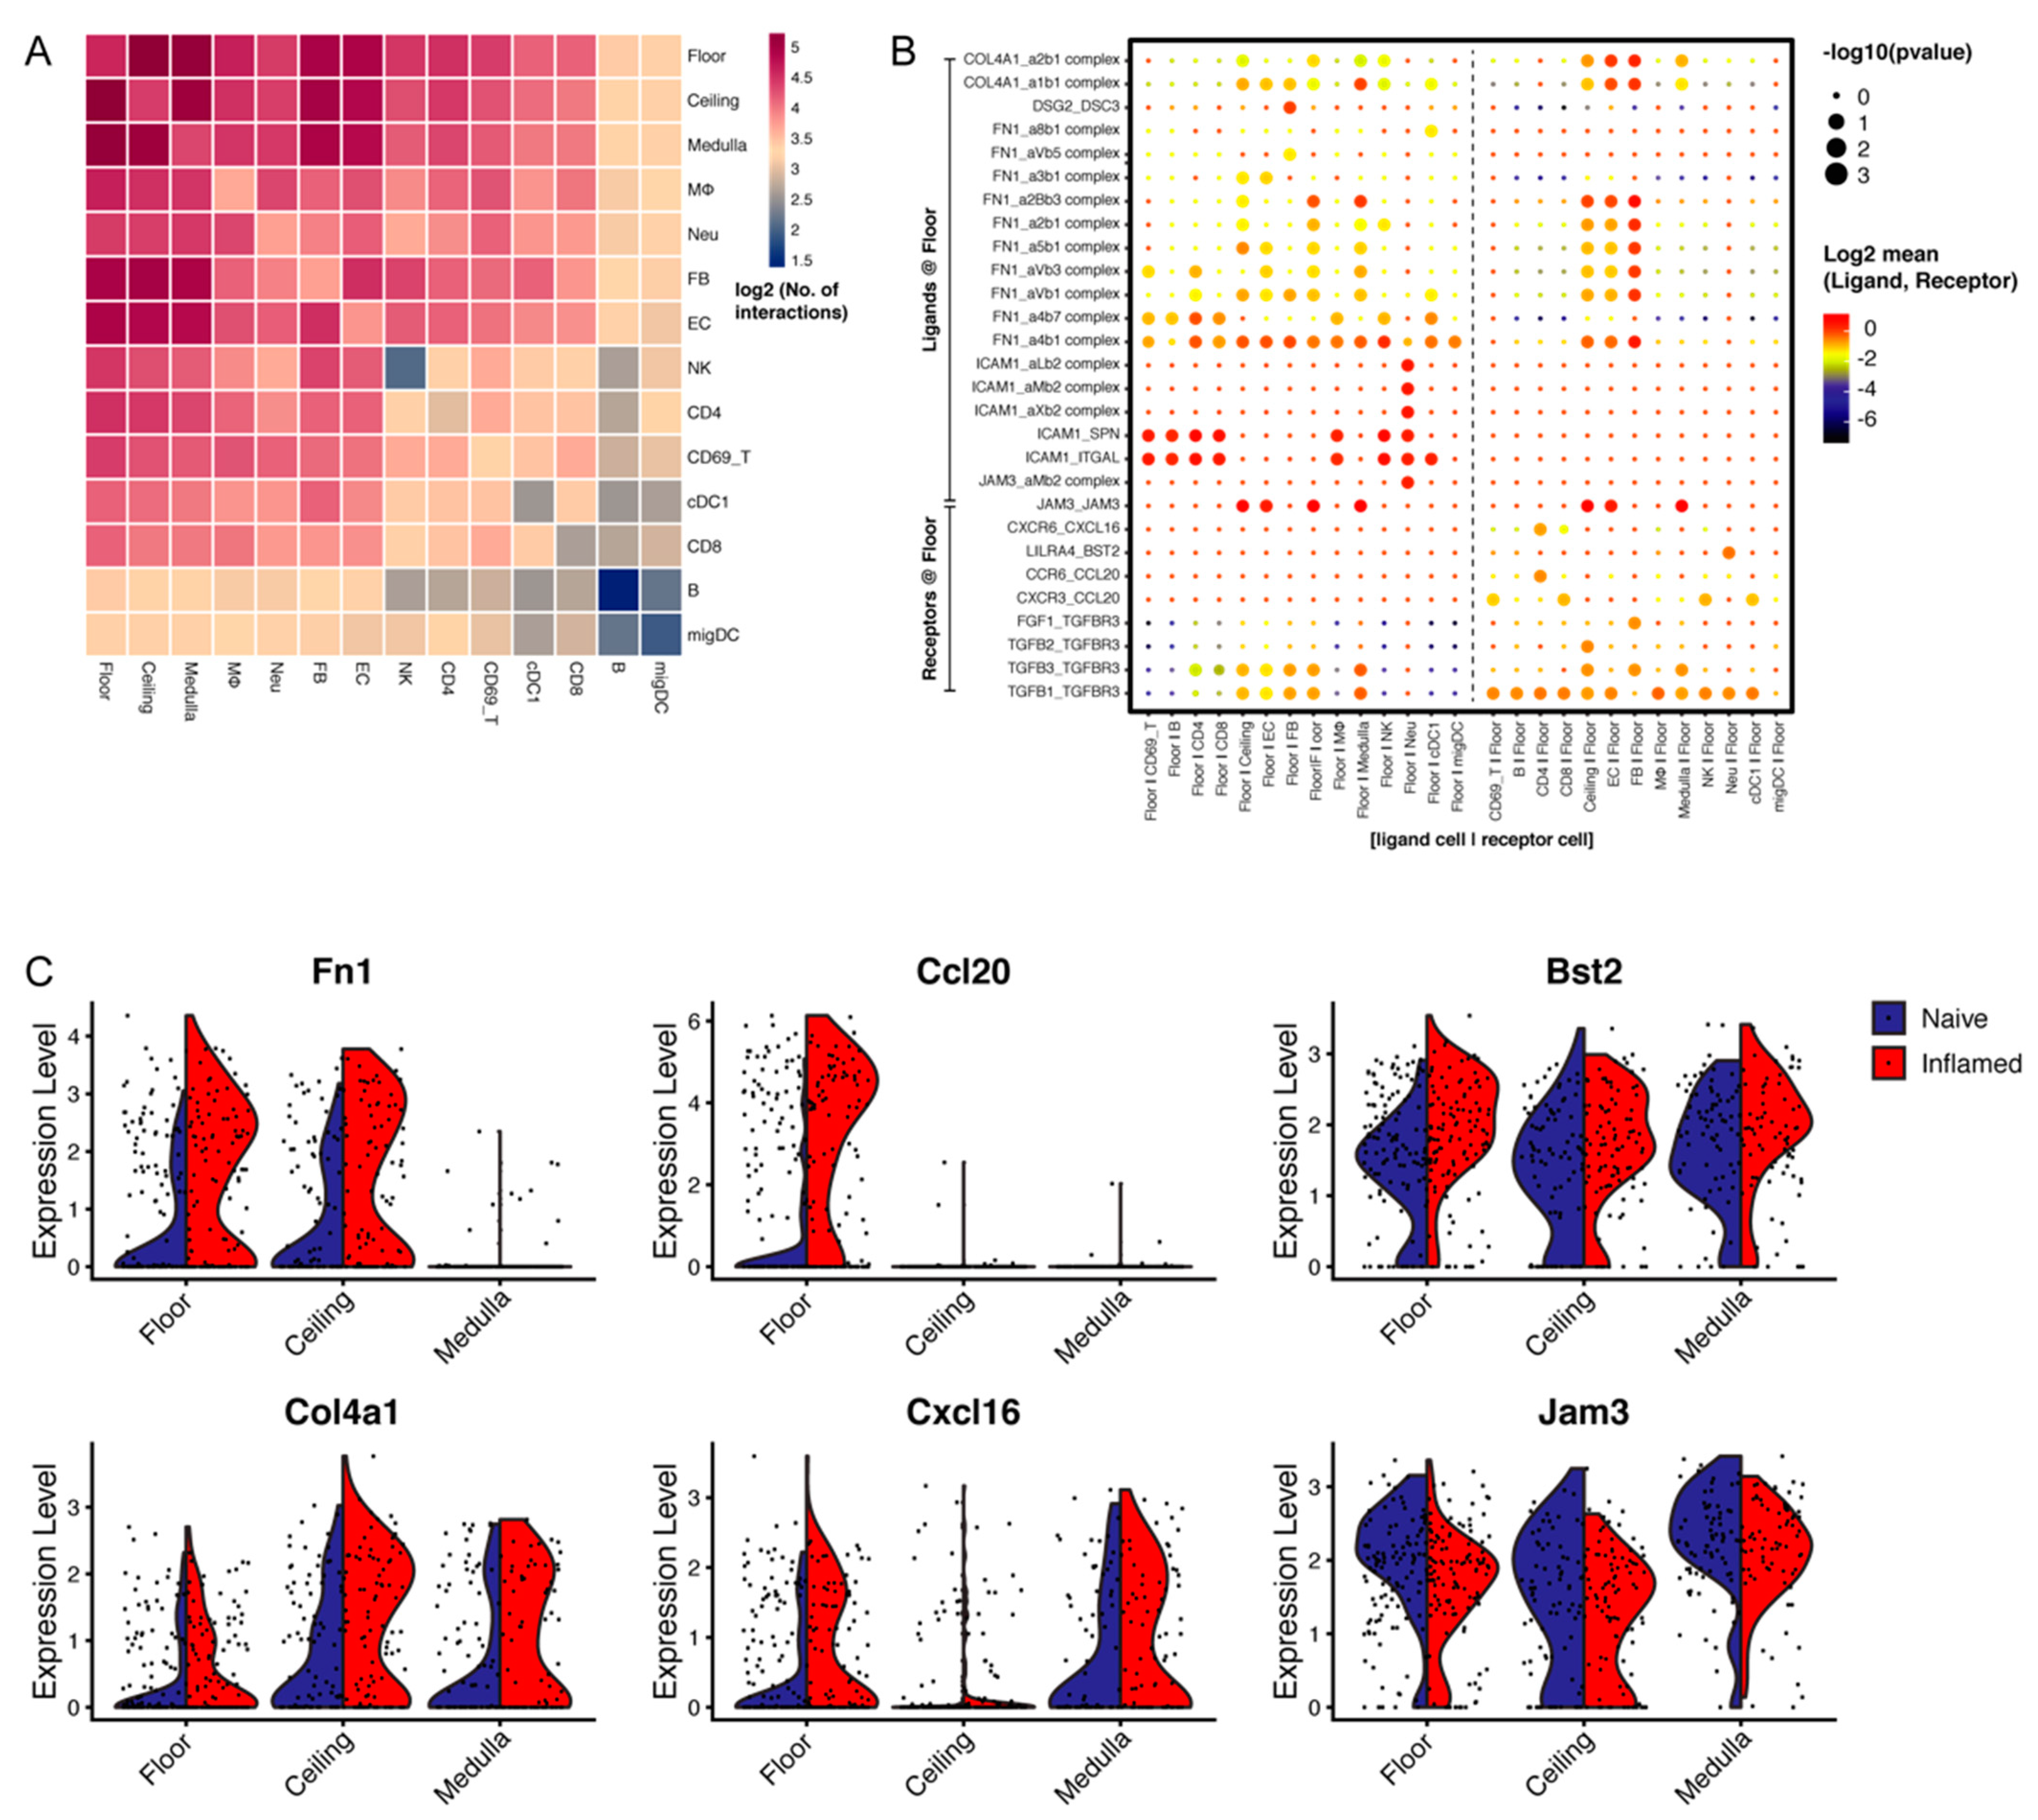
3.5. LN LECs Potentially Interact with Distinct Immune Cell Types
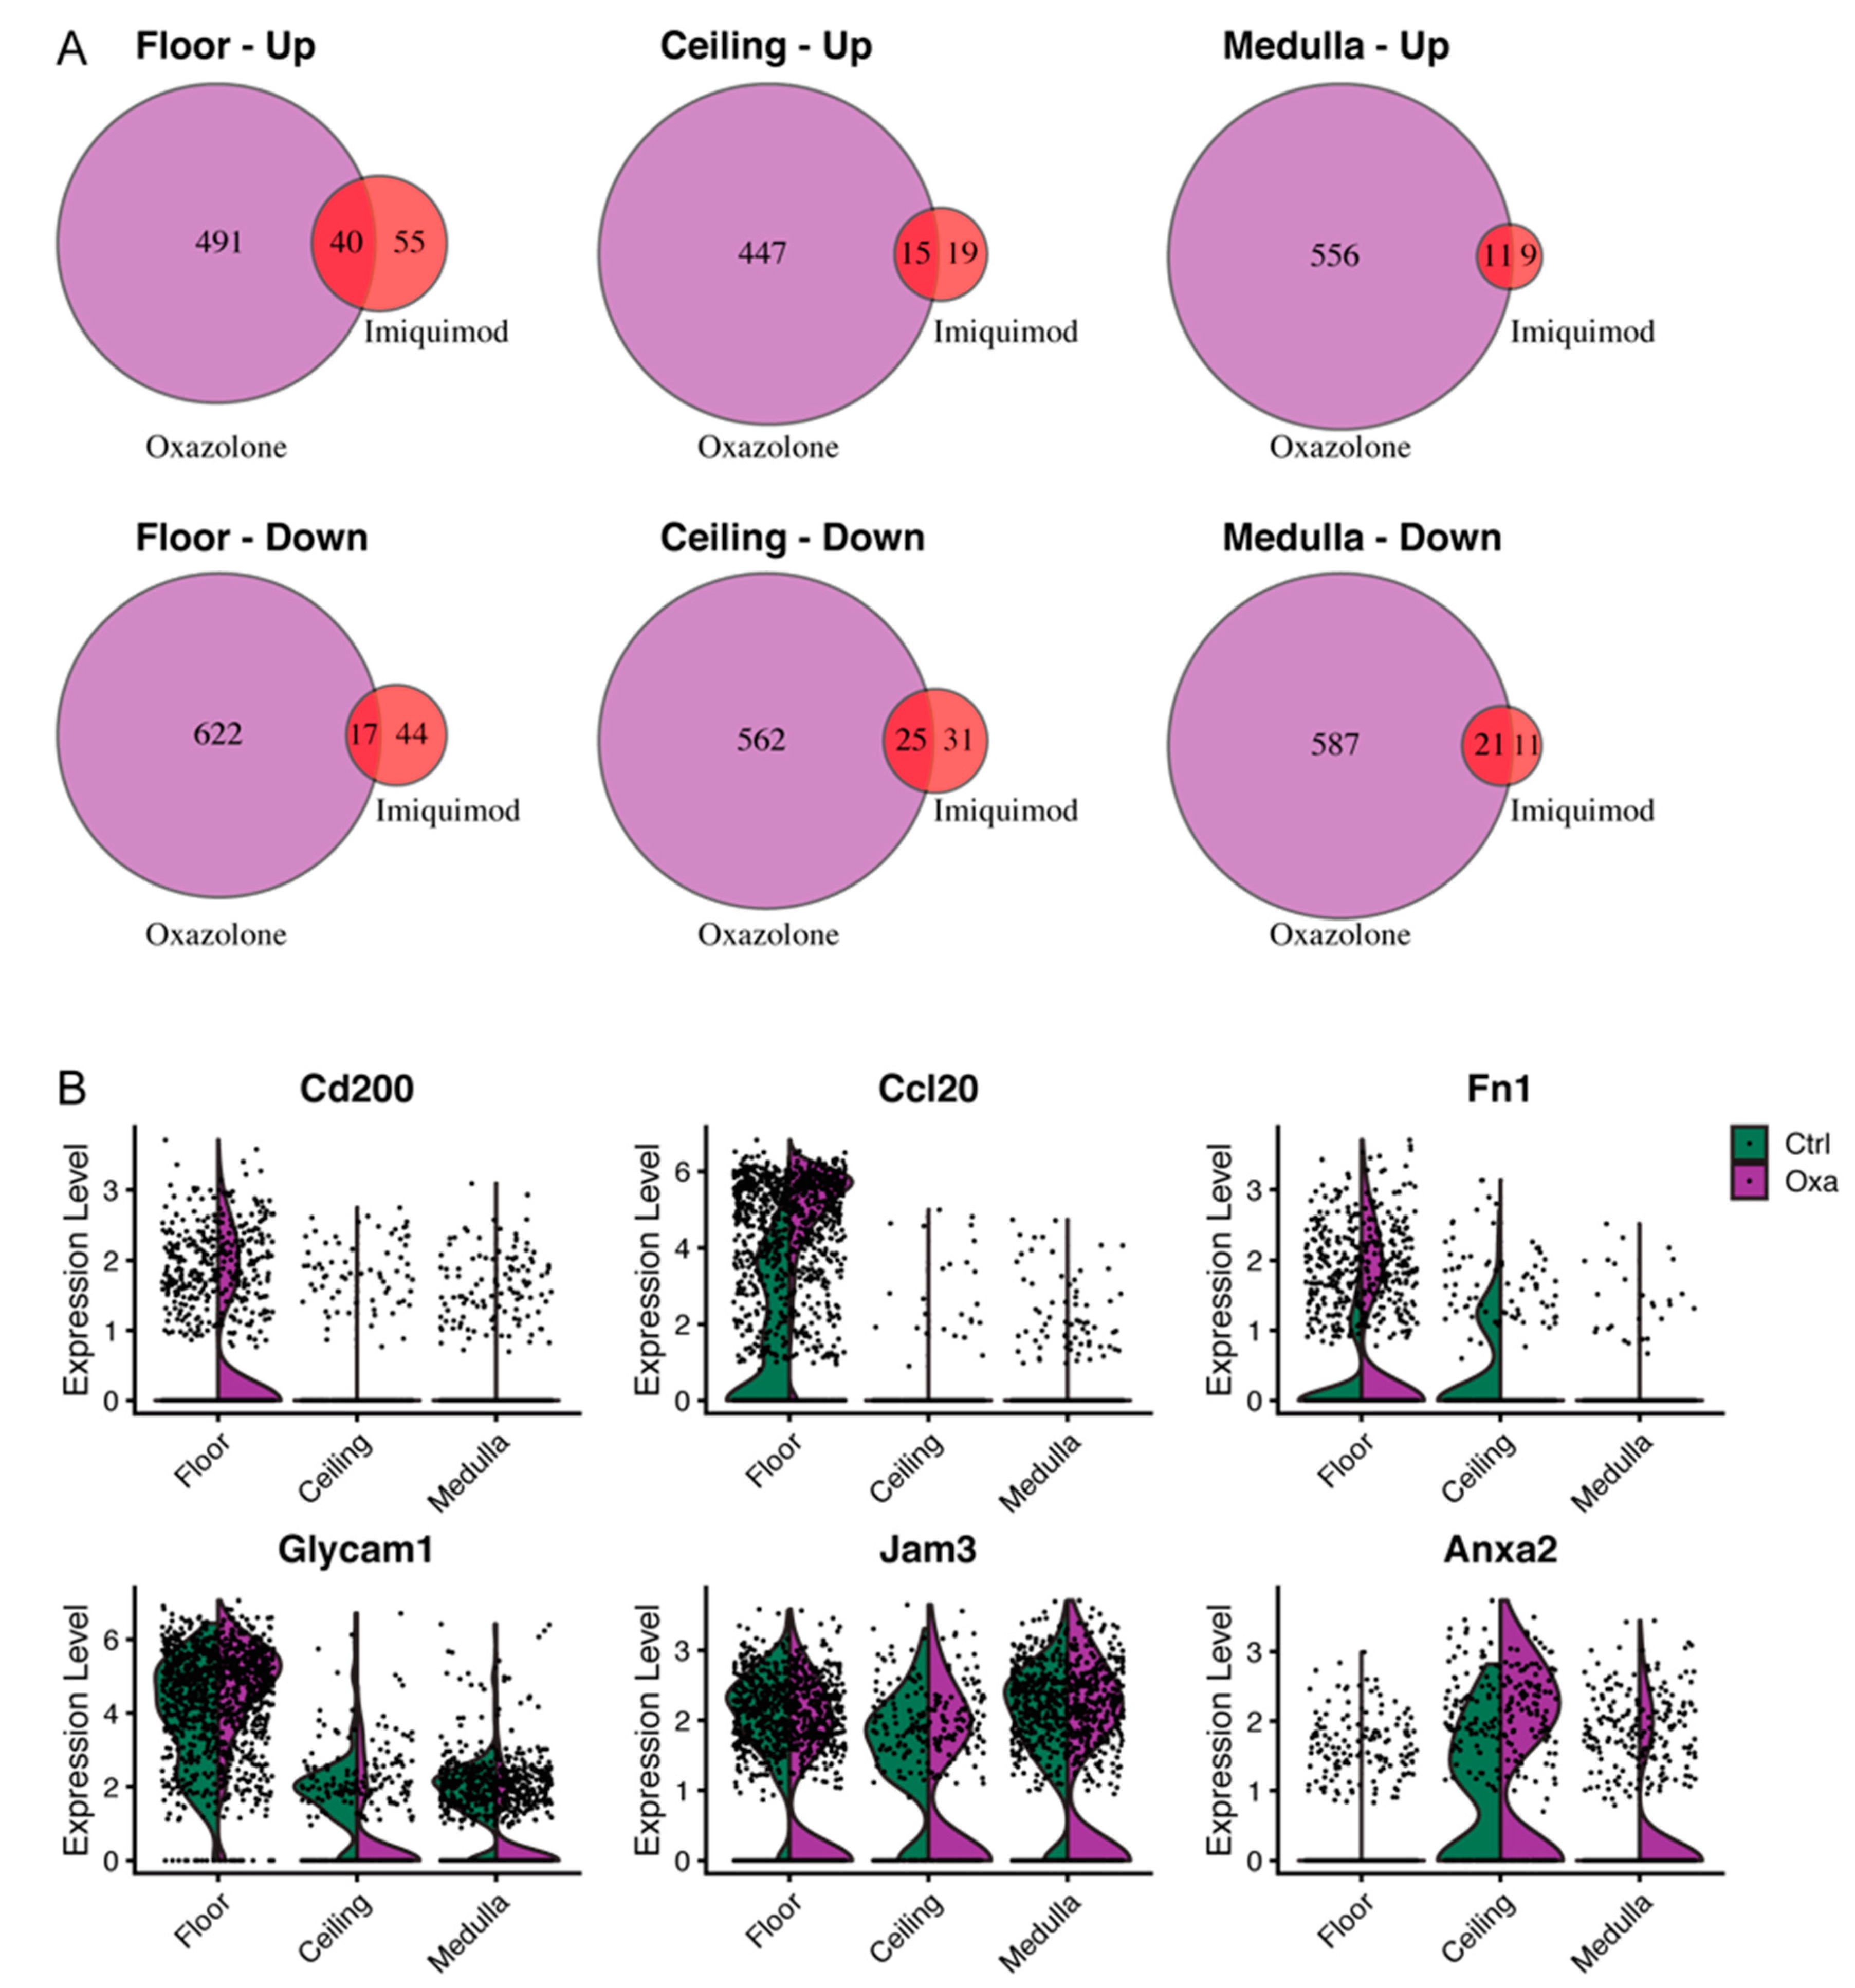
3.6. Imiquimod-Induced Inflammation Elicits Many Transcriptional Changes also Observed after Cutaneous Oxazolone Challenge
4. Discussion
Supplementary Materials
Author Contributions
Funding
Institutional Review Board Statement
Informed Consent Statement
Data Availability Statement
Acknowledgments
Conflicts of Interest
References
- Tewalt, E.F.; Cohen, J.N.; Rouhani, S.J.; Guidi, C.J.; Qiao, H.; Fahl, S.; Conaway, M.R.; Bender, T.P.; Tung, K.S.; Vella, A.T.; et al. Lymphatic endothelial cells induce tolerance via PD-L1 and lack of costimulation leading to high-level PD-1 expression on CD8 T cells. Blood 2012, 120, 4772–4782. [Google Scholar] [CrossRef] [PubMed]
- Cap, S.; Dihr, M.; Cousin, N.; Tacconi, C.; Detmar, M.; Dieterich, L.C. Lymphatic PD-L1 expression restricts tumor-specific CD8+T cell responses. bioRxiv 2020. [Google Scholar] [CrossRef]
- Schwager, S.; Detmar, M. Inflammation and Lymphatic Function. Front. Immunol. 2019, 10, 308. [Google Scholar] [CrossRef] [Green Version]
- Jalkanen, S.; Salmi, M. Lymphatic endothelial cells of the lymph node. Nat. Rev. Immunol. 2020, 20, 566–578. [Google Scholar] [CrossRef]
- Chang, J.E.; Turley, S.J. Stromal infrastructure of the lymph node and coordination of immunity. Trends Immunol. 2015, 36, 30–39. [Google Scholar] [CrossRef] [PubMed]
- Tewalt, E.F.; Cohen, J.N.; Rouhani, S.J.; Engelhard, V.H. Lymphatic endothelial cells—Key players in regulation of tolerance and immunity. Front. Immunol. 2012, 3, 305. [Google Scholar] [CrossRef] [Green Version]
- Tamburini, B.A.; Burchill, M.A.; Kedl, R.M. Antigen capture and archiving by lymphatic endothelial cells following vaccination or viral infection. Nat. Commun. 2014, 5, 1–13. [Google Scholar] [CrossRef] [PubMed]
- Takeda, A.; Hollmén, M.; Dermadi, D.; Pan, J.; Brulois, K.F.; Kaukonen, R.; Lönnberg, T.; Boström, P.; Koskivuo, I.; Irjala, H.; et al. Single-Cell Survey of Human Lymphatics Unveils Marked Endothelial Cell Heterogeneity and Mechanisms of Homing for Neutrophils. Immunity 2019, 51, 561–572.e5. [Google Scholar] [CrossRef]
- Fujimoto, N.; He, Y.; D’Addio, M.; Tacconi, C.; Detmar, M.; Dieterich, L.C. Single-cell mapping reveals new markers and functions of lymphatic endothelial cells in lymph nodes. PLoS Biol. 2020, 18, e3000704. [Google Scholar] [CrossRef] [Green Version]
- Xiang, M.; Grosso, R.; Takeda, A.; Pan, J.; Bekkhus, T.; Brulois, K.; Dermadi, D.; Nordling, S.; Vanlandewijck, M.; Jalkanen, S.; et al. A Single-Cell Transcriptional Roadmap of the Mouse and Human Lymph Node Lymphatic Vasculature. Front. Cardiovasc. Med. 2020, 7, 52. [Google Scholar] [CrossRef]
- Halin, C.; Tobler, N.E.; Vigl, B.; Brown, L.F.; Detmar, M. VEGF-A produced by chronically inflamed tissue induces lymphangiogenesis in draining lymph nodes. Blood 2007, 110, 3158–3167. [Google Scholar] [CrossRef] [Green Version]
- Dubey, L.K.; Karempudi, P.; Luther, S.A.; Ludewig, B.; Harris, N.L. Interactions between fibroblastic reticular cells and B cells promote mesenteric lymph node lymphangiogenesis. Nat. Commun. 2017, 8, 367. [Google Scholar] [CrossRef] [Green Version]
- Angeli, V.; Ginhoux, F.; Llodrà, J.; Quemeneur, L.; Frenette, P.S.; Skobe, M.; Jessberger, R.; Merad, M.; Randolph, G.J. B Cell-Driven Lymphangiogenesis in Inflamed Lymph Nodes Enhances Dendritic Cell Mobilization. Immunity 2006, 24, 203–215. [Google Scholar] [CrossRef] [Green Version]
- Kataru, R.P.; Kim, H.; Jang, C.; Choi, D.K.; Koh, B.I.; Kim, M.; Gollamudi, S.; Kim, Y.-K.; Lee, S.-H.; Koh, G.Y. T Lymphocytes Negatively Regulate Lymph Node Lymphatic Vessel Formation. Immunity 2011, 34, 96–107. [Google Scholar] [CrossRef] [Green Version]
- Commerford, C.D.; Dieterich, L.C.; He, Y.; Hell, T.; Montoya-Zegarra, J.A.; Noerrelykke, S.F.; Russo, E.; Röcken, M.; Detmar, M. Mechanisms of Tumor-Induced Lymphovascular Niche Formation in Draining Lymph Nodes. Cell Rep. 2018, 25, 3554–3563.e4. [Google Scholar] [CrossRef] [PubMed] [Green Version]
- Hemmi, H.; Kaisho, T.; Takeuchi, O.; Sato, S.; Sanjo, H.; Hoshino, K.; Horiuchi, T.; Tomizawa, H.; Takeda, K.; Akira, S. Small anti-viral compounds activate immune cells via the TLR7 MyD88–dependent signaling pathway. Nat. Immunol. 2002, 3, 196–200. [Google Scholar] [CrossRef]
- Van Der Fits, L.; Mourits, S.; Voerman, J.S.A.; Kant, M.; Boon, L.; Laman, J.D.; Cornelissen, F.; Mus, A.-M.; Florencia, E.; Prens, E.P.; et al. Imiquimod-Induced Psoriasis-Like Skin Inflammation in Mice Is Mediated via the IL-23/IL-17 Axis. J. Immunol. 2009, 182, 5836–5845. [Google Scholar] [CrossRef]
- Swindell, W.R.; Michaels, K.A.; Sutter, A.J.; Diaconu, D.; Fritz, Y.; Xing, X.; Sarkar, M.K.; Liang, Y.; Tsoi, A.; Gudjonsson, J.E.; et al. Imiquimod has strain-dependent effects in mice and does not uniquely model human psoriasis. Genome Med. 2017, 9, 1–21. [Google Scholar] [CrossRef] [PubMed] [Green Version]
- Fletcher, A.L.; Malhotra, D.; Acton, S.E.; Lukacs-Kornek, V.; Bellemare-Pelletier, A.; Curry, M.; Armant, M.; Turley, S.J. Reproducible Isolation of Lymph Node Stromal Cells Reveals Site-Dependent Differences in Fibroblastic Reticular Cells. Front. Immunol. 2011, 2, 35. [Google Scholar] [CrossRef] [PubMed] [Green Version]
- Picelli, S.; Faridani, O.R.; Bjorklund, A.K.; Winberg, G.; Sagasser, S.; Sandberg, R. Full-length RNA-seq from single cells using Smart-seq2. Nat. Protoc. 2014, 9, 171–181. [Google Scholar] [CrossRef] [PubMed]
- Bolger, A.M.; Lohse, M.; Usadel, B. Trimmomatic: A flexible trimmer for Illumina sequence data. Bioinformatics 2014, 30, 2114–2120. [Google Scholar] [CrossRef] [Green Version]
- Dobin, A.; Davis, C.A.; Schlesinger, F.; Drenkow, J.; Zaleski, C.; Jha, S.; Batut, P.; Chaisson, M.; Gingeras, T.R. STAR: Ultrafast universal RNA-seq aligner. Bioinformatics 2013, 29, 15–21. [Google Scholar] [CrossRef] [PubMed]
- Liao, Y.; Smyth, G.K.; Shi, W. The R package Rsubread is easier, faster, cheaper and better for alignment and quantification of RNA sequencing reads. Nucleic Acids Res. 2019, 47, e47. [Google Scholar] [CrossRef] [PubMed] [Green Version]
- Lun, A.T.; McCarthy, D.J.; Marioni, J.C. A step-by-step workflow for low-level analysis of single-cell RNA-seq data with Bioconductor. F1000Research 2016, 5, 2122. [Google Scholar] [CrossRef]
- Bacher, R.; Chu, L.-F.; Leng, N.; Gasch, A.P.; Thomson, J.A.; Stewart, R.M.; Newton, M.; Kendziorski, C. SCnorm: Robust normalization of single-cell RNA-seq data. Nat. Methods 2017, 14, 584–586. [Google Scholar] [CrossRef] [PubMed] [Green Version]
- Satija, R.; Farrell, J.A.; Gennert, D.; Schier, A.F.; Regev, A. Spatial reconstruction of single-cell gene expression data. Nat. Biotechnol. 2015, 33, 495–502. [Google Scholar] [CrossRef] [PubMed] [Green Version]
- Stuart, T.; Butler, A.; Hoffman, P.; Hafemeister, C.; Papalexi, E.; Mauck, W.M.; Hao, Y.; Stoeckius, M.; Smibert, P.; Satija, R. Comprehensive Integration of Single-Cell Data. Cell 2019, 177, 1888–1902.e21. [Google Scholar] [CrossRef]
- Tirosh, I.; Izar, B.; Prakadan, S.M.; Wadsworth, M.H., II; Treacy, D.; Trombetta, J.J.; Rotem, A.; Rodman, C.; Lian, C.; Murphy, G.; et al. Dissecting the multicellular ecosystem of metastatic melanoma by single-cell RNA-seq. Science 2016, 352, 189–196. [Google Scholar] [CrossRef] [Green Version]
- Ashburner, M.; Ball, C.A.; Blake, J.A.; Botstein, D.; Butler, H.; Cherry, J.M.; Davis, A.P.; Dolinski, K.; Dwight, S.S.; Eppig, J.T.; et al. Gene Ontology: Tool for the unification of biology. Nat. Genet. 2000, 25, 25–29. [Google Scholar] [CrossRef] [Green Version]
- The Gene Ontology Consortium; Carbon, S.; Douglass, E.; Good, B.M.; Unni, D.R.; Harris, N.L.; Mungall, C.J.; Basu, S.; Chisholm, R.L.; Dodson, R.J.; et al. The Gene Ontology resource: Enriching a GOld mine. Nucleic Acids Res. 2021, 49, D325–D334. [Google Scholar] [CrossRef]
- Mi, H.; Muruganujan, A.; Ebert, D.; Huang, X.; Thomas, P.D. PANTHER version 14: More genomes, a new PANTHER GO-slim and improvements in enrichment analysis tools. Nucleic Acids Res. 2019, 47, D419–D426. [Google Scholar] [CrossRef]
- La Manno, G.; Soldatov, R.; Zeisel, A.; Braun, E.; Hochgerner, H.; Petukhov, V.; Lidschreiber, K.; Kastriti, M.E.; Lönnerberg, P.; Furlan, A.; et al. RNA velocity of single cells. Nat. Cell Biol. 2018, 560, 494–498. [Google Scholar] [CrossRef] [Green Version]
- Huang, S.; Ziegler, C.G.; Austin, J.; Mannoun, N.; Vukovic, M.; Ordovas-Montanes, J.; Shalek, A.K.; Von Andrian, U.H. Lymph nodes are innervated by a unique population of sensory neurons with immunomodulatory potential. Cell 2021, 184, 441–459.e25. [Google Scholar] [CrossRef]
- Durinck, S.; Spellman, P.T.; Birney, E.; Huber, W. Mapping identifiers for the integration of genomic datasets with the R/Bioconductor package biomaRt. Nat. Protoc. 2009, 4, 1184–1191. [Google Scholar] [CrossRef] [PubMed] [Green Version]
- Efremova, M.; Vento-Tormo, M.; Teichmann, S.A.; Vento-Tormo, R. CellPhoneDB: Inferring cell–cell communication from combined expression of multi-subunit ligand–receptor complexes. Nat. Protoc. 2020, 15, 1484–1506. [Google Scholar] [CrossRef] [PubMed]
- Schindelin, J.; Arganda-Carreras, I.; Frise, E.; Kaynig, V.; Longair, M.; Pietzsch, T.; Preibisch, S.; Rueden, C.; Saalfeld, S.; Schmid, B.; et al. Fiji: An open-source platform for biological-image analysis. Nat. Methods 2012, 9, 676–682. [Google Scholar] [CrossRef] [PubMed] [Green Version]
- Ulvmar, M.H.; Werth, K.; Braun, A.; Kelay, P.; Hub, E.; Eller, K.; Chan, L.; Lucas, B.; Novitzky-Basso, I.; Nakamura, K.; et al. The atypical chemokine receptor CCRL1 shapes functional CCL21 gradients in lymph nodes. Nat. Immunol. 2014, 15, 623–630. [Google Scholar] [CrossRef] [PubMed]
- Cohen, J.N.; Tewalt, E.F.; Rouhani, S.J.; Buonomo, E.L.; Bruce, A.N.; Xu, X.; Bekiranov, S.; Fu, Y.-X.; Engelhard, V.H. Tolerogenic Properties of Lymphatic Endothelial Cells Are Controlled by the Lymph Node Microenvironment. PLoS ONE 2014, 9, e87740. [Google Scholar] [CrossRef] [PubMed] [Green Version]
- Cordeiro, O.G.; Chypre, M.; Brouard, N.; Rauber, S.; Alloush, F.; Romera-Hernandez, M.; Bénézech, C.; Li, Z.; Eckly, A.; Coles, M.C.; et al. Integrin-Alpha IIb Identifies Murine Lymph Node Lymphatic Endothelial Cells Responsive to RANKL. PLoS ONE 2016, 11, e0151848. [Google Scholar] [CrossRef] [Green Version]
- Homey, B.; Dieu-Nosjean, M.-C.; Wiesenborn, A.; Massacrier, C.; Pin, J.-J.; Oldham, E.R.; Catron, D.; Buchanan, M.E.; Müller, A.; Malefyt, R.D.; et al. Up-Regulation of Macrophage Inflammatory Protein-3α/CCL20 and CC Chemokine Receptor 6 in Psoriasis. J. Immunol. 2000, 164, 6621–6632. [Google Scholar] [CrossRef] [PubMed] [Green Version]
- Schutyser, E.; Struyf, S.; Van Damme, J. The CC chemokine CCL20 and its receptor CCR6. Cytokine Growth Factor Rev. 2003, 14, 409–426. [Google Scholar] [CrossRef]
- Imai, Y.; Singer, M.S.; Fennie, C.; Lasky, L.A.; Rosen, S.D. Identification of a carbohydrate-based endothelial ligand for a lymphocyte homing receptor. J. Cell Biol. 1991, 113, 1213–1221. [Google Scholar] [CrossRef]
- Trachsel, E.; Kaspar, M.; Bootz, F.; Detmar, M.; Neri, D. A Human mAb Specific to Oncofetal Fibronectin Selectively Targets Chronic Skin Inflammation In Vivo. J. Investig. Dermatol. 2007, 127, 881–886. [Google Scholar] [CrossRef] [Green Version]
- Wright, G.J.; Cherwinski, H.; Foster-Cuevas, M.; Brooke, G.; Puklavec, M.J.; Bigler, M.; Song, Y.; Jenmalm, M.; Gorman, D.; McClanahan, T.; et al. Characterization of the CD200 Receptor Family in Mice and Humans and Their Interactions with CD200. J. Immunol. 2003, 171, 3034–3046. [Google Scholar] [CrossRef] [PubMed] [Green Version]
- Ko, Y.-C.; Chien, H.-F.; Jiang-Shieh, Y.; Chang, C.-Y.; Pai, M.-H.; Huang, J.-P.; Chen, H.-M.; Wu, C.-H. Endothelial CD200 is heterogeneously distributed, regulated and involved in immune cell-endothelium interactions. J. Anat. 2009, 214, 183–195. [Google Scholar] [CrossRef] [PubMed]
- Hoek, R.M.; Ruuls, S.R.; Murphy, C.A.; Wright, G.J.; Goddard, R.; Zurawski, S.M.; Blom, B.; Homola, M.E.; Streit, W.J.; Brown, M.H.; et al. Down-Regulation of the Macrophage Lineage Through Interaction with OX2 (CD200). Science 2000, 290, 1768–1771. [Google Scholar] [CrossRef] [PubMed]
- Rygiel, T.P.; Karnam, G.; Goverse, G.; Van Der Marel, A.P.J.; Greuter, M.J.; Van Schaarenburg, R.A.; Visser, W.F.; Brenkman, A.B.; Molenaar, R.; Hoek, R.M.; et al. CD200-CD200R signaling suppresses anti-tumor responses independently of CD200 expression on the tumor. Oncogene 2011, 31, 2979–2988. [Google Scholar] [CrossRef] [PubMed] [Green Version]
- Grindheim, A.K.; Saraste, J.; Vedeler, A. Protein phosphorylation and its role in the regulation of Annexin A2 function. Biochim. Biophys. Acta Gen. Subj. 2017, 1861, 2515–2529. [Google Scholar] [CrossRef] [PubMed]
- Honda, T.; Egawa, G.; Grabbe, S.; Kabashima, K. Update of Immune Events in the Murine Contact Hypersensitivity Model: Toward the Understanding of Allergic Contact Dermatitis. J. Investig. Dermatol. 2013, 133, 303–315. [Google Scholar] [CrossRef] [PubMed] [Green Version]
- Braun, A.; Worbs, T.; Moschovakis, G.L.; Halle, S.; Hoffmann, K.; Bölter, J.; Münk, A.; Förster, R. Afferent lymph–derived T cells and DCs use different chemokine receptor CCR7–dependent routes for entry into the lymph node and intranodal migration. Nat. Immunol. 2011, 12, 879–887. [Google Scholar] [CrossRef]
- Rantakari, P.; Auvinen, K.; Jäppinen, N.; Kapraali, M.; Valtonen, J.; Karikoski, M.; Gerke, H.; Iftakhar-E.-Khuda, I.; Keuschnigg, J.; Umemoto, E.; et al. The endothelial protein PLVAP in lymphatics controls the entry of lymphocytes and antigens into lymph nodes. Nat. Immunol. 2015, 16, 386–396. [Google Scholar] [CrossRef]
- Rodda, L.B.; Lu, E.; Bennett, M.L.; Sokol, C.L.; Wang, X.; Luther, S.A.; Barres, B.A.; Luster, A.D.; Ye, C.J.; Cyster, J.G. Single-Cell RNA Sequencing of Lymph Node Stromal Cells Reveals Niche-Associated Heterogeneity. Immunity 2018, 48, 1014–1028.e6. [Google Scholar] [CrossRef] [Green Version]
- Pezoldt, J.; Pasztoi, M.; Zou, M.; Wiechers, C.; Beckstette, M.; Thierry, G.R.; Vafadarnejad, E.; Floess, S.; Arampatzi, P.; Buettner, M.; et al. Neonatally imprinted stromal cell subsets induce tolerogenic dendritic cells in mesenteric lymph nodes. Nat. Commun. 2018, 9, 3903. [Google Scholar] [CrossRef] [Green Version]
- Veerman, K.; Tardiveau, C.; Martins, F.; Coudert, J.; Girard, J.-P. Single-Cell Analysis Reveals Heterogeneity of High Endothelial Venules and Different Regulation of Genes Controlling Lymphocyte Entry to Lymph Nodes. Cell Rep. 2019, 26, 3116–3131.e5. [Google Scholar] [CrossRef] [Green Version]
- Brulois, K.; Rajaraman, A.; Szade, A.; Nordling, S.; Bogoslowski, A.; Dermadi, D.; Rahman, M.; Kiefel, H.; O’Hara, E.; Koning, J.J.; et al. A molecular map of murine lymph node blood vascular endothelium at single cell resolution. Nat. Commun. 2020, 11, 1–15. [Google Scholar] [CrossRef]
- Swindell, W.R.; Sarkar, M.; Liang, Y.; Xing, X.; Baliwag, J.; Elder, J.T.; Johnston, A.; Ward, N.L.; Gudjonsson, J.E. RNA-seq identifies a diminished differentiation gene signature in primary monolayer keratinocytes grown from lesional and uninvolved psoriatic skin. Sci. Rep. 2017, 7, 1–13. [Google Scholar] [CrossRef] [Green Version]
- Bielecki, P.; Riesenfeld, S.J.; Hütter, J.-C.; Triglia, E.T.; Kowalczyk, M.S.; Ricardo-Gonzalez, R.R.; Lian, M.; Vesely, M.C.A.; Kroehling, L.; Xu, H.; et al. Skin-resident innate lymphoid cells converge on a pathogenic effector state. Nat. Cell Biol. 2021, 592, 1–5. [Google Scholar] [CrossRef]
- Liu, J.; Chang, H.-W.; Huang, Z.-M.; Nakamura, M.; Sekhon, S.; Ahn, R.; Munoz-Sandoval, P.; Bhattarai, S.; Beck, K.M.; Sanchez, I.M.; et al. Single-cell RNA sequencing of psoriatic skin identifies pathogenic Tc17 cell subsets and reveals distinctions between CD8+ T cells in autoimmunity and cancer. J. Allergy Clin. Immunol. 2020. [Google Scholar] [CrossRef] [PubMed]
- Martens, R.; Permanyer, M.; Werth, K.; Yu, K.; Braun, A.; Halle, O.; Halle, S.; Patzer, G.E.; Bošnjak, B.; Kiefer, F.; et al. Efficient homing of T cells via afferent lymphatics requires mechanical arrest and integrin-supported chemokine guidance. Nat. Commun. 2020, 11, 1–16. [Google Scholar] [CrossRef]
- Reiter, M.J.; Man, T.L.T.; Miller, R.L.; Weeks, C.E.; Tomai, M.A. Cytokine induction in mice by the immunomodulator imiquimod. J. Leukoc. Biol. 1994, 55, 234–240. [Google Scholar] [CrossRef]
- Cohen, M.; Ben-Yehuda, H.; Porat, Z.; Raposo, C.; Gordon, S.; Schwartz, M. Newly Formed Endothelial Cells Regulate Myeloid Cell Activity Following Spinal Cord Injury via Expression of CD200 Ligand. J. Neurosci. 2016, 37, 972–985. [Google Scholar] [CrossRef] [Green Version]
- Belkin, D.A.; Mitsui, H.; Wang, C.Q.F.; Gonzalez, J.; Zhang, S.; Shah, K.R.; Coats, I.; Suàrez-Fariñas, M.; Krueger, J.G.; Felsen, D.; et al. CD200 Upregulation in Vascular Endothelium Surrounding Cutaneous Squamous Cell Carcinoma. JAMA Dermatol. 2013, 149, 178–186. [Google Scholar] [CrossRef] [Green Version]
- Li, W.; Chen, Z.; Yuan, J.; Yu, Z.; Cheng, C.; Zhao, Q.; Huang, L.; Hajjar, K.A.; Chen, Z.; Lo, E.H.; et al. Annexin A2 is a Robo4 ligand that modulates ARF6 activation-associated cerebral trans-endothelial permeability. Br. J. Pharmacol. 2019, 39, 2048–2060. [Google Scholar] [CrossRef]
- Luo, M.; Flood, E.C.; Almeida, D.; Yan, L.; Berlin, D.A.; Heerdt, P.M.; Hajjar, K.A. Annexin A2 supports pulmonary microvascular integrity by linking vascular endothelial cadherin and protein tyrosine phosphatases. J. Exp. Med. 2017, 214, 2535–2545. [Google Scholar] [CrossRef]
- Fuse, C.; Ishida, Y.; Hikita, T.; Asai, T.; Oku, N. Junctional Adhesion Molecule-C Promotes Metastatic Potential of HT1080 Human Fibrosarcoma. J. Biol. Chem. 2007, 282, 8276–8283. [Google Scholar] [CrossRef] [Green Version]
- Santoso, S.; Orlova, V.V.; Song, K.; Sachs, U.J.; Andrei-Selmer, C.L.; Chavakis, T. The Homophilic Binding of Junctional Adhesion Molecule-C Mediates Tumor Cell-Endothelial Cell Interactions. J. Biol. Chem. 2005, 280, 36326–36333. [Google Scholar] [CrossRef] [Green Version]
- Liu, Y.; Cook, C.; Sedgewick, A.J.; Zhang, S.; Fassett, M.S.; Ricardo-Gonzalez, R.R.; Harirchian, P.; Kashem, S.W.; Hanakawa, S.; Leistico, J.R.; et al. Single-Cell Profiling Reveals Divergent, Globally Patterned Immune Responses in Murine Skin Inflammation. iScience 2020, 23, 101582. [Google Scholar] [CrossRef]
- Donglang, G.; Tongtong, L.; Dan, C.; Chan, Z.; Changming, W.; Guang, Y.; Yan, Y.; Zongxiang, T. Comparative Study on Different Skin Pruritus Mouse Models. Front. Med. 2021, 8, 630237. [Google Scholar] [CrossRef]
- Mebius, R.E.; Dowbenko, D.; Williams, A.; Fennie, C.; Lasky, L.A.; Watson, S.R. Expression of GlyCAM-1, an endothelial ligand for L-selectin, is affected by afferent lymphatic flow. J. Immunol. 1993, 151, 6769–6776. [Google Scholar]
- Weng, Y.; Siciliano, S.J.; Waldburger, K.E.; Sirotina-Meisher, A.; Staruch, M.J.; Daugherty, B.L.; Gould, S.L.; Springer, M.S.; DeMartino, J.A. Binding and Functional Properties of Recombinant and Endogenous CXCR3 Chemokine Receptors. J. Biol. Chem. 1998, 273, 18288–18291. [Google Scholar] [CrossRef] [Green Version]


Publisher’s Note: MDPI stays neutral with regard to jurisdictional claims in published maps and institutional affiliations. |
© 2021 by the authors. Licensee MDPI, Basel, Switzerland. This article is an open access article distributed under the terms and conditions of the Creative Commons Attribution (CC BY) license (https://creativecommons.org/licenses/by/4.0/).
Share and Cite
Sibler, E.; He, Y.; Ducoli, L.; Keller, N.; Fujimoto, N.; Dieterich, L.C.; Detmar, M. Single-Cell Transcriptional Heterogeneity of Lymphatic Endothelial Cells in Normal and Inflamed Murine Lymph Nodes. Cells 2021, 10, 1371. https://doi.org/10.3390/cells10061371
Sibler E, He Y, Ducoli L, Keller N, Fujimoto N, Dieterich LC, Detmar M. Single-Cell Transcriptional Heterogeneity of Lymphatic Endothelial Cells in Normal and Inflamed Murine Lymph Nodes. Cells. 2021; 10(6):1371. https://doi.org/10.3390/cells10061371
Chicago/Turabian StyleSibler, Eliane, Yuliang He, Luca Ducoli, Nadja Keller, Noriki Fujimoto, Lothar C. Dieterich, and Michael Detmar. 2021. "Single-Cell Transcriptional Heterogeneity of Lymphatic Endothelial Cells in Normal and Inflamed Murine Lymph Nodes" Cells 10, no. 6: 1371. https://doi.org/10.3390/cells10061371