Article

Sorbent and Photocatalytic Potentials of Local Clays for the Removal of Organic Xenobiotic: Case of Crystal Violet

1
Department of Chemistry, Faculty of Science, University of Maroua, JCR8+423 Maroua, Cameroon
2
Department of Chemistry, School of Physical Sciences, College of Agriculture and Natural Sciences, University of Cape Coast, Cape Coast P.O. Box LG 25, Ghana
3
UniLaSalle-Ecole des Métiers de l’Environnement, Cyclann, Campus de Ker Lann, 35170 Bruz, France
4
Department of Chemical Engineering, College of Engineering, King Khalid University, Abha 61411, Saudi Arabia
5
Univ Rennes, CNRS, ISCR (Institut des Sciences Chimiques de Rennes)—UMR 6226, F-35000 Rennes, France
6
Multifunctional Materials Laboratory, Department of Mechanical Engineering, Ahmadu Bello University, Zaria 810222, Nigeria
7
Africa Centre of Excellence on New Pedagogies in Engineering Education, Ahmadu Bello University, Zaria 81022, Nigeria
*
Authors to whom correspondence should be addressed.
Catalysts 2022, 12(8), 899; https://doi.org/10.3390/catal12080899
Submission received: 22 July 2022 / Revised: 5 August 2022 / Accepted: 8 August 2022 / Published: 16 August 2022
(This article belongs to the Special Issue Nanomaterials for Photocatalysis)

Abstract

:
Natural materials are widely used in the field of environmental remediation and are appreciated for their surface physical and chemical properties. Clay constitutes a typical example. In this work, we report the evaluation of sorbent and photocatalytic potentials of local clay of two irrigated rice field waters in the degradation of crystal violet. The structural, textural and compositional properties of the local clay were investigated by Fourier Transform Infrared Spectroscopy (FTIR), X-ray Diffraction (XRD) and X-ray Fluorescence (XRF) analysis. The analysis results showed that these materials were composed mainly of quartz and kaolinite. The efficiency of these adsorbents (Y. Clay and L. Clay) to eliminate crystal violet dye from aqueous medium was examined at different initial concentrations, pH, contact time, adsorbent dose and the possible interference of inorganic salts from fertilizers. Kinetic studies showed that the adsorption process was well described by the pseudo-second order model and the equilibrium modelling results fitted adequately to the Freundlich model. The maximum amount of uptake capacity achieved at pH 2.0 was 18.40 (mg·g−1) and 20.40 (mg·g−1), respectively, for Y. Clay and L. Clay. The evaluation of the photocatalytic potential showed that the raw clay samples do not show photocatalytic activities during the 30 min of exposure to UV light. On the other hand, their photocatalytic potential is manifested when loaded with titanium dioxide (TiO2). Clays coupled with TiO2 under UV light showed an improvement in the degradation of the crystal violet dye by 15%. The synergistic effects between the high photocatalytic activity of TiO2 and the strong adsorption capacity of clays can be one promising technique for in situ remediation of contaminated soaked rice field.

1. Introduction

Clays have recently attracted attention as promising materials for industrial applications [1]. Different properties such as high mechanical and chemical stability, availability, affordability, ion exchange capability, and environmentally friendliness makes them an ultimate choice as adsorbents or catalysis support [2]. For example, they have been widely used as support for nanoparticles of Titanium dioxide (TiO2) for water treatment due to their large reserve, wide distribution and low cost [3]. In addition, the intercalation of metal oxides in its structure, through the pillaring process, has contributed to improve their properties, resulting in higher surface areas, multi-charged sites, higher interlayer spaces and higher thermal stability [2]. On the other hand, clay is a porous material and there are minerals and ions between its layers (composed of SiO4 and AlO6), facilitating ions exchange [4].
Generally, in rice fields, several chemicals compound are used, mainly pesticides, fertilizers and dyes, which are also associated in their formulation. A major part of these compounds is drained into rivers and lakes by rainwater causing a serious environmental problem [5]. Stormwater can also lead to contamination of the water table, and the effect on the quality of drinking water has not been demonstrated. Dyes in general are used in the fertilizer manufacturing process. For example, Crystal violet, a synthetic cationic dye, applied in agroindustry is a strong carcinogen and also causes genetic mutation [2,3]. Among its many applications, Crystal violet, is used to color various products such as antifreeze, detergents or in the Gram method for the classification of bacteria and fertilizers. Its concentration in agricultural effluents generally does not exceed tens of ppm.
It was shown that clay minerals and their derived nanocomposites based on adsorption process have been long used as a class of effective and economically feasible material for removal of toxic metals and organic pollutants from wastewater [6]. Logically, given its properties, the natural clay of the soaked areas could be a self-purifier of the pollution of the receiving environments.
However, conventional adsorption methods have suffered from limitations, including incomplete precipitation and sludge generation, with further desorption treatment often required. Due to its extremely slow biodegradation and toxic nature, Crystal violet organic dye needs advanced treatment methods. In the regard, photocatalysis based advanced technique seems to be efficient [7]. It degrades the organic pollutants non-selectively and converts the toxic pollutants into end-products (harmless) such as CO2 and H2O along with inorganic ions [8]. Heterogeneous photocatalysis is becoming more interesting in recent years for several research areas, especially for environmental applications [9,10]. In the literature, most of the works reviewed mention either modified clays, or functionalized clays, or the association of clays with other composites such as activated carbon/clay composites, clay-biochar composites and hybrid silicate-clay composites [8]. There are few studies treating natural clay for water remediation [9]. One of the most promising alternatives for the removal of various dyes from wastewater is to combine the excellent adsorptive advantages of clays with improved photocatalytic reactivity [8,9,10].
In the present work, natural clays of Cameroonian irrigated rice field waters were used as materials for pollutants removal. To our knowledge, few works exist on the use of sustainable soils which are cost-effective and environmentally friendly for water remediation.
Firstly, their sorption potential in terms of crystal violet elimination, when its concentration in agricultural effluents does not usually exceed tens of ppm, were evaluated. The influences of key operational parameters, such as pH, sorbent dosage, contact time, and initial dye concentration have been considered. Secondly their natural photocatalytic properties were evaluated, allowing us to draw a conclusion about their self-purifying capabilities. Finally, the influence of the agricultural matrix, in particular the mineral components of fertilizers on the adsorption of dye, were followed. For this, different inorganic salts such as (NH4)3PO4, KCl and NaNO3 containing fertilizing elements were used. Furthermore, the kinetic and isotherm models were determined, and an adsorption mechanism of dye on the surface of clay was proposed.

2. Material and Methods

2.1. Reagents

The sample of dye in solid powder form was purchased from Sigma-Aldrich Corporation (Burlington, MA, USA). The structure and essential chemical characteristics are presented in Table 1. Stock solution of 100 mg/L of crystal violet dye was prepared by dissolving 0.05 g in 0.5 L of distilled water and the derived solutions with desired concentrations were obtained by dilution process. NaOH and HCl diluted solutions were used to adjust the pH values.

2.2. Preparation of Clays

The natural clays used in this work were obtained from two irrigated rice field waters in the Northern region of Cameroon: Yagoua’s deposit in the Mayo-Danay Sub-division, Far North Region and Lagdo’s deposit in the Benoue Sub-division, North Region. The samples taken were transported to the laboratory for further pre-treatment and treatment, up to pure clays with particles sized less than 2 µm. Briefly, after collecting the raw clays lumps, stones and other heavy particles were removed from the samples mechanically. A mass of 200 g of each sample was dispersed in 10 L of distilled water for one week. The suspension was then used to obtain particles sized less than 2 µm using a sedimentation operations process [11] following stokes law [12]. The chemical treatment was performed using chloric acid by introducing 50 g of each samples into a beaker containing 1 L of distilled water under stirring for about 30 min.

2.3. Characterization

The possible functional groups on the surface of the materials was analyzed by Fourier transform infrared spectrophotometry (FTIR) using an attenuated total reflectance (ATR) iS50 apparatus equipped with a diamond crystal at the range of wavenumber between 4000 and 500 cm−1, while the crystallinity was examined by X-ray Diffraction using a D2 phaser diffractometer (AXS, Bruker) with Kα radiation of Cu (k = 1.5418 A°) and a current/voltage of 10 mA/30 kV. The diffraction patterns were recorded from 10 to 70 (2 theta values) at a rate of 1.2 min−1. The former oxides were identified by comparison with the pattern of the international center of diffraction data (joint committee of powder diffraction Standard, JCPDS). X-ray Fluorescence (XRF, S8 TIGER, Bruker, Billerica, MA, USA) was used to identify the major minerals and chemical compound present in the clays.

2.4. Batch Adsorption Experiments

Adsorption experiments were conducted in batch mode using 200 mL conical flasks containing a total volume 20 mL of crystal violet dye. Reaction mixture (adsorbent + dye solution) was agitated at constant speed of 700 rpm using a magnetic stirrer (SH-2 Model) for the required time. The effect of some key operational parameters such as contact time (1–60 min), adsorbent dose (0.01–0.07 g), initial pH (2–12) and dye concentration (1–12 ppm) on the crystal violet dye adsorption were studied. After each experiment, the solid phase was separated from the liquid phase by filtration using a micropore filter (0.45 µm). The initial and residual dye concentration were measured using a UV/Vis spectrophotometer (PRIM-Light&Advanced spectrophotometer Mode, Champigny sur Marne, France) at maximal wavelength value of 590 nm. The amount of crystal violet adsorbed per gram of adsorbent, qe (mg/g), was calculated using Equation (1):
q e / t = ( C o C e / t ) V m
where Co and Ce/t are initial and equilibrium concentrations or at specific time t of Crystal violet dye solution (mg/L), respectively, V is the total volume of Crystal violet dye solution (L), and m stands for the mass of adsorbent (g).

2.5. Photocatalytic Experiments

The photocatalytic potentials of Yagoua and Lagdo clays from rice field water were observed in the degradation of crystal violet dye under irradiation of mercury with a low vapor pressure lamp (365 nm); the suspension was stirred in the dark for 1 h. Then 2 mL of the suspension was taken out at intervals of time (1–60 min) and the solid was separated from the solution by filtration using a micropore filter (0.45 µm). The remaining clear liquid was used for absorbance measurements at the wavelength of 590 nm on a UV/Vis spectrophotometer (SOCOMAM, PRIM-Light & Advanced spectrophotometer Model). Additionally, for the intensification part of the clay, the quantity of TiO2 added was around 0.1 g for each test

3. Results and Discussion

3.1. Physicochemical Characterization

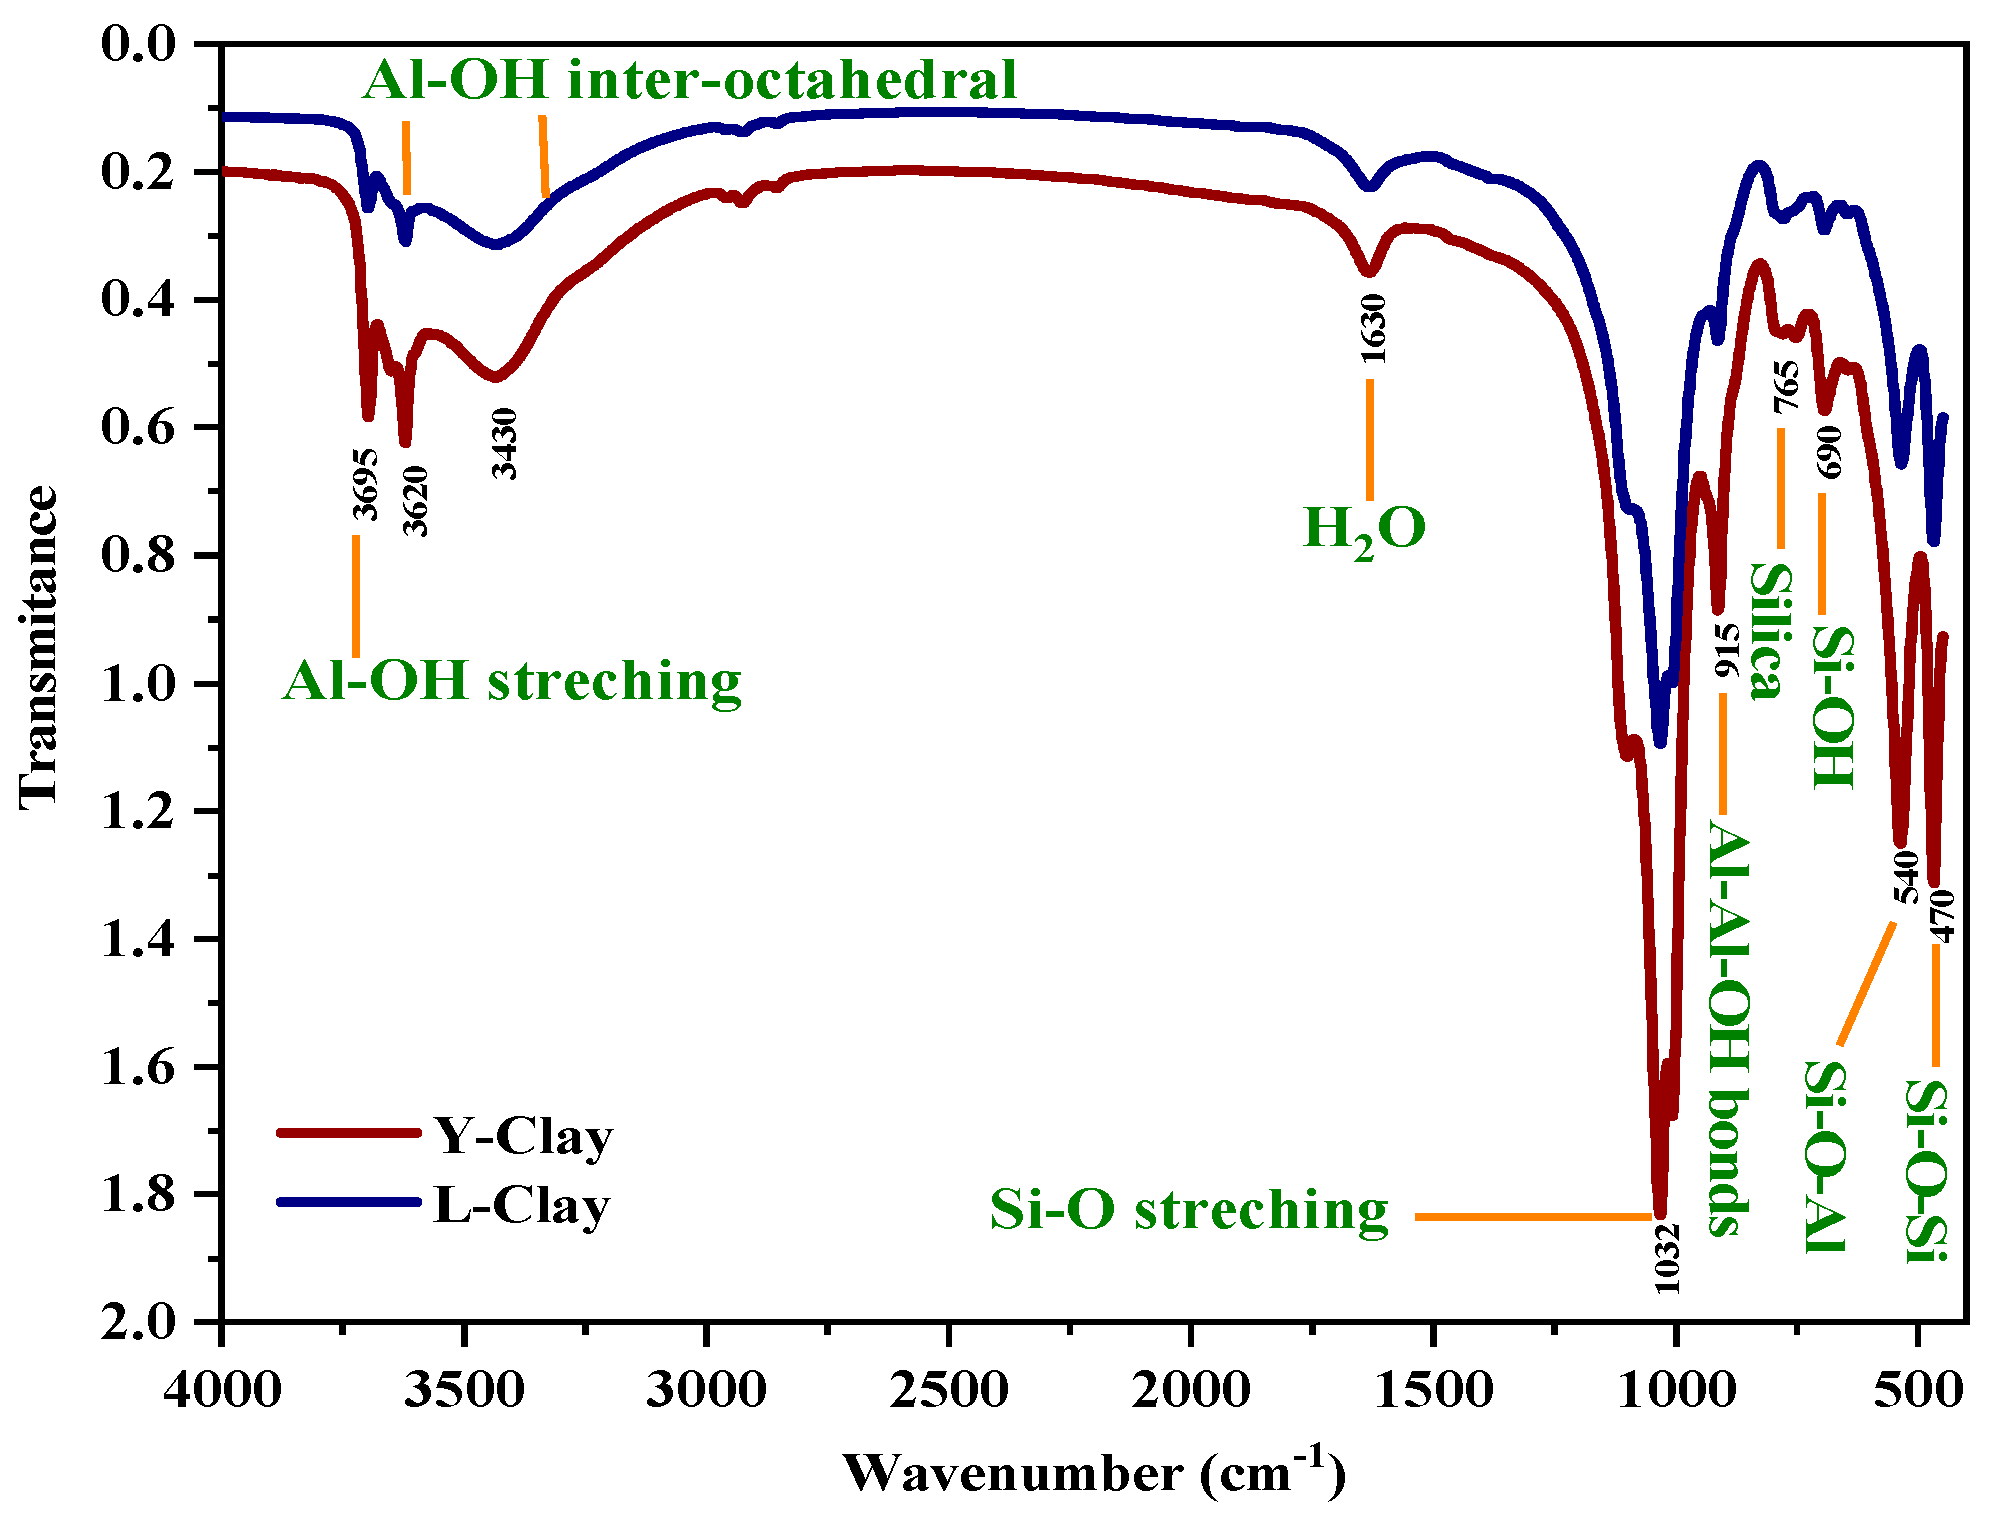
3.1.1. Fourier Transformed Infrared (FTIR) Analysis

The FTIR information provided by this analysis for the two clays is depicted in Figure 1. It was observed that the FTIR spectra of the two samples were similar. According to these analyses, the wide absorption band at 3695 cm−1 corresponds to Al-O-H stretching while the peaks at 3620 cm−1; 3430 cm−1 refers to Al-O-H inter-octahedral [13]. The peaks observed at 1630 cm−1 could suggest the possibility of water hydration in the clay sample (H-O-H stretching) [14]. In the region of low wavenumbers, there are characteristic bands of clay. 1032 cm−1 is a characteristic of layered silicate mineral and is assigned to the triply degenerate Si-O stretching ν3 (in-plane) vibration; 915 cm−1 is assigned to OH deformation mode of Al-Al-OH or Al-OH-Al; and 765 cm−1 corresponds to free silica or quartz admixtures, always present in natural clay samples [15]. Furthermore, the band observed at 540 cm−1 corresponds to ν2, the deformation mode of Al-O-Si group, and the bands at 470 cm−1 are attributed to Si-O-Si deformation. In addition, the peak observed at 690 cm−1 belongs to Si-O-H stretching vibrations [13].

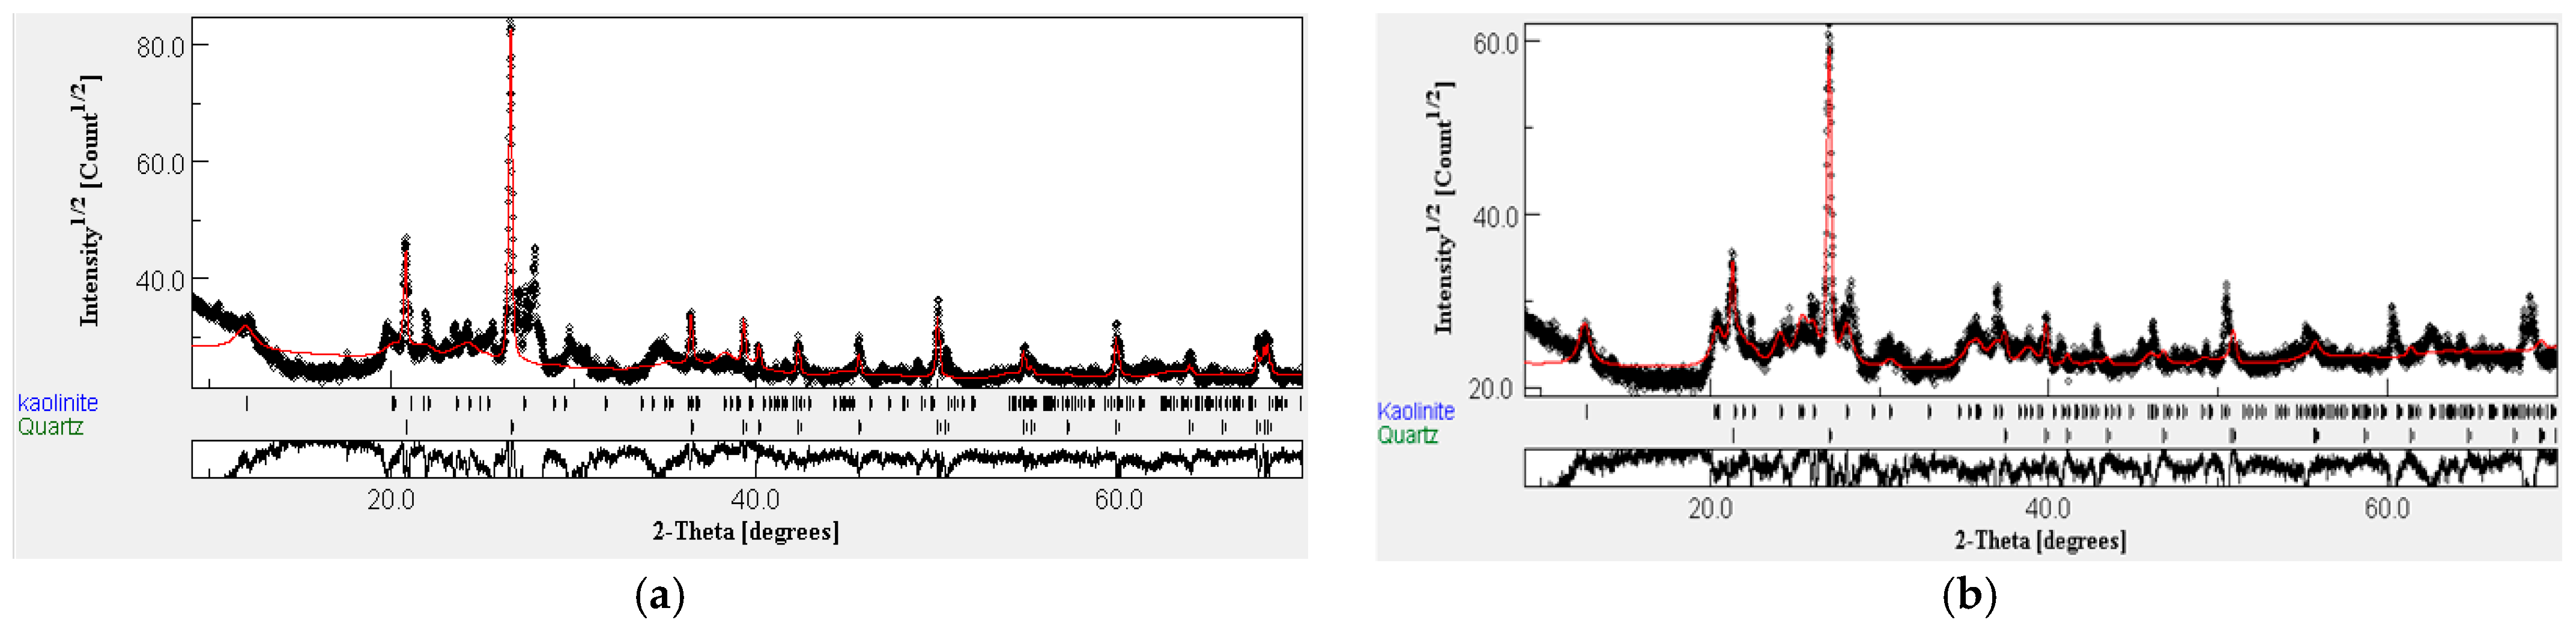
3.1.2. X-ray Diffraction (XRD) Analysis

Quantitative phase identification of the clay samples was carried out using the MAUD (Materials Analysis Using Diffraction) software (Lutteroti). As shown in Figure 2, predominantly two phases were identified in both clay samples. These correspond to the kaolinite phase with d001, d002, d003 and d004 crystallographic planes at 2θ values of 12.3°, 24.8°, 37.6° and 51.1°, respectively, and the quartz phase with d100, d10-1, d200 and d2-12 planes corresponding to 2θ values of 20.8°, 26.6°, 42.4° and 50.1°, respectively.
The composition of LAG was found to be 56.49% kaolinite and 43.51% quartz with YAG being 71.98% kaolinite and 28.02% quartz. The average crystallite sizes of the kaolinite and quartz phases in the LAG clay samples were found to be 92 Å and 1958 Å, respectively. A similar analysis of the YAG clay samples gave crystallite sizes of 247 Å and 700 Å corresponding to the kaolinite and quartz phases. These observations show that, generally, the crystallite sizes of the kaolinite phases were smaller than those of the quartz phases.

3.1.3. X-ray Fluorescence (XRF) Analysis
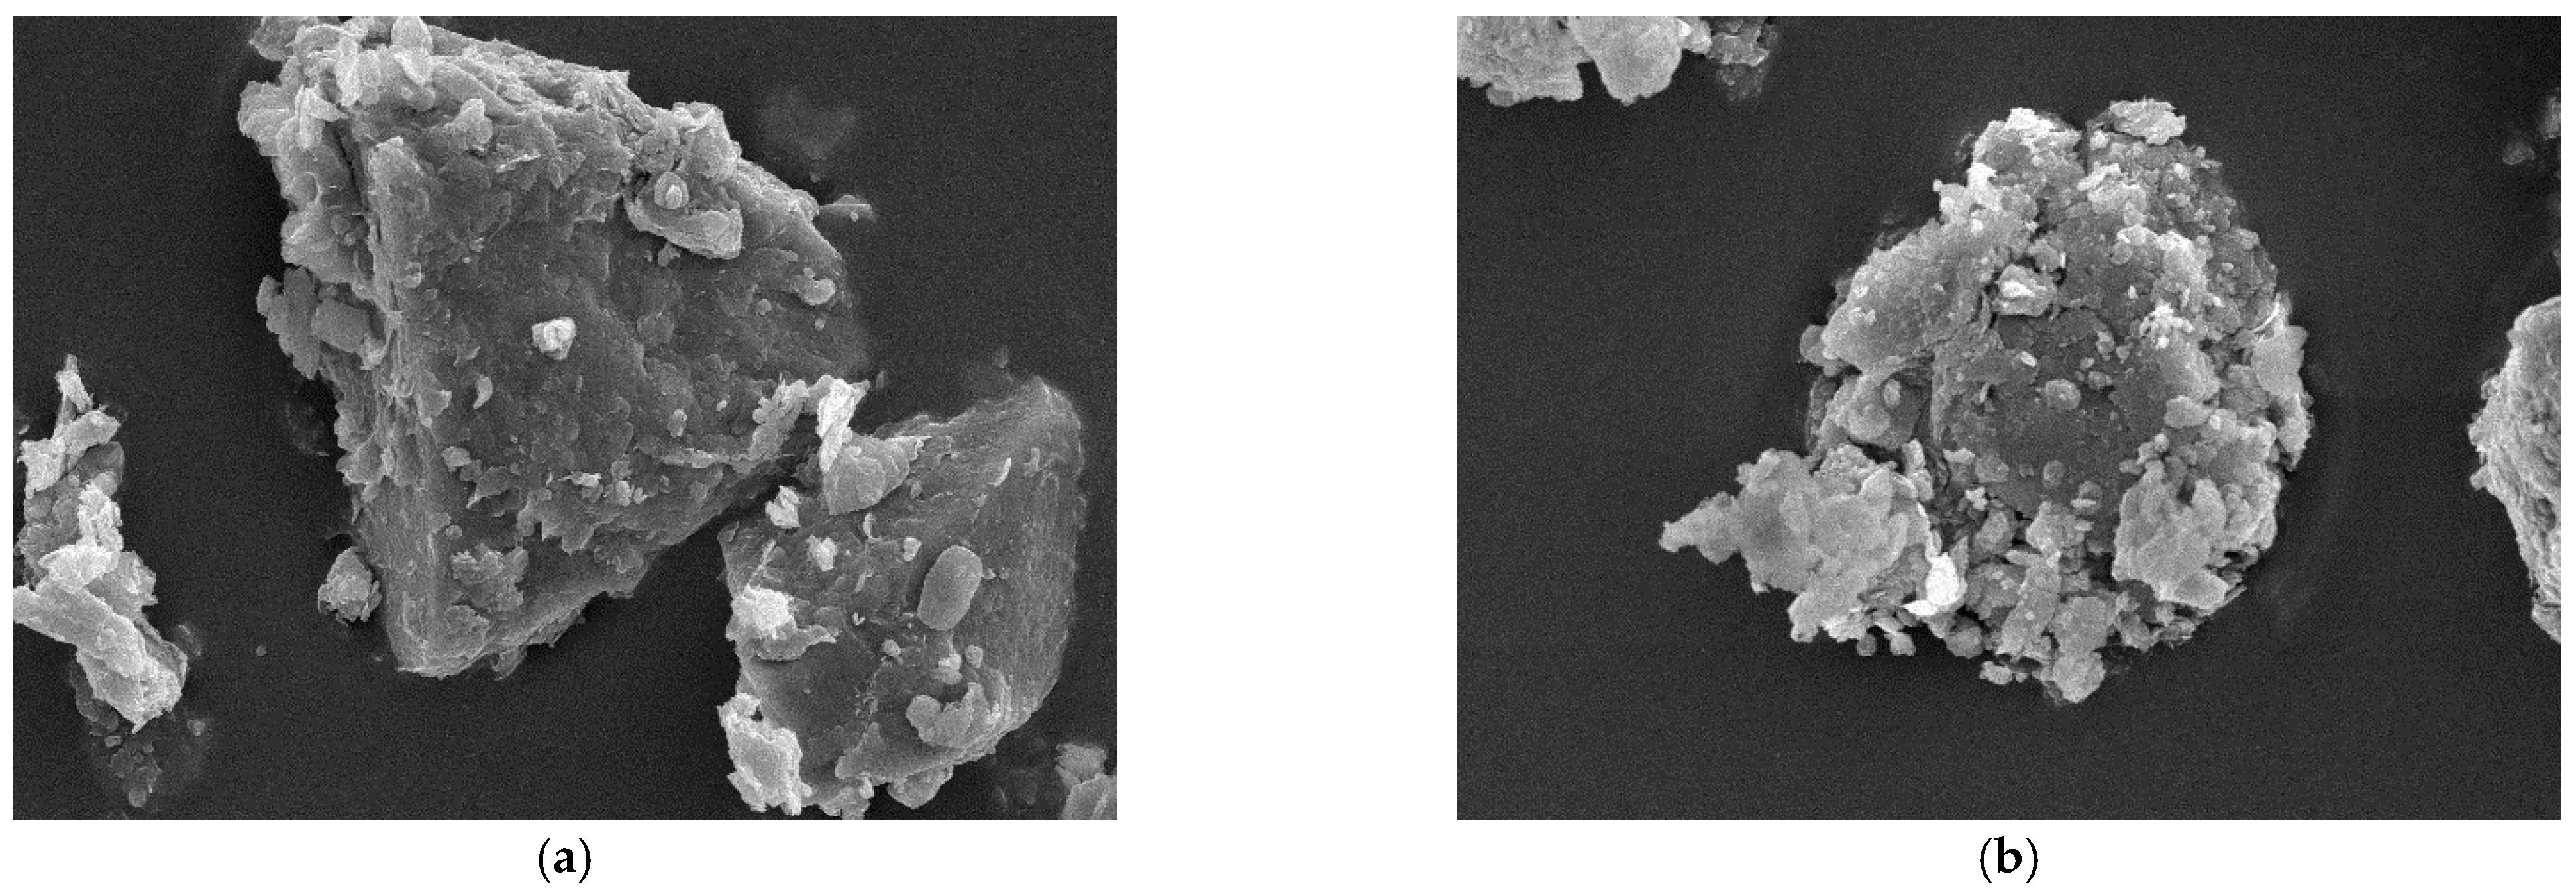
The chemical composition of the clay samples as shown in Table 2 revealed major quantities of silica, alumina and iron oxides, while other minerals are present in trace amounts. The Y. clay has the most amount of SiO2, Al2O3 and Fe2O3 in agreement with the obtained chemical composition from the identified phases using XRD and surface functional group from FTIR compared to the L. clay. Furthermore, the L. clay, on the contrary, shows significant quantities of CaO, MgO and Na2O, which can imply intercalation via cation exchange indicating monolayer modification. The Loss On Ignition (LOI) value indicates that our clay samples have lower carbonaceous matter and higher mineral matter contents.

3.1.4. SEM Analysis

Figure 3 displays the scanning electron microscope characterization of the clay samples. The images show silica, alumina and iron oxides with a diameter from 2 to 10 µm in each type of clay; the other nanoparticles are very small in size. Some oxide particles have agglomerated and are deposited on the surface as silica oxide.

3.2. Adsorption Tests

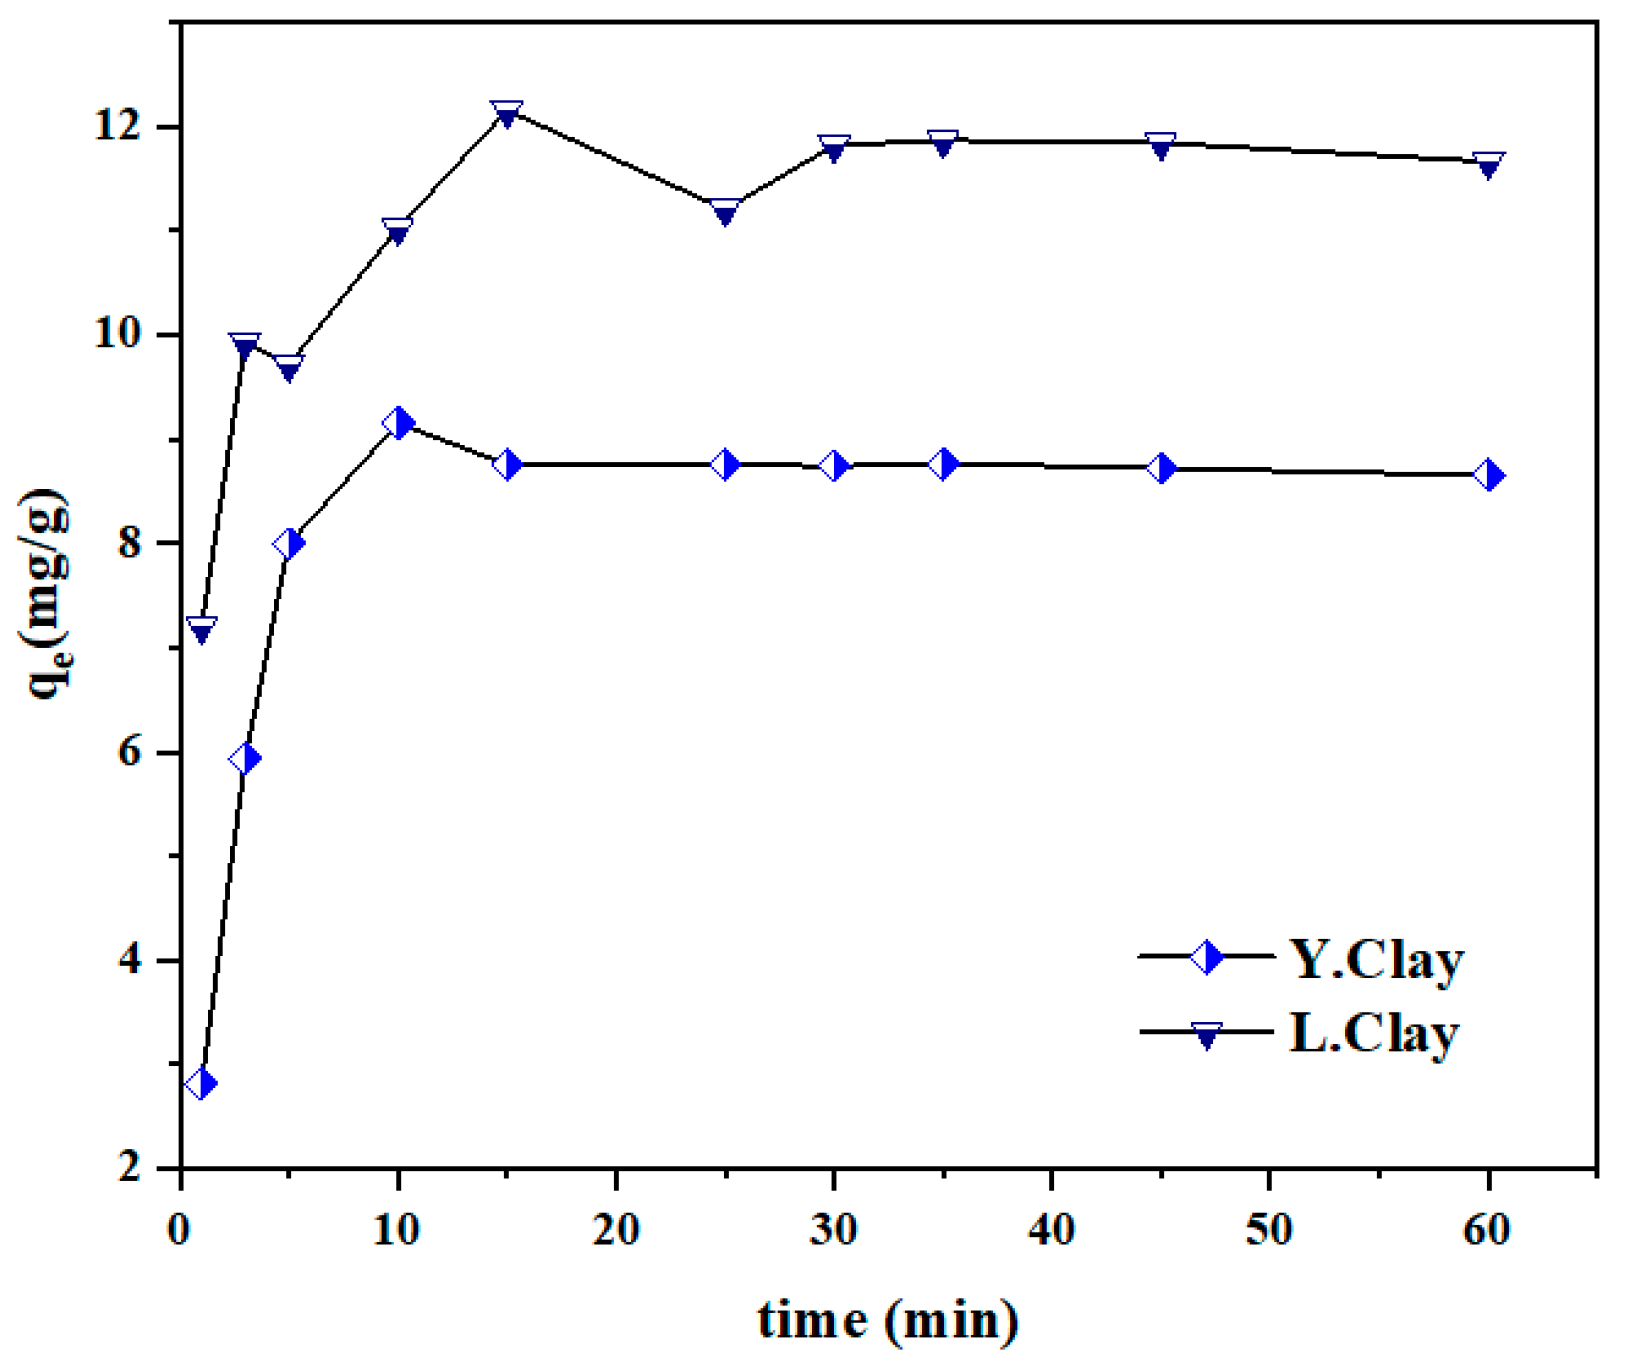
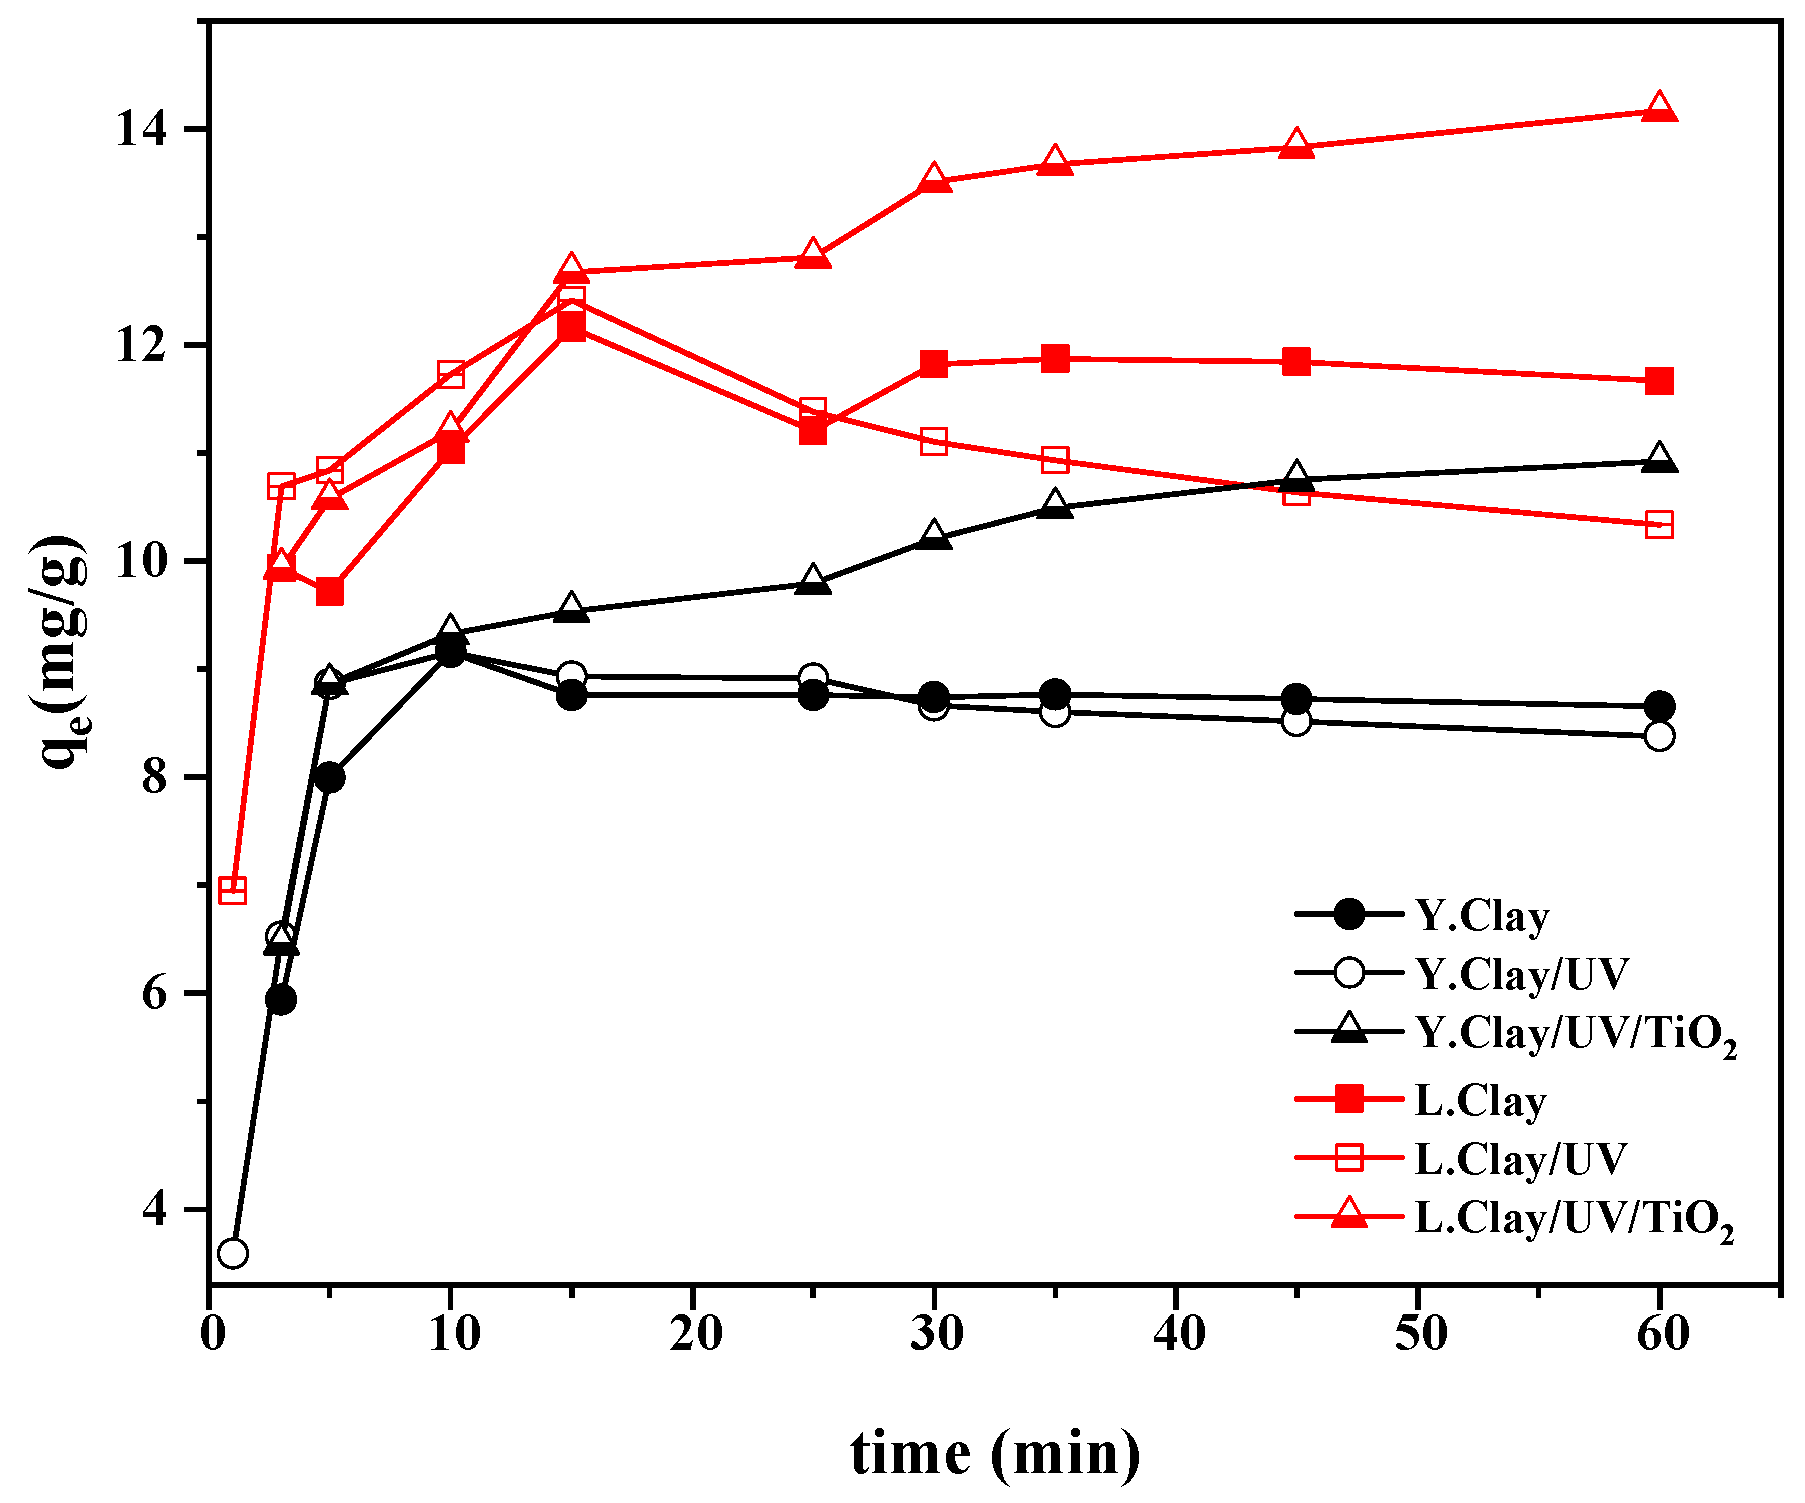
3.2.1. Effect of Contact Time

The effect of contact time on crystal violet dye adsorption (Figure 4) shows that the uptake capacity increased with the increase of time, and reached the maximum and remained constant after 30 min for the various clays. The maximum uptake capacity was 9.15 mg/g and 12.15 mg/g for the equilibrium time of 10 and 15 min, respectively, for Y. clay and L. clay. The rapid adsorption at the initial stage is attributed to the high active site and functional group as expected by the FTIR on the clay surfaces. This brought out strong electrostatic attraction between the organic xenobiotic and the surface of clay samples. The higher adsorption capacity of L. clay than Y. clay was due to the presence of carbonaceous matter as indicated by the LOI value from the XRF analysis and the intercalation of sodium which upgraded the surface area. It is noted that the carbonaceous matter could contain functional groups (active site). Some molecules of the additional layers will desorb giving rise to the equilibrium. In addition, we note some variation in concentration after establishment of adsorption equilibrium; this trend can be due to the mechanical action of agitation which contributes to the desorption of poorly bound molecules.

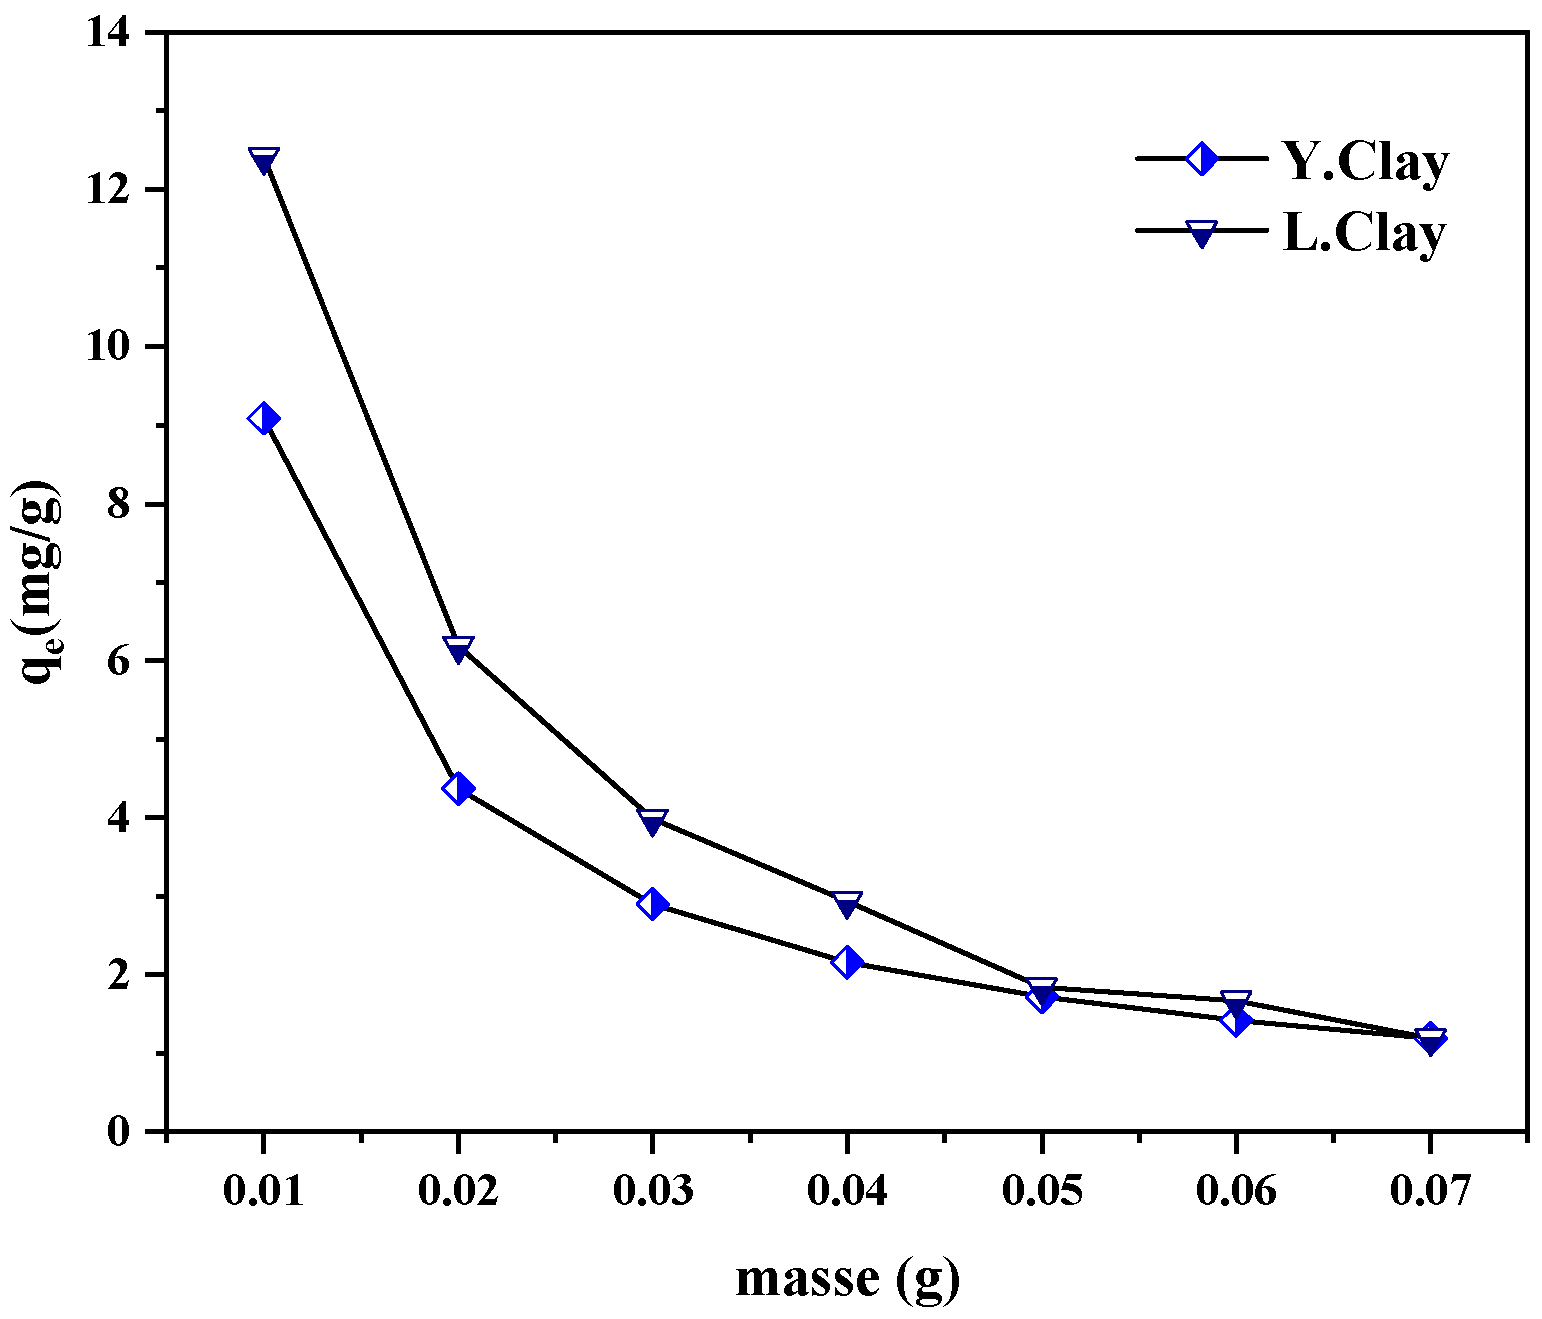
3.2.2. Effect of Adsorbent Dose
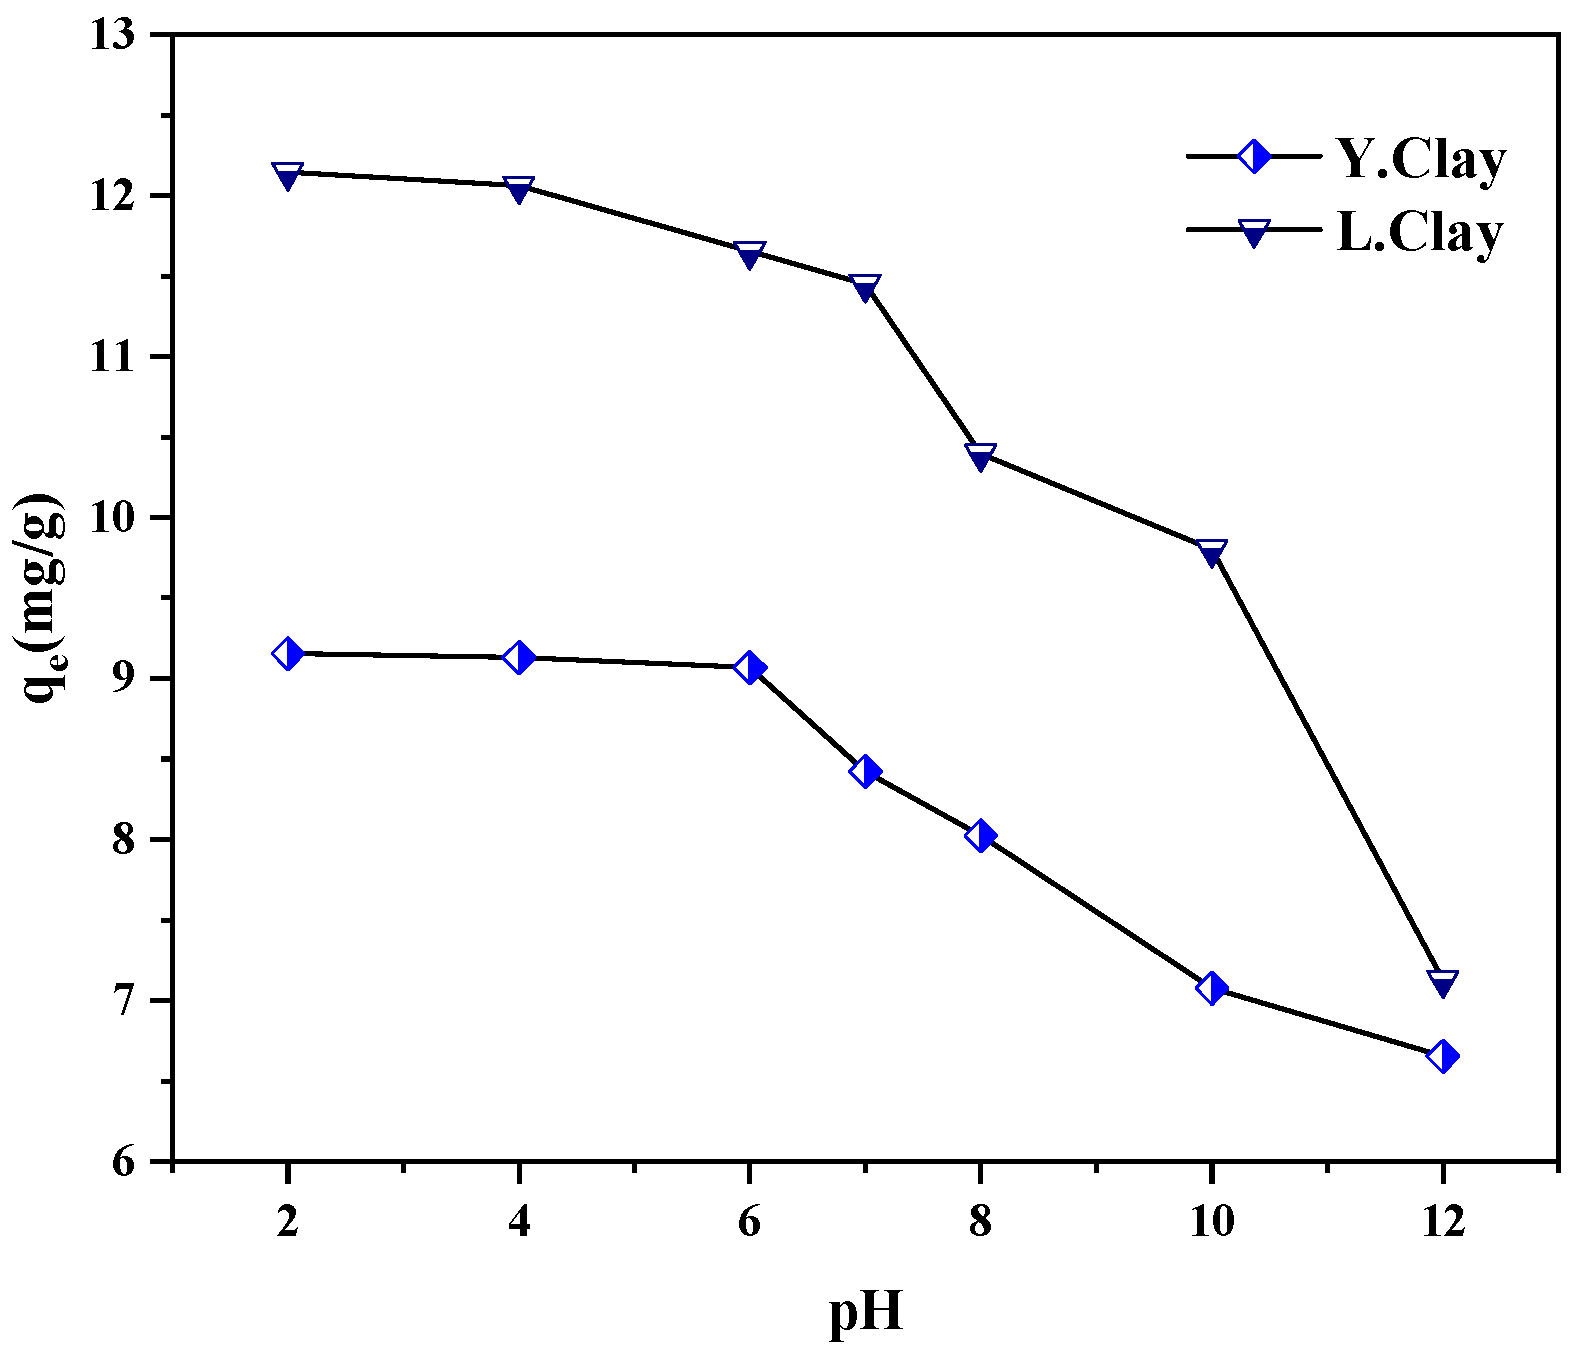
The influence of Y. clay and L. clay quantity over crystal violet adsorption is presented in Figure 5. It can be seen that the amount of adsorbent increases, and the uptake capacity decreases. In fact, when the adsorbent dose remains weak in solution, dye molecules can easily reach the active site. The decrease of the adsorption capacity at higher adsorbent dosage was due to a decrease in the number of occupied active sites per unit of mass. This might also be ascribed to a growth of electrostatic interactions between the particles of clay leading to their agglomeration (aggregates of particles clay) and to desorption of crystal violet.

3.2.3. Effect of pH

Initial pH of dye solution plays an important role in the adsorption and photocatalytic process, particularly on the uptake capacity or elimination. It was evident that crystal violet adsorption capacity decreases with increase in initial pH (Figure 6). It can also be observed that maximum uptake capacity on various adsorbents was obtained at pH 2. This observation indicated that adsorption of crystal violet dye depends on pH. Higher uptake capacity of anionic dye at acidic pH could be attributed to the number of positively active sites on the clay surface. This condition was favorable to adsorption due to electrostatic interactions. Further adsorption experiments were conducted at initial pH of 2.0.

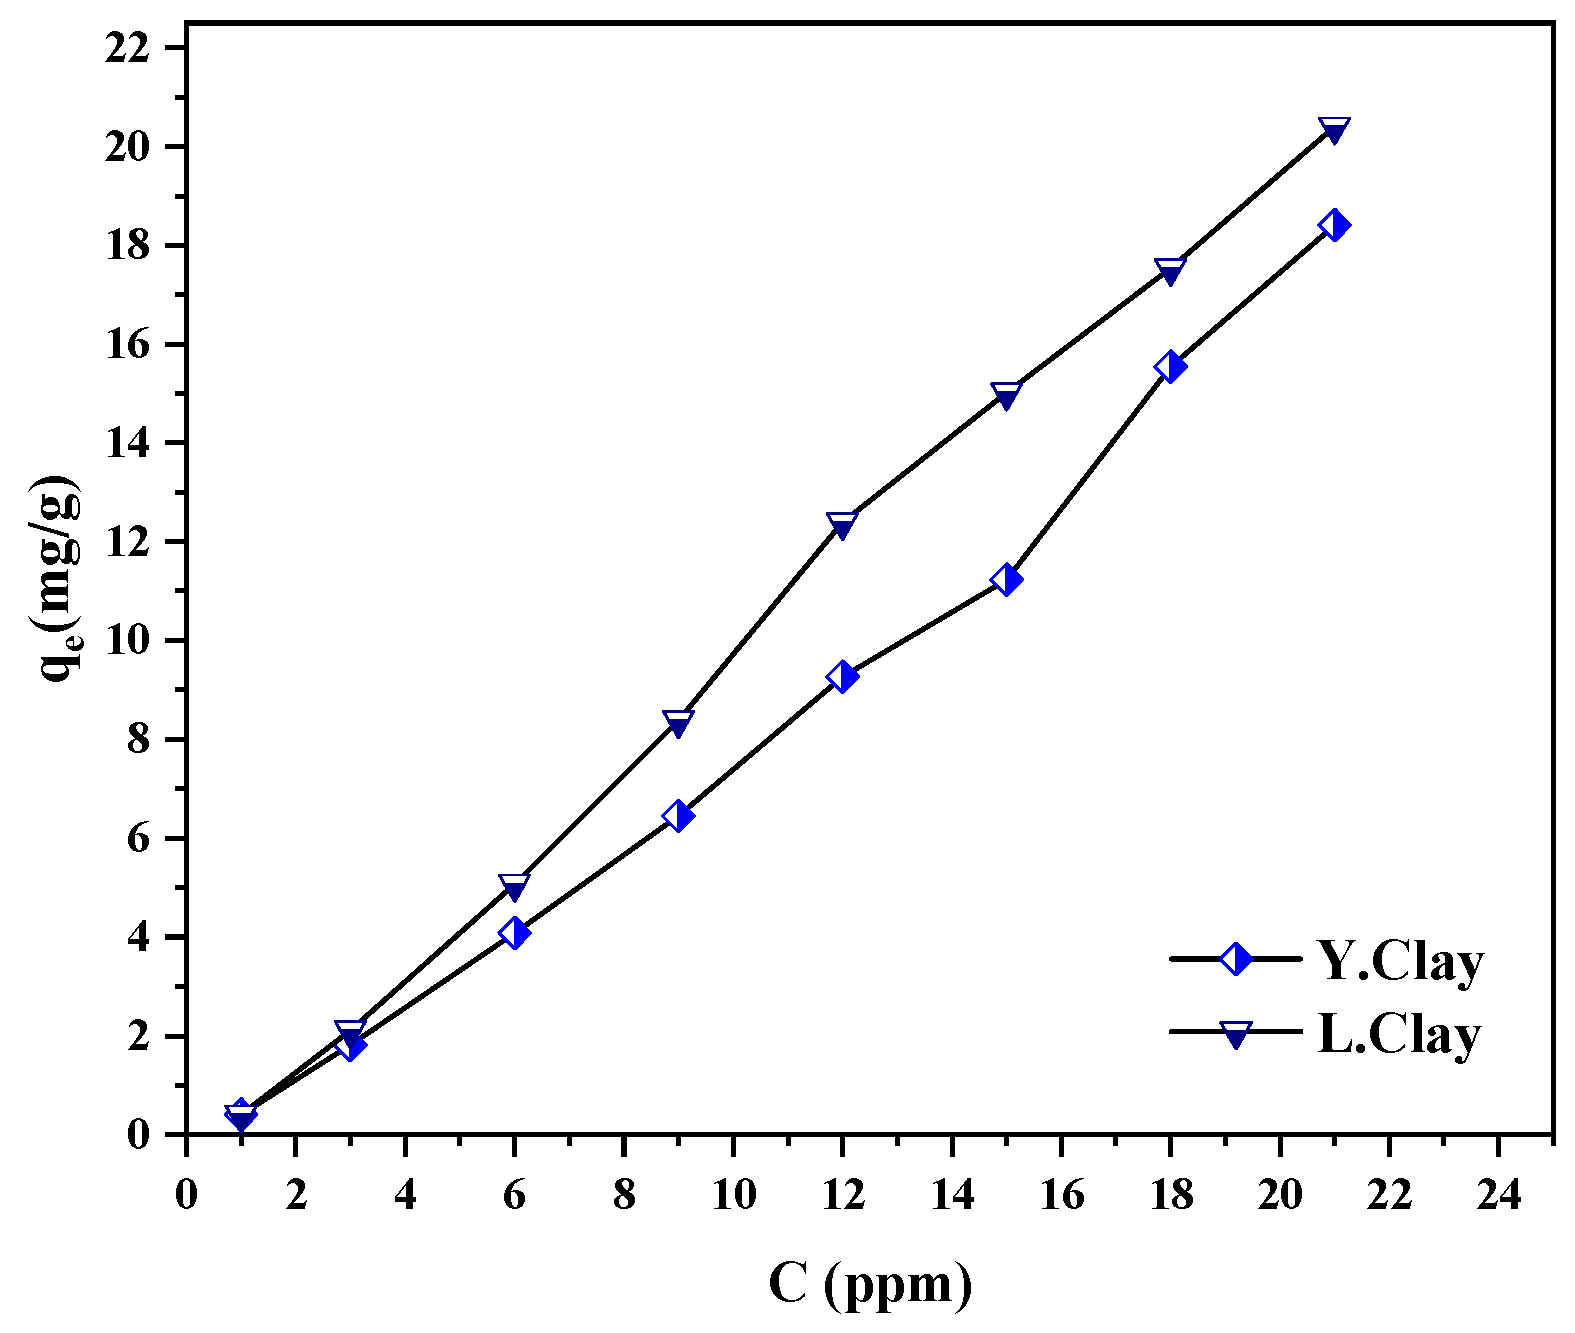
3.2.4. Effect of Initial Dye Concentration

Initial dye concentration effect over the adsorption capacity of crystal violet on the two adsorbents are shown in Figure 7. It can be observed that the uptake capacity of dye onto all adsorbents increases continuously with increase in concentrations up to 22 ppm. Crystal violet adsorption on all the clay samples did not show a high flat surface, suggesting that there was no formation of monolayer on the surface of the adsorbents. It may also mean that, for the mass of adsorbents used at selected contact time, the active sites on the surface of adsorbents are not totally occupied.

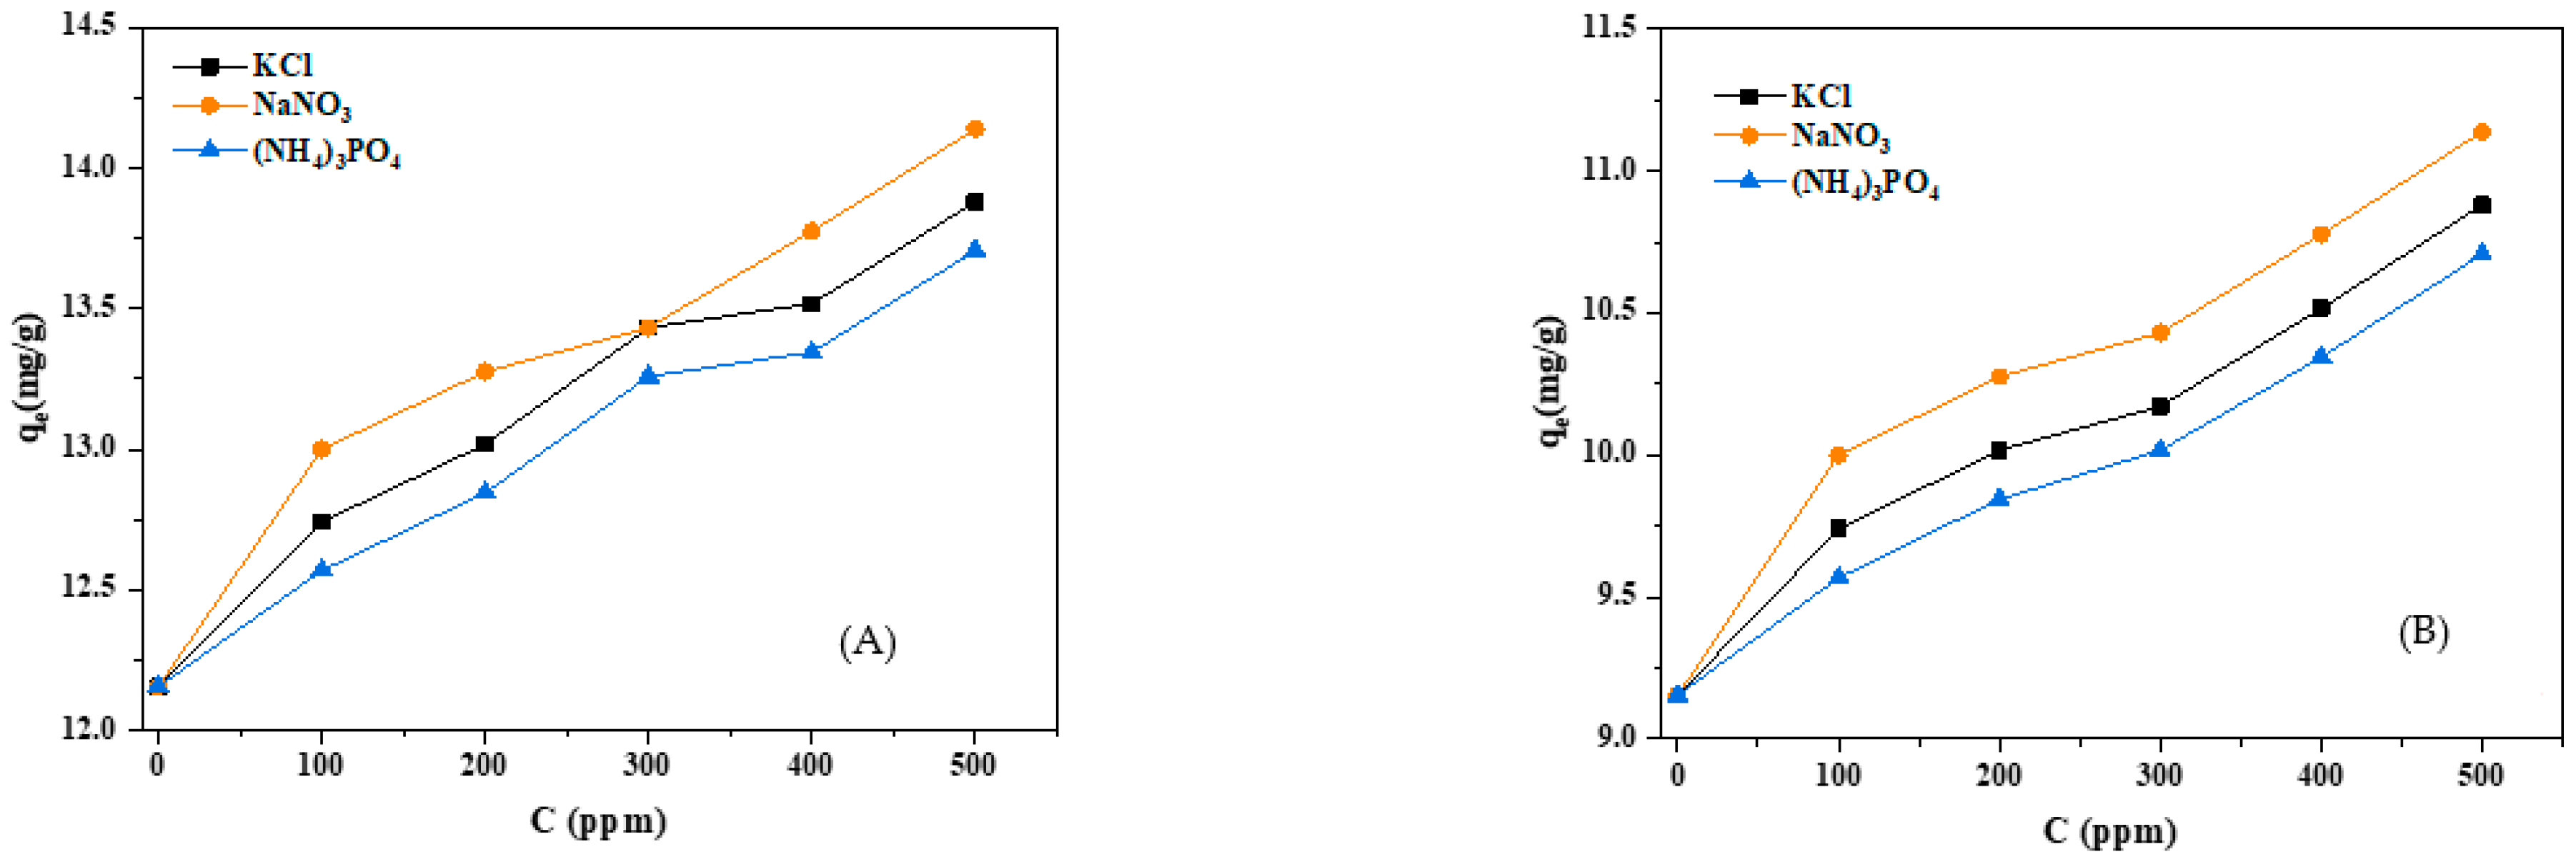
3.2.5. Potential Interference of Inorganic Salts

Interactions between molecules of adsorbate and adsorbents surface can be influenced by the presence of inorganic salts in the solution. Various inorganic salts are frequently used as fertilizers in agriculture to improve the production quality, as is the case in the rice field. In order to examine the effect of salts on crystal violet adsorption on local clays of the irrigated rice fields’ waters at Yagoua and Lagdo, salts such as KCl, NaNO3 and (NH4)3PO4 containing nutrients (NPK) were used in this study. It can be observed that the presence of salts improves the rate of adsorption process and the uptake capacity of the organic xenobiotic used (Figure 8A,B) for both clays, and the adsorption capacity is better in the case of NaNO3 salt. This can be explained by the possible intercalation of sodium in the inner active site which upgrades the surface area and facilitates the adsorption of crystal violet. In other words, local clay from the irrigated rice fields’ waters retained some fertilizing elements due to its adsorptive potential, which is a promising way to economize on fertilizer for agricultural use. Beyond that, L. clay has the best adsorption capacity because it has less value of silica and the maximum amount of Na2O, P2O5, CaO and organic matters (XRF and XRD).

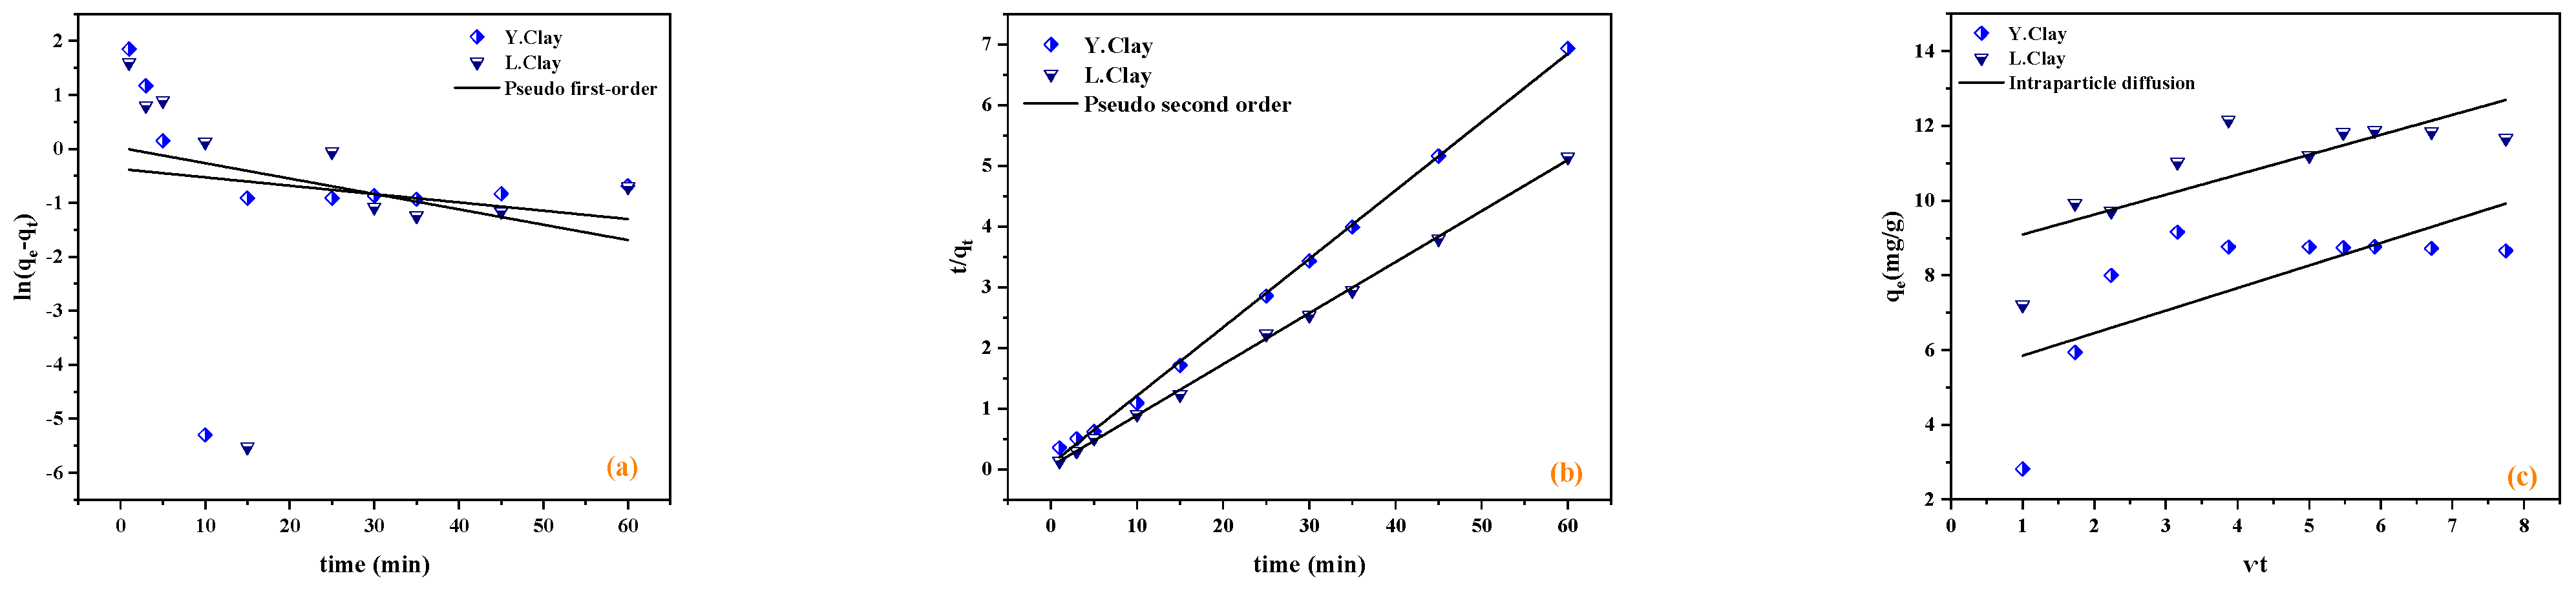
3.3. Kinetics Modelling Analysis

During the adsorption process, chemical reaction and mass transfer describe the kinetics model. Several reaction control models are available in the literature to describe and to better understand the behavior of pollutants on the adsorbents’ surface [16,17]. In this work, three kinetic models, pseudo first order, pseudo second order and intraparticle diffusion, were applied on crystal violet dye adsorption. The best fit of the experimental data was established based on the maximum number of parameters that confirm the model. The lagergren’s equation of pseudo-first order model has been widely used to illustrate the adsorption on liquid-solid systems based on the uptake capacity of the solids. The linear form of this model is expressed as:
l n   ( q e q t ) = l n q e k 1
where qt and qe (mg·g−1) are the adsorbed amount at any time t and at equilibrium respectively and k1 (min−1) is the rate constant of the adsorption process. k1 was determined from the intercept and slope of the plot ln(qeqt) versus t. The linearized form of pseudo-second-order kinetic model [18] is expressed as follows:
t q t = 1 K 2 q e 2 + t q e
where k2 (g·mg−1min−1) is the rate constant of pseudo-second order adsorption. The plot of t/qt vs. t gives a straight line with slope = 1/qe and k2 can be deduced from the intercept. To evaluate the limiting rate of the crystal violet dye adsorption on local clays of rice field waters, the possible contribution of intraparticle diffusion on crystal violet dye adsorption process was explored using the Weber-Morris model [17].
q t = k i n t t + c
where kint was calculated from the slope of the plot of qt versus √t.
The plots obtained from the experimental data for both kinetic models are illustrated in Figure 9a–c. Table 3 shows the parameters obtained for both models. As illustrated, the pseudo-second-order kinetic model exhibited higher values of correlation coefficients (R2), which revealed that the experimental data fitted well in this model. The calculated uptake capacity qe values from the pseudo-second-order model were closer to the experimental results while that of pseudo-first-order were much lower than the experimental adsorption capacity qe values. These results suggest that the adsorption process follows the pseudo-second-order model, where crystal violet dye adsorption takes place on an energetically heterogeneous surface. The rate constant k2 indicated that there is no significance difference on dye adsorption rate between the Y. Clay and L. Clay but shows that L. Clay uptake capacity per unit of time is closely higher due to the fact that the L. Clay has an important amount of Na2O and CaO (as can be seen from XRF) that plays an important role during the adsorption process. The thickness of boundary layer constant C from intraparticle diffusion revealed that the adsorption process of crystal violet is occurring at a multistage where the intraparticle diffusion is not only the rate determining stage [3]. It can be also seen from Figure 9c that the plot showed two overlapping lines over the whole-time range, which illustrated a two-stage adsorption process with decreasing rates. The first fast stage is the surface adsorption where the diffusion of the adsorbate from the solution to the surface of adsorbents takes place and it is not considered as the limiting stage rate. The second stage corresponds to the equilibrium stage where the rate of diffusion process become much lower due to the low adsorbate concentration of crystal violet dye solution. The rate constant of intraparticle diffusion kint of Y. Clay was greater than that of L. Clay; this observation is assigned to the presence of Na2O and CaO with the positively charged surface which restricts the diffusion process in the case of L. Clay.

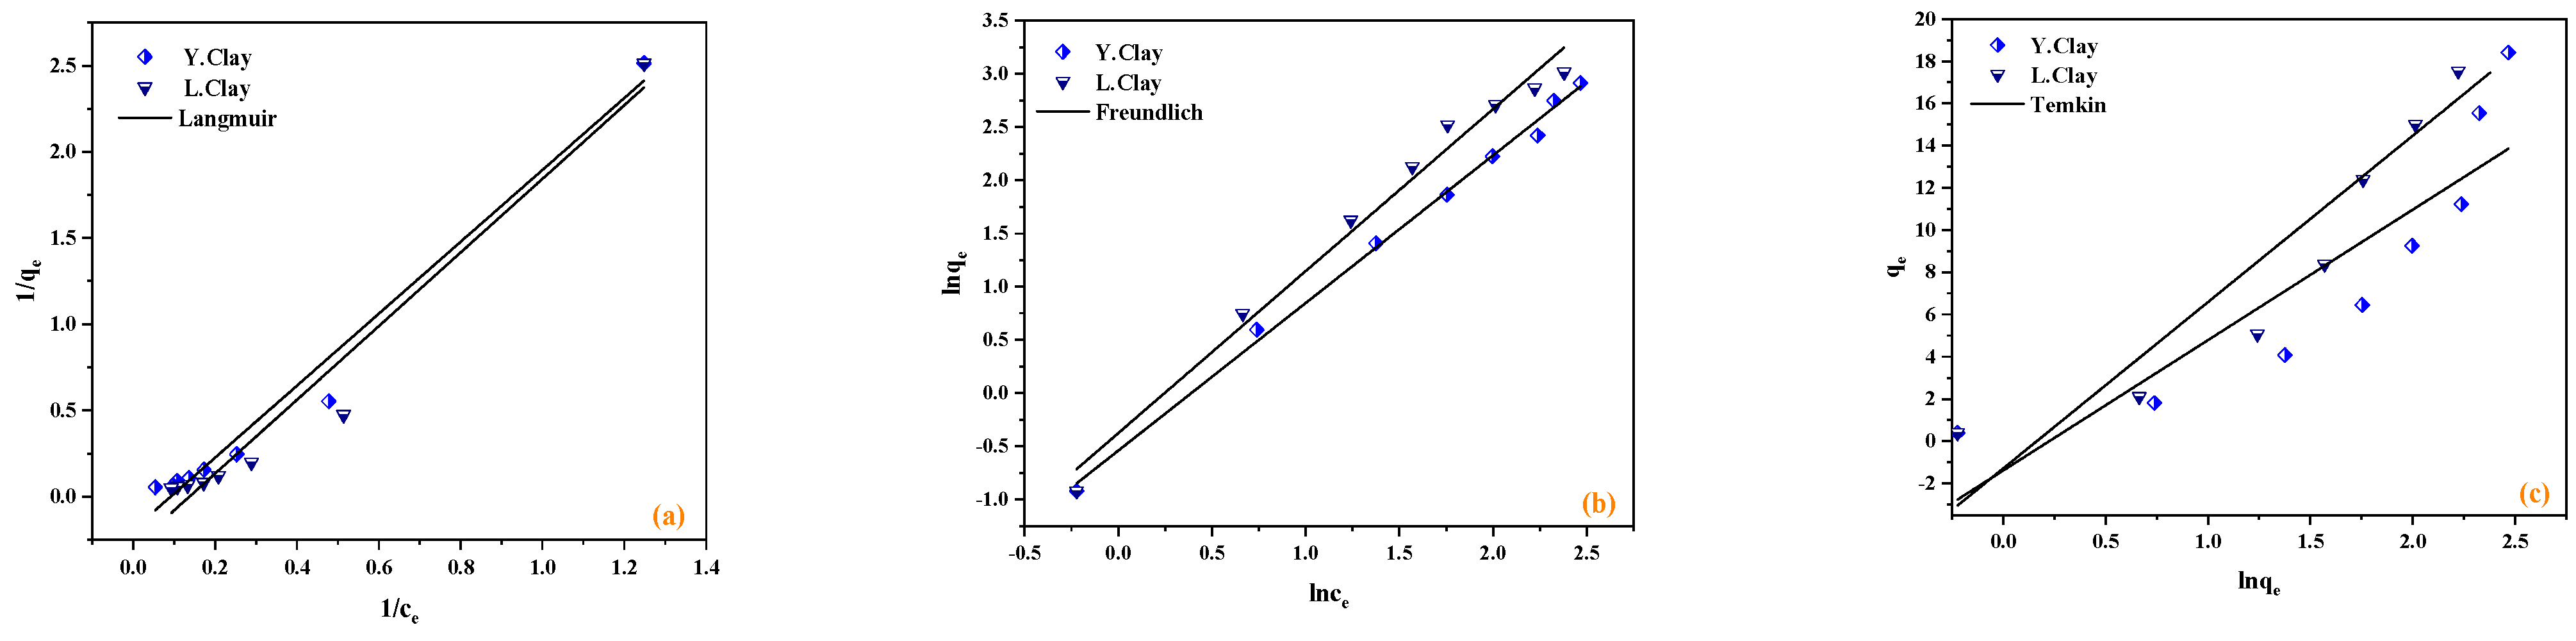
3.4. Modelling of Adsorption Isotherms

The fundamental goal of equilibrium isotherm analysis is to describe the interactions established between adsorbate and adsorbent surfaces. The adsorption results have been analyzed using three isotherm models, the Langmuir, Freundlich and Temkin, in their linear forms. Linear regression equations of the three isotherm models are brought together in Table 4.
The Langmuir model assumes a monolayer adsorption mechanism where the adsorbent has a fixed number of active sites of similar activation energy and affinity toward the adsorbate. In this model, the steric limitation between the adjacent adsorbate species was ignored [19] (Langmuir, 1918). Qmax and KL are the Langmuir constants which are related to the adsorption capacity.
The Freundlich adsorption isotherm suggests a multilayer adsorption mechanism where various sites with different adsorption energies are involved [21]. It is assumed that the heterogeneous surface of adsorbent exhibits non-uniform distribution of adsorption heat instead of exponential decrease upon the end of the adsorption process [20]. KF and n are the Freundlich constants which are related to adsorption capacity and intensity (Figure 10).
The Temkin isotherm contains a factor that explicitly considers the adsorbent–adsorbate interactions. The model assumes that the heat of adsorption of all molecules in the layer would decrease linearly rather than being logarithmic with coverage [22]. bT is the constant of adsorption energy, T is the temperature (K), and AT the binding constant at equilibrium (L·g−1).
The parameters obtained from the three models are summarized in Table 5. It was regarded that the adsorption data fitted well with the Freundlich isotherm model (R2 = 0.99), indicating the heterogeneous surface with non-uniform distribution adsorption heat and affinities. n values lie between 0 and 1 which confirmed the heterogeneous nature of the surface. The kf constant values were in the order Y. clay ˃ L. clay, which is not the same order of the adsorption capacity of the samples. According to the Temkin model, the variation of adsorption energy was positive, which means adsorption reaction is endothermic and spontaneous. RL is less than 1 indicating the possible and favorable adsorption of crystal violet on clay samples. These results indicated that the adsorption is multilayer on the heterogeneous surface of L. clay and Y. clay in a possibly spontaneous way.

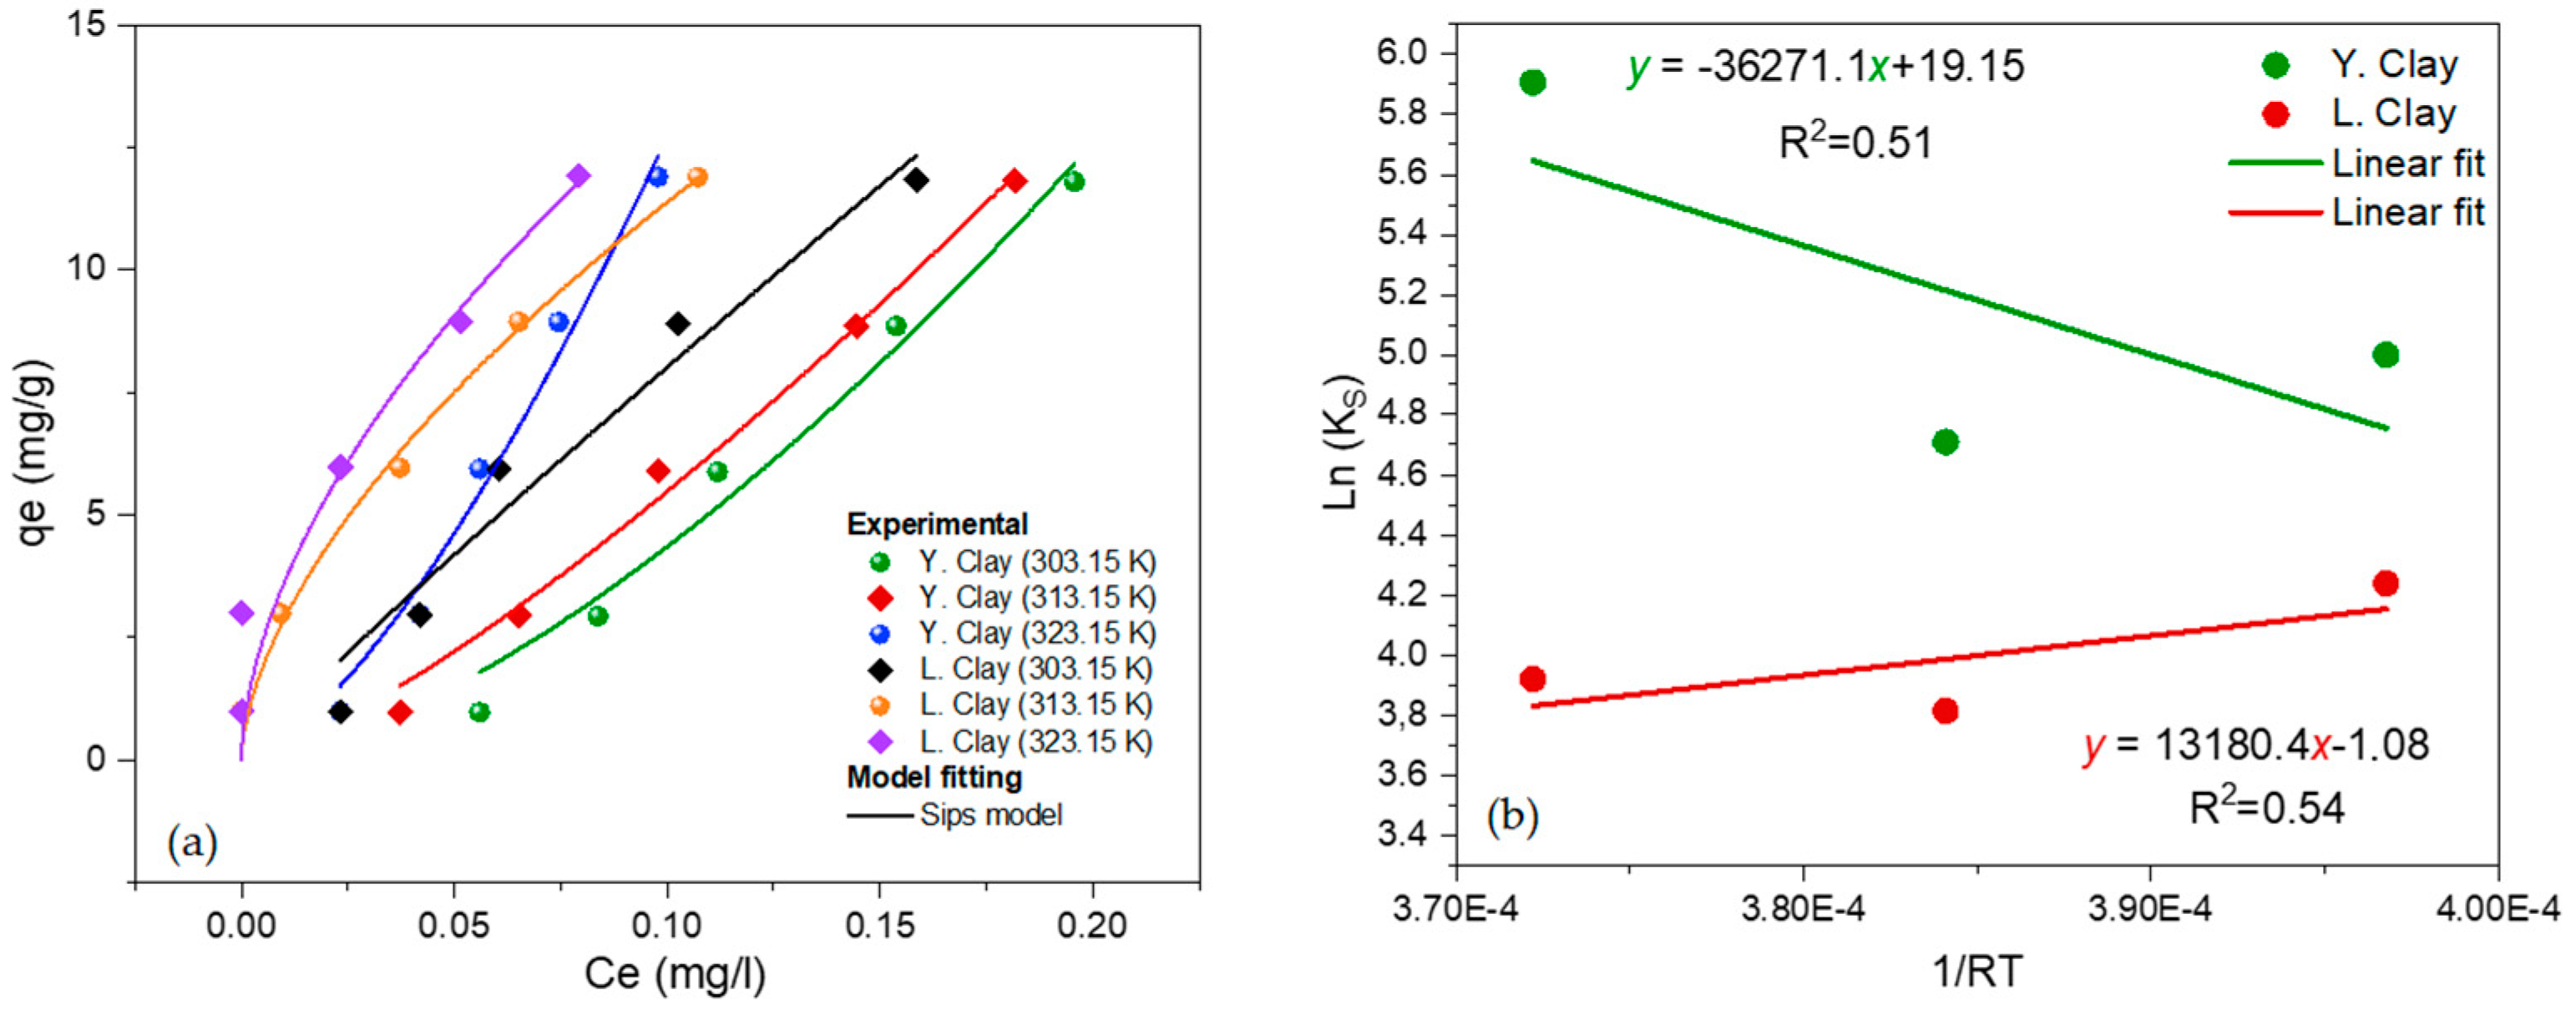
3.5. Adsorption Thermodynamics
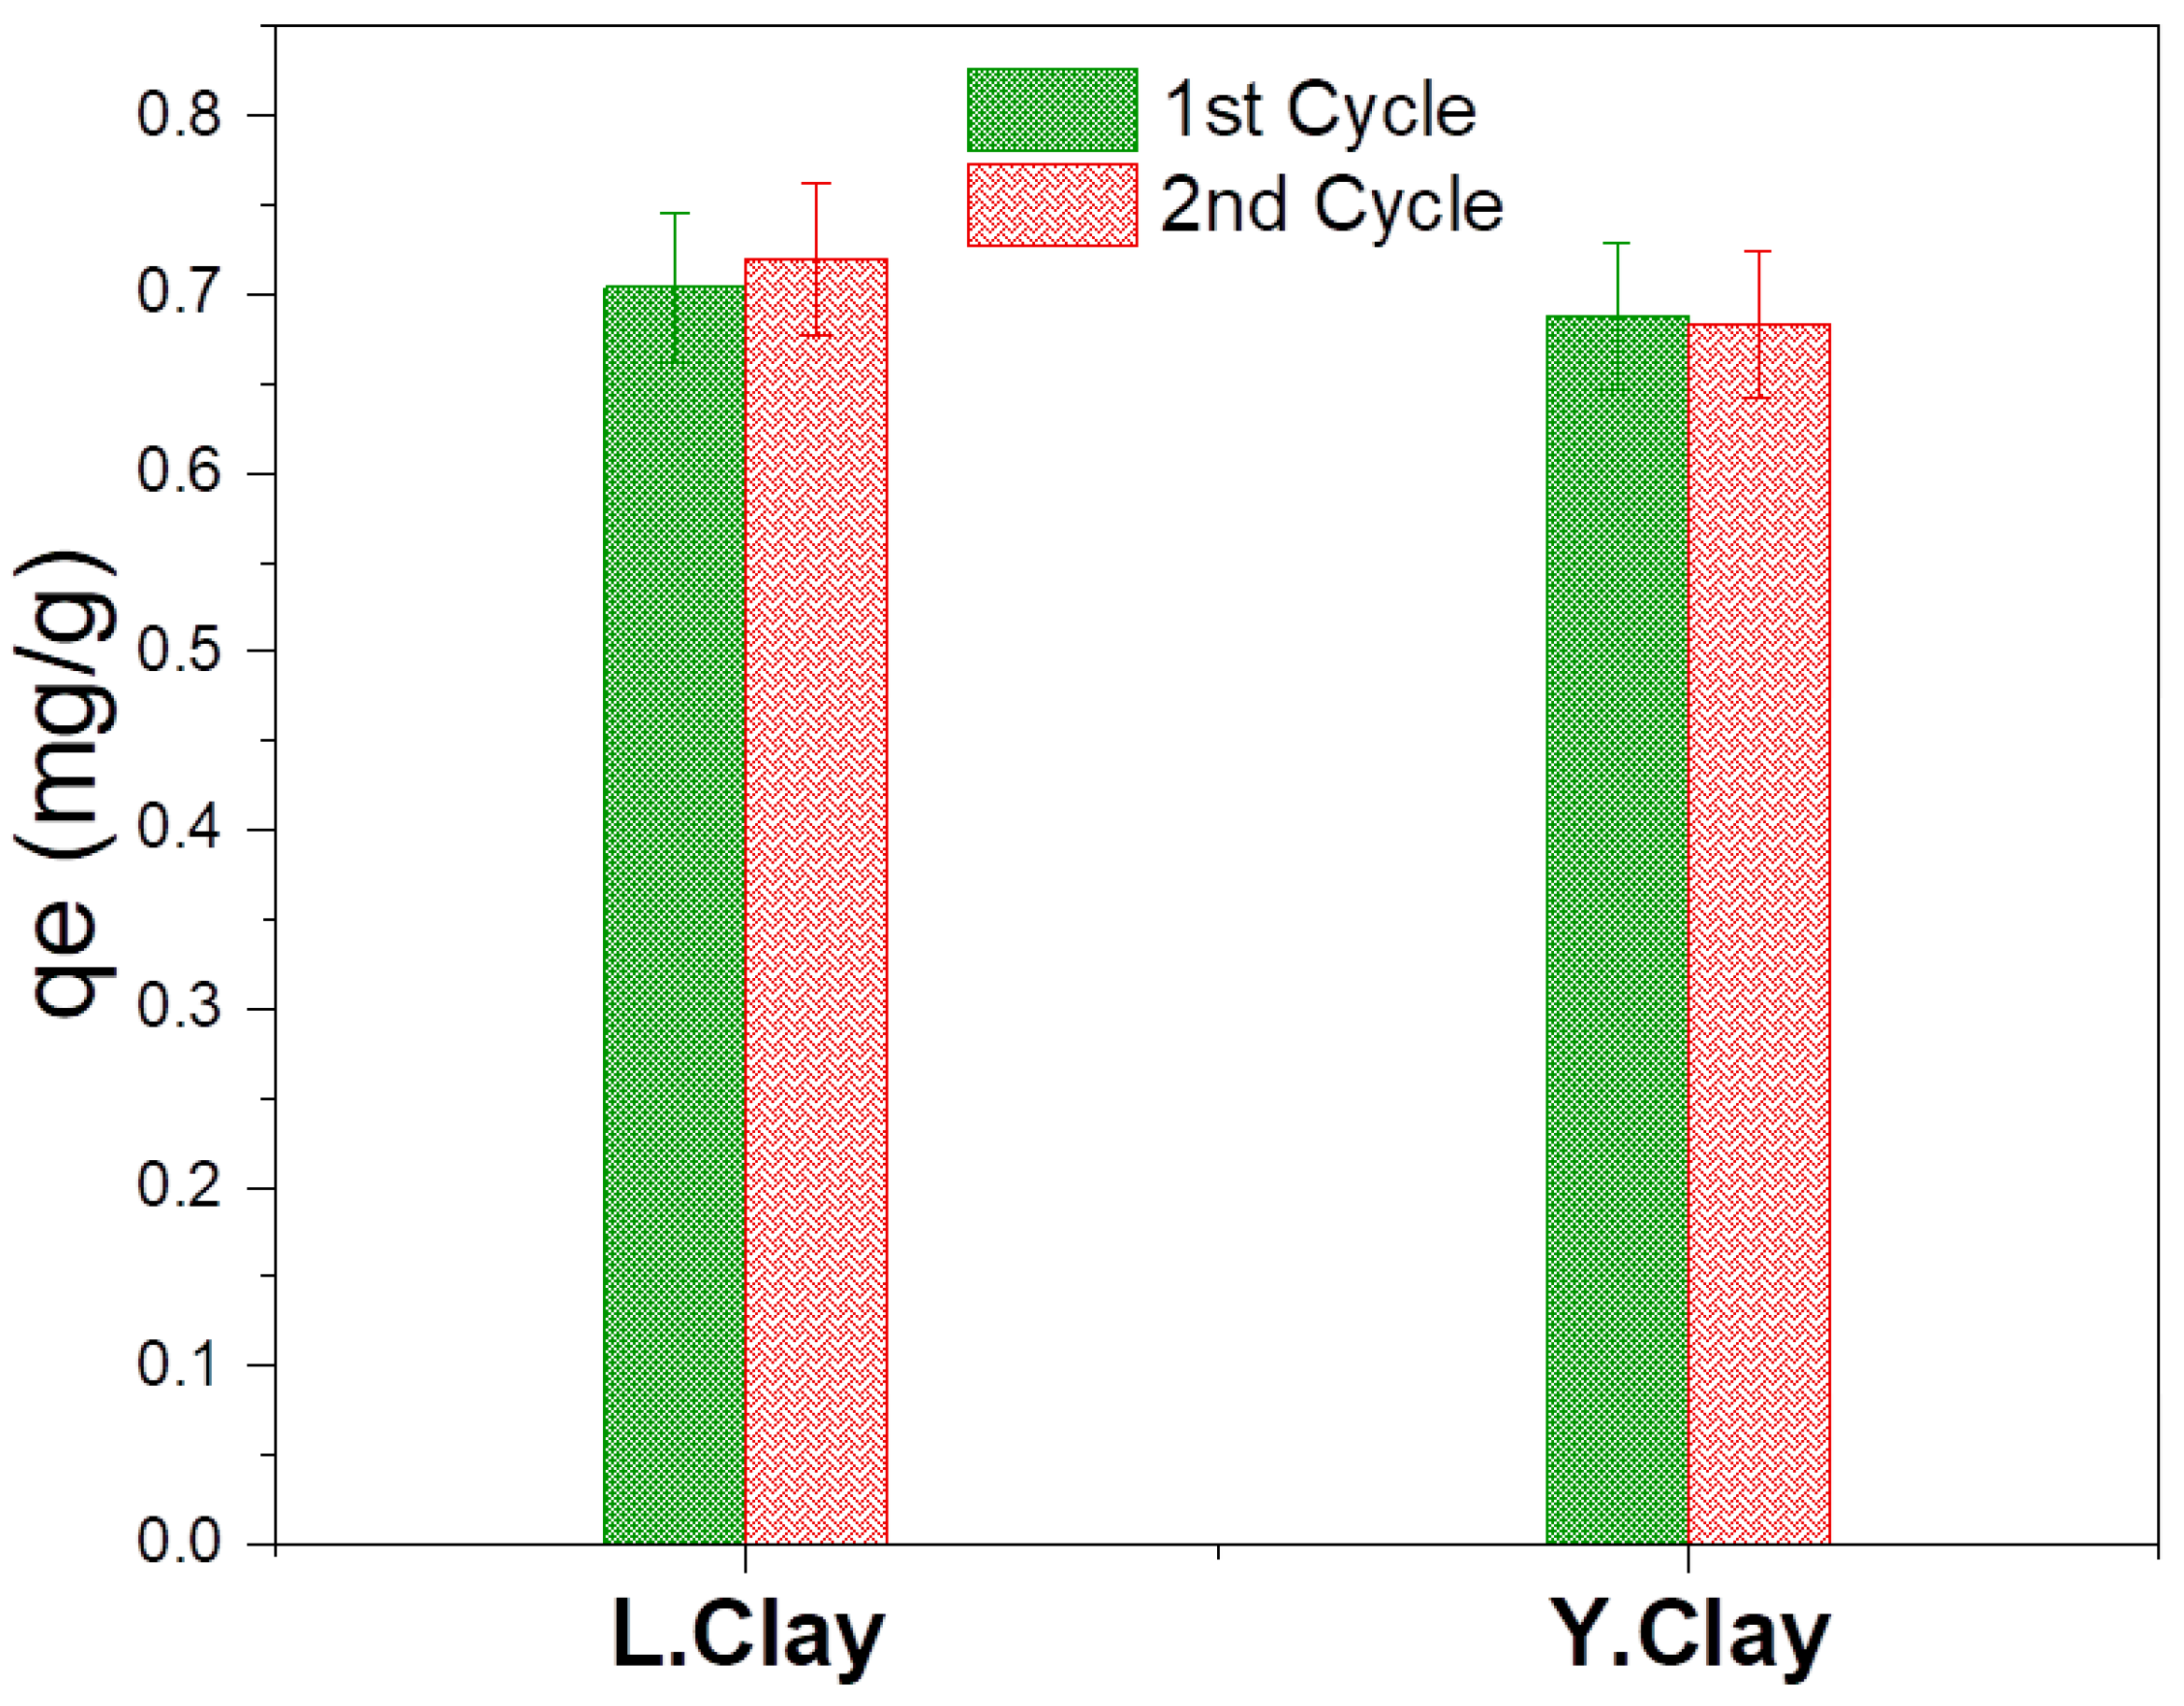
The effect of temperature and the thermodynamic study experiments of dye adsorption on clays were performed using 50 mL of crystal violet dye solution of concentration ranging from 1 to 12 mg/L with a required adsorbent dose of 50 mg for each run. The mixture was agitated in an incubator shaker (Innova® 40) at 200 rpm and different temperatures of 30°, 40°, 50 °C for 2 h.
The obtained results are presented in Figure 11a and the isotherm modeling was carried out with the help of the non-linear model according to the Equation (5):
q e = K s C e β s 1 + a s C e β s
where Ks is the Sips adsorption constant (L mg−1); βs: describes the surface heterogeneity; as: Sips constant.
The thermodynamic parameters were calculated using the following equations:
Δ G 0 = R T L n   K s
Δ G 0 = Δ H 0 T Δ S 0
L n   ( K s ) = ( Δ S 0 R ) ( Δ H 0 R T )
As shown in Table 6, an increase in temperature in the range 303.15–323.15 K leads to a decrease in ΔG0 for Y. Clay and an increase in ΔG0 for L. Clay. This can be explained by the fact that the adsorption is more favorable at higher temperatures for Y. Clay, but is less favorable for the L. Clay with increasing temperature.
According to ΔH0 Values, the dye adsorption is endothermic process for Y. Clay, but exothermic one for L. Clay. The positive value of ΔS0 indicates the increased magnitude of randomness at the solid/liquid interface [22].

3.6. Reuse Test

Studied Clays (L. Clay and Y. Clay) were used for the adsorption of 5 mg/L of crystal violet dye solution duration two hours at 10 °C with mClay/Vsolution ratio of 4 (mg/mL). After treatment the clays were separated by centrifugation (3000 rpm during 10 min) and treated with NaOH (1 M) during 1 h and then washed with ultra-pure water 6 times (60 min each) and finaly dried at 105 °C during 15 h. Obtained clays were used in the second test of adsorption under the same experimental condition as the first and results are shown in Figure 12.
The results show that there is no significant variation in the adsorption capacity for both used clays; L. Clay and Y. Clay. It is also noticed that there is a slight difference (≈0.1 mg/g) in the adsorption capacities of the studied clays even after the second adsorption cycle.

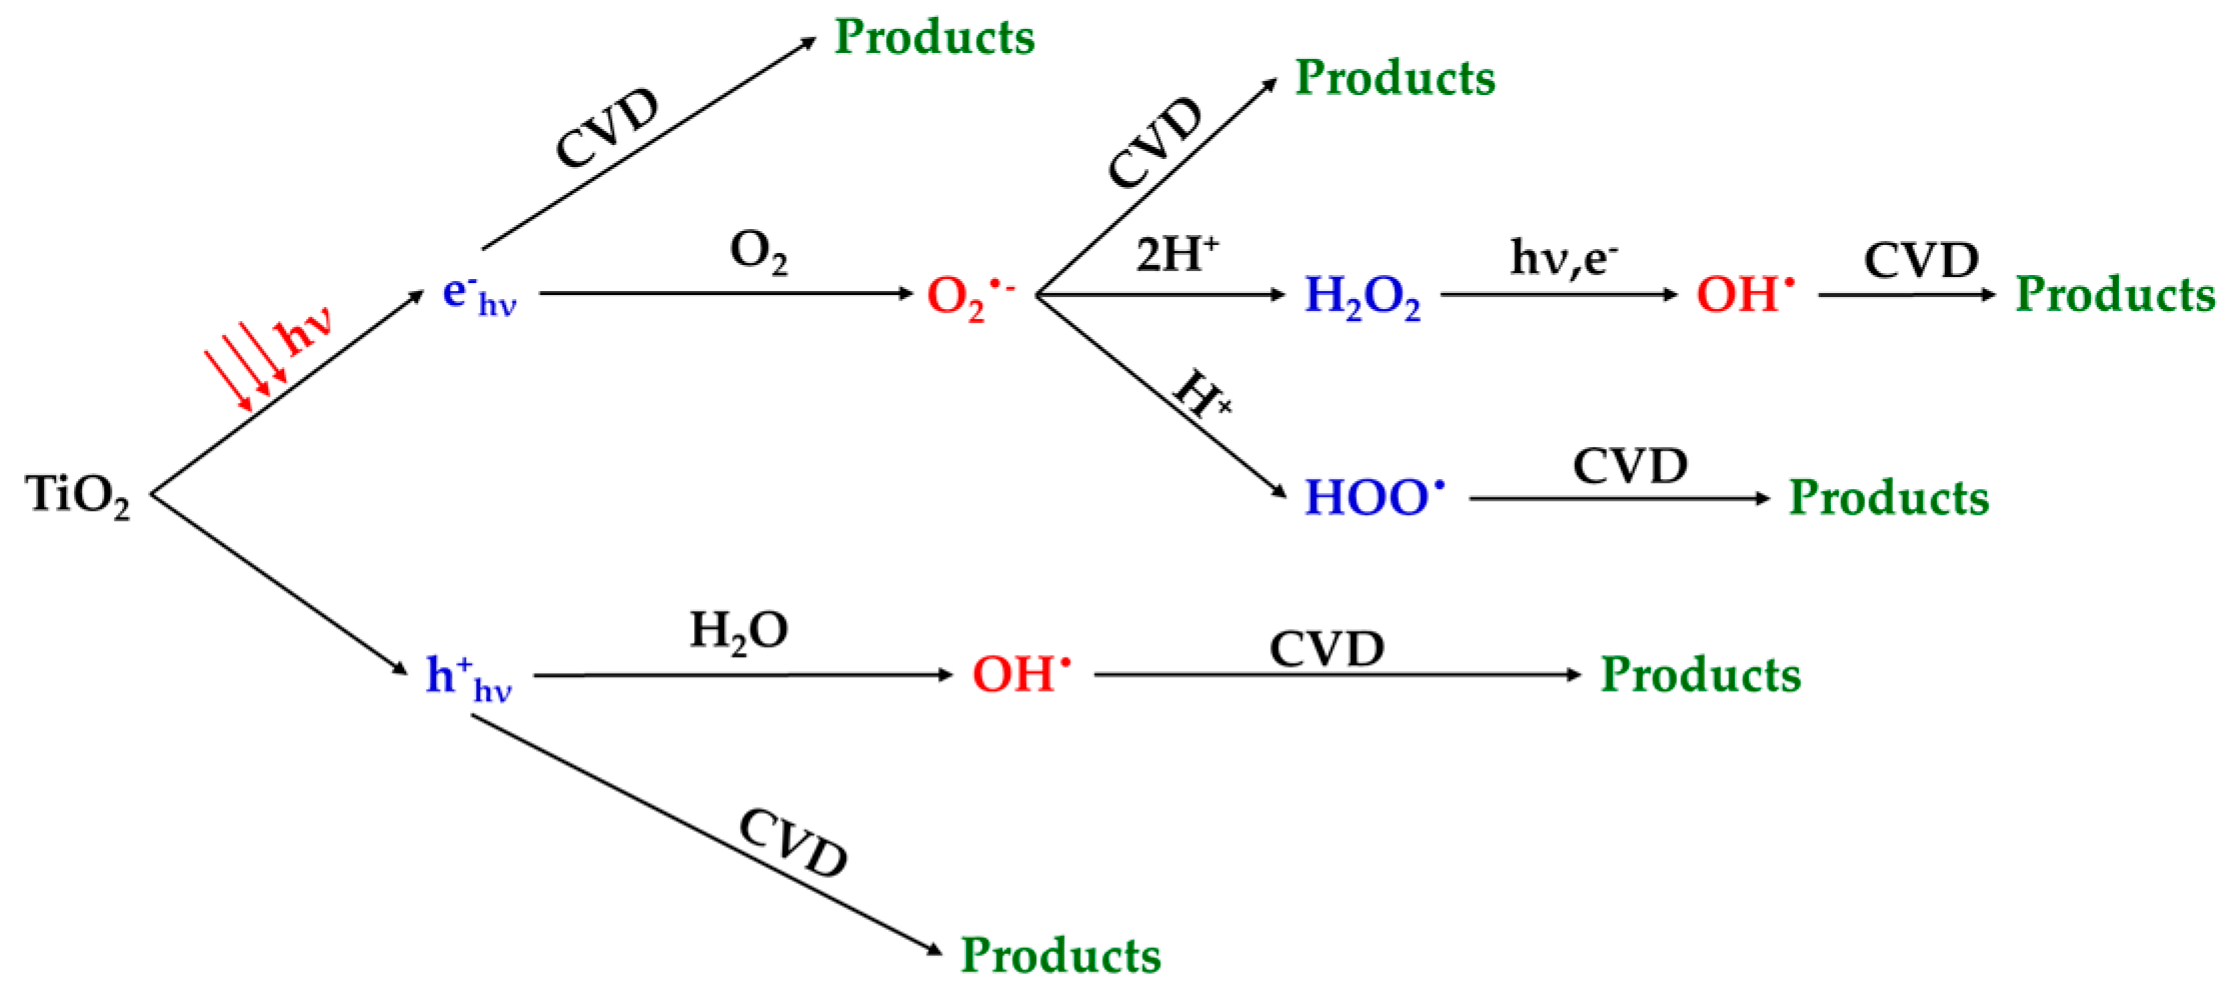
3.7. Coupled Adsorption-Photocatalytic Experiments

The investigation of photocatalytic potentials of the local clay samples on degradation of crystal violet dye under UV light is a new approach that enhances the removal efficiency as a function of reaction time. Figure 13 shows the uptake capacity of crystal violet dye per unit of time in the presence of clay samples and UV irradiation. The dye did not undergo any decomposition. In dark conditions, the maximum amount of adsorbed quantity was 9.15 mg/g and 12.15 mg/g at equilibrium time compared to the one under UV irradiation, which decreases along with increase in time. This observation may be due to the fact that the bonding energy of atoms is lower and that there is a possible production of heat by UV light [23]. This favors the bonds breaking, leading to desorption of crystal violet. These results show that our clay material does not have photocatalytic potentials due to the absence of a semi-conductor which can enhance the photocatalytic activity. This observation is in accordance with the results from XRF, FTIR and XRD that did not reveal the presence of semi-conductors in the clay samples. On the other hand, TiO2 is known for its photocatalytic activity [24]. To verify the absence of photoactivity of the natural clay samples from rice field waters, an amount of TiO2 is added. From Figure 13, the measured uptake capacity growth with increase in time illustrate the mineralization of organic xenobiotic that liberates more active sites to facilitate the adsorption process and the growth in rate of mineralization under UV irradiation. The enhanced photocatalytic activity of TiO2+clay samples can be attributed to the enhanced physicochemical properties of the material, highest availability of active sites and highest specific surface area compared to raw clays and unsupported TiO2 [25,26,27,28,29,30]. Furthermore, the photocatalytic activity of TiO2+clays photocatalysts can directly be related to the holes induced through the release of electrons (e) from the valance band to conduction band under UV irradiation [23,27,28,29,30]. Then different Reactive Oxygen Species are produced which contributed directly or indirectly to removal of CVD in solution (Figure 14). However, the main species strongly involved in this process were hydroxyl and superoxide radical [10,30,31,32]. The performance of the UV/TiO2 system on the degradation of CVD is known in the literature [33]. It should be noted that the added TiO2 diffuses Reactive Oxygen Species into the solution. These will initiate the degradation of the CVD in the solution and on the clay, leading to the regeneration of the clay in situ.

4. Conclusions

Two natural local clays from irrigated rice field waters were tested as sorbent and photocatalysts toward the degradation of organic xenobiotic (crystal violet dye) from aqueous solution. Additionally, we present the coupling of adsorption and photocatalysis under UV irradiation, which is a new and promising approach for removal of dyes from industrial wastewater. The characteristics of both clay samples are similar with good adsorptive properties, but showed variability in their microstructures. Besides, the two clay samples did not exhibit photocatalytic potentials due to the absence of semi-conductor as demonstrated by FTIR, XRD and XRF analysis. The adsorption reaction was found to be sensitive to several operational parameters such as pH of solution, adsorbent dosage, concentration of dye and the presence of inorganic salts. Adsorption of crystal violet follows the pseudo-second order kinetic model (R2 = 0.99 for both clay samples, qe values are 8.88; 11.90 mg/g similar to the experimental results respectively for Y. Clay and L. Clay) and both the surface of the adsorbent (many functional groups, abundance of kaolinite, higher LOI) and the intraparticle diffusion contribute to the rate determining step (boundary constant are 5.25 and 8.56, respectively, for Y. Clay and L. Clay). The equilibrium of adsorption results revealed that Freundlich isotherm (R2 = 0.99 and 0.98 respectively for Y. Clay and L. Clay) fits the adsorption data adequately here adsorption takes places in a two stage mechanism as surface adsorption and equilibrium. The coupling of adsorption and photocatalytic degradation does not enhance the removal of crystal violet dye. Experimental results confirmed that the combination of natural clay samples with TiO2 improved the elimination of dye. These results suggest that to show photocatalytic potentials, natural clay need to be doped by a semi-conductor which will give a promising material for coupling adsorption and photocatalytic degradation applications for treatment of organic xenobiotic waste.

Author Contributions

S.D., H.Z., B.T. and M.S.: writing—original draft preparation; S.T., A.B., B.T. and A.E.J.: funding and writing—review and editing: A.A.A., A.K., D.O.O.: supervision and editing. All authors have read and agreed to the published version of the manuscript.

Funding

This research received no external funding.

Acknowledgments

This work was supported by the King Khalid University, Abha, Saudi Arabia (by grant R.G.P. 1/195/42). We express our gratitude to the Deanship of Scientific Research, King Khalid University, for its support of this study. The authors thank the university of Maroua, the university of Cape Coast, UniLaSalle-EME, ENSC Rennes and Ahmadu Bello University for their scientific collaboration. The authors gratefully acknowledge also TIYA Antoine of “UMR ISM-Institut des Sciences Moleculaires, Université Bordeaux 1” for recording the FTIR and XRD of the samples.

Conflicts of Interest

The authors declare no conflict of interest.

References

  1. Churchman, G.J.; Gates, W.P.; Theng, B.K.G.; Yuan, G. Clays and clay minerals for pollution control. Dev. Clay Sci. 2006, 1, 625–675. [Google Scholar]
  2. Hamidzadeh, S.; Torabbeigi, M.; Shahtaheri, S.J. Removal of crystal violet from water by magnetically modified activated carbon and nanomagnetic iron oxide. J. Environ. Health Sci. Eng. 2015, 13, 8. [Google Scholar] [CrossRef]
  3. Mohamed, S.K.; Hegazy, S.H.; Abdelwahab, N.A.; Ramadan, A.M. Coupled adsorption-photocatalytic degradation of crystal violet under sunlight using chemically synthesized grafted sodium alginate/ZnO/Graphene oxide composite. Int. J. Biol. Macromol. 2018, 108, 1185–1198. [Google Scholar] [CrossRef] [PubMed]
  4. Asencios, Y.J.; Quijo, M.V.; Marcos, F.C.; Nogueira, A.E.; Rocca, R.R.; Assaf, E.M. Photocatalytic activity of Nb heterostructure (NaNbO3/Na2Nb4O11) and Nb/clay materials in the degradation of organic compounds. Sol. Energy 2019, 194, 37–46. [Google Scholar] [CrossRef]
  5. Lupi, L.; Bedmar, F.; Puricelli, M.; Marino, D.; Aparicio, V.C.; Wunderlin, D.; Miglioranza, K.S. Glyphosate runoff and its occurrence in rainwater and subsurface soil in the nearby area of agricultural fields in Argentina. Chemosphere 2019, 225, 906–914. [Google Scholar] [CrossRef]
  6. Lin, S.; Sun, S.; Shen, K.; Tan, D.; Zhang, H.; Dong, F.; Fu, X. Photocatalytic microreactors based on nano TiO2-containing clay colloidosomes. Appl. Clay Sci. 2018, 159, 42–49. [Google Scholar] [CrossRef]
  7. Assadi, A.A.; Bouzaza, A.; Wolbert, D. Study of synergetic effect by surface discharge plasma/TiO2 combination for indoor air treatment: Sequential and continuous configurations at pilot scale. J. Photochem. Photobiol. A Chem. 2015, 310, 148. [Google Scholar] [CrossRef]
  8. Paumo, H.K.; Dalhatou, S.; Katata-Seru, L.M.; Kamdem, B.P.; Tijani, J.O.; Vishwanathan, V.; Bahadur, I. TiO2 assisted photocatalysts for degradation of emerging organic pollutants in water and wastewater. J. Mol. Liq. 2021, 331, 115458. [Google Scholar] [CrossRef]
  9. Dlamini, M.C.; Maubane-Nkadimeng, M.S.; Moma, J.A. The use of TiO2/clay heterostructures in the photocatalytic remediation of water containing organic pollutants: A review. J. Environ. Chem. Eng. 2021, 9, 106546. [Google Scholar] [CrossRef]
  10. Chkirida, S.; Zari, N.; Achour, R.; Hassoune, H.; Lachehab, A.; Bouhfid, R. Highly synergic adsorption/photocatalytic efficiency of Alginate/Bentonite impregnated TiO2 beads for wastewater treatment. J. Photochem. Photobiol. A Chem. 2021, 412, 113215. [Google Scholar] [CrossRef]
  11. Mbouga, M.N.; Ngassoum, M.B.; Kamga, R.; Cretin, M. Characterization of acidic and alkali treated Kaolinite and montmorillonite clay from Adamawa and far-north region of Cameroon. J. Appl. Chem. Sci. Int. 2018, 9, 26–38. [Google Scholar]
  12. Guimaraes, V.; Teixeira, A.R.; Lucas, M.S.; Silva, A.M.; Peres, J.A. Pillared interlayered natural clays as heterogeneous photocatalysts for H2O2-assisted treatment of a winery wastewater. Sep. Purif. Technol. 2019, 228, 115768. [Google Scholar] [CrossRef]
  13. Mubiayi, M.P.; Muleja, A.A.; Nzaba, S.K.; Mamba, B.B. Geochemical and Physicochemical Characteristics of Clay Materials from Congo with Photocatalytic Activity on 4-Nitrophenol in Aqueous Solutions. ACS Omega 2020, 5, 29943–29954. [Google Scholar] [CrossRef]
  14. Nayak, P.S.; Singh, B.K. Instrumental characterization of clay by XRF, XRD and FTIR. Bull. Mater. Sci. 2007, 30, 235–238. [Google Scholar] [CrossRef]
  15. Ravindra Reddy, T.; Kaneko, S.; Endo, T.; Lakshmi Reddy, S. Spectroscopic characterization of bentonite. J. Lasers Opt. Photonics 2017, 4, 1–4. [Google Scholar]
  16. Weber, W.J., Jr.; Morris, J.C. Kinetics of adsorption on carbon from solution. J. Sanit. Eng. Div. 1963, 89, 31–59. [Google Scholar] [CrossRef]
  17. Ray, S.S.; Gusain, R.; Kuma, N. Adsorption equilibrium isotherms, kinetics and thermodynamics. Carbon Nanomater.-Based Adsorbents Water Purif. 2020, 405, 101–118. [Google Scholar]
  18. Ho, Y.S.; McKay, G. Pseudo-second order model for sorption processes. Process Biochem. 1999, 34, 451–465. [Google Scholar] [CrossRef]
  19. Langmuir, I. The adsorption of gases on plane surfaces of glass, mica and platinum. J. Am. Chem. Soc. 1918, 40, 1361–1403. [Google Scholar] [CrossRef]
  20. Freundlich, H. Uber die adsorption in losungen, zeitschrift fur phtsikalische chemie. Z. Fur Phys. Chem. 1906, 62, 121–125. [Google Scholar]
  21. Radushkevich, M.D.L. The equation of the characteristic curve of the activated charcoal USSR Phys. Chem Sect 1947, 55, 331. [Google Scholar]
  22. Semerciöz, A.S.; Göğüş, F.; Çelekli, A.; Bozkurt, H. Development of carbonaceous material from grapefruit peel with microwave implemented-low temperature hydrothermal carbonization technique for the adsorption of Cu (II). J. Clean. Prod. 2017, 165, 599–610. [Google Scholar] [CrossRef]
  23. Hadjltaief, H.B.; Ameur, S.B.; Da Costa, P.; Zina, M.B.; Galvez, M.E. Photocatalytic decolorization of cationic and anionic dyes over ZnO nanoparticle immobilized on natural Tunisian clay. Appl. Clay Sci. 2018, 152, 148–157. [Google Scholar] [CrossRef]
  24. Baaloudj, O.; Assadi, I.; Nasrallah, N.; El, A.; Khezami, L. Simultaneous removal of antibiotics and inactivation of antibiotic-resistant bacteria by photocatalysis: A review. J. Water Process Eng. 2021, 42, 102089. [Google Scholar] [CrossRef]
  25. Baaloudj, O.; Nasrallah, N.; Kebir, M.; Guedioura, B.; Amrane, A.; Nguyen-Tri, P.; Nanda, S.; Assadi, A.A. Artificial neural network modeling of cefixime photodegradation by synthesized CoBi2O4 nanoparticles. Environ. Sci. Pollut. Res. 2020, 28, 15436–15452. [Google Scholar] [CrossRef]
  26. Lou, W.; Kane, A.; Wolbert, D.; Rtimi, S.; Assadi, A.A. Study of a photocatalytic process for removal of antibiotics from wastewater in a falling film photoreactor: Scavenger study and process intensification feasibility. Chem. Eng. Process. Process Intensif. 2017, 122, 213–221. [Google Scholar] [CrossRef]
  27. Baaloudj, O.; Nasrallah, N.; Kebir, M.; Khezami, L.; Amrane, A.; Assadi, A.A. A comparative study of ceramic nanoparticles synthesized for antibiotic removal: Catalysis characterization and photocatalytic performance modeling. Environ. Sci. Pollut. Res. 2020, 28, 13900–13912. [Google Scholar] [CrossRef]
  28. Baaloudj, O.; Nasrallah, N.; Bouallouche, R.; Kenfoud, H.; Khezami, L.; Assadi, A.A. High efficient Cefixime removal from water by the sillenite Bi12TiO20: Photocatalytic mechanism and degradation pathway. J. Clean. Prod. 2022, 330, 129934. [Google Scholar] [CrossRef]
  29. Baaloudj, O.; Assadi, A.A.; Azizi, M.; Kenfoud, H.; Trari, M.; Amrane, A.; Assadi, A.A.; Nasrallah, N. Synthesis and Characterization of ZnBi2O4 Nanoparticles: Photocatalytic Performance for Antibiotic Removal under Different Light Sources. Appl. Sci. 2021, 11, 3975. [Google Scholar] [CrossRef]
  30. Baaloudj, O.; Nasrallah, N.; Kenfoud, H.; Algethami, F.; Modwi, A.; Guesmi, A.; Assadi, A.A.; Khezami, L. Application of Bi12ZnO20 Sillenite as an Efficient Photocatalyst for Wastewater Treatment: Removal of Both Organic and Inorganic Compounds. Materials 2021, 14, 5409. [Google Scholar] [CrossRef]
  31. Song, X.; Qin, G.; Cheng, G.; Jiang, W.; Chen, X.; Dai, W.; Fu, X. Oxygen defect-induced NO− intermediates promoting NO deep oxidation over Ce doped SnO2 under visible light. Appl. Catal. B Environ. 2021, 284, 119761. [Google Scholar] [CrossRef]
  32. Zeghioud, H.; Assadi, A.A.; Khellaf, N.; Djelal, H.; Amrane, A.; Rtimi, S. Photocatalytic performance of CuxO/TiO2 deposited by HiPIMS on polyester under visible light LEDs: Oxidants, ions effect, and reactive oxygen species investigation. Materials 2019, 12, 412. [Google Scholar] [CrossRef] [PubMed]
  33. Creţescu, I.; Lutic, D. Advanced removal of crystal violet dye from aqueous solutions by photocatalysis using commercial products containing titanium dioxide. C. R. Chim. 2022, 25, 1–12. [Google Scholar] [CrossRef]
Figure 1. FTIR spectra of Y-Clay and L-Clay.
Catalysts 12 00899 g001
Figure 2. A XRD spectra of Y-Clay (a) and L-Clay (b).
Catalysts 12 00899 g002
Figure 3. Clay samples image under a scanning electron microscope (Y-Clay (a) and L-Clay (b)).
Catalysts 12 00899 g003
Figure 4. Effect of contact time; Conditions: m = 0.01 g, C = 12 mg/L, T = 30 °C.
Catalysts 12 00899 g004
Figure 5. Effect of adsorbent dose; Conditions: t = 10 min for Y. Clay/15 min for L. Clay, C = 12 mg/L, T = 30 °C.
Catalysts 12 00899 g005
Figure 6. Effect of pH; Conditions: t = 10 min for Y. Clay/15 min for L. Clay, m = 0.01 g, C = 12 mg/L, T = 30 °C.
Catalysts 12 00899 g006
Figure 7. Effect of Initial Dye Concentration; Conditions: t = 10 min for Y. Clay/15 min for L. Clay, m = 0.01 g, pH = 2, T = 30 °C.
Catalysts 12 00899 g007
Figure 8. Effect of interference of inorganic salts on (A) L. Clay, (B) Y. Clay; Conditions: pH = 2, V = 20 mL, C = 12 mg/L.
Catalysts 12 00899 g008
Figure 9. (a) pseudo-first-order, (b) pseudo-second-order, (c) intraparticle diffusion Kinetic models plot.
Catalysts 12 00899 g009
Figure 10. (a) Langmuir, (b) Freundlich, (c) Temkin isotherms.
Catalysts 12 00899 g010
Figure 11. (a) effect of temperature on clay adsorption capacities (Vsolution = 50 mL, mClay = 50 mg, naturel pH, 200 rpm of stirring); (b) Plot for the thermodynamic analysis.
Catalysts 12 00899 g011
Figure 12. Regeneration and reuse test for L. Clay and Y. Clay for the adsorption of crystal violet dye (C0 = 5 mg/L; T = 10 °C; mClay/Vsolution = 4 mg/mL).
Catalysts 12 00899 g012
Figure 13. Photocatalytic degradation efficiency of crystal violet under clays, under clays and TiO2 + Clays + UV. Conditions: Clay (m = 0.1 g), TiO2 (m = 0.1 g), V = 200 mL, C = 12 mg/L, Ph = 2, T = 30 °C.
Catalysts 12 00899 g013
Figure 14. Degradation mechanism of crystal violet under TiO2 + Clays + UV.
Catalysts 12 00899 g014
Table 1. Structure and chemical characteristics of Crystal violet dye.
Structure/PropertiesCrystal Violet
Structure Catalysts 12 00899 i001
NatureCationic
C.I nameBasic violet 3
C.I number42,555
Chemical formulaC25H30N3Cl
Molecular Weight407.979 ± 0.025
λmax590 nm
Table 2. Chemical Analysis of Y-Clay and L-Clay.
SamplesY-ClayL-Clay
SiO251.3138.78
Al2O314.889.44
Fe2O35.314.08
CaO0.711.72
MgO0.350.70
SO30.030.09
K2O2.852.47
Na2O0.031.18
P2O50.050.14
LOI8.829.91
Other15.6631.49
Table 3. Kinetics parameters of each tested model for adsorption of crystal Violet Dye.
Adsorbentsqe (mg/g)Pseudo-First OrderPseudo-Second OrderIntraparticle Diffusion
k1
(L/min)
qe(calc.) (mg/g)R2K2
(g/mg min)
qe(calc.) (mg/g)R2C
(mg·g−1)
kint (mg·L·min−1/2)R2
Y. clay9.150.031.020.080.158.880.995.250.600.46
L. clay12.150.020.690.020.1411.900.998.560.530.61
Table 4. Equilibrium models equations used to investigate crystal violet degradation mechanism.
Isotherm ModelEquationReferences
Langmuir q e = q m a x . K L . C e 1 + K L . C e [19] Langmuir, 1918
Freundlich q e = K F . C e   1 / n [20] Freundlich, 1906
Temkin q e = R T b T l n A T . C e [21] Radushkevich, 1947
Table 5. Adsorption isotherm parameters calculated using linear regression analysis.
Models LangmuirFreundlichTemkin
Parametersqm, expRLqe, calR2KFnR2bTATR2
Y. clay18.400.333.460.971.710.720.991.256.180.79
L. clay20.400.373.400.961.460.650.981.177.880.88
Table 6. Thermodynamic parameters of crystal violet dye adsorption onto Clay at different temperatures (303.15–323.15 K).
T (K)ΔG° (KJ/mol)ΔH° (kJ mol−1)ΔS° (J mol−1 K−1)
Y. Clay303.15−12.636.271159.21
313.15−12.26
323.15−15.87
L. Clay303.15−10.68−13.180−8.97
313.15−9.93
323.15−10.53
Publisher’s Note: MDPI stays neutral with regard to jurisdictional claims in published maps and institutional affiliations.

