Article

Palladium-Nickel Electrocatalysts on Nitrogen-Doped Reduced Graphene Oxide Nanosheets for Direct Hydrazine/Hydrogen Peroxide Fuel Cells

by
Mir Ghasem Hosseini
1,2,*,
Vahid Daneshvari-Esfahlan
1,3,
Hossein Aghajani
4,
Sigrid Wolf
3 and
Viktor Hacker
3,*
1
Electrochemistry Research Laboratory, Department of Physical Chemistry, Faculty of Chemistry, University of Tabriz, Tabriz 51666-16471, Iran
2
Department of Materials Science and Nanotechnology, Engineering Faculty, Near East University, Nicosia 99318, Turkey
3
Institute of Chemical Engineering and Environmental Technology, Graz University of Technology, Inffeldgasse 25/C, 8010 Graz, Austria
4
Faculty of Materials & Metallurgy Engineering, Iran University of Science and Technology, Tehran 13114-16846, Iran
*
Authors to whom correspondence should be addressed.
Catalysts 2021, 11(11), 1372; https://doi.org/10.3390/catal11111372
Submission received: 29 October 2021 / Revised: 11 November 2021 / Accepted: 12 November 2021 / Published: 14 November 2021
(This article belongs to the Topic Electromaterials for Environment & Energy)

Abstract

:
In the present work, nitrogen-doped reduced graphene oxide-supported (NrGO) bimetallic Pd–Ni nanoparticles (NPs), fabricated by means of the electrochemical reduction method, are investigated as an anode electrocatalyst in direct hydrazine–hydrogen peroxide fuel cells (DHzHPFCs). The surface and structural characterization of the synthesized catalyst affirm the uniform deposition of NPs on the distorted NrGO. The electrochemical studies indicate that the hydrazine oxidation current density on Pd–Ni/NrGO is 1.81 times higher than that of Pd/NrGO. The onset potential of hydrazine oxidation on the bimetallic catalyst is also slightly more negative, i.e., the catalyst activity and stability are improved by Ni incorporation into the Pd network. Moreover, the Pd–Ni/NrGO catalyst has a large electrochemical surface area, a low activation energy value and a low resistance of charge transfer. Finally, a systematic investigation of DHzHPFC with Pd–Ni/NrGO as an anode and Pt/C as a cathode is performed; the open circuit voltage of 1.80 V and a supreme power density of 216.71 mW cm−2 is obtained for the synthesized catalyst at 60 °C. These results show that the Pd–Ni/NrGO nanocatalyst has great potential to serve as an effective and stable catalyst with low Pd content for application in DHzHPFCs.

Graphical Abstract

1. Introduction

Direct hydrazine–hydrogen peroxide fuel cells (DHzHPFCs) are known as unique power sources for air-independent applications in space and underwater. The use of hydrazine (N2H4) as a high-energy fuel in FCs has been investigated since the 1970s [1,2], specifically as an alternative fuel in portable power sources [3,4,5]. N2H4 is considered a promising liquid fuel for the following reasons: (1) its handling is safer; (2) its electrooxidation occurs without the generation of carbon dioxide, which leads to a reduction of greenhouse gas emissions; (3) catalysts are not poisoned during the N2H4 oxidation reaction due to lack of the carbonaceous intermediates production, as reported by Mohammed et al., who investigated the sensitive electrochemical detection of hydrazine based on SnO2/CeO2 nanostructured oxide and reported the high stability, sensitivity and repeatability of hydrazine oxidation on the synthesized nanomaterial [6]; and (4) because of the high theoretical electromotive force of 1.56 V [7] and power density (PD) of 5.4 KWh L−1 observed for DHzHPFCs. On the other hand, a simple internal structure of fuel cells is obtained with an oxidant of hydrogen peroxide (H2O2) [8,9,10]. Compared to the oxygen reduction reaction (ORR) with a theoretical electrode potential of 1.23 V, the theoretical electrode potential of the H2O2 reduction reaction (HRR, 1.77 V) and the corresponding kinetics is higher. Thus, the ideal open circuit voltage (OCV) of the single FC and its PW is increased using H2O2 as an alternative fuel to oxygen. The anode, cathode, and overall cell reactions in the DHzHPFC are:
Anode : N 2 H 4 + OH N 2 + 4 H 2 O + 4 e E ° = 1.21   V   vs .   SHE
Cathode : 2 H 2 O 2 + 4 H + + 4 e + 4 H 2 O E ° = 0.92   V   vs .   SHE
Overall : N 2 H 4 + 2 H 2 O 2 N 2 + 4 H 2 O E ° = 2.13   V   vs .   SHE
In DHzHPFC, a Nafion membrane is used, electrons transferring from anode to cathode and Na+ migration occurring in the opposite direction. According to Equation (3), H2O and N2 are products of this type of DFC [10,11]. Various chemicals have been designed recently and their performances as catalysts examined in the DHzHPFC [3,5,9,12,13,14,15,16,17,18]. For example, the accumulation of gas bubbles on the electrode surface is effectively solved by using a nano-hill morphology of vertical graphene, by means of which a superoleophobic electrode was obtained that could accelerate the elimination process of bubbles generated on the anodic electrode surface. Yin et al. report on a DHzHPFC that yields a high-power density of 84 mW cm−2 using a Zr/Ni alloy as the anode and Pt/C as the cathode [19]. In another report on DHzHPFC, with a Pt-based anode (10.0 mg cm−2) and an Au/C cathode (10.0 mg cm−2), a high PD of 1.02 W cm−2 and an OCV of 1.75 V at 80 °C is reported [20]. In the course of this work, Yan et al. [21] fabricated dealloyed nanoporous gold leaves and found that these catalysts present high performances for both N2H4 oxidation (HzOR) and HRR. One method to improve the electrocatalytic activity of anode electrocatalysts is by preparing core–shell nanoparticles, in which the core and shell are composed of different elements. Preparation of different core–shell nanoparticles, including Ni–Pt, Ni–Pd, and Ni–Ru, on reduced graphene oxide (rGO) have been recently reported by Hossieni et al., [13]. The reported single fuel cell results show that Ni–Pd/rGO resulted in an improvement in power density (204.79 mW cm−2) equal to 10.03% and 47.32% with respect to Ni–Pt/rGO (186.12 mW cm−2) and Ni–Ru/rGO (139.01 mW cm−2), respectively, which was attributed to the synergistic effects between Pd and Ni metals.
Such observations allowed the implementation of a DHzHPFC based on these porous membrane catalysts with an OCV of 1.2 V and a maximum power density (MPD) of 195.0 mW cm−2 at 80 °C with a total loading of 0.1 mg cm−2 Au on each side. Although high power densities and OCVs are obtained, the critical impediment to the commercialization of DHzHPFC technology is still linked to high-cost catalysts prepared from resource-limited noble metals. Additionally, the current nanoelectrodes have further disadvantages, including structural irregularity, irregular distribution, and agglomeration during operation. These disadvantages mean that it is necessary to prepare low-cost, highly active, and more stable catalysts. To achieve this goal, ideal nanoelectrocatalysts should be highly conducive to facilitating the transfer of electrons/ions and possess a high active surface to increase the catalytic efficiency of desired nanocatalysts in the DHzHPFC community [22,23]. Alloying noble metals with cheap transition metals is well-known as one way to decrease the content of noble metals. Among non-precious transition metals, Ni is a low-cost and co-catalyst active metal, and its alloying with Pd refreshes the active sites of Pd; it thus improves the corresponding activity/stability of the bimetallic catalyst as a result of Pd–Ni synergistic influences [24,25]. The selection of a suitable catalyst support is another important parameter that improves fuel cell performance, in addition to reducing the price of catalysts. In this respect, graphene and its derivatives, as an allotrope of single-layer carbon atoms arranged in a two-dimensional honeycomb lattice, have received more attention in scientific communications due to their unique properties, including strong electrical conductivity (6500 S m−1) [26,27], a high theoretical specific surface area, high thermal and chemical stability, and an adjustable bandgap. These characteristics led to graphene being engaged as a carbon support in several applications, especially for Energy Generation [28,29,30]. Although graphene possesses unique properties, the path of its commercialization remains a challenge for researchers. For graphene to be transferred from the laboratory to consumer-utilized products, it is necessary to produce large-scale graphene which is practical and competitive. For this reason, better understanding of graphene and its derivatives as a step to introducing this material into industrial-scale production has a high importance. Different methods for preparation of graphene and its derivates along with their sustainability have been reviewed recently by Umar et al., [29] helping the researchers investigating the high-quality production of these nanomaterials. Furthermore, graphene oxide (GO) has various functional groups, i.e., −COOH and −OH, for immobilization of different active species. Recently, the incorporation of heteroatoms and especially nitrogen [31,32,33,34] into the carbon plane has attracted great attention.
In fact, by doping the carbon plane with nitrogen atoms, the electronic density of the neighboring carbon atoms is redistributed, inducing an electrophilic center in the adjacency of nitrogen atoms, and modifies the geometry and the electron donor character of the resultant nitrogen-doped GO. [35] The uniform dispersion with a narrow small metal particle size is also obtained by the incorporation of nitrogen atoms into the GO skeleton [36]. Based on the literature [37,38], the nitrogen atoms in the NrGO support are effective in changing the oxidation state of Pd and its NPs’ size, suggesting deposition of Pd2+ on NrGO as oxo/hydroxo clusters of Pd. Following clustering, the metal oxide species are reduced, leading to the formation of Pd NPs. Charge localization occurs on the catalyst support and is attacked by activated hydrogen atoms from the Pd NPs at the quaternary nitrogen sites, resulting in uniform growth of the Pd metal NPs.
This work reports the preparation of NrGO-supported bimetallic Pd–Ni alloy NPs by polyol method and its use as an anode catalyst towards the production of HzOR in DHzHPFCs. In this respect, the phase, elemental composition, and surface morphology of the fabricated nanostructure were qualified by employing X-ray diffraction (XRD), field emission scanning electron microscopy (FE-SEM), energy-dispersive X-ray spectroscopy (EDX), Fourier-transform infrared spectroscopy (FT-IR), and transmission electron microscopy (TEM). Cyclic voltammetry (CV), chronoamperometry (CA), and electrochemical impedance spectroscopy (EIS) methods were utilized to study hydrazine oxidation on the synthesized nanocatalyst and these results were compared with the results for the Pd/NrGO electrocatalyst. Finally, the cell performance of DHzHPFC was investigated by considering different operation conditions on cell potential and its MPD. In the DHzHPFCs experiments, the membrane electrode assembly (MEA) was obtained using the catalyst-coated membrane (CCM) method.

2. Results and Discussion

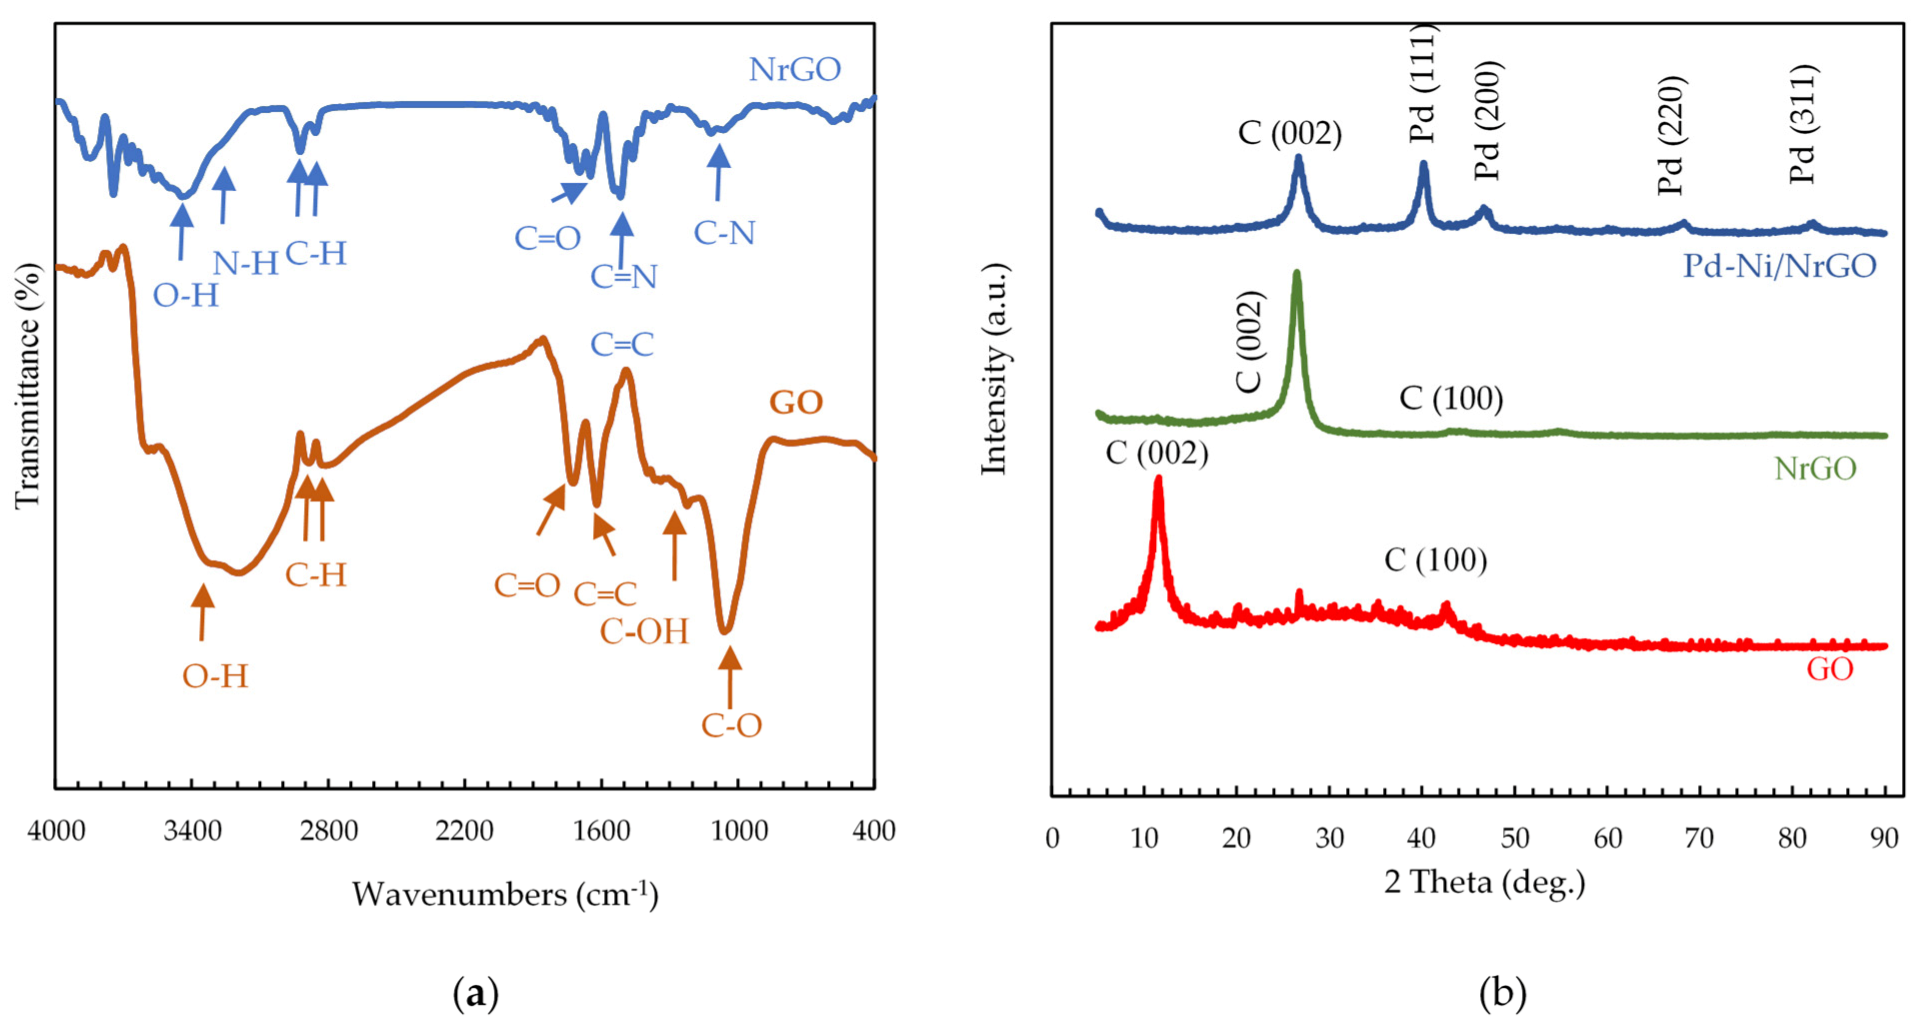
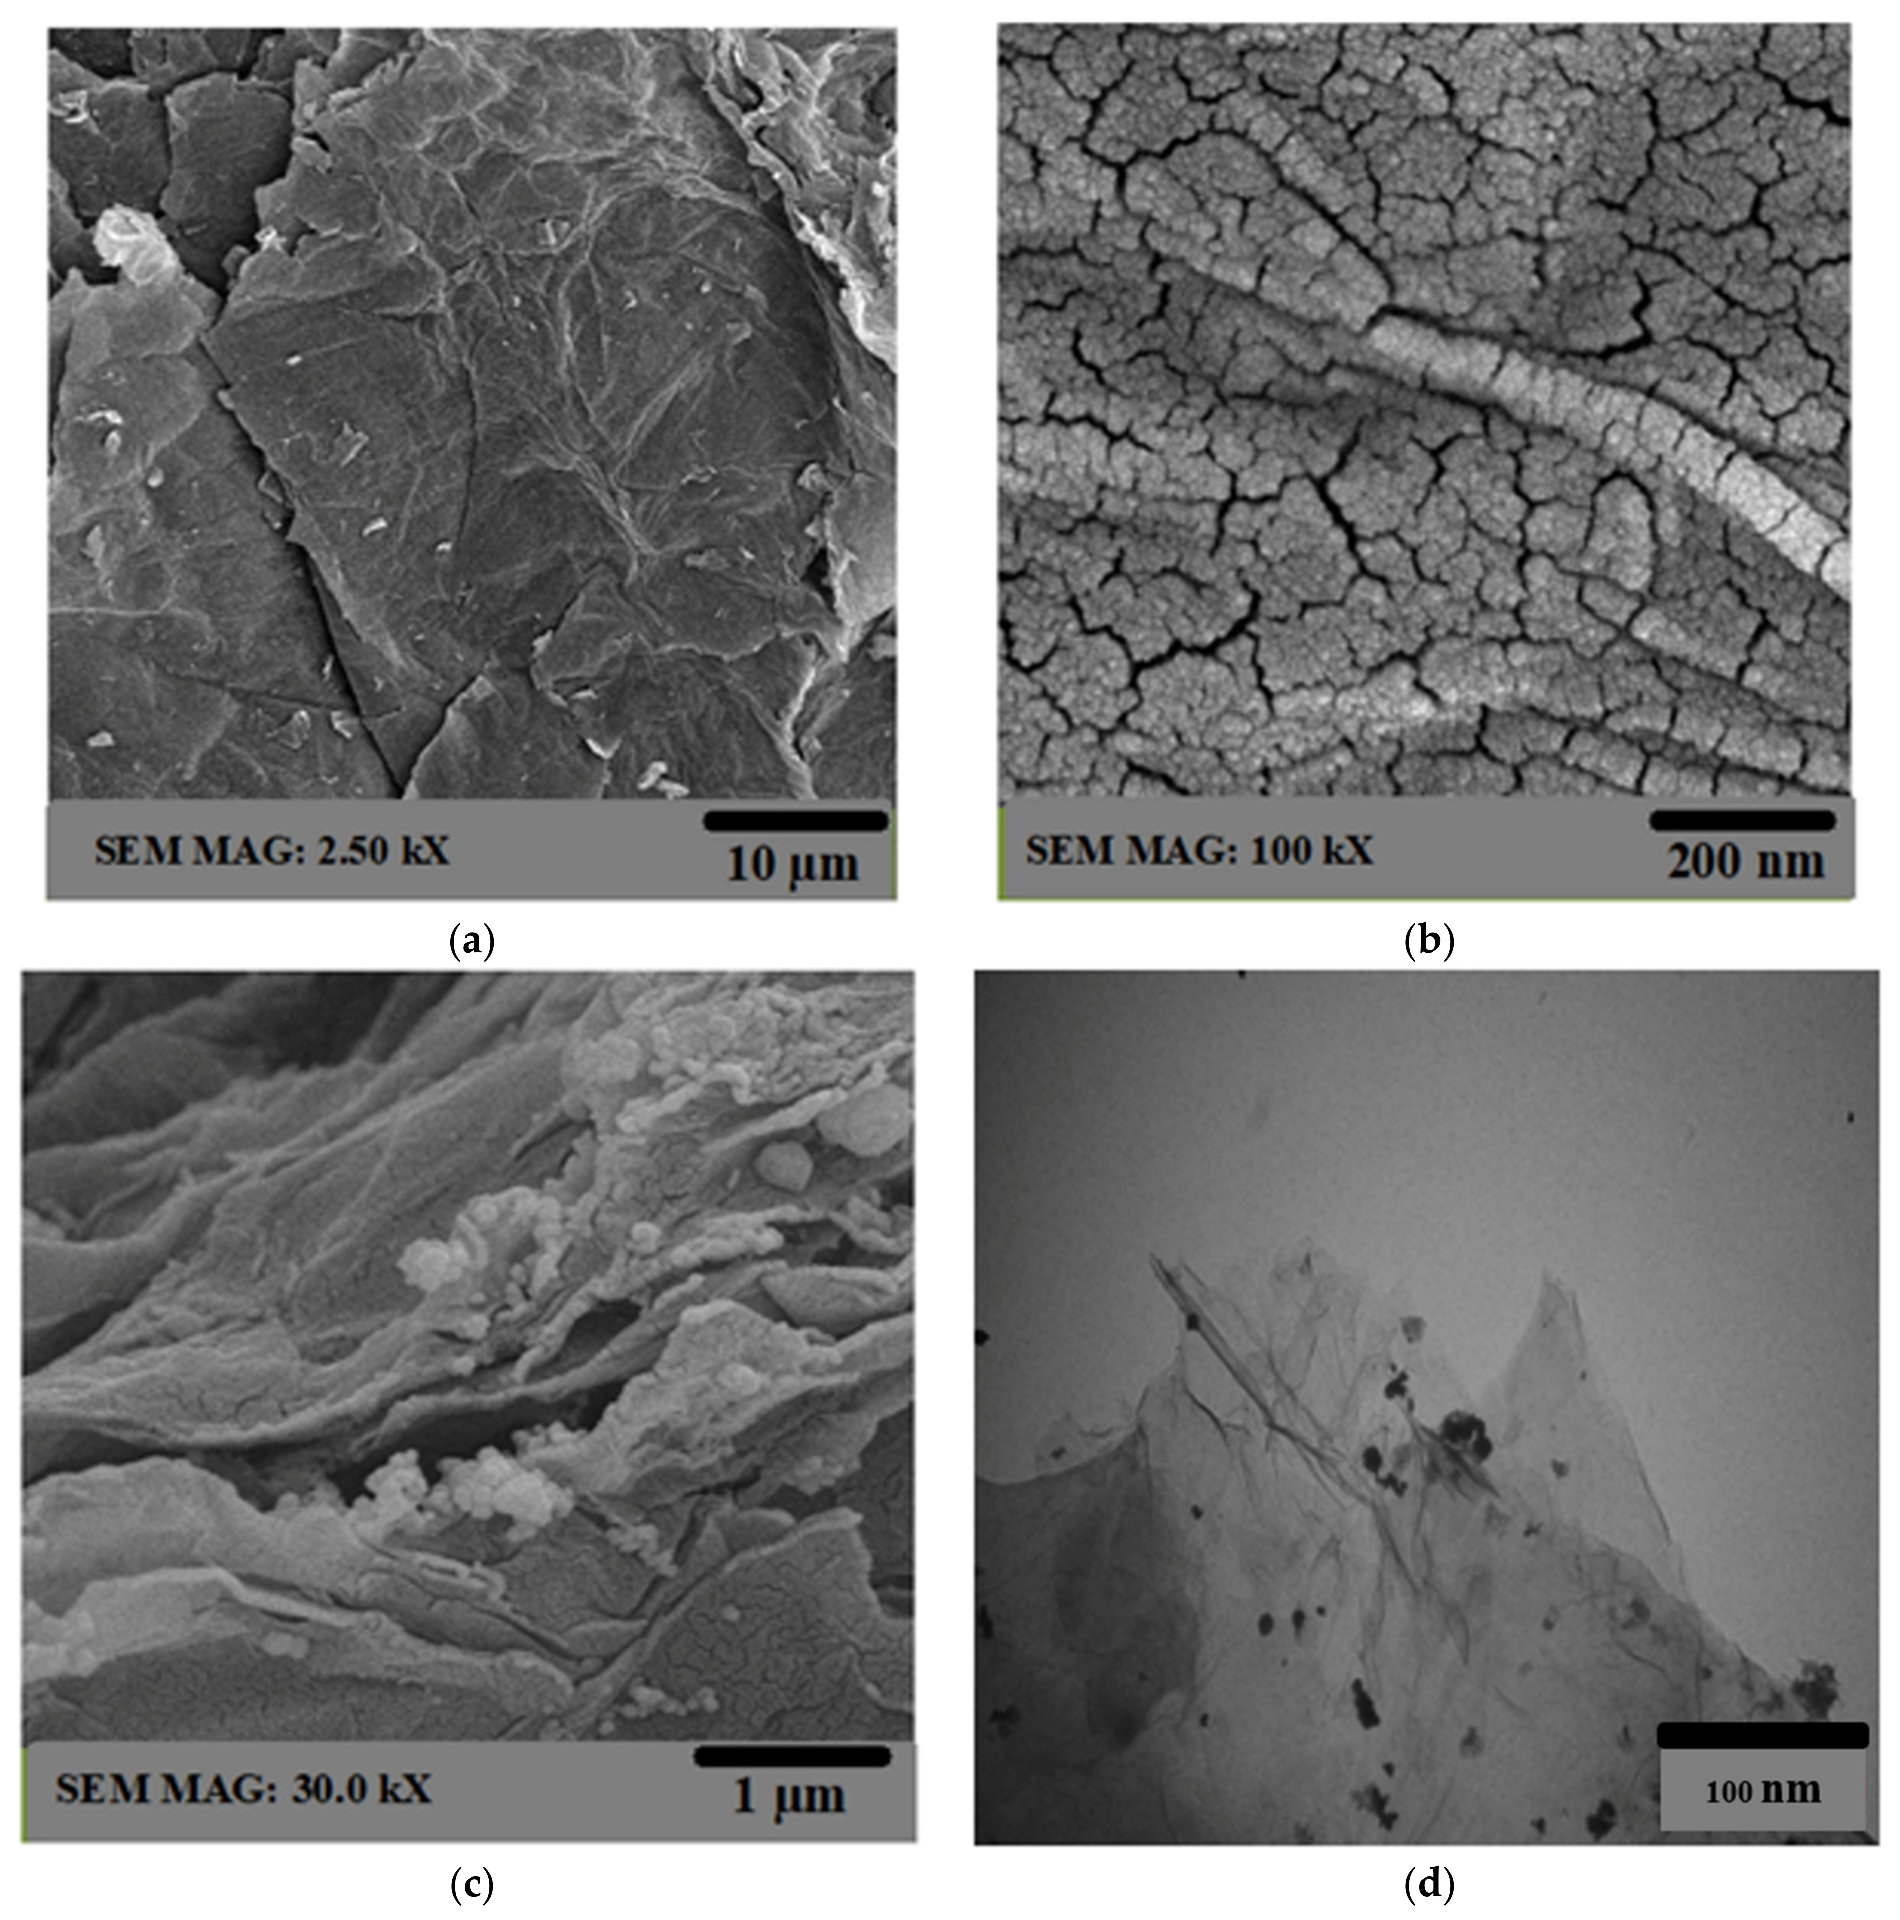
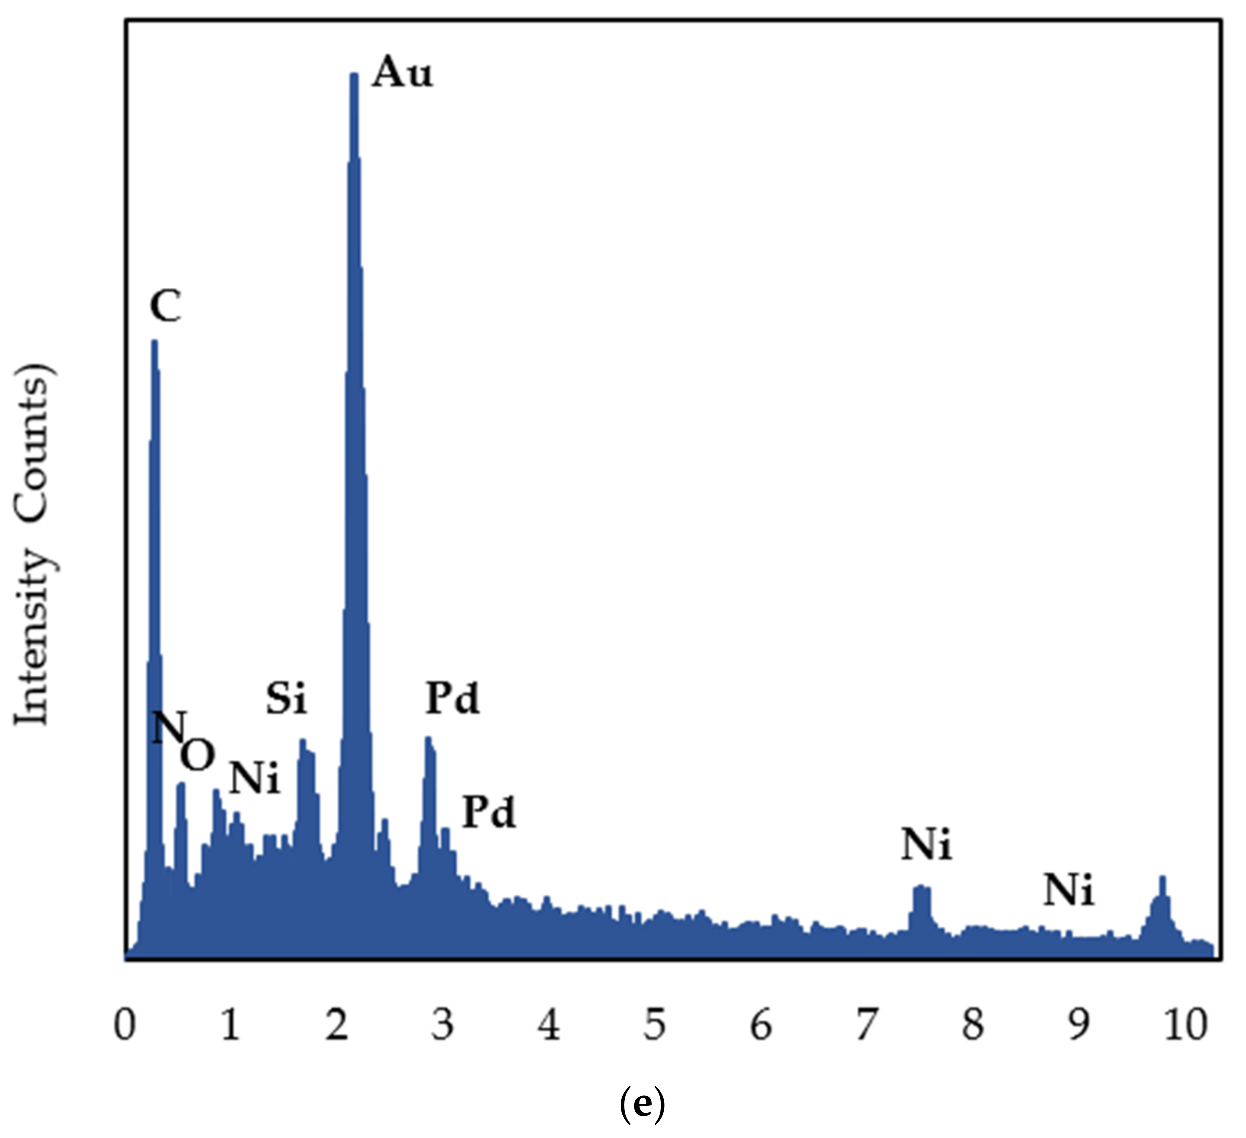
2.1. Physical Characterization of Nanocatalysts

The functional groups of the catalyst support can simplify the incorporation of metal nanoparticles on surfaces. According to recent work [39], FT-IR was conducted to qualify the GO functional groups and their changes in NrGO support after simultaneous nitrogen atom doping of the GO skeleton and reduction of oxygenated species, as shown in Figure 1a. In both spectra (in the range of 400–4000 cm−1), the band at 3400 cm−1 demonstrates the O–H stretch of the –OH group. During oxidation or functionalization of GO, the carboxyl groups have fluctuated, which leads to a clear peak at 3400 cm−1. Four characteristic bands can be observed in the spectrum of GO, with one at 1728 cm−1 arising from stretching vibrations of C=O in carbonyl and carboxyl groups and the other three at 1624 cm−1, 1220 cm−1, and 1085 cm−1, devoted to the C=C, C–OH, and C–O stretching vibrations, respectively. In the case of NrGO, the bands at 1624 and 1220 cm−1 are not observed and the intensity peaks of other oxygenated functional groups decrease. Additionally, the superposition of C=C and C=N vibrations leads to shifts in the in-plane vibration of C=C from 1624 to 1556 cm−1. Moreover, a new peak appears at 1187 cm−1 which can be related to the C-N bonds. These observations provide valuable information in regard to the existence of nitrogen-containing groups in the synthesized catalyst support in close agreement with reports in the literature [39,40,41].
Figure 1b presents XRD patterns of GO, NrGO, and Pd–Ni/NrGO samples; the existence of sharp peaks in these XRD patterns characterize a crystalline structure for the synthesized materials. The strong sharp peak of a basal plane in the graphitic structure (002) is seen at a 2θ value of 11.49° with d-spacing of 0.77 nm in the XRD pattern of GO [42]. Such a peak is also observed in the XRD spectra of NrGO and Pd–Ni/NrGO but moving to a higher 2θ value of 26.45° than that of GO [43,44]. The interlayer spacing of NrGO samples was about 0.340 nm, which is a somewhat smaller than that in the bare rGO (0.37 nm), which is ascribed to the more compact graphitic structure created after nitrogen doping [39,45,46].
The four strong, sharp peaks at 40.15°, 46.80°, 68.29°, and 82.28° are observed for the Pd–Ni/NrGO catalyst with the miller indices (111), (200), (220), and (311), respectively, for the face-centered-cubic (fcc) lattice crystal structure facets of the Pd (JCPDS No. 01-087-0641) [47,48]. Pd (111) presents the strongest sharp peak for oxidation of an active facet of small organic molecules. As seen in Figure 1b, the deposition of Pd–Ni metal Nps on the NrGO support has no influence on the support structure; the peaks for NrGO are maintained with a decrease in intensity. By comparing the XRD pattern of Pd–Ni/NrGO with the standard powder diffraction file of Pd (JCPDS No. 01-087-0641) and Ni (JCPDS No. 00-04-0850), it is concluded that all the peaks for synthesized catalysts are placed between the peaks of Pd and Ni metal NPs. These results reveal the successful preparation of the Pd–Ni/NrGO nanostructure in good accordance with those reported in the literature [39,47,48,49,50].
Figure 2a,b presents the FE-SEM image of NrGO planner sheets with wrinkled and folded features, indicating that the generic morphology of GO is preserved after nitrogen doping [51]. As displayed in Figure 2c, the FE-SEM micrograph of the Pd–Ni/NrGO sample displays the Pd–Ni metallic NPs dispersed uniformly on the surface of NrGO, and the compact exfoliated multilayers of NrGO features is restricted after the incorporation of metal NPs. This means that the Pd–Ni NPs form independently on the rough and planar nanosheets provided by NrGO without any aggregation. It is found that the particle size of Pd–Ni is around 11–13 nm.
To determine the distribution of each element on the synthesized catalyst, a back scattered electron (BSE) image was captured, and the result is displayed in Figure S1 in the Supplementary Material. As seen in this figure, there are white and gray zones which are associated with the presence of higher and lower average atomic numbers, respectively. White-colored aggregates are mainly made up of a metallic phase (Pd and Ni) whereas darker aggregates are richer in oxygen, nitrogen, and carbon. These images are corroborated by SEM images performed on the synthesized catalyst along with the uniform distribution of metal nanoparticles on the catalyst support (Figure 2c) and the EDX map (Figure S2).
To further observe the morphology of Pd–Ni/NrGO, TEM images were recorded, as seen in Figure 2d. It can be seen that the bimetallic nanoparticles are scattered homogeneously on the NrGO sheet with a narrow size range. The uniform dispersion of Pd–Ni NPs on catalyst support may be attributed to the shifting of the d-band centers of supported Pd atoms to the Fermi level by the incorporation of nitrogen into graphene [52,53]. The obtained results from EDX analysis (as seen in Figure 2e) indicated the existence of C (42.19 wt%), N (16.23 wt%), O (21.16 wt%), Pd (11.08 wt%), and Ni (9.34 wt%) in the synthesized catalyst. This means that the total metal content of the electrocatalyst is around 20 wt% with a weight ratio of 1:1 for Pd to Ni metals. Figure S2 presents the elemental mapping images of the synthesized catalyst which confirm the uniform deposition of bimetallic NPs on the active sites of N-rGO.

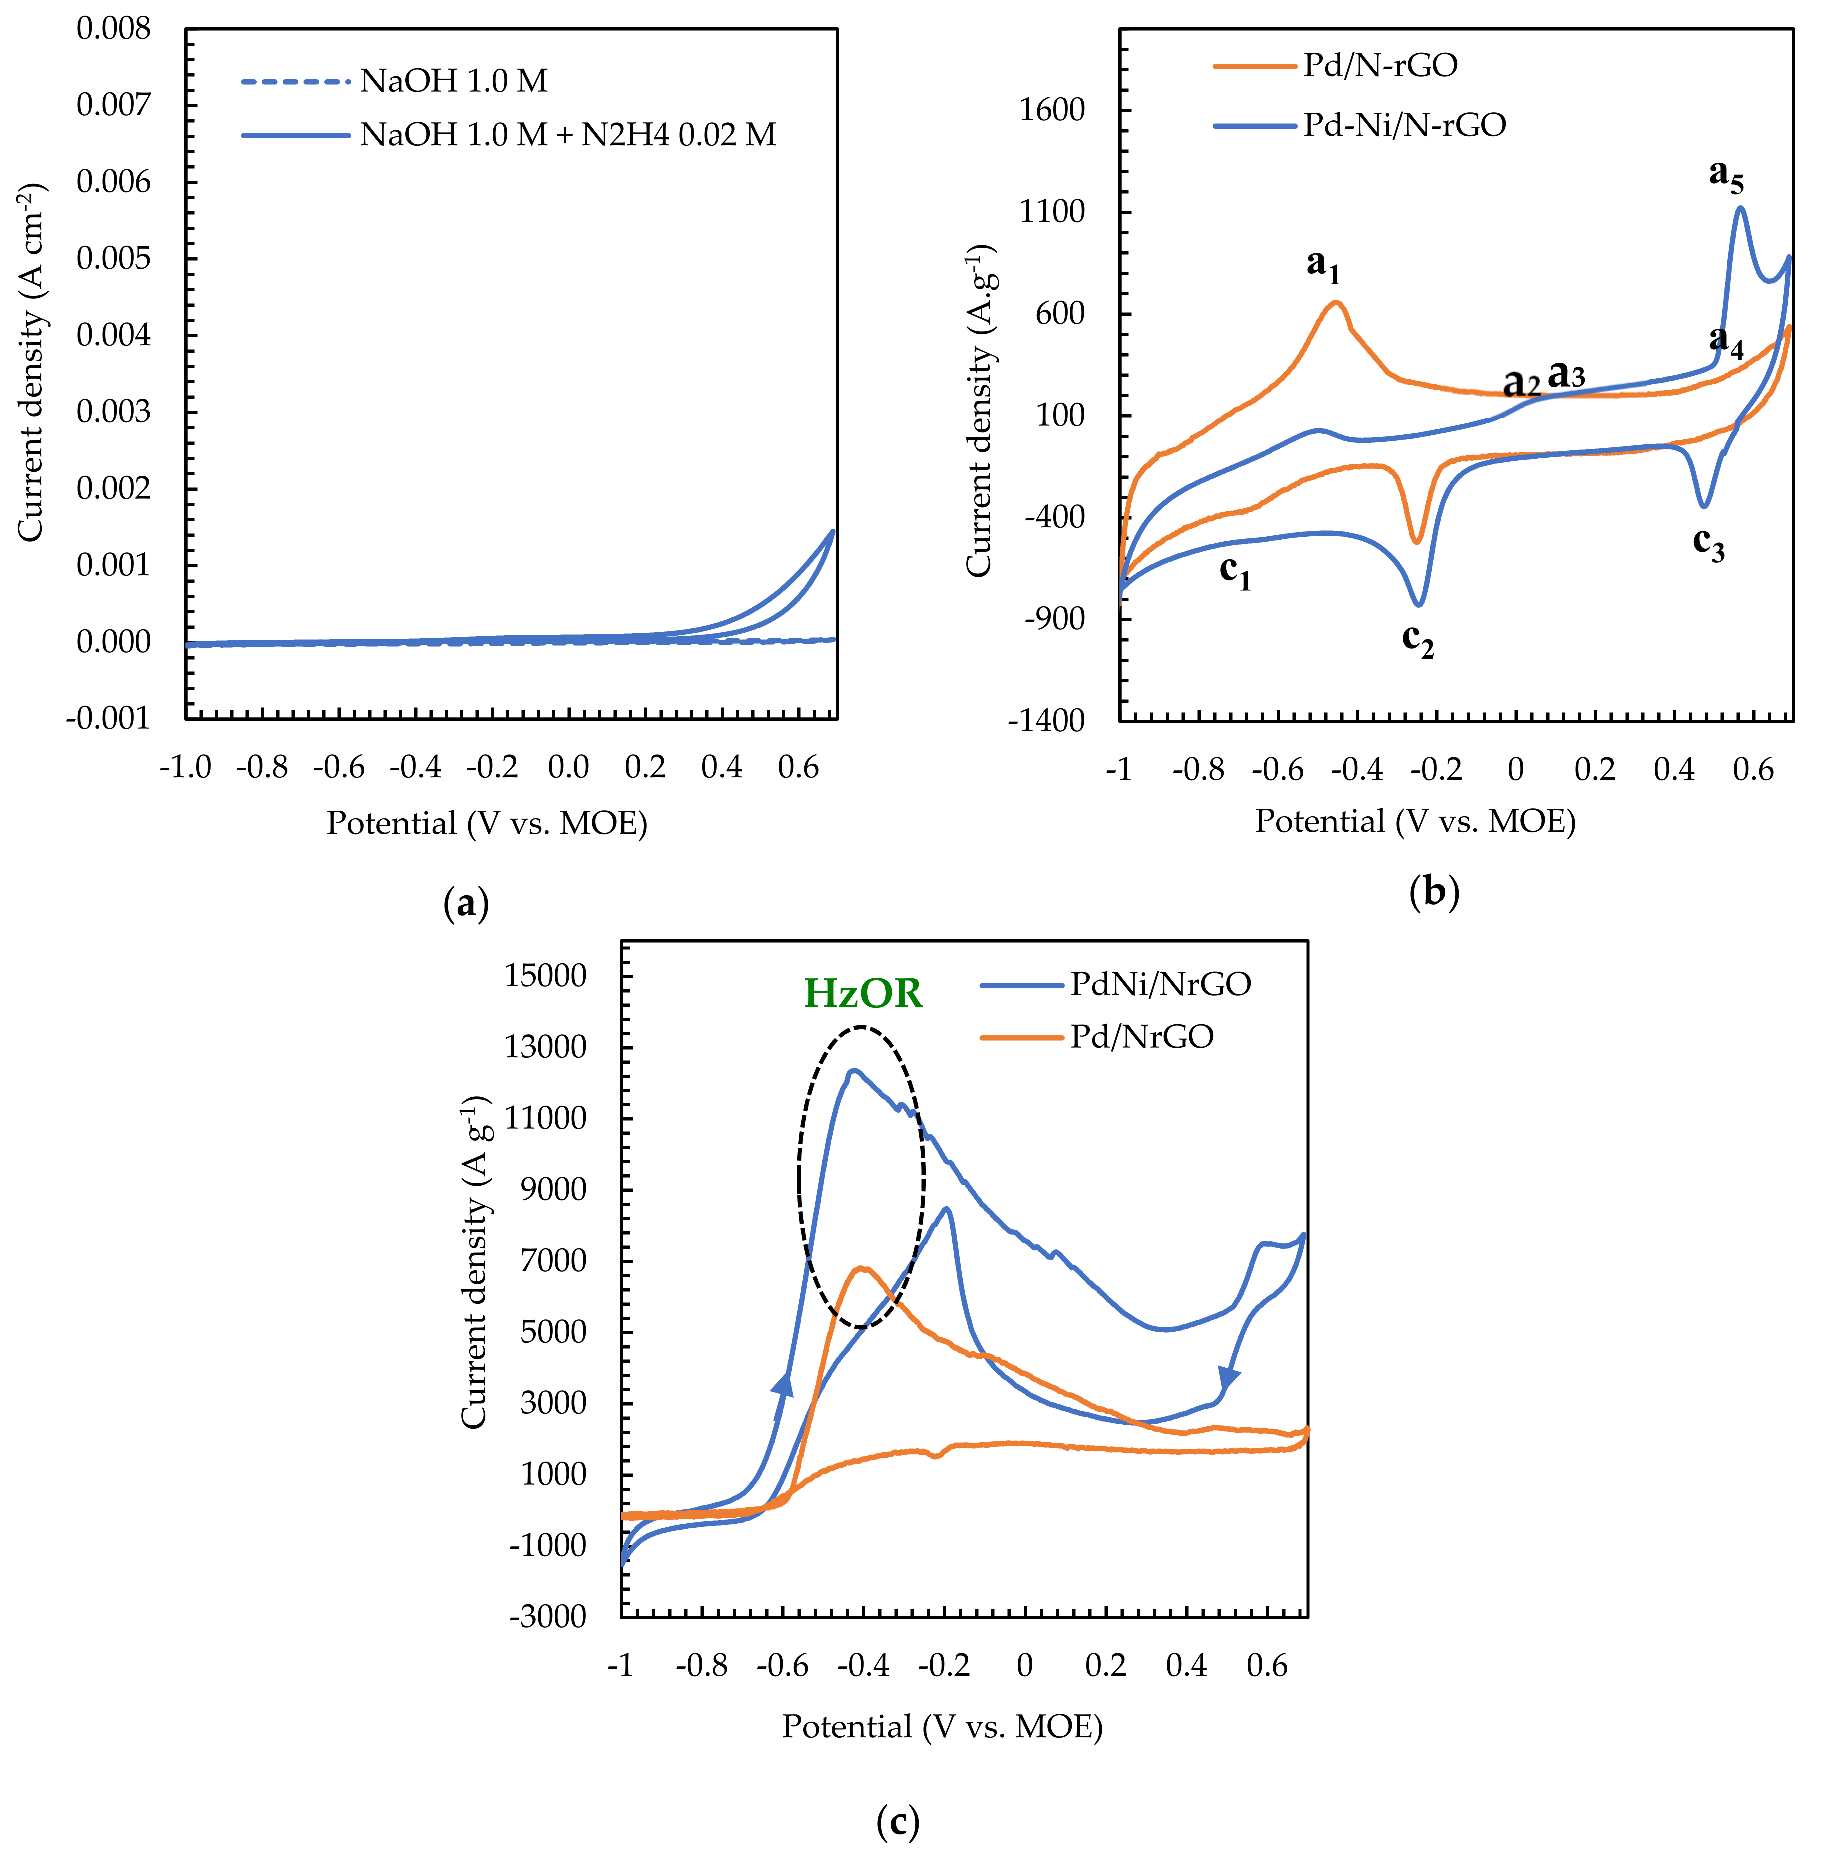
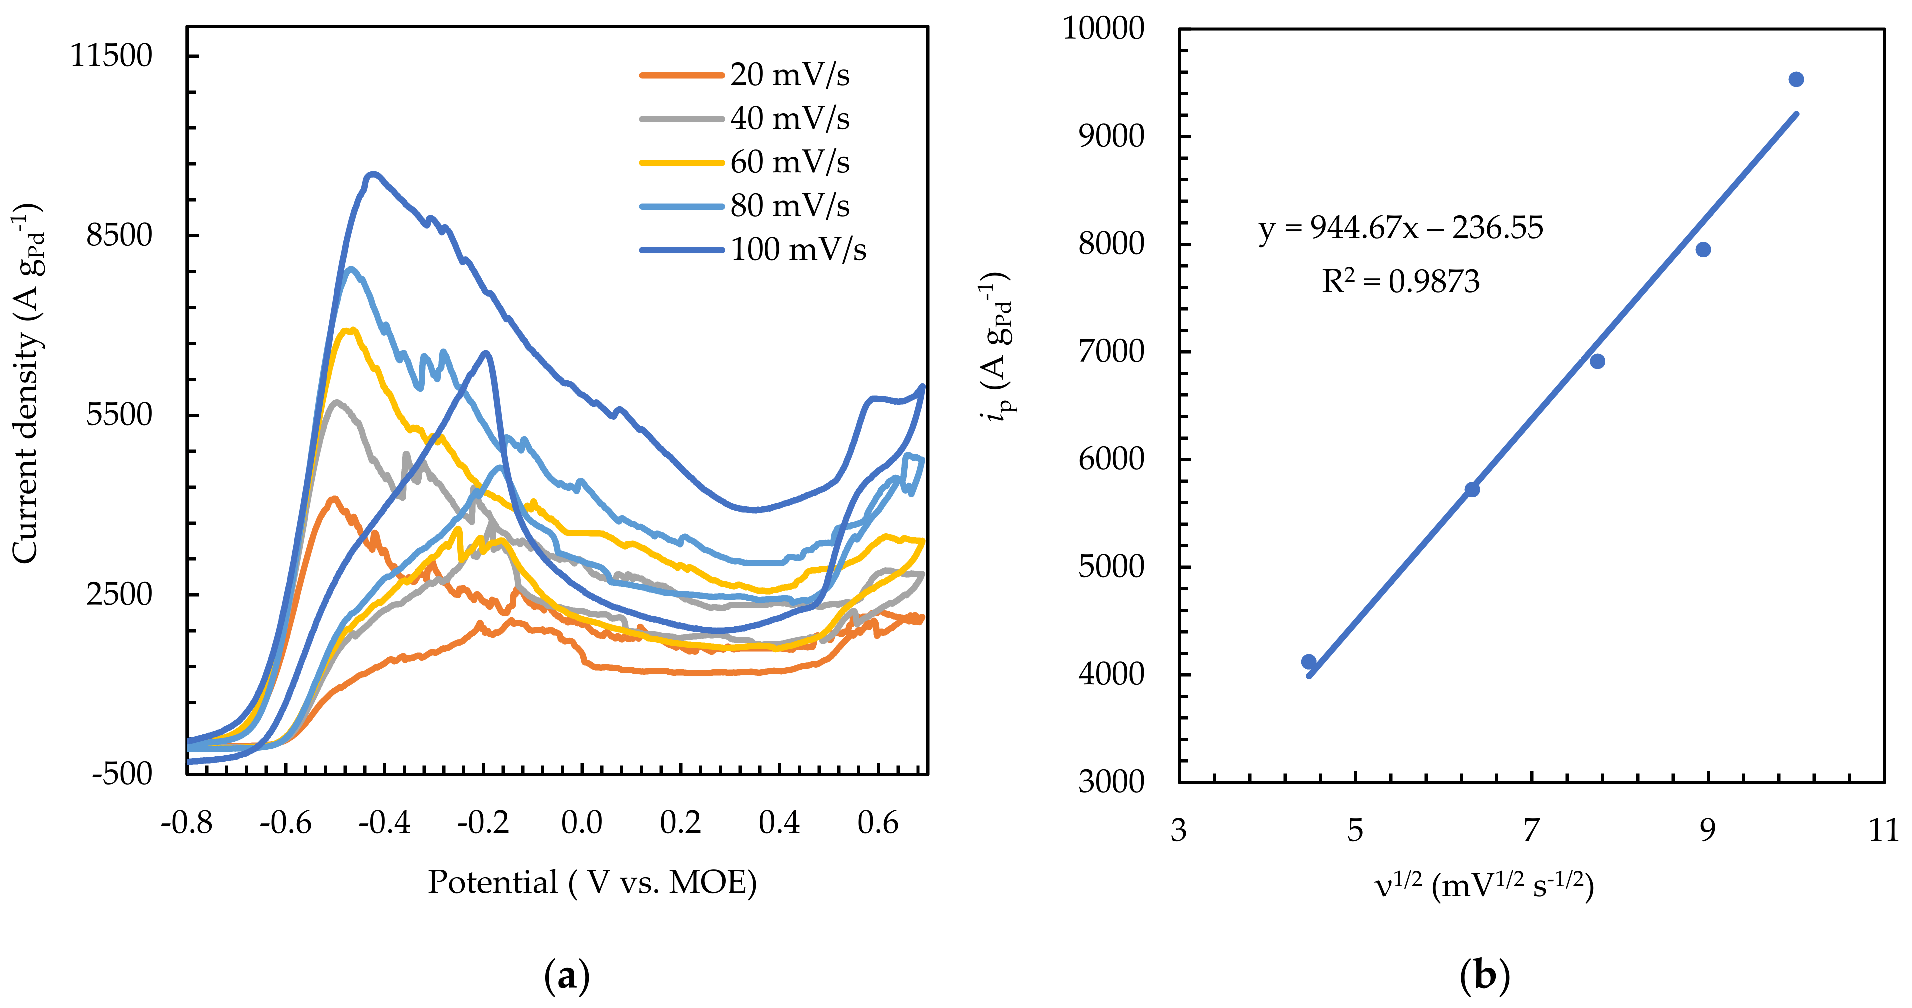
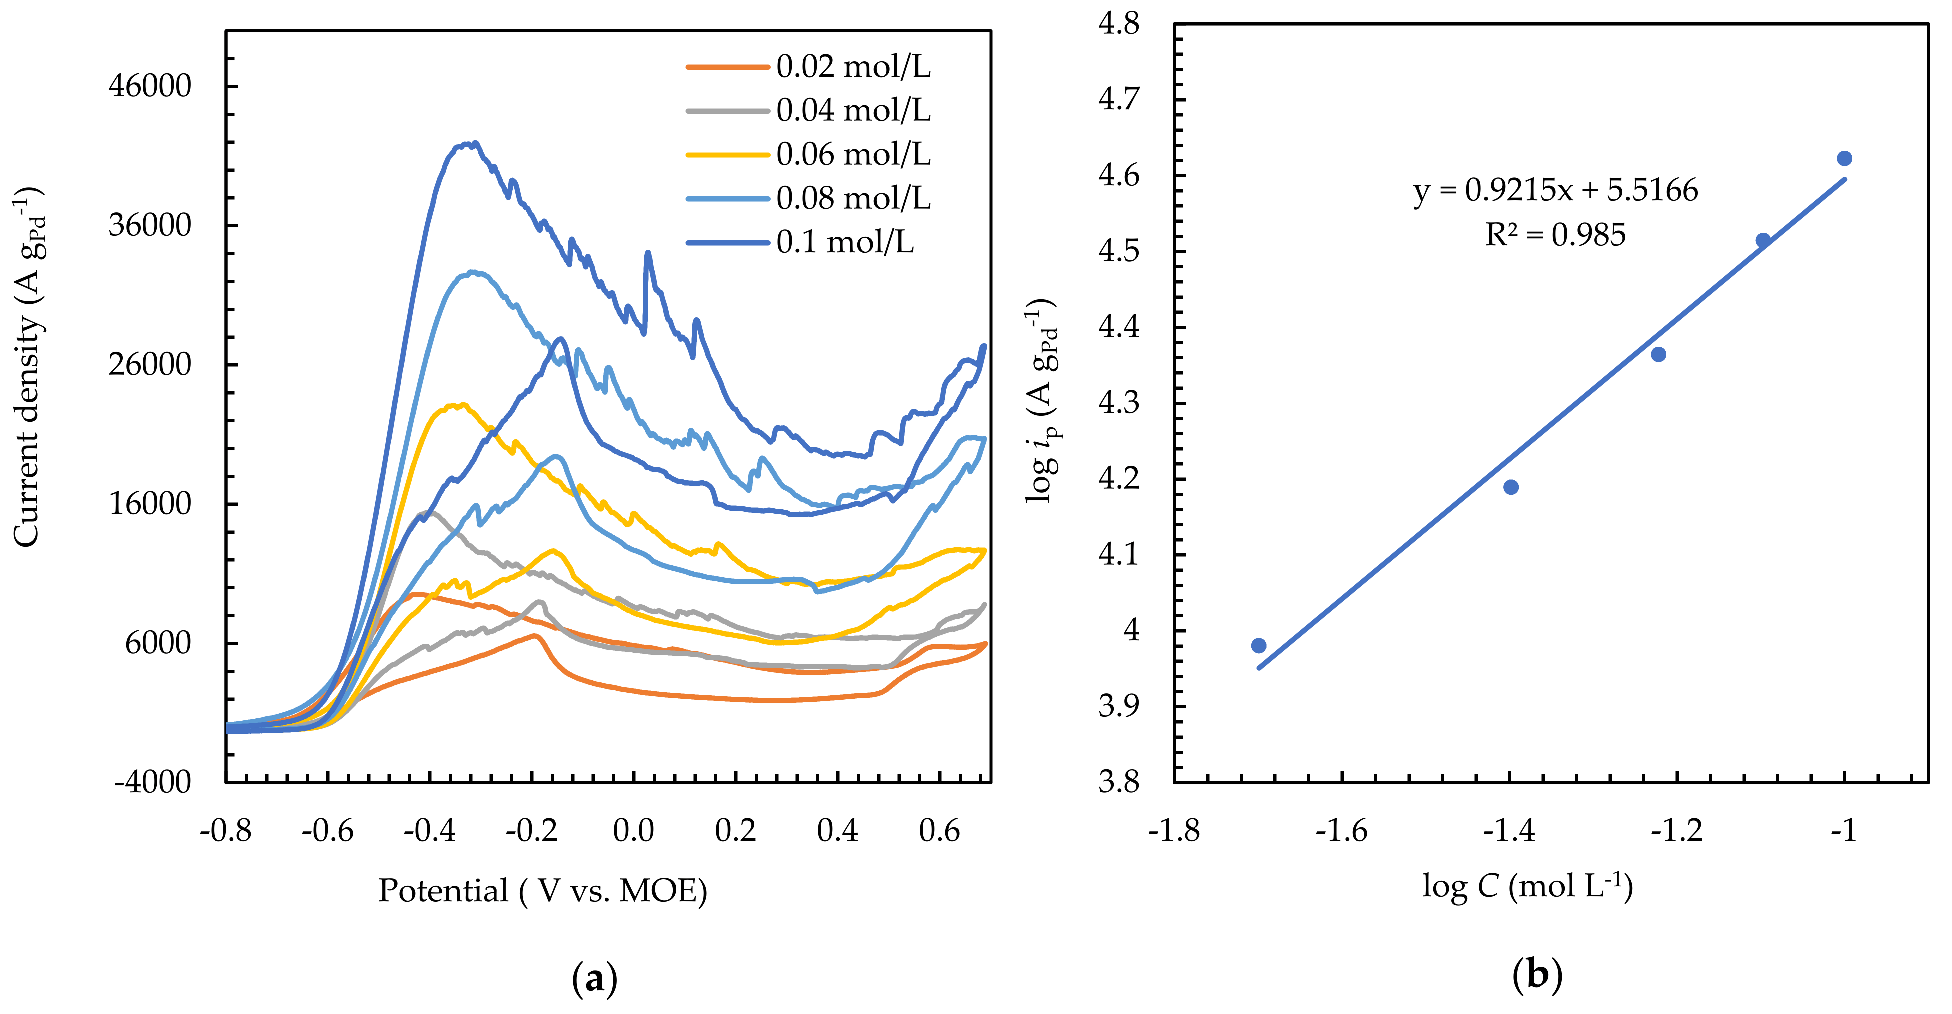
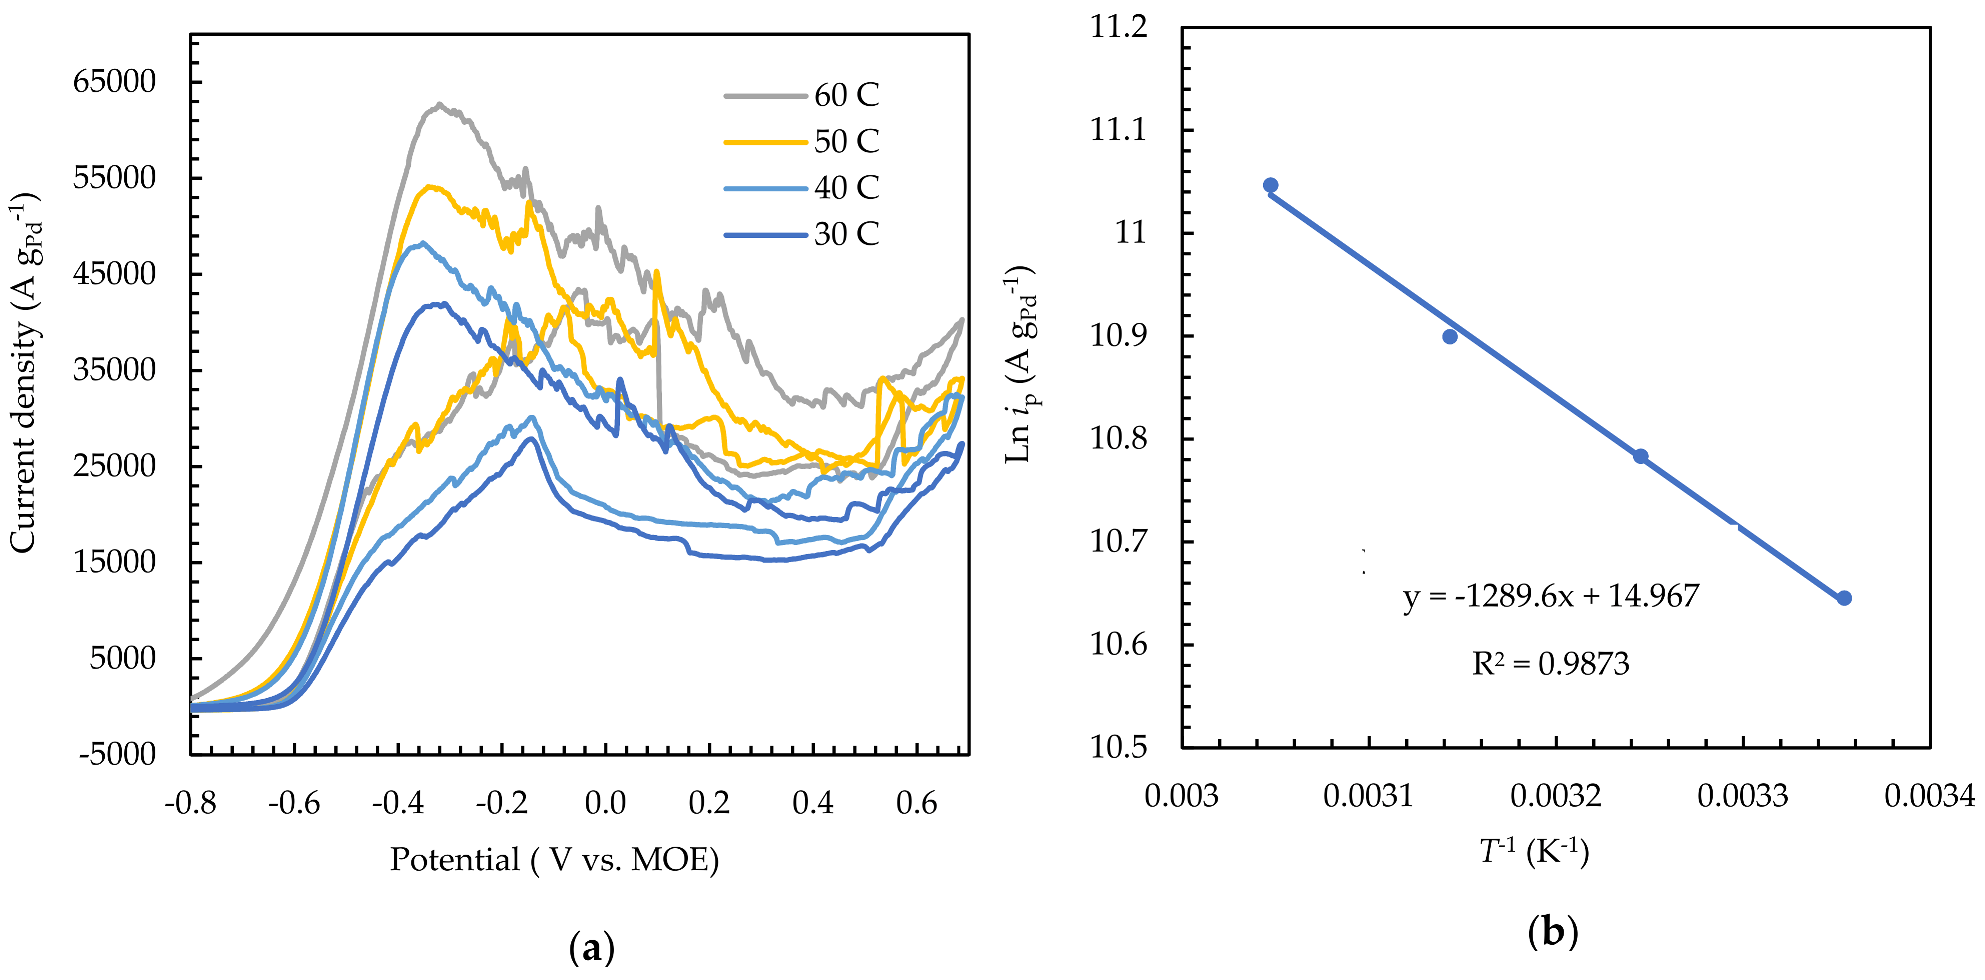
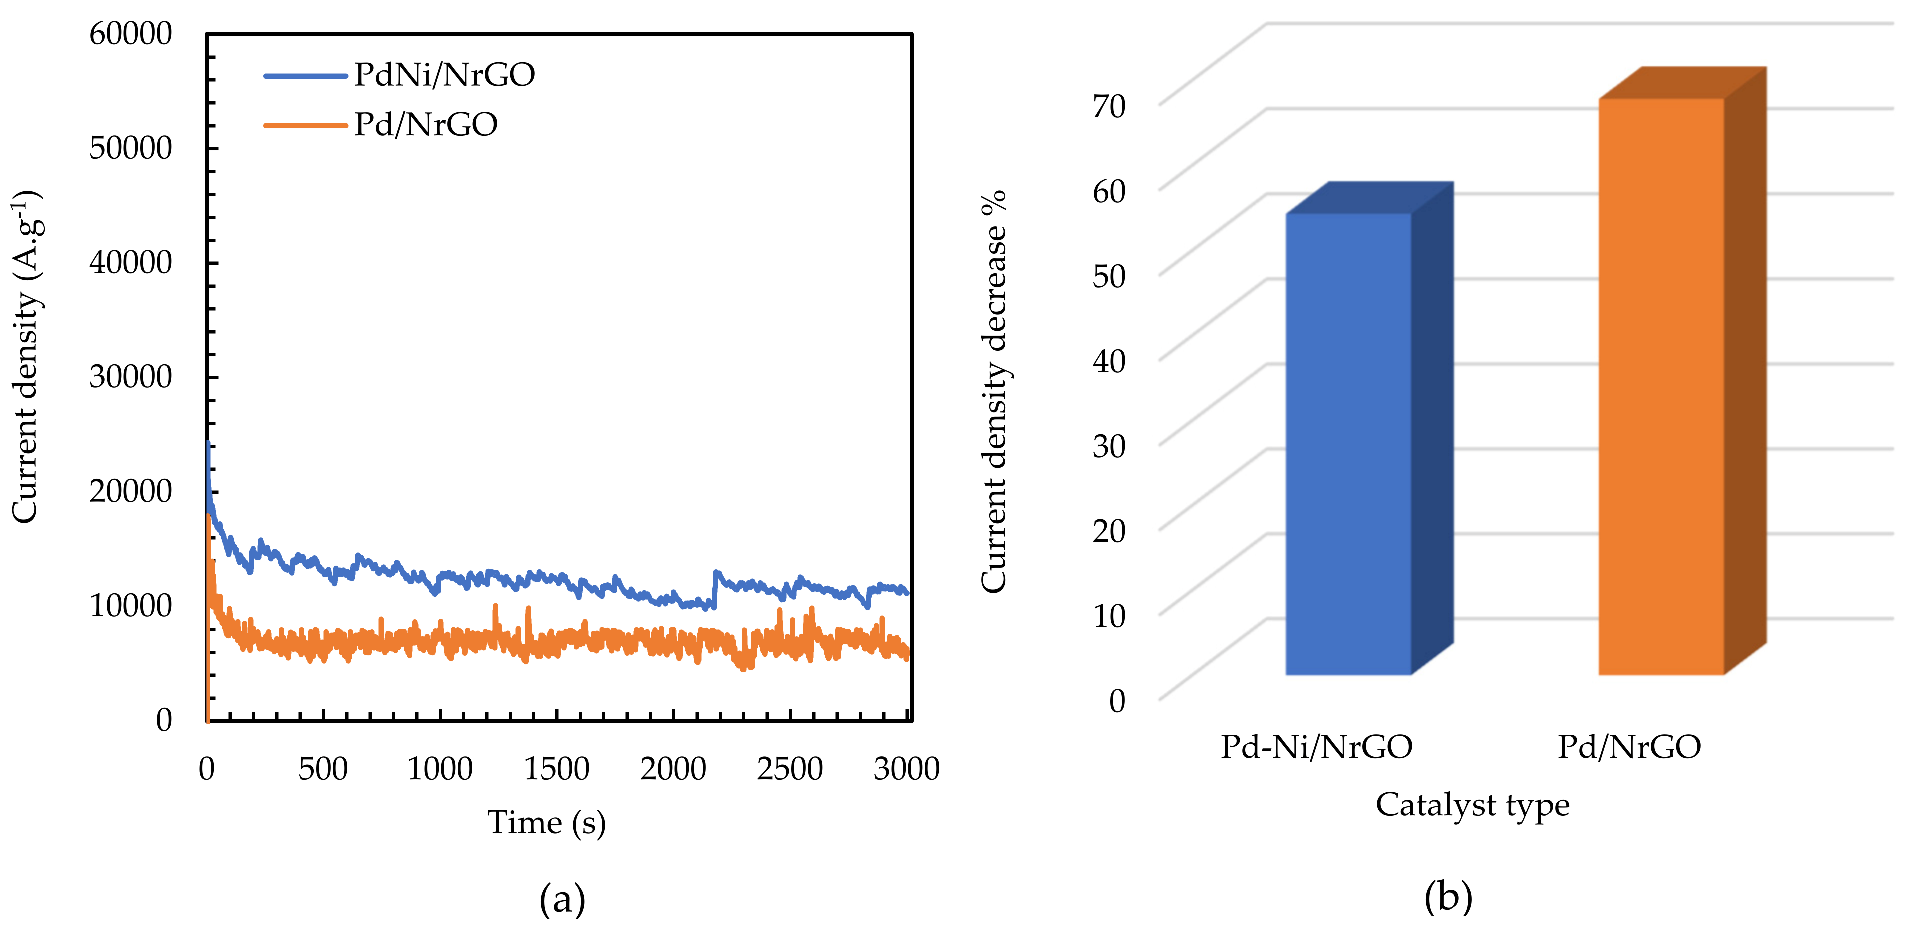
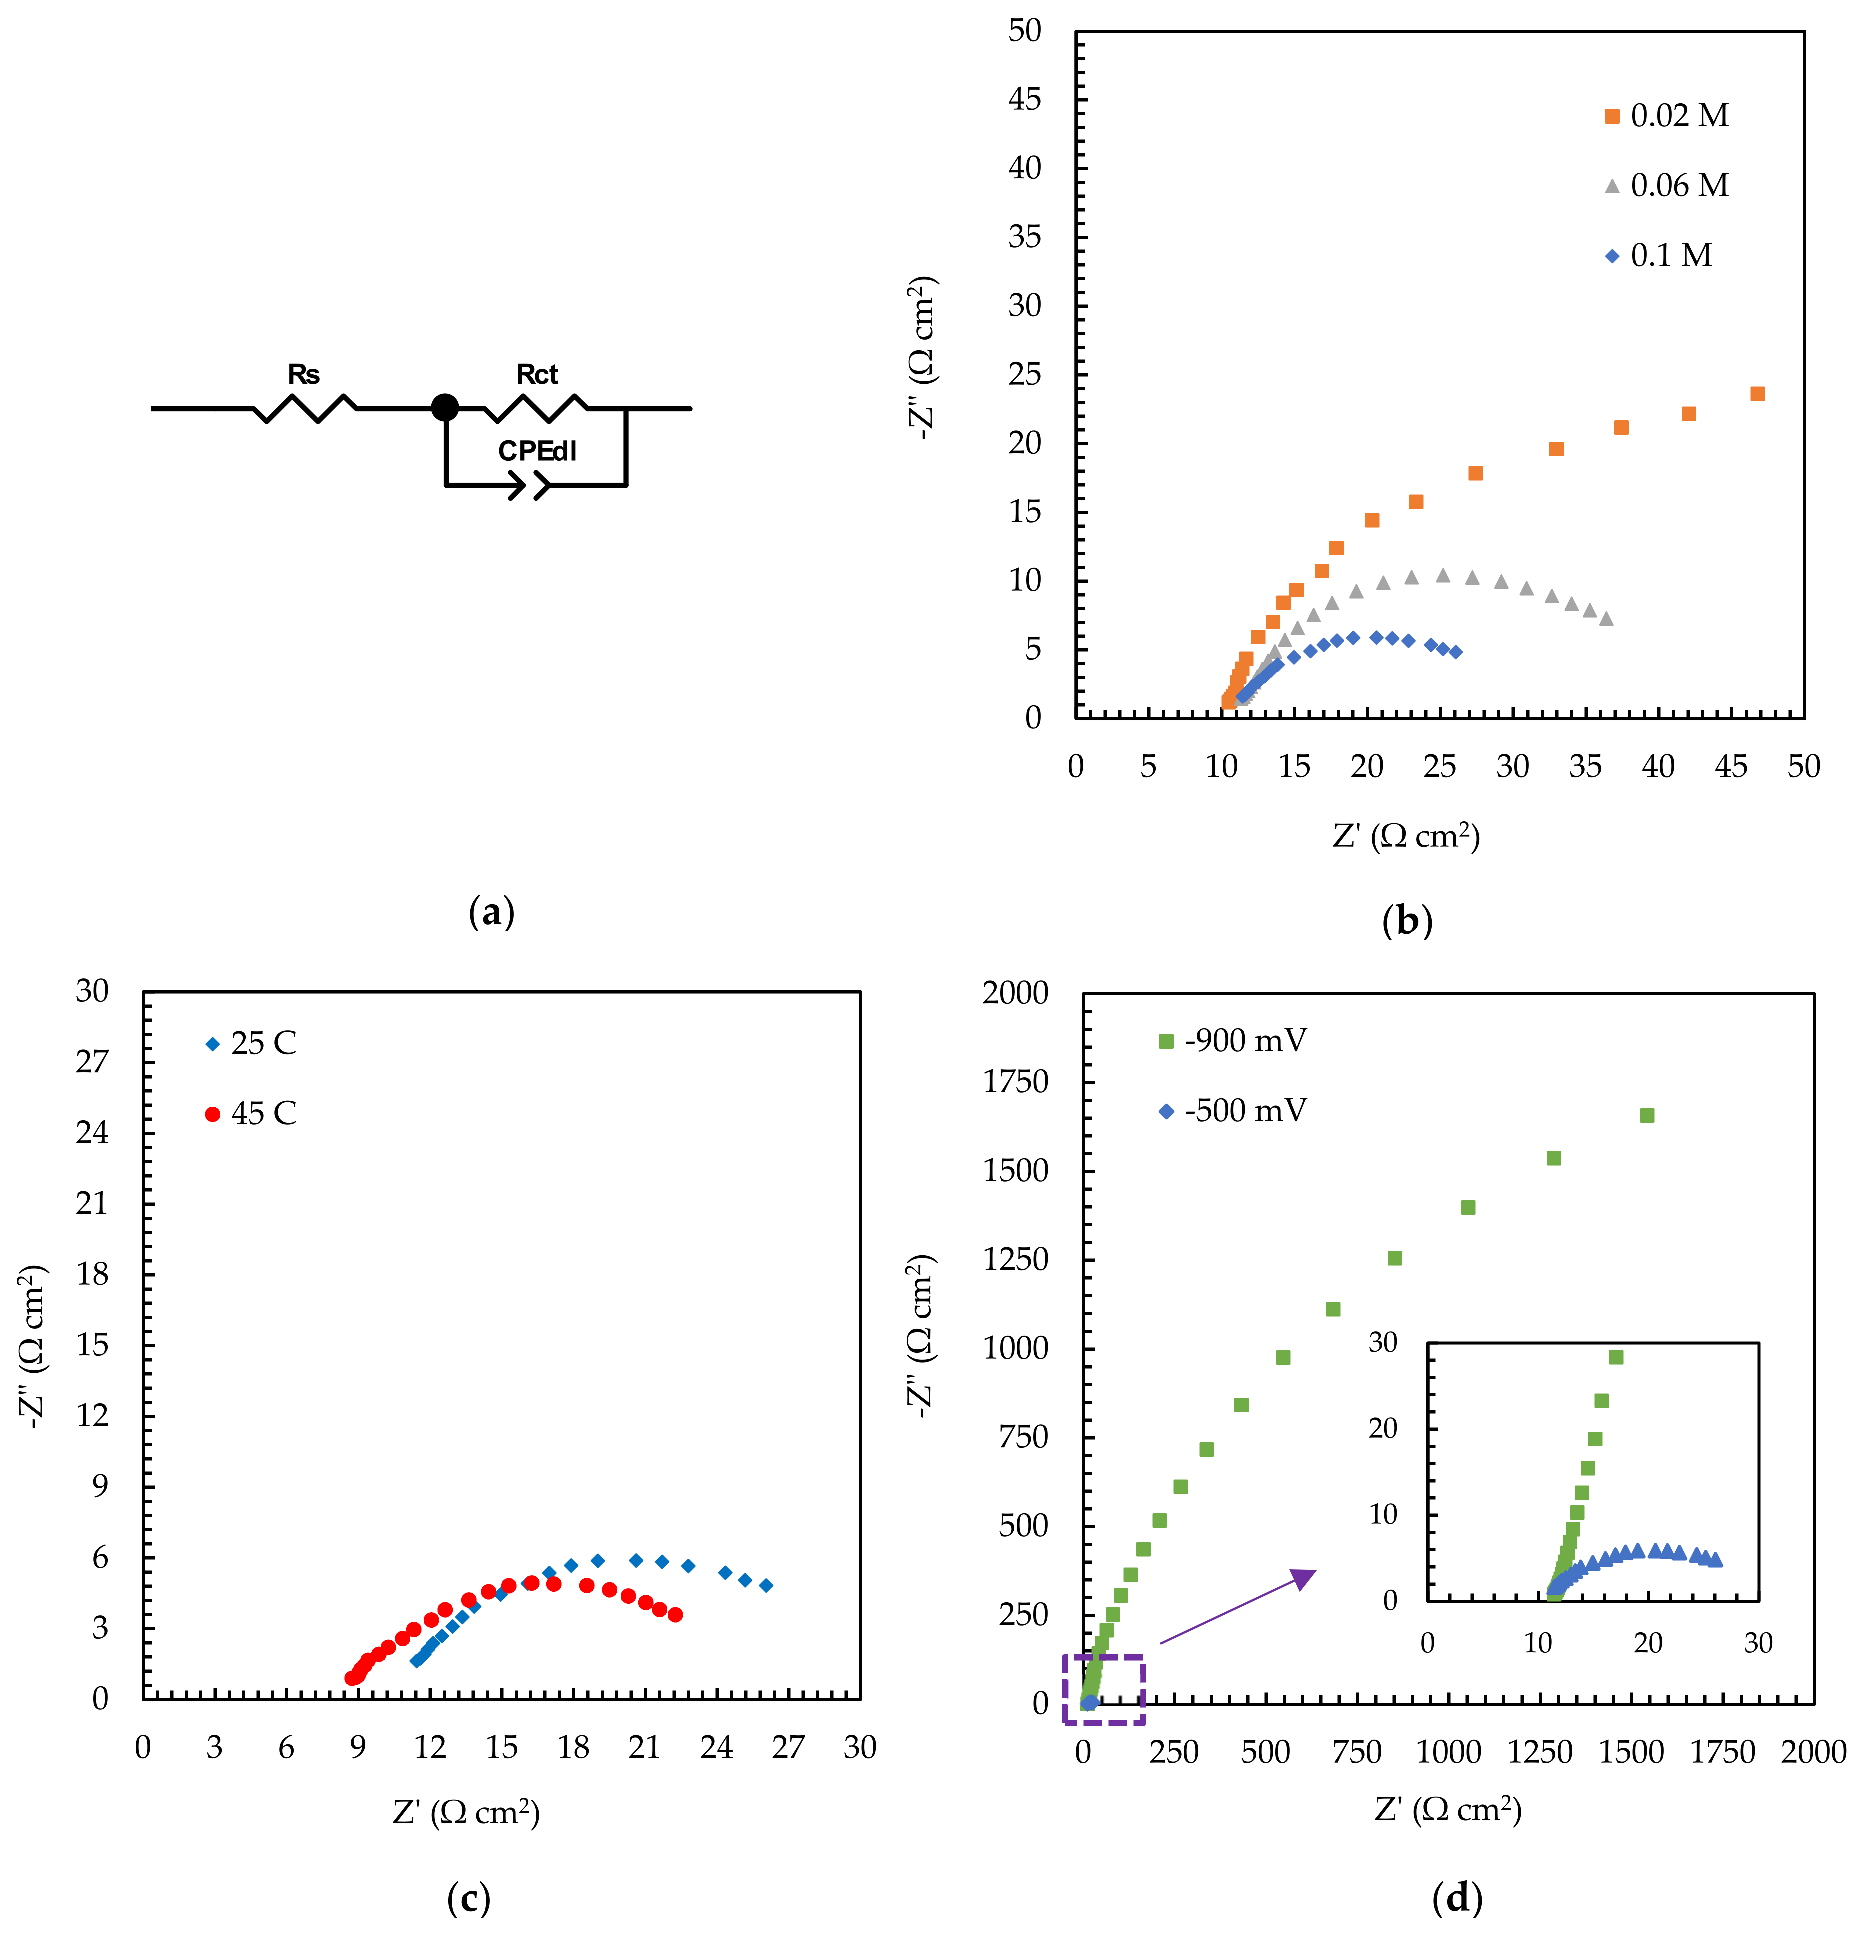
2.2. Half-Cell Measurements

CV is employed for the determination of the catalytic activity of Pd–Ni/NrGO against HzOR. In this respect, the CVs of the NrGO in the presence and absence of N2H4 0.02 mol L−1 are recorded at a sweep rate of 100 mV s−1 and presented in Figure 3a. No obvious peak is seen in each solution, confirming a capacitive current background without any perceptible faradaic processes and inactivity of NrGO against HzOR.
The CV method has been used recently for the investigation of borohydride oxidation reaction kinetics that occurred on the bimetallic Pd-based nanocatalysts and also for the calculation of their electrochemical active surface area (ECSA), which determines the electrode kinetics for various redox reactions taking place at the electrode surface. Following on from previous work [39], we decided here to record again the CVs of the Pd–Ni/NrGO and Pd/NrGO in NaOH 1.0 mol L−1 with a sweep rate of 100 mV s−1, as seen in Figure 3b. In both plots, hydrogen desorption and adsorption peaks (a1 and C1) are observed from the −0.75 to −0.3 V potential range in the forward and backward sweeps, respectively. The peaks shown in the potentials above 0.35 V (a4) are related to the palladium oxide formation peak, while the palladium oxide reduction peak is seen at the potential window of −0.2 to −0.4 V in the backward scan.
The first peak in the anodic scan (a2) is observed at a potential of 0.03 V which can be assigned to the reaction: Ni + 2 OH α Ni ( OH ) 2 + 2 e , followed then by an irreversible transformation of α-Ni(OH)2 to β-Ni(OH)2 (a3) by moving to the more positive potentials. The same behavior has been recently reported in the literature [54]. Once the β phase is produced, it cannot be electrochemically removed/reduced from the surface of the electrode because of its high electrochemical stability [54]. By increasing potential, the next increase in the anodic current density (a5) is seen at a potential of (0.4–0.6) V; this may be attributed to the electrochemical conversion of Ni+3/Ni+2, where β-Ni(OH)2 is oxidized to β-NiOOH. In the cathodic region, at the potential +0.4 to +0.6 V, the β-NiOOH is reduced to β-Ni(OH)2 (c3). These reduction and oxidation peaks (a5 and c3) correspond to the reversible conversion of Ni+3/Ni+2, as described with Equations (4)–(6) [54,55]:
Ni OH 2 +   OH     NiOOH   +   H 2 O +   e
NiO   +   OH     NiOOH   +   e
Ni   +   3 OH   NiOOH   +   3 e
The area of the PdO reduction region in the CVs plotted in Figure 3b is utilized to compute the electrochemical active surface area (ECSA) of Pd/NrGO and Pd–Ni/NrGO catalysts. As is known, a high value of ECSA for each electrocatalyst reveals a high number of electrocatalytic active sites and vice versa. Thereby, the HzOR kinetics at various Pd-based electrodes is controlled with the ECSA [56]. The ECSA of Pd-based catalysts is computed with Equation (7) [33].
ECSA = Q PdO 0.405 × [ Pd ]
QPdO denotes the coulombic charge (mC) and it is computed by integrating of the palladium oxide reduction peak; the value of 0.405 is the conversion factor (mC cm−2) that corresponds to palladium oxide reduction; [Pd] is related to the loading amount of the Pd-based catalyst. The calculated ECSA for two synthesized catalysts is given in Table 1. It is noticed that the ECSA for Pd–Ni/NrGO is 2.61 times higher than that of Pd/NrGO; thus, the existence of Ni atoms in bimetallic catalysts significantly alters the electronic structure of Pd and its electrochemical activity.
Cyclic voltammograms of Pd–Ni/NrGO and Pd/NrGO catalysts in NaOH 1.0 mol L−1 containing N2H4 0.02 mol L−1 at the sweep rate of 100 mV s−1 are presented in Figure 3c. A dramatic change can be seen in comparison to the CVs recorded in the absence of N2H4. The peak of HzOR for the Pd–Ni/NrGO and Pd/NrGO electrocatalysts is seen at a potential window of −0.6 to −0.4 V. The following reaction describes the peak of HzOR for the synthesized catalysts.
N 2 H 4 +   4 OH     N 2 +   4 H 2 O   +   4 e
As reported in Table 1, the current density of HzOR on the Pd–Ni/NrGO (12,360.50 A g−1) is 1.81 times higher than that of Pd/NrGO (6821.22 A g−1). In addition, the reported onset hydrazine oxidation potentials in Table 1 show a more negative value for the Pd–Ni/NrGO (−0.45 V) than the Pd/NrGO (−0.40 V). It can be concluded that embedding Ni atoms into the Pd network not only reduced the preparation cost but also enhanced the catalytic performance due to the synergistic effects between Pd and Ni along with an increment in the effective surface area of this electrode.
To obtain more information regarding the electrochemical kinetic parameters of the Pd–Ni/NrGO electrode, CVs were recorded at several scan rates. Figure 4a presents the CV curves in an aqueous solution of NaOH 1.0 mol L−1 containing N2H4 0.02 mol L−1 at various sweep rates. According to this Figure, the anodic current (ip) increases by increasing the scan rates. At the same time, the peak potential is moved to more positive values, suggesting an irreversible electrochemical process [57]. Equation (9) describes the relationship between peak potential, Ep (V), and sweep rate, v (V s−1), for an irreversible electrochemical process [58]:
E p = E 0 + RT 1 α nF 0.78 + ln D 0 k s + ln 1 α nFv RT 1 2
where E0, R, T, α , F, and D0, are the standard potential (V), gas constant (8.314 J K−1 mol−1), temperature (K), charge transfer coefficient, Faraday constant (96,485 C mol−1), and diffusion coefficient of N2H4 (cm2 s−1), respectively. n corresponds to the number of transferred electrons in the rate-determination step. ks denotes the standard heterogeneous rate constant (cm s−1). When the IP values are established in terms of the square root of the scan rate ( v 1 2 ), a linear relation is observed (as detailed in Figure 4b), suggesting a diffusion-controlled process for the electrooxidation of N2H4. By increasing scan rates, the number of electrochemically active species and the length of the diffusion path through penetration of the reaction zone from the electrode surface into the inner parts are increased [59]. The relation between ip and the sweep rate along with the other influencing parameters on the IP values can be represented with Equation (10) [59]:
i p = 2.99 × 10 5 n α n 1 2 AD 0 1 2 v 1 2 c 0
n α = 1.857 RT F E p E p 2
In this relation, A and Ep/2 are the electrode surface area (cm2) and half-peak potential (V), respectively. c 0 refers to the bulk concentration of electroactive species [60].
The concentration of N2H4 was optimized during the electrooxidation of N2H4 on the Pd–NrGO catalyst. The recorded CV curves in a solution of NaOH 1.0 mol L−1 and various concentrations of N2H4 at a sweep rate of 100 mV s−1 are represented in Figure 5a. The HzOR peak potential is shifted slightly towards positive values by increasing N2H4 concentration and the highest ip value is obtained at N2H4 0.1 mol L−1. This observation may be explained by the existence of a large number of electroactive species in solution. According to Equation (10), it is expected that the anodic current density will increase with increasing N2H4 concentration, as observed in Figure 5a [61]. By plotting log ip values in terms of log [ N 2 H 4 ] , a straight linear relationship is obtained (Figure 5b). The order of the N2H4 oxidation reaction on the Pd–Ni/NrGO catalyst is calculated from the slope of the log ip vs. log [ N 2 H 4 ] plot (Figure 5b) according to Equations (12) and (13):
Rate = i p = k [ N 2 H 4 ] β
log i p = log k + β log [ N 2 H 4 ]
where k, [N2H4], and β are the reaction rate constant and the bulk concentration of N2H4, and reaction order, respectively. The value of 0.92 on Pd–Ni/NrGO, which is close to a typical value of 1 reveals a first-order reaction for HzOR with this catalyst and is consistent with the values reported in other works [62].
Electrolyte temperature also influences the performance of electrodes with the effect that it has on the rate of the charge transfer process in the electrode/electrolyte interface and mass diffusion in electrolyte solutions. Figure 6a reveals the CV curves of Pd–Ni/NrGO at different temperatures in an aqueous solution of 1.0 mol L−1 NaOH containing 0.1 mol L−1 N2H4. All CV curves have similar shapes, which suggests the same reaction mechanisms at the investigated temperatures. The current density of the Pd–Ni/NrGO catalyst increases by raising the temperature from 25 to 35, 45, and 55 °C. This is due to the endothermic reaction that takes place at the Pd–Ni/NrGO electrode surface. The activation energy (Ea, J mol−1) can be calculated by the Arrhenius equation (Equation (14)) [63]:
E a RT 2 = ln i p T
Arrhenius plots of the Pd–Ni/NrGO catalyst are plotted in Figure 6b. The Ea value for this catalyst is obtained as 10.72 kJ mol−1. The low value of Ea for the Pd–Ni/NrGO catalyst reveals that the electrooxidation of hydrazine occurs easily for this catalyst, which may be ascribed to its large specific surface area and massive catalytic active sites offered due to the unbeatable morphology of NrGO supported Pd–Ni nanoparticles.
CA is a powerful electrochemical technique for surveying the stability and catalytic performance of electrodes. Figure 7 presents the CA curves for hydrazine electrooxidation in a NaOH 1.0 mol L−1 + N2H4 0.1 mol L−1 solution under a potential of −0.5 V vs. MOE. In the beginning, a sharp oxidation current is seen for each electrode, which relates to the free active sites of these electrodes from adsorbed molecules. After a few seconds, the oxidation current is reduced, which may be related to the occupation of the active sites. According to Figure 7a, the current density of Pd–Ni/NrGO (~11,100 A g−1) is higher than that of Pd/NrGO (~5770 A g−1) after stabilization for 3000 s. Furthermore, the resulting current density percentage decrease for Pd–Ni/NrGO (54.31%) is lower than that of Pd/NrGO (67.80%) (as seen in Figure 7b), suggesting the better durability of Pd–Ni/NrGO compared to Pd/NrGO. The results obtained from the CA analysis are consistent with the CV results.
EIS is utilized to explore the electron transfer kinetics of Pd–Ni/NrGO towards HzOR. Nyquist plots were recorded in NaOH 1.0 mol L−1 containing N2H4 x mol L−1 (x: 0.02, 0.06, and 0.1) at different potentials (−0.5 and −0.9 V) and various temperatures (25 and 45 °C), and the results are displayed in Figure 8.
The EIS data obtained are fitted by an equivalent circuit depicted in Figure 8a. The elements of Rs, Rct, and CPEdl in the equivalent circuit depict electrolyte solution resistance, charge transfer resistance, and the constant phase element of the electrical double layer, respectively. The intersection of impedance spectra (Figure 8b–d) with the x-axis at high frequencies is the electrolyte solution resistance, and it corresponds to the ohmic resistance of the electrolyte between the anode and the reference electrode, the anode ohmic resistance, and the contact resistance. The high-frequency semicircle relates to the charge transfer of the HzOR that has taken place on the anode electrode. Table 2 summarizes the obtained charge transfer resistances of the Pd–Ni/NrGO catalyst towards HzOR.
In accordance with Figure 8b–d, a low circle diameter is observed for the synthesized catalyst, indicating a low Rct value and thereby a fast charge transfer on the Pd–Ni/NrGO. By increasing the N2H4 concentration (Figure 8b), at T = 25 °C and a potential of −0.5 V, the Rct values are reduced, which may be attributed to the increment reaction kinetics by raising the sorption of N2H4 on the electrode surface. A decrease in Rct is seen in Figure 8c with increasing temperature at a potential of −0.5 V and N2H4 0.1 mol L−1, and this suggests that the charge transfer rate is promoted at the electrode/electrolyte interface at high temperatures. As presented by the fitting results in Figure 8d, under T = 25 °C and N2H4 0.1 M, the Rct is reduced from 44.22 to 22.03 with an enhancement of the polarization potential from −0.9 to −0.5 V. The reason for this observation could be the faradaic reactions that occurred at the potential of −0.5 V. No faradaic reaction occurs, however, at the potential of −0.9 V. All results obtained from EIS measurements are consistent with the CV results.

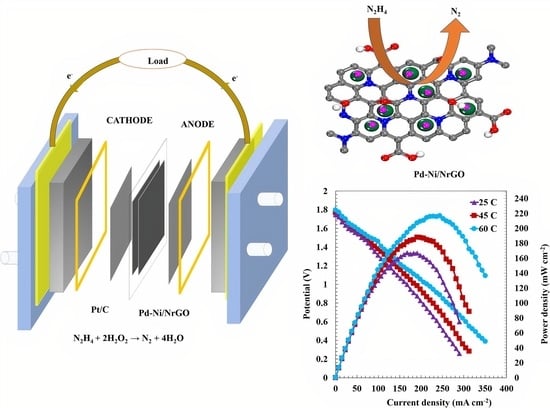
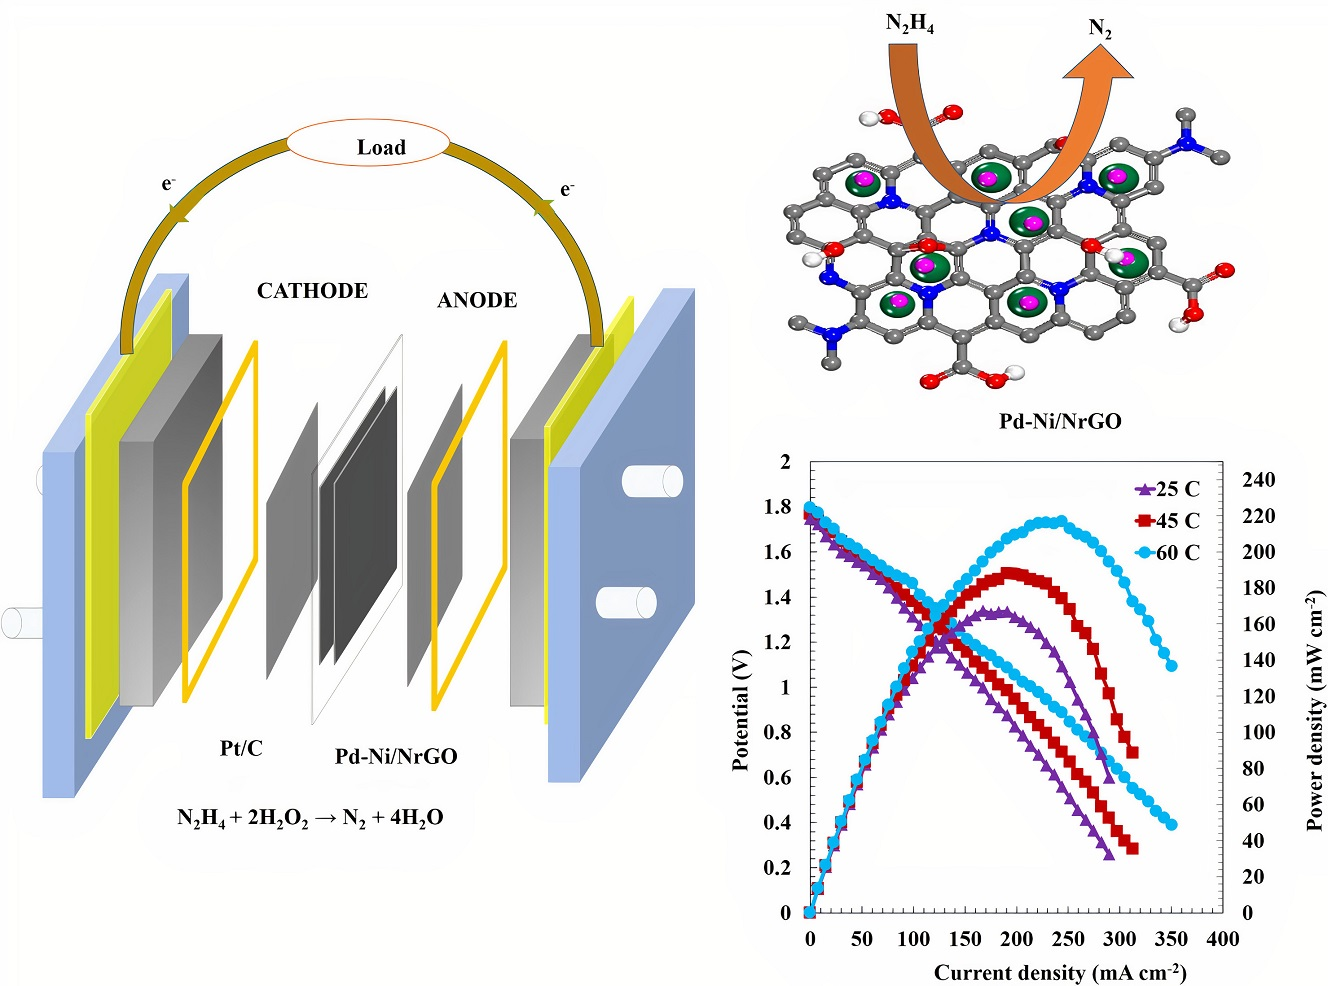
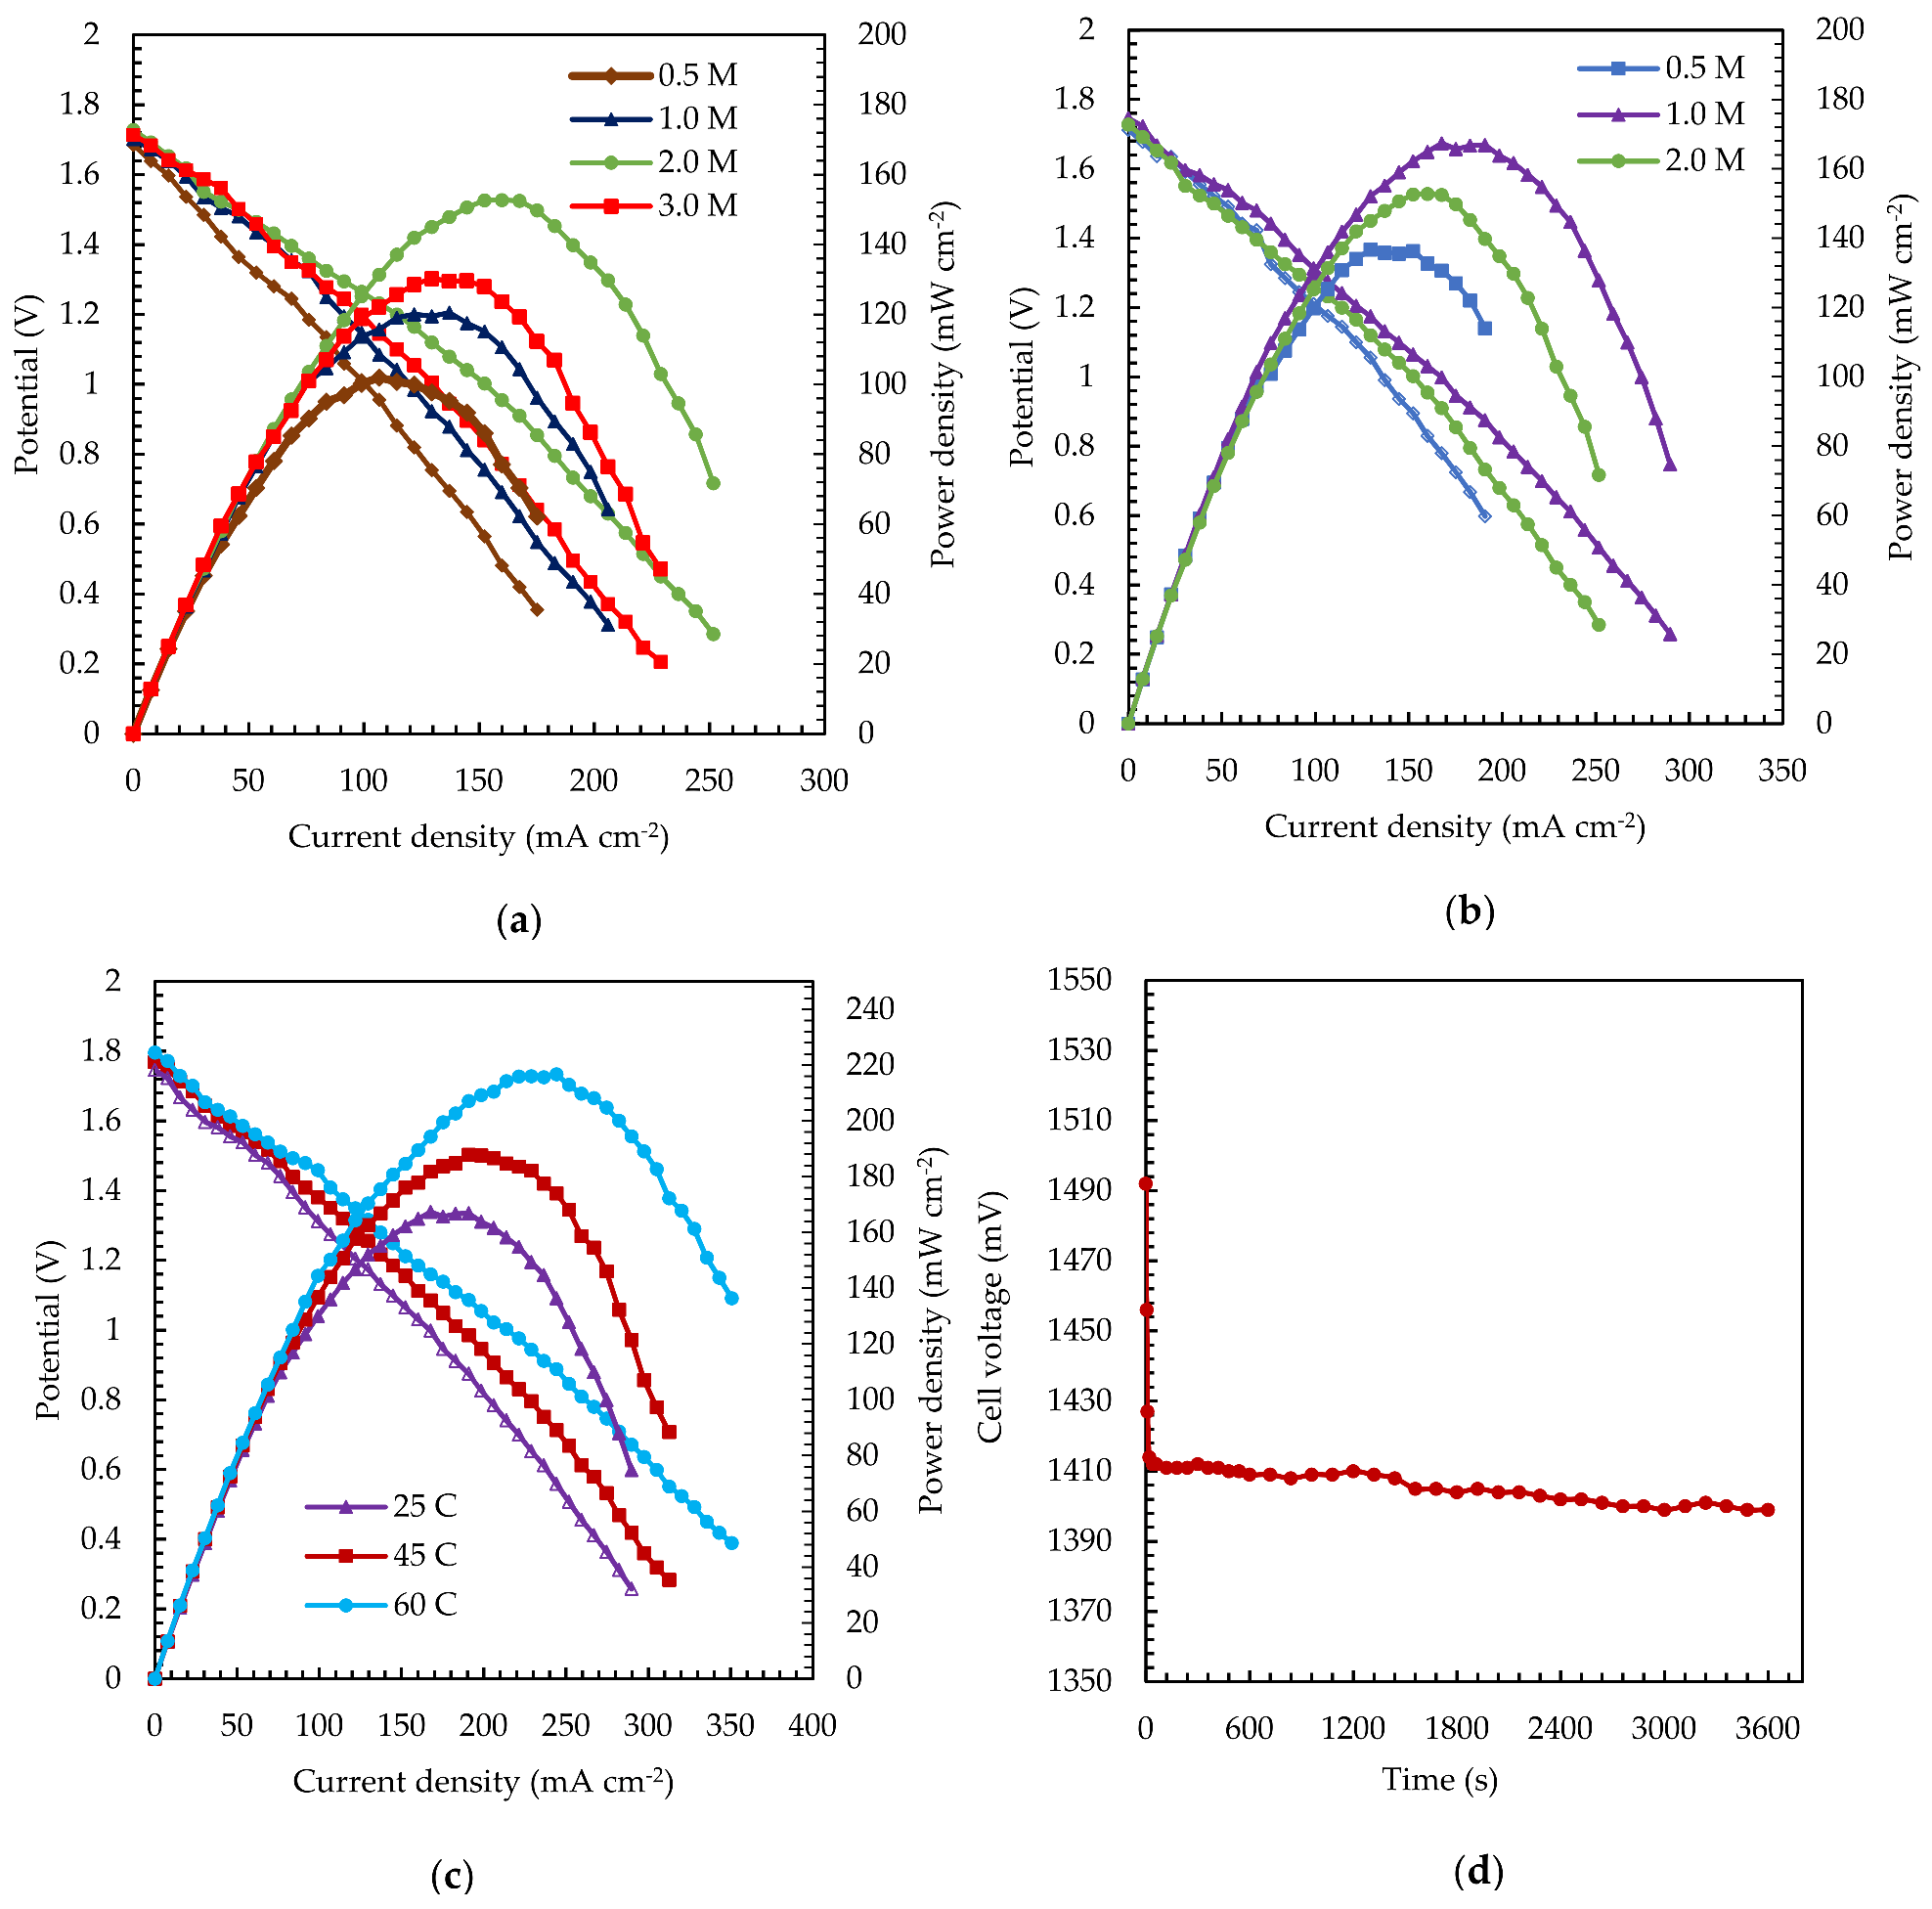
2.3. Single-Cell Tests

The performance of Pd–Ni/NrGO in a DHzHPFC using H2SO4 0.5 mol L−1, with several oxidant concentrations, and NaOH 2.0 mol L−1, with various fuel concentrations at three temperatures, was evaluated by monitoring the power density curves (I–P curves) and polarization curves (I–V curves). Figure 9 depicts the I–P and I–V curves of DHzHPFC assembled with Pd–Ni/NrGO (1.0 mg cm−2) as an anode and Pt/C (0.5 mg cm−2) as a cathode under several operating conditions. Taking the electrode reaction and the Nernst equation (Equation (15)) into account, the OCP is enhanced with the increment of H2O2 concentrations (Figure 9a). Thus, the maximum power density (MPD) is enhanced from 101.93 mW cm−2 to 120.50 and 152.74 mW cm−2 by increasing the concentration of H2O2 from 0.5 M to 1.0 and 2.0 mol L−1, respectively. The MPD is reduced to 130.25 mW cm−2, however, by a further increase in the H2O2 concentration to 3.0 mol L−1. This may be due to the fast chemical decomposition of H2O2 and its crossover from the membrane and also the poisoning of the electrode surface by the attachment of gas bubbles produced from H2O2 decomposition [4,11,64] at a high H2O2 concentration (i.e., above 3.0 mol L−1). H2O2 2.0 mol L−1 is thus chosen as the optimum concentration at which the cell performance reaches its maximum.
E = E 0 + RT nF ln [ N 2 H 4 ] [ H 2 O 2 ] 2 [ N 2 ] [ H 2 O ] 4
To optimize the concentration of N2H4, three concentrations of 0.5, 1.0, and 2.0 mol L−1 were tested and the results are presented in Figure 9b. It can be perceived that the MPDs increased from 136.72 to 167.38 mW cm−2 by incremental N2H4 concentrations from 0.5 mol L−1 to 1.0 mol L−1. Additionally, the anode potential and cell OCP are enhanced with raising N2H4 concentrations, which may be explained based on the electrode reaction and Nernst equation. The fuel diffusion and the oxidation kinetics of N2H4 are promoted with an increased N2H4 concentration. However, the MPD is reduced to 152.74 mW cm−2, at which the N2H4 concentration is 2.0 mol L−1 as a consequence of increasing hydrolysis of N2H4 and its crossover [4,65,66].
As presented in the electrochemical tests, the performance of the Pd–Ni/NrGO catalyst is very sensitive to temperature. In this context, the DHzHPFC performance at different temperatures was also examined and the obtained results are presented in Figure 9c. Varying the temperature from 25 to 45 and 60 °C, DHzHPFC presents an enhanced peak power density from 167.38 to 187.87 and 216.71 mW cm−2, respectively. The high values of OCV and MPD reveal that the kinetics of N2H4 oxidation and H2O2 reduction is promoted with an enhanced temperature [24]. The achieved MPDs for the Pd–Ni/NrGO electrocatalyst at various N2H4 concentrations, H2O2 concentrations, and temperatures are reported in Table 3. A comparison of DHzHPFC performances for different reported anode catalysts in the literature is provided in Table 4. As seen in this Table, the Pd–Ni/NrGO electrocatalyst exhibits an equal or greater catalytic performance, suggesting that Pd–Ni/NrGO is an excellent anode electrocatalyst in DHzHPFC applications.
Stability is a vital parameter in the determination of DHzHPFC performance. In Figure 9d, stability tests were adopted for a single cell with the Pd–Ni/NrGO as an anode, Pt/C as a cathode, NaOH 2.0 mol L−1 + N2H4 1.0 mol L−1 as an anolyte, and H2SO4 0.5 mol L−1 + H2O2 2.0 mol L−1 as a catholyte at a constant current of 90 mA cm−2 and 25 °C. It can be noticed that after a potential decay in the first seconds, it maintained a relatively stable value during the test. The observed oscillation in the cell voltage may be related to the addition of new fuel solution, restarting the measurements, possible minor changes in cell temperature, the oxygen produced from H2O2 decomposition at the cathode, or the hydrogen produced from the hydrolysis of N2H4 at the anode. It is evident that the produced gas bubbles cumulate on the electrode and so block the transfer of N2H4 or H2O2 solution, leading to instant loss of cell performance. As a result, the Pd–Ni/NrGO anode assembled DHzHPFC presents a relatively stable performance.

3. Experimental

3.1. Materials

The purity of the materials used for the synthesis of Pd–Ni/NrGO is given in Table S1. In all the experiments, double-distilled deionized water (0.055 μS cm−1) was used to prepare solutions and all materials were of analytical grade.

3.2. Methods

Production of a Pd–Ni/NrGO electrocatalyst. Firstly, the GO was synthesized using a modified Hummers method [71]. More details of GO preparation are provided in the Supplementary Information. NrGO was produced by the addition of 1.5 g urea to 200 mL GO suspension (2.5 mg mL−1 in H2O) and stirred for 120 min. After the elimination of the solvent with a rotary evaporator, the resultant solid was conveyed into a tubular furnace and treated at 800 °C under an N2 atmosphere for 45 min. The obtained powder was cooled to ambient temperature under constant N2 flow and designated as NrGO. After that, appropriate amounts of NiCl2.6H2O (35.0 mM) and PdCl2 (32.0 mM) were put into 160.0 mL of NrGO suspension (0.5 mg mL−1 isopropanol and distilled water (v/v: 4/1)) under ultrasonication. The pH was adjusted to 10.0 by gradually adding 20.0 mL of NaOH solution containing 150.0 mg of NaBH4 to the suspension at 90 °C. The mixture was then refluxed at 99 °C for 240 min. The Pd–Ni/NrGO precipitate was filtered using Whatman filter paper, rinsed with water, and then dried.

3.3. Physical and Electrochemical Characterization

FTIR (PerkinElmer, Waltham, MA, USA, (300–4300 cm−1)) was used to analyze the nature of chemical bonds in terms of functional groups of the GO and NrGO samples. SEM (MIRA3FEG-SEM, Tescan, Brno, Czech Republic) and TEM (PHILIPS, Amsterdam, The Netherland, CM 120) were utilized to determine the surface morphology of the Pd–Ni/NrGO catalyst, along with the characterization of elemental distribution on the surface of synthesized materials, using EDX. The crystallographic structure of the synthesized catalyst was investigated by XRD (PHILIPS, PW1730, Netherland).
All electrochemical tests were performed using a Gamry Potentiostat/Galvanostat/ZRA (Reference 600™, Warminster, PA, USA) in a three-electrode cell consisting of a platinized titanium rod as a counter electrode and Hg/HgO (MOE) electrode as a reference electrode. The working electrode was constructed by dropping a specific quantity of catalyst ink on a glassy carbon electrode (GCE, 0.196 cm2). The catalyst ink was provided by dispersing synthesized powders (5.0 mg) into isopropanol: water solution (v/v: 2/1) containing Nafion solution under ultrasonication for 120 min.
The electrochemical behavior of the samples was studied by CV, CA, and EIS techniques. CV tests were performed in NaOH 1.0 mol L−1 and N2H4 × mol L−1 (x: 0–0.1 mol L−1) at sweep rates of 20 to 100 mV s−1 and various temperatures (298.15–328.15) K. The CA tests were conducted in aqueous solutions of NaOH 1.0 mol L−1 + N2H4 0.1 mol L−1 at −0.5 V vs. MOE. All EIS tests were carried out in a frequency range of 105 to 10−1 Hz with an r.m.s amplitude of modulation potential of ±10 mV.

3.4. DHzHPFC Measurements

The MEA used for the DHzHPFCs performance test was produced using the CCM technique [72]. Before the compression process of the MEA, the Nafion®117 membrane surface was hydrothermally treated according to the procedure described in the literature [24]. The commercial Pt/C (0.5 mgmetal cm−2), as a cathode ink, and Pd–Ni/NrGO (1.0 mgPd cm−2), as an anode ink, were sprinkled directly on both sides of the treated membrane. The catalyst inks were supplied by ultrasonically mixing specific quantities of anodic catalyst, 2-propanol, H2O, and Nafion solution for 30 min. The as-manufactured catalyst-coated Nafion membrane was hot-pressed at 100 °C for 1.0 min, followed by heating at 80 °C for 15 min. Subsequently, the membrane was immersed in 2.0 mol L−1 NaOH for 3 days. Finally, the catalyst-coated membrane was assembled, together with the produced gas diffusion electrodes (GDE), and placed between two graphite blocks as flow plates (Scheme 1). An alkaline hydrazine solution was employed as the fuel on the anode side by using homemade pumps. On the cathode side, an acidic solution of H2O2 was used as the oxidizing agent. DHzHPFC performance experiments were carried out after cell activation and current density–potential (I–V) and current density–power density (I–P) curves were recorded at various cell conditions. The procedure used for the cell activation is explained in the supporting information.

4. Conclusions

The Pd–Ni alloy nanoparticles were successfully deposited onto the NrGO support using the electrochemical reduction method. FTIR and XRD spectroscopic studies successfully demonstrated nitrogen doping in GO. SEM, EDX, and TEM images also confirmed uniform dispersion of Pd–Ni nanoparticles with a narrow crystalline size in the range of 11–13 nm. The electrochemical properties of the Pd–Ni/NrGO and Pd/NrGO catalysts were investigated by employing CV, CA, CP, and EIS techniques, and the results proved that Pd–Ni/NrGO has a higher catalytic activity and a longer lifetime in comparison with Pd/NrGO. The results also indicated that the Pd–Ni/NrGO has a higher ECSA (166.38 m2 g−1) than that of Pd/NrGO (63.67 m2 g−1). Furthermore, the Pd–Ni/NrGO showed a higher catalytic activity toward hydrazine electrooxidation compared with Pd/NrGO; thus, the hydrazine oxidation current density on the Pd–Ni/NrGO (12,360.50 A g−1) was higher than that of Pd/NrGO (6821.22 A g−1). The low activation energy for the electrooxidation of hydrazine on the Pd–Ni/NrGO catalyst (10.72 kJ mol−1) revealed that the electrooxidation of hydrazine occurs readily on this catalyst. The results of the DHzHPFC setup showed a high maximum power density in the range of 216.71 mW cm−2 under optimal conditions. In summary, this work has demonstrated that the unique Pd–Ni/NrGO catalyst has promise as a potential anode electrocatalyst for DHzHPFC applications.

Supplementary Materials

The following are available online at https://www.mdpi.com/article/10.3390/catal11111372/s1: Table S1: A summary of the purity of the used materials; Figure S1: The BSE image of the Pd–Ni/NrGO catalyst; Figure S2: The elemental mapping images of each element in Pd–Ni/N-rGO, and more details regarding synthesizing of GO.

Author Contributions

Conceptualization, M.G.H. and V.D.-E.; validation, M.G.H. and H.A.; formal analysis, V.D.-E.; investigation and writing—original draft preparation, V.D.-E.; writing—review and editing, M.G.H., V.D.-E., S.W. and V.H.; supervision, M.G.H. and V.H.; project administration, M.G.H. and V.H.; funding acquisition, M.G.H. and V.H. All authors have read and agreed to the published version of the manuscript.

Funding

This research was supported by the Office of the Vice Rector for Research of the University of Tabriz, and the Austrian Science Fund (FWF) under grant number I 3871-N37, and Open Access Funding by the Graz University of Technology.

Acknowledgments

The authors gratefully acknowledge financial support from the Office of the Vice-Rector for Research of the University of Tabriz, the Austrian Science Fund (FWF) under grant number I 3871-N37, and Open Access Funding by the Graz University of Technology.

Conflicts of Interest

There are no conflict to declare.

References

  1. Andrew, M.R.; Gressler, W.J.; Johnson, J.K.; Short, R.T.; Williams, K.R. Engineering aspects of hydrazine-air fuel-cell power systems. J. Appl. Electrochem. 1972, 2, 327–336. [Google Scholar] [CrossRef]
  2. Tamura, K.; Kahara, T. Exhaust Gas Compositions and Fuel Efficiencies of Hydrazine–Air Fuel Cells. J. Electrochem. Soc. 1976, 123, 776–780. [Google Scholar] [CrossRef]
  3. Akbar, K.; Kim, J.H.; Lee, Z.; Kim, M.; Yi, Y.; Chun, S.-H. Superaerophobic graphene nano-hills for direct hydrazine fuel cells. NPG Asia Mater. 2017, 9, e378. [Google Scholar] [CrossRef]
  4. Abdolmaleki, M.; Ahadzadeh, I.; Goudarziafshar, H. Direct hydrazine-hydrogen peroxide fuel cell using carbon supported Co@Au core-shell nanocatalyst. Int. J. Hydrog. Energ. 2017, 42, 15623–15631. [Google Scholar] [CrossRef]
  5. Silva, T.L.; Cazetta, A.L.; Zhang, T.; Koh, K.; Silva, R.; Asefa, T.; Almeida, V.C. Nanoporous Heteroatom-Doped Carbons Derived from Cotton Waste: Efficient Hydrazine Oxidation Electrocatalysts. ACS Appl. Energ. Mater. 2019, 2, 2313–2323. [Google Scholar] [CrossRef]
  6. Mohammad, A.; Ehtisham Khan, M.; Alarifi, I.M.; Cho, M.H.; Yoon, T. A sensitive electrochemical detection of hydrazine based on SnO2/CeO2 nanostructured oxide. Microchem. J. 2021, 171, 106784. [Google Scholar] [CrossRef]
  7. Blomen, L.J.M.J.; Mugerwa, M.N. Fuel Cell Systems; Springer: Boston, MA, USA, 1993; ISBN 0-306-44158-6. [Google Scholar]
  8. Amirfakhri, S.J.; Meunier, J.-L.; Berk, D. A comprehensive study of the kinetics of hydrogen peroxide reduction reaction by rotating disk electrode. Electrochim. Acta 2013, 114, 551–559. [Google Scholar] [CrossRef]
  9. Zhang, X.-Y.; Shi, S.; Yin, H.-M. CuPd Alloy Oxide Nanobelts as Electrocatalyst towards Hydrazine Oxidation. ChemElectroChem 2019, 6, 1514–1519. [Google Scholar] [CrossRef]
  10. Wei, J.; Wang, X.; Wang, Y.; Guo, J.; He, P.; Yang, S.; Li, N.; Pei, F.; Wang, Y. Carbon-Supported Au Hollow Nanospheres as Anode Catalysts for Direct Borohydride−Hydrogen Peroxide Fuel Cells. Energ. Fuels 2009, 23, 4037–4041. [Google Scholar] [CrossRef]
  11. Cao, D.; Chen, D.; Lan, J.; Wang, G. An alkaline direct NaBH4–H2O2 fuel cell with high power density. J. Power Sources 2009, 190, 346–350. [Google Scholar] [CrossRef]
  12. Khilari, S.; Pradhan, D. MnFe2O4@nitrogen-doped reduced graphene oxide nanohybrid: An efficient bifunctional electrocatalyst for anodic hydrazine oxidation and cathodic oxygen reduction. Catal. Sci. Technol. 2017, 7, 5920–5931. [Google Scholar] [CrossRef]
  13. Hosseini, M.G.; Mahmoodi, R.; Abdolmaleki, M. High performance direct hydrazine-hydrogen peroxide fuel cell using reduced graphene oxide supported Ni@M (M = Pt, Pd, Ru) nanoparticles as novel anodic electrocatalysts. New J. Chem. 2018, 42, 12222–12233. [Google Scholar] [CrossRef]
  14. Sapner, V.S.; Chavan, P.P.; Munde, A.V.; Sayyad, U.S.; Sathe, B.R. Heteroatom (N, O, and S)-Based Biomolecule-Functionalized Graphene Oxide: A Bifunctional Electrocatalyst for Enhancing Hydrazine Oxidation and Oxygen Reduction Reactions. Energ. Fuels 2021, 35, 6823–6834. [Google Scholar] [CrossRef]
  15. Zabielaitė, A.; Balčiūnaitė, A.; Šimkūnaitė, D.; Lichušina, S.; Stalnionienė, I.; Šimkūnaitė-Stanynienė, B.; Naruškevičius, L.; Tamašauskaitė-Tamašiūnaitė, L.; Norkus, E.; Selskis, A.; et al. High Performance Direct N2H4-H2O2 Fuel Cell Using Fiber-Shaped Co Decorated with Pt Crystallites as Anode Electrocatalysts. J. Electrochem. Soc. 2019, 167, 054502. [Google Scholar] [CrossRef]
  16. Nagai, T.; Kojima, T.; Takeichi, N.; Asahi, M.; Yamazaki, S.-i.; Siroma, Z.; Fujiwara, N.; Ioroi, T. Performance of Perovskite-Type Oxides for Oxygen Reduction Reaction in Direct Hydrazine Fuel Cell. J. Electrochem. Soc. 2020, 167, 164506. [Google Scholar] [CrossRef]
  17. Milikić, J.; Oliveira, R.C.P.; Tapia, A.; Santos, D.M.F.; Zdolšek, N.; Trtić-Petrović, T.; Vraneš, M.; Šljukić, B. Ionic Liquid-Derived Carbon-Supported Metal Electrocatalysts as Anodes in Direct Borohydride-Peroxide Fuel Cells. Catalysts 2021, 11, 632. [Google Scholar] [CrossRef]
  18. Bortoloti, F.; Angelo, A.C.D. Ordered PtSn/C Electrocatalyst: A High Performance Material for the Borohydride Electrooxidation Reaction. Catalysts 2017, 7, 198. [Google Scholar] [CrossRef] [Green Version]
  19. Yin, W.X.; Li, Z.P.; Zhu, J.K.; Qin, H.Y. Effects of NaOH addition on performance of the direct hydrazine fuel cell. J. Power Sources 2008, 182, 520–523. [Google Scholar] [CrossRef]
  20. Lao, S.J.; Qin, H.Y.; Ye, L.Q.; Liu, B.H.; Li, Z.P. A development of direct hydrazine/hydrogen peroxide fuel cell. J. Power Sources 2010, 195, 4135–4138. [Google Scholar] [CrossRef]
  21. Yan, X.; Meng, F.; Xie, Y.; Liu, J.; Ding, Y. Direct N2H4/H2O2 Fuel Cells Powered by Nanoporous Gold Leaves. Sci. Rep. 2012, 2, 941. [Google Scholar] [CrossRef]
  22. Huang, R.; Wen, Y.-H.; Shao, G.-F.; Sun, S.-G. Insight into the Melting Behavior of Au–Pt Core–Shell Nanoparticles from Atomistic Simulations. J. Phys. Chem. C 2013, 117, 4278–4286. [Google Scholar] [CrossRef]
  23. Gholinejad, M.; Khosravi, F.; Afrasi, M.; Sansano, J.M.; Nájera, C. Applications of bimetallic PdCu catalysts. Catal. Sci. Technol. 2021, 11, 2652–2702. [Google Scholar] [CrossRef]
  24. Ma, J.; Sahai, Y.; Buchheit, R.G. Direct borohydride fuel cell using Ni-based composite anodes. J. Power Sources 2010, 195, 4709–4713. [Google Scholar] [CrossRef]
  25. Hosseini, M.G.; Mahmoodi, R. Ni@M (M = Pt, Pd and Ru) core@shell nanoparticles on a Vulcan XC-72R support with superior catalytic activity toward borohydride oxidation: Electrochemical and fuel cell studies. New J. Chem. 2017, 41, 13408–13417. [Google Scholar] [CrossRef]
  26. Smith, A.T.; LaChance, A.M.; Zeng, S.; Liu, B.; Sun, L. Synthesis, properties, and applications of graphene oxide/reduced graphene oxide and their nanocomposites. Nano Mater. Sci. 2019, 1, 31–47. [Google Scholar] [CrossRef]
  27. Chen, Y.; Tian, Y.; Qiu, Y.; Liu, Z.; He, H.; Li, B.; Cao, H. Synthesis and superior cathode performance of sandwiched LiMn2O4@rGO nanocomposites for lithium-ion batteries. Mater. Today Adv. 2019, 1, 100001. [Google Scholar] [CrossRef]
  28. Lei, Y.; Lu, J.; Luo, X.; Wu, T.; Du, P.; Zhang, X.; Ren, Y.; Wen, J.; Miller, D.J.; Miller, J.T.; et al. Synthesis of porous carbon supported palladium nanoparticle catalysts by atomic layer deposition: Application for rechargeable lithium-O2 battery. Nano Lett. 2013, 13, 4182–4189. [Google Scholar] [CrossRef]
  29. Taqi-uddeen Safian, M.; Umar, K.; Mohamad Ibrahim, M.N. Synthesis and scalability of graphene and its derivatives: A journey towards sustainable and commercial material. J. Clean. Prod. 2021, 318, 128603. [Google Scholar] [CrossRef]
  30. Yaqoob, A.A.; Mohamad Ibrahim, M.N.; Umar, K.; Bhawani, S.A.; Khan, A.; Asiri, A.M.; Rizwan Khan, M.; Azam, M.; Al Ammari, A.M. Cellulose Derived Graphene/Polyaniline Nanocomposite Anode for Energy Generation and Bioremediation of Toxic Metals via Benthic Microbial Fuel Cells. Polymers 2021, 13, 135. [Google Scholar] [CrossRef]
  31. Lu, Z.-J.; Bao, S.-J.; Gou, Y.-T.; Cai, C.-J.; Ji, C.-C.; Xu, M.-W.; Song, J.; Wang, R. Nitrogen-doped reduced-graphene oxide as an efficient metal-free electrocatalyst for oxygen reduction in fuel cells. RSC Adv. 2013, 3, 3990–3995. [Google Scholar] [CrossRef]
  32. Ren, J.; Zhang, J.; Yang, C.; Yang, Y.; Zhang, Y.; Yang, F.; Ma, R.; Yang, L.; He, H.; Huang, H. Pd nanocrystals anchored on 3D hybrid architectures constructed from nitrogen-doped graphene and low-defect carbon nanotube as high-performance multifunctional electrocatalysts for formic acid and methanol oxidation. Mater. Today Energ. 2020, 16, 100409. [Google Scholar] [CrossRef]
  33. Yang, H.; Ko, Y.; Lee, W.; Züttel, A.; Kim, W. Nitrogen-doped carbon black supported Pt–M (M = Pd, Fe, Ni) alloy catalysts for oxygen reduction reaction in proton exchange membrane fuel cell. Mater. Today Energ. 2019, 13, 374–381. [Google Scholar] [CrossRef]
  34. Guo, R.; An, N.; An, S.; Zhang, J.; Chou, K.; Guan, L.; Tian, X. One-Step Preparation of Nitrogen-Doped Platinum-Based Catalysts for Electrocatalytic Oxidation of Ethanol. Catalysts 2021, 11, 1264. [Google Scholar] [CrossRef]
  35. Wu, G.; Santandreu, A.; Kellogg, W.; Gupta, S.; Ogoke, O.; Zhang, H.; Wang, H.-L.; Dai, L. Carbon nanocomposite catalysts for oxygen reduction and evolution reactions: From nitrogen doping to transition-metal addition. Nano Energ. 2016, 29, 83–110. [Google Scholar] [CrossRef] [Green Version]
  36. Zhou, Y.; Neyerlin, K.; Olson, T.S.; Pylypenko, S.; Bult, J.; Dinh, H.N.; Gennett, T.; Shao, Z.; O’Hayre, R. Enhancement of Pt and Pt-alloy fuel cell catalyst activity and durability via nitrogen-modified carbon supports. Energ. Environ. Sci. 2010, 3, 1437–1446. [Google Scholar] [CrossRef]
  37. Schauermann, S.; Nilius, N.; Shaikhutdinov, S.; Freund, H.-J. Nanoparticles for Heterogeneous Catalysis: New Mechanistic Insights. Acc. Chem. Res. 2013, 46, 1673–1681. [Google Scholar] [CrossRef]
  38. Wilde, M.; Fukutani, K.; Naschitzki, M.; Freund, H.J. Hydrogen absorption in oxide-supported palladium nanocrystals. Phys. Rev. B 2008, 77, 113412. [Google Scholar] [CrossRef] [Green Version]
  39. Hosseini, M.G.; Daneshvari-Esfahlan, V.; Wolf, S.; Hacker, V. Novel Bimetallic Pd–X (X = Ni, Co) Nanoparticles Assembled on N-Doped Reduced Graphene Oxide as an Anode Catalyst for Highly Efficient Direct Sodium Borohydride–Hydrogen Peroxide Fuel Cells. ACS Appl. Energ. Mater. 2021, 4, 6025–6039. [Google Scholar] [CrossRef]
  40. Kumar, N.A.; Choi, H.-J.; Shin, Y.R.; Chang, D.W.; Dai, L.; Baek, J.-B. Polyaniline-Grafted Reduced Graphene Oxide for Efficient Electrochemical Supercapacitors. ACS Nano 2012, 6, 1715–1723. [Google Scholar] [CrossRef]
  41. Xue, Y.; Liu, J.; Chen, H.; Wang, R.; Li, D.; Qu, J.; Dai, L. Nitrogen-Doped Graphene Foams as Metal-Free Counter Electrodes in High-Performance Dye-Sensitized Solar Cells. Angew. Chem. Int. Ed. 2012, 51, 12124–12127. [Google Scholar] [CrossRef]
  42. Mu, X.; Yuan, B.; Feng, X.; Qiu, S.; Song, L.; Hu, Y. The effect of doped heteroatoms (nitrogen, boron, phosphorus) on inhibition thermal oxidation of reduced graphene oxide. RSC Adv. 2016, 6, 105021–105029. [Google Scholar] [CrossRef]
  43. Kumar, M.P.; Raju, M.M.; Arunchander, A.; Selvaraj, S.; Kalita, G.; Narayanan, T.N.; Sahu, A.K.; Pattanayak, D.K. Nitrogen Doped Graphene as Metal Free Electrocatalyst for Efficient Oxygen Reduction Reaction in Alkaline Media and Its Application in Anion Exchange Membrane Fuel Cells. J. Electrochem. Soc. 2016, 163, F848–F855. [Google Scholar] [CrossRef]
  44. Soo, L.T.; Loh, K.S.; Mohamad, A.B.; Daud, W.R.W.; Wong, W.Y. Effect of nitrogen precursors on the electrochemical performance of nitrogen-doped reduced graphene oxide towards oxygen reduction reaction. J. Alloy. Compd. 2016, 677, 112–120. [Google Scholar] [CrossRef]
  45. Fuge, G.M.; Rennick, C.J.; Pearce, S.R.J.; May, P.W.; Ashfold, M.N.R. Structural characterisation of CNx thin films deposited by pulsed laser ablation. Diam. Relat. Mater. 2003, 12, 1049–1054. [Google Scholar] [CrossRef]
  46. Jang, J.W.; Lee, C.E.; Lyu, S.C.; Lee, T.J.; Lee, C.J. Structural study of nitrogen-doping effects in bamboo-shaped multiwalled carbon nanotubes. Appl. Phys. Lett. 2004, 84, 2877–2879. [Google Scholar] [CrossRef]
  47. Gopalsamy, K.; Balamurugan, J.; Thanh, T.D.; Kim, N.H.; Hui, D.; Lee, J.H. Surfactant-free synthesis of NiPd nanoalloy/graphene bifunctional nanocomposite for fuel cell. Compos. Part B Eng. 2017, 114, 319–327. [Google Scholar] [CrossRef]
  48. Zhang, J.-W.; Zhang, B.; Zhang, X. Enhanced catalytic activity of ternary NiCoPd nanocatalyst dispersed on carbon nanotubes toward methanol oxidation reaction in alkaline media. J. Solid State Electrochem. 2017, 21, 447–453. [Google Scholar] [CrossRef]
  49. Wang, J.; Bao, J.; Zhou, Y.; Zhang, Y.; Sun, B.; Wang, M.; Sheng, X.; Liu, W.; Luo, C.; Xue, Y.; et al. Dopamine-assisted synthesis of rGO@NiPd@NC sandwich structure for highly efficient hydrogen evolution reaction. J. Solid State Electrochem. 2020, 24, 137–144. [Google Scholar] [CrossRef]
  50. Shviro, M.; Polani, S.; Dunin-Borkowski, R.E.; Zitoun, D. Bifunctional Electrocatalysis on Pd-Ni Core-Shell Nanoparticles for Hydrogen Oxidation Reaction in Alkaline Medium. Adv. Mater. Interfaces 2018, 5, 1701666. [Google Scholar] [CrossRef]
  51. Mageed, A.K.; Radiah, D.; Salmiaton, A.; Izhar, S.; Razak, M.A.; Yusoff, H.M.; Yasin, F.; Kamarudin, S. Preparation and Characterization of Nitrogen Doped Reduced Graphene Oxide Sheet. Int. J. Appl. Chem. 2016, 12, 104–108. [Google Scholar]
  52. Liu, S.; Huang, S. Theoretical insights into the activation of O2 by Pt single atom and Pt4 nanocluster on functionalized graphene support: Critical role of Pt positive polarized charges. Carbon 2017, 115, 11–17. [Google Scholar] [CrossRef]
  53. Esrafili, M.D.; Asadollahi, S. Exploring different reaction mechanisms for oxidation of CO over a single Pd atom incorporated nitrogen-doped graphene: A DFT study. Appl. Surf. Sci. 2019, 463, 526–534. [Google Scholar] [CrossRef]
  54. Trafela, S.; Zavasnik, J.; Sturm, S.; Rozman, K.Z. Formation of a Ni(OH)2/NiOOH active redox couple on nickel nanowires for formaldehyde detection in alkaline media. Electrochim. Acta 2019, 309, 346–353. [Google Scholar] [CrossRef]
  55. Medway, S.L.; Lucas, C.A.; Kowal, A.; Nichols, R.J.; Johnson, D. In situ studies of the oxidation of nickel electrodes in alkaline solution. J. Electroanal. Chem. 2006, 587, 172–181. [Google Scholar] [CrossRef]
  56. El-Shafei, A.A. Electrocatalytic oxidation of methanol at a nickel hydroxide/glassy carbon modified electrode in alkaline medium. J. Electroanal. Chem. 1999, 471, 89–95. [Google Scholar] [CrossRef]
  57. Dong, H.; Feng, R.; Ai, X.; Cao, Y.; Yang, H.; Cha, C. Electrooxidation Mechanisms and Discharge Characteristics of Borohydride on Different Catalytic Metal Surfaces. J. Phys. Chem. B 2005, 109, 10896–10901. [Google Scholar] [CrossRef]
  58. Santos, D.M.F.; Sequeira, C.A.C. Cyclic voltammetry investigation of borohydride oxidation at a gold electrode. Electrochim. Acta 2010, 55, 6775–6781. [Google Scholar] [CrossRef]
  59. Bard, A.J.; Faulkner, R.L. Electrochemical Methods: Fundamentals and Applications; Wiley: New York, NY, USA, 1980. [Google Scholar]
  60. Denuault, G.; Mirkin, M.V.; Bard, A.J. Direct determination of diffusion coefficients by chronoamperometry at microdisk electrodes. J. Electroanal. Chem. Interfacial Electrochem. 1991, 308, 27–38. [Google Scholar] [CrossRef]
  61. Ding, W.; Wu, M.; Liang, M.; Ni, H.; Li, Y. Sensitive Hydrazine Electrochemical Biosensor Based on a Porous Chitosan–Carbon Nanofiber Nanocomposite Modified Electrode. Anal. Lett. 2015, 48, 1551–1569. [Google Scholar] [CrossRef]
  62. Vats, T.; Dutt, S.; Kumar, R.; Siril, P.F. Facile synthesis of pristine graphene-palladium nanocomposites with extraordinary catalytic activities using swollen liquid crystals. Sci. Rep. 2016, 6, 33053. [Google Scholar] [CrossRef] [Green Version]
  63. Hosseini, M.G.; Momeni, M.M.; Faraji, M. Highly Active Nickel Nanoparticles Supported on TiO2 Nanotube Electrodes for Methanol Electrooxidation. Electroanalysis 2010, 22, 2620–2625. [Google Scholar] [CrossRef]
  64. Wu, H.J.; Wang, C.; Liu, Z.X.; Mao, Z.Q. Influence of operation conditions on direct NaBH4/H2O2 fuel cell performance. Int. J. Hydrog. Energ. 2010, 35, 2648–2651. [Google Scholar] [CrossRef]
  65. Liu, B.H.; Li, Z.P.; Arai, K.; Suda, S. Performance improvement of a micro borohydride fuel cell operating at ambient conditions. Electrochim. Acta 2005, 50, 3719–3725. [Google Scholar] [CrossRef]
  66. Duteanu, N.; Vlachogiannopoulos, G.; Shivhare, M.R.; Yu, E.H.; Scott, K. A parametric study of a platinum ruthenium anode in a direct borohydride fuel cell. J. Appl. Electrochem. 2007, 37, 1085–1091. [Google Scholar] [CrossRef]
  67. Crisafulli, R.; De Barros, V.V.S.; Rodrigues De Oliveira, F.E.; De Araújo Rocha, T.; Zignani, S.; Spadaro, L.; Palella, A.; Dias, J.A.; Linares, J.J. On the promotional effect of Cu on Pt for hydrazine electrooxidation in alkaline medium. Appl. Catal. B Environ. 2018, 236, 36–44. [Google Scholar] [CrossRef]
  68. Feng, G.; Kuang, Y.; Li, P.; Han, N.; Sun, M.; Zhang, G.; Sun, X. Single Crystalline Ultrathin Nickel–Cobalt Alloy Nanosheets Array for Direct Hydrazine Fuel Cells. Adv. Sci. 2017, 4, 1600179. [Google Scholar] [CrossRef]
  69. Paganin, V.A.; Ticianelli, E.A.; Gonzalez, E.R. Development and electrochemical studies of gas diffusion electrodes for polymer electrolyte fuel cells. J. Appl. Electrochem. 1996, 26, 297–304. [Google Scholar] [CrossRef]
  70. Deng, J.; Li, X.; Imhanria, S.; Chen, K.; Deng, X.; Wang, W. Molybdenum carbide-nitrogen doped carbon composites as effective non-precious electrocatalyst for direct hydrazine fuel cell. Electrochim. Acta 2021, 384, 138417. [Google Scholar] [CrossRef]
  71. Hummers, W.S.; Offeman, R.E. Preparation of Graphitic Oxide. J. Am. Chem. Soc. 1958, 80, 1339. [Google Scholar] [CrossRef]
  72. Prasanna, M.; Cho, E.A.; Lim, T.H.; Oh, I.H. Effects of MEA fabrication method on durability of polymer electrolyte membrane fuel cells. Electrochim. Acta 2008, 53, 5434–5441. [Google Scholar] [CrossRef]
Figure 1. (a) FT-IR spectra of GO and NrGO [1]. (b) XRD patterns of GO and NrGO, and Pd–Ni/NrGO. Reprinted with permission from ref. [1]. Copyright 2021 American Chemical Society.
Catalysts 11 01372 g001
Figure 2. (ac) FESEM images of (a,b) NrGO and (c) Pd–Ni/NrGO. (d) TEM image and (e) EDX image of Pd–Ni/NrGO.
Catalysts 11 01372 g002aCatalysts 11 01372 g002b
Figure 3. The CVs in the NaOH 1.0 mol L−1 under a sweep rate of 100 mVs−1 (a) for NrGO in the presence and absence of N2H4 0.02 mol L−1, (b) for Pd/NrGO and Pd–Ni/NrGO in the absence of N2H4, (c) for Pd–Ni/NrGO in the presence of N2H4 0.02 mol L−1.
Catalysts 11 01372 g003
Figure 4. (a) The effects of sweep rate on the CVs of Pd–Ni/NrGO in NaOH 1.0 mol L−1 + N2H4 0.02 mol L−1. (b) The plot of HzOR peak current vs. ν1/2 for Pd–Ni/NrGO.
Catalysts 11 01372 g004
Figure 5. (a) The effects of N2H4 concentration on the CVs of Pd–Ni/NrGO in NaOH 1.0 mol L−1 at a constant sweep rate of 100 mV s−1. (b) The plot of log CN2H4-log ip for Pd–Ni/NrGO.
Catalysts 11 01372 g005
Figure 6. (a) The effects of temperature on the CVs of Pd–Ni/NrGO in NaOH 1.0 mol L−1 + N2H4 0.1 mol L−1 at a constant sweep rate of 100 mV s−1. (b) The Plot of ln ip vs. 1/T for Pd–Ni/NrGO.
Catalysts 11 01372 g006
Figure 7. (a) CA curves of Pd–Ni/NrGO and Pd/NrGO in NaOH 1.0 mol L−1 + N2H4 0.1 mol L−1 at −0.5 V. (b) The resulting current density percentage decrease for Pd–Ni/NrGO and Pd/NrGO at a potential of −0.5 vs. MOE and 25 °C for 3000 s.
Catalysts 11 01372 g007
Figure 8. (a) The equivalent circuit utilized for fitting of the EIS information; the influence of (b) concentration of N2H4, (c) temperature, and (d) potential on the EIS spectra of Pd–Ni/N-rGO.
Catalysts 11 01372 g008
Figure 9. The effects of operation conditions on the performance of DHzHPFC designed with Pd–Ni/NrGO (1.0 mg cm−2) as an anode and Pt/C (0.5 mg cm−2) as a cathode: (a) H2O2 concentration, (b) N2H4 concentration, and (c) temperature; (d) stability test for Pd–Ni/NrGO at a discharging current of 90 mA cm−2.
Catalysts 11 01372 g009
Scheme 1. The components of DHzHPFCs.
Catalysts 11 01372 sch001
Table 1. The electrochemically active surface area (ECSA), hydrazine oxidation current density (ip), and onset potential of HzOR on the Pd–Ni/NrGO and Pd/NrGO catalysts.
Catalyst TypeECSA (m2 g−1)ip (A g−1)Onset Potential (V vs. MOE)
Pd/NrGO63.676821.22−0.40
Pd–Ni/NrGO166.3812,360.50−0.45
Table 2. The values of Rct for HzOR on the Pd–Ni/NrGO catalyst at different concentrations of hydrazine, temperatures, and voltages.
N2H4 Concentration (mol L−1)Potential
(V vs. MOE)
Temperature
(°C)
Rct
(Ω cm2)
0.02−0.52592.76
0.06−0.52531.27
0.1−0.52522.03
0.1−0.54517.12
0.1−0.9254422
Table 3. The MPDs value for DHzHPFC with the Pd–Ni/NrGO electrocatalyst as an anode at various experimental FC conditions.
FC ConditionMPD/(mW cm−2)
[N2H4]/(mol L−1)[H2O2]/(mol L−1)T/(°C)
2.00.525101.93
2.01.025120.50
2.02.025152.74
2.03.025130.25
0.52.025136.72
1.02.025167.38
1.02.045187.87
1.02.060216.71
Table 4. The comparison of DHzHPFC performances under different experimental FC conditions.
AnodeCathodeMembraneAnolyteCatholyteTemperature (℃)Maximum Power Density (mW cm−2)Ref.
Pt53Cu47/C
(0.5 mg cm−2)
Pt/C (20 wt.%)
(1.0 mg cm−2)
TokuyamaKOH 1.0 M +
N2H4 1.0 M
O2 flow rate: 30 SCCM8056.1[67]
Ni0.6Co0.4 nanosheets
(1.4 mg cm−2)
Pt/C
(40.0 wt.%)
Nafion 115KOH 4.0 M +
N2H4 20.0 wt%
H2O2 20.0% + H2SO4 0.5 M80107.1[68]
Pd/CNT
(1.0 mg cm−2)
Pt/C
(0.25 mg cm−2)
Nafion 117NaOH 1.0 M +
N2H4 2.0 M
O2 flow rate: 150.0 mL min−160110[69]
Co–Au/C
(1.0 mg cm−2)
Au/C
(1.0 mg cm−2)
Nafion 117NaOH 2.0 M +
N2H4 2.0 M
H2O2 2.0 M + H2SO4 0.5 M60122.8[4]
MoCx–NC
(1.0 mg cm−2)
Pt/C
(1.0 mg cm−2)
KOH-doped PBIKOH 6.0 M +
N2H4 0.5 M
O2 Flux:
0.2 slpm
80158.26[70]
Ni–Pd/rGO
(1.0 mg cm−2)
Pt/C
(0.5 mg cm−2)
Nafion 117NaOH 2.0 M +
N2H4 1.0 M
H2O2 2.0 M + H2SO4 0.5 M60204.8[13]
Pd–Ni/NrGO
(1.0 mg cm−2)
Pt/C
(0.5 mg cm−2)
Nafion 117N2H4 1.0 M +
NaOH 2.0 M
H2O2 2.0 M + H2SO4 0.5 M25
60
187.87
216.71
This work
Publisher’s Note: MDPI stays neutral with regard to jurisdictional claims in published maps and institutional affiliations.

