Cr-Free, Cu Promoted Fe Oxide-Based Catalysts for High-Temperature Water-Gas Shift (HT-WGS) Reaction


Operando Molecular Spectroscopy and Catalysis Research Laboratory, Department of Chemical & Biomolecular Engineering, Lehigh University, Bethlehem, PA-18015, USA
*
Author to whom correspondence should be addressed.
Catalysts 2020, 10(3), 305; https://doi.org/10.3390/catal10030305
Submission received: 19 February 2020
/
Revised: 29 February 2020
/
Accepted: 4 March 2020
/
Published: 6 March 2020
(This article belongs to the Special Issue Catalysts for Water-Gas Shift Reaction)
Abstract
:Ca, Ni, Co, and Ge promoters were examined as potential candidates to substitute for the current toxic Cr in Cu-promoted Fe oxide-based catalysts for the HT-WGS reaction. The Ca and Ni promoters were found to improve catalyst performance relative to promotion with Cr. The HS-LEIS surface analysis data demonstrate that Ca and Ge tend to segregate on the surface, while Ni, Co, and Cr form solid solutions in the Fe3O4 bulk lattice. The corresponding number of catalytic active sites, redox, and WGS activity values of the catalysts were determined with CO-TPR, CO+H2O-TPSR, and SS-WGS studies, respectively. The poorer HT-WGS performances of the Ge and Co promoters are related to the presence of surface Ge and Co that inhibits catalyst redox ability, with the Co also not stabilizing the surface area of the Fe3O4 support. The Ni promoter uniformly disperses the Cu nanoparticles on the catalyst surface and increases the number of FeOx-Cu interfacial redox sites. The Ca promoter on the catalyst surface, however, enhances the activity of the FeOx-Cu interfacial redox sites. The CO+H2O TPSR results reveal that the redox ability of the active sites follows the SS-WGS performance of the catalysts and show the following trend: 3Cu8CaFe > 3Cu8NiFe ≥ 3Cu8CrFe > 3Cu8CoFe >> 3Cu8GeFe. Furthermore, all the catalysts followed a redox-type reaction mechanism for the HT-WGS reaction.
1. Introduction
The water-gas shift (WGS) reaction converts CO in the presence of H2O into CO2 and H2, which aims at controlling H2 to CO ratio for the synthesis of NH3 and CH3OH, production of synthetic fuels, etc. [1,2]. Due to reversible and exothermic nature of the WGS reaction (Equation (1)), industrially, the reaction is performed in several stages with different catalysts to attain greater CO equilibrium conversions [3,4]. The low-temperature water gas shift (LT-WGS) reaction is performed at ~190–250 °C with copper-zinc-oxide based catalysts and a high-temperature water gas shift (HT-WGS) reaction is performed at ~350–450 °C with iron oxide-based catalysts:
Industrial HT-WGS catalysts mostly contain (~80–90% by bulk weight) Fe oxide with Cu and Cr oxides added as promoters for improved activity [4]. Unfortunately, the hexavalent Cr (VI) present in the catalyst is a significant carcinogen [5] and has been the topic of intense research over the past decades, especially to find Cr-free HT-WGS catalysts. A thorough understanding of the structures and roles of various metal oxides present in Cu/Cr–Fe oxide catalysts, however, is needed for the rational design of a Cr-free catalyst for the HT-WGS reaction. In this regard, detailed in situ and operando spectroscopy studies have been undertaken to gain this information, along with identification and determination of the catalytic active site(s) and structure-function relationship for the Cu/Cr–Fe oxide-based HT-WGS catalysts.
It is now well established that the initial calcined catalysts contain both the bulk α/γ-Fe2O3 phases that transform to bulk γ-Fe2O3 phase after calcining in an oxidizing environment to 400 °C [6]. After exposure to WGS or r-WGS reaction conditions, the bulk γ-Fe2O3 phase (Fe3+) slightly reduces and transforms to a bulk γ-Fe3O4 phase (Fe2+/3+), which is the equilibrated bulk structure of iron oxide under WGS or r-WGS reaction conditions [6,7,8,9].
The Cu promoter in the initial calcined catalyst is present as Cu+2, which is distributed uniformly throughout the Fe2O3 bulk lattices [7]. After activation under the WGS or r-WGS reaction conditions, the Cu+2 reduces to metallic Cu, which migrates to the surface and sinters to form nanoparticles (NPs). Although the metallic Cu NPs can be easily oxidized to Cu+2 by both CO2 or H2O, the Cu remains as metallic Cu NPs during WGS or r-WGS reactions because of the presence of the reducing H2 and CO gases. For the supported 3Cu/8Cr–Fe oxide catalyst, TEM and HS-LEIS analysis revealed that the Cu NPs are ~3 nm in size [7]. Interestingly, the HS-LEIS depth analysis also showed that ~1/3rd of the surface of the metallic Cu NPs is covered by the FeOx species by the so-called strong metal-support interaction (SMSI) [10] effect. In a subsequent study, the SMSI effect was thoroughly investigated for the supported Cu/Cr–Fe based HT-WGS catalysts, and FeOx sites in close vicinity of metallic Cu NPs (or the FeOx-Cu interface) were reported as the catalytic active site for the WGS reaction [11]. The metallic Cu NPs increase TOF value by ~3–4x and, thus, serve as chemical promoters for the WGS reaction [7,12]. The reaction rate enhancement is related to the improved surface chemical characteristics of the FeOx overlayer (e.g., a strong affinity for CO adsorption [13] and H2O dissociation [13]).
The Cr-oxide promoter in the initial oxidized catalyst is mostly surface-enriched, as surface dioxo (O=)2Cr+6O2 sites and residual chromia is present as Cr+3 dissolves in the Fe2O3 bulk lattice [7]. Under WGS or r-WGS reaction environments, the surface Cr+6 sites reduce (Cr+3) and form a solid solution with the Fe3O4 bulk lattice. The Cr+3 in the bulk Fe3O4 lattice acts as a structural stabilizer that inhibits sintering and overreduction of iron oxide to FeO or metallic Fe [5,8,14]. This is reflected by an increase in surface area and total number of active sites [7,12]. Additionally, in situ XANES measurements have demonstrated that re-oxidation of Cr+3 in the lattice to Cr+6 by CO2 or H2O is not possible since the Cr+6Cr+3 redox cycle does not take place.7 This suggests that Cr does not directly participate in the WGS reaction supported by the nearly same TOF values for the Cr–Fe and pure Fe oxide catalysts [7,12].
The above summary of the Cu–Cr–Fe oxide WGS catalyst system suggests that ideal substitutes for the toxic Cr promoter should possess the following properties: (i) be able to stabilize the surface area of Fe3O4 against excessive thermal and mechanical sintering, (ii) form a solid solution with the Fe3O4 bulk lattice to inhibit overreduction of iron oxide, and (iii) not interfere with the formation of highly active FeOx-Cu interfacial sites.
Several reviews of Cr-free HT-WGS catalysts have been published in the literature [15,16,17] and are only briefly summarized here. Chinchen was the first to examine Ca, Ce, and Zr promoters without Cu, based on cation size and oxidation number [18]. The Ce–Fe and Zr–Fe mixed oxides were found to have higher surface areas, but lower activity than the standard Cr–Fe oxide catalyst. Rethwisch and Dumesic studied the effect of Zn and Mg as bulk oxides in iron (ZnFe2O4 and MgFe2O4) but found that these two oxide phases result in lower WGS activity than the Fe3O4 bulk oxide catalyst [19]. Pereira et al. investigated the promotion effect of Co on iron oxide, in the absence of Cu oxide [20]. No promotion effect of Co was observed for low Co/Fe molar ratios (~0.05). For a high Co concentration (Co/Fe molar ratio of 1), cobalt ferrite (CoFe2O4) and Co3Fe7 alloy formation was observed, resulting in increased surface area, higher WGS activity, and improved resistance against overreduction of magnetite. Lee et al. investigated the promotion of Ni, along with Co, Zn, and Cs, and found that Ni increased surface area and resulted in higher CO conversion during WGS, but also lead to an undesirable side reaction of CO methanation [21,22,23]. Other researchers found Cu promoted Ni–Fe oxide catalysts more active due to increased lattice strain, decreased lattice oxygen binding energy, higher surface area, and reducibility of iron oxide [24]. Among the Cr-free HT-WGS catalysts, Al has received the most attention [25,26,27] and a corresponding study with Al was recently reported [9]. The high WGS activity of the Cu/Al–Fe catalysts was attributed to the high surface area, excellent reducibility, and high CO conversion. A series of Mn, Co, Ni, and Cu promoted Fe/Nb catalysts have also been examined for HT-WGS reactions [28]. The co-doping of Nb with the transition metal oxides was found to improve catalytic activity due to increased lattice strain and facile Fe+2Fe+3 redox cycle. However, it is important to note that most of these studies lacked in situ spectroscopic information and were conducted on the initially oxidized catalysts. The above conclusions of the Cr-free WGS catalysts are debatable since recent in situ and operando spectroscopy studies have shown that Fe-based HT-WGS catalyst structures are dynamic in nature.
In the present study, the oxides of Ca, Co, Ni, and Ge in Cu were examined as promoters of Cr-free Fe oxide catalysts for a HT-WGS reaction since these oxides form solid solutions with the Fe3O4 bulk lattice [29]. Although these metals have been previously investigated, the present study is unique because (i) experiments were conducted on catalysts activated under the WGS or r-WGS reaction conditions to accommodate the dynamic nature of the catalyst structure and (ii) without exposure to air that could oxidize and change the pyrophoric catalyst. In addition, unique characterization (e.g., High Sensitivity Low Energy Ion Scattering (HS-LEIS) Spectroscopy to determine the elemental composition of the outermost surface layers) and chemical probe reactions were undertaken (CO- Temperature Programmed Reduction (TPR) and CO+H2O-Temperature Programmed Surface Reaction (TPSR) experiments to gain insight into the number of catalytic active sites, surface redox ability, reaction mechanism, and TOF values) to gain a fundamental understanding of the functioning of non-Cr promoters in the Cu–Fe oxide HT-WGS catalytic system.
2. Results
2.1. BET Surface Area
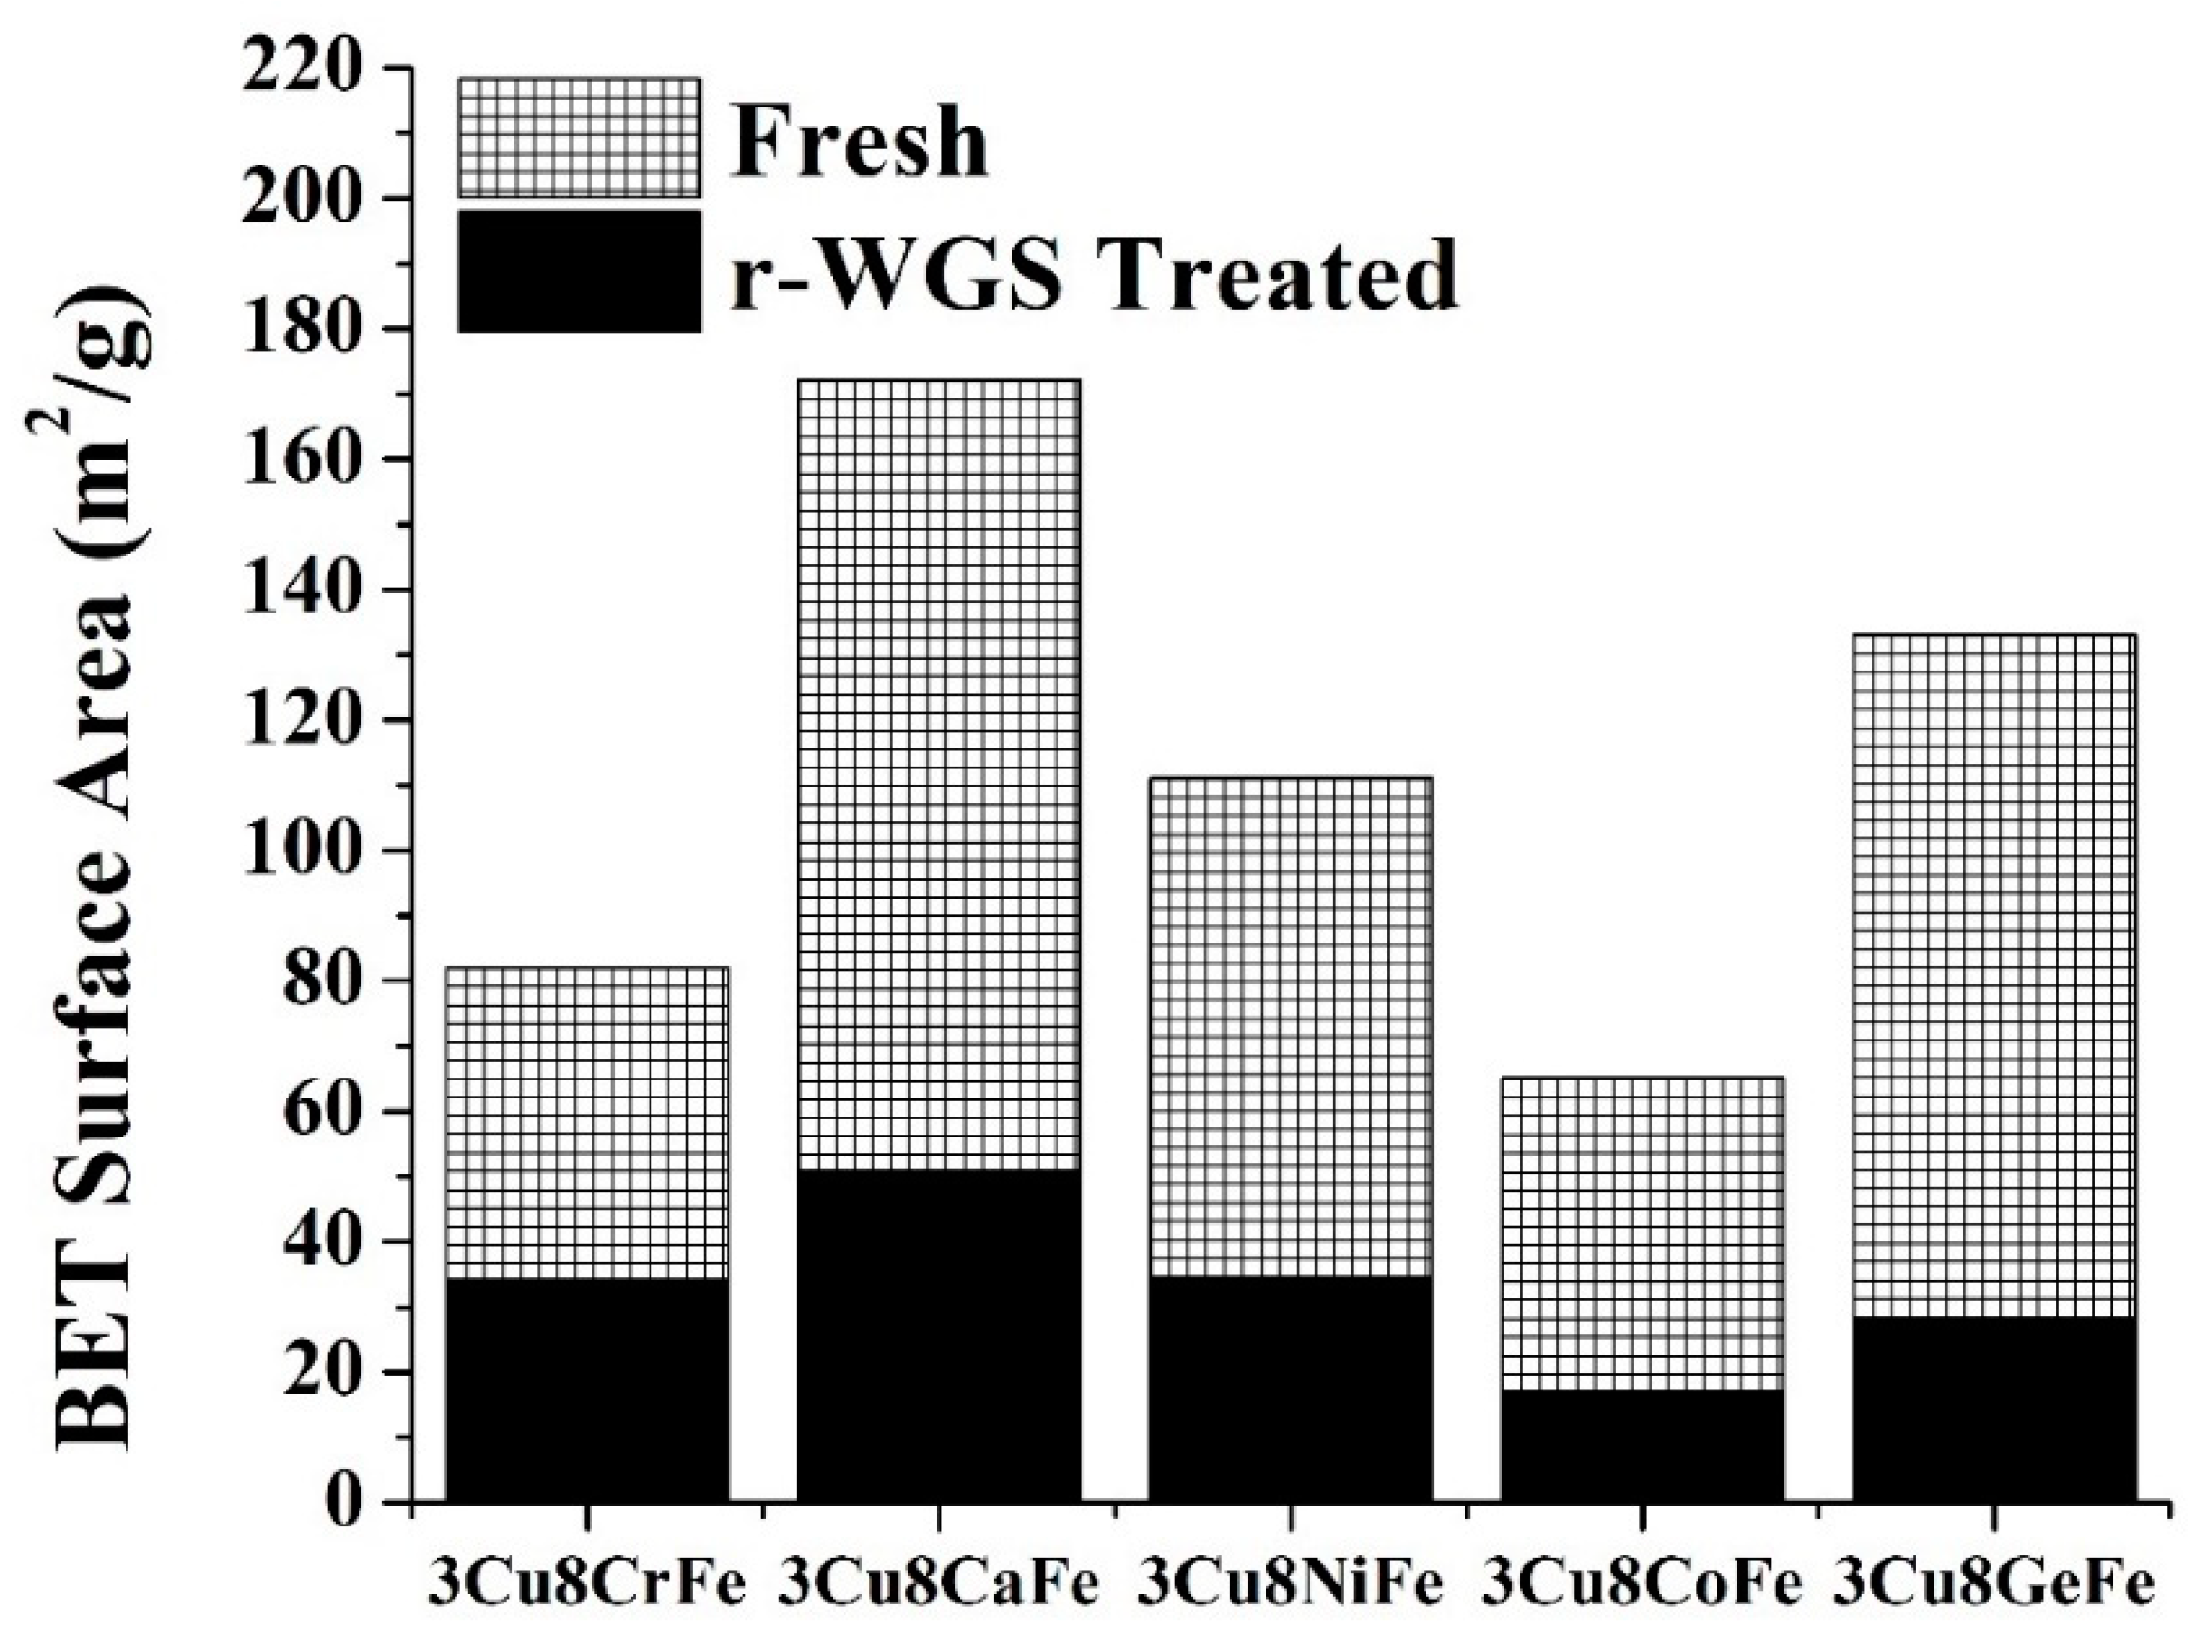
The BET surface area of the freshly calcined 3Cu8MFe (M = Cr, Ca, Ni, Co, Ge) catalysts are shown in Figure 1. The commercial 3Cu8CrFe catalyst has a surface area of ~78 m2/g. Among all non-Cr catalysts, 3Cu8CaFe exhibits the highest surface area (~ 2.2x compared to 3Cu8CrFe catalyst). Both 3Cu8NiFe and 3Cu8GeFe catalysts also have a much higher surface area (~1.4x and ~1.7x, respectively) than the 3Cu8CrFe catalyst. On the other hand, the fresh 3Cu8CoFe catalyst has ~17% less surface area than the 3Cu8CrFe catalyst.
After treatment of the catalysts under r-WGS reaction conditions, the surface area changes drastically. The commercial 3Cu8CrFe catalyst has a surface area of ~34 m2/g, only 43% of the fresh catalyst surface area. Among non-Cr promoters, only the 3Cu8CaFe catalyst exhibits a higher surface area (~51 m2/g) than the 3Cu8CrFe catalyst after the r-WGS treatment. The 3Cu8NiFe catalyst has a similar surface area compared to the 3Cu8CrFe catalyst. On the other hand, the 3Cu8CoFe and 3Cu8GeFe catalysts have a much lower surface area compared to the 3Cu8CrFe catalyst.
2.2. High Sensitivity Low Energy Ion Scattering (HS-LEIS)
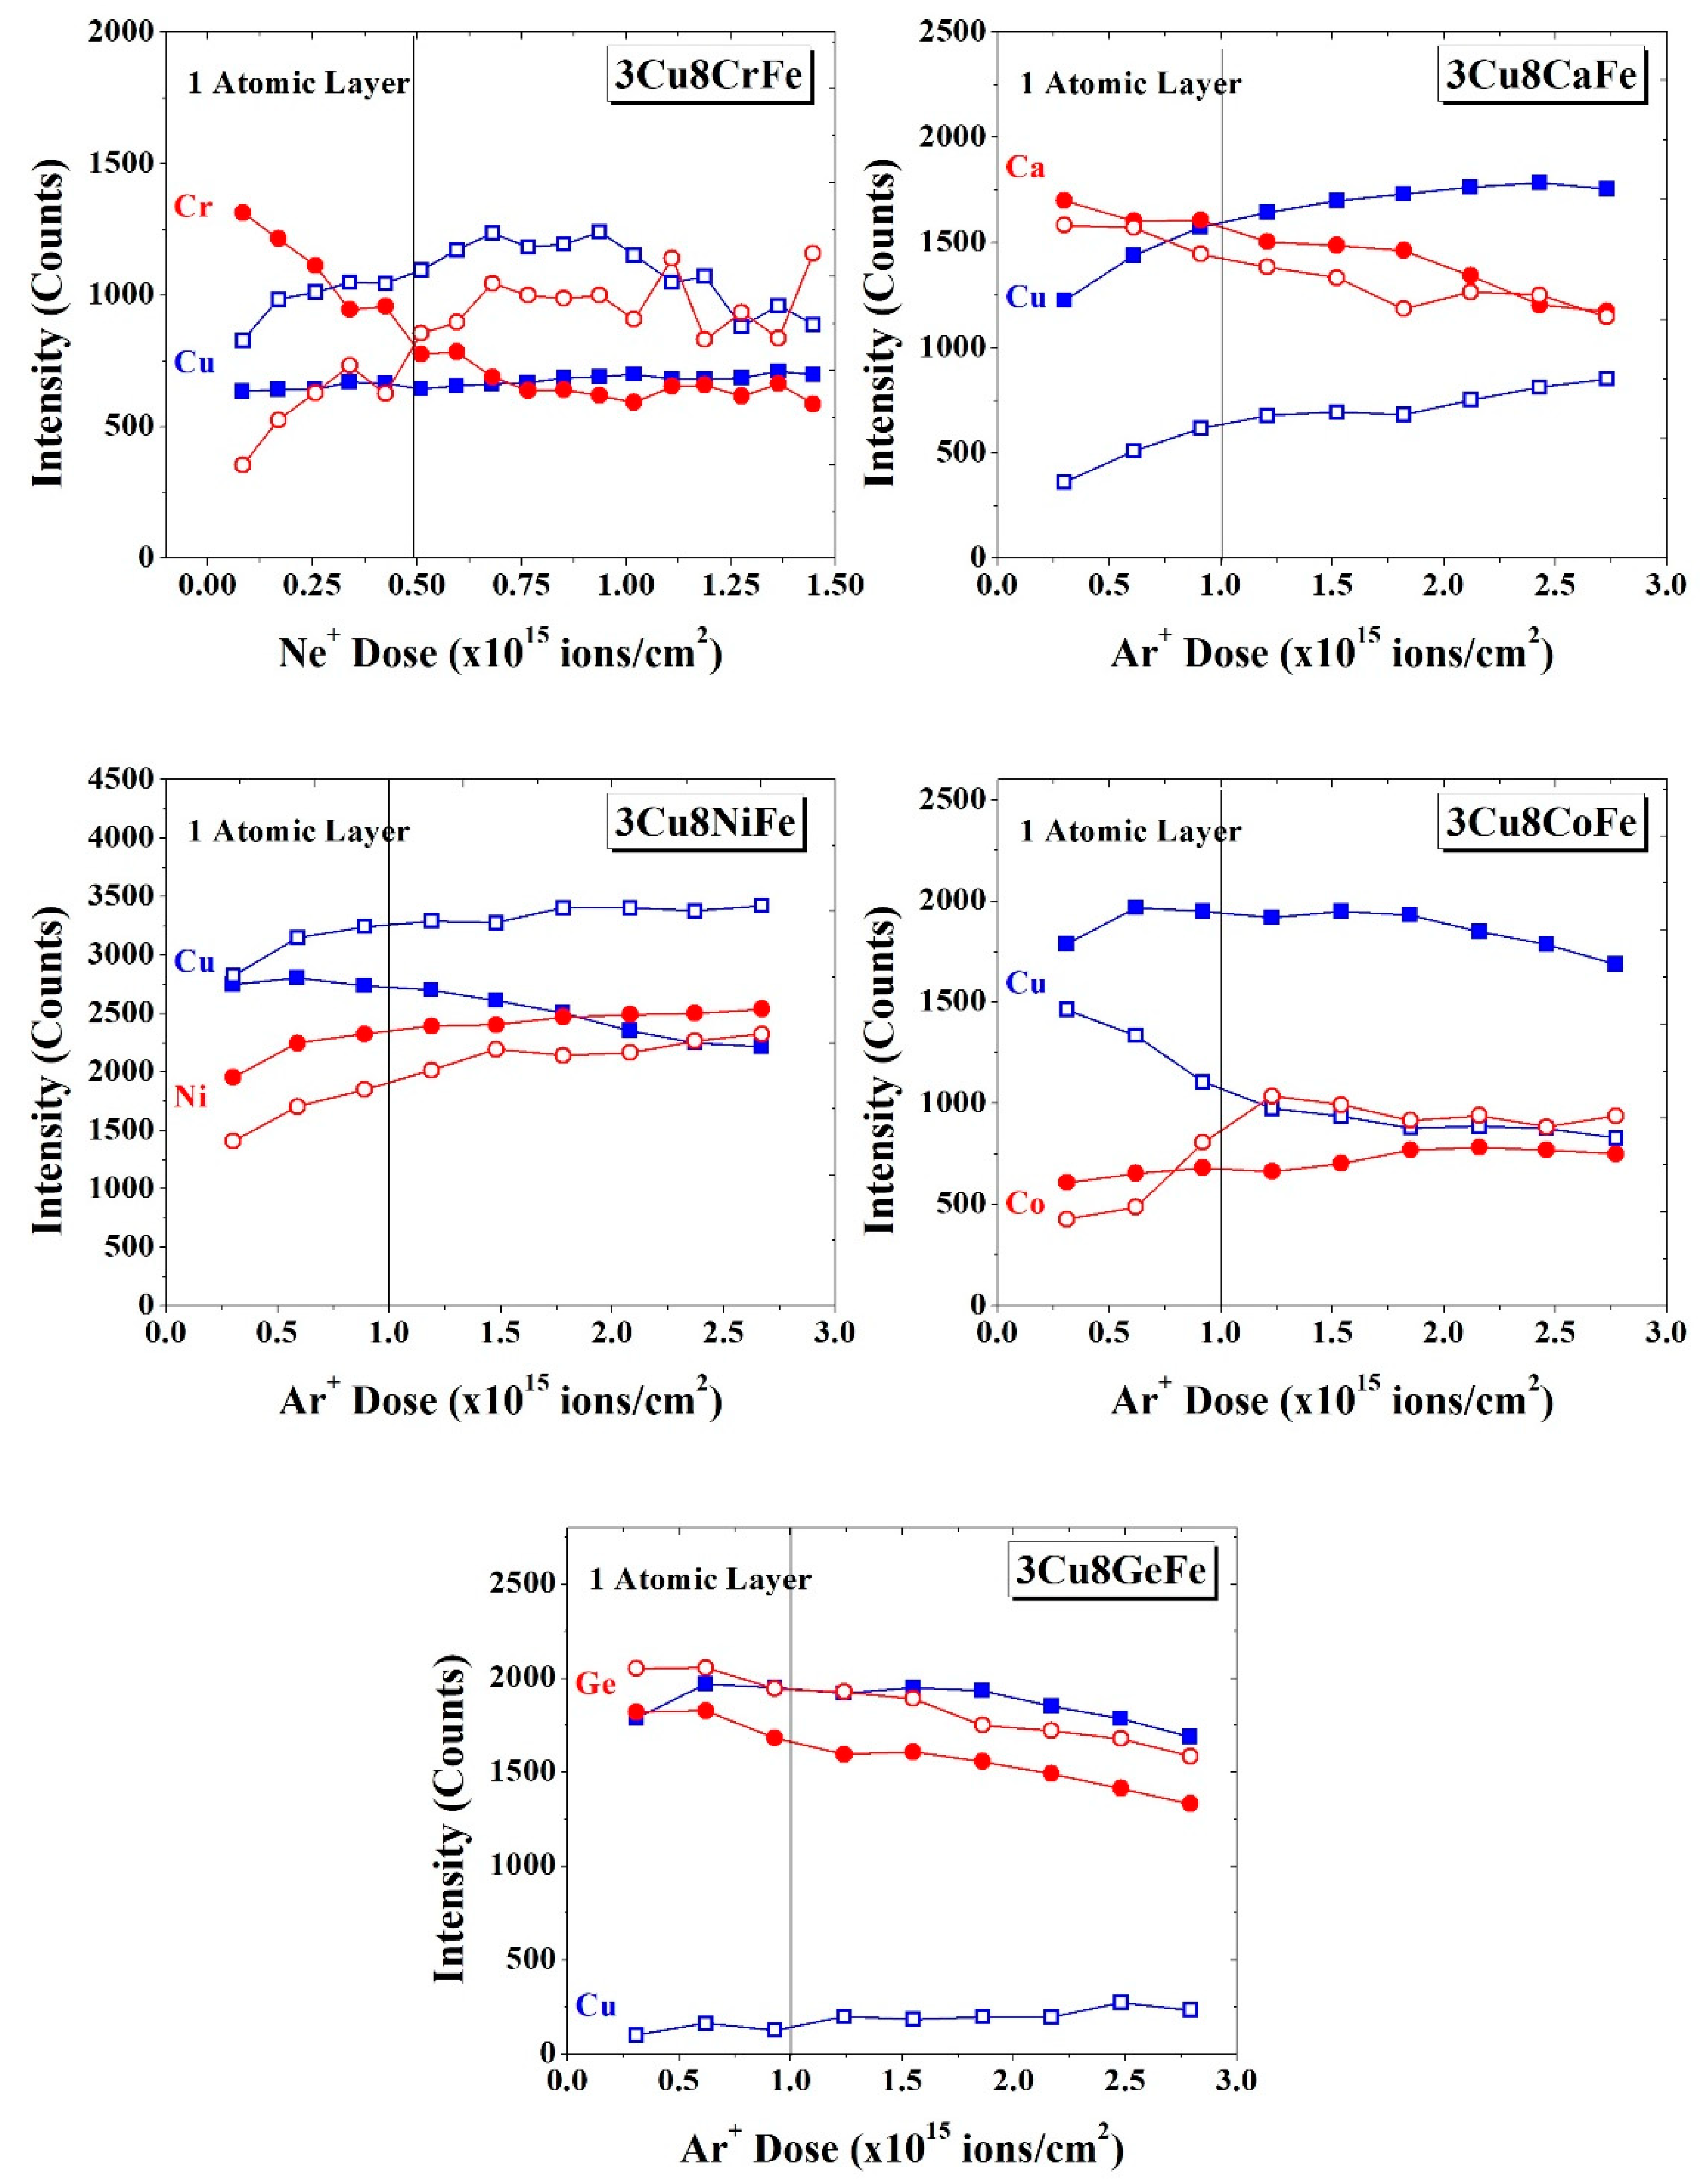
The surface of the catalysts was examined by High-Sensitivity Low Energy Ion Scattering (HS-LEIS) Spectroscopy, a highly surface-sensitive technique that analyzes the topmost surface layer (~0.3 nm) of a solid, as well as depth profiling by surface sputtering through Ar+ gas ions. Two types of ions—He+ for a lighter element like Ca and Ne+ for heavier elements like Fe, Co, Ni, Cu, and Ge—were used for probing. The HS-LEIS depth profile for the 3Cu8CrFe catalyst, both initially calcined and activated under r-WGS reaction conditions, has been reported previously [7] (reproduced in Figure 2) and the findings were summarized in the introduction section. In the current study, the surfaces of the 3Cu8CaFe, 3Cu8NiFe, 3Cu8CoFe, and 3Cu8GeFe catalysts were analyzed; the HS-LEIS intensity of each element as a function of depth are presented in Figure 2.
3Cu8CaFe: For the initially calcined catalyst, the intensity of the Ca signal continuously decreases with depth, indicating that Ca is surface enriched. The corresponding intensity of the Cu signal, however, increases with depth, indicating that Cu is surface depleted and is more concentrated below the outermost surface layer in the bulk lattice. After activation of the catalyst under r-WGS reaction conditions, no noticeable change in the intensity of the Ca signal takes place since Ca remains surface enriched. The corresponding intensity of the Cu signal, however, decreases by ~50%, reflecting sintering of the Cu (> 4 nm metallic Cu NPs, see Figure S1). The increasing intensity of the Cu signal from the topmost layers with depth suggests that the surface of the Cu0 NPs is partially covered by other metal oxides (Ca and/or Fe-oxides).
3Cu8NiFe: For the initially calcined catalyst, the intensity of the Ni signal increases with depth, indicating that Ni is surface depleted and more concentrated in the bulk lattice. The intensity of the Cu signal, however, modestly decreases with sputtering depth, reflecting its surface enrichment. The higher concentration of Cu than Ni in the topmost layers is supported by the greater intensity of the Cu signal than the Ni signal (the similar HS-LEIS sensitivity factors of both Ni and Cu allow us to make this statement; see Figure S2a). After activation of the 3Cu8NiFe catalyst under r-WGS conditions, the overall intensity of the Ni signal slightly decreases and continuously increases with depth profiling. The increasing intensity of the Ni signal with sputtering depth is reflected by the migration of Ni into the Fe3O4 bulk lattice. In contrast, the overall intensity of the Cu signal is higher than that of the calcined catalyst, suggesting that the formed metallic Cu NPs are comparatively smaller in size (~2.5 nm, see Figure S2b). Furthermore, the increasing intensity of the Cu signal with depth reflects the presence of FeOx overlayers on metallic Cu NPs, since Ni tends to diffuse into the Fe3O4 bulk lattice [29].
3Cu8CoFe: For the initially calcined catalyst, the intensity of the Co signal modestly increases with sputtering, reflecting the greater concentration of Co in the Fe oxide bulk lattice. The intensity of the Cu signal, however, is relatively constant, indicating a uniform distribution of Cu in the outermost surface layer and the Fe oxide bulk lattice. After activation under r-WGS reaction conditions, the intensity of the Co signal slightly decreases in the outermost layer and increases in the layers below the outermost layer. This trend in HS-LEIS intensity of the Co signal is consistent with the migration of Co from the outermost layer into the Fe3O4 bulk lattice [20]. The overall intensity of the Cu signal is reduced after activation consistent with the formation of metallic Cu NPs on the outermost surface. The decreasing intensity of the Cu signal with depth indicates that Cu is surface enriched and may not even be decorated with Fe and Co oxide overlayers.
3Cu8GeFe: For the initially calcined catalyst, the decreasing intensity of the Ge signal decreases with depth, indicating surface enrichment of Ge oxide. The corresponding intensity of the Cu with sputtering depth is relatively constant consistent with the uniform distribution of Cu between the outermost surface layer and deeper layers. After catalyst activation under r-WGS reaction conditions, the intensity of the Ge signal was slightly decreased and still exhibited the same trend with depth, consistent with surface enrichment of Ge. The intensity of the Cu signal, however, was drastically diminished, suggesting the formation of very large metallic Cu NPs and/or thick oxide overlayers.
2.3. CO-Temperature Programmed Reduction (TPR)
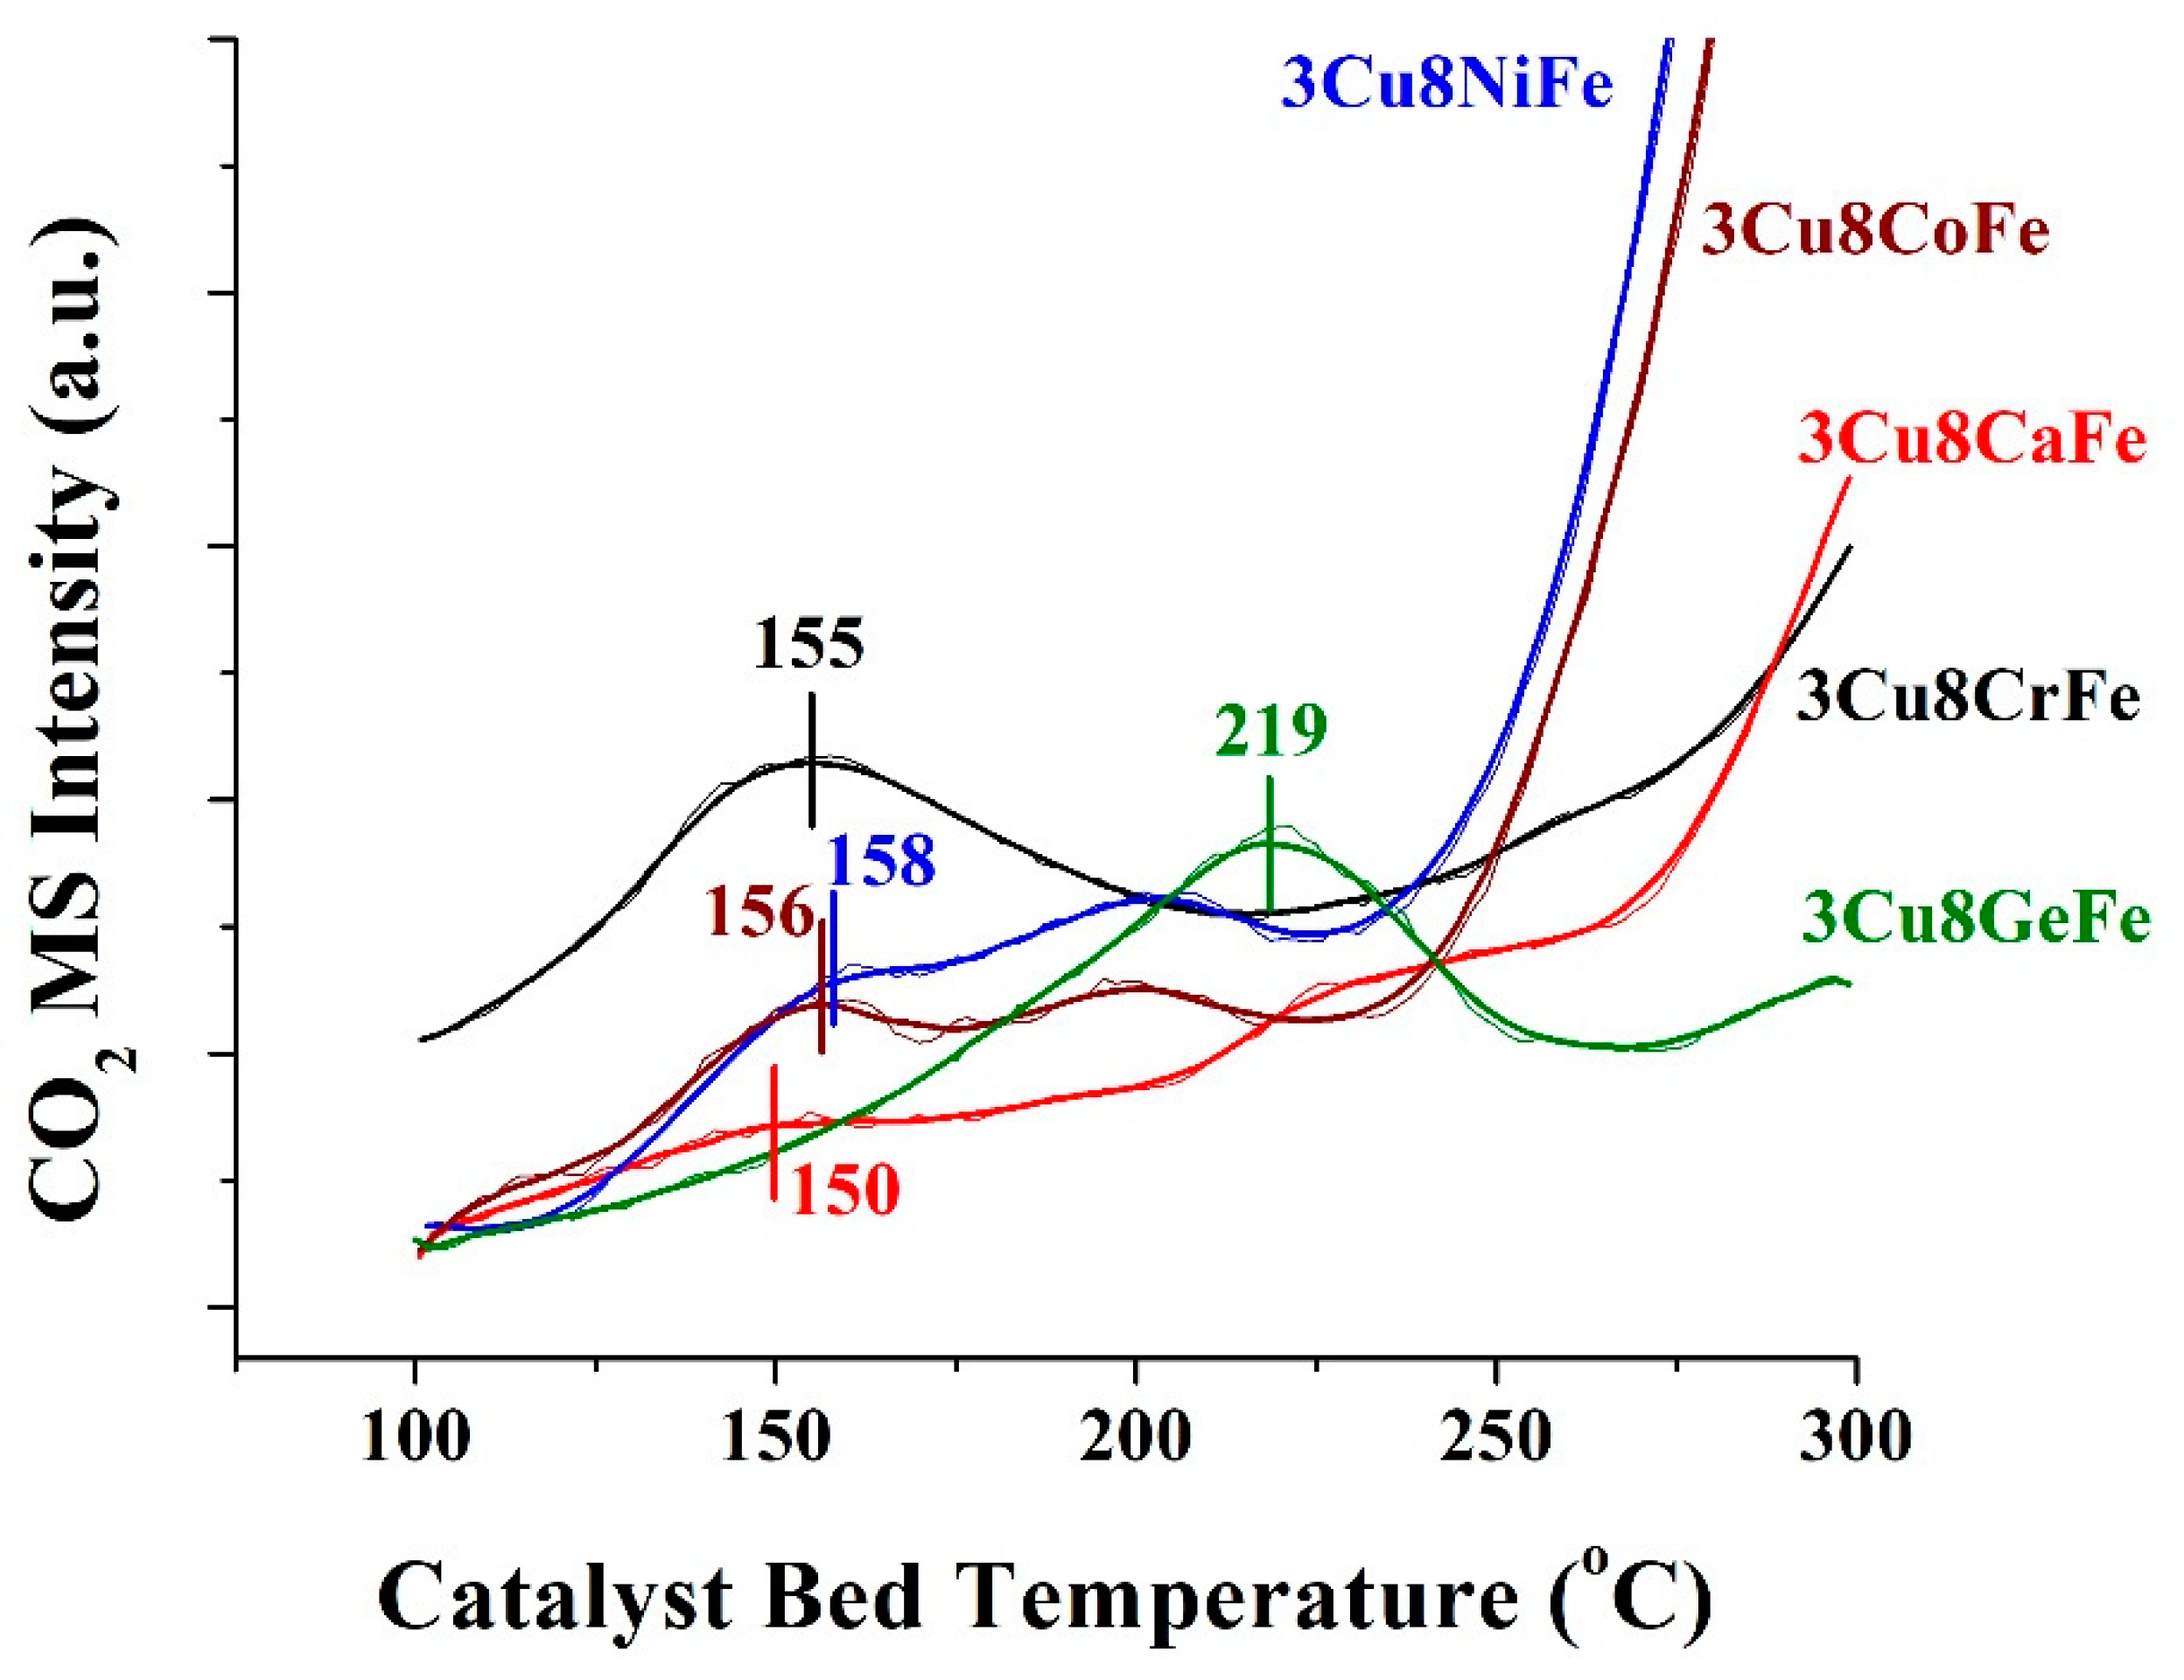
The reducibility of the catalysts was probed by the CO-TPR experiment (shown in Figure 3). The TPR profiles of all the catalysts, except for 3Cu8GeFe, majorly exhibit two reduction zones. The low-temperature reduction is due to the removal of highly active surface lattice oxygen and the high-temperature reduction can be attributed to the slow removal of bulk lattice O atoms [7]. Further, these catalysts show a peak reduction temperature, Tp, within a narrow temperature range (150 to 158 °C), suggesting a comparable reducibility characteristic. On the other hand, the reduction of 3Cu8GeFe catalyst by CO exhibits Tp at a much higher temperature. This indicates that the 3Cu8GeFe catalyst is much less reducible in nature compared to the other catalysts.
The number of catalytic active sites present in each catalyst can also be quantified from the area under the respective CO2 evolution TPR curves. For this purpose, the number of reducible sites corresponding only to the lowest Tp (marked in Figure 3) was considered. This assumption was based on the fact that the sites active at the lowest temperature for CO-oxidation possess a much higher activity at elevated temperature and dominate the overall catalytic activity. The number of reducible catalytic active sites (Ns) for each catalyst are listed in Table 1.
2.4. CO+H2O Temperature Programmed Surface Reaction (TPSR)
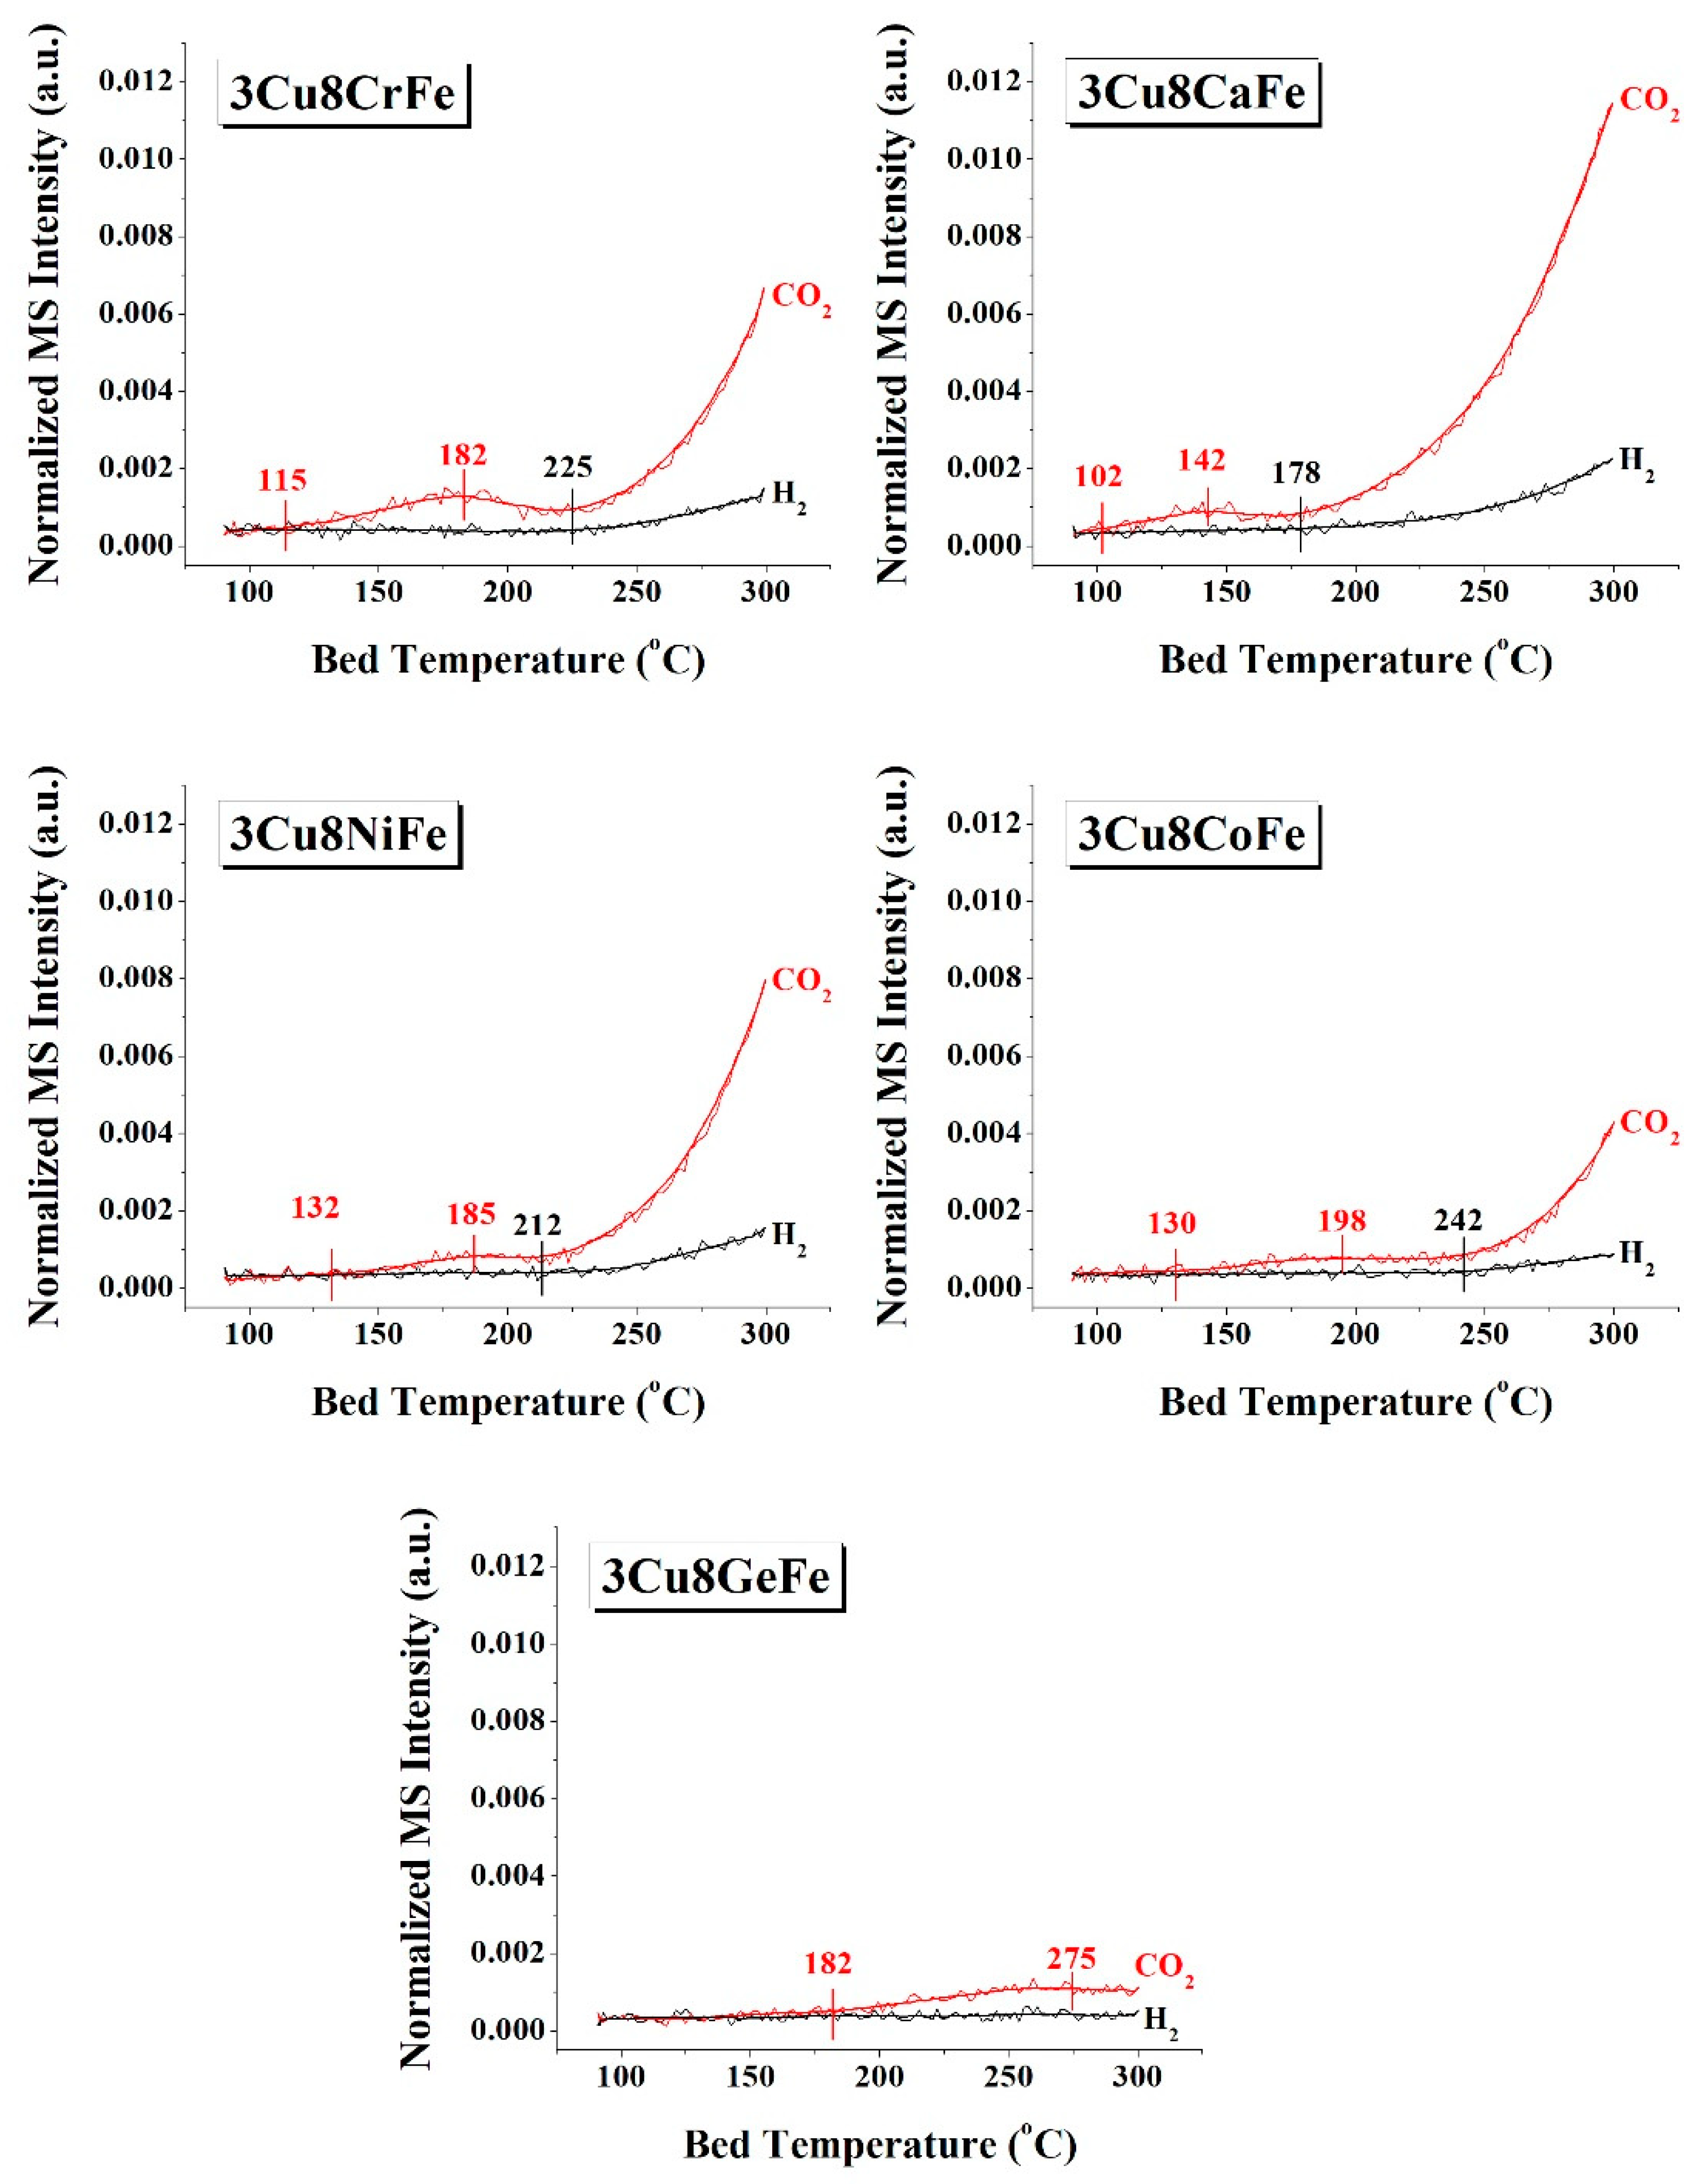
The redox ability of the catalytic active sites was chemically probed with CO+H2O- TPSR spectroscopy; the resulting spectra are shown in Figure 4. Formation of CO2 reflects the ability of the catalytic sites to reduce and oxidize CO, while the formation of H2 reflects the ability of the reduced catalytic active sites to be oxidized by H2O. For the 3Cu8CrFe catalyst, the CO2 evolution initiates at ~115 °C and exhibits a much-delayed H2 light-off temperature of ~225 °C. For the 3Cu8CaFe catalyst, CO2 and especially H2 evolution started at much lower temperatures (102 °C and 178 °C, respectively) compared to the 3Cu8CrFe catalyst. The 3Cu8NiFe catalyst exhibits a delayed CO2 evolution (~132 °C), but an earlier H2 evolution (~212 °C) compared to the 3Cu8CrFe catalyst. Finally, both the 3Cu8CoFe and 3Cu8GeFe (see Figure S4 for H2O evolution temperature) catalysts display very slow evolutions (much delayed light off temperatures) for both CO2 and H2, compared to the 3Cu8CrFe catalyst. The redox ability (based on H2 evolution temperature) of the catalytic active sites present in the respective catalysts follows the trend 3Cu8CaFe > 3Cu8NiFe ~ 3Cu8CrFe > 3Cu8CoFe >> 3Cu8GeFe.
2.5. SS-WGS Activity
The SS-WGS activity values for all the promoted catalysts at 340 °C are presented in Table 1. The SS activity follows the order 3Cu8CaFe > 3Cu8NiFe > 3Cu8CrFe > 3Cu8CoFe >> 3Cu8GeFe. From the knowledge of the activity and Ns values for each catalyst, it was possible to quantify the TOF values (also given in Table 1). The activation energy values for the catalysts were determined using Arrhenius plots (see Figure S5) and included in Table 1. All the catalysts, with the exception of 3Cu8GeFe that showed a much lower activation energy value, exhibited comparable activation energy values.
To correlate the redox ability of the catalysts with final SS-WGS activity, the reaction rate constant, for the rate-determining CO-oxidation step, at 400 °C, [krds]400 °C, was determined for each catalyst using information on [Tp]rds and utilizing the Redhead expression for first-order desorption [30] (Equation (2)) and Arrhenius expression [31] (Equation (3)); this is included in Table 1 as well.
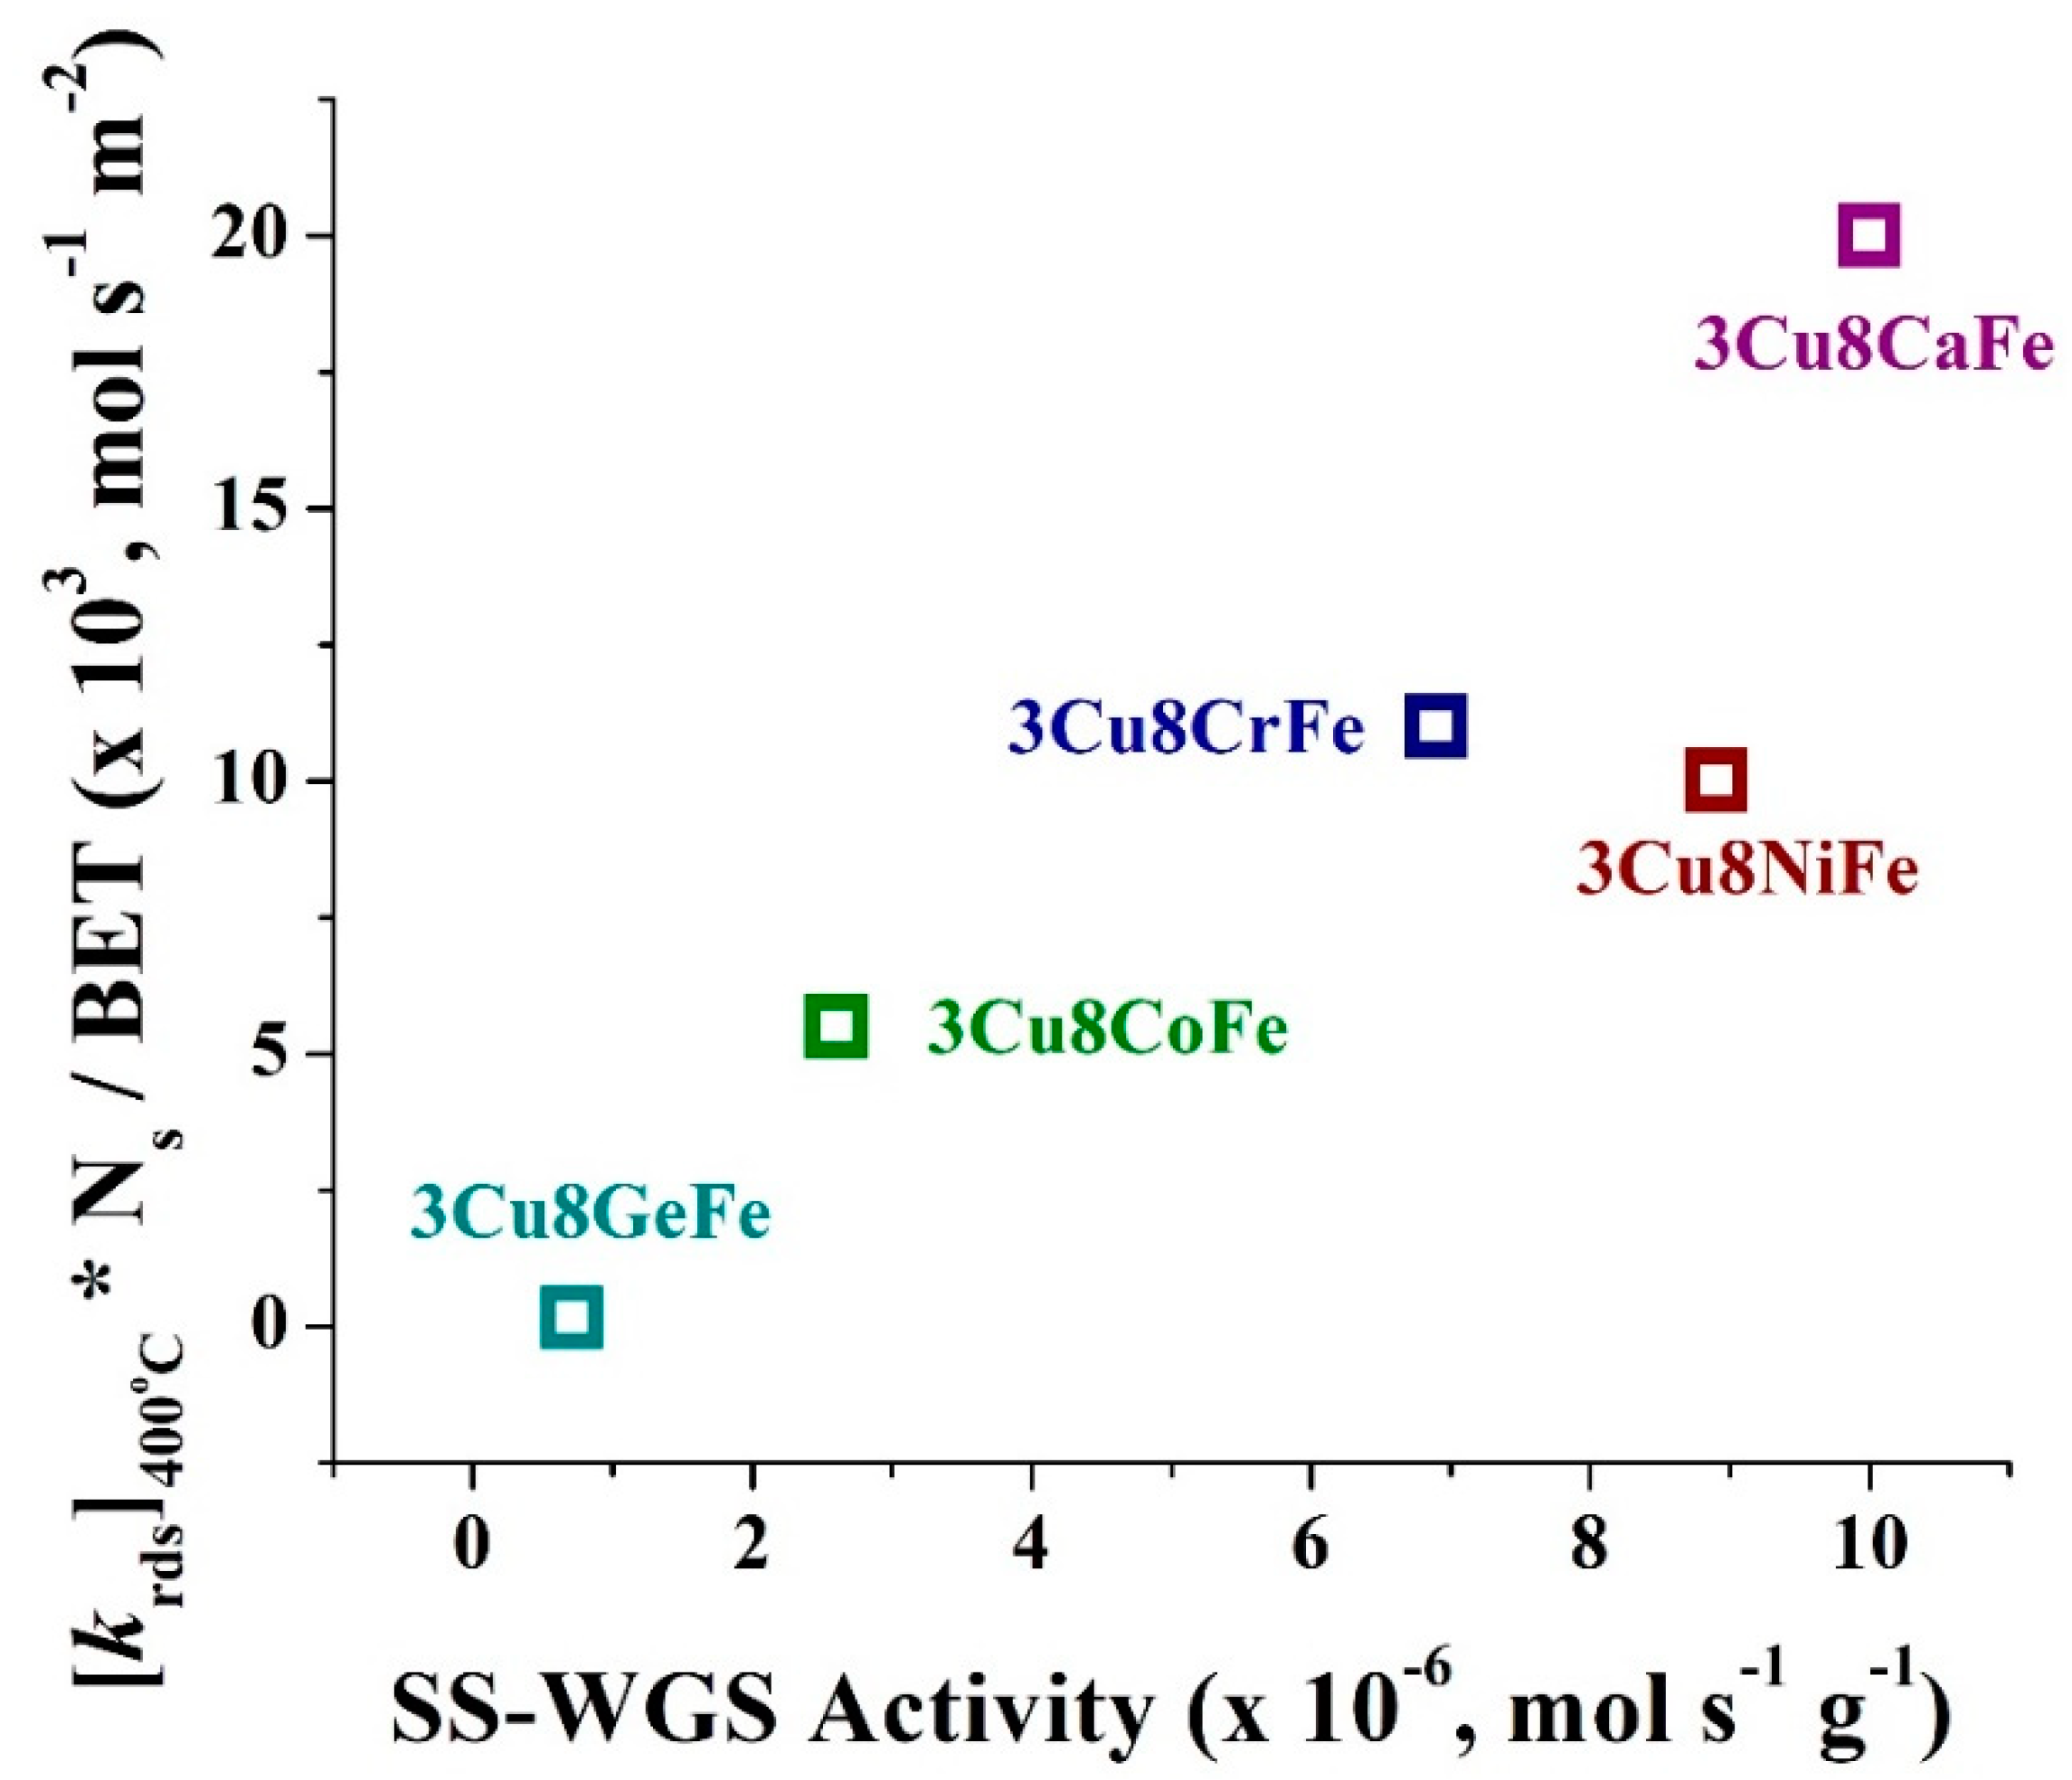
In Equations (2) and (3), A is the frequency factor (1013 s–1), β is the linear heating rate (in K/min), Ed is the activation energy for desorption, and R is the universal gas constant. For this purpose, the [Tp]rds was determined from CO+H2O- TPSR spectroscopy, marked in Figure 4 and included in Table 1. A plot of [krds]400 °C multiplied by the number of surface sites (Ns) (for r-WGS activated catalysts) and normalized by BET surface area vs. SS-WGS activity is shown in Figure 5. From Figure 5, with a slight exception for the 3Cu8NiFe catalyst, all catalysts exhibit a linear relationship between redox ability of the catalytic active sites and the SS-activity.
3. Discussion
3.1. Structure of Catalysts after Calcination and Activation with r-WGS Reaction
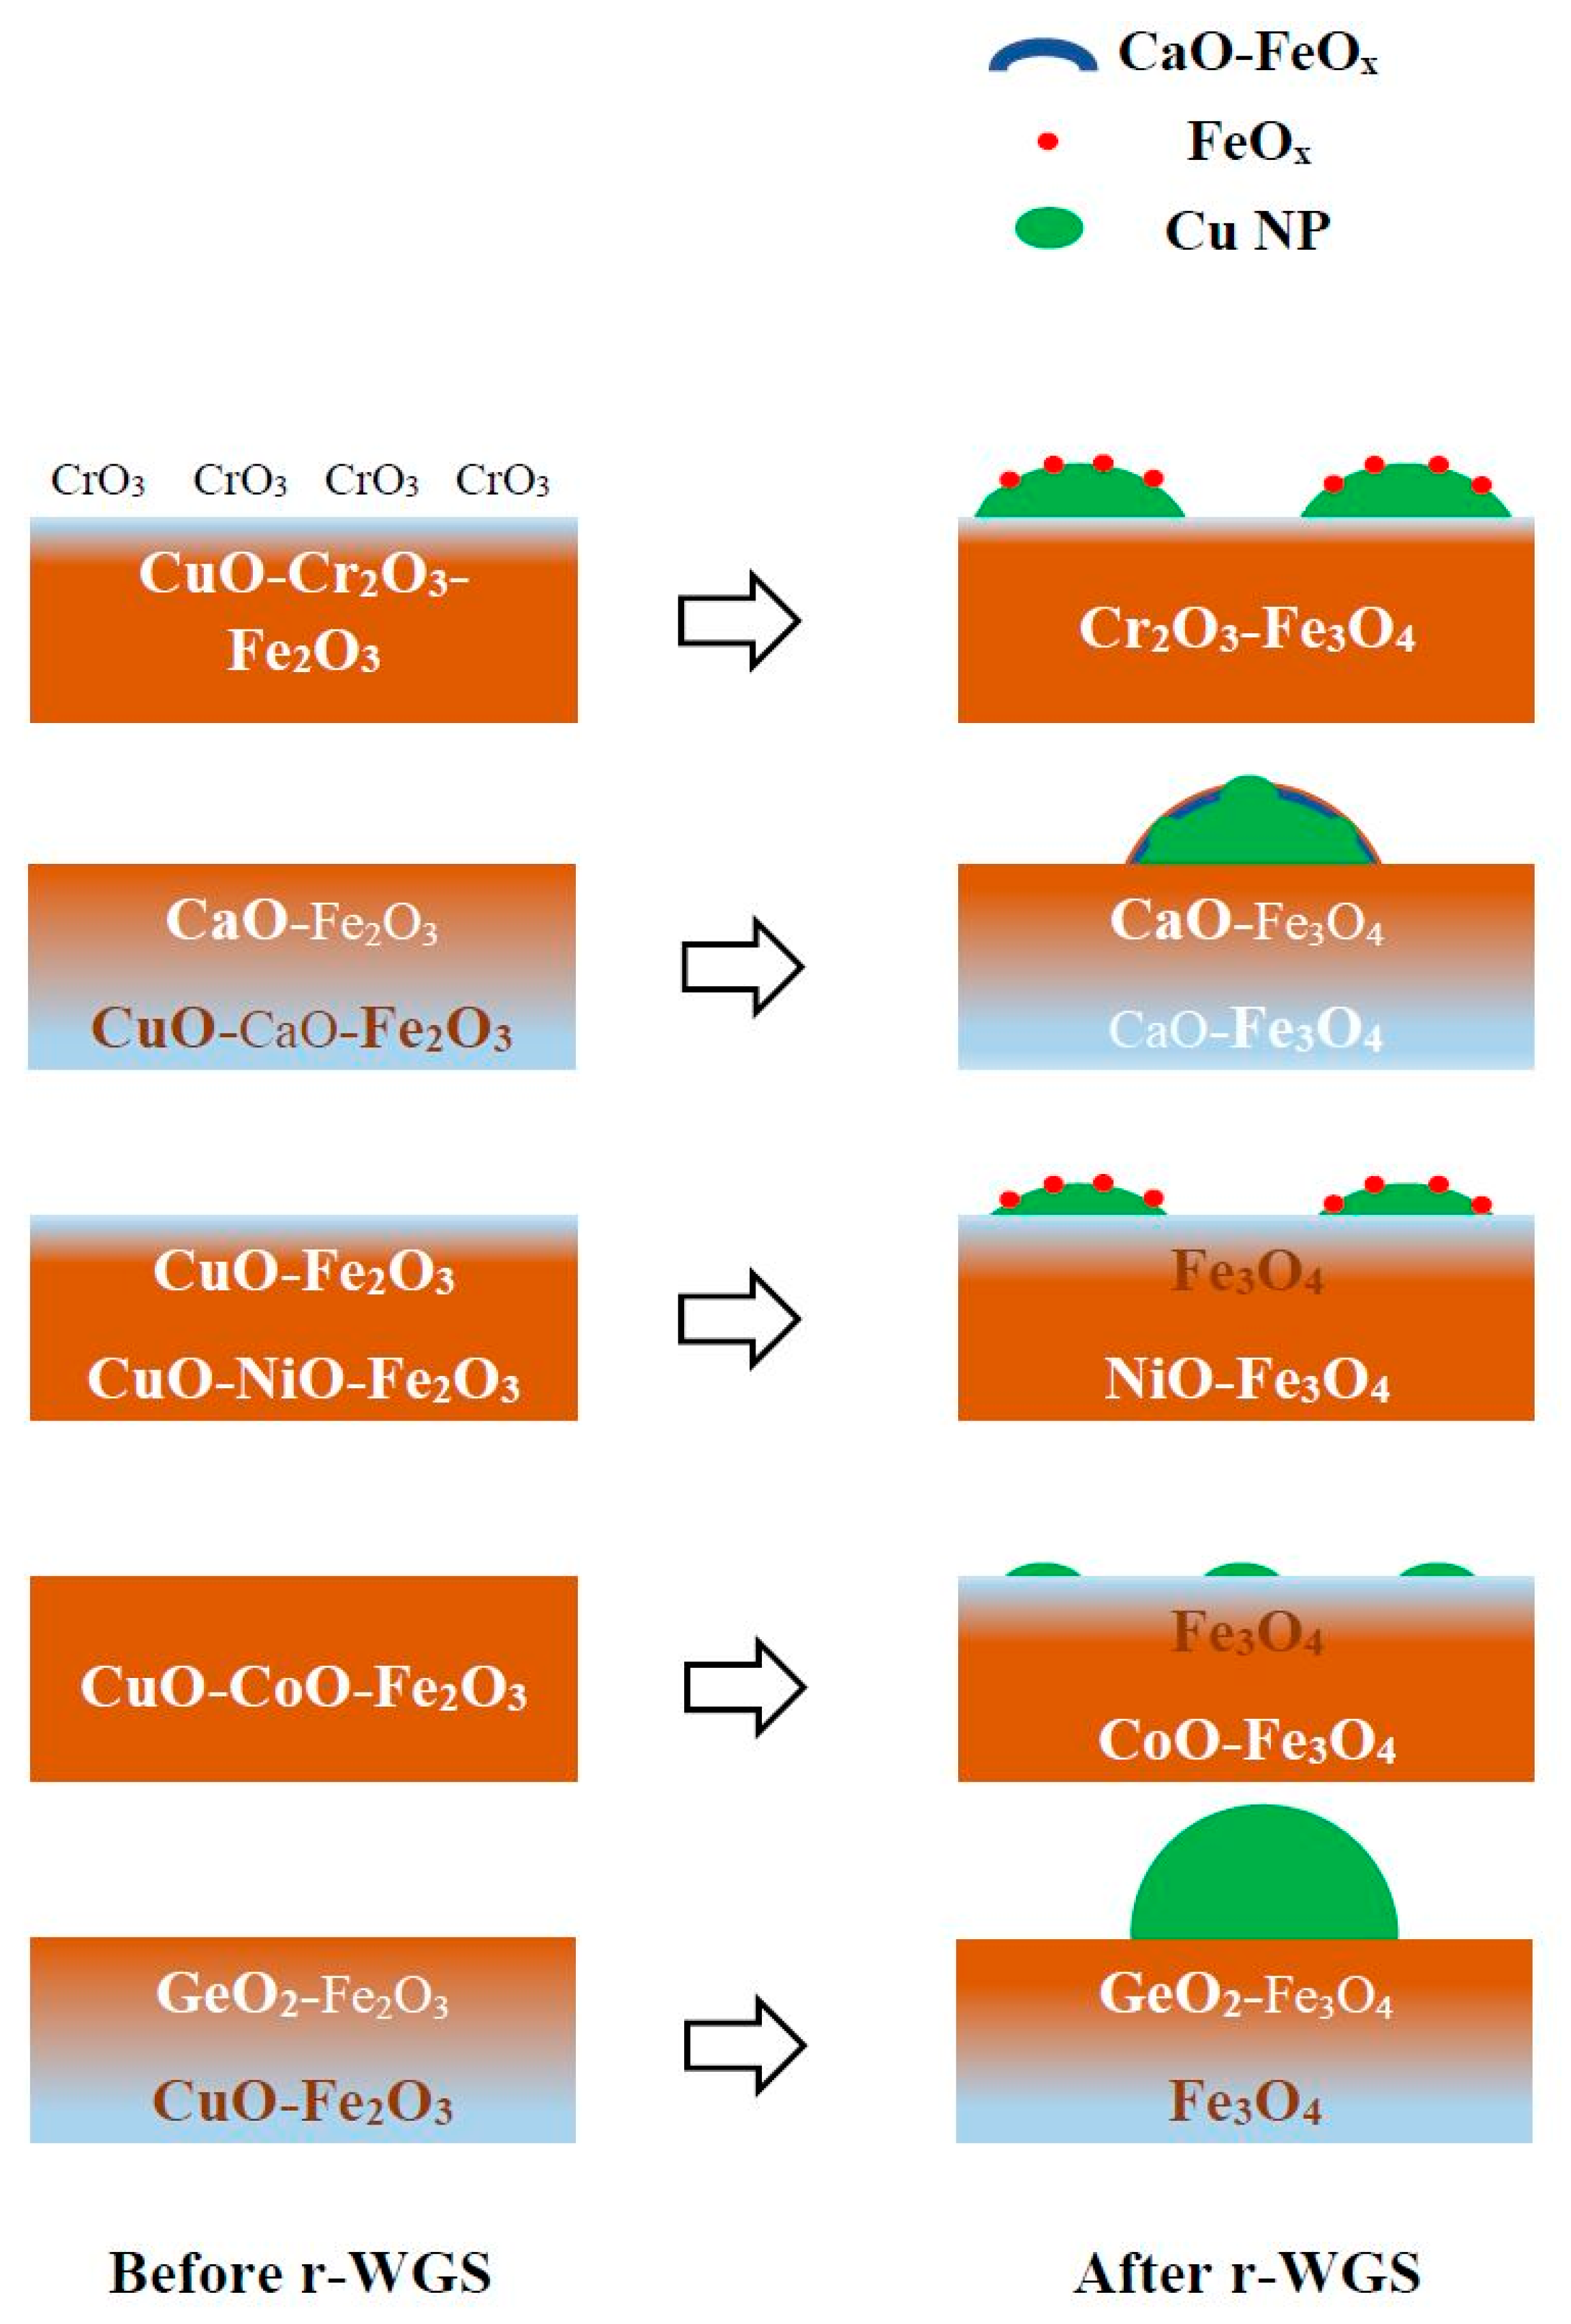
Calcined catalysts: The characterization studies revealed that in the calcined catalysts, Cu is present as Cu+2 cations dissolved in the Fe2O3 lattice [7]. This is also supported by the equilibrium dissolution limit of Cu in the Fe2O3 phase (9 mol % of Cu/mole of Fe) [32], which is much higher compared to 3.5 mol % of Cu present in our catalysts per mole of Fe. The distribution of the promoters between the outermost surface layer and the subsurface layers, however, is dependent on the nature of each promoter. In the initially calcined catalyst, the oxide promoters are present in the outermost surface layer and subsurface layers. Whereas Cr, Ca, and Ge are surface enriched in the initial calcined catalysts, the Ni and Co promoters are surface depleted (see Figure 2). Studies show that Cr only in Cr(III) state can be dissolved in bulk Fe2O3 lattice and remaining Cr in Cr(VI) state (present due to the oxidizing environment for fresh catalyst) cannot be incorporated into Fe2O3 lattice, confirming the surface enrichment of Cr [7,29]. Unfortunately, Ca(II) is incapable of substituting Fe(III) in the Fe2O3 phase, resulting in surface enrichment of Ca [29]. Only a very small amount of Ge (~1 wt %) can be dissolved in Fe2O3 phase [33], which is much lower compared to ~5.5 wt % Ge present in our 3Cu8GeFe catalyst, causing surface enrichment of Ge. On the other hand, incorporation of Ni(II) and Co(III) up to 10 mol % per mol Fe in Fe2O3 lattice has been achieved in the literature [29,34,35]. The approximate 9–10 mol % of Ni and Co, respectively, per mole of Fe present in our 3Cu8NiFe and 3Cu8CoFe catalysts confirms the solid solution of Ni and Co in bulk Fe2O3 lattice. A schematic of the catalyst structures for the initially calcined catalysts is shown in Scheme 1 (left).
Activated catalysts: After activation of the catalysts under WGS reaction mixture, the bulk Fe2O3 phase reduces to form Fe3O4 phase [6,7,8,9]. Interestingly, the dissolution limit of various promoters changes significantly in the Fe3O4 lattice compared to the Fe2O3 lattice [29]. Cu(II) is capable of migrating into the bulk Fe3O4 lattice [29]; however, the reducing environment of the WGS reaction retains Cu on the surface of the catalysts as Cu0 NPs [7]. For the 3Cu8CaFe catalyst, the surface enrichment of Ca (see Figure 2) is consistent with the solubility limit of Ca in Fe3O4 [36]. The equilibrium solubility of Ca in Fe3O4 is 6.76 mol % Ca/mol Fe and the composition of the Ca-promoted catalyst was almost double at 12.6 mol % of Ca/mol of Fe. The excess Ca above the solubility limit accounts for the surface enrichment of Ca in the activated 3Cu8CaFe catalyst. For the 3Cu8NiFe and 3Cu8CoFe catalysts, after activation under r-WGS conditions, the HS-LEIS data show that both Ni and Co are surface depleted and make a solid solution with bulk Fe3O4 lattice. This is supported by the literature, reporting that ~50 mol % of Ni or Co/mol Fe can be incorporated in the Fe3O4 lattice [29], which is much higher than the amount (~9.5–10 mol % Ni or Co/mol Fe) present in our catalysts. Although Ge is soluble in the Fe3O4 lattice [29], the solubility limit must be very low as observed by surface enrichment of Ge in the 3Cu8GeFe catalyst. Unfortunately, we could not find any literature reporting the solubility data of Ge in the Fe3O4 lattice. A schematic of the catalyst structures and nature of the catalytic active site of the activated catalysts is shown in Scheme 1 (right).
3.2. Number of Catalytic Active Sites
The number of catalytic active sites strongly depends on the capability of promoters to make solid solutions and their ability to stabilize the surface area of the Fe3O4 bulk phase against thermal and mechanical sintering. After activation under r-WGS reaction conditions (see Figure 2), only Cr, Ni, and Co promoters were able to make a complete solid solution with the Fe3O4 bulk phase. The 3Cu8CrFe and 3Cu8NiFe catalysts possess a similar amount of catalytic active sites (see Table 1) per gram of the catalyst, whereas the 3Cu8CoFe catalyst has about ~40% smaller number of active sites. Interestingly, the surface area of the 3Cu8CoFe catalyst (after r-WGS treatment) is also much smaller compared to the 3Cu8CrFe and 3Cu8NiFe catalysts. A BET surface area normalized number of active sites for all the catalysts is presented in Table S1. From Table S1, it is clear that the promoters capable of forming complete solid solutions with Fe3O4 phase (Cr, Ni and Co) contain a similar number of active sites per unit surface area of the catalyst. On the other hand, whereas only half of the Ca present in 3Cu8CaFe catalyst forms a solid solution with Fe3O4 phase, almost all Ge in the 3Cu8GeFe catalyst is surface enriched. Accordingly, the 3Cu8CaFe catalyst possess a much smaller number of highly active catalytic sites (see Table S1) and the 3Cu8GeFe catalyst does not contain a measurable amount of catalytic active sites with low-temperature activity (see Figure 3). The number of active sites for the 3Cu8GeFe catalyst presented in Table 1 and Table S1 are less active and are active at a much higher temperature.
3.3. Reducibility and Redox Characteristics of Catalytic Active Sites
Reducibility of the catalytic active sites is a strong function of the promoter’s ability to form a solid solution with the Fe3O4 phase. All promoters, except Ge, which forms a partial or complete solid solution with the Fe3O4 phase, are highly reducible (possess low-temperature CO- reduction peak, see Figure 3). On the other hand, Ge in the 3Cu8GeFe catalyst is completely surface enriched and very difficult to reduce (high CO-reduction peak temperature). Interestingly, the redox ability of these catalytic active sites is very different from its reducibility and depends on the type and nature of promotion of Cu0 NPs present on the catalyst surface. Ca, Cr, and Ni helped catalysts form a thin oxide overlayer decorated on Cu0 NPs on the respective catalyst surface (see Figure 2 and Scheme 1) and possess high redox ability (Figure 4 and Table 1). Co and Ge promoted catalysts, lack the advancement of Cu0 NPs with oxide layers, and exhibit low redox ability.
3.4. TOF Values
The TOF exhibited by all the catalysts is a complex function of catalyst structure, number and nature of catalytic active sites, and SS-WGS performance. A summary for all the catalysts is given below:
3Cu8CaFe: Ca forms a partial solid solution (within its solubility limit) in the Fe3O4 phase, resulting in a highly reducible, but small amount of catalytic active sites. However, the decoration of Cu0 NPs on the catalyst surface by both Ca and Fe-oxide phases creates a Cu-FeOx/CaOx highly active interfacial surface area and make the catalytic active sites extremely redox in nature. A small number of catalytic active sites with very high redox ability exhibit the highest SS-WGS performance, resulting in very high TOF.
3Cu8NiFe and 3Cu8CrFe: Both Ni and Cr form a complete solid solution with the Fe3O4 bulk phase and stabilize the surface area effectively, resulting in a very high number of highly reducible catalytic active sites. In addition, both the promoters form FeOx overlayers on the Cu0 NPs on the respective catalyst surface, making the catalytic active sites highly redox in nature. A large number of active sites with high redox ability and high SS-WGS performance result in high TOF.
3Cu8CoFe: Co forms a complete solid solution with Fe3O4, but fails to stabilize the surface area against sintering, causing a highly reducible, but moderate amount of catalytic active sites. Further, the absence of interaction of active sites with Cu0 NPs results in moderate redox ability. A moderate number of catalytic active sites with moderate redox ability exhibiting moderate to low SS-WGS activity results in a moderate TOF.
3Cu8GeFe: Ge is mostly surface enriched, possesses the highest number of active sites, but exhibits the lowest reducibility and redox ability. A high number of active sites with the least redox ability results in the lowest SS-WGS activity; catalytic sites possess the lowest TOF.
3.5. HT-WGS Reaction Mechanism
It is now well established in the literature that the HT-WGS reaction on an Fe oxide-based catalyst proceeds via a redox mechanism where the lattice oxygen atoms are periodically reduced and re-oxidized by CO and H2O, respectively [11,13,37]. The CO+H2O-TPSR spectra demonstrate that all the promoted Cu-FeOx catalysts were initially reduced by CO and subsequently oxidized by H2O to complete the redox catalytic cycle. The following facts support the conclusion that the WGS reaction proceeds via a redox mechanism.
- (i)
- The evolution of CO2 and H2 occur at two different temperatures (redox mechanism) rather than simultaneously being involved from a common surface reaction intermediate (associative mechanism).
- (ii)
- At a relatively high temperature, when both CO2 and H2 evolution occur, the H2 formation is always retarded, compared to CO2 production; H2/CO2 ratio is less than 1, which becomes ~1 at a much higher temperature (>500 °C) [37].
- (iii)
- The comparison of SS-activity performance exhibited by all the catalysts show that the activity values follow the same trend (see Figure 5) as the degree of redox ability of the active sites observed from the CO+H2O TPSR experiments, which is 3Cu8CaFe > 3Cu8NiFe ~ 3Cu8CrFe > 3Cu8CoFe >> 3Cu8GeFe.
4. Experimental
4.1. Catalyst Synthesis and Activation
The CuO/MOx-Fe2O3 (M: Cr, Ca, Co, Ni and Ge) catalysts investigated in this study were synthesized in two steps. In the first step, the ammonia assisted co-precipitation method was undertaken to prepare the 8 wt % MOx-Fe2O3 catalysts. Iron nitrate (Sigma Aldrich, St. Louis, MO, USA, 99.99% trace metal basis), chromium nitrate (Sigma Aldrich, St. Louis, MO, USA, 99.99% trace metal basis), calcium nitrate (Sigma Aldrich, St. Louis, MO, USA, 99% trace metal basis), cobalt nitrate (Alfa Aesar, Haverhill, MA, USA, 100% trace metal basis), nickel nitrate (Alfa Aesar, Haverhill, MA, USA, 100% trace metal basis), and germanium oxide (Alfa Aesar, Haverhill, MA, USA, 100% trace metal basis) were chosen as metal oxide precursors. For catalyst preparation, the calculated amounts of corresponding metal nitrates (metal oxide in case of Ge) were mixed and dissolved in distilled and deionized water to which dilute ammonium hydroxide (EMD Millipore Corporation, Burlington, MA, USA, 28–30% by volume, 99.998% after ignited) was added dropwise with continuous stirring until the pH reached 8.5. (It should be mentioned that, for the preparation of 8 wt % GeO2-Fe2O3 catalyst, the aqueous solution was prepared at an elevated temperature (80 °C) to ensure complete dissolution of GeO2 in water.) The dark brown precipitate formed was further aged for 24 h and filtered. The filtered precipitates were then dried at 80 °C for 12 h and calcined at 400 °C for 4 h in a programmable oven under static air. The calcined catalysts were crushed into a fine powder and an incipient-wetness point was determined (~0.3–0.4 ml/g). In the second step, the calculated amounts of the aqueous solution of Cu nitrate (Alfa Aesar, Haverhill, MA, USA, 100% trace metal basis) were drop-wise impregnated to this powder to result in a final 3 wt % CuO loading on 8 wt % MOx-Fe2O3 catalysts. The impregnated catalysts were subsequently dried overnight, followed by drying at 80 °C for 12 h before final calcination at 400 °C for 4 h under static air. The prepared catalysts were assigned as 3Cu8MFe (M: Cr, Ca, Co, Ni, Ge); this notation will be used throughout the manuscript.
4.2. Brunauer-Emmett-Teller (BET) Surface Area Determination
The surface areas of the freshly calcined and r-WGS reaction mixture treated catalysts were determined by the 3-point BET method. A micromeritics® (Norcross, GA, USA) AutoChem II instrument equipped with a TCD detector was utilized to measure N2 (Airgas, Idaho Falls, ID, USA, UHP certified gas) adsorption/desorption amount for three different partial pressures (P/P0 = 0.15, 0.22, 0.30). Prior to measurement, fresh samples were heated at ~150 °C for 1 h under 30 mL/min He (Airgas, Idaho Falls, ID, USA, UHP certified gas) flow to remove any impurities. For surface area determination of the spent catalysts, the samples were first treated under r-WGS reaction mixture (10 mL/min of 50% CO2/Ar (Norco, Idaho Falls, ID, USA, certified standard, 50% CO2/Ar) and 50 mL/min of 10% H2/Ar (Norco, Idaho Falls, ID, USA, certified standard, 10.2% H2/Ar) with CO2 to H2 ratio ~1) at 500 °C for 2 h. After activation in an r-WGS reaction environment, the samples were degassed with He (30 mL/min for 1h at 150 °C) prior to BET measurements.
4.3. High-Sensitivity Low Energy Ion Scattering (HS-LEIS) Spectroscopy
The outermost surface layers of the catalysts were analyzed with a Qtac100 (Chestnut Ridge, NY, USA) HS-LEIS spectrometer (ION-TOF) equipped with a highly sensitive double toroidal analyzer. The instrument provides 3000-fold higher sensitivity than conventional LEIS equipment, allowing for better quantitative static depth profiling. Prior to the initial spectroscopic measurement, the catalyst samples were dehydrated in static O2 (Airgas, Allentown, PA, USA, UHP certified gas, supplied by a balloon into the preparation chamber of the spectrometer) at 400 °C for 1 h to remove any possible adsorbed carbonaceous material and adsorbed moisture. After the dehydration step, the preparation chamber was evacuated, and the catalyst sample was transferred to the main UHV chamber for HS-LEIS analysis. To collect the surface information on activated catalysts after the r-WGS reaction, the dehydrated catalysts were further treated for 1 h under static r-WGS reaction conditions (∼100 mbar CO2 (Airgas, Allentown, PA, USA, UHP certified gas) and ∼100 mbar H2 (Airgas, Allentown, PA, USA, UHP certified gas)) at 400 °C. The design of the preparation chamber on the HS-LEIS spectrometer prevents the pre-treated catalysts from coming in contact with the atmosphere when being transferred into the main UHV analysis chamber. The HS-LEIS depth profiling spectrum was collected using 3 keV He+ and 5 keV Ne+ as the ion sources. For deeper depth profiling, the surface was sputtered with 0.5 keV Ar+ with each sputter and measurement cycle yielding a total of 1 × 10¹⁵ ions/cm2, which corresponds to ∼1 atomic layer (~0.3 nm).
4.4. CO-TPR and CO+H2O TPSR Spectroscopy
The CO-TPR and CO+H2O TPSR experiments were performed in an Altamira Instruments system (AMI-200, Pittsburgh, PA, USA). For the temperature-programmed experiments, approximately 30 mg of the catalyst sample was mounted on one limb of a quartz U-tube reactor that was first dehydrated under 10% O2/Ar (Praxair, Allentown, PA, USA, Certified Standard, 10% O2/Ar balance) at 400 °C for 1 h. Afterwards, the catalyst samples were activated under WGS reaction conditions (10 mL/min 10% CO/Ar (Praxair, Allentown, PA, USA, Certified Standard, 9.9% CO/Ar balance) and 30 mL/min He (Airgas, Allentown, PA, USA, UHP certified gas) flowing through a bubbler to carry 2.5% water vapor (H2O/CO~1)) at 400 °C for 90 min. After the catalyst was activated, the reactor was flushed with He and cooled to 80 °C. To conduct CO-TPR experiments, a flow of 30 mL/min 10% CO/Ar was introduced with a temperature ramp of 10 °C/min up to 450 °C. For CO+H2O TPSR experiments, a flow of 10 mL/min 10% CO/Ar and 30 mL/min He, flowing through bubbler at room temperature, was then introduced with the temperature ramping up to 450 °C at a rate of 10 °C/min. The gases flowing out of the reactor were analyzed by an online quadrupole mass spectrometer (AMETEK, Dycor Dymaxion DME100MS, Berwyn, PA, USA).
4.5. SS-WGS Activity
The steady-state activity of the HT-WGS catalytic reaction was measured in an Altamira Instruments system (AMI-200). For this experiment, approximately 10 mg of catalyst samples were first dehydrated, followed by activation under the WGS reaction conditions as described above for the CO+H2O TPSR experiment. The activated catalysts were then treated in a reaction mixture of 10% CO/Ar (10 ml/min) and water vapor (H2O/CO~1) via He (30 ml/min) flowing through the water bubbler at 25 °C. The reaction was performed at 340 °C to ensure low conversions (<10%) and the steady-state WGS reaction data were taken 2 h after the experiment. The outgoing gases were analyzed by an online quadrupole mass spectrometer (Dycor Dymaxion DME100MS). The SS activities at two higher temperatures (360 °C and 380 °C) were also measured to find out the activation energy for the reaction using the Arrhenius expression.
5. Conclusions
A series of 3Cu8MFe catalysts were synthesized by a two-step co-precipitation, followed by the incipient-wetness impregnation method to test the performance of the Cr-free promoters for an HT-WGS reaction. The HS-LEIS surface analysis characterization and CO-TPR, CO+H2O TPSR and SS-WGS activity experiments were conducted to understand the catalyst structure, nature of the active site, structure-function relationship, and the HT-WGS reaction mechanism. It was found that both Ca and Ni promote the formation of highly active FeOx-Cu interfacial areas and exhibit better SS-WGS activity, compared to the 3Cu8CrFe catalyst. The Co and Ge promoters, however, lack the ability to promote the FeOx-Cu interface and perform poorly for the HT-WGS reaction. These activity findings are related to the ability of the promoters to form solid solutions with the Fe3O4 support (Cr, Ni and Ca); promoters that do not stabilize the Fe3O4 surface area (Co); and promoters that do not dissolve in Fe3O4 (Ge), segregate at the surface, and minimize formation of FeOx-Cu interfacial sites. This suggests that FeOx-Cu interfacial sites are active sites for 3Cu8MFe catalysts. The role of FeOx-Cu interfacial sites was further elaborated upon by correlating redox ability with SS-WGS performance. Consequently, both redox ability and SS-WGS performance follow the same trend: 3Cu8CaFe > 3Cu8NiFe ≥ 3Cu8CrFe > 3Cu8CoFe >> 3Cu8GeFe. This trend reveals that both Ca and Ni can be utilized as substitutes for the toxic Cr promoter in the HT-WGS catalyst. Furthermore, all the catalysts follow the redox-type reaction mechanism for the HT-WGS reaction.
Supplementary Materials
The following are available online at https://www.mdpi.com/2073-4344/10/3/305/s1, Figures S1–S5 and Table S1.
Author Contributions
Conceptualization, S.S. and I.E.W.; Data curation, S.S.; Formal analysis, S.S. and I.E.W.; Funding acquisition, I.E.W.; Investigation, S.S.; Supervision, I.E.W.; Writing—original draft, S.S.; Writing—review & editing, I.E.W. All authors have read and agreed to the published version of the manuscript.
Funding
The authors acknowledge financial support from the National Science Foundation Grant CBET-1511689.
Acknowledgments
The authors are thankful to Henry Luftman of Lehigh University for help in generating the HS-LEIS data, Jih-Mirn Jheng of National Chung Hsing University for help in running the CO+H2O-TPSR measurements, and Rebecca R. Fushimi of Idaho National Laboratory for providing instrument time (supported by the U.S. Department of Energy (USDOE), Office of Energy Efficiency and Renewable Energy (EERE), Advanced Manufacturing Office Next Generation R&D Projects under contract no. DE-AC07-05ID14517) for BET surface area measurements of the catalysts.
Conflicts of Interest
The authors declare no conflict of interest.
References
- Ridler, D.E.; Twigg, M.V. Catalyst Handbook, 2nd ed.; CRC Press: Boca Raton, FL, USA, 1996. [Google Scholar]
- Satterfield, C.N. Heterogeneous Catalysis in Industrial Practice, 2nd ed.; McGraw Hill Book Co.: New York, NY, USA, 1991. [Google Scholar]
- Newsome, D.S. The Water-Gas Shift Reaction. Catal. Rev. 1980, 21, 275–318. [Google Scholar] [CrossRef]
- Ratnasamy, C.; Wagner, J.P. Water Gas Shift Catalysis. Catal. Rev. 2009, 51, 325–440. [Google Scholar] [CrossRef]
- Chinchen, G.C.; Logan, R.H.; Spencer, M.S. Water-Gas Shift Reaction over an Iron Oxide/Chromium Oxide Catalyst.: II: Stability of Activity. Appl. Catal. 1984, 12, 89–96. [Google Scholar] [CrossRef]
- Patlolla, A.; Carino, E.V.; Ehrlich, S.N.; Stavitski, E.; Frenkel, A.I. Application of Operando XAS, XRD, and Raman Spectroscopy for Phase Speciation in Water Gas Shift Reaction Catalysts. ACS Catal. 2012, 2, 2216–2223. [Google Scholar] [CrossRef]
- Zhu, M.; Rocha, T.C.R.; Lunkenbein, T.; Knop-Gericke, A.; Schlögl, R.; Wachs, I.E. Promotion Mechanisms of Iron Oxide-Based High Temperature Water–Gas Shift Catalysts by Chromium and Copper. ACS Catal. 2016, 6, 4455–4464. [Google Scholar] [CrossRef]
- Keturakis, C.J.; Zhu, M.; Gibson, E.K.; Daturi, M.; Tao, F.; Frenkel, A.I.; Wachs, I.E. Dynamics of CrO3–Fe2O3 Catalysts during the High-Temperature Water-Gas Shift Reaction: Molecular Structures and Reactivity. ACS Catal. 2016, 6, 4786–4798. [Google Scholar] [CrossRef] [Green Version]
- Zhu, M.; Yalçın, Ö.; Wachs, I.E. Revealing Structure-Activity Relationships in Chromium Free High Temperature Shift Catalysts Promoted by Earth Abundant Elements. Appl. Catal. B Environ. 2018, 232, 205–212. [Google Scholar] [CrossRef]
- Tauster, S.J. Strong Metal-Support Interactions. Acc. Chem. Res. 1987, 20, 389–394. [Google Scholar] [CrossRef]
- Zhu, M.; Tian, P.; Kurtz, R.; Lunkenbein, T.; Xu, J.; Schlögl, R.; Wachs, I.E.; Han, Y.-F. Strong Metal–Support Interactions between Copper and Iron Oxide during the High-Temperature Water-Gas Shift Reaction. Angew. Chem. Int. Ed. 2019, 58, 9083–9087. [Google Scholar] [CrossRef]
- Zhu, M.; Wachs, I.E. Determining Number of Active Sites and TOF for the High-Temperature Water Gas Shift Reaction by Iron Oxide-Based Catalysts. ACS Catal. 2016, 6, 1764–1767. [Google Scholar] [CrossRef]
- Polo-Garzon, F.; Fung, V.; Nguyen, L.; Tang, Y.; Tao, F.; Cheng, Y.; Daemen, L.L.; Ramirez-Cuesta, A.J.; Foo, G.S.; Zhu, M.; et al. Elucidation of the Reaction Mechanism for High-Temperature Water Gas Shift over an Industrial-Type Copper–Chromium–Iron Oxide Catalyst. J. Am. Chem. Soc. 2019, 141, 7990–7999. [Google Scholar] [CrossRef] [PubMed]
- Domka, F.; Łaniecki, M. The Role of Cr2O3 in Catalyst for Water-Gas Shift Reaction. Z. Anorg. Allg. Chem. 1977, 435, 273–283. [Google Scholar] [CrossRef]
- Lee, D.-W.; Lee, M.S.; Lee, J.Y.; Kim, S.; Eom, H.-J.; Moon, D.J.; Lee, K.-Y. The Review of Cr-Free Fe-Based Catalysts for High-Temperature Water-Gas Shift Reactions. Catal. Today 2013, 210, 2–9. [Google Scholar] [CrossRef]
- Zhu, M.; Wachs, I.E. Iron-Based Catalysts for the High-Temperature Water–Gas Shift (HT-WGS) Reaction: A Review. ACS Catal. 2016, 6, 722–732. [Google Scholar] [CrossRef]
- Zhu, M.; Wachs, I.E. A Perspective on Chromium-Free Iron Oxide-Based Catalysts for High Temperature Water-Gas Shift Reaction. Catal. Today 2018. [Google Scholar] [CrossRef]
- Chinchen, G.C. EP Patent EP0062410 B1, 1986.
- Rethwisch, D.G.; Dumesic, J.A. The Effects of Metal-Oxygen Bond Strength on Properties of Oxides: II. Water-Gas Shift over Bulk Oxides. Appl. Catal. 1986, 21, 97–109. [Google Scholar] [CrossRef]
- Pereira, A.L.; dos Santos, N.A.; Ferreira, M.L.; Albornoz, A.; do Carmo Rangel, M. Effect of Cobalt on the Activity of Iron-Based Catalysts in Water Gas Shift Reaction. In Natural Gas Conversion VIII.; Bellot Noronha, F., Schmal, M., Falabella Sousa-Aguiar, E., Eds.; in Studies in Surface Science and Catalysis; Elsevier: San Diego, CA, USA, 2007; Volume 167, pp. 225–230. [Google Scholar] [CrossRef]
- Lee, J.Y.; Lee, D.-W.; Lee, K.-Y.; Wang, Y. Cr-Free Fe-Based Metal Oxide Catalysts for High Temperature Water Gas Shift Reaction of Fuel Processor Using LPG. Catal. Today 2009, 146, 260–264. [Google Scholar] [CrossRef]
- Lee, J.Y.; Lee, D.-W.; Hong, Y.-K.; Lee, K.-Y. The CO Removal Performances of Cr-Free Fe/Ni Catalysts for High Temperature WGSR under LNG Reformate Condition without Additional Steam. Int. J. Hydrog. Energy 2011, 36, 8173–8180. [Google Scholar] [CrossRef]
- Lee, J.Y.; Lee, D.-W.; Lee, M.S.; Lee, K.-Y. Cs-Promoted Ni/Fe Catalyst as a Cr-Free, High Temperature Shift Catalyst for Steam Methane Reformate without Additional Supply of Steam. Catal. Commun. 2011, 15, 37–40. [Google Scholar] [CrossRef]
- Jha, A.; Jeong, D.-W.; Shim, J.-O.; Jang, W.-J.; Lee, Y.-L.; Rode, C.V.; Roh, H.-S. Hydrogen Production by the Water-Gas Shift Reaction Using CuNi/Fe2O3 Catalyst. Catal. Sci. Technol. 2015, 5, 2752–2760. [Google Scholar] [CrossRef]
- de Araújo, G.C.; do Carmo Rangel, M. An Environmental Friendly Dopant for the High-Temperature Shift Catalysts. Catal. Today 2000, 62, 201–207. [Google Scholar] [CrossRef]
- Jeong, D.-W.; Subramanian, V.; Shim, J.-O.; Jang, W.-J.; Seo, Y.-C.; Roh, H.-S.; Gu, J.H.; Lim, Y.T. High-Temperature Water Gas Shift Reaction Over Fe/Al/Cu Oxide Based Catalysts Using Simulated Waste-Derived Synthesis Gas. Catal. Lett. 2013, 143, 438–444. [Google Scholar] [CrossRef]
- Jang, W.-J.; Shim, J.-O.; Jeon, K.-W.; Na, H.-S.; Kim, H.-M.; Lee, Y.-L.; Roh, H.-S.; Jeong, D.-W. Design and Scale-up of a Cr-Free Fe-Al-Cu Catalyst for Hydrogen Production from Waste-Derived Synthesis Gas. Appl. Catal. B Environ. 2019, 249, 72–81. [Google Scholar] [CrossRef]
- Damma, D.; Jampaiah, D.; Welton, A.; Boolchand, P.; Arvanitis, A.; Dong, J.; Smirniotis, P.G. Effect of Nb Modification on the Structural and Catalytic Property of Fe/Nb/M (M = Mn, Co, Ni, and Cu) Catalyst for High Temperature Water-Gas Shift Reaction. Catal. Today 2019. [Google Scholar] [CrossRef]
- Cornell, R.M.; Schwertmann, U. The Iron Oxides: Structure, Properties, Reactions, Occurrences and Uses; John Wiley & Sons: Hoboken, NJ, USA, 2003. [Google Scholar]
- Redhead, P.A. Thermal Desorption of Gases. Vacuum 1962, 12, 203–211. [Google Scholar] [CrossRef]
- Laidler, K.J. The Development of the Arrhenius Equation. J. Chem. Educ. 1984, 61, 494. [Google Scholar] [CrossRef]
- Cornell, R.M.; Giovanoli, R. The Influence of Copper on the Transformation of Ferrihydrite (5Fe2O3 9H2O) into Crystalline Products in Alkaline Media. Polyhedron 1988, 7, 385–391. [Google Scholar] [CrossRef]
- Bernstein, L.R.; Waychunas, G.A. Germanium Crystal Chemistry in Hematite and Goethite from the Apex Mine, Utah, and Some New Data on Germanium in Aqueous Solution and in Stottite. Geochim. Cosmochim. Acta 1987, 51, 623–630. [Google Scholar] [CrossRef]
- Shannon, R.D.; Prewitt, C.T. Effective Ionic Radii in Oxides and Fluorides. Acta Crystallogr. Sect. B 1969, 25, 925–946. [Google Scholar] [CrossRef]
- Singh, B.; Sherman, D.M.; Gilkes, R.J.; Wells, M.; Mosselmans, J.F.W. Structural Chemistry of Fe, Mn, and Ni in Synthetic Hematites as Determined by Extended X-Ray Absorption Fine Structure Spectroscopy. Clays Clay Miner. 2000, 48, 521–527. [Google Scholar] [CrossRef]
- de Sitter, J.; Govaert, A.; de Grave, E.; Chambaere, D.; Robbrecht, G. A Mössbauer Study of Ca2+-Containing Magnetites. Phys. Status Solidi 1977, 43, 619–624. [Google Scholar] [CrossRef]
- Zhu, M.; Wachs, I.E. Resolving the Reaction Mechanism for H2 Formation from High-Temperature Water–Gas Shift by Chromium–Iron Oxide Catalysts. ACS Catal. 2016, 6, 2827–2830. [Google Scholar] [CrossRef]
Figure 1.
BET surface area of the freshly calcined catalysts and catalysts treated under r-WGS conditions (500 °C, 2 h).
Figure 1.
BET surface area of the freshly calcined catalysts and catalysts treated under r-WGS conditions (500 °C, 2 h).

Figure 2.
The HS-LEIS elemental intensity of Cu and M (M=Ca, Ni, Co and Ge) of calcined (solid symbols) and r-WGS reaction activated (empty symbols) for the 3Cu8MFe catalysts as a function of Ar+ ion dose. The vertical dashed line indicates Ar+/Ne+ sputtering of one atomic layer. For reference, HS-LEIS elemental analysis of the 3Cu8CrFe catalyst is also included in the figure, adapted with permission from [7].

Figure 3.
CO2 evolution of 3Cu8MFe catalysts (M = Cr, Ca, Ni, Co and Ge) as a function of catalyst bed temperature. The thin zigzag line represents the actual data points and the bold solid line passing through the data points is the moving average for the respective data points in each curve. Calibration of the CO2 mass spectrometer signal, number of catalytic active redox sites (Ns) for each catalyst, was achieved with CO-Temperature Programmed Reduction of known quantities of bulk CuO (see calibration curve in Figure S3).

Figure 4.
Evolution of H2 and CO2 as a function of catalyst temperature for various 3Cu8MFe catalysts (M = Cr, Ca, Ni, Co, and Ge). The thin zigzag line represents the actual data points and the bold solid line passing through the data points is the moving average for the respective data points in each curve.

Figure 5.
The plot of [krds]400 °C * Ns / BET vs. SS-WGS activity for the 3Cu8MFe catalysts (M= Cr, Ca, Ni, Co, and Ge).
Figure 5.
The plot of [krds]400 °C * Ns / BET vs. SS-WGS activity for the 3Cu8MFe catalysts (M= Cr, Ca, Ni, Co, and Ge).

Scheme 1.
Structure and active site on the 3Cu8MFe catalysts (M= Cr, Ca, Ni, Co and Ge) before and after activation with r-WGS reaction mixture.
Scheme 1.
Structure and active site on the 3Cu8MFe catalysts (M= Cr, Ca, Ni, Co and Ge) before and after activation with r-WGS reaction mixture.


Table 1.
Number of catalytic active sites (Ns), the CO2 evolution peak reduction temperatures ([Tp]rds), reaction rate constants, [krds]400 °C from [Tp]rds, SS-WGS activity, TOF and activation energy values of the 3Cu8MFe catalysts (M= Cr, Ca, Ni, Co and Ge).
Table 1.
Number of catalytic active sites (Ns), the CO2 evolution peak reduction temperatures ([Tp]rds), reaction rate constants, [krds]400 °C from [Tp]rds, SS-WGS activity, TOF and activation energy values of the 3Cu8MFe catalysts (M= Cr, Ca, Ni, Co and Ge).
| Catalyst | Number of Active Sites from CO-TPR (Ns) x10−3 (mol/g) | Kinetic Parameters from CO+H2O-TPSR | Activity (340 °C) x10−6 (mol/s g) | TOF (Activity/Ns) x10−3 (s−1) | Activation Energy (Ea) (kJ/mol) | |
|---|---|---|---|---|---|---|
| [Tp]rds (°C) | [krds]400 °C x108 (s−1) | |||||
| 3Cu8CrFe | 0.74 | 182 | 5.1 | 6.9 | 9.3 | 69 |
| 3Cu8CaFe | 0.22 | 142 | 47.5 | 10.0 | 45 | 50 |
| 3Cu8NiFe | 0.76 | 185 | 4.3 | 8.9 | 12 | 60 |
| 3Cu8CoFe | 0.45 | 198 | 2.1 | 2.6 | 5.8 | 78 |
| 3Cu8GeFe | 1.52 | 275 | 0.03 | 0.71 | 0.5 | 36 |
© 2020 by the authors. Licensee MDPI, Basel, Switzerland. This article is an open access article distributed under the terms and conditions of the Creative Commons Attribution (CC BY) license (http://creativecommons.org/licenses/by/4.0/).
Share and Cite
MDPI and ACS Style
Sourav, S.; Wachs, I.E. Cr-Free, Cu Promoted Fe Oxide-Based Catalysts for High-Temperature Water-Gas Shift (HT-WGS) Reaction. Catalysts 2020, 10, 305. https://doi.org/10.3390/catal10030305
AMA Style
Sourav S, Wachs IE. Cr-Free, Cu Promoted Fe Oxide-Based Catalysts for High-Temperature Water-Gas Shift (HT-WGS) Reaction. Catalysts. 2020; 10(3):305. https://doi.org/10.3390/catal10030305
Chicago/Turabian StyleSourav, Sagar, and Israel E. Wachs. 2020. "Cr-Free, Cu Promoted Fe Oxide-Based Catalysts for High-Temperature Water-Gas Shift (HT-WGS) Reaction" Catalysts 10, no. 3: 305. https://doi.org/10.3390/catal10030305
Note that from the first issue of 2016, this journal uses article numbers instead of page numbers. See further details here.