The Effect of Older Age and Frailty on the Time to Diagnosis of Cancer: A Connected Bradford Electronic Health Records Study

 ,
,  , , , , and
Abstract
:Simple Summary
Abstract
1. Introduction
2. Materials and Methods
2.1. Study Design
2.2. Setting
2.3. Participants
- aged 18 years and above,
- registered with a general practice contributing data to the Connected Bradford database
2.4. Data Sources
2.5. Variables
2.6. Time to Diagnosis
2.7. Frailty
2.8. Demographics
2.9. Statistical Methods
3. Results
4. Discussion
4.1. Why Does Increasing Frailty Delay Time to Diagnosis of Cancer?
4.2. Comparison with Existing Literature
4.3. Strengths and Limitations
4.4. Implications for Practice, Policy and Research
5. Conclusions
Author Contributions
Funding
Institutional Review Board Statement
Informed Consent Statement
Data Availability Statement
Acknowledgments
Conflicts of Interest
References
- von Wagner, C.; Macedo, A.; Campbell, C.; Simon, A.E.; Wardle, J.; Hammersley, V.; Weller, D.; Waller, J. Continuing cancer screening later in life: Attitudes and intentions among older adults in England. Age Ageing 2013, 42, 770–775. [Google Scholar] [CrossRef] [PubMed] [Green Version]
- Pilleron, S.; Sarfati, D.; Janssen-Heijnen, M.; Vignat, J.; Ferlay, J.; Bray, F.; Soerjomataram, I. Global cancer incidence in older adults, 2012 and 2035: A population-based study. Int. J. Cancer 2019, 144, 49–58. [Google Scholar] [CrossRef] [PubMed] [Green Version]
- Jones, D.; Di Martino, E.; Bradley, S.H.; Essang, B.; Hemphill, S.; Wright, J.M.; Renzi, C.; Surr, C.; Clegg, A.; De Wit, N.; et al. Factors affecting the decision to investigate older adults with potential cancer symptoms: A systematic review. Br. J. Gen. Pract. 2022, 72, e1–e10. [Google Scholar] [CrossRef] [PubMed]
- Neal, R.D.; Din, N.U.; Hamilton, W.; Ukoumunne, O.C.; Carter, B.; Stapley, S.; Rubin, G. Comparison of cancer diagnostic intervals before and after implementation of NICE guidelines: Analysis of data from the UK General Practice Research Database. Br. J. Cancer 2014, 110, 584–592. [Google Scholar] [CrossRef] [Green Version]
- Royce, T.J.; Hendrix, L.H.; Stokes, W.A.; Allen, I.M.; Chen, R.C. Cancer Screening Rates in Individuals with Different Life Expectancies. JAMA Intern. Med. 2014, 174, 1558–1565. [Google Scholar] [CrossRef] [Green Version]
- Jones, D.; di Martino, E.; Hatton, N.L.; Surr, C.; de Wit, N.; Neal, R.D. Investigating cancer symptoms in older people: What are the issues and where is the evidence? Br. J. Gen. Pract. 2020, 70, 321–322. [Google Scholar] [CrossRef]
- Emery, J.; Vedsted, P. New NICE guidance on diagnosing cancer in general practice. Br. J. Gen. Pract. 2015, 65, 446–447. [Google Scholar] [CrossRef] [Green Version]
- NICE. Suspected Cancer: Recognition and Referral [NG12]. Available online: https://www.nice.org.uk/guidance/ng12/chapter/Recommendations-organised-by-site-of-cancer#prostate-cancer (accessed on 13 April 2022).
- Elliss-Brookes, L.; McPhail, S.; Ives, A.; Greenslade, M.; Shelton, J.; Hiom, S.; Richards, M. Routes to diagnosis for cancer—Determining the patient journey using multiple routine data sets. Br. J. Cancer 2012, 107, 1220–1226. [Google Scholar] [CrossRef] [Green Version]
- Xue, Q.L. The frailty syndrome: Definition and natural history. Clin. Geriatr. Med. 2011, 27, 1–15. [Google Scholar] [CrossRef] [Green Version]
- Clegg, A.; Bates, C.; Young, J.; Ryan, R.; Nichols, L.; Ann Teale, E.; Mohammed, M.A.; Parry, J.; Marshall, T. Development and validation of an electronic frailty index using routine primary care electronic health record data. Age Ageing 2016, 45, 353–360. [Google Scholar] [CrossRef]
- Todd, O. Can Frailty Inform the Management of Hypertension in Older People? Ph.D. Thesis, University of Leeds, Leeds, UK, 2020. [Google Scholar]
- Rockwood, K.; Song, X.; MacKnight, C.; Bergman, H.; Hogan, D.B.; McDowell, I.; Mitnitski, A. A global clinical measure of fitness and frailty in elderly people. Can. Med. Assoc. J. 2005, 173, 489–495. [Google Scholar] [CrossRef] [PubMed] [Green Version]
- Handforth, C.; Clegg, A.; Young, C.; Simpkins, S.; Seymour, M.T.; Selby, P.J.; Young, J. The prevalence and outcomes of frailty in older cancer patients: A systematic review. Ann. Oncol. 2015, 26, 1091–1101. [Google Scholar] [CrossRef] [PubMed]
- Kristjansson, S.R.; Nesbakken, A.; Jordhøy, M.S.; Skovlund, E.; Audisio, R.A.; Johannessen, H.O.; Bakka, A.; Wyller, T.B. Comprehensive geriatric assessment can predict complications in elderly patients after elective surgery for colorectal cancer: A prospective observational cohort study. Crit. Rev. Oncol. Hematol. 2010, 76, 208–217. [Google Scholar] [CrossRef] [PubMed] [Green Version]
- Neal, R.D.; Tharmanathan, P.; France, B.; Din, N.U.; Cotton, S.; Fallon-Ferguson, J.; Hamilton, W.; Hendry, A.; Hendry, M.; Lewis, R.; et al. Is increased time to diagnosis and treatment in symptomatic cancer associated with poorer outcomes? Systematic review. Br. J. Cancer 2015, 112 (Suppl. S1), S92–S107. [Google Scholar] [CrossRef] [PubMed] [Green Version]
- Sohal, K.; Mason, D.; Birkinshaw, J.; West, J.; McEachan, R.; Elshehaly, M.; Cooper, D.; Shore, R.; McCooe, M.; Lawton, T.; et al. Connected Bradford: A Whole System Data Linkage Accelerator. Wellcome Open Res. 2022, 7, 26. [Google Scholar] [CrossRef]
- Benchimol, E.I.; Smeeth, L.; Guttmann, A.; Harron, K.; Moher, D.; Petersen, I.; Sørensen, H.T.; von Elm, E.; Langan, S.M.; RECORD Working Committee. The REporting of studies Conducted using Observational Routinely-collected health Data (RECORD) Statement. PLoS Med. 2015, 12, e1001885. [Google Scholar] [CrossRef]
- Bingham, D.D.; Daly-Smith, A.; Hall, J.; Seims, A.; Dogra, S.A.; Fairclough, S.J.; Ajebon, M.; Kelly, B.; Hou, B.; Shire, K.A.; et al. COVID-19 lockdown: Ethnic differences in children’s self-reported physical activity and the importance of leaving the home environment; a longitudinal and cross-sectional study from the Born in Bradford birth cohort study. Int. J. Behav. Nutr. Phys. Act. 2021, 18, 117. [Google Scholar] [CrossRef]
- City of Bradford Metropolitan District Council. Ethnicity in Bradford-Understanding Bradford District. Available online: https://ubd.bradford.gov.uk/media/1348/ethnicity-in-bradford.pdf (accessed on 13 June 2022).
- Round, T.; Gildea, C.; Ashworth, M.; Moller, H. Association between use of urgent suspected cancer referral and mortality and stage at diagnosis: A 5-year national cohort study. Br. J. Gen. Pract. 2020, 70, e389–e398. [Google Scholar] [CrossRef] [Green Version]
- Wiering, B.; Lyratzopoulos, G.; Hamilton, W.; Campbell, J.; Abel, G. Concordance with urgent referral guidelines in patients presenting with any of six ‘alarm’ features of possible cancer: A retrospective cohort study using linked primary care records. BMJ Qual. Saf. 2021, 31, 579–589. [Google Scholar] [CrossRef]
- Connected Health Cities. Connected Bradford Brochure. Available online: https://connectedhealthcities.github.io/connected-yorkshire/connected-bradford-brochure.html (accessed on 19 April 2022).
- IHTSDO. Overview of SNOMED CT. Available online: https://www.nlm.nih.gov/healthit/snomedct/snomed_overview.html (accessed on 2 September 2022).
- Watson, J.; Nicholson, B.D.; Hamilton, W.; Price, S. Identifying clinical features in primary care electronic health record studies: Methods for codelist development. BMJ Open 2017, 7, e019637. [Google Scholar] [CrossRef]
- Price, S.; Spencer, A.; Zhang, X.; Ball, S.; Lyratzopoulos, G.; Mujica-Mota, R.; Stapley, S.; Ukoumunne, O.C.; Hamilton, W. Trends in time to cancer diagnosis around the period of changing national guidance on referral of symptomatic patients: A serial cross-sectional study using UK electronic healthcare records from 2006–2017. Cancer Epidemiol. 2020, 69, 101805. [Google Scholar] [CrossRef] [PubMed]
- Moore, S.F.; Price, S.J.; Chowienczyk, S.; Bostock, J.; Hamilton, W. The impact of changing risk thresholds on the number of people in England eligible for urgent investigation for possible cancer: An observational cross-sectional study. Br. J. Cancer 2021, 125, 1593–1597. [Google Scholar] [CrossRef] [PubMed]
- UK Government. List of Ethnic Groups. Available online: https://www.ethnicity-facts-figures.service.gov.uk/style-guide/ethnic-groups (accessed on 7 June 2022).
- Jensen, H.; Torring, M.L.; Olesen, F.; Overgaard, J.; Vedsted, P. Cancer suspicion in general practice, urgent referral and time to diagnosis: A population-based GP survey and registry study. BMC Cancer 2014, 14, 636. [Google Scholar] [CrossRef] [Green Version]
- Office for National Statistics. Health State Life Expectancies by National Deprivation Deciles, England: 2017 to 2019. Available online: https://www.ons.gov.uk/peoplepopulationandcommunity/healthandsocialcare/healthinequalities/bulletins/healthstatelifeexpectanciesbyindexofmultipledeprivationimd/2017to2019 (accessed on 8 June 2022).
- Austin, P.C.; Tu, J.V.; Daly, P.A.; Alter, D.A. The use of quantile regression in health care research: A case study examining gender differences in the timeliness of thrombolytic therapy. Stat. Med. 2005, 24, 791–816. [Google Scholar] [CrossRef] [PubMed]
- Sterne, J.A.C.; White, I.R.; Carlin, J.B.; Spratt, M.; Royston, P.; Kenward, M.G.; Wood, A.M.; Carpenter, J.R. Multiple imputation for missing data in epidemiological and clinical research: Potential and pitfalls. BMJ 2009, 338, b2393. [Google Scholar] [CrossRef] [PubMed]
- StataCorp. Stata Statistical Software: Release 17; StataCorp LLC.: College Station, TX, USA, 2021. [Google Scholar]
- Sud, A.; Torr, B.; Jones, M.E.; Broggio, J.; Scott, S.; Loveday, C.; Garrett, A.; Gronthoud, F.; Nicol, D.L.; Jhanji, S.; et al. Effect of delays in the 2-week-wait cancer referral pathway during the COVID-19 pandemic on cancer survival in the UK: A modelling study. Lancet Oncol. 2020, 21, 1035–1044. [Google Scholar] [CrossRef]
- Hanna, T.P.; King, W.D.; Thibodeau, S.; Jalink, M.; Paulin, G.A.; Harvey-Jones, E.; O’Sullivan, D.E.; Booth, C.M.; Sullivan, R.; Aggarwal, A. Mortality due to cancer treatment delay: Systematic review and meta-analysis. BMJ 2020, 371, m4087. [Google Scholar] [CrossRef]
- Jones, D.J.; di Martino, E.; Bradley, S.H.; Essang, B.; Hemphill, S.; Wright, J.; Renzi, C.; Surr, C.; Clegg, A.P.; Neal, R. Factors influencing the symptom appraisal and help seeking of older adults with possible cancer: A mixed methods systematic review. Br. J. Gen. Pract. 2022, 72, e702–e712. [Google Scholar] [CrossRef]
- CRUK. Together We Can Help Beat Cancer in Bradford East; Cancer Research UK: London, UK, 2020. [Google Scholar]
- Dyba, T.; Randi, G.; Bray, F.; Martos, C.; Giusti, F.; Nicholson, N.; Gavin, A.; Flego, M.; Neamtiu, L.; Dimitrova, N.; et al. The European cancer burden in 2020: Incidence and mortality estimates for 40 countries and 25 major cancers. Eur. J. Cancer 2021, 157, 308–347. [Google Scholar] [CrossRef]
- CRUK. Cancer Incidence for Common Cancers. Available online: https://www.cancerresearchuk.org/health-professional/cancer-statistics/incidence/common-cancers-compared#ref- (accessed on 2 September 2022).
- Smittenaar, C.R.; Petersen, K.A.; Stewart, K.; Moitt, N. Cancer incidence and mortality projections in the UK until 2035. Br. J. Cancer 2016, 115, 1147–1155. [Google Scholar] [CrossRef] [Green Version]
- Dregan, A.; Moller, H.; Murray-Thomas, T.; Gulliford, M.C. Validity of cancer diagnosis in a primary care database compared with linked cancer registrations in England. Population-based cohort study. Cancer Epidemiol. 2012, 36, 425–429. [Google Scholar] [CrossRef] [PubMed]
- Dai, S.; Yang, M.; Song, J.; Dai, S.; Wu, J. Impacts of Frailty on Prognosis in Lung Cancer Patients: A Systematic Review and Meta-Analysis. Front. Med. 2021, 8, 715513. [Google Scholar] [CrossRef] [PubMed]
- Allen, K.; Brown, H.; Singh, K.; Krelle, H.; Bennett, A.; Gray, R.; Beck, H. Advancing Care, Advancing Years: Improving Cancer Treatment and Care for an Ageing Population; Cancer Research UK: London, UK, 2018; pp. 21, 37–39, 41. [Google Scholar]
- City of Bradford Metropolitan District Council. About Bradford’s Economy. Available online: https://www.bradford.gov.uk/business/bradford-economy/about-bradfords-economy/ (accessed on 13 June 2022).
- Smart, R.; Carter, B.; McGovern, J.; Luckman, S.; Connelly, A.; Hewitt, J.; Quasim, T.; Moug, S. Frailty Exists in Younger Adults Admitted as Surgical Emergency Leading to Adverse Outcomes. J. Frailty Aging 2017, 6, 219–223. [Google Scholar] [CrossRef] [PubMed]
- Spiers, G.F.; Kunonga, T.P.; Hall, A.; Beyer, F.; Boulton, E.; Parker, S.; Bower, P.; Craig, D.; Todd, C.; Hanratty, B. Measuring frailty in younger populations: A rapid review of evidence. BMJ Open 2021, 11, e047051. [Google Scholar] [CrossRef]
- Mathur, R.; Bhaskaran, K.; Chaturvedi, N.; Leon, D.A.; vanStaa, T.; Grundy, E.; Smeeth, L. Completeness and usability of ethnicity data in UK-based primary care and hospital databases. J. Public Health 2013, 36, 684–692. [Google Scholar] [CrossRef]
- Lansbury, L.N.; Roberts, H.C.; Clift, E.; Herklots, A.; Robinson, N.; Sayer, A.A. Use of the electronic Frailty Index to identify vulnerable patients: A pilot study in primary care. Br. J. Gen. Pract. 2017, 67, e751–e756. [Google Scholar] [CrossRef] [Green Version]
- van Kempen, J.A.; Schers, H.J.; Jacobs, A.; Zuidema, S.U.; Ruikes, F.; Robben, S.H.; Melis, R.J.; Olde Rikkert, M.G. Development of an instrument for the identification of frail older people as a target population for integrated care. Br. J. Gen. Pract. 2013, 63, e225–e231. [Google Scholar] [CrossRef] [Green Version]
- Keeble, E.; Roberts, H.C.; Williams, C.D.; Van Oppen, J.; Conroy, S.P. Outcomes of hospital admissions among frail older people: A 2-year cohort study. Br. J. Gen. Pract. 2019, 69, e555–e560. [Google Scholar] [CrossRef] [Green Version]
- Travers, J.; Romero-Ortuno, R.; Bailey, J.; Cooney, M.-T. Delaying and reversing frailty: A systematic review of primary care interventions. Br. J. Gen. Pract. 2019, 69, e61–e69. [Google Scholar] [CrossRef]
- Wynter-Blyth, V.; Moorthy, K. Prehabilitation: Preparing patients for surgery. BMJ 2017, 358, j3702. [Google Scholar] [CrossRef]


| Total (%) | Not Frail | Mild Frailty | Moderate Frailty | Severe Frailty | ||
|---|---|---|---|---|---|---|
| n = 7460 | 5719 | 1401 | 288 | 52 | ||
| Sex | ||||||
| Female | 3554 | 47.64% | 2728 | 648 | 147 | 31 |
| Age Category (years) | ||||||
| 18–64 | 2516 | 33.73% | 2377 | 132 | <10 ** | <10 |
| 65–74 | 2077 | 27.84% | 1705 | 320 | 47 | <10 |
| 75–84 | 1973 | 26.45% | 1249 | 585 | 119 | 20 |
| 85–104 | 894 | 11.98% | 388 | 364 | 117 | 25 |
| Ethnicity | ||||||
| Asian or Asian British | 547 | 7.33% | 410 | 111 | 22 | <10 |
| Black, Black British, | 47 | 0.63% | 37 | <10 | <10 | <10 |
| African or Caribbean | ||||||
| Mixed or multiple ethnic groups | 2542 | 34.08% | 1936 | 486 | 99 | 21 |
| Other ethnic group | 40 | 0.54% | 34 | <10 | <10 | <10 |
| White | 3247 | 43.53% | 2471 | 621 | 135 | 20 |
| Missing | 1037 | 13.90% | 831 | 173 | 28 | <10 |
| Index of Multiple Deprivation (IMD) Decile | ||||||
| 1 and 2 | 2351 | 31.51% | 1749 | 466 | 113 | 23 |
| 3 and 4 | 1474 | 19.76% | 1124 | 280 | 59 | 11 |
| 5 and 6 | 1180 | 15.82% | 916 | 220 | 39 | <10 |
| 7 and 8 | 1004 | 13.46% | 806 | 165 | 29 | <10 |
| 9 and 10 | 876 | 11.74% | 682 | 165 | 25 | <10 |
| Missing | 575 | 7.71% | 442 | 105 | 23 | <10 |
| Cognitive impairment | ||||||
| No dementia diagnosis | 7117 | 95.40% | 5563 | 1278 | 240 | 36 |
| Dementia diagnosis | 343 | 4.60% | 156 | 123 | 48 | 16 |
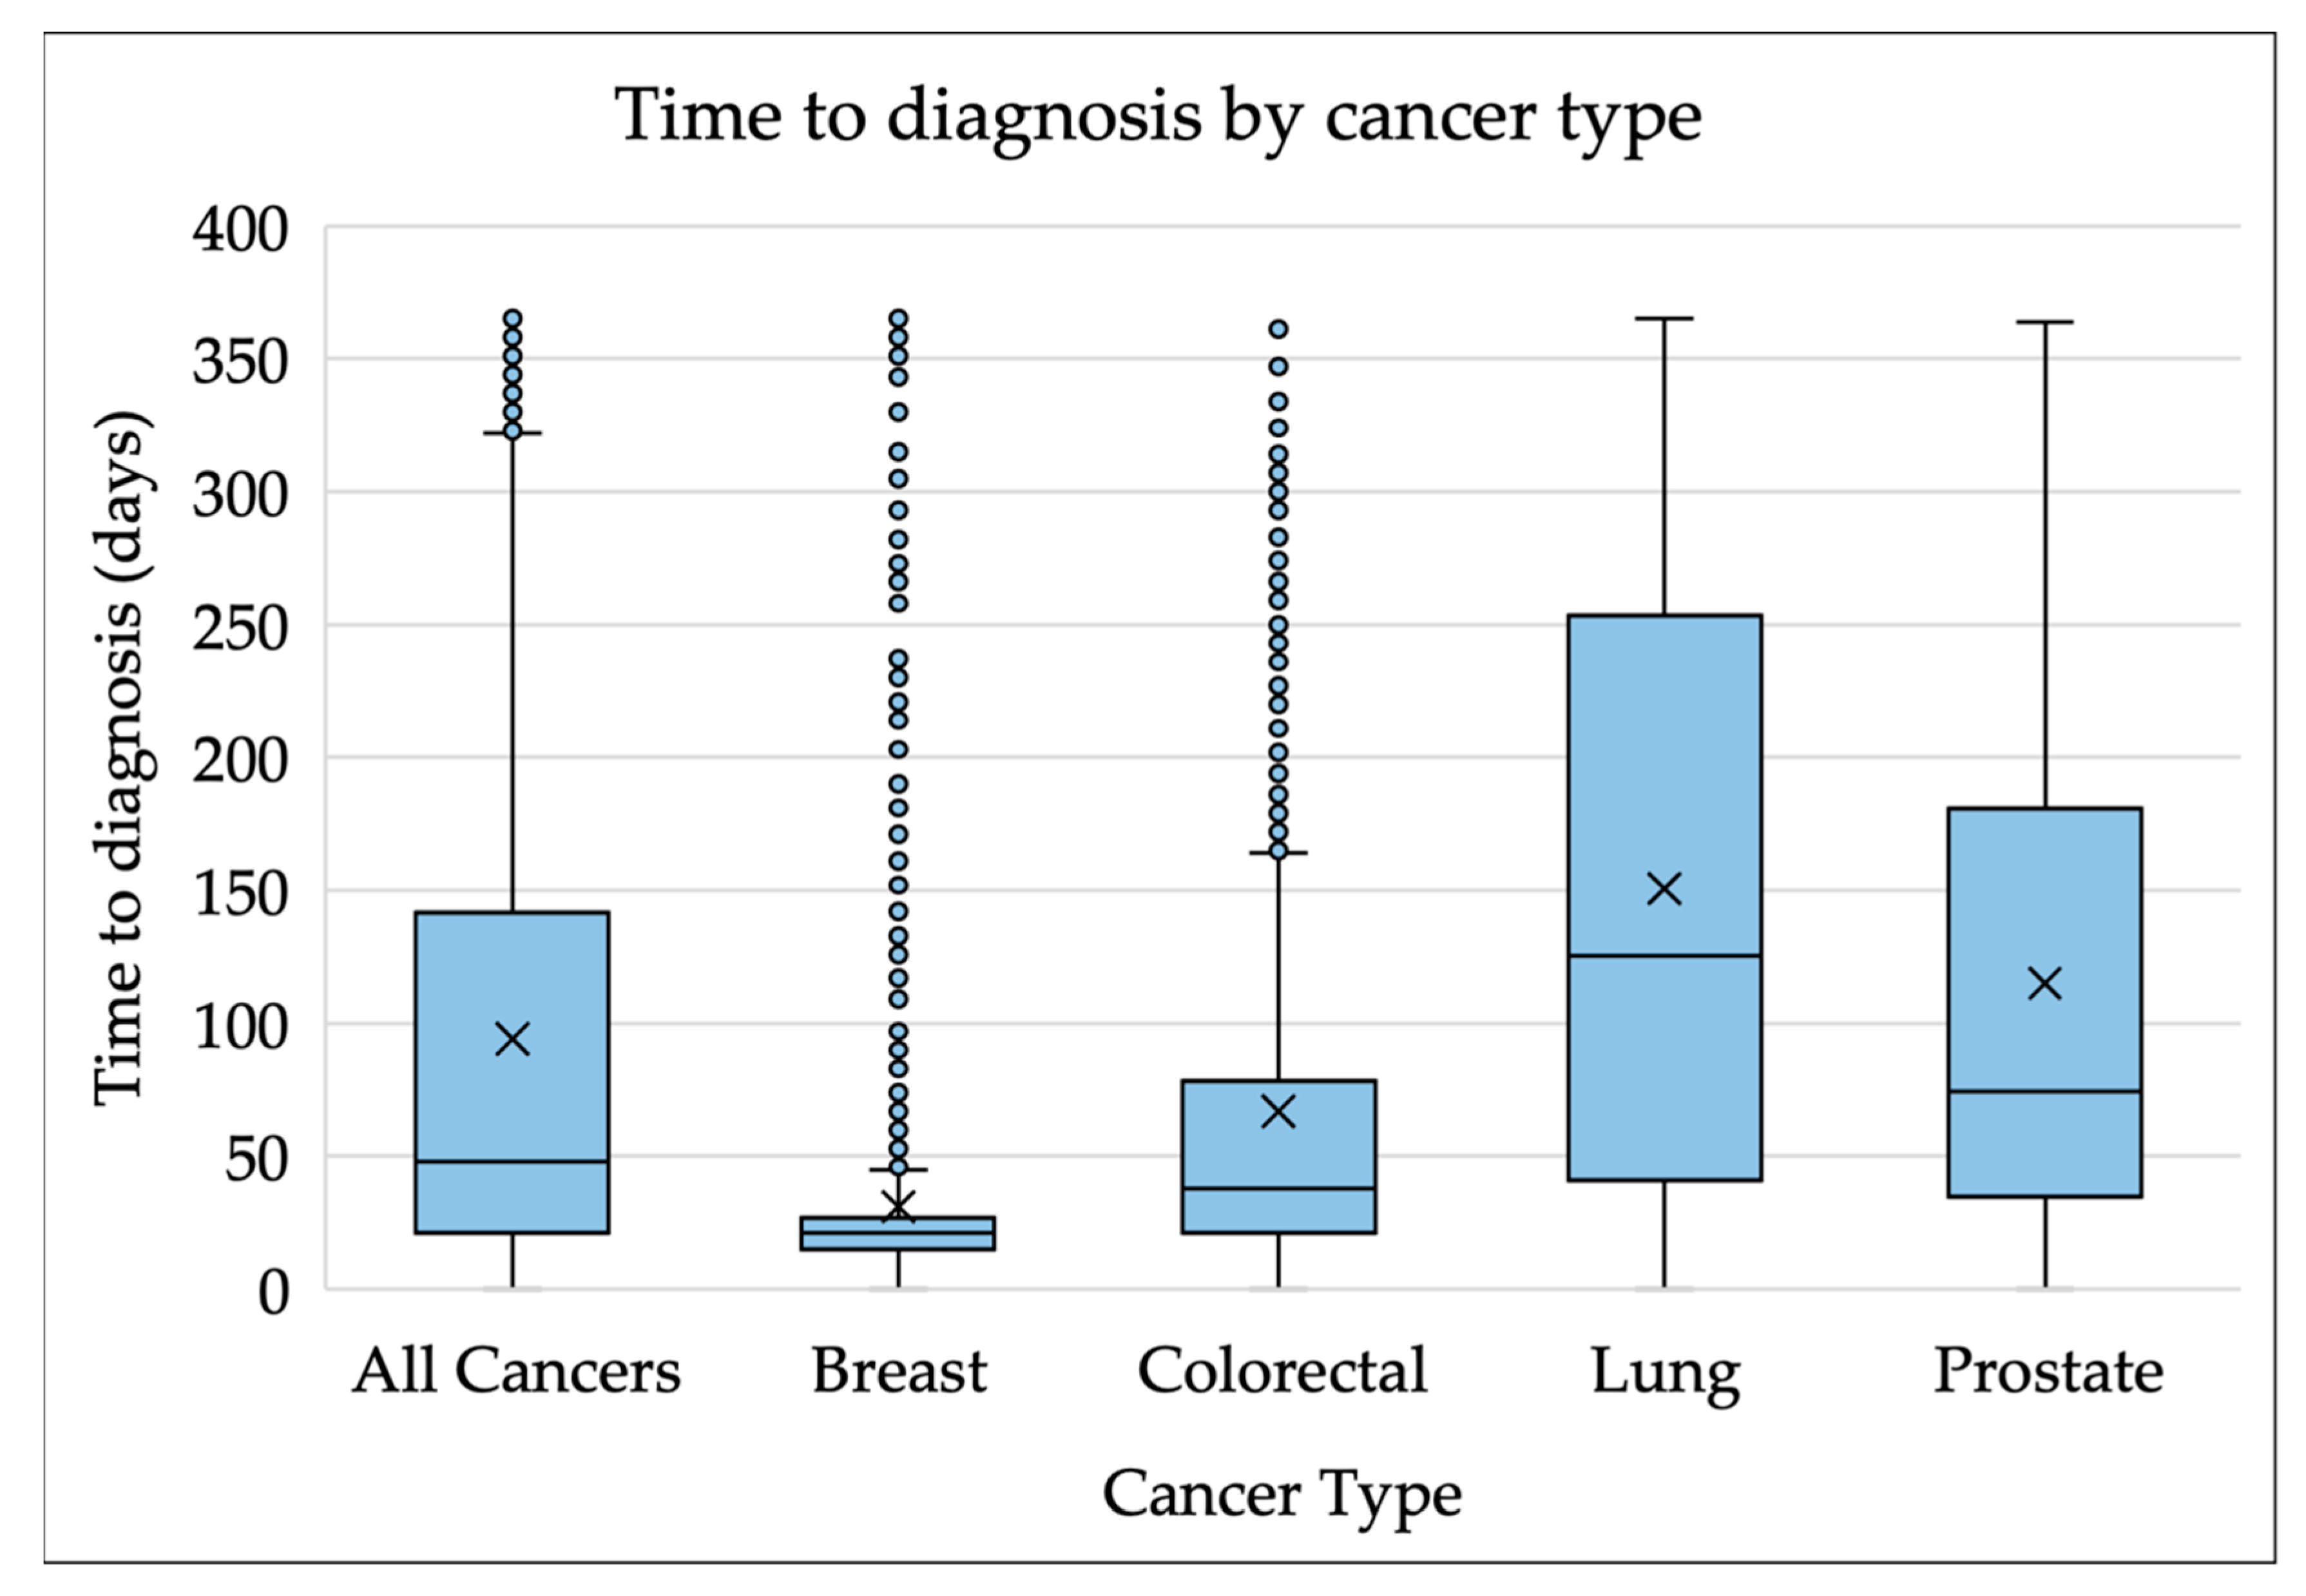
| Cancer Type | ||||||
| Lung | 1502 | 20.13% | 1037 | 368 | 83 | 14 |
| Breast | 1408 | 18.87% | 1151 | 201 | 47 | <10 |
| Prostate | 1284 | 17.21% | 988 | 252 | 40 | <10 |
| Colorectal | 1049 | 14.06% | 842 | 170 | 30 | <10 |
| Bladder/Urinary Tract | 819 | 10.98% | 607 | 174 | 33 | <10 |
| Pancreatic | 233 | 3.12% | 161 | 52 | 15 | <10 |
| Ovarian | 224 | 3.00% | 201 | 19 | <10 | <10 |
| Oesophageal | 177 | 2.37% | 128 | 40 | <10 | <10 |
| Brain | 175 | 2.35% | 143 | 24 | <10 | <10 |
| Melanoma | 129 | 1.73% | 108 | 17 | <10 | <10 |
| Renal | 116 | 1.55% | 75 | 32 | <10 | <10 |
| Lymphoma | 98 | 1.31% | 81 | 12 | <10 | <10 |
| Gastric | 75 | 1.01% | 55 | 16 | <10 | <10 |
| Endometrial | 68 | 0.91% | 60 | <10 | <10 | <10 |
| Cervical | 36 | 0.48% | 32 | <10 | <10 | <10 |
| Head and Neck | 31 | 0.42% | 23 | <10 | <10 | <10 |
| Myeloma | 10 | 0.13% | <10 | <10 | <10 | <10 |
| Other * | 26 | 0.35% | <25 | <10 | <10 | <10 |
| Unadjusted Difference | Adjusted Difference * | ||||||
|---|---|---|---|---|---|---|---|
| Median | 75th Centile | 90th Centile | Median | 75th Centile | 90th Centile | ||
| (95th CI) | (95th CI) | ||||||
| n = 7460 (%) Electronic frailty index (eFI) | |||||||
| Not frail | 5719 (76.66) | Ref. | Ref. | Ref. | Ref. | Ref. | Ref. |
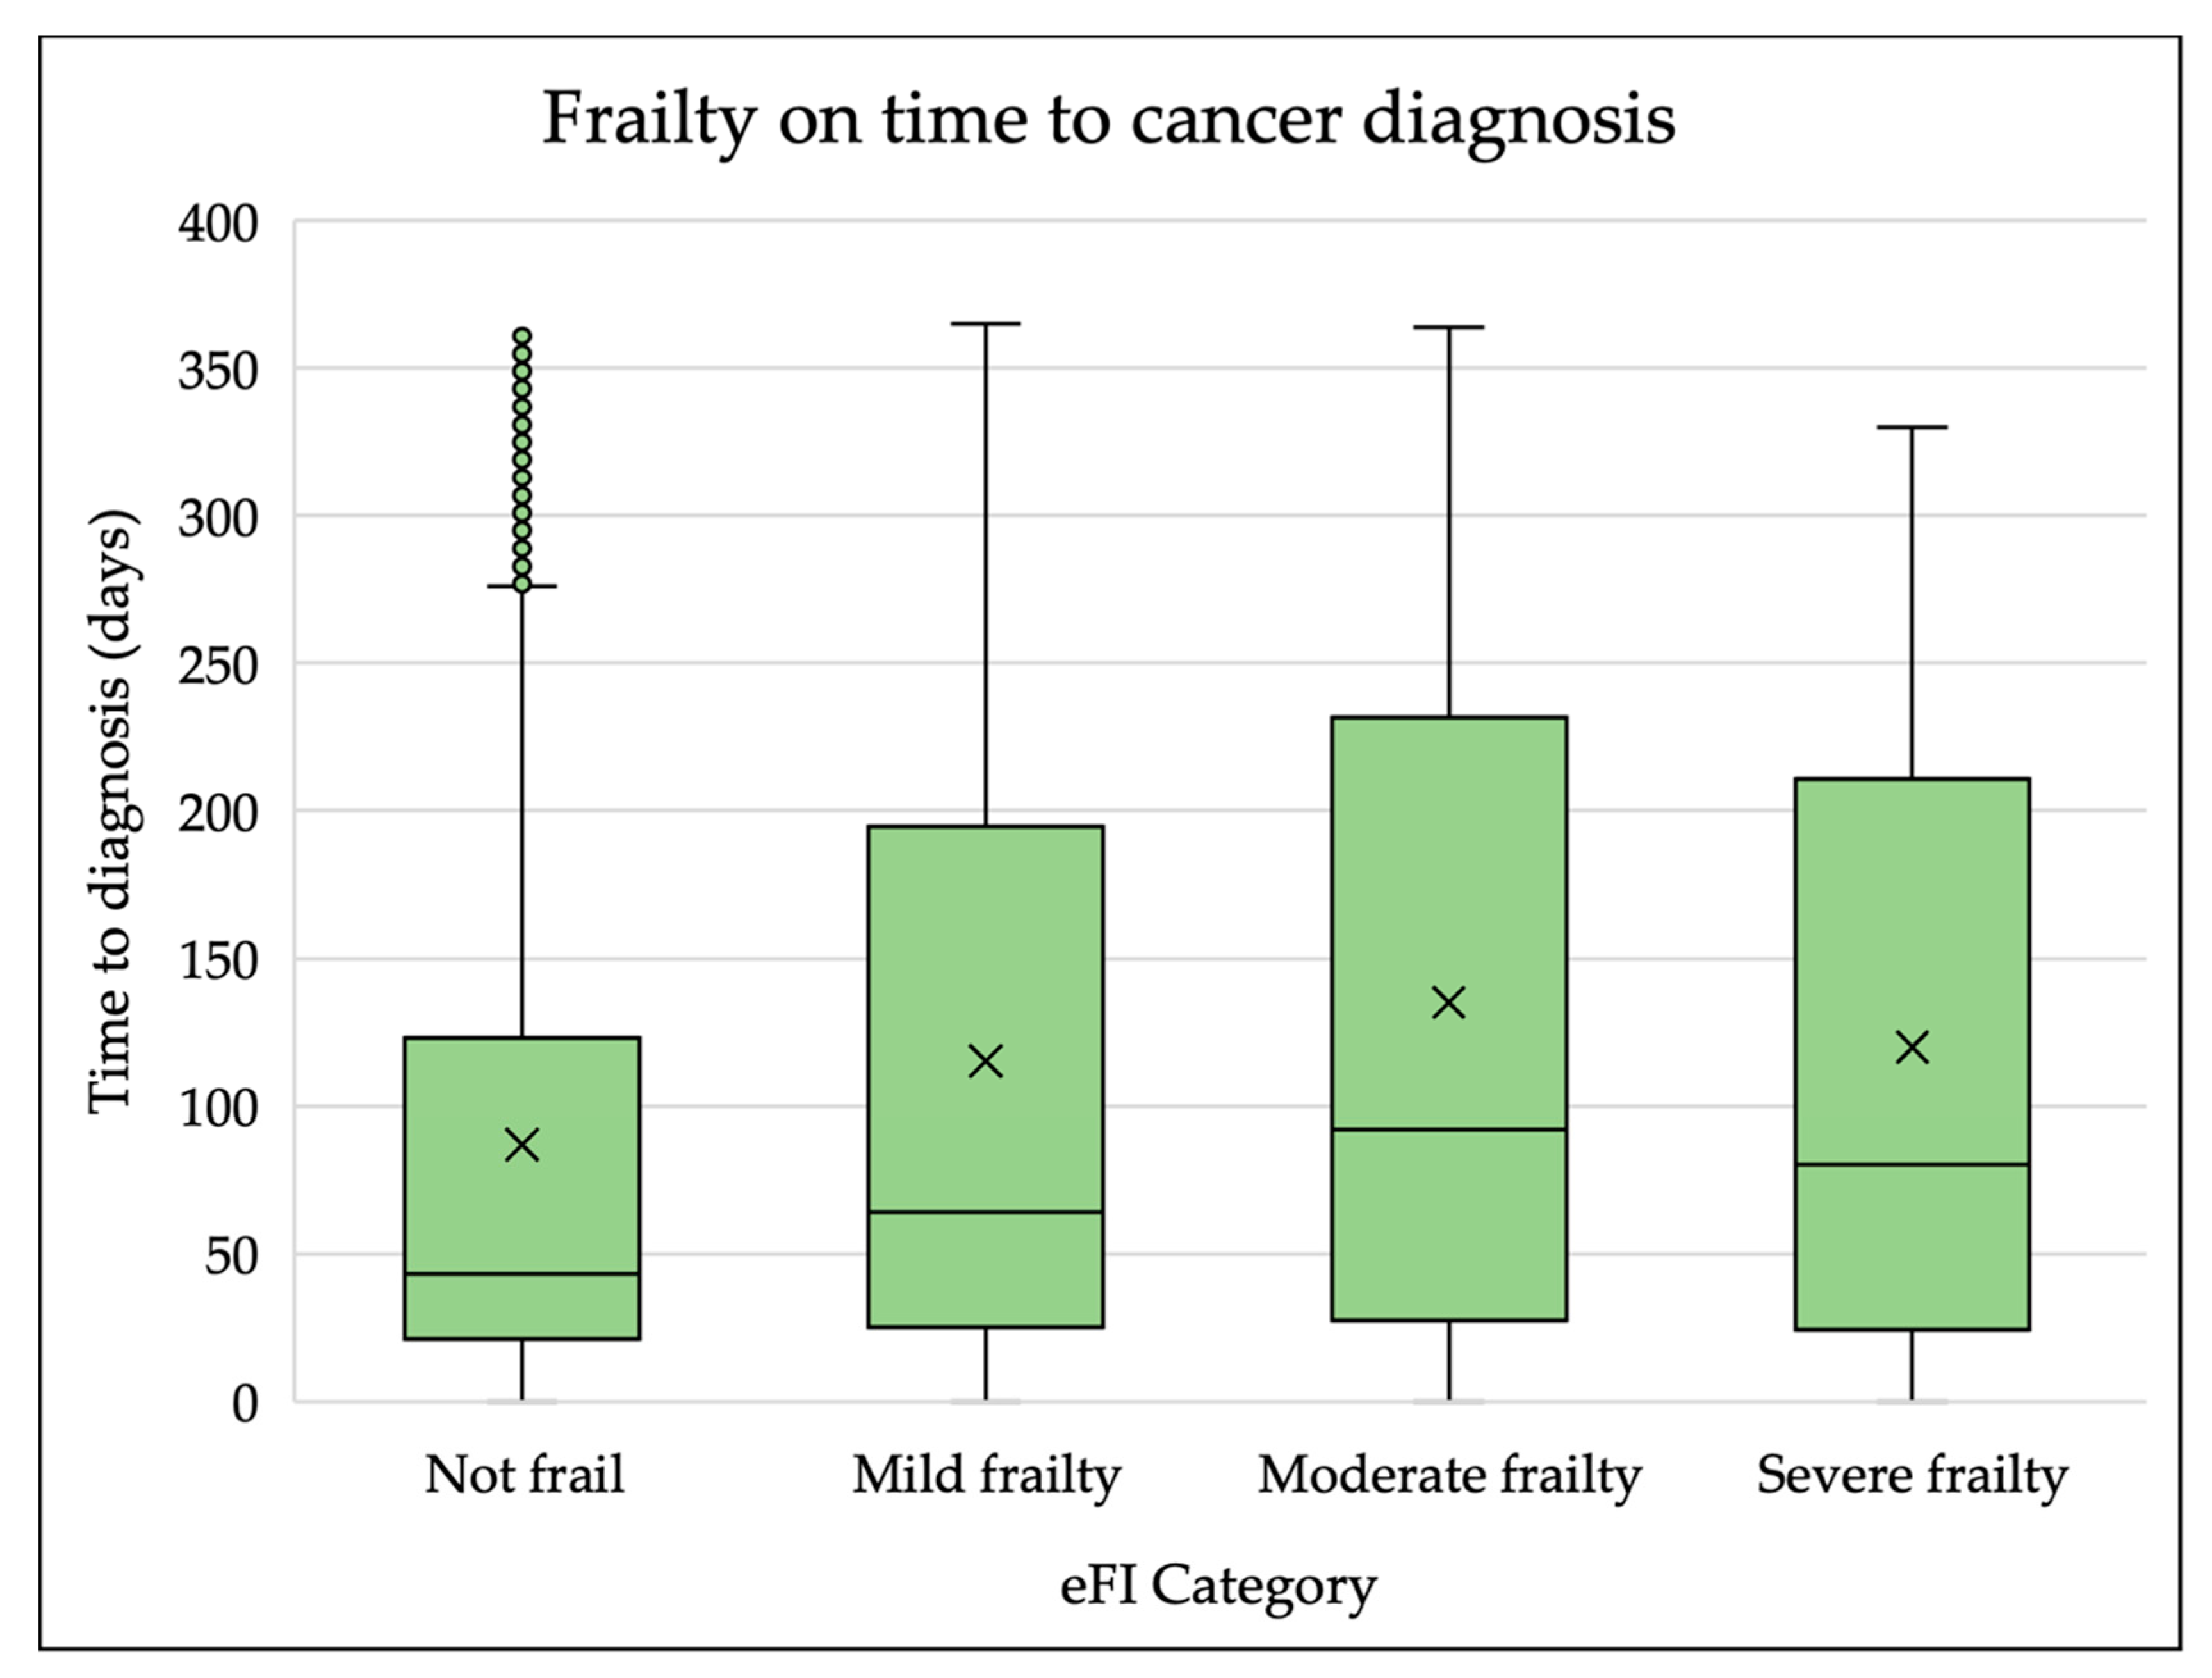
| Mild frailty | 1401 (18.78) | 21 (15–27) ** p = 0.000 | 70 (50–90) p = 0.000 | 61 (48–74) p = 0.000 | 7 (2–11) p = 0.003 | 21 (9–34) p = 0.001 | 24 (11–37) p = 0.000 |
| Moderate frailty | 288 (3.86) | 49 (23–75) p = 0.000 | 107 (76–138) p = 0.000 | 74 (55–93) p = 0.000 | 23 (4–42) p = 0.019 | 51 (25–76) p = 0.000 | 42 (25–59) p = 0.000 |
| Severe frailty | 52 (0.70) | 44 (−13–101) p = 0.130 | 75 (13–137) p = 0.018 | 58 (2–114) p = 0.043 | 11 (−27–48) p = 0.581 | 45 (−9–100) p = 0.103 | 8 (−23–38) p = 0.621 |
| Constant | - | 43 | 123 | 250 | 64 | 150 | 280 |
| Age (years) | |||||||
| 18–64 | 2516 (33.73) | Ref. | Ref. | Ref. | Ref. | Ref. | Ref. |
| 65–74 | 2077 (27.84) | 18 (14–22) p = 0.000 | 58 (43–73) p = 0.000 | 45 (24–66) p = 0.000 | −1 (−3–2) p = 0.572 | 0 (−5–5) p = 0.912 | 1 (−11–13) p = 0.853 |
| 75–84 | 1973 (26.45) | 24 (19–29) p = 0.000 | 69 (52–86) p = 0.000 | 52 (33–71) p = 0.000 | 1 (−1–4) p = 0.345 | 1 (−5–6) p = 0.831 | −3 (−15–8) p = 0.563 |
| 85–101 | 894 (11.98) | 19 (12–26) p = 0.000 | 73 (45–101) p = 0.000 | 57 (37–77) p = 0.000 | −1 (−5–3) p = 0.593 | 2 (−7–11) p = 0.647 | −9 (−23–6) p = 0.247 |
| Constant | - | 35 | 99 | 235 | 64 | 150 | 280 |
| Age Category (Years) | ||||
|---|---|---|---|---|
| 18–64 | 65–74 | 75–84 | 85–104 | |
| (95th CI) | ||||
| eFI | ||||
| Not frail | Ref. | Ref. | Ref. | Ref. |
| Mild frailty | 1 (−7–9) p = 0.803 | 8 (−3–18) p = 0.214 | 7 (−1–14) p = 0.064 | 8 (0–15) p = 0.065 |
| Moderate frailty | 171 (75–266) * p = 0.001 | 97 (42–152) p = 0.001 | 16 (−16–48) p = 0.317 | 10 (−2–23) p = 0.170 |
| Severe frailty | 20 (−19–59) p = 0.303 | 5 (−97–107) p = 0.909 | 17 (−52–87) p = 0.637 | 9 (−51–68) p = 0.800 |
| Constant | 51 | 69 | 66 | 70 |
| Cancer Type | ||||
|---|---|---|---|---|
| Breast | Colorectal | Lung | Prostate | |
| (95th CI) | ||||
| eFI | ||||
| Not frail | Ref. | Ref. | Ref. | Ref. |
| Mild frailty | 0 (−1–1) p = 0.805 | 11 (0.36–22) * p = 0.043 | 50 (21–78) p = 0.001 | 32 (3–60) p = 0.028 |
| Moderate frailty | 1 (−3–5) p = 0.611 | 19 (−18–56) p = 0.324 | 90 (46–134) p = 0.000 | 52 (−15–119) p = 0.130 |
| Severe frailty | −2 (−9–5) p = 0.577 | 8 (−65–82) p = 0.827 | 115 (23–207) p = 0.015 | −19 (−155–117) p = 0.786 |
| Constant | 20 | 35 | 79 | 73 |
Publisher’s Note: MDPI stays neutral with regard to jurisdictional claims in published maps and institutional affiliations. |
© 2022 by the authors. Licensee MDPI, Basel, Switzerland. This article is an open access article distributed under the terms and conditions of the Creative Commons Attribution (CC BY) license (https://creativecommons.org/licenses/by/4.0/).
Share and Cite
Summerfield, C.; Smith, L.; Todd, O.; Renzi, C.; Lyratzopoulos, G.; Neal, R.D.; Jones, D. The Effect of Older Age and Frailty on the Time to Diagnosis of Cancer: A Connected Bradford Electronic Health Records Study. Cancers 2022, 14, 5666. https://doi.org/10.3390/cancers14225666
Summerfield C, Smith L, Todd O, Renzi C, Lyratzopoulos G, Neal RD, Jones D. The Effect of Older Age and Frailty on the Time to Diagnosis of Cancer: A Connected Bradford Electronic Health Records Study. Cancers. 2022; 14(22):5666. https://doi.org/10.3390/cancers14225666
Chicago/Turabian StyleSummerfield, Charlotte, Lesley Smith, Oliver Todd, Cristina Renzi, Georgios Lyratzopoulos, Richard D. Neal, and Daniel Jones. 2022. "The Effect of Older Age and Frailty on the Time to Diagnosis of Cancer: A Connected Bradford Electronic Health Records Study" Cancers 14, no. 22: 5666. https://doi.org/10.3390/cancers14225666