1. Introduction
In neurooncology, magnetic resonance imaging (MRI) represents the gold standard when diagnosing gliomas, monitoring treatment, and assessing treatment response. Due to its widespread use, high spatial resolution, and good contrast in soft tissue, MRI is the method of choice. However, the use of MRI has limitations. First, the differentiation between glioma entities, as well as between neoplastic and other lesions, particularly after treatment, causes difficulties. Chemo- and radiotherapy can induce post-therapeutic effects, including radiation necrosis and edema, which are difficult to differentiate from tumor progression or recurrence [
1]. Additionally, MRI can be unreliable when determining tumor size or growth. Recent studies have shown that when comparing the tumor volume assessed in positron emission tomography (PET) and MRI, substantial spatial differences can be found [
2]. Therefore, according to the RANO working group, the additional use of radiolabeled amino acids is recommended [
3]. O-(2-[
18F]fluoroethyl)-L-tyrosine ([
18F]FET) PET can be used to detect biologically active tumor parts, and the low uptake in normal brain parenchyma leads to an enhanced tumor-to-brain contrast, thus enabling an accurate differentiation of tumor from healthy tissue. Previous studies have shown that amino acid PET can identify the glioma extent more reliably than MRI [
4]. However, around 30% of low-grade gliomas and 5% of high-grade gliomas show indifferent or even decreased amino acid uptake compared to healthy tissue [
5]. The pathomechanism for this phenomenon is still unclear. Although previous studies suggest that the L-amino acid transporter 1 (LAT1) primarily promotes [
18F]FET uptake, [
18F]FET-negative gliomas did not show a reduced LAT1 expression in immunohistochemistry [
6,
7]. It remains indistinct whether [
18F]FET-negative gliomas have a favorable prognosis or not. One study reported that a small number of patients with photopenic gliomas, meaning gliomas with lower amino acid uptake than healthy tissue, even have an inferior prognosis compared to isometabolic gliomas [
8]. However, these findings need to be further validated in larger patient cohorts also with respect to the underlying biological mechanisms.
Radiomics, as a subdiscipline of artificial intelligence, is based on the extraction of quantitative features from medical images such as MRI, PET, or computed tomography (CT). Radiomics is increasingly used to noninvasively determine lesion properties such as the degree of tumor heterogeneity or shape, providing additional information from routinely acquired images [
9,
10,
11]. By combining pathomolecular parameters and radiomic features, prognostic models can be generated, enabling automation of various steps within the diagnostic routine. Radiomics is of increasing interest, as it often achieves higher diagnostic accuracy than conventional PET image parameters alone [
12,
13].
The aim was to evaluate whether [18F]FET-negative gliomas contain information that cannot be extracted by conventional visual read but by radiomic feature analysis and to what extent radiomics from conventional late static, early static, and dynamic time-to-peak PET images may help to identify tumor tissue.
2. Materials and Methods
2.1. Patients
For this retrospective study, we included 46 patients with a newly diagnosed, histologically verified glioma who had undergone a dynamic [18F]FET PET scan at the Department of Nuclear Medicine of the University Hospital, LMU Munich, and showed tumoral [18F]FET uptake equal or below the background activity. Gliomas were visually classified as [18F]FET-negative by trained nuclear medicine physicians. All patients signed written informed consent as part of the clinical routine, and the local ethics committee approved the retrospective analysis of the data (approval number 604-16).
Tissue samples were obtained from stereotactic biopsy or surgery and used for glioma classification according to the 2021 WHO guidelines [
14]. Molecular markers such as isocitrate dehydrogenase (IDH) mutation status and codeletion of chromosome arms 1p and 19q (1p/19q codeletion) were obtained in accordance with previous studies [
15,
16]. Furthermore, the O
6-methylguanine-DNA-methyltransferase (MGMT) promoter methylation was determined [
16].
2.2. [18F]FET PET Imaging
Dynamic [
18F]FET PET scans were acquired with an ECAT EXACT HR+ scanner (Siemens Healthineers, Erlangen, Germany) after intravenous bolus injection of a standard dose of 185 MBq of [
18F]FET, according to standard protocols [
17]. Dynamic emission data were recorded 0–40 min post-injection (p. i.) in 3D mode with 16 frames (7 × 10 s, 3 × 30 s, 1 × 2 min, 3 × 5 min, and 2 × 10 min). Image reconstruction and processing, including motion correction, were performed as described previously [
18].
2.3. MR Imaging
All patients underwent routine MRI prior to tissue sampling with a 1.5 T or 3.0 T magnet before and after the injection of a gadolinium-based contrast agent (MultiHance, Bracco Imaging, Milan, Italy). Axial T1- and T2-weighted and FLAIR sequenced were acquired.
2.4. Delineation of Tumor and Background Volumes
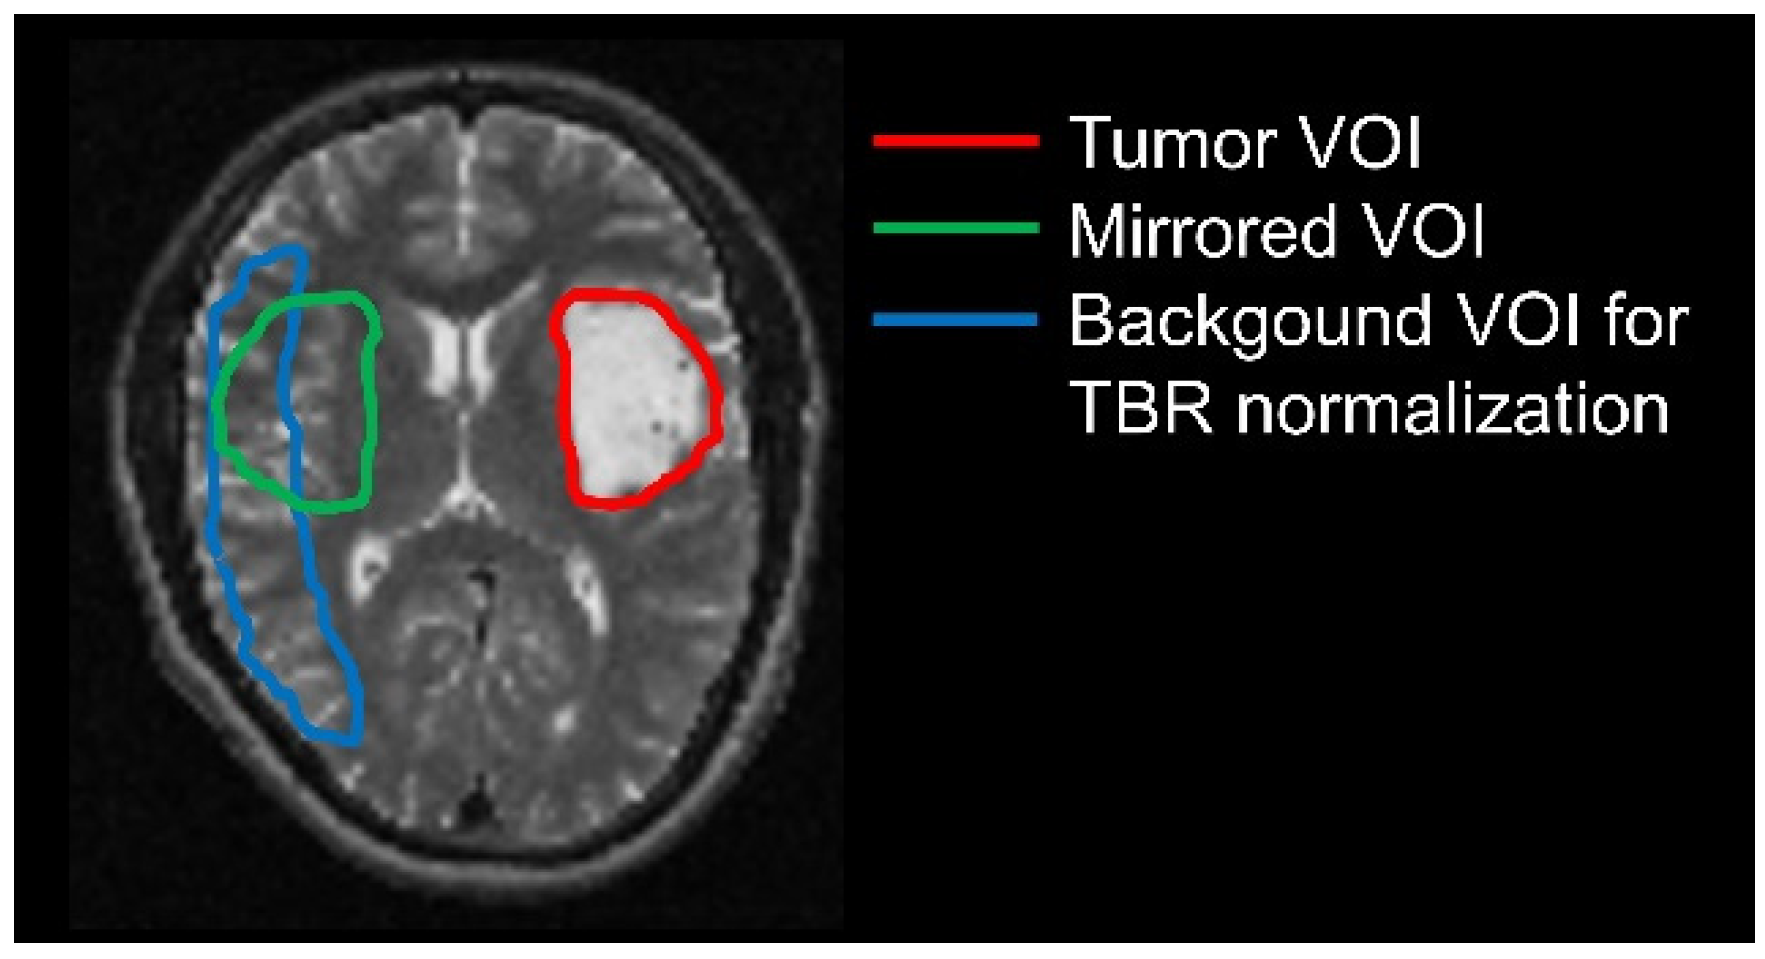
All volumes of interest (VOIs) were defined using PMOD View tool (version 3.5, PMOD Technologies LLC, Zurich, Switzerland). First, PMOD Fusion tool (version 3.5) was used to coregister and resample each patient’s T2/FLAIR image to the corresponding [18F]FET PET image. Since for [18F]FET-negative gliomas the VOI cannot be defined within PET images, manual contouring of signal hyperintensity was performed in the T2/FLAIR weighted images. This VOI was then applied to extract information from dynamic [18F]FET PET data.
A crescent-shaped background VOI manually drawn in the contralateral hemisphere served as reference tissue for the quantification of tumor-to-background ratios (TBR). This procedure has proven to yield most stable background values for quantification purposes with the lowest inter- and intra-reader variability [
19].
A second background VOI was obtained by mirroring the manually generated tumor VOI to the contralateral unaffected brain tissue, excluding the ventricle (
Figure 1). This second VOI was chosen as it enables a direct comparison between healthy and tumor tissue for radiomics analyses.
2.5. Generation of Parametric Images
Static early 5–15 min p. i. and standard 20–40 min p. i. summation images were calculated from dynamic PET data and normalized with the respective mean uptake within the crescent-shaped background VOI, yielding early TBR
5–15 and standard TBR
20–40 images. In addition to quantification using static images, parametric images containing information on the peak time point (time-to-peak, TTP) of each voxel’s time-activity curve were created as described previously [
12,
18].
2.6. Extraction of Radiomic Features
Different kinds of quantitative features were extracted from medical images. These were calculated directly from image intensities or intensity histograms (first order), from a second image obtained by the application of image filters aiming to describe image texture, or from the tumor label mask yielding shape information on the segmented tumor VOI. These radiomic features were extracted with the open-source Python (version 3.8) package pyradiomics (version 3.0.1 [
18]). The default first order (n = 18) and texture (n = 75) features were included. Most of the feature definitions implemented in pyradiomics comply with definitions by the Image Biomarker Standardization Initiative (IBSI) [
20].
2.7. Statistical Analyses
Results are provided as mean and standard deviation and/or median and range. Statistical analysis was performed with IBM SPSS Statistics (version 28). For each radiomic feature, differences between tumor and healthy tissue were evaluated using Wilcoxon test for paired non-parametric variables. p-values below 0.05 were considered statistically significant.
Analyses were performed for the entire patient cohort of [18F]FET-negative gliomas and for the subgroup of only isometabolic gliomas after exclusion of cases with visually photopenic defects.
2.8. Differentiation of Tumor from Healthy Tissue Using Logistic Regression
In addition to the direct comparison of single radiomic features in [18F]FET-negative gliomas and healthy tissue, the ability to differentiate tumors from healthy tissue using machine learning was addressed. Tumor was distinguished from healthy tissue for the whole cohort and for isometabolic and photopenic gliomas separately. The respective classification procedure was implemented using python (version 3.8) and scikit-learn package (version 1.0.2).
Machine learning was performed using logistic regression (LR) classifiers optimizing the area under the receiver operating characteristic curve (AUC). LR was applied in balanced mode, which allows for automatically adjusting sample weights according to class frequencies and thus reducing the effect of imbalanced input data. Liblinear solver was applied with L2 regularization, thus allowing for preventing overfitting and handling multicollinearity. The remaining settings of the LR classifiers were set to the default values defined in scikit-learn.
The machine learning pipeline included the following steps: (1) standardization of features by removing the mean and scaling to unit variance, (2) exclusion of features with zero variance, (3) tuning of the inverse regularization strength C, which adjusts L2 penalty using cross-validation (CV). In order to report cross-validated scores, this pipeline was inserted into an outer CV loop of a nested-CV procedure. Inner and outer CV loops were chosen to have 50 repeats and 5 folds with stratified splits containing equal distributions of the class labels in each fold. The high number of random splits in repeated CV improves the robustness of performance estimates.
3. Results
3.1. Patient Characteristics
A total of 46 patients (median age 35 years, range 16–72 years) were enrolled in this study. A total of 29 gliomas were classified as astrocytoma, IDH mutant (22 WHO grade two, 6 WHO grade three, 1 WHO grade four), 5 gliomas as an oligodendroglioma, IDH mutant with 1p/19q codeletion (5 WHO grade two), 11 gliomas as glioblastoma, IDH wildtype, and 1 glioma as WHO grade one. In three cases, the IDH mutation status could not be determined due to a lack of tumor tissue for reevaluation (two cases histologically classified as diffuse astrocytoma WHO grade two, one case as anaplastic astrocytoma WHO grade three according to WHO 2016 classification). A total of 17 patients presented with photopenic defects and 29 with isometabolic gliomas, which are not visually identifiable in [18F]FET PET images.
3.2. Differences between [18F]FET-Negative Tumor and Healthy Tissue—Overview
The numbers of significant features (
p < 0.05) according to the Wilcoxon test for paired non-parametric variables are given in
Table 1. Notably, the largest proportion of significant features comprised parameters derived from TTP images (> 60%) and was lower in static early TBR
5–15 and standard TBR
20–40 images, particularly in the subgroup of isometabolic gliomas. All results from the Wilcoxon test are provided in
Supplementary Table S1.
3.3. Differences between Isometabolic Tumor and Healthy Tissue
In standard TBR20–40 images, 8 out of 11 significant features were first-order features quantifying the magnitude of voxel values, which was higher in tumors compared to healthy tissue. Among texture features, for example, the size-zone non-uniformity, a feature measuring the variability of size zone volumes, presented with significantly lower mean values in healthy tissue, indicating that tumor tissue, although visually [18F]FET-negative, shows more heterogeneity.
In early TBR5–15 images, only three features presented with a p-value < 0.05: skewness, cluster shade, and small area high gray level emphasis. For all features, the tumor showed higher mean values, indicating, e.g., a higher asymmetry of the intensity distribution or the gray level co-occurrence matrix in the tumor.
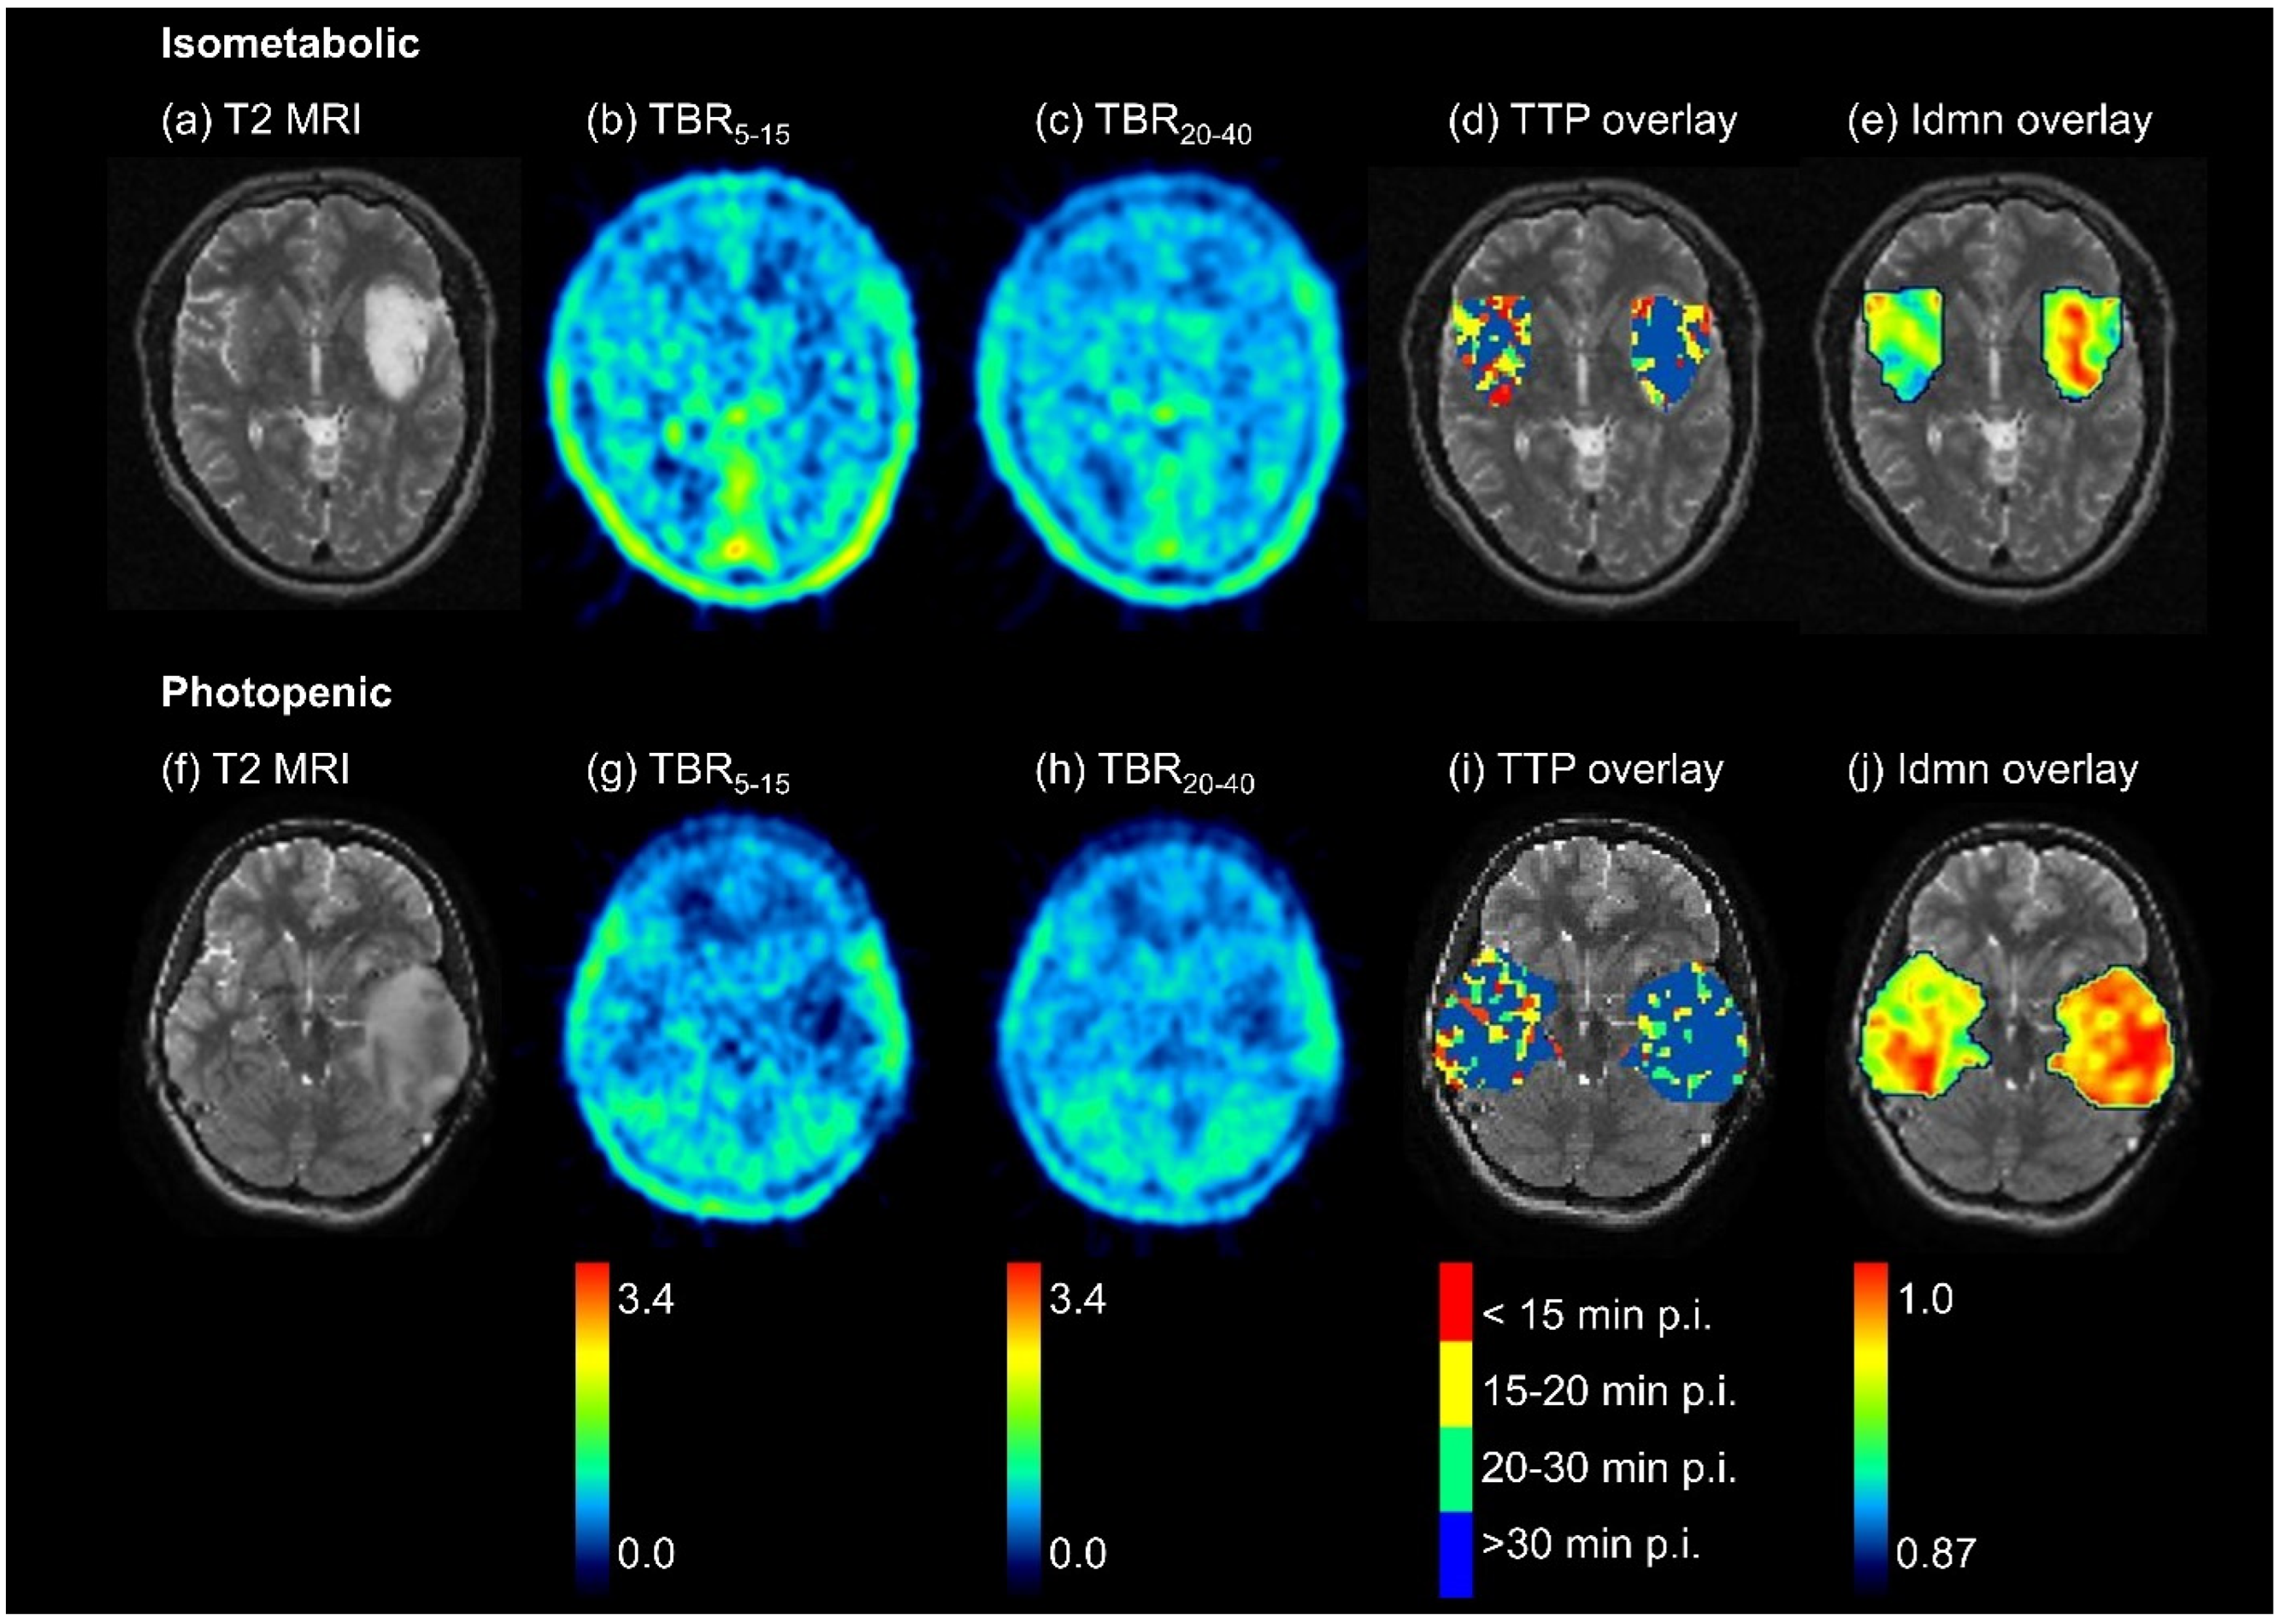
When analyzing the TTP images, the tumor VOI showed higher homogeneity and higher TTP values than the healthy tissue. A total of 14 out of 18 first-order features (78%) and 50 out of 75 texture features (67%) presented significant differences supporting these findings. This is exemplarily visualized in
Figure 2 for an isometabolic glioma.
3.4. Differences between Photopenic Tumor and Healthy Tissue
In standard TBR20–40 images, in the case of photopenic gliomas, most of the significant features were also first-order parameters (10/18, 55%). As expected, the features indicated a lower magnitude of voxel intensities and lower uniformity within the photopenic gliomas compared to healthy tissue.
The early TBR5–15 images showed comparable findings. Significant first-order features (10/18, 56%) included, for example, simple mean and median values, which were decreased within photopenic gliomas. Texture features such as dependence non-uniformity also indicated a lower uniformity of early TBR5–15 images in the tumor.
In TTP images, only the following first-order features were significant (4/18, 22%): energy, total energy, 10 percentile, and variance. Overall, the tendency of radiomic features derived from TTP images suggested a higher TTP and a lower variance in the tumor.
3.5. Differentiation of Tumor from Healthy Tissue Using Logistic Regression
Classification results using logistic regression are provided in
Table 2. Despite significant differences between tumor and non-tumor, the AUC values for the direct differentiation between both groups remained low. Better results were obtained for univariate analyses. Here, an AUC of 0.72 ± 0.14 could be reached for isometabolic gliomas using the feature high gray level run emphasis derived from TTP images and an AUC of 0.86 ± 0.15 for photopenic gliomas using the first order feature 10 percentile derived from TBR
5–15 images. In univariate analyses, texture features derived from TTP images and a few first-order features derived from TBR images yielded the highest scores for differentiation of isometabolic tumors from healthy tissue. In the case of photopenic tumors, first-order parameters derived from TBR
5–15 and TBR
20–40 images yielded the highest univariate AUC values. Results from univariate analyses are provided in
Supplementary Table S2.
4. Discussion
The characteristics of [
18F]FET-negative gliomas are not yet clarified. This study systematically evaluates the radiomic characteristics of [
18F]FET-negative gliomas within a group of newly diagnosed gliomas who had undergone a dynamic [
18F]FET PET scan and were visually classified as [
18F]FET-negative. Recent studies showed the usefulness of radiomic features derived from [
18F]FET PET images for improved tumor classification [
12,
13,
21], differentiation of treatment-related changes from tumor progression [
9] or local relapse [
22,
23], or for survival prediction [
24]. These studies show that radiomic analyses enable the extraction of additional clinically relevant information from images complementing simple VOI statistics and thus improve diagnostic and prognostic performance. However, radiomic analyses have not yet been applied to [
18F]FET-negative gliomas. Hence, the aim of this study was to investigate if radiomic analyses can provide more information in [
18F]FET-negative gliomas than is visually possible for a physician and if differences are found between tumor tissue and healthy background. For this purpose, radiomic features were extracted from standard 20–40 min p. i. TBR images, from early 5–15 min p. i. TBR images and TTP images were derived from dynamic analysis and were then compared between the T2-hyperintense tumor and its mirrored VOI in healthy background.
The largest fraction of significantly different features were obtained for features derived from TTP images. Similar results were found for isometabolic gliomas upon exclusion of photopenic gliomas, i.e., [18F]FET-negative gliomas, which cannot be visually identified.
Interestingly, only a small fraction of significantly different features derived from static TBR images were found for isometabolic gliomas. Surprisingly, the first-order features derived from TBR
20–40 images quantifying the magnitude of voxel values were significantly increased in tumors compared to healthy tissue, although this could not be identified visually. Further, features quantifying heterogeneity, for example, size zone uniformity, showed a higher variability of size zone volumes implying that the uptake pattern in tumor tissue is more heterogeneous than in healthy tissue. Such heterogeneity is not directly obvious when inspecting static TBR images and could, for example, reflect the presence of small sub-volumes that exhibit either slightly increased or decreased uptake. In the case of TBR
5–15 images, only three of all radiomic features were significantly different, reflecting an increased asymmetry of the intensity histogram in tumor tissue. Even more important for the differentiation of isometabolic tumors from healthy tissue were features derived from TTP images. A large fraction of significantly different features (64%) was observed, indicating not only higher homogeneity in tumor but also larger TTP values compared to healthy tissue. Both observations may be related to the inhibition of vasculo- and angiogenesis signaling pathways and, thus, a reduced blood volume fraction in
IDH mutant gliomas, which represents the majority of our patient cohort, while normal vasculature is present in healthy tissue [
25,
26]. Since blood time-activity curves are characterized by an early peak after radiotracer bolus injection, the reduced tumor vascularization and thus lower blood volume result in a decreased number of voxels with an early peak, which corresponds to an increased number of voxels with TTP above 30 min p. i. The predominant assignment of voxels to the group with an ascending kinetic (TTP > 30 min p. i.) directly leads to a more homogeneous distribution of TTP values within the tumor. When using univariate classification, the texture features derived from TTP images reached the highest AUC scores.
For photopenic gliomas, the percentages of significantly different features were comparably low for all three image types. The radiomic data derived from standard TBR20–40 and early TBR5–15 showed, as expected, a lower magnitude of voxels. This finding can also be visually identified. Whether the overall decreased uptake can be attributed to a generally reduced vascularization and thus a low tracer availability in tumor tissue, an increased wash-out, or to some other phenomenon needs to be evaluated further. In accordance with the results of isometabolic gliomas, radiomic features derived from TBR images insinuate an increased heterogeneity of uptake patterns in photopenic tumor tissue. Consistent with the findings in isometabolic gliomas, the TTP was found to be longer in photopenic tumor tissue than in healthy tissue, and the variance was decreased. The first-order TBR features, using univariate classification, showed the highest AUC scores.
Several limitations of the study need to be addressed. Differentiation of tumor from healthy tissue has been performed in this study by defining tumor volumes within T2/FLAIR MRI images, which itself is already indicative of the presence of a tumor lesion. Furthermore, unlike the Wilcoxon test, the classification does not consider the paired nature of the tumor and the corresponding mirrored background VOI of each patient. Furthermore, the robustness of statistical analyses and machine learning might be affected by the small number of patients. Before a potential application for clinical patient assessment, data pooling also from different centers in combination with feature harmonization techniques should be used to improve model generalizability. Of further interest might be a voxel-based classification of tumor and healthy tissue using voxel-wise radiomic and parametric maps derived from dynamic [
18F]FET PET data alone. Moreover, it might be interesting to compare [
18F]FET-negative gliomas with non-neoplastic lesions such as Multiple Sclerosis lesions or after ischemia. For a classification of [
18F]FET-negative lesions using tumor and non-neoplastic lesions as comparison groups, ratios of radiomic features derived from the lesion VOI and the mirrored VOI in healthy tissue might be considered. In this context, it might be interesting to compare results from dynamic PET with results from radiomic analyses performed on sophisticated MRI sequences such as diffusion-weighted imaging, dynamic susceptibility contrast, or dynamic contrast-enhanced MRI [
27]. These sequences might also provide further insight into the underlying differences between [
18F]FET-negative and [
18F]FET-positive gliomas by quantifying, for example, blood volume or diffusion properties of the tumor. Another limitation resulting from the use of a mirrored background VOI for comparison is that the shape of the tumor and healthy tissue VOIs were identical; thus, shape features had to be excluded from analyses.
While dynamic PET imaging is time-consuming and kinetic analysis may require dedicated software solutions, it has huge potential for increasing clinical performance, which might be further enhanced by the application of total-body PET/CT devices [
28]. The increased sensitivity due to the long axial field-of-view enables the acquisition of shorter time frames, i.e., improved temporal resolution, and thus, e.g., the reduction of motion artifacts and the extraction of more precise information for the diagnosis, but also for targeted therapy. Furthermore, there is conceivable clinical utility in the ability to extract high-quality information even from very late time points after radiotracer injection. Moreover, it will be interesting to evaluate the relevance of total-body PET/CT for noninvasive pharmacokinetic modeling utilizing an image-derived input function derived from the ventricle or aorta [
29].

 ,
, 


