
Cancer Survival in Adults in Spain: A Population-Based Study of the Spanish Network of Cancer Registries (REDECAN)

 ,
,  , , , , and
Abstract
:Simple Summary
Abstract
1. Introduction
2. Materials and Methods
2.1. Study Design and Population
2.2. Follow-Up for Vital Status
2.3. Quality Control
2.4. Statistical Analyses
3. Results
3.1. Study Population and Quality Indicators
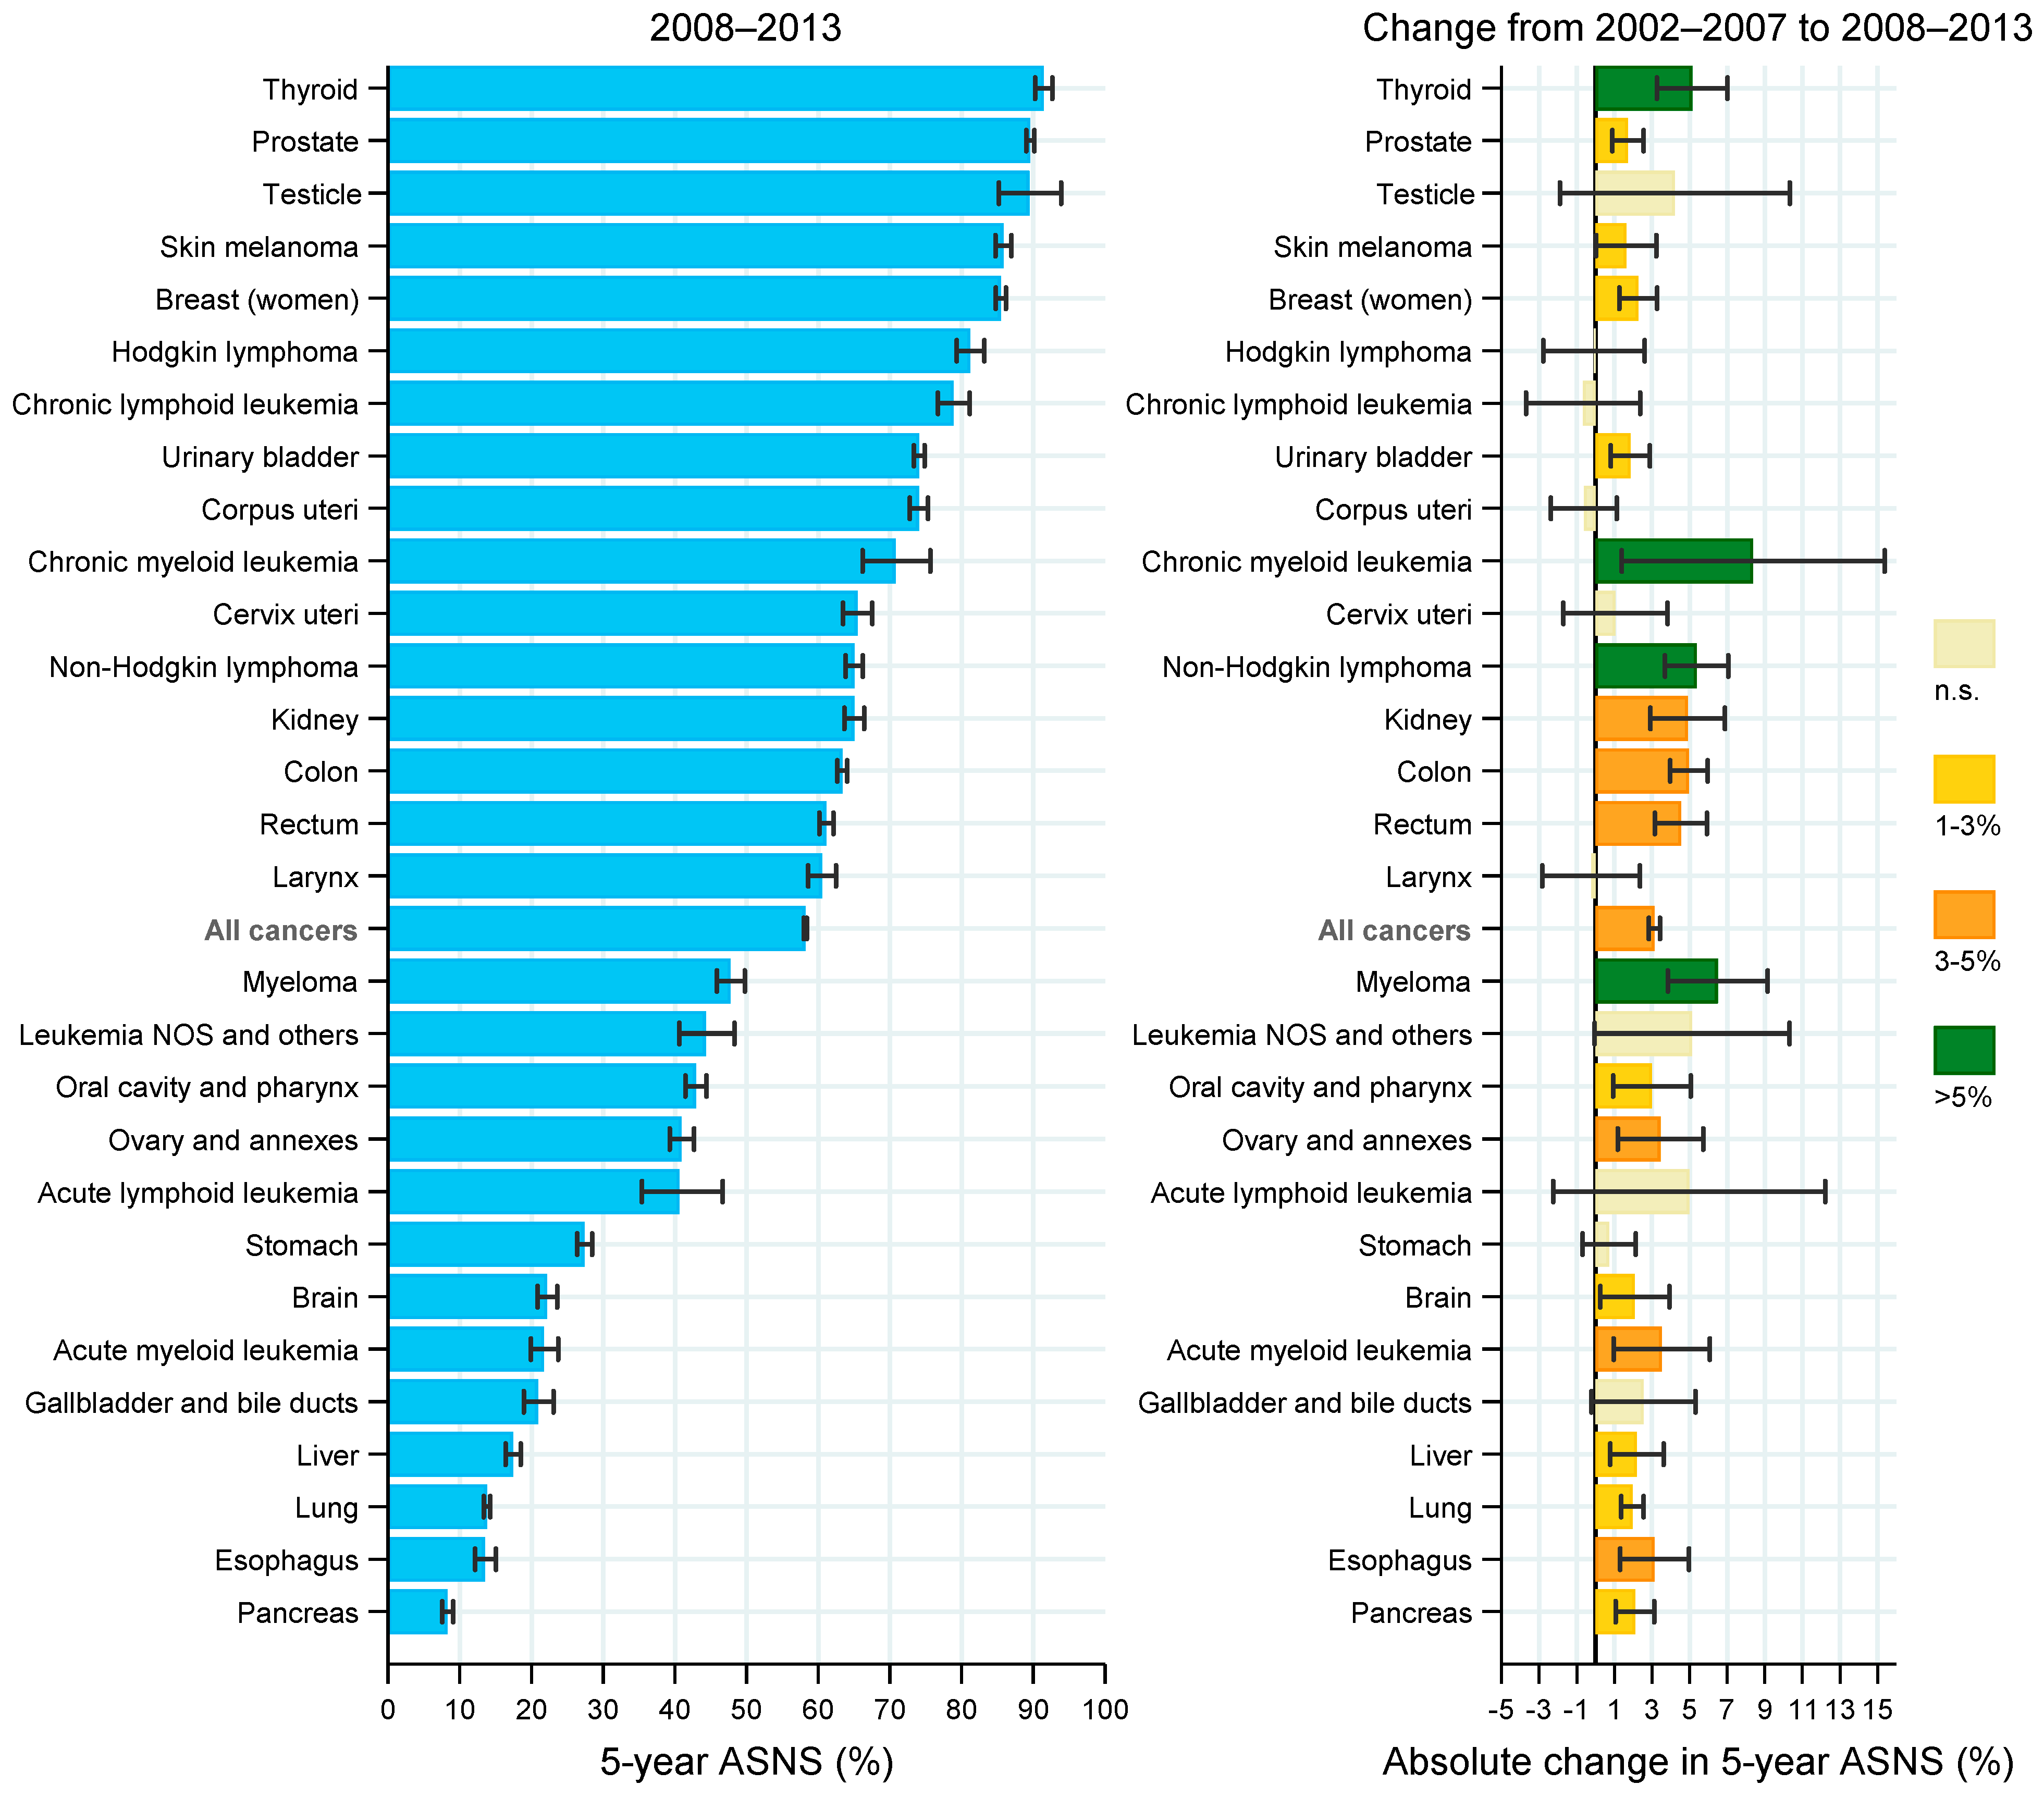
3.2. Cancer Survival in Patients Diagnosed in 2008–2013
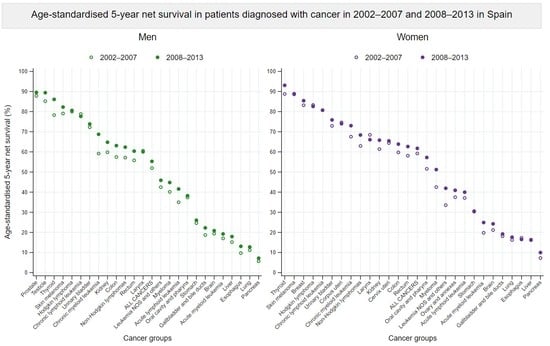
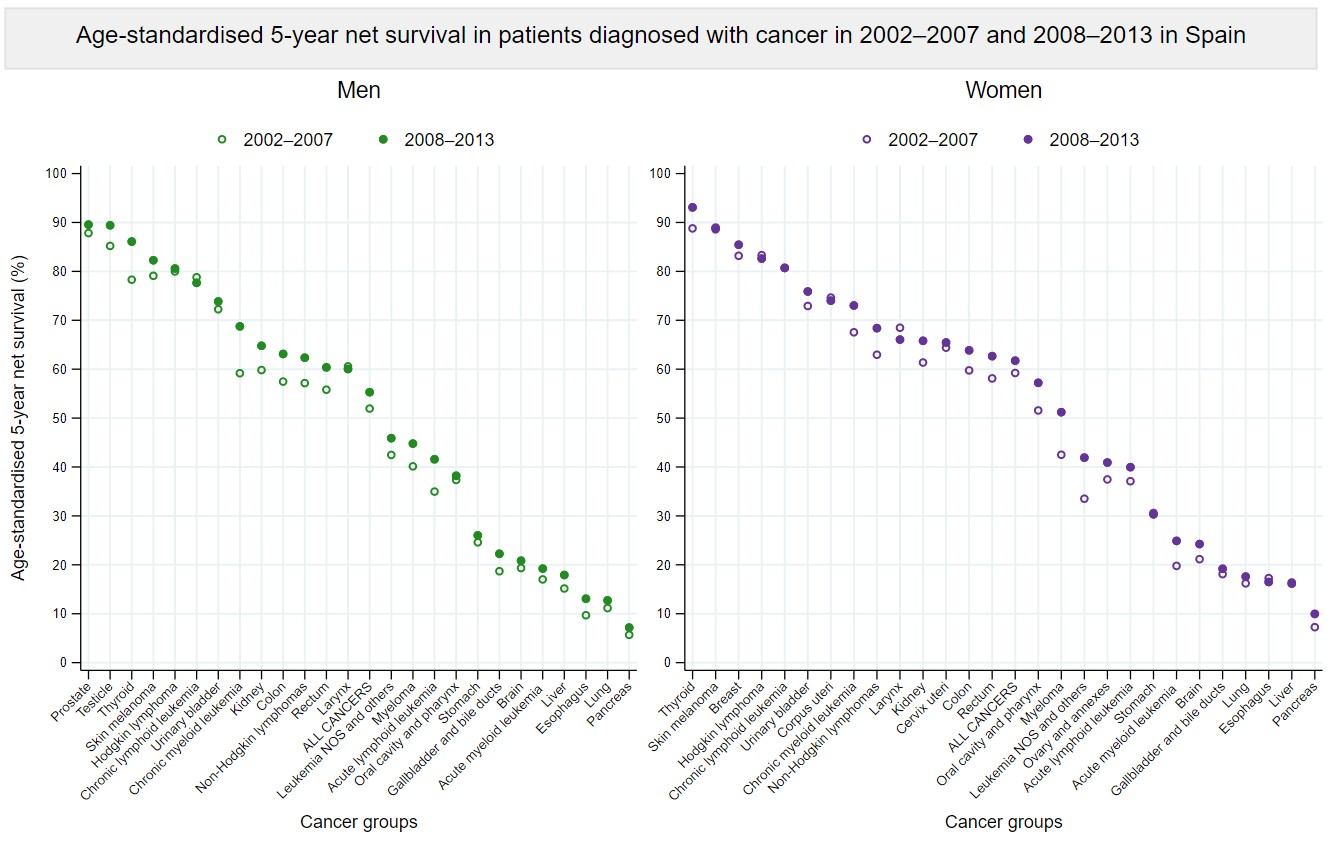
3.3. Survival Trends between 2002–2007 and 2008–2013
4. Discussion
5. Conclusions
Supplementary Materials
Author Contributions
Funding
Institutional Review Board Statement
Informed Consent Statement
Data Availability Statement
Acknowledgments
Conflicts of Interest
References
- Sung, H.; Ferlay, J.; Siegel, R.L.; Laversanne, M.; Soerjomataram, I.; Jemal, A.; Bray, F. Global Cancer Statistics 2020: GLOBOCAN Estimates of Incidence and Mortality Worldwide for 36 Cancers in 185 Countries. CA Cancer J. Clin. 2021, 71, 209–249. [Google Scholar] [CrossRef] [PubMed]
- Red Española de Registros de Cáncer (REDECAN). Estimaciones de la Incidencia del Cáncer en España. 2022. Available online: https://redecan.org (accessed on 14 May 2022).
- Instituto Nacional de Estadística. Estadística de Defunciones Según Causa de Muerte. INE-España. 2019. Available online: https://www.ine.es/ (accessed on 14 May 2022).
- Allemani, C.; Matsuda, T.; Di Carlo, V.; Harewood, R.; Matz, M.; Nikšić, M.; Bonaventure, A.; Valkov, M.; Johnson, C.J.; Estève, J.; et al. Global surveillance of trends in cancer survival 2000-14 (CONCORD-3): Analysis of individual records for 37,513,025 patients diagnosed with one of 18 cancers from 322 population-based registries in 71 countries. Lancet 2018, 391, 1023–1075. [Google Scholar] [CrossRef] [Green Version]
- De Angelis, R.; Sant, M.; Coleman, M.P.; Francisci, S.; Baili, P.; Pierannunzio, D.; Trama, A.; Visser, O.; Brenner, H.; Ardanaz, E.; et al. Cancer survival in Europe 1999–2007 by country and age: Results of EUROCARE--5-a population-based study. Lancet Oncol. 2014, 15, 23–34. [Google Scholar] [CrossRef]
- Tron, L.; Belot, A.; Fauvernier, M.; Remontet, L.; Bossard, N.; Launay, L.; Bryere, J.; Monnereau, A.; Dejardin, O.; Launoy, G. Socioeconomic environment and disparities in cancer survival for 19 solid tumor sites: An analysis of the French Network of Cancer Registries (FRANCIM) data. Int. J. Cancer 2019, 144, 1262–1274. [Google Scholar] [CrossRef] [PubMed] [Green Version]
- Chirlaque, M.D.; Salmeron, D.; Galceran, J.; Ameijide, A.; Mateos, A.; Torrella, A.; Jimenez, R.; Larranaga, N.; Marcos-Gragera, R.; Ardanaz, E.; et al. Cancer survival in adult patients in Spain. Results from nine population-based cancer registries. Clin. Transl. Oncol. 2018, 20, 201–211. [Google Scholar] [CrossRef] [PubMed]
- International Agency for Reasearch on Cancer. Cancer Incidence in Five Continents, Vol. XI. IARC Scientific Publication No. 166., 1st ed.; Bray, F., Colombet, M., Mery, L., Piñeros, M., Znaor, A., Zanetti, R., Ferlay, J., Eds.; International Agency for Reasearch on Cancer—World Health Organization: Lyon, France, 2021; ISBN 978-92-832-2218-7. [Google Scholar]
- World Health Organization. International Classification of Diseases for Oncology (ICD-O), 1st Revision, 3rd ed.; Fritz, A., Percy, C., Jack, A., Shanmugaratnam, K., Sobin, L., Parkin, D.M., Sharon, W., Eds.; World Health Organization: Geneva, Switzerland, 2013; ISBN 978 92 4 154849 6. [Google Scholar]
- International Association of Cancer Registries. International Rules for Multiple Primary Cancers (ICD-O Third Edition). International Agency for Research on Cancer Internal Report No. 2004/02. Available online: http://www.iacr.com.fr/images/doc/MPrules_july2004.pdf (accessed on 14 May 2022).
- World Health Organization. WHO Classification of Tumours of Haematopoietic and Lymphoid Tissues; Swerdlow, S.H., Campo, E., Harris, N.L., Jaffe, E.S., Pileri, S.A., Stein, H., Thiele, J., Eds.; International Agency for Research on Cancer: Lyon, France, 2017; ISBN 9789283244943. [Google Scholar]
- HAEMACARE Working Group. Manual for coding and reporting haematological malignancies. Tumori 2010, 96, i-A32. [Google Scholar]
- Rossi, S.; Baili, P.; Capocaccia, R.; Caldora, M.; Carrani, E.; Minicozzi, P.; Pierannunzio, D.; Santaquilani, M.; Trama, A.; Allemani, C.; et al. The EUROCARE-5 study on cancer survival in Europe 1999–2007: Database, quality checks and statistical analysis methods. Eur. J. Cancer 2015, 51, 2104–2119. [Google Scholar] [CrossRef]
- Perme, M.P.; Stare, J.; Estève, J. On Estimation in Relative Survival. Biometrics 2012, 68, 113–120. [Google Scholar] [CrossRef]
- Elandt-Johnson, R.C.; Johnson, N.L. Survival Models and Data Analysis; John Wiley and Sons: New York, NY, USA, 1980; ISBN 9780471031741. [Google Scholar]
- Brenner, H.; Gefeller, O.; Hakulinen, T. Period analysis for “up-to-date” cancer survival data: Theory, empirical evaluation, computational realisation and applications. Eur. J. Cancer 2004, 40, 326–335. [Google Scholar] [CrossRef]
- Corazziari, I.; Quinn, M.; Capocaccia, R. Standard cancer patient population for age standardising survival ratios. Eur. J. Cancer 2004, 40, 2307–2316. [Google Scholar] [CrossRef]
- Greenwood, M. The natural duration of cancer. In Reports on Public Health and Medical Subjects; Great Britain Ministry of Health: Londres, UK, 1926; pp. 1–26. [Google Scholar]
- Clerc-Urmès, I.; Grzebyk, M.; Hédelin, G. Net Survival Estimation with Stns. Stata J. Promot. Commun. Stat. Stata 2014, 14, 87–102. [Google Scholar] [CrossRef] [Green Version]
- Lundberg, F.E.; Andersson, T.M.L.; Lambe, M.; Engholm, G.; Mørch, L.S.; Johannesen, T.B.; Virtanen, A.; Pettersson, D.; Ólafsdóttir, E.J.; Birgisson, H.; et al. Trends in cancer survival in the Nordic countries 1990–2016: The NORDCAN survival studies. Acta Oncol. 2020, 59, 1266–1274. [Google Scholar] [CrossRef] [PubMed]
- Cowppli-Bony, A.; Uhry, Z.; Remontet, L.; Voirin, N.; Guizard, A.V.; Trétarre, B.; Bouvier, A.M.; Colonna, M.; Bossard, N.; Woronoff, A.S.; et al. Survival of solid cancer patients in France, 1989–2013: A population-based study. Eur. J. Cancer Prev. 2017, 26, 461–468. [Google Scholar] [CrossRef] [PubMed]
- Zadnik, V.; Zagar, T.; Lokar, K.; Tomsic, S.; Konjevic, A.D.; Zakotnik, B. Trends in population-based cancer survival in Slovenia. Radiol. Oncol. 2021, 55, 42–49. [Google Scholar] [CrossRef]
- Galceran, J.; Ameijide, A.; Carulla, M.; Mateos, A.; Quirós, J.R.; Rojas, D.; Alemán, A.; Torrella, A.; Chico, M.; Vicente, M.; et al. Cancer incidence in Spain, 2015. Clin. Transl. Oncol. 2017, 19, 799–825. [Google Scholar] [CrossRef]
- Quaresma, M.; Coleman, M.P.; Rachet, B. 40-year trends in an index of survival for all cancers combined and survival adjusted for age and sex for each cancer in England and Wales, 1971–2011: A population-based study. Lancet 2015, 385, 1206–1218. [Google Scholar] [CrossRef] [Green Version]
- Micheli, A.; Ciampichini, R.; Oberaigner, W.; Ciccolallo, L.; de Vries, E.; Izarzugaza, I.; Zambon, P.; Gatta, G.; De Angelis, R.; Oberaigner, W.; et al. The advantage of women in cancer survival: An analysis of EUROCARE-4 data. Eur. J. Cancer 2009, 45, 1017–1027. [Google Scholar] [CrossRef]
- Ellison, L.F. Differences in cancer survival in Canada by sex. Health Rep. 2016, 27, 19–27. [Google Scholar]
- Majek, O.; Gondos, A.; Jansen, L.; Emrich, K.; Holleczek, B.; Katalinic, A.; Nennecke, A.; Eberle, A.; Brenner, H. Sex Differences in Colorectal Cancer Survival: Population-Based Analysis of 164,996 Colorectal Cancer Patients in Germany. PLoS ONE 2013, 8, e68077. [Google Scholar] [CrossRef] [Green Version]
- Gatta, G.; Botta, L.; Sánchez, M.J.; Anderson, L.A.; Pierannunzio, D.; Licitra, L.; Hackl, M.; Zielonke, N.; Oberaigner, W.; Van Eycken, E.; et al. Prognoses and improvement for head and neck cancers diagnosed in Europe in early 2000s: The EUROCARE-5 population-based study. Eur. J. Cancer 2015, 51, 2130–2143. [Google Scholar] [CrossRef]
- Guizard, A.V.; Uhry, Z.; De Raucourt, D.; Mazzoleni, G.; Sánchez, M.J.; Ligier, K.; Van Eycken, E.; Henau, K.; Velten, M.; Bouvier, V.; et al. Trends in net survival from head and neck cancer in six European Latin countries: Results from the SUDCAN population-based study. Eur. J. Cancer Prev. 2017, 26, S16–S23. [Google Scholar] [CrossRef] [PubMed]
- Quaglia, A.; Tavilla, A.; Shack, L.; Brenner, H.; Janssen-Heijnen, M.; Allemani, C.; Colonna, M.; Grande, E.; Grosclaude, P.; Vercelli, M.; et al. The cancer survival gap between elderly and middle-aged patients in Europe is widening. Eur. J. Cancer 2009, 46, 1006–1016. [Google Scholar] [CrossRef] [PubMed]
- Arnold, M.; Rutherford, M.J.; Bardot, A.; Ferlay, J.; Andersson, T.M.L.; Myklebust, T.Å.; Tervonen, H.; Thursfield, V.; Ransom, D.; Shack, L.; et al. Progress in cancer survival, mortality, and incidence in seven high-income countries 1995–2014 (ICBP SURVMARK-2): A population-based study. Lancet Oncol. 2019, 20, 1493–1505. [Google Scholar] [CrossRef] [Green Version]
- Nur, U.; Lyratzopoulos, G.; Rachet, B.; Coleman, M.P. The impact of age at diagnosis on socioeconomic inequalities in adult cancer survival in England. Cancer Epidemiol. 2015, 39, 641–649. [Google Scholar] [CrossRef] [Green Version]
- Sarfati, D.; Koczwara, B.; Jackson, C. The impact of comorbidity on cancer and its treatment. CA Cancer J. Clin. 2016, 66, 337–350. [Google Scholar] [CrossRef]
- Pilleron, S.; Gower, H.; Janssen-Heijnen, M.; Signal, V.C.; Gurney, J.K.; Morris, E.J.A.; Cunningham, R.; Sarfati, D. Patterns of age disparities in colon and lung cancer survival: A systematic narrative literature review. BMJ Open 2021, 11, e044239. [Google Scholar] [CrossRef]
- Abdelsattar, Z.M.; Habermann, E.; Borah, B.J.; Moriarty, J.P.; Rojas, R.L.; Blackmon, S.H. Understanding Failure to Rescue After Esophagectomy in the United States. Ann. Thorac. Surg. 2020, 109, 865–871. [Google Scholar] [CrossRef]
- Chirlaque, M.D.; Salmeron, D.; Ardanaz, E.; Galceran, J.; Martinez, R.; Marcos-Gragera, R.; Sanchez, M.J.; Mateos, A.; Torrella, A.; Capocaccia, R.; et al. Cancer survival in Spain: Estimate for nine major cancers. Ann. Oncol. 2010, 21, iii21–iii29. [Google Scholar] [CrossRef]
- Rodríguez-Barranco, M.; Salamanca-Fernández, E.; Fajardo, M.L.; Bayo, E.; Chang-Chan, Y.L.; Expósito, J.; García, C.; Tallón, J.; Minicozzi, P.; Sant, M.; et al. Patient, tumor, and healthcare factors associated with regional variability in lung cancer survival: A Spanish high-resolution population-based study. Clin. Transl. Oncol. 2019, 21, 621–629. [Google Scholar] [CrossRef] [Green Version]
- Guevara, M.; Rodríguez-Barranco, M.; Puigdemont, M.; Minicozzi, P.; Yanguas-Bayona, I.; Porras-Povedano, M.; Rubió-Casadevall, J.; Sánchez Pérez, M.J.; Marcos-Gragera, R.; Ardanaz, E. Disparities in the management of cutaneous malignant melanoma. A population-based high-resolution study. Eur. J. Cancer Care 2019, 28, e13043. [Google Scholar] [CrossRef]
- Rodríguez, A.; Algara, M.; Monge, D.; López-Torrecilla, J.; Caballero, F.; Morera, R.; Escó, R.; Pérez-Montero, H.; Ferrer, C.; Lara, P.C.; et al. Infrastructure and equipment for radiation oncology in the Spanish National Health System: Analysis of external beam radiotherapy 2015–2020. Clin. Transl. Oncol. 2018, 20, 402–410. [Google Scholar] [CrossRef] [PubMed]
- Rodríguez-Lescure, A.; de la Peña, F.A.; Aranda, E.; Calvo, A.; Felip, E.; Garrido, P.; Vera, R. Study of the Spanish Society of Medical Oncology (SEOM) on the access to oncology drugs and predictive biomarkers in Spain. Clin. Transl. Oncol. 2020, 22, 2253–2263. [Google Scholar] [CrossRef] [PubMed]
- Hoffmann, V.S.; Baccarani, M.; Hasford, J.; Castagnetti, F.; Di Raimondo, F.; Casado, L.F.; Turkina, A.; Zackova, D.; Ossenkoppele, G.; Zaritskey, A.; et al. Treatment and outcome of 2904 CML patients from the EUTOS population-based registry. Leukemia 2017, 31, 593–601. [Google Scholar] [CrossRef] [PubMed]
- Di Felice, E.; Roncaglia, F.; Venturelli, F.; Mangone, L.; Luminari, S.; Cirilli, C.; Carrozzi, G.; Giorgi Rossi, P. The impact of introducing tyrosine kinase inhibitors on chronic myeloid leukemia survival: A population-based study. BMC Cancer 2018, 18, 1069. [Google Scholar] [CrossRef] [PubMed]
- Thorsteinsdottir, S.; Dickman, P.W.; Landgren, O.; Blimark, C.; Hultcrantz, M.; Turesson, I.; Björkholm, M.; Kristinsson, S.Y. Dramatically improved survival in multiple myeloma patients in the recent decade: Results from a Swedish population-based study. Haematologica 2018, 103, e412–e415. [Google Scholar] [CrossRef] [PubMed] [Green Version]
- Pratap, S.; Scordino, T.S. Molecular and cellular genetics of non-Hodgkin lymphoma: Diagnostic and prognostic implications. Exp. Mol. Pathol. 2019, 106, 44–51. [Google Scholar] [CrossRef] [PubMed]
- Villavicencio, A.; Solans, M.; Auñon-Sanz, C.; Roncero, J.M.; Marcos-Gragera, R. Population-based survival of lymphoid neoplasms: Twenty years of epidemiological data in the Girona province, Spain. Cancer Epidemiol. 2020, 69, 101841. [Google Scholar] [CrossRef]
- Muller-Hermelink, H.K.; Catovsky, D.; Campo, E.; Harris, N.; Stein, H. Chronic Lymphocytic Leukaemia/Small Lymphocytic Lymphoma, 4th ed.; Swerdlow, S.H., Campo, E., Harris, N.L., Jaffe, E.S., Pileri, S.A., Stein, H., Thiele, J., Vardiman, J.W., Eds.; WHO Press: Lyon, France, 2008. [Google Scholar]
- Solans, M.; Osca-Gelis, G.; Comas, R.; Roncero, J.M.; Gallardo, D.; Marcos-Gragera, R.; Saez, M. Challenges in assessing the real incidence of chronic lymphocytic leukemia: 16 years of epidemiological data from the province of Girona, Spain. Cancer Causes Control 2018, 29, 379–382. [Google Scholar] [CrossRef]
- Manchon-Walsh, P.; Aliste, L.; Espinàs, J.A.; Prades, J.; Guarga, A.; Balart, J.; Biondo, S.; Castells, A.; Sanjuán, X.; Tabernero, J.; et al. Improving survival and local control in rectal cancer in Catalonia (Spain) in the context of centralisation: A full cycle audit assessment. Eur. J. Surg. Oncol. 2016, 42, 1873–1880. [Google Scholar] [CrossRef]
- Salamanca-Fernández, E.; Rodriguez-Barranco, M.; Chang-Chan, Y.L.; Redondo-Sánchez, D.; Domínguez-López, S.; Bayo, E.; Narankiewicz, D.; Expósito, J.; Sánchez, M.J. Thyroid Cancer Epidemiology in South Spain: A population-based time trend study. Endocrine 2018, 62, 423–431. [Google Scholar] [CrossRef]
- Rojo Álvaro, J.; Bermejo Fraile, B.; Menéndez Torre, E.; Ardanaz, E.; Guevara, M.; Anda Apiñániz, E. Increased incidence of thyroid cancer in Navarra (Spain). Evolution and clinical characteristics, 1986–2010. Endocrinol. Diabetes Nutr. 2017, 64, 303–309. [Google Scholar] [CrossRef]
- Rosiello, G.; Larcher, A.; Montorsi, F.; Capitanio, U. Renal cancer: Overdiagnosis and overtreatment. World J. Urol. 2021, 39, 2821–2823. [Google Scholar] [CrossRef] [PubMed]
- Taieb, J.; Prager, G.W.; Melisi, D.; Westphalen, C.B.; D’Esquermes, N.; Ferreras, A.; Carrato, A.; MacArulla, T. First-line and second-line treatment of patients with metastatic pancreatic adenocarcinoma in routine clinical practice across Europe: A retrospective, observational chart review study. ESMO Open 2020, 5, e000587. [Google Scholar] [CrossRef] [PubMed] [Green Version]
- Jones, G.S.; Baldwin, D.R. Recent advances in the management of lung cancer. Clin. Med. J. R. Coll. Physicians Lond. 2018, 18, s41–s46. [Google Scholar] [CrossRef] [PubMed]
- Brenner, H.; Spix, C. Combining cohort and period methods for retrospective time trend analyses of long-term cancer patient survival rates. Br. J. Cancer 2003, 89, 1260–1265. [Google Scholar] [CrossRef] [PubMed] [Green Version]


| Cancer Groups | ICD-10 Codes | Number of Eligible Cases | Excluded, % | Number of Cases Included (%) | Data Quality Indicators, % | |||
|---|---|---|---|---|---|---|---|---|
| DCO | Diagnosed at Autopsy | Microscopically Verified | Non-Specific Morphology a | Lost to Follow-Up b | ||||
| Oral cavity and pharynx | C01–C06, C09–14 | 14,939 | 0.64 | 0.11 | 14,828 (99.26) | 98.73 | 1.50 | 0.26 |
| Esophagus | C15 | 6442 | 1.60 | 0.20 | 6326 (98.20) | 95.78 | 4.47 | 0.40 |
| Stomach | C16 | 21,748 | 2.21 | 0.43 | 21,175 (97.37) | 94.63 | 5.77 | 0.25 |
| Colon | C18 | 58,307 | 1.75 | 0.32 | 57,097 (97.92) | 94.93 | 5.38 | 0.14 |
| Rectum | C19–C20 | 28,990 | 0.63 | 0.20 | 28,750 (99.17) | 97.26 | 3.01 | 0.15 |
| Liver | C22 | 14,863 | 4.44 | 0.69 | 14,101 (94.87) | 43.93 | 37.08 | 0.35 |
| Gallbladder and bile ducts c | C23–C24 | 6865 | 2.08 | 0.52 | 6686 (97.39) | 65.99 | 34.89 | 0.27 |
| Pancreas | C25 | 15,685 | 4.07 | 0.54 | 14,962 (95.39) | 61.72 | 40.22 | 0.30 |
| Larynx | C32 | 10,636 | 0.80 | 0.03 | 10,548 (99.17) | 98.52 | 1.80 | 0.20 |
| Lung, bronchus and trachea c | C33–34 | 66,692 | 2.21 | 0.42 | 64,938 (97.37) | 87.20 | 13.62 | 0.32 |
| Skin melanoma | C43 | 12,857 | 0.32 | 0.05 | 12,809 (99.63) | 99.63 | 0.00 | 0.30 |
| Breast (women only) | C50 | 67,186 | 0.75 | 0.01 | 66,670 (99.23) | 98.55 | 1.69 | 0.25 |
| Cervix uteri | C53 | 5674 | 0.55 | 0.00 | 5643 (99.45) | 98.90 | 1.45 | 0.87 |
| Corpus uteri | C54 | 14,912 | 0.50 | 0.07 | 14,827 (99.43) | 98.14 | 1.98 | 0.20 |
| Ovary and annexes | C56, C570–C574, C577 | 8635 | 1.97 | 0.24 | 8444 (97.79) | 91.38 | 9.53 | 0.28 |
| Prostate | C61 | 77,920 | 1.40 | 0.19 | 76,682 (98.41) | 91.38 | 8.62 | 0.16 |
| Testicle | C62 | 3102 | 0.16 | 0.10 | 3094 (99.74) | 99.22 | 0.94 | 0.52 |
| Kidney | C64 | 13,912 | 1.32 | 0.71 | 13,630 (97.97) | 83.09 | 17.23 | 0.21 |
| Urinary bladder | C67, D090, D414 | 47,058 | 0.76 | 0.09 | 46,659 (99.15) | 95.75 | 4.94 | 0.12 |
| Brain | C71 | 9404 | 2.46 | 0.38 | 9137 (97.16) | 69.94 | 18.44 | 0.42 |
| Thyroid | C73 | 9176 | 0.20 | 0.73 | 9091 (99.07) | 99.33 | 0.79 | 0.34 |
| Hodgkin lymphoma | C81 | 3531 | 0.03 | 0.57 | 3510 (99.41) | 99.97 | 0.00 | 0.34 |
| Non-Hodgkin lymphoma | C82–C86, C96 | 18,691 | 0.81 | 0.56 | 18,435 (98.63) | 98.06 | 9.74 | 0.23 |
| Myeloma | C90 | 7421 | 1.68 | 0.19 | 7282 (98.13) | 93.79 | 0.00 | 0.15 |
| Acute lymphoid leukemia | C910 | 760 | 0.53 | 0.26 | 754 (99.21) | 99.73 | 0.00 | 0.13 |
| Chronic lymphoid leukemia | C911 | 5293 | 0.36 | 0.06 | 5271 (99.58) | 99.37 | 0.00 | 0.23 |
| Acute myeloid leukemia | C920, C923–C928, C930, C940–C946 | 4246 | 0.00 | 0.00 | 4246 (100.00) | 99.48 | 0.00 | 0.33 |
| Chronic myeloid leukemia | C921 | 1302 | 0.69 | 0.00 | 1293 (99.31) | 99.85 | 0.00 | 0.23 |
| Leukemia NOS and others | C913; C914; C915; C916; C917; C918; C919; C929; C931; C947; C950; C959 | 2321 | 11.72 | 0.26 | 2043 (88.02) | 90.16 | 39.94 | 0.34 |
| Other cancers d | 54,405 | 3.46 | 0.37 | 52,319 (96.17) | 85.91 | 14.68 | 0.23 | |
| All cancers d | C00–C96 (except C44), D090, D414, D45–D47 | 612,973 | 1.64 | 0.27 | 601,250 (98.09) | 91.03 | 8.97 | 0.23 |
| Cancer Group | Men | Women | Both | ||||||
|---|---|---|---|---|---|---|---|---|---|
| Number of Cases | OS (95% CI), % | NS (95% CI), % | Number of Cases | OS (95% CI), % | NS (95% CI), % | Number of Cases | OS (95% CI), % | NS (95% CI), % | |
| Oral cavity and pharynx | 5573 | 37.2 (35.9–38.6) | 40.5 (39.0–42.0) | 1733 | 53.1 (50.5–55.5) | 57.6 (54.7–60.6) | 7306 | 41.0 (39.8–42.2) | 44.5 (43.2–45.9) |
| Esophagus | 2619 | 11.5 (10.2–12.9) | 12.7 (11.3–14.2) | 472 | 13.8 (10.7–17.3) | 14.6 (11.0–18.1) | 3091 | 11.9 (10.7–13.1) | 13.0 (11.7–14.4) |
| Stomach | 6533 | 20.8 (19.8–21.8) | 24.0 (22.7–25.2) | 3880 | 23.3 (21.9–24.7) | 26.1 (24.5–27.7) | 10,413 | 21.7 (20.9–22.6) | 24.8 (23.8–25.8) |
| Colon | 18,121 | 51.2 (50.4–52.0) | 60.5 (59.5–61.5) | 12,488 | 53.3 (52.3–54.2) | 60.2 (59.1–61.3) | 30,609 | 52.1 (51.5–52.7) | 60.4 (59.7–61.1) |
| Rectum | 9580 | 51.2 (50.1–52.3) | 59.0 (57.7–60.4) | 5136 | 53.9 (52.4–55.3) | 59.7 (57.9–61.4) | 14,716 | 52.1 (51.3–53.0) | 59.3 (58.2–60.3) |
| Liver | 5440 | 16.1 (15.1–17.2) | 17.6 (16.4–18.8) | 2028 | 10.3 (8.8–11.8) | 11.2 (9.5–12.8) | 7468 | 14.6 (13.7–15.5) | 15.9 (14.9–16.9) |
| Gallbladder and bile ducts | 1584 | 14.8 (12.9–16.7) | 17.2 (14.9–19.5) | 1766 | 12.0 (10.4–13.7) | 14.2 (12.1–16.3) | 3350 | 13.3 (12.1–14.6) | 15.6 (14.1–17.2) |
| Pancreas | 4427 | 5.7 (5.0–6.5) | 6.2 (5.4–7.1) | 3881 | 6.3 (5.5–7.2) | 6.9 (5.9–7.8) | 8308 | 6.0 (5.5–6.6) | 6.5 (5.9–7.2) |
| Larynx | 4460 | 55.2 (53.6–56.7) | 61.5 (59.7–63.3) | 355 | 64.7 (59.1–69.8) | 68.0 (62.2–73.8) | 4815 | 55.9 (54.3–57.3) | 62.0 (60.3–63.7) |
| Lung | 26,981 | 10.9 (10.5–11.3) | 12.1 (11.6–12.6) | 6352 | 17.3 (16.3–18.4) | 18.0 (16.9–19.2) | 33,333 | 12.1 (11.7–12.5) | 13.2 (12.8–13.6) |
| Skin melanoma | 3140 | 70.9 (69.2–72.6) | 80.3 (78.1–82.5) | 3480 | 81.4 (79.9–82.7) | 87.5 (85.7–89.3) | 6620 | 76.4 (75.3–77.5) | 84.1 (82.7–85.5) |
| Breast (women) | 34,294 | 82.0 (81.6–82.5) | 87.3 (86.8–87.9) | 34,294 | |||||
| Cervix uteri | 2726 | 65.8 (63.9–67.6) | 67.6 (65.7–69.6) | 2726 | |||||
| Corpus uteri | 7432 | 70.2 (69.1–71.3) | 75.1 (73.8–76.4) | 7432 | |||||
| Ovary and annexes | 4199 | 43.0 (41.3–44.6) | 44.7 (43.0–46.4) | 4199 | |||||
| Prostate | 38,929 | 78.0 (77.5–78.4) | 90.0 (89.4–90.6) | 38,929 | |||||
| Testicle | 1671 | 95.1 (93.9–96.1) | 95.9 (94.8–97.0) | 1671 | |||||
| Kidney | 5069 | 58.5 (57.0–59.9) | 65.4 (63.6–67.2) | 2374 | 59.6 (57.4–61.6) | 64.1 (61.7–66.5) | 7443 | 58.8 (57.6–60.0) | 65.0 (63.5–66.4) |
| Urinary bladder | 20,022 | 60.3 (59.5–61.0) | 70.8 (69.9–71.8) | 3973 | 61.6 (60.0–63.2) | 70.7 (68.6–72.8) | 23,995 | 60.5 (59.8–61.1) | 70.8 (69.9–71.7) |
| Brain | 2613 | 13.5 (12.2–14.9) | 13.9 (12.5–15.4) | 2104 | 14.0 (12.4–15.6) | 14.3 (12.7–15.9) | 4717 | 13.7 (12.7–14.8) | 14.1 (13.0–15.2) |
| Thyroid | 1186 | 84.8 (82.5–86.9) | 88.9 (86.5–91.4) | 4151 | 93.0 (92.1–93.7) | 95.3 (94.5–96.2) | 5337 | 91.2 (90.4–92.0) | 93.9 (93.1–94.8) |
| Hodgkin lymphoma | 1026 | 78.5 (75.8–81.0) | 81.1 (78.3–83.8) | 725 | 82.4 (79.4–85.1) | 83.5 (80.6–86.5) | 1751 | 80.2 (78.1–82.0) | 82.1 (80.0–84.1) |
| Non-Hodgkin lymphoma | 5188 | 57.6 (56.1–59.0) | 63.8 (62.1–65.4) | 4395 | 62.2 (60.7–63.7) | 66.7 (64.9–68.4) | 9583 | 59.7 (58.6–60.7) | 65.1 (63.9–66.3) |
| Myeloma | 1989 | 35.1 (32.8–37.4) | 40.2 (37.4–43.0) | 1747 | 41.2 (38.7–43.7) | 45.0 (42.2–47.9) | 3736 | 38.0 (36.3–39.7) | 42.5 (40.5–44.5) |
| Acute lymphoid leukemia | 189 | 36.5 (29.5–43.6) | 38.0 (30.6–45.4) | 147 | 32.1 (24.5–39.9) | 32.7 (24.6–40.7) | 336 | 34.6 (29.4–39.8) | 35.7 (30.2–41.1) |
| Chronic lymphoid leukemia | 1446 | 61.4 (58.6–64.0) | 73.1 (69.4–76.9) | 995 | 64.1 (60.8–67.1) | 74.2 (70.1–78.2) | 2441 | 62.5 (60.4–64.5) | 73.6 (70.8–76.3) |
| Acute myeloid leukemia | 1192 | 19.3 (17.0–21.7) | 20.1 (17.6–22.6) | 1022 | 25.9 (23.1–28.7) | 26.3 (23.3–29.3) | 2214 | 22.3 (20.5–24.2) | 22.9 (21.0–24.9) |
| Chronic myeloid leukemia | 366 | 69.9 (64.7–74.4) | 75.1 (69.5–80.8) | 240 | 70.3 (63.7–75.9) | 74.2 (67.0–81.3) | 606 | 70.0 (66.0–73.7) | 74.8 (70.4–79.2) |
| Leukemia NOS and others | 658 | 32.8 (28.9–36.8) | 37.8 (32.5–43.1) | 405 | 30.0 (25.1–35.0) | 33.2 (27.3–39.1) | 1063 | 31.7 (28.6–34.8) | 36.0 (32.0–40.0) |
| All cancers a | 184,991 | 47.4 (47.1–47.6) | 54.3 (54.0–54.6) | 123,769 | 57.4 (57.1–57.7) | 62.0 (61.6–62.3) | 308,760 | 51.4 (51.2–51.6) | 57.4 (57.2–57.6) |
| Cancer Groups | Age-Standardised Net Survival (95% CI), % | |||
|---|---|---|---|---|
| 1 Year | 3 Years | 5 Years | 5 Years Conditional | |
| Oral cavity and pharynx | 70.2 (69.1–71.4) | 51.0 (49.7–52.3) | 42.9 (41.5–44.4) | 60.7 (58.7–62.7) |
| Esophagus | 38.1 (36.3–39.9) | 17.4 (16.0–19.0) | 13.5 (12.1–15.0) | 34.3 (31.0–37.9) |
| Stomach | 51.2 (50.2–52.2) | 31.7 (30.7–32.7) | 27.4 (26.4–28.4) | 52.8 (51.1–54.6) |
| Colon | 81.3 (80.8–81.7) | 69.1 (68.5–69.7) | 63.3 (62.6–64.0) | 77.6 (76.9–78.4) |
| Rectum | 83.4 (82.8–84.0) | 68.7 (67.9–69.5) | 61.1 (60.1–62.1) | 72.8 (71.7–73.9) |
| Liver | 45.8 (44.6–47.0) | 25.1 (24.0–26.2) | 17.4 (16.4–18.5) | 36.0 (34.0–38.0) |
| Gallbladder and bile ducts | 45.0 (42.9–47.2) | 27.3 (25.3–29.4) | 20.9 (18.9–23.1) | 44.3 (40.9–48.0) |
| Pancreas | 27.9 (26.9–29.0) | 11.5 (10.7–12.3) | 8.3 (7.5–9.1) | 26.8 (24.4–29.4) |
| Larynx | 84.1 (82.9–85.3) | 68.1 (66.5–69.8) | 60.5 (58.6–62.5) | 71.6 (69.5–73.9) |
| Lung | 39.0 (38.5–39.6) | 18.6 (18.2–19.1) | 13.8 (13.3–14.2) | 33.7 (32.6–34.7) |
| Skin melanoma | 95.6 (95.1–96.2) | 89.4 (88.5–90.2) | 85.8 (84.7–86.9) | 89.6 (88.6–90.7) |
| Breast (women) | 96.0 (95.7–96.3) | 90.1 (89.6–90.5) | 85.5 (84.8–86.2) | 88.8 (88.1–89.5) |
| Cervix uteri | 84.3 (82.8–85.7) | 70.7 (68.9–72.6) | 65.5 (63.5–67.5) | 76.6 (74.3–78.9) |
| Corpus uteri | 89.2 (88.4–89.9) | 78.5 (77.5–79.6) | 74.0 (72.8–75.3) | 82.3 (80.9–83.7) |
| Ovary and annexes | 70.4 (69.1–71.8) | 50.8 (49.2–52.4) | 40.9 (39.3–42.6) | 55.7 (53.3–58.1) |
| Prostate | 96.4 (96.1–96.6) | 92.2 (91.7–92.6) | 89.6 (89.0–90.1) | 92.3 (91.7–92.9) |
| Testicle | 93.2 (90.6–95.9) | 91.5 (88.2–95.0) | 89.4 (85.2–93.9) | 95.3 (90.6–100.0) |
| Kidney | 78.9 (78.0–79.9) | 70.2 (69.0–71.3) | 65.0 (63.6–66.4) | 81.6 (80.0–83.2) |
| Urinary bladder | 87.9 (87.5–88.4) | 78.6 (78.0–79.2) | 74.1 (73.3–74.8) | 83.7 (83.0–84.5) |
| Brain | 48.9 (47.5–50.2) | 26.8 (25.5–28.2) | 22.2 (20.8–23.6) | 36.2 (33.7–38.8) |
| Thyroid | 93.9 (93.1–94.7) | 92.3 (91.3–93.2) | 91.4 (90.2–92.6) | 97.1 (95.9–98.3) |
| Hodgkin lymphoma | 89.4 (88.1–90.8) | 83.1 (81.4–84.8) | 81.2 (79.3–83.1) | 89.5 (87.3–91.8) |
| Non-Hodgkin lymphoma | 78.1 (77.2–78.9) | 68.9 (67.9–69.9) | 65.0 (63.8–66.2) | 82.2 (80.9–83.6) |
| Myeloma | 79.5 (78.2–80.8) | 60.4 (58.7–62.1) | 47.8 (45.9–49.8) | 58.6 (56.4–60.9) |
| Acute lymphoid leukemia | 64.1 (59.3–69.2) | 43.7 (38.5–49.5) | 40.6 (35.4–46.7) | 61.9 (54.8–69.9) |
| Chronic lymphoid leukemia | 87.2 (86.2–88.2) | 86.7 (85.2–88.3) | 78.9 (76.7–81.1) | 83.2 (80.9–85.5) |
| Acute myeloid leukemia | 42.9 (40.9–45.1) | 25.1 (23.3–27.1) | 21.7 (19.9–23.7) | 40.4 (36.6–44.6) |
| Chronic myeloid leukemia | 86.4 (83.4–89.5) | 76.9 (73.0–81.0) | 70.8 (66.2–75.6) | 79.6 (74.4–85.2) |
| Leukemia NOS and others | 68.5 (65.5–71.8) | 51.4 (47.9–55.1) | 44.3 (40.6–48.3) | 61.9 (57.4–66.9) |
| All cancers a | 74.7 (74.6–74.9) | 63.0 (62.8–63.2) | 58.2 (58.0–58.4) | 77.1 (76.8–77.3) |
| Cancer Group | Men | Women | ||||
|---|---|---|---|---|---|---|
| ASNS (95% CI), % | Absolute Change a (95% CI), % | ASNS (95% CI), % | Absolute Change a (95% CI), % | |||
| 2002–2007 | 2008–2013 | 2002–2007 | 2008–2013 | |||
| Oral cavity and pharynx | 37.4 (35.7, 39.1) | 38.2 (36.6, 39.9) | 0.9 (−1.5, 3.2) | 51.6 (48.7, 54.6) | 57.2 (54.4, 60.2) | 5.6 (1.5, 9.8) |
| Esophagus | 9.7 (8.6, 11.0) | 13.1 (11.6, 14.7) | 3.4 (1.4, 5.3) | 17.3 (13.8, 21.6) | 16.5 (13.1, 20.8) | −0.8 (−6.2, 4.6) |
| Stomach | 24.6 (23.5, 25.8) | 26.0 (24.8, 27.4) | 1.4 (−0.3, 3.2) | 30.6 (29.0, 32.3) | 30.3 (28.6, 32.2) | −0.3 (−2.8, 2.2) |
| Colon | 57.5 (56.5, 58.4) | 63.1 (62.2, 64.1) | 5.6 (4.3, 7.0) | 59.8 (58.7, 60.8) | 63.9 (62.8, 64.9) | 4.1 (2.6, 5.6) |
| Rectum | 55.8 (54.6, 57.1) | 60.4 (59.1, 61.7) | 4.6 (2.8, 6.4) | 58.1 (56.6, 59.7) | 62.7 (61.1, 64.3) | 4.6 (2.3, 6.8) |
| Liver | 15.2 (14.1, 16.3) | 17.9 (16.7, 19.2) | 2.8 (1.1, 4.4) | 16.4 (14.3, 18.7) | 16.2 (14.1, 18.6) | −0.2 (−3.4, 2.9) |
| Gallbladder and bile ducts | 18.7 (16.2, 21.6) | 22.3 (19.6, 25.3) | 3.6 (−0.3, 7.5) | 18.1 (15.7, 20.8) | 19.2 (16.5, 22.4) | 1.1 (−2.8, 5.0) |
| Pancreas | 5.7 (4.9, 6.6) | 7.2 (6.3, 8.2) | 1.5 (0.2, 2.8) | 7.3 (6.2, 8.5) | 10.0 (8.7, 11.4) | 2.7 (1.0, 4.5) |
| Larynx | 60.6 (58.8, 62.4) | 60.0 (58.0, 62.1) | −0.5 (−3.2, 2.2) | 68.5 (62.4, 75.1) | 66.1 (58.8, 74.2) | −2.4 (−12.4, 7.5) |
| Lung | 11.2 (10.7, 11.6) | 12.7 (12.2, 13.2) | 1.6 (0.9, 2.2) | 16.2 (15.1, 17.4) | 17.6 (16.5, 18.8) | 1.4 (−0.3, 3.0) |
| Skin melanoma | 79.1 (77.3, 81.0) | 82.3 (80.5, 84.1) | 3.2 (0.6, 5.7) | 88.6 (87.2, 90.0) | 88.9 (87.5, 90.3) | 0.3 (−1.7, 2.3) |
| Breast (women) | 83.2 (82.5, 83.9) | 85.5 (84.8, 86.2) | 2.3 (1.3, 3.3) | |||
| Cervix uteri | 64.4 (62.5, 66.3) | 65.5 (63.5, 67.5) | 1.1 (−1.7, 3.8) | |||
| Corpus uteri | 74.6 (73.4, 75.9) | 74.0 (72.8, 75.3) | −0.6 (−2.4, 1.1) | |||
| Ovary and annexes | 37.5 (36.0, 39.0) | 40.9 (39.3, 42.6) | 3.5 (1.2, 5.7) | |||
| Prostate | 87.8 (87.2, 88.4) | 89.6 (89.0, 90.1) | 1.7 (0.9, 2.6) | |||
| Testicle | 85.2 (81.0, 89.6) | 89.4 (85.2, 93.9) | 4.2 (−1.9, 10.3) | |||
| Kidney | 59.8 (58.1, 61.6) | 64.8 (63.0, 66.6) | 5.0 (2.4, 7.5) | 61.4 (59.1, 63.7) | 65.8 (63.7, 68.0) | 4.4 (1.3, 7.6) |
| Urinary bladder | 72.3 (71.5, 73.1) | 73.8 (73.0, 74.7) | 1.6 (0.4, 2.7) | 72.9 (71.1, 74.8) | 75.9 (74.2, 77.6) | 3.0 (0.5, 5.5) |
| Brain | 19.3 (17.8, 21.0) | 20.8 (19.2, 22.6) | 1.5 (−0.9, 3.9) | 21.2 (19.3, 23.2) | 24.2 (22.1, 26.5) | 3.1 (0.2, 6.0) |
| Thyroid | 78.3 (74.9, 81.8) | 86.1 (83.2, 89.1) | 7.8 (3.3, 12.3) | 88.8 (87.3, 90.3) | 93.1 (91.8, 94.4) | 4.3 (2.3, 6.3) |
| Hodgkin lymphoma | 80.0 (77.3, 82.7) | 80.6 (77.8, 83.4) | 0.6 (−3.3, 4.5) | 83.3 (80.8, 85.9) | 82.6 (80.0, 85.3) | −0.7 (−4.4, 3.0) |
| Non-Hodgkin lymphoma | 57.2 (55.4, 58.9) | 62.4 (60.7, 64.1) | 5.2 (2.8, 7.6) | 63.0 (61.4, 64.6) | 68.4 (66.8, 70.0) | 5.4 (3.2, 7.7) |
| Myeloma | 40.1 (37.7, 42.7) | 44.8 (42.2, 47.5) | 4.6 (1.0, 8.3) | 42.5 (40.0, 45.2) | 51.2 (48.5, 54.1) | 8.7 (4.9, 12.5) |
| Acute lymphoid leukemia | 35.1 (29.9, 41.3) | 41.6 (34.8, 49.6) | 6.5 (−2.9, 15.8) | 37.1 (30.4, 45.3) | 40.0 (32.1, 49.7) | 2.9 (−8.5, 14.3) |
| Chronic lymphoid leukemia | 78.8 (76.2, 81.5) | 77.7 (74.6, 80.8) | −1.1 (−5.2, 2.9) | 80.7 (77.7, 83.9) | 80.7 (77.7, 83.8) | −0.0 (−4.4, 4.3) |
| Acute myeloid leukemia | 17.0 (14.9, 19.4) | 19.2 (16.9, 21.8) | 2.2 (−1.1, 5.5) | 19.8 (17.3, 22.6) | 24.9 (22.1, 28.0) | 5.1 (1.2, 9.0) |
| Chronic myeloid leukemia | 59.2 (53.6, 65.3) | 68.8 (62.7, 75.4) | 9.6 (1.0, 18.2) | 67.5 (59.6, 76.5) | 73.0 (66.4, 80.3) | 5.5 (−5.4, 16.4) |
| Leukemia NOS and others | 42.5 (38.2, 47.2) | 45.9 (41.4, 50.9) | 3.4 (−3.1, 10.0) | 33.5 (28.5, 39.5) | 41.9 (36.1, 48.7) | 8.4 (0.0, 16.8) |
| All cancers b | 52.0 (51.7, 52.2) | 55.3 (55.0, 55.6) | 3.3 (3.0, 3.7) | 59.2 (58.9, 59.6) | 61.7 (61.4, 62.1) | 2.5 (2.0, 3.0) |
| Cancer Group | Younger Than 75 Years | Aged 75 Years and Older | ||||
|---|---|---|---|---|---|---|
| ASNS (95% CI), % | Absolute Change a (95% CI), % | ASNS (95% CI), % | Absolute Change a (95% CI), % | |||
| 2002–2007 | 2008–2013 | 2002–2007 | 2008–2013 | |||
| Oral cavity and pharynx | 41.6 (40.3, 42.9) | 46.6 (45.2, 48.2) | 5.1 (3.1, 7.1) | 35.9 (32.1, 39.6) | 33.8 (30.3–37.3) | −2.1 (−7.2, 3.1) |
| Esophagus | 12.8 (11.4, 14.3) | 16.2 (14.4, 18.1) | 3.4 (1.1, 5.7) | 4.5 (2.7, 6.2) | 7.0 (4.8–9.2) | 2.5 (−0.2, 5.3) |
| Stomach | 30.5 (29.3, 31.8) | 31.5 (30.2, 32.9) | 1.0 (−0.8, 2.8) | 17.2 (15.7, 18.6) | 17.3 (15.8–18.7) | 0.1 (−1.9, 2.1) |
| Colon | 63.0 (62.1, 63.8) | 68.9 (68.1, 69.8) | 6.0 (4.8, 7.1) | 47.1 (45.7, 48.5) | 49.7 (48.4–51.0) | 2.5 (0.6, 4.4) |
| Rectum | 61.8 (60.8, 62.9) | 67.3 (66.2, 68.5) | 5.5 (3.9, 7.1) | 43.7 (41.7, 45.7) | 45.9 (43.9–48.0) | 2.3 (−0.6, 5.1) |
| Liver | 18.8 (17.6, 20.1) | 21.6 (20.2, 23.0) | 2.8 (0.9, 4.6) | 6.3 (5.1, 7.6) | 7.1 (5.8–8.4) | 0.8 (−1.0, 2.6) |
| Gallbladder and bile ducts | 21.5 (19.2, 24.1) | 25.2 (22.6, 28.2) | 3.7 (0.0, 7.4) | 10.6 (8.4, 12.8) | 10.3 (8.4–12.3) | −0.3 (−3.2, 2.7) |
| Pancreas | 7.9 (7.0, 8.8) | 10.7 (9.7, 11.8) | 2.8 (1.4, 4.2) | 2.0 (1.3, 2.7) | 2.3 (1.6–3.0) | 0.3 (−0.7, 1.3) |
| Larynx | 64.5 (63.0, 66.1) | 65.2 (63.3, 67.0) | 0.7 (−1.8, 3.1) | 51.5 (47.0, 56.0) | 49.1 (44.1–54.0) | −2.4 (−9.1, 4.3) |
| Lung | 14.2 (13.8, 14.7) | 17.0 (16.4, 17.6) | 2.7 (2.0, 3.5) | 5.9 (5.3, 6.5) | 5.9 (5.3–6.6) | 0.0 (−0.8, 0.9) |
| Skin melanoma | 86.3 (85.2, 87.3) | 87.8 (86.7, 88.9) | 1.5 (0.0, 3.1) | 71.3 (66.5, 76.2) | 73.6 (69.2–78.0) | 2.2 (−4.3, 8.8) |
| Breast (women) | 87.5 (87.0, 88.1) | 90.6 (90.1, 91.1) | 3.1 (2.3, 3.8) | 72.5 (70.4, 74.7) | 72.8 (70.8–74.9) | 0.3 (−2.6, 3.3) |
| Cervix uteri | 69.6 (67.6, 71.5) | 70.2 (68.1, 72.3) | 0.6 (−2.3, 3.5) | 32.8 (26.6, 39.0) | 36.5 (30.1–42.9) | 3.7 (−5.2, 12.6) |
| Corpus uteri | 81.3 (80.2, 82.4) | 82.3 (81.1, 83.5) | 1.0 (−0.6, 2.6) | 58.4 (55.3, 61.5) | 53.8 (50.5–57.1) | −4.6 (−9.1, 0.0) |
| Ovary and annexes | 46.1 (44.3, 48.0) | 49.8 (47.8, 51.9) | 3.7 (1.0, 6.5) | 16.3 (13.5, 19.1) | 19.1 (16.1–22.0) | 2.8 (−1.3, 6.9) |
| Prostate | 92.5 (92.0, 93.1) | 95.6 (95.1, 96.1) | 3.1 (2.3, 3.9) | 76.3 (74.8, 77.9) | 74.7 (73.2, 76.3) | −1.6 (−3.8, 0.6) |
| Testicle | 91.3 (88.2, 94.6) | 93.0 (89.6, 96.6) | 1.7 (−3.1, 6.4) | 29.9 (0.0, 62.0) | 57.0 (27.4–86.7) | 27.1 (−16.6, 70.7) |
| Kidney | 67.3 (65.8, 68.8) | 72.7 (71.3, 74.2) | 5.5 (3.4, 7.6) | 42.5 (39.4, 45.7) | 46.0 (42.8–49.2) | 3.5 (−1.1, 8.0) |
| Urinary bladder | 78.6 (77.8, 79.4) | 80.9 (80.1, 81.7) | 2.3 (1.2, 3.4) | 56.7 (55.0, 58.4) | 57.3 (55.7–59.0) | 0.7 (−1.7, 3.1) |
| Brain | 22.8 (21.4, 24.2) | 25.4 (23.9, 27.0) | 2.6 (0.5, 4.7) | 3.5 (2.2, 4.8) | 2.4 (1.3–3.4) | −1.1 (−2.8, 0.5) |
| Thyroid | 92.1 (91.0, 93.3) | 95.4 (94.5, 96.3) | 3.3 (1.8, 4.8) | 50.3 (43.1, 57.6) | 67.0 (60.5–73.4) | 16.6 (6.9, 26.3) |
| Hodgkin lymphoma | 85.8 (84.1, 87.6) | 86.2 (84.4, 88.1) | 0.4 (−2.2, 2.9) | 40.3 (30.2, 50.3) | 36.0 (26.1–45.9) | −4.2 (−18.4, 9.9) |
| Non-Hodgkin lymphoma | 68.0 (66.7, 69.3) | 73.8 (72.5, 75.1) | 5.8 (4.0, 7.7) | 39.2 (36.7, 41.8) | 43.5 (40.9–46.1) | 4.3 (0.6, 7.9) |
| Myeloma | 49.1 (46.8, 51.4) | 56.3 (53.9, 58.8) | 7.2 (3.9, 10.6) | 22.2 (19.5, 24.9) | 26.9 (23.9–30.0) | 4.7 (0.7, 8.8) |
| Acute lymphoid leukemia | 39.3 (34.6, 44.7) | 43.5 (37.8, 50.1) | 4.2 (−3.8, 12.1) | 2.6 (0.0, 6.6) | 14.8 (4.4–25.1) | 12.2 (1.1, 23.3) |
| Chronic lymphoid leukemia | 85.5 (83.5, 87.6) | 86.4 (84.0, 88.9) | 0.9 (−2.2, 4.0) | 64.9 (59.8, 70.0) | 60.4 (55.5–65.3) | −4.5 (−11.6, 2.6) |
| Acute myeloid leukemia | 24.3 (22.1, 26.8) | 29.8 (27.3, 32.5) | 5.4 (1.9, 8.9) | 3.2 (1.6, 4.8) | 2.1 (0.7–3.4) | −1.2 (−3.3, 0.9) |
| Chronic myeloid leukemia | 75.0 (70.1, 80.1) | 83.7 (78.9, 88.9) | 8.8 (1.7, 15.8) | 31.6 (18.7, 44.5) | 39.0 (28.3–49.7) | 7.4 (−9.4, 24.2) |
| Leukemia NOS and others | 47.5 (43.2, 52.3) | 53.9 (49.2, 59.1) | 6.4 (−0.3, 13.1) | 18.7 (14.4, 23.0) | 20.7 (15.4–26.1) | 2.0 (−4.9, 8.9) |
| All cancers b | 60.6 (60.4, 60.8) | 65.1 (64.8, 65.3) | 4.5 (4.1, 4.8) | 41.5 (41.0, 42.0) | 41.4 (40.9–41.8) | −0.1 (−0.8, 0.5) |
Publisher’s Note: MDPI stays neutral with regard to jurisdictional claims in published maps and institutional affiliations. |
© 2022 by the authors. Licensee MDPI, Basel, Switzerland. This article is an open access article distributed under the terms and conditions of the Creative Commons Attribution (CC BY) license (https://creativecommons.org/licenses/by/4.0/).
Share and Cite
Guevara, M.; Molinuevo, A.; Salmerón, D.; Marcos-Gragera, R.; Carulla, M.; Chirlaque, M.-D.; Rodríguez Camblor, M.; Alemán, A.; Rojas, D.; Vizcaíno Batllés, A.; et al. Cancer Survival in Adults in Spain: A Population-Based Study of the Spanish Network of Cancer Registries (REDECAN). Cancers 2022, 14, 2441. https://doi.org/10.3390/cancers14102441
Guevara M, Molinuevo A, Salmerón D, Marcos-Gragera R, Carulla M, Chirlaque M-D, Rodríguez Camblor M, Alemán A, Rojas D, Vizcaíno Batllés A, et al. Cancer Survival in Adults in Spain: A Population-Based Study of the Spanish Network of Cancer Registries (REDECAN). Cancers. 2022; 14(10):2441. https://doi.org/10.3390/cancers14102441
Chicago/Turabian StyleGuevara, Marcela, Amaia Molinuevo, Diego Salmerón, Rafael Marcos-Gragera, Marià Carulla, María-Dolores Chirlaque, Marta Rodríguez Camblor, Araceli Alemán, Dolores Rojas, Ana Vizcaíno Batllés, and et al. 2022. "Cancer Survival in Adults in Spain: A Population-Based Study of the Spanish Network of Cancer Registries (REDECAN)" Cancers 14, no. 10: 2441. https://doi.org/10.3390/cancers14102441