Obesity-Independent Association between Glycemic Status and the Risk of Hematologic Malignancy: A Nationwide Population-Based Longitudinal Cohort Study

 , ,
, ,
Abstract
:Simple Summary
Abstract
1. Introduction
2. Materials and Methods
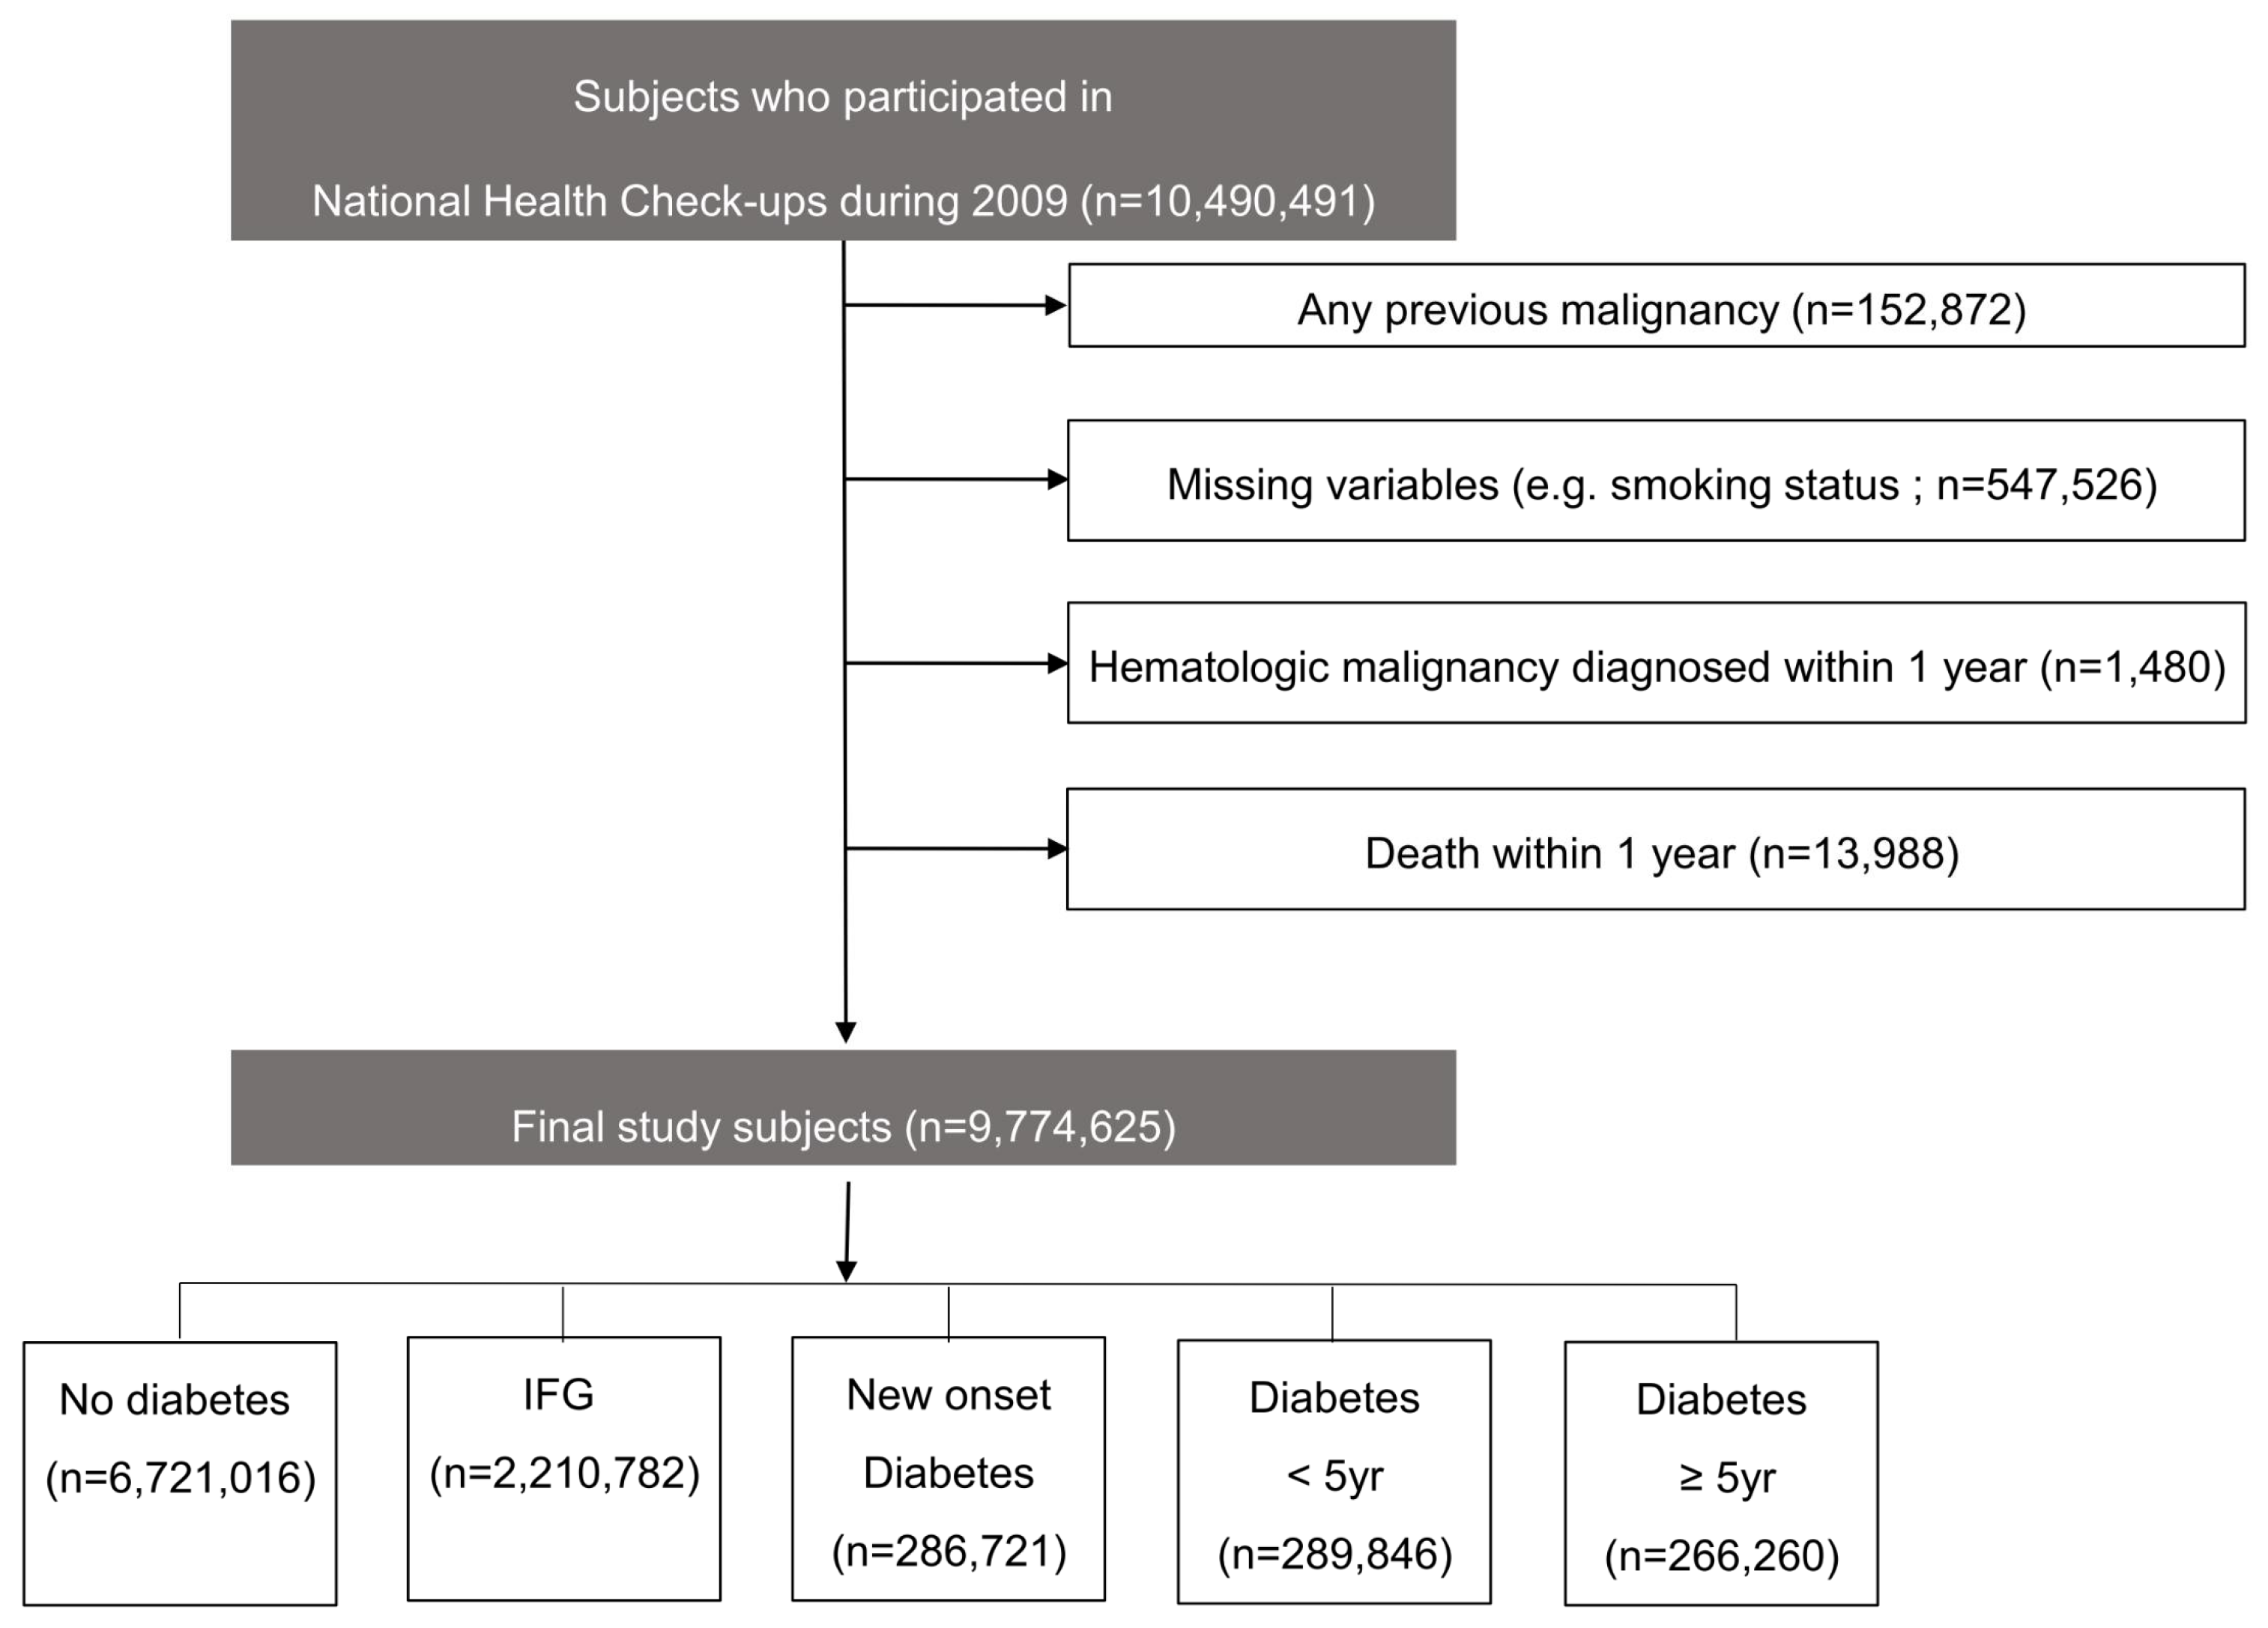
2.1. Data Source and Study Participants
2.2. Definition of Diabetes and Glucose Tolerance Status
2.3. Definition of Hematologic Malignancies
2.4. Covariates
2.5. Statistical Analysis
3. Results
3.1. Risk of Hematologic Malignancies According to the Presence of Diabetes
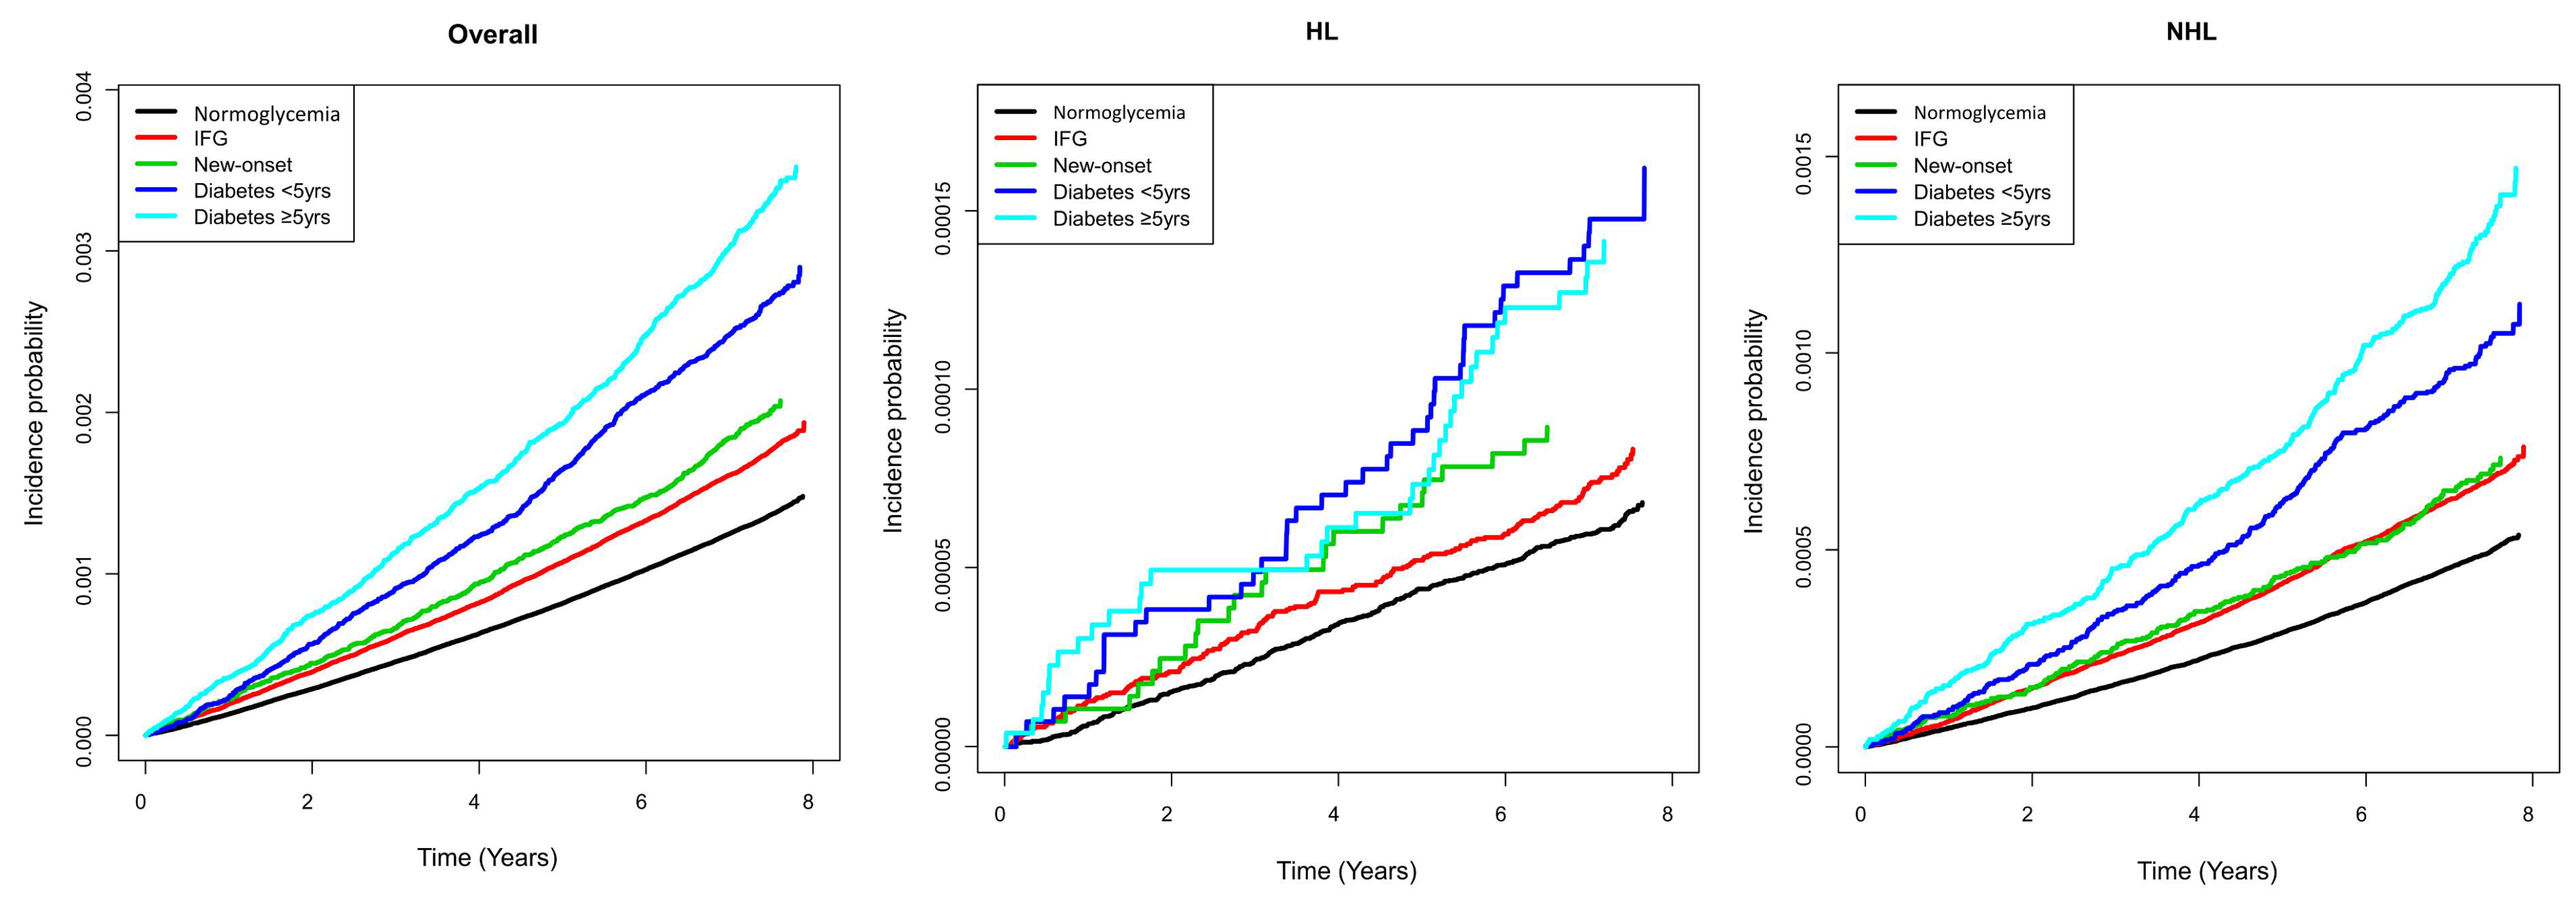
3.2. Risk of Hematologic Malignancies According to Baseline Glucose Tolerance Status and Diabetes Duration
3.3. Glycemic Status and Risk of Hematologic Malignancies Stratified by Age and BMI
3.4. Sensitivity Analyses
4. Discussion
5. Conclusions
Supplementary Materials
Author Contributions
Funding
Institutional Review Board Statement
Informed Consent Statement
Data Availability Statement
Acknowledgments
Conflicts of Interest
References
- El-Serag, H.B.; Tran, T.; Everhart, J.E. Diabetes increases the risk of chronic liver disease and hepatocellular carcinoma. Gastroenterology 2004, 126, 460–468. [Google Scholar] [CrossRef]
- Friberg, E.; Orsini, N.; Mantzoros, C.S.; Wolk, A. Diabetes mellitus and risk of endometrial cancer: A meta-analysis. Diabetologia 2007, 50, 1365–1374. [Google Scholar] [CrossRef] [PubMed]
- Harding, J.L.; Shaw, J.E.; Peeters, A.; Cartensen, B.; Magliano, D.J. Cancer risk among people with type 1 and type 2 diabetes: Disentangling true associations, detection bias, and reverse causation. Diabetes Care 2014, 38, 264–270. [Google Scholar] [CrossRef] [Green Version]
- Jiang, Y.; Ben, Q.; Shen, H.; Lu, W.; Zhang, Y.; Zhu, J. Diabetes mellitus and incidence and mortality of colorectal cancer: A systematic review and meta-analysis of cohort studies. Eur. J. Epidemiol. 2011, 26, 863–876. [Google Scholar] [CrossRef] [PubMed]
- Atchison, E.; Gridley, G.; Carreon, J.D.; Leitzmann, M.F.; McGlynn, K.A. Risk of cancer in a large cohort of U.S. veterans with diabetes. Int. J. Cancer 2010, 128, 635–643. [Google Scholar] [CrossRef] [PubMed]
- Lai, G.Y.; Park, Y.; Hartge, P.; Hollenbeck, A.R.; Freedman, N.D. The association between self-reported diabetes and cancer incidence in the NIH-AARP diet and health study. J. Clin. Endocrinol. Metab. 2013, 98, E497–E502. [Google Scholar] [CrossRef] [Green Version]
- Saarela, K.; Tuomilehto, J.; Sund, R.; Keskimäki, I.; Hartikainen, S.; Pukkala, E. Cancer incidence among Finnish people with type 2 diabetes during 1989–2014. Eur. J. Epidemiol. 2018, 34, 259–265. [Google Scholar] [CrossRef] [PubMed]
- Castillo, J.J.; Mull, N.; Reagan, J.L.; Nemr, S.; Mitri, J. Increased incidence of non-Hodgkin lymphoma, leukemia, and myeloma in patients with diabetes mellitus type 2: A meta-analysis of observational studies. J. Am. Soc. Hematol. 2012, 119, 4845–4850. [Google Scholar] [CrossRef] [Green Version]
- Lo, S.-F.; Chang, S.-N.; Muo, C.-H.; Chen, S.-Y.; Liao, F.-Y.; Dee, S.-W.; Chen, P.-C.; Sung, F.-C. Modest increase in risk of specific types of cancer types in type 2 diabetes mellitus patients. Int. J. Cancer 2012, 132, 182–188. [Google Scholar] [CrossRef]
- Hu, Y.; Zhang, X.; Ma, Y.; Yuan, C.; Wang, M.; Wu, K.; Tabung, F.K.; Tobias, D.; Hu, F.B.; Giovannucci, E.; et al. Incident type 2 diabetes duration and cancer risk: A prospective study in two US cohorts. J. Natl. Cancer Inst. 2020, 113, 381–389. [Google Scholar] [CrossRef]
- Wotton, C.J.; Yeates, D.G.R.; Goldacre, M.J. Cancer in patients admitted to hospital with diabetes mellitus aged 30 years and over: Record linkage studies. Diabetologia 2010, 54, 527–534. [Google Scholar] [CrossRef] [Green Version]
- Dankner, R.; Boffetta, P.; Balicer, R.D.; Boker, L.K.; Sadeh, M.; Berlin, A.; Olmer, L.; Goldfracht, M.; Freedman, L.S. Time-Dependent Risk of Cancer After a Diabetes Diagnosis in a Cohort of 2.3 Million Adults. Am. J. Epidemiol. 2016, 183, 1098–1106. [Google Scholar] [CrossRef] [Green Version]
- Yang, W.-S.; Li, H.-L.; Xu, H.-L.; Yang, G.; Gao, Y.-T.; Zheng, W.; Shu, X.-O.; Xiang, Y.-B. Type 2 diabetes and the risk of non-Hodgkin’s lymphoma: A report from two population-based cohort studies in China. Eur. J. Cancer Prev. 2016, 25, 149. [Google Scholar] [CrossRef] [PubMed]
- Gini, A.; Bidoli, E.; Zanier, L.; Clagnan, E.; Zanette, G.; Gobbato, M.; De Paoli, P.; Serraino, D. Cancer among patients with type 2 diabetes mellitus: A population-based cohort study in northeastern Italy. Cancer Epidemiol. 2016, 41, 80–87. [Google Scholar] [CrossRef] [PubMed]
- Tseng, C.-H. Diabetes and non-Hodgkin’s lymphoma: Analyses of prevalence and annual incidence in 2005 using the national health insurance database in Taiwan. Ann. Oncol. 2011, 23, 153–158. [Google Scholar] [CrossRef]
- Khan, A.E.; Gallo, V.; Linseisen, J.; Kaaks, R.; Rohrmann, S.; Raaschou-Nielsen, O.; Tjønneland, A.; Johnsen, H.E.; Overvad, K.; Bergmann, M.M.; et al. Diabetes and the risk of non-Hodgkin‘s lymphoma and multiple myeloma in the European Prospective Investigation into Cancer and Nutrition. Haematologica 2008, 93, 842–850. [Google Scholar] [CrossRef] [PubMed] [Green Version]
- American Diabetes Association. Classification and diagnosis of diabetes: Standards of medical care in diabetes-2020. Diabetes Care 2020, 43, S14. [Google Scholar] [CrossRef] [PubMed] [Green Version]
- Rhee, S.Y.; Han, K.-D.; Kwon, H.; Park, S.-E.; Park, Y.-G.; Kim, Y.-H.; Yoo, S.-J.; Rhee, E.-J.; Lee, W.-Y. Association between glycemic status and the risk of parkinson disease: A nationwide population-based study. Diabetes Care 2020, 43, 2169–2175. [Google Scholar] [CrossRef] [PubMed]
- Jeong, S.-M.; Choi, T.; Kim, D.; Han, K.; Kim, S.J.; Rhee, S.Y.; Giovannucci, E.L.; Shin, D.W. Association between high-density lipoprotein cholesterol level and risk of hematologic malignancy. Leukemia 2020, 35, 1–9. [Google Scholar] [CrossRef]
- Cerhan, J.R.; Wallace, R.B.; Lutz, C.T.; Folsom, A.R.; Thomas, A.S.; Zheng, W.; Potter, J.D. Medical history risk factors for non-Hodgkin‘s lymphoma in older women. J. Natl. Cancer Inst. 1997, 89, 314–318. [Google Scholar] [CrossRef] [PubMed] [Green Version]
- Hong, S.; Won, Y.-J.; Park, Y.R.; Jung, K.-W.; Kong, H.-J.; Lee, E.S. Cancer statistics in Korea: Incidence, mortality, survival, and prevalence in cancer research and treatment. Off. J. Korean Cancer Assoc. 2020, 52, 335. [Google Scholar]
- Won, Y.-W.; Kwon, J.H.; Lee, S.I.; Oh, S.Y.; Kim, W.S.; Kim, S.J.; Won, J.-H.; Kim, K.H.; Park, S.K.; Kim, J.S.; et al. Clinical features and outcomes of Hodgkin’s lymphoma in Korea: Consortium for Improving survival of lymphoma (CISL). Ann. Hematol. 2011, 91, 223–233. [Google Scholar] [CrossRef]
- Böni-Schnetzler, M.; Schmid, C.; Mary, J.-L.; Zimmerli, B.; Meier, P.J.; Zapf, J.; Schwander, J.; Froesch, E.R. Insulin regulates the expression of the insulin-like growth factor binding protein 2 mRNA in rat hepatocytes. Mol. Endocrinol. 1990, 4, 1320–1326. [Google Scholar] [CrossRef] [PubMed] [Green Version]
- Lawlor, M.A.; Alessi, D.R. PKB/Akt: A key mediator of cell proliferation, survival and insulin responses? J. Cell Sci. 2001, 114, 2903–2910. [Google Scholar] [CrossRef] [PubMed]
- Weijzen, S.; Velders, M.; Kast, W. Modulation of the immune response and tumor growth by activated Ras. Leukemia 1999, 13, 502–513. [Google Scholar] [CrossRef] [Green Version]
- Perez-Cornago, A.; Appleby, P.N.; Tipper, S.; Key, T.J.; Allen, N.E.; Nieters, A.; Vermeulen, R.; Roulland, S.; Casabonne, D.; Kaaks, R. Prediagnostic circulating concentrations of plasma insulin-like growth factor-I and risk of lymphoma in the European prospective investigation into cancer and nutrition. Int. J. Cancer 2017, 140, 1111–1118. [Google Scholar] [CrossRef]
- Oikawa, A.; Siragusa, M.; Quaini, F.; Mangialardi, G.; Katare, R.; Caporali, A.; Van Buul, J.; Van Alphen, F.P.; Graiani, G.; Spinetti, G.; et al. Diabetes mellitus induces bone marrow microangiopathy. Arterioscler. Thromb. Vasc. Biol. 2010, 30, 498–508. [Google Scholar] [CrossRef] [PubMed]
- Kraakman, M.J.; Kammoun, H.L.; Dragoljevic, D.; Al-Sharea, A.; Lee, M.K.; Flynn, M.C.; Stolz, C.J.; Guirguis, A.A.; Lancaster, G.I.; Chin-Dusting, J.; et al. Leptin-deficient obesity prolongs survival in a murine model of myelodysplastic syndrome. Haematologica 2018, 103, 597–606. [Google Scholar] [CrossRef] [Green Version]
- Han, T.-J.; Wang, X. Leptin and its receptor in hematologic malignancies. Int. J. Clin. Exp. Med. 2015, 8, 19840. [Google Scholar] [PubMed]
- Imbesi, S.; Musolino, C.; Allegra, A.; Saija, A.; Morabito, F.; Calapai, G.; Gangemi, S. Oxidative stress in oncohematologic diseases: An update. Expert Rev. Hematol. 2013, 6, 317–325. [Google Scholar] [CrossRef]
- Ma, R.C.; Chan, J. Type 2 diabetes in East Asians: Similarities and differences with populations in Europe and the United States. Ann. NY Acad. Sci. 2013, 1281, 64–91. [Google Scholar] [CrossRef] [PubMed] [Green Version]
- Wang, Y.; Liu, X.; Yan, P.; Bi, Y.; Liu, Y.; Zhang, Z.-J. Association between type 1 and type 2 diabetes and risk of non-Hodgkin‘s lymphoma: A meta-analysis of cohort studies. Diabetes Metab. 2020, 46, 8–19. [Google Scholar] [CrossRef] [PubMed]
- Cook, L.; Melamed, A.; Niederer, H.; Valganon, M.; Laydon, D.; Foroni, L.; Taylor, G.P.; Matsuoka, M.; Bangham, C.R.M. The role of HTLV-1 clonality, proviral structure, and genomic integration site in adult T-cell leukemia/lymphoma. Blood 2014, 123, 3925–3931. [Google Scholar] [CrossRef] [Green Version]
- Fassone, L.; Bhatia, K.; Gutierrez, M.; Capello, D.; Gloghini, A.; Dolcetti, R.; Vivenza, D.; Ascoli, V.; Coco, F.; Pagani, L.; et al. Molecular profile of Epstein–Barr virus infection in HHV-8-positive primary effusion lymphoma. Leukemia 2000, 14, 271–277. [Google Scholar] [CrossRef] [PubMed] [Green Version]


| Glycemic Status Category | Normoglycemia | IFG | Newly Detected Diabetes | Diabetes < 5 Years | Diabetes ≥ 5 Years |
|---|---|---|---|---|---|
| (n = 6,721,016) | (n = 2,210,782) | (n = 286,721) | (n = 289,846) | (n = 266,260) | |
| Age | 44.82 ± 13.84 | 49.63 ± 13.27 | 51.85 ± 12.66 | 58.31 ± 11.09 | 61.89 ± 9.89 |
| Sex, male | 3,471,338 (51.7) | 1,370,671 (62.0) | 204,232 (71.2) | 168,676 (58.2) | 145,231 (54.5) |
| Smoking status | |||||
| Non-smoker | 4,131,803 (61.5) | 1,205,511 (54.5) | 133,656 (46.6) | 167,006 (57.6) | 167,597 (62.9) |
| Ex-smoker | 852,248 (12.7) | 385,137 (17.4) | 52,303 (18.2) | 53,932 (18.6) | 47,252 (17.8) |
| Current-smoker | 1,736,965 (25.8) | 620,134 (28.1) | 100,762 (35.1) | 68,908 (23.8) | 51,411 (19.3) |
| Alcohol consumption | |||||
| None | 3,483,838 (51.8) | 1,041,566 (47.1) | 123,167 (43.0) | 175,294 (60.5) | 178,196 (66.9) |
| Mild | 2,772,531 (41.3) | 935,802 (42.33) | 122,823 (42.8) | 88,405 (30.5) | 69,817 (26.2) |
| Heavy | 464,647 (6.9) | 233,414 (10.6) | 40,731 (14.2) | 26,147 (9.0) | 18,247 (6.9) |
| Regular physical activity | 1,161,028 (17.3) | 419,581 (19.0) | 54,394 (19.0) | 64,325 (22.2) | 64,782 (24.3) |
| Comorbidities | |||||
| Hypertension | 1,289,796 (19.2) | 726,690 (32.9) | 124,915 (43.6) | 180,358 (62.2) | 177,685 (66.7) |
| Dyslipidemia | 938,118 (14.0) | 495,844 (22.4) | 81,959 (28.6) | 140,205 (48.4) | 125,602 (47.2) |
| Chronic kidney disease | 326,778 (4.86) | 147,030 (6.65) | 21,675 (7.56) | 31,530 (10.88) | 45,848 (17.22) |
| Obesity (BMI > 25 kg/m2) | 1,860,854 (27.7) | 875,575 (39.6) | 137,675 (48.0) | 150,114 (51.8) | 114,271 (42.9) |
| Body mass index, kg/m2 | 23.1 (21.1–25.3) | 24.2 (22.2–26.3) | 24.9 (22.8–27.0) | 25.2 (23.2–27.3) | 24.5 (22.6–26.5) |
| Waist circumference, cm | 79 (72–85) | 82 (76–88) | 85 (80–90) | 86 (81–91) | 85 (80–90) |
| Fasting glucose, mg/dL | 88 (82–94) | 106 (102–112) | 140 (131–159) | 126 (107–153) | 135 (112–169) |
| Systolic blood pressure, mmHg | 120 (110–130) | 125 (116–135) | 130 (120–139) | 130 (120–138) | 130 (120–139) |
| Diastolic blood pressure, mmHg | 75 (70–80) | 80 (70–84) | 80 (73–88) | 80 (70–85) | 80 (70–83) |
| Total cholesterol, mg/dL | 190 (168–214) | 199 (176–225) | 205 (179–233) | 192 (166–221) | 185 (160–213) |
| Triglycerides, mg/dL | 105.4 (105.4–105.4) | 128.6 (128.5–128.7) | 162.1 (161.8–162.5) | 150.5 (150.2–150.8) | 139.7 (139.4–140.0) |
| HDL-cholesterol, mg/dL | 54 (46–64) | 53 (45–62) | 51 (43–60) | 49 (41–58) | 49 (41–57) |
| LDL-cholesterol, mg/dL | 110 (90–132) | 116 (94–139) | 115 (91–141) | 108 (83–133) | 104 (81–128) |
| Sulfonylurea | 203,200 (70.1) | 224,755 (84.4) | |||
| Metformin | 200,405 (69.1) | 193,325 (72.6) | |||
| Meglitinides | 10,024 (3.5) | 14,888 (5.6) | |||
| Thiazolidinedione | 31,763 (11.0) | 40,912 (15.4) | |||
| Dipeptidyl peptidase-4 inhibitor | 26,015 (9.0) | 23,424 (8.8) | |||
| Alpha-glucosidase inhibitor | 39,788 (13.7) | 79,722 (29.9) | |||
| Insulin | 23,523 (8.1) | 47,469 (17.8) |
| Subjects (N) | Event (n) | Duration (Person-Years) | Incidence Rate (per 100,000 Person-Years) | Model 1 | Model 2 | |
|---|---|---|---|---|---|---|
| All Hematologic Malignancy | ||||||
| No Diabetes | 8,931,798 | 12,632 | 65,014,611.6 | 19.40 | 1 (Ref.) | 1 (Ref.) |
| Diabetes | 842,827 | 2101 | 5,974,211.7 | 35.20 | 1.08 (1.03,1.13) | 1.05 (1.01,1.10) |
| 1. Hodgkin Lymphoma | ||||||
| No Diabetes | 8,931,798 | 592 | 65,041,866.8 | 0.91 | 1 (Ref.) | 1 (Ref.) |
| Diabetes | 842,827 | 102 | 5,978,296.2 | 1.71 | 1.27 (1.02,1.58) | 1.28 (1.03,1.59) |
| 2. Non-Hodgkin Lymphoma | ||||||
| No Diabetes | 8,931,798 | 4691 | 65,031,545.4 | 7.21 | 1 (Ref.) | 1 (Ref.) |
| Diabetes | 842,827 | 801 | 5,976,673.7 | 13.40 | 1.11 (1.03,1.20) | 1.09 (1.01,1.17) |
| 3. Myeloid Leukemia | ||||||
| No Diabetes | 8,931,798 | 3698 | 65,035,921.5 | 5.69 | 1 (Ref.) | 1 (Ref.) |
| Diabetes | 842,827 | 571 | 5,977,584.1 | 9.55 | 1.09 (1.00,1.19) | 1.06 (0.97,1.16) |
| 4. Lymphoid Leukemia | ||||||
| No Diabetes | 8,931,798 | 1059 | 65,041,338.5 | 1.63 | 1 (Ref.) | 1 (Ref.) |
| Diabetes | 842,827 | 153 | 5,978,245.5 | 2.56 | 1.04 (0.87,1.23) | 1.01 (0.85,1.20) |
| 5. Multiple Myeloma | ||||||
| No Diabetes | 8,931,798 | 3,067 | 65,037,282.2 | 4.72 | 1 (Ref.) | 1 (Ref.) |
| Diabetes | 842,827 | 548 | 5,977,526.9 | 9.17 | 1.01 (0.92,1.10) | 0.99 (0.90,1.08) |
| Subjects (N) | Event (n) | Duration (Person-Years) | Incidence Rate (per 1000 Person-Years) | Model 1 | Model 2 | |
|---|---|---|---|---|---|---|
| All Hematologic Malignancy | ||||||
| Normoglycemia | 6,721,016 | 8885 | 48,998,241.0 | 18.13 | 1 (Ref.) | 1 (Ref.) |
| Impaired fasting glucose | 2,210,782 | 3747 | 16,016,370.5 | 23.40 | 1.00 (0.96,1.04) | 0.99 (0.95,1.02) |
| Newly detected diabetes | 286,721 | 543 | 2,046,567.9 | 26.53 | 1.01 (0.92,1.10) | 0.99 (0.91,1.08) |
| Diabetes (<5 years) | 289,846 | 740 | 2,067,385.4 | 35.79 | 1.07 (0.99,1.15) | 1.03 (0.96,1.11) |
| Diabetes (≥5 years) | 266,260 | 818 | 1,860,258.4 | 43.97 | 1.14 (1.06,1.23) | 1.11 (1.03,1.20) |
| 1. Hodgkin’s Lymphoma | ||||||
| Normoglycemia | 6,721,016 | 422 | 49,017,433.3 | 0.86 | 1 (Ref.) | 1 (Ref.) |
| Impaired fasting glucose | 2,210,782 | 170 | 16,024,433.5 | 1.06 | 1 (0.84,1.20) | 1.02 (0.85,1.22) |
| Newly detected diabetes | 286,721 | 25 | 2,047,711.7 | 1.22 | 1.03 (0.69,1.54) | 1.04 (0.69,1.57) |
| Diabetes (<5 years) | 289,846 | 42 | 2,068,831.9 | 2.03 | 1.49 (1.08,2.06) | 1.51 (1.09,2.09) |
| Diabetes (≥5 years) | 266,260 | 35 | 1,861,752.6 | 1.88 | 1.26 (0.89,1.79) | 1.27 (0.89,1.81) |
| 2. Non-Hodgkin’s Lymphoma | ||||||
| Normoglycemia | 6,721,016 | 3239 | 49,010,295.7 | 6.61 | 1 (Ref.) | 1 (Ref.) |
| Impaired fasting glucose | 2,210,782 | 1452 | 16,021,249.7 | 9.06 | 1.07 (1.00,1.14) | 1.05 (0.98,1.12) |
| Newly detected diabetes | 286,721 | 191 | 2,047,292.1 | 9.33 | 0.98 (0.84,1.13) | 0.95 (0.82,1.11) |
| Diabetes (<5 years) | 289,846 | 282 | 2,068,219.3 | 13.64 | 1.13 (1.00,1.28) | 1.09 (0.96,1.23) |
| Diabetes (≥5 years) | 266,260 | 328 | 1,861,162.3 | 17.62 | 1.27 (1.13,1.43) | 1.24 (1.10,1.39) |
| 3. Myeloid Leukemia | ||||||
| Normoglycemia | 6,721,016 | 2667 | 49,013,083.3 | 5.44 | 1 (Ref.) | 1 (Ref.) |
| Impaired fasting glucose | 2,210,782 | 1031 | 16,022,838.2 | 6.44 | 0.95 (0.88,1.02) | 0.93 (0.86,1.00) |
| Newly detected diabetes | 286,721 | 150 | 2,047,485.0 | 7.33 | 0.97 (0.82,1.15) | 0.94 (0.80,1.11) |
| Diabetes (<5 years) | 289,846 | 197 | 2,068,637.3 | 9.52 | 1.05 (0.91,1.21) | 1.00 (0.86,1.16) |
| Diabetes (≥5 years) | 266,260 | 224 | 1,861,461.8 | 12.03 | 1.18 (1.03,1.36) | 1.14 (0.99,1.31) |
| 4. Lymphoid leukemia | ||||||
| Normoglycemia | 6,721,016 | 746 | 49,017,148.6 | 1.52 | 1 (Ref.) | 1 (Ref.) |
| Impaired fasting glucose | 2,210,782 | 313 | 16,024,189.8 | 1.95 | 1.05 (0.92,1.19) | 1.02 (0.90,1.17) |
| Newly detected diabetes | 286,721 | 45 | 2,047,662.3 | 2.20 | 1.07 (0.79,1.44) | 1.04 (0.77,1.40) |
| Diabetes (<5 years) | 289,846 | 54 | 2,068,839.1 | 2.61 | 1.05 (0.79,1.39) | 1.01 (0.76,1.33) |
| Diabetes (≥5 years) | 266,260 | 54 | 1,861,744.1 | 2.90 | 1.04 (0.79,1.38) | 1.02 (0.77,1.35) |
| 5. Multiple Myeloma | ||||||
| Normoglycemia | 6,721,016 | 2142 | 49,014,251.6 | 4.37 | 1 (Ref.) | 1 (Ref.) |
| Impaired fasting glucose | 2,210,782 | 925 | 16,023,030.6 | 5.77 | 0.96 (0.89,1.04) | 0.96 (0.89,1.04) |
| Newly detected diabetes | 286,721 | 144 | 2,047,492.8 | 7.03 | 1.03 (0.87,1.21) | 1.02 (0.86,1.21) |
| Diabetes (<5 years) | 289,846 | 199 | 2,068,565.9 | 9.62 | 1.01 (0.87,1.17) | 0.98 (0.85,1.14) |
| Diabetes (≥5 years) | 266,260 | 205 | 1,861,468.3 | 11.01 | 0.96 (0.83,1.11) | 0.93 (0.81,1.08) |
| N | All Blood Cancer | Hodgkin Lymphoma | Non-Hodgkin Lymphoma | Myeloid Leukemia | Lymphoid Leukemia | Multiple Myeloma | ||||||||
|---|---|---|---|---|---|---|---|---|---|---|---|---|---|---|
| Event | aHR (95% CI) | Event | aHR (95% CI) | Event | aHR (95% CI) | Event | aHR (95% CI) | Event | aHR (95% CI) | Event | aHR (95% CI) | |||
| Age | Diabetes | |||||||||||||
| <40 | No | 3,035,864 | 1446 | 1 (Ref.) | 132 | 1 (Ref.) | 521 | 1 (Ref.) | 604 | 1 (Ref.) | 162 | 1 (Ref.) | 76 | 1 (Ref.) |
| Yes | 63,404 | 45 | 1.26 (0.94,1.70) | 3 | 1.15 (0.36,3.65) | 12 | 0.93 (0.52,1.65) | 24 | 1.56 (1.03,2.35) | 4 | 1.06 (0.39,2.88) | 3 | 1.45 (0.45,4.65) | |
| 40–64 | No | 4,895,306 | 7197 | 1 (Ref.) | 313 | 1 (Ref.) | 2711 | 1 (Ref.) | 2109 | 1 (Ref.) | 633 | 1 (Ref.) | 1729 | 1 (Ref.) |
| Yes | 528,531 | 1104 | 1.10 (1.03,1.17) | 56 | 1.25 (0.93,1.67) | 430 | 1.15 (1.04,1.28) | 308 | 1.09 (0.96,1.23) | 86 | 1.02 (0.81,1.28) | 266 | 1.01 (0.89,1.16) | |
| ≥65 | No | 1,000,628 | 3989 | 1 (Ref.) | 147 | 1 (Ref.) | 1459 | 1 (Ref.) | 985 | 1 (Ref.) | 264 | 1 (Ref.) | 1262 | 1 (Ref.) |
| Yes | 250,892 | 952 | 0.96 (0.89,1.03) | 43 | 1.22 (0.86,1.71) | 359 | 0.98 (0.87,1.10) | 239 | 0.97 (0.84,1.12) | 63 | 0.97 (0.73,1.28) | 279 | 0.90 (0.79,1.03) | |
| p for interaction | 0.004 | 0.706 | 0.078 | 0.093 | 0.896 | 0.154 | ||||||||
| Glycemic status | ||||||||||||||
| <40 | Normoglycemia | 2,528,330 | 1179 | 1 (Ref.) | 105 | 1 (Ref.) | 426 | 1 (Ref.) | 482 | 1 (Ref.) | 141 | 1 (Ref.) | 64 | 1 (Ref.) |
| Impaired fasting glucose | 507,534 | 267 | 1.02 (0.89,1.17) | 27 | 1.35 (0.88,2.08) | 95 | 1.01 (0.80,1.26) | 122 | 1.12 (0.92,1.37) | 21 | 0.69 (0.43,1.09) | 12 | 0.78 (0.42,1.46) | |
| Newly detected diabetes | 47,588 | 31 | 1.19 (0.83,1.70) | 2 | 1.10 (0.27,4.50) | 10 | 1.05 (0.56,1.98) | 14 | 1.28 (0.75,2.18) | 3 | 0.99 (0.31,3.12) | 3 | 1.87 (0.58,6.03) | |
| Diabetes < 5 y | 12,588 | 7 | 0.94 (0.44,1.97) | 1 | 2.06 (0.28,14.90) | 1 | 0.37 (0.05,2.61) | 5 | 1.55 (0.64,3.77) | 0 | N/A | 0 | N/A | |
| Diabetes ≥ 5 y | 3228 | 7 | 3.64 (1.73,7.66) | 0 | N/A | 1 | 1.41 (0.20,10.08) | 5 | 6.06 (2.50,14.68) | 1 | 4.73 (0.66,34.09) | 0 | N/A | |
| 40–64 | Normoglycemia | 3,519,512 | 4999 | 1 (Ref.) | 221 | 1 (Ref.) | 1848 | 1 (Ref.) | 1507 | 1 (Ref.) | 430 | 1 (Ref.) | 1203 | 1 (Ref.) |
| Impaired fasting glucose | 1,375,794 | 2198 | 1.00 (0.95,1.05) | 92 | 0.92 (0.721.18) | 863 | 1.06 (0.98,1.16) | 602 | 0.91 (0.83,1.00) | 203 | 1.09 (0.92,1.29) | 526 | 0.98 (0.88,1.08) | |
| Newly detected diabetes | 190,421 | 342 | 1.05 (0.94,1.17) | 15 | 0.95 (0.56,1.62) | 125 | 1.05 (0.87,1.25) | 91 | 0.93 (0.75,1.16) | 28 | 1.02 (0.69,1.50) | 90 | 1.13 (0.91,1.41) | |
| Diabetes < 5 y | 187,609 | 409 | 1.12 (1.01,1.24) | 22 | 1.33 (0.85,2.08) | 162 | 1.23 (1.04,1.44) | 114 | 1.07 (0.88,1.30) | 33 | 1.11 (0.77,1.59) | 100 | 1.03 (0.84,1.27) | |
| Diabetes ≥ 5 y | 150,501 | 353 | 1.12 (1.00,1.25) | 19 | 1.36 (0.85,2.19) | 143 | 1.26 (1.06,1.50) | 103 | 1.16 (0.95,1.43) | 25 | 1.01 (0.67,1.52) | 76 | 0.86 (0.68,1.09) | |
| ≥65 | Normoglycemia | 673,174 | 2707 | 1 (Ref.) | 96 | 1 (Ref.) | 965 | 1 (Ref.) | 678 | 1 (Ref.) | 175 | 1 (Ref.) | 875 | 1 (Ref.) |
| Impaired fasting glucose | 327,454 | 1282 | 0.94 (0.88,1.01) | 51 | 1.07 (0.76,1.51) | 494 | 1.01 (0.90,1.12) | 307 | 0.89 (0.78,1.02) | 89 | 1.01 (0.78,1.31) | 387 | 0.89 (0.79,1.01) | |
| Newly detected diabetes | 48,712 | 170 | 0.84 (0.72,0.98) | 8 | 1.13 (0.55,2.33) | 56 | 0.77 (0.58,1.00) | 45 | 0.87 (0.64,1.18) | 14 | 1.08 (0.62,1.86) | 51 | 0.80 (0.60,1.06) | |
| Diabetes < 5 y | 89,649 | 324 | 0.89 (0.79,1.00) | 19 | 1.55 (0.94,2.55) | 119 | 0.90 (0.74,1.09) | 78 | 0.85 (0.67,1.07) | 21 | 0.90 (0.57,1.42) | 99 | 0.86 (0.69,1.06) | |
| Diabetes ≥ 5 y | 112,531 | 458 | 1.03 (0.93,1.14) | 16 | 1.06 (0.62,1.80) | 184 | 1.15 (0.98,1.34) | 116 | 1.03 (0.85,1.26) | 28 | 0.98 (0.66,1.47) | 129 | 0.91 (0.76,1.09) | |
| p for interaction | 0.001 | 0.977 | 0.227 | 0.008 | 0.51 | 0.368 | ||||||||
| BMI, kg/m2 | Diabetes | |||||||||||||
| <25 | No | 6,195,369 | 8174 | 1 (Ref.) | 396 | 1 (Ref.) | 2995 | 1 (Ref.) | 2380 | 1 (Ref.) | 680 | 1 (Ref.) | 2025 | 1 (Ref.) |
| Yes | 440,767 | 1092 | 1.07 (1.00,1.14) | 55 | 1.29 (0.97,1.72) | 409 | 1.11 (1.00,1.23) | 282 | 1.03 (0.91,1.17) | 89 | 1.18 (0.94,1.48) | 294 | 1.00 (0.88,1.13) | |
| ≥25 | No | 2,736,429 | 4458 | 1 (Ref.) | 196 | 1 (Ref.) | 1696 | 1 (Ref.) | 1318 | 1 (Ref.) | 379 | 1 (Ref.) | 1042 | 1 (Ref.) |
| Yes | 402,060 | 1009 | 1.05 (0.98,1.13) | 47 | 1.22 (0.88,1.70) | 392 | 1.07 (0.96,1.20) | 289 | 1.12 (0.99,1.28) | 64 | 0.86 (0.65,1.12) | 254 | 1.00 (0.87,1.15) | |
| p for interaction | 0.849 | 0.957 | 0.875 | 0.544 | 0.073 | 0.879 | ||||||||
| Glycemic status | ||||||||||||||
| <25 | Normoglycemia | 4,860,162 | 5990 | 1 (Ref.) | 288 | 1 (Ref.) | 2148 | 1 (Ref.) | 1789 | 1 (Ref.) | 504 | 1 (Ref.) | 1477 | 1 (Ref.) |
| Impaired fasting glucose | 1,335,207 | 2184 | 1.00 (0.95,1.05) | 108 | 1.09 (0.87,1.37) | 847 | 1.09 (1.00,1.18) | 591 | 0.94 (0.85,1.03) | 176 | 1.01 (0.85,1.20) | 548 | 0.95 (0.86,1.05) | |
| Newly detected diabetes | 149,046 | 275 | 0.97 (0.86,1.10) | 13 | 1.03 (0.59,1.80) | 86 | 0.86 (0.69,1.07) | 72 | 0.90 (0.71,1.13) | 33 | 1.51 (1.06,2.15) | 77 | 1.05 (0.80,1.26) | |
| Diabetes < 5 y | 139,732 | 351 | 1.044 (0.94,1.16) | 22 | 1.64 (1.05,2.54) | 137 | 1.16 (0.97,1.38) | 83 | 0.91 (0.73,1.14) | 23 | 0.93 (0.61,1.42) | 100 | 1.01 (0.82,1.23) | |
| Diabetes ≥ 5 y | 151,989 | 466 | 1.16 (1.05,1.28) | 20 | 1.31 (0.82,2.07) | 186 | 1.32 (1.13,1.54) | 127 | 1.19 (0.99,1.43) | 33 | 1.14 (0.80,1.63) | 117 | 0.95 (0.78,1.15) | |
| ≥25 | Normoglycemia | 1,860,854 | 2895 | 1 (Ref.) | 134 | 1 (Ref.) | 1091 | 1 (Ref.) | 878 | 1 (Ref.) | 242 | 1 (Ref.) | 665 | 1 (Ref.) |
| Impaired fasting glucose | 875,575 | 1563 | 0.98 (0.92,1.04) | 62 | 0.88 (0.65,1.19) | 605 | 1.00 (0.91,1.11) | 440 | 0.94 (0.84,1.06) | 137 | 1.06 (0.86,1.31) | 377 | 1.00 (0.88,1.13) | |
| Newly detected diabetes | 137,675 | 268 | 1.02 (0.90,1.16) | 12 | 1.01 (0.56,1.83) | 105 | 1.05 (0.86,1.28) | 78 | 1.03 (0.82,1.30) | 12 | 0.57 (0.32,1.02) | 67 | 1.07 (0.831.38) | |
| Diabetes < 5 y | 150,114 | 389 | 1.04 (0.94,1.160) | 20 | 1.30 (0.81,2.09) | 145 | 1.02 (0.86,1.22) | 114 | 1.12 (0.92,1.37) | 31 | 1.10 (0.76,1.61) | 99 | 0.99 (0.80,1.23) | |
| Diabetes ≥ 5 y | 114,271 | 352 | 1.07 (0.96,1.20) | 15 | 1.17 (0.68,2.01) | 142 | 1.15 (0.96,1.37) | 97 | 1.13 (0.91,1.40) | 21 | 0.88 (0.56,1.39) | 88 | 0.94 (0.75,1.18) | |
| p for interaction | 0.862 | 0.834 | 0.302 | 0.673 | 0.045 | 0.973 | ||||||||
Publisher’s Note: MDPI stays neutral with regard to jurisdictional claims in published maps and institutional affiliations. |
© 2021 by the authors. Licensee MDPI, Basel, Switzerland. This article is an open access article distributed under the terms and conditions of the Creative Commons Attribution (CC BY) license (https://creativecommons.org/licenses/by/4.0/).
Share and Cite
Kang, J.; Jin, S.-M.; Kim, S.J.; Kim, D.; Han, K.; Jeong, S.-M.; Chang, J.; Rhee, S.Y.; Choi, T.; Shin, D.W. Obesity-Independent Association between Glycemic Status and the Risk of Hematologic Malignancy: A Nationwide Population-Based Longitudinal Cohort Study. Cancers 2021, 13, 4760. https://doi.org/10.3390/cancers13194760
Kang J, Jin S-M, Kim SJ, Kim D, Han K, Jeong S-M, Chang J, Rhee SY, Choi T, Shin DW. Obesity-Independent Association between Glycemic Status and the Risk of Hematologic Malignancy: A Nationwide Population-Based Longitudinal Cohort Study. Cancers. 2021; 13(19):4760. https://doi.org/10.3390/cancers13194760
Chicago/Turabian StyleKang, Jihun, Sang-Man Jin, Seok Jin Kim, Dahye Kim, Kyungdo Han, Su-Min Jeong, JiWon Chang, Sang Youl Rhee, Taewoong Choi, and Dong Wook Shin. 2021. "Obesity-Independent Association between Glycemic Status and the Risk of Hematologic Malignancy: A Nationwide Population-Based Longitudinal Cohort Study" Cancers 13, no. 19: 4760. https://doi.org/10.3390/cancers13194760