Article

ID1 and ID4 Are Biomarkers of Tumor Aggressiveness and Poor Outcome in Immunophenotypes of Breast Cancer

by
Marta Garcia-Escolano
1,*,
Yoel G. Montoyo-Pujol
1,
Fernando Ortiz-Martinez
1,
Jose J. Ponce
2,
Silvia Delgado-Garcia
3,
Tina A. Martin
3,
Hortensia Ballester
3,
F. Ignacio Aranda
4,
Elena Castellon-Molla
4,
J. Miguel Sempere-Ortells
5 and
Gloria Peiro
1,4
1
Research Department, University General Hospital of Alicante, and Alicante Institute for Health and Biomedical Research (ISABIAL), Pintor Baeza 12, 03010 Alicante, Spain
2
Medical Oncology Department, University General Hospital of Alicante, and Alicante Institute for Health and Biomedical Research (ISABIAL), Pintor Baeza 12, 03010 Alicante, Spain
3
Gynecology and Obstetrics Department, University General Hospital of Alicante, and Alicante Institute for Health and Biomedical Research (ISABIAL), Pintor Baeza 12, 03010 Alicante, Spain
4
Pathology Department, University General Hospital of Alicante, and Alicante Institute for Health and Biomedical Research (ISABIAL), Pintor Baeza 12, 03010 Alicante, Spain
5
Biotechnology Department, Immunology Division, University of Alicante, Ctra San Vicente s/n. 03080-San Vicente del Raspeig, 03010 Alicante, Spain
*
Author to whom correspondence should be addressed.
Cancers 2021, 13(3), 492; https://doi.org/10.3390/cancers13030492
Submission received: 29 December 2020 / Revised: 23 January 2021 / Accepted: 24 January 2021 / Published: 27 January 2021

Abstract

:

Simple Summary

Inhibitor of differentiation (ID) proteins are essential to promote proliferation during embryonic development, but they are silenced in most adult tissues. Evidence to date shows ID1 expression in many tumor types, including breast cancer. However, the role of the remaining ID family members, especially ID4, in breast cancer remains unclear. In this work, we aimed to assess the four ID genes expression in breast cancer cell lines and a long series of breast cancer samples and correlate them with clinicopathological features and patients’ survival. We observed a significantly higher expression of ID4 in tumor cell lines than the healthy breast epithelium cell line. We confirmed that the overexpression of ID1 and ID4 correlated with more aggressive phenotypes and poor survival in breast cancer patients’ samples. Our results support the importance of ID proteins as targets for the development of anti-cancer drugs.

Abstract

Inhibitor of differentiation (ID) proteins are a family of transcription factors that contribute to maintaining proliferation during embryogenesis as they avoid cell differentiation. Afterward, their expression is mainly silenced, but their reactivation and contribution to tumor development have been suggested. In breast cancer (BC), the overexpression of ID1 has been previously described. However, whether the remaining ID genes have a specific role in this neoplasia is still unclear. We studied the mRNA expression of all ID genes by q RT-PCR in BC cell lines and 307 breast carcinomas, including all BC subtypes. Our results showed that ID genes are highly expressed in all cell lines tested. However, ID4 presented higher expression in BC cell lines compared to a healthy breast epithelium cell line. In accordance, ID1 and ID4 were predominantly overexpressed in Triple-Negative and HER2-enriched samples. Moreover, high levels of both genes were associated with larger tumor size, histological grade 3, necrosis and vascular invasion, and poorer patients’ outcomes. In conclusion, ID1 and ID4 may act as biomarkers of tumor aggressiveness and worse prognosis in breast cancer, and they could be used as potential targets for new treatments discover.

Graphical Abstract

1. Introduction

Breast cancer (BC) is the most common cancer diagnosed among women and is still the leading cause of cancer-related death in this gender worldwide [1]. In the last decades, we have witnessed the appearance of new diagnosis methods that have increased the diagnosis of early stages of BC [2]. This fact, added to the implementation of novel therapies [3], has improved BC patients’ prognosis. Indeed, the current 5-year survival rate is 91.1% [4]. Despite these advances, about 30% of BC patients relapse [5]. Additionally, the 5-year survival rate decreases dramatically to 27% for patients diagnosed with advanced stages of the disease [6], and there are still no specific treatments for the triple-negative breast cancer (TNBC) subtype [7]. These data bring to light the need for finding new targets for the efficient treatment of the most aggressive breast tumors.
The inhibitor of differentiation (ID) proteins are a family of four (ID1-4) helix-loop-helix (HLH) transcription factors that lack the DNA binding domain. They act by recruiting other transcription regulators forming homo- or hetero-dimers that fail to bind the E-sequences of DNA. As a result, the transcription of E-box dependent genes is inhibited [8]. IDs sequence and structure are very conserved among family members and species, especially the HLH domain, indicating that they exert an important function [9,10]. In fact, ID proteins play a crucial role during development, where they regulate cell fate by impairing senescence [11]. Despite this, the ID expression patterns usually overlap, and it is known that they are differentially regulated, which suggests different functions for each of them. In adulthood, their expression is mainly restricted to some populations of stem cells [12,13,14] or tissues that proliferate as an injury response [15].
The activation and participation of the ID family, especially ID1, in tumor development have been widely studied in several tumor types. For instance, the expression of ID1 has generally been associated with malignant behavior and poorer prognosis in the stomach, colon, prostate, ovary, bladder, pancreas, and brain tumors, among others (reviewed in [16]). In contrast, in other cancer types such as hepatic or thyroid tumors, the role of ID1 is not so evident [17,18,19,20]. In BC, most of the studies carried out included a short clinical series or experimental cell models. Data reported have associated ID1 with hormone receptors (HR) negative status, aggressive phenotypes, and shorter survival [21,22,23,24]. Nevertheless, some authors have obtained different results [25].
In contrast to ID1, little data are available about the contribution of the other ID proteins to tumor malignancy. Previous investigators have demonstrated an association of ID2 expression with tumor development, aggressiveness, and chemotherapy resistance [26,27,28]. However, in BC, there is also evidence supporting the opposite role [29]. Similarly, recent studies postulate that ID3 expression may contribute to chemo-resistance [30,31], while others claim that it may reverse multi-drug resistance and increase chemosensitivity [32,33].
It is interesting to highlight the controversy surrounding ID4. It is the longest protein of this family [34], and it shows expression patterns that differ from the other three family members [10,35]. In fact, ID4 has been proposed as a regulatory factor of the expression of the remaining ID proteins [36]. Increased expression of ID4 has been observed in some tumor types such as hepatocellular carcinoma [37], glioblastoma [38], or melanoma [39], indicating a possible role in tumor development. On the contrary, other authors have reported that loss of ID4 by hypermethylation increases tumor progression and metastasis [40,41], supporting the theory of ID4 being a tumor suppressor gene. In BC, the interest in ID4 has generally been focused on another direction. It is known that, in the breast, there is a negative regulation loop between ID4 and BRCA1 [42], and most of the studies published to date investigate the dysregulation of this loop during BC development [43].
Here, we aimed to assess the contribution of ID genes in BC malignancy and clarify the dual role of ID4 in this neoplasia. To that end, we analyzed the expression of the four ID genes in BC cell lines and a large clinical series of BC patients, previously stratified by immunophenotypes. mRNA expression results were correlated with clinicopathological parameters and patients’ outcome. We found that ID4 presented high mRNA expression in BC cell lines. Moreover, in the analyzed clinical series, its overexpression, together with ID1, was associated with aggressive clinic-pathological factors and poor survival.

2. Results

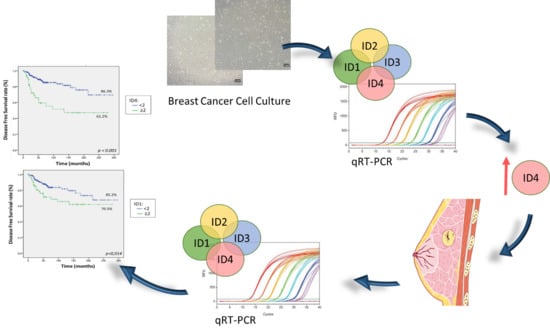
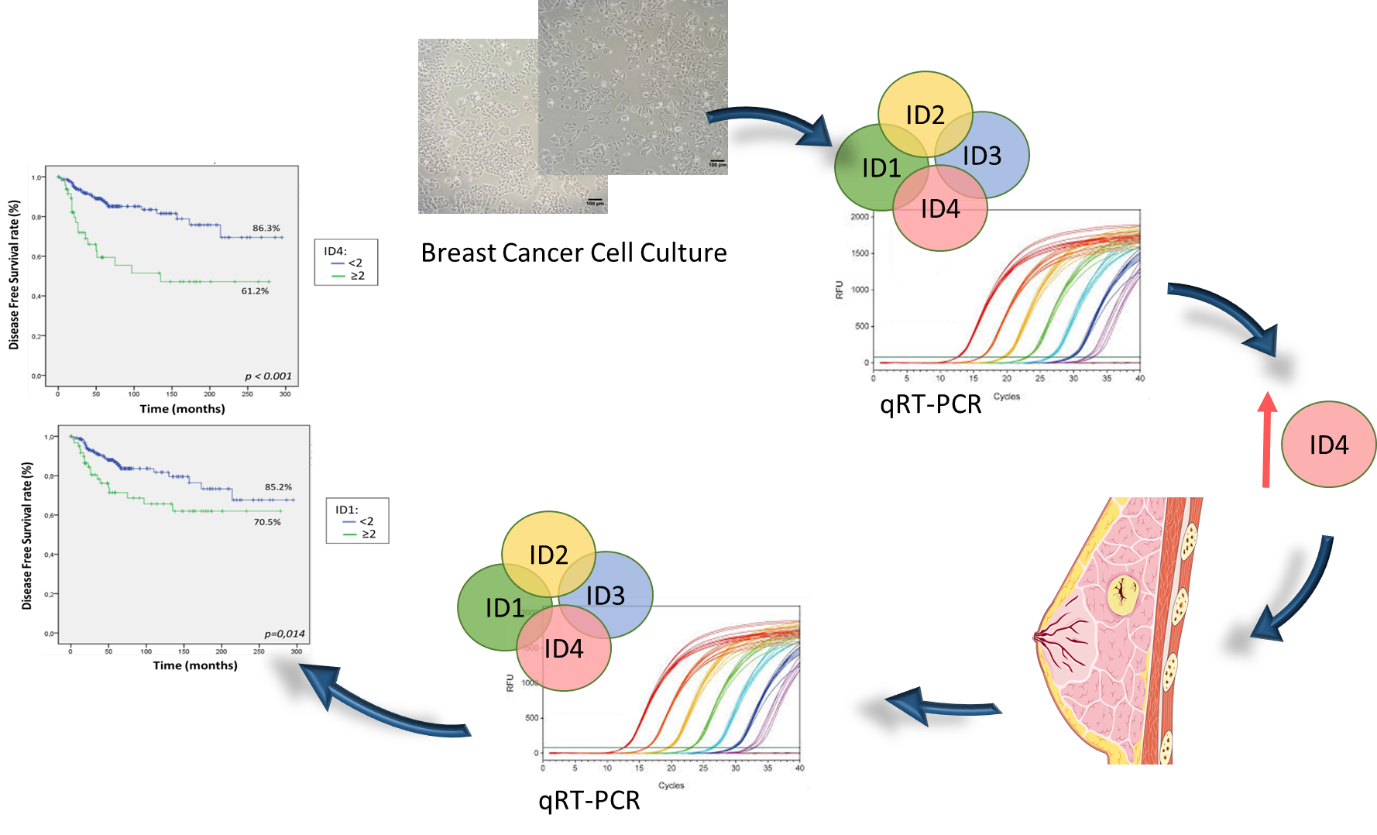
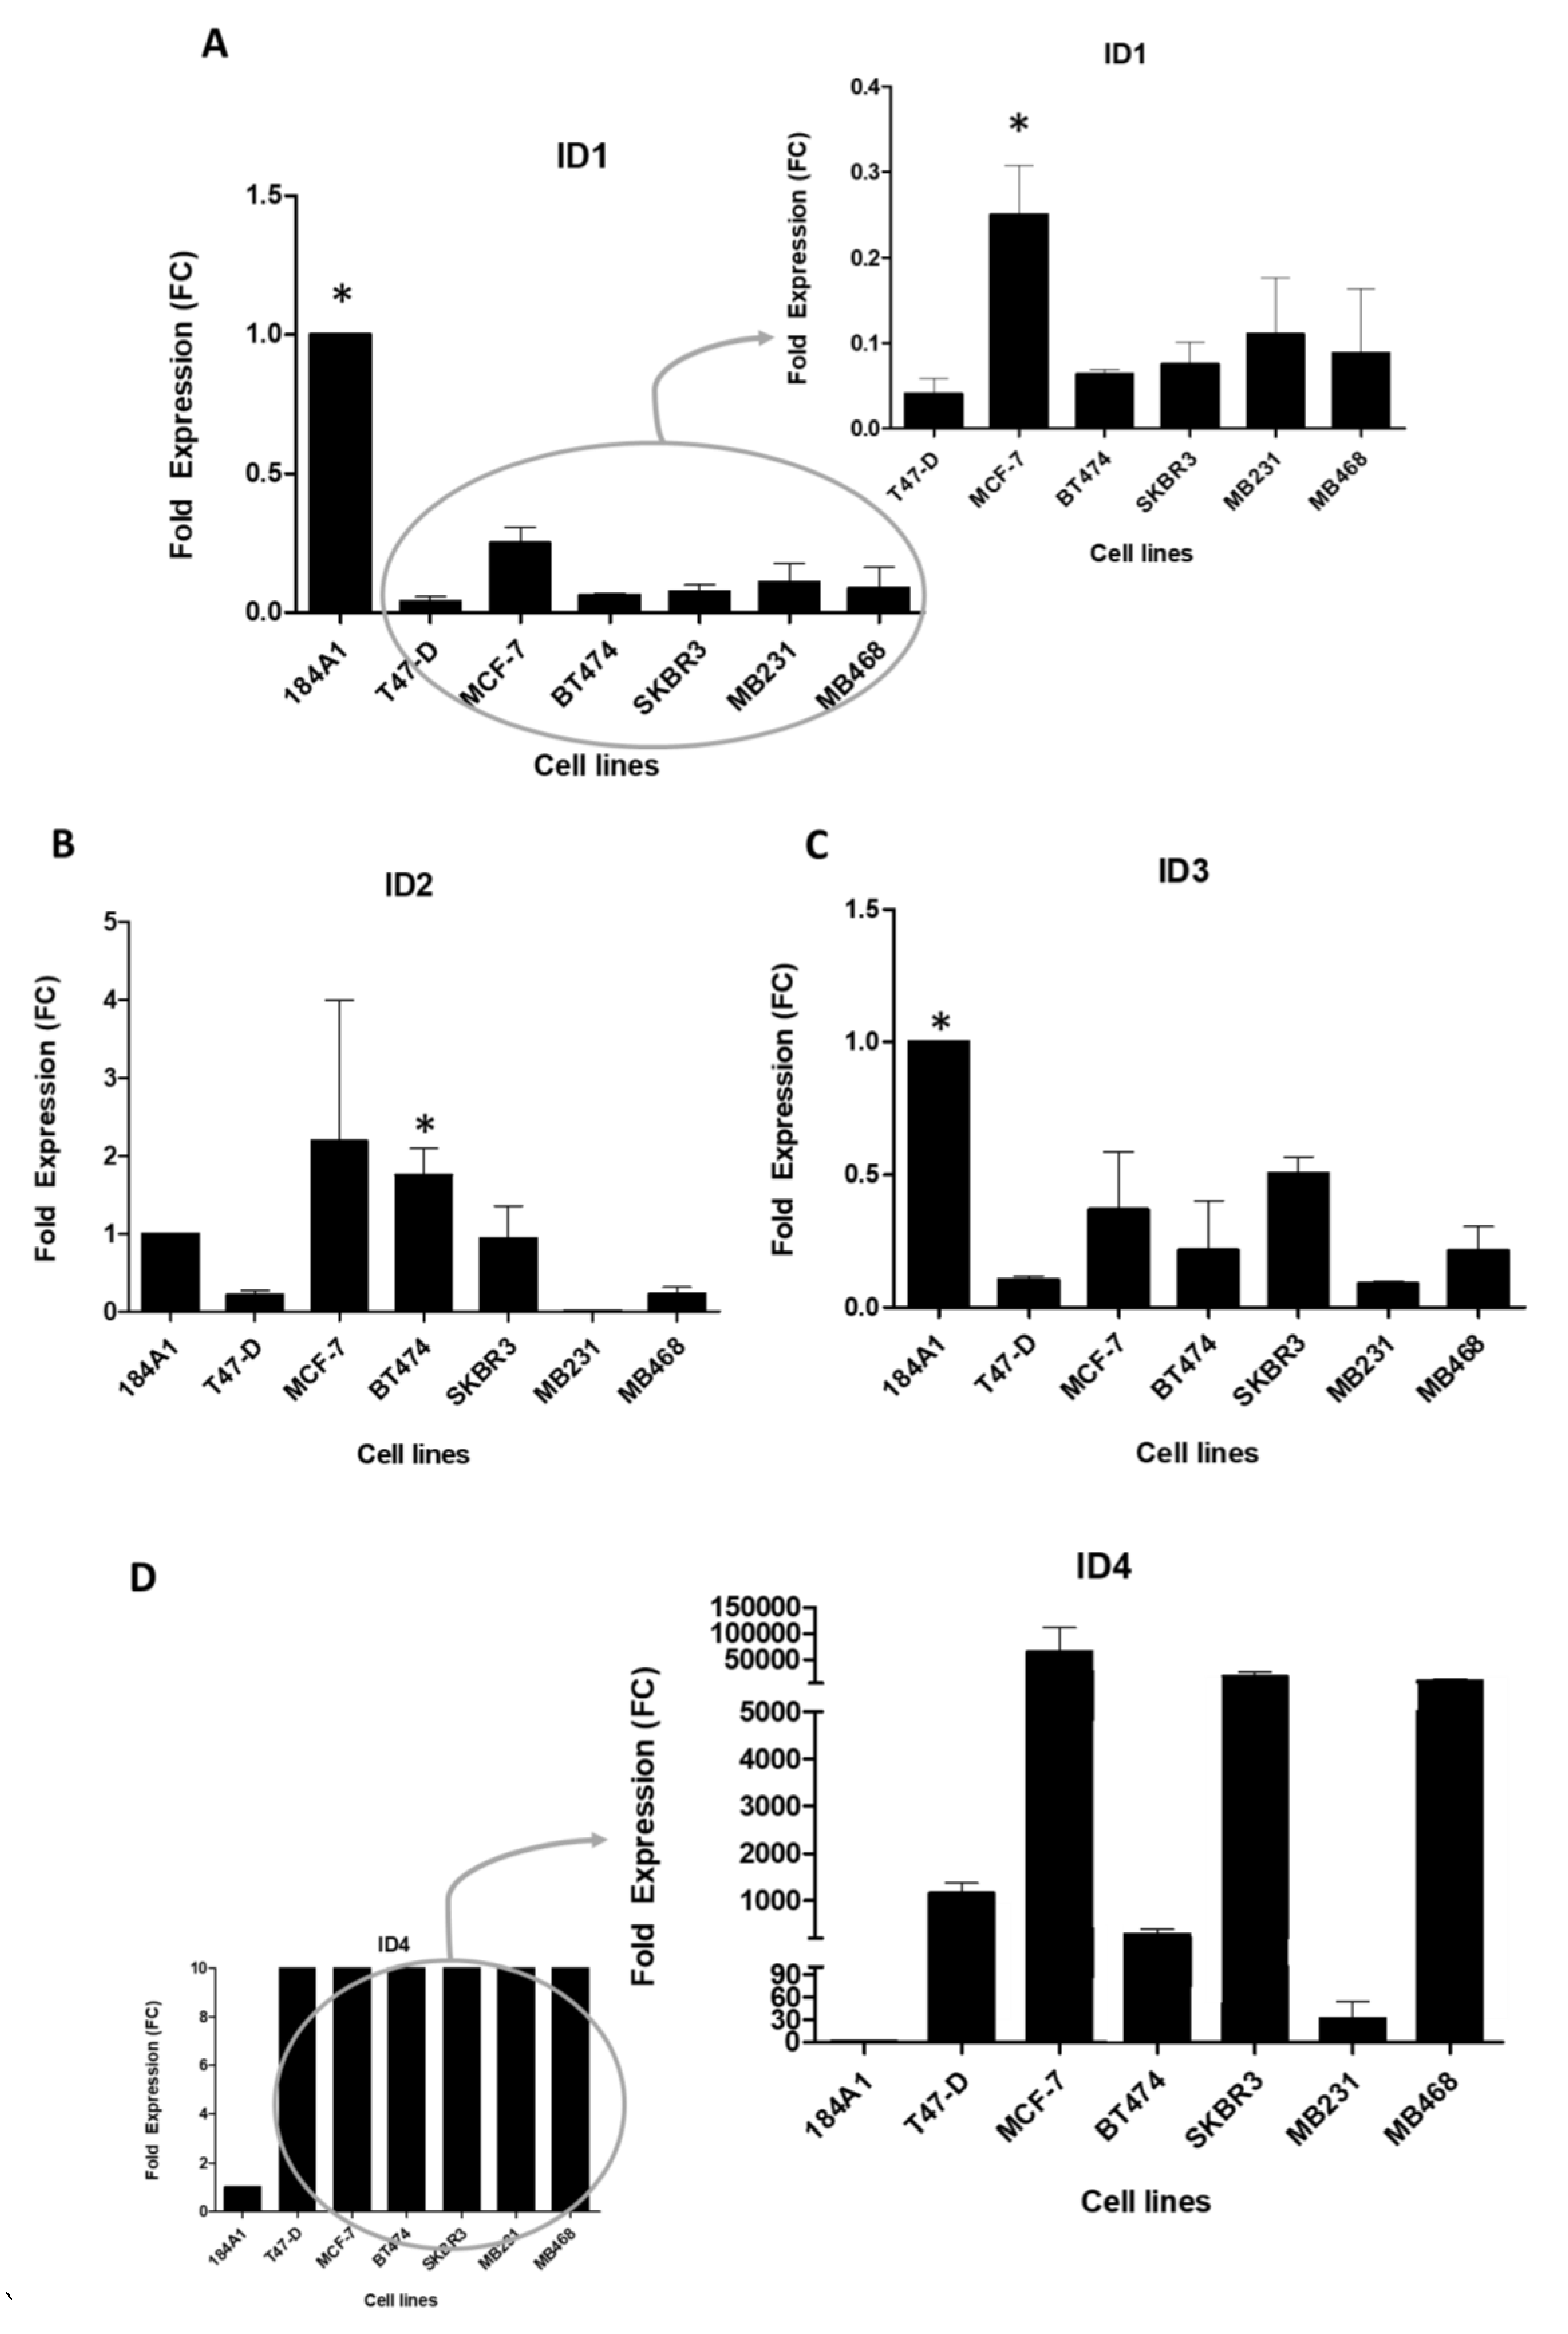
2.1. ID Genes Expression in BC Cell Lines

We detected high mRNA expression of the four ID genes in all cell lines, including the non-tumor cell line 184A1, which indeed showed significantly higher expression of ID1 and ID3 than all the tumor cell lines (all p ≤ 0.03). When we excluded 184A1 from the analysis, MCF-7 showed the highest levels of ID1 compared with the other cell lines (all p ≤ 0.03). In contrast, ID3 levels did not differ significantly among tumor cell lines. All cell lines showed a similar expression of ID2, except MDA-MB-231, which showed no expression. Regarding ID4, all tumor cell lines showed increased expression compared with 184A1 (all p ≤ 0.06), meaning that this gene could have a specific role in BC pathogenesis. Among the tumor cell lines, MCF-7 presented the highest levels of ID4 expression (Figure 1).

2.2. Patients’ and Tumor Characteristics

In our clinical series of 307 non-consecutive patients with breast carcinoma, the mean age at diagnosis was 55.3 years (range 23–88). Tumors were predominantly larger than 20 mm (54.9%), with histological grade 3 (59.9%), absence of necrosis (65.1%) or vascular invasion (63.3%), and negative lymph nodes (61.2%). We classified samples into five molecular subtypes according to a validated IHC surrogate profile panel [44] as follows: 19.9% luminal A-like, 19.2% luminal B/HER2-negative, 15.6% luminal B/HER2-positive, 13.4% HER2-enriched, and 31.9% TNBC. All patients had a follow-up (FU) at least 12 months, being the median FU 62 months (P25 = 40 months; P75 =113 months). The median OS was 62 months (range 2–295 months), whereas the median period to local recurrence or distant metastasis was 45 months (range 2–214 months).

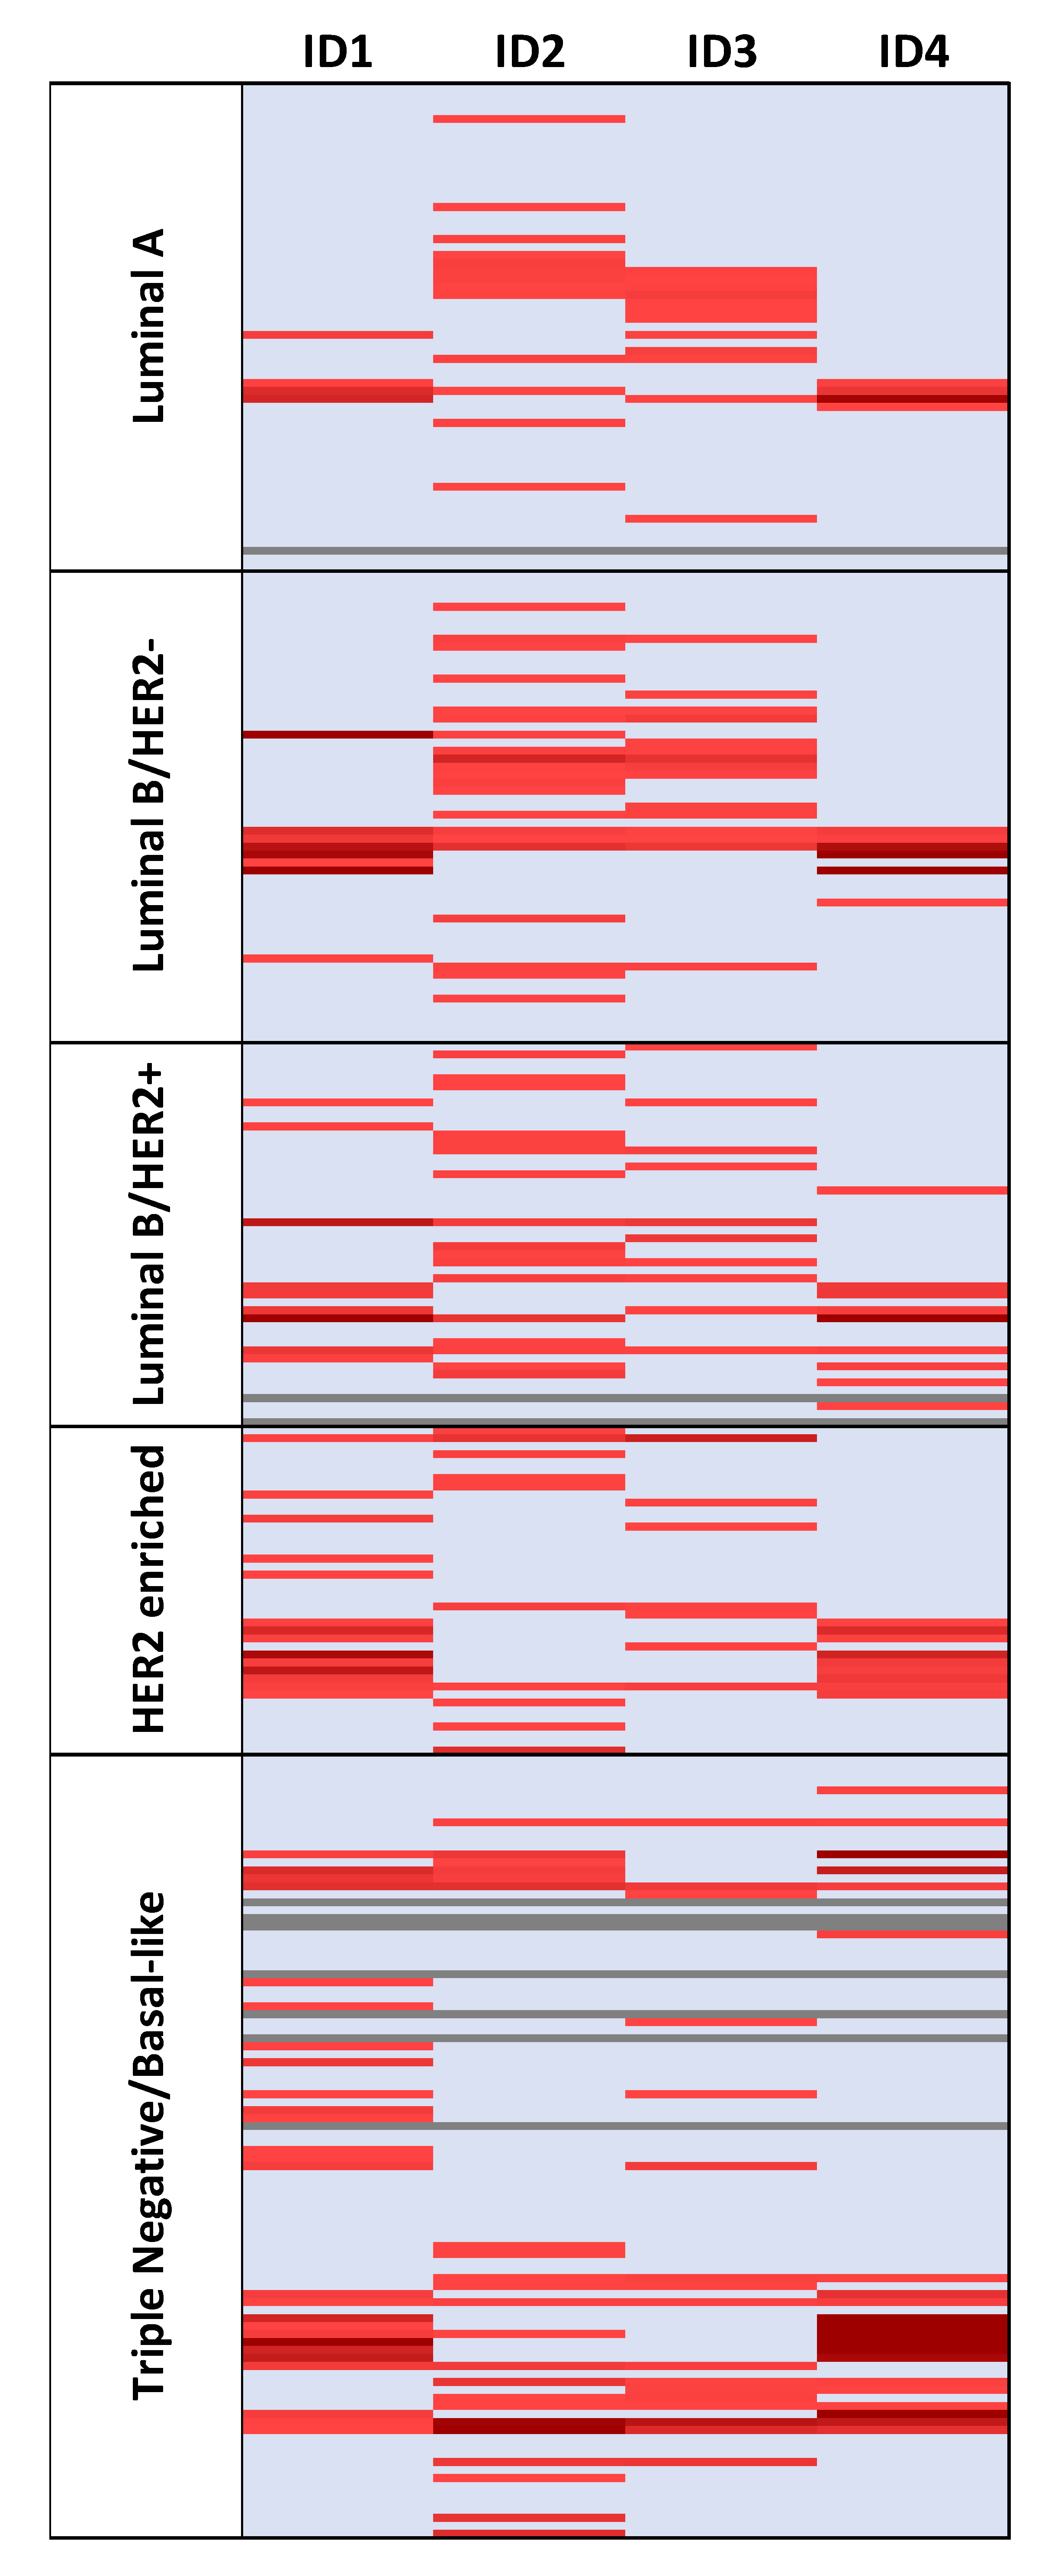
2.3. ID Genes Are Overexpressed in Most Analyzed Tumor Samples

As for the study exclusion criteria, we did not analyze ID genes’ expression in 10 samples. The remaining 297 samples were classified according to the expression of ID genes into two groups: overexpression (FC ≥ 2) and normal-low expression (FC < 2). Based on this, ID1 was overexpressed in 61 samples (20.5%), ID2 in 83 (27.9%), ID3 in 61 (20.5%), and ID4 in 49 (16.5%). When considering the ID family together, 50.5% of the studied tumors presented overexpression of at least one ID gene (Figure 2). Regarding these samples, 52.0% had only one ID gene overexpressed, whereas overexpression of the four ID genes simultaneously was found in 6.0% of them.

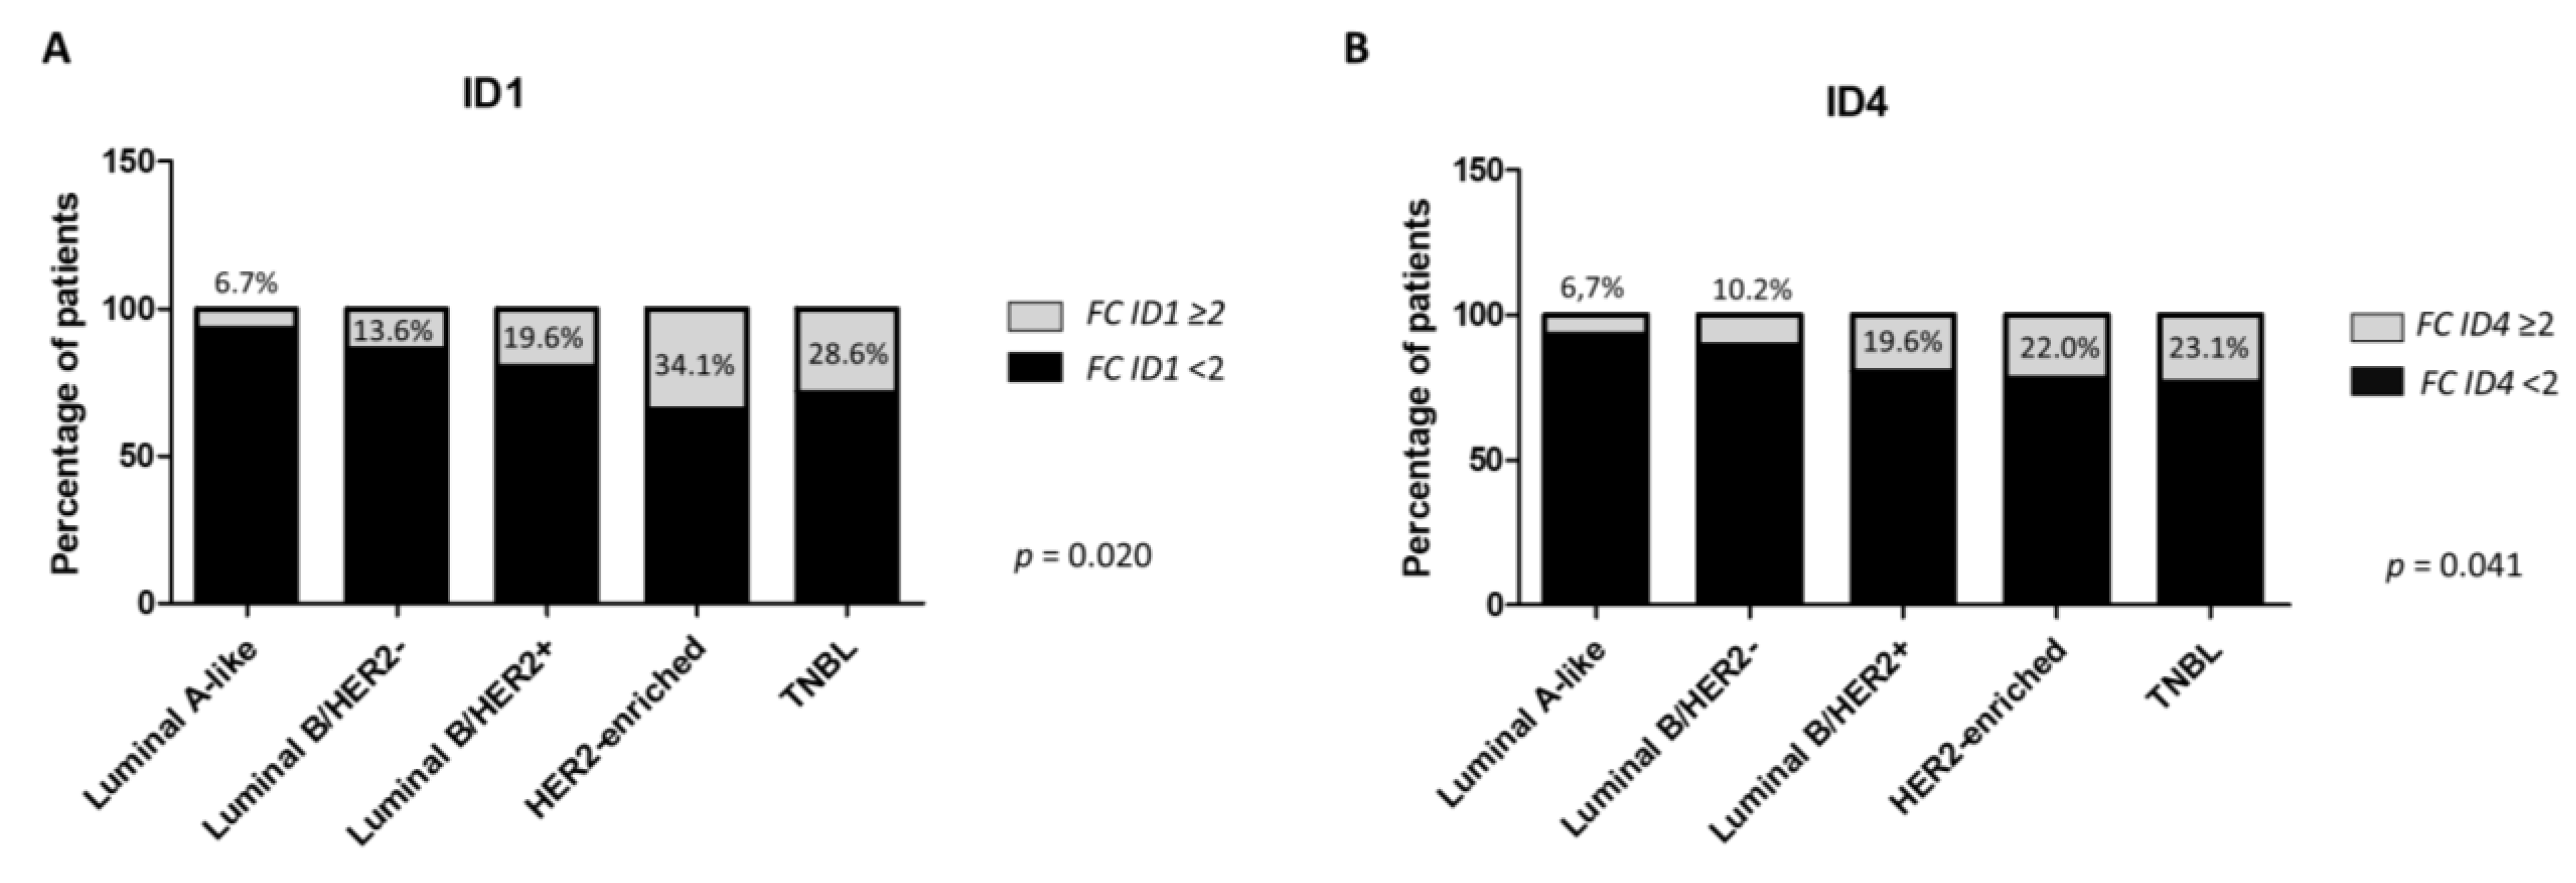
2.4. ID1 and ID4 Overexpression Is Associated with Aggressive Clinicopathological Features

We found ID1 and ID4 overexpression in tumors larger than 20 mm (68.3%, p = 0.012; and 67.3%, p = 0.036, respectively), with histological grade 3 (78.7%, p = 0.029; and 79.6%, p = 0.042, respectively), and necrosis (50.0% p = 0.003; and 52.1% p = 0.004, respectively). Additionally, the overexpression of ID4 was associated with the presence of vascular invasion (51.0%, p = 0.015) but as a trend for ID1 overexpression (45.9%, p = 0.055). Despite most of the samples with high expression of ID4 were from patients older than 50 (73.5%), this association was marginally significant (p = 0.071). All data shown in Table 1.
A trend towards significance was observed between ID2 overexpression and necrosis (72.3%, p = 0.091). No significant associations were found for ID3 (Table S1).
Regarding the intrinsic BC subtypes, ID1 and ID4 were predominantly overexpressed in the aggressive subtypes TNBC and HER2-enriched (p = 0.020 and p = 0.041, respectively) (Figure 3). In contrast, ID2 and ID3 overexpression were more frequently found in luminal B subtypes, although differences among phenotypes were not significant (p > 0.05) (Figure S1).

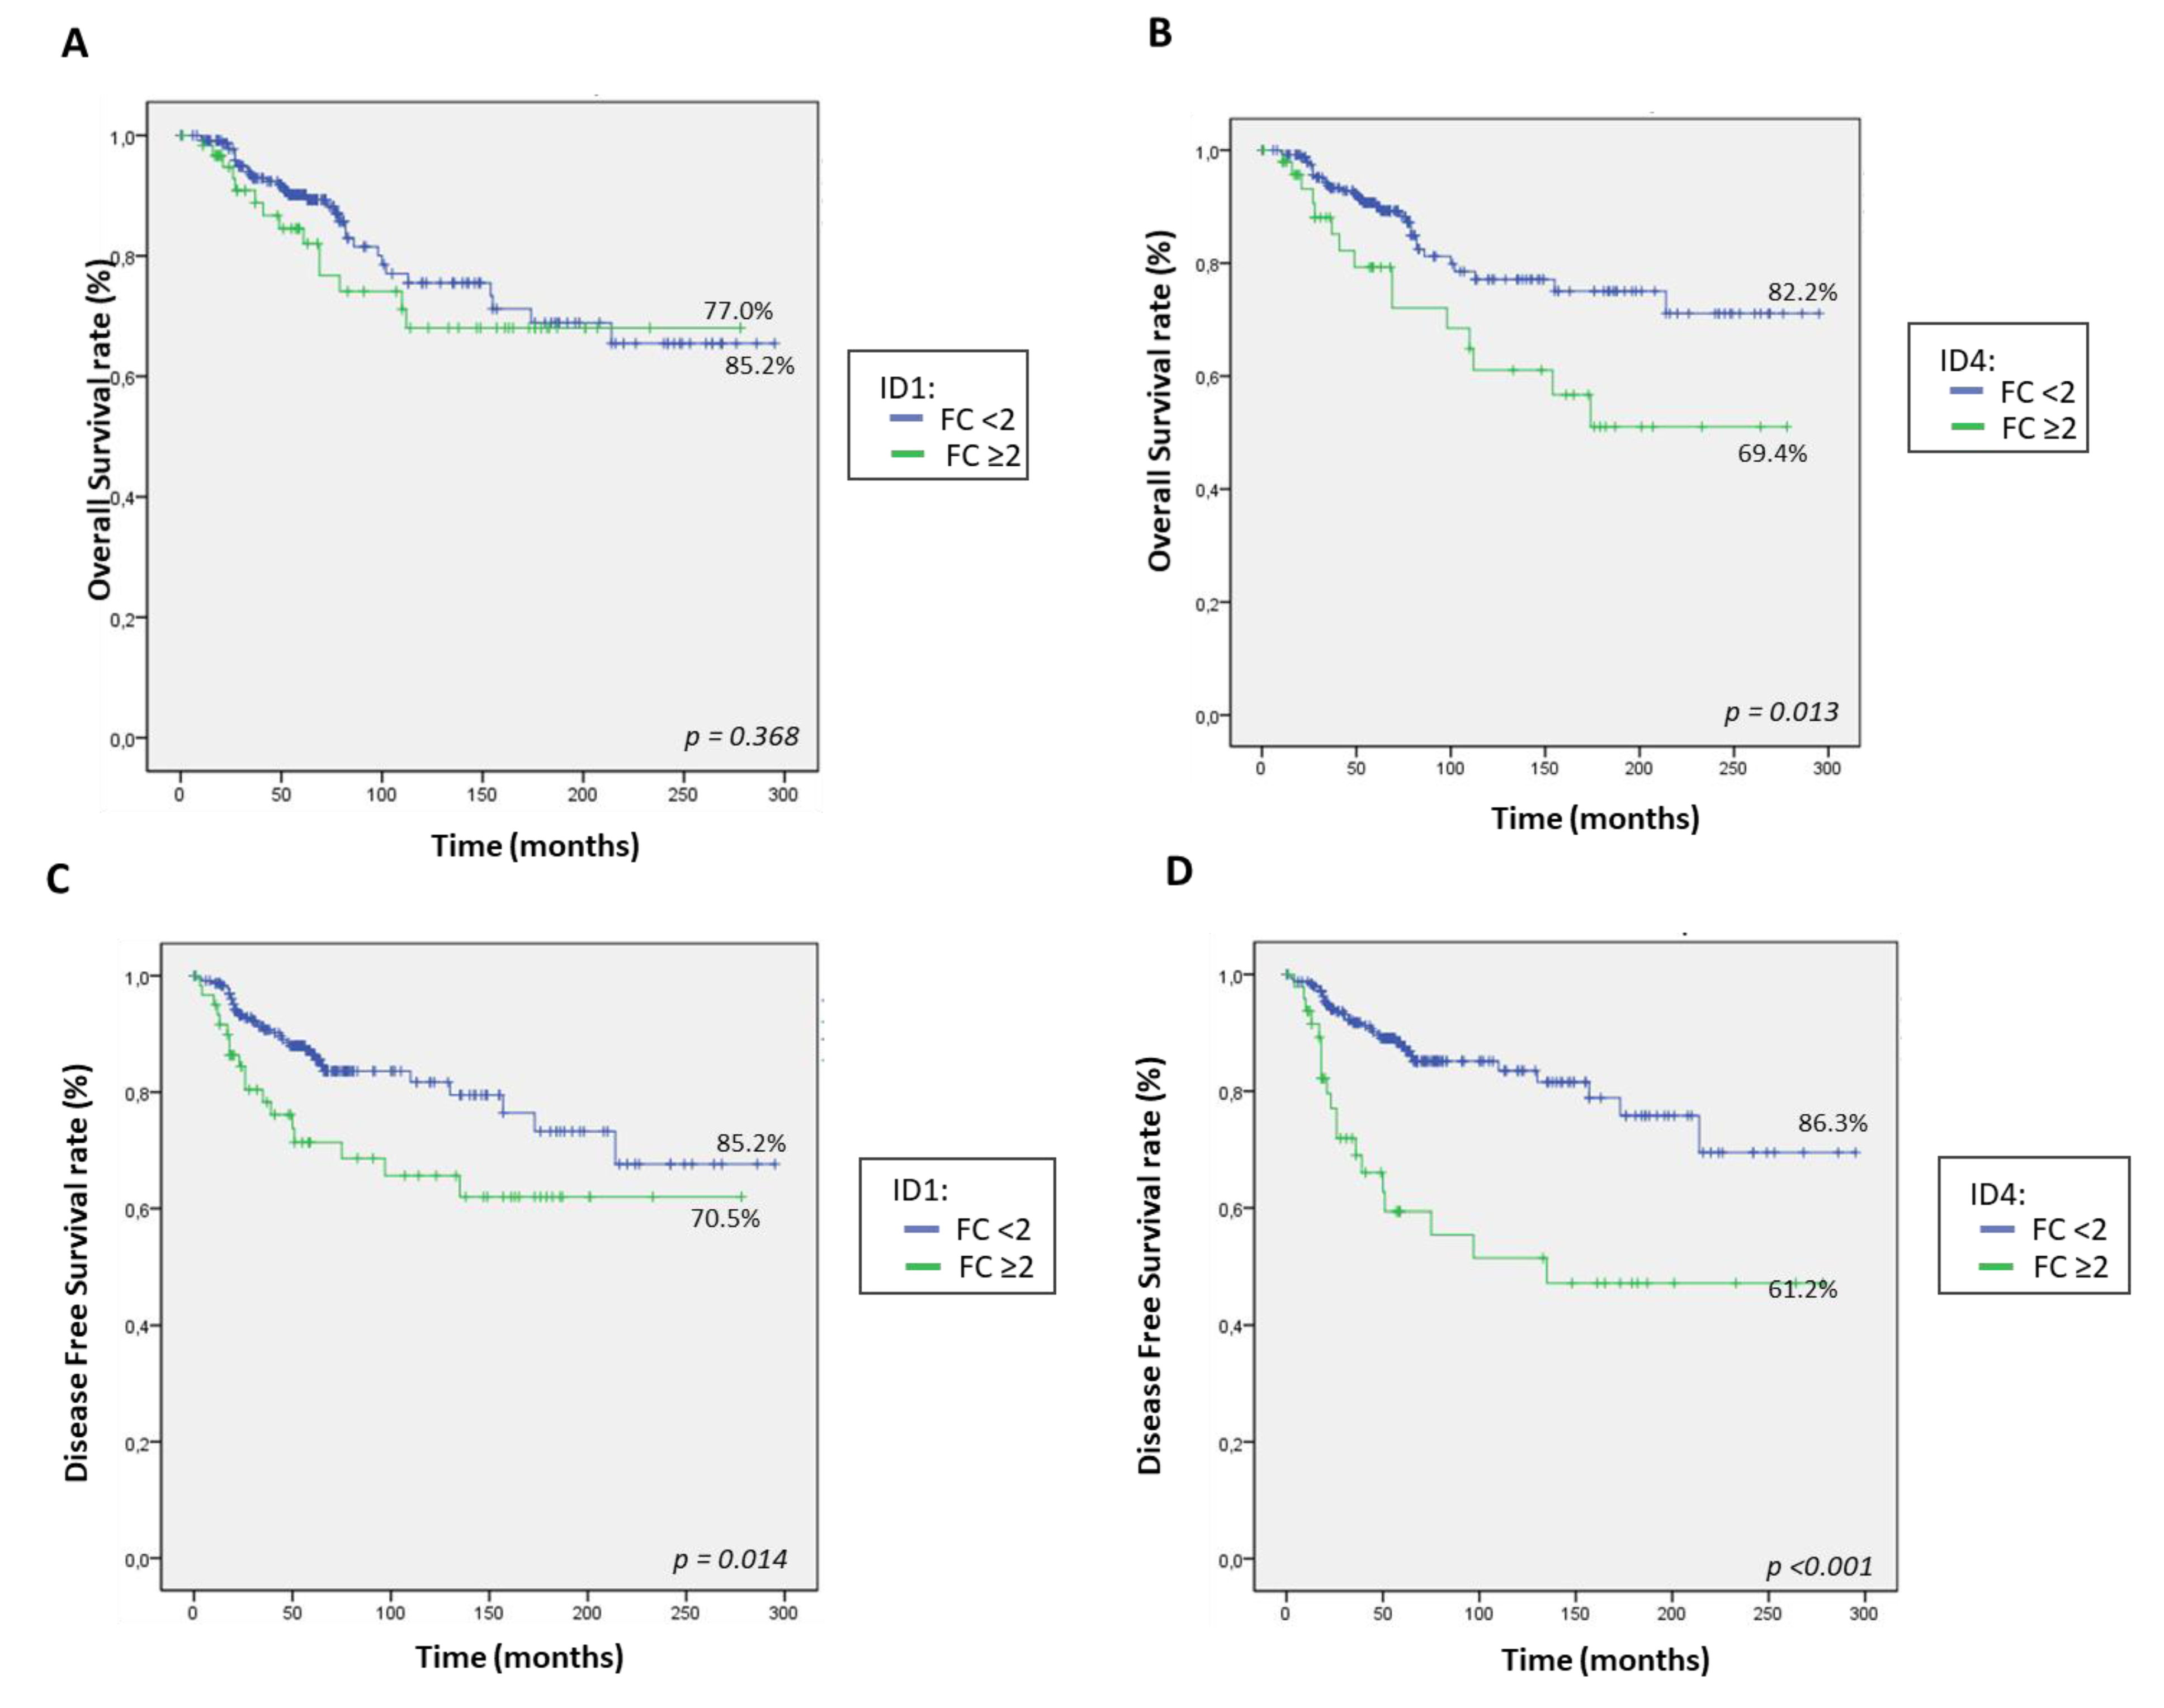
2.5. Patients Expressing High Levels of ID1 and ID4 Present Shorter OS and DFS

Univariate analyses (Table 2) revealed that patients with larger tumor size (HR: 2.8; 95% CI = 1.5, 5.2; p = 0.002), histological grade 3 (HR: 8.1; 95% CI = 1.1, 58.8; p = 0.040), necrosis (HR: 1.8; 95% CI = 1.0, 3.2; p = 0.042), vascular invasion (HR: 2.6; 95% CI = 1.4, 4.6; p = 0.001), positive lymph-nodes (HR: 2.6; 95% CI = 1.4, 4.6; p = 0.001), absence of hormone receptors (HR: 1.8; 95% CI = 1.0, 3.3; p = 0.039) and ID4 overexpression (HR: 2.1; 95% CI = 1.2, 3.9; p = 0.016) had shorter OS.
Similarly, DFS was significantly affected by larger tumor size (HR: 1.8; 95% CI = 1.0, 3.2; p = 0.034), presence of necrosis (HR: 1.8; 95% CI = 1.0, 3.1; p = 0.004), vascular invasion (HR: 2.5; 95% CI = 1.4, 4.2; p = 0.001), ID1 (HR: 2.0; 95% CI = 1.1, 3.6; p = 0.016), and ID4 overexpression (HR: 3.4; 95% CI = 1.9, 6.0; p <0.001). A trend was also observed for HR negative status (HR: 1.6; 95% CI = 0.9, 2.8; p = 0.080) (Table 2).
We performed Kaplan–Meier curves for OS and DFS (Figure 4) and observed that patients whose tumors had high levels of ID1 (FC ≥ 2) showed shorter OS (77.0% vs. 85.2%) and DFS (70.5% vs. 85.2%) rates. However, these differences were only significant for DFS (p = 0.014). Likewise, tumors with ID4 overexpression presented significantly decreased rates of OS (69.4% vs. 82.2%; p = 0.013) and DFS (61.2% vs. 86.3%; p < 0.001). Neither ID2 nor ID3 overexpression showed significant associations with OS or DFS).
Patients were further stratified according to BC intrinsic immunophenotypes, and Kaplan–Meier curves for OS and DFS were carried out (Tables S2 and S3, and Figure S2). Results showed that patients with HER2-enriched tumors had the poorest OS rates (65.9%, p = 0.027) and DFS rates (58.5%, p < 0.001). Focusing specifically on this subgroup of patients, those whose tumors expressed high levels (FC ≥ 2) of ID1 or ID4 presented markedly shorter OS and DFS rates (all p < 0.05) (Figure S3). On the contrary, neither ID2 nor ID3 overexpression was associated with a worse prognosis in this subgroup of BC patients.

2.6. ID4 Is an Independent Marker of Poor Prognosis in Breast Cancer

All variables that significantly affected OS and DFS were included in Cox’s proportional hazard multivariate analysis (Table 2). Results showed that none of the chosen factors independently affected OS (all p > 0.05), although a trend towards significance was observed for ID4 overexpression (p = 0.176). In contrast, the presence of vascular invasion (p = 0.031), necrosis (p = 0.050), and ID4 overexpression (p = 0.001) were independent prognostic factors for DFS.

2.7. Comparison with Available Databases

We compared our results with those available in the public database Kaplan Meier Plotter [45]. Two different cohorts of BC patients were used for these analyses: DFS (n = 3951) and OS (n = 1402). In agreement with our series, the expression of ID2 and ID3 did not impact either in DFS or in OS, whereas higher expression of ID1 and ID4 was associated with poorer DFS (all p < 0.05). Nevertheless, contrary to our data, ID4 did not significantly correlate with OS for these patients (Figure 4).

3. Discussion

In the current study, we analyzed the presence of the four ID genes in BC and found that ID4 mRNA expression was higher in BC cell lines than the healthy epithelium control cells. The expression of the remaining ID genes was also detected in all cell lines studied, although the expression in BC lines was not significantly higher than in the control model. In the light of these results, we took the investigation to the next step and studied the expression of the ID family in 307 non-consecutive samples of human BC stratified by immunophenotypes. As far as we know, our work represents the largest series where the mRNA expression of the four ID genes has been simultaneously studied to date.
Our data showed that at least one of these genes was overexpressed in most analyzed tumor samples compared to healthy breast tissue, supporting their reactivation during breast carcinogenesis. More concretely, in our series, overexpression of ID1 and ID4 was related to HR-negative immunophenotypes, in contrast to ID2 and ID3, which were more frequently overexpressed in luminal subtypes. This suggests that each gene could contribute to the etiopathogenesis of a specific subtype of BC. We further demonstrated that mRNA overexpression of ID1 and ID4 was linked to aggressive clinicopathological factors and poorer survival rates. Besides, ID4 showed an independent prognostic value for recurrence. Our results regarding ID1 are supported by previous studies demonstrating its expression in HR-negative BC phenotypes [22,46] and implied more aggressive features and poorer outcomes [22,23,24,46].
According to our knowledge, the contribution of ID4 in BC aggressiveness is still unclear. As stated before, in the last decades, the role of ID4 as a tumor suppressor gene has been proposed based on evidence showing an increase in tumor progression and the risk of metastasis following the loss of ID4 by hypermethylation [40,41]. Nevertheless, opposite data claiming an increased expression of ID4 in various tumor types have also been reported [37,38,39]. Along with this work, we have presented compelling evidence that supports a pro-oncogenic role of this gene in BC progression. Our in vitro data demonstrates that the expression of ID4 is higher in tumor cell lines than in healthy breast epithelium.
Moreover, our study in a large series of BC patients establishes an association between ID4 overexpression and aggressive clinic-pathological features and BC subtypes. Additionally, ID4 showed an independent prognostic value for recurrence. Comparably, other authors have studied ID4 expression at the protein level in BC specimens and found correlations with high tumor grade, absence of HR, increased vascularization and recurrence, and shorter OS [47,48,49,50,51,52]. The expression of ID4 has also been linked to a stem-like phenotype in the aggressive basal-like BC subtype [53]. In agreement, our work demonstrated that these associations are also found at the mRNA level. These data together support the involvement of ID4 in the pathogenesis of BC beyond the dysregulation of BRCA1 expression. A very recent work carried out on a short series of basal-like BC samples and cell lines showed that the interaction between ID4 and DNA damage repair proteins could contribute to the DNA damage repair deficiencies and the aggressiveness of this BC subtype [54]. These data support the high association between ID4 overexpression and the most aggressive BC phenotypes in our series.
Unfortunately, the current work did not contribute to elucidating the role of ID2 and ID3 in BC. Previous reports aimed at studying both genes in BC, and their conclusions were divergent [24,26,29]. Considering the above data and our results, it seems that these two genes have a secondary role in BC progression. Nevertheless, further research could be carried out to elucidate these discrepancies.
Interestingly, other authors have found opposite conclusions about ID1 and ID4 mRNA expression in BC. Zhou and colleagues recently evaluated the prognostic relevance of the ID family by using a set of public databases and reported that higher mRNA levels of ID1 and ID4 were associated with lower histological grades, less lymph-node metastasis, and longer survival rates [25]. As our results differ from those presented by Zhou et al. [25], we carried out a prognosis analysis with the data available at the database Kaplan–Meier Plotter. In agreement with our results, Kaplan–Meier Plotter data showed that high mRNA levels of ID1 and ID4 correlated with shorter DFS rates. In contrast, the overexpression of ID2 or ID3 showed no association with survival.
The discordances found between ID1 expression in cell lines and patient samples could be explained considering the nature of this gene. It is known that ID1 acts as a driver of cell proliferation, and all the cell lines in our in vitro study are highly proliferative. Consequently, all studied cell lines, including the non-tumor cell line 184A1, presented high rates of ID1 expression. This fact has previously been reported [55] and suggests that interactions between tumor and stromal cells may regulate IDs expression [56], which is an interesting field for further research, especially in the different subtypes of BC. Other in vitro studies have demonstrated that induced expression of ID1 transformed non-aggressive BC cell lines into more aggressive cells [21,26]. That is in agreement with our data since the less aggressive luminal cell lines, T47-D, showed reduced levels of ID1 compared to the invasive TNBC MDA-MB-231 and MDA-MB-468.
In conclusion, our results support that ID1 and ID4 have a role as pro-oncogenes in BC and are associated with tumor aggressiveness in BC subtypes. In addition, they seem relevant molecular prognostic markers in this neoplasia. Our findings of ID4 are especially interesting, considering the increasing controversy about the role of this gene in BC. Therefore, both genes seem potential targets for developing novel drugs for BC treatment, specifically in more aggressive phenotypes such as TNBC and HER2-enriched. Of note, this strategy is now more realistic considering that Wojnarowicz and colleagues have recently developed a molecule that successfully targets and disrupts ID proteins in vitro and in vivo [57]. Nevertheless, our results, which have potential therapeutic implications, warrant further investigation.

4. Materials and Methods

4.1. Cell Culture

Six human BC cell lines: MCF-7 and T47-D (luminal A-like), BT474 (luminal B/HER2-negative), SKBR3 (HER2-enriched), MDA-MB-231, and MDA-MD-468 (TNBC), and the normal breast epithelium cell line (184A1) were purchased from ATCC (Manassas, VA, USA). All tumor cell lines were maintained in 75 cm2 flask (SPL Life Science, Gyeonggi, Korea) fed with Dulbecco Modified Eagle Medium/Ham F12 (1:1) with L-glutamine and 15 mM HEPES media (Biowest, Nauaillé, France) supplemented with 10% Fetal Bovine Serum (Biowest, Nauaillé, France), 50 U/mL penicillin and 50 mg/mL streptomycin (Biowest, Nauaillé, France). The cell line 184A1 was maintained in Mammary Epithelial Cell Growth Medium (MEGM BullekitTM Lonza, Basel, Switzerland) supplemented with growth factors (MEGMTM SingleQuotsTM Supplements, Lonza, Basel, Switzerland), and 1% penicillin and streptomycin (Biowest, Nauaillé, France). Cells were incubated in humidified incubators at 37 °C and 5% CO2.
Once a year, or when cells were thawed out, a mycoplasma test was carried out following the instructions of the Venor®GeM One Step kit (Minerva BioLabs, Berlin, Germany). Cells were maintained in culture for a few weeks, enough time for a couple of passages, and needed experiments.

4.2. Patients

Our retrospective study included 307 non-consecutive samples from patients with primary BC diagnosed and treated at the University General Hospital of Alicante (Spain) between 1993 and 2016. Tumor specimens were obtained from the Biobank collections of the same institution. Inclusion criteria were: diagnosis of resectable infiltrative primary breast carcinoma of at least 10 mm in size, stage I-III, complete pathological report, and those patients who had not been lost to follow-up in at least 12 months. Patients with tumors in stage IV, with preoperative chemo-/radiotherapy or low quality/quantity of RNA, were excluded from the study. The Local Ethics Committee approval was obtained for this project (ethic code PI2014/39), informed consent from all individual participants were collected, and patients’ data were anonymized. This study was conducted following the Declaration of Helsinki and has been written following the REMARK criteria [58].
The studied variables were age, tumor size, histological grade (Scarff–Bloom–Richardson classification modified by Elston and Ellis), vascular invasion, necrosis, nodal status, and immunophenotype. Survival data were obtained from clinical reports. Overall survival (OS) was defined as the period between surgery and patient’s death, and disease-free survival (DFS) as the time between surgery and recurrence.
Patients were treated either with breast-conserving surgery or mastectomy. Post-lumpectomy radiotherapy was given at a total dose of 50 Gy after surgery, and those patients with HR-positive tumors were additionally treated with tamoxifen/aromatase inhibitors for 2–5 years. High-risk patients (young age, high histological grade, HR-negative tumors, or positive lymph nodes) received systemic chemotherapy after surgery, with 6 cycles of cyclophosphamide, methotrexate, 5-fluorouracil, or four cycles of doxorubicin plus cyclophosphamide. In our institution, trastuzumab (HerceptinTM) was approved to be added to chemotherapy protocols in HER2-positive BC patients after 2005.

4.3. Immunohistochemistry (IHC) and FISH

Tissue microarrays (TMAs), including two cores of 1 mm from each formalin-fixed paraffin-embedded (FFPE) tumor, were made (Beecher Instruments) and stained with immunohistochemical standard techniques at conditions detailed in Supplementary Materials (Table S4). Two independent pathologists analyzed the results. Positive scores for staining were set as follows: HR (ER and PR) >1% (nuclei), Bcl2 > 50% (cytoplasm), p53 > 20% (nuclei), Ki67 ≥ 14% (nuclei), any degree of CK5/6 (cytoplasmic) or EGFR (membrane) [59] and HER2 according to the 2018 scoring guidelines (>10%, 3+cells). HER2 equivocal cases (2+ and <10% 3+) were confirmed by FISH (HER2 IQFISH pharmaDxTM; Agilent Technologies/Dako; Carpinteria, CA, USA) [60,61]. According to the St Gallen recommendation, intrinsic subtypes were classified based on the IHC results [62].

4.4. RNA Isolation and cDNA Synthesis

Two punches (1 mm thick/≥4 mm deep) of FFPE tissue from preselected areas were used for RNA isolation. Samples were first deparaffinized by grinding them into small pieces and incubating them with mineral oil (Sigma-Aldrich, Steinheim, Germany) at high temperature (95 °C). RNA isolation was carried out in the robotic workstation QIAcube (QIAGEN, Hilden, Germany) following the instructions of the RNeasy FFPE Kit (QIAGEN, Hilden, Germany) for tissue samples and RNeasy Minikit (QIAGEN, Hilden, Germany) for cell culture samples. A step of incubation with DNase (QIAGEN, Hilden, Germany) was included to eliminate any genomic DNA contamination. The final RNA concentration and purity were measured with a NanoDrop spectrophotometer (Thermo Scientific, Waltham MA, USA). For the reverse transcription reaction, 1.5 µg of RNA was used as a template in a total volume of 20 µL according to recommendations of the High-Capacity cDNA Reverse Transcription Kit (Thermo Fischer Scientific, Waltham MA, USA).

4.5. Quantitative Real-Time PCR (qRT-PCR)

The qRT-PCR was carried out in a Real-Time PCR System 7500-FAST (Applied Biosystems, Foster City, CA, USA) using the TaqMan® Fast Universal PCR Master Mix and TaqMan® Gene Expression Assays (Life Technologies, CA, USA) containing specific exon-junction probes: PUM1 (Hs00472881_m1), β-ACTIN (Hs01060665_g1), ID1 (Hs03676575_s1), ID2 (Hs04187239_m1), ID3 (Hs00171409_m1) and ID4 (Hs02912975_g1). Since ID1 contains only one exon, we performed control reactions to ensure that the selected assay does not amplify genomic DNA. The qRT-PCR reaction took place in a total volume of 10 µl according to the manufacturers’ instructions. PUM1 and β-ACTIN were used as reference genes. All reactions were done in duplicates, and no-template controls were included in each plate. Relative changes in mRNA expression were calculated as the fold change (FC) by the 2-ΔΔCt method using as reference sample a pool of breast epithelium tissues from 10 healthy patients who underwent a breast reduction in the case of tissue samples, or the cell line 184A1 for BC cell lines. Tumor samples showing double expression than the control (FC ≥ 2) were considered overexpressed. Results were analyzed with the 7500 Software v2.06 (Applied Biosystems, Foster City, CA, USA).

4.6. Statistical Analyses

The Kolmogorov–Smirnov test was used to identify whether variables were normally distributed. Parametric variables were defined by the average ± standard deviation, non-parametric variables were by the median and 25–75th percentiles or mean and range (min-max), and qualitative variables were defined by the frequency percentage of each subgroup. The Chi-square test was used to measure associations between qualitative variables. Log-rank tests were used for the comparison of Kaplan–Meier survival curves. Univariate and multivariate survival analyses were performed using the Cox proportional hazard model. All molecular and clinicopathological variables having a P-value < 0.05 in the univariate analyses were considered for the multivariate analyses. For the purpose of the study, samples were classified according to the expression FC as normal-low expression (FC < 2) versus overexpression (FC ≥ 2).
In cell culture experiments, expression was defined as the average and standard deviation among replicates. Differences in expression among cell lines were compared with the Student’s T-test. p-values < 0.05 were regarded as statistically significant, whereas those between 0.05–0.10 were considered marginally significant. All statistical analyses were conducted using SPSS version 22.0 (SPSS Inc, Chicago, IL, USA).

5. Conclusions

ID4, which is the ID family member that differs the most in terms of sequence and function, is highly expressed in breast cancer cell lines than breast healthy tissue cell line. In breast cancer biopsies, ID4 and ID1 are overexpressed in a subset of samples that predominantly presented more aggressive phenotypes and shorter overall and disease-free survival. These results have been previously suggested for ID1, but there was not enough evidence showing a pro-oncogenic role of ID4 in breast cancer.

Supplementary Materials

The following are available online at https://www.mdpi.com/2072-6694/13/3/492/s1, Figure S1: Percentage of samples overexpressing ID2 and ID3 in each BC immunophenotype, Figure S2: Kaplan-Meier plot for OS and DFS rates (%) for all patients classified according to breast cancer immunophenotypes, Figure S3: Kaplan-Meier plot for OS and DFS rates (%) for patients with HER2-enriched tumors classified according to ID1 or ID4 mRNA expression. Table S1: Correlation between ID2 and ID3 mRNA expression and clinic-pathological variables, Table S2: Correlations between BC immunophenotypes and OS, Table S3: Correlations between BC immunophenotypes and DFS, Table S4: Antibodies and conditions for immunohistochemistry.

Author Contributions

Conceptualization, M.G.-E., and G.P.; methodology, M.G.-E., Y.G.M.-P., F.O.-M., J.J.P., S.D.-G., T.A.M., H.B., F.I.A., E.C.-M., J.M.S.-O., and G.P.; validation, M.G.-E., Y.G.M.-P., and F.O.-M.; formal analysis, M.G.-E., and F.O.-M.; investigation, M.G.-E., Y.G.M.-P., and G.P.; resources, J.J.P., S.D.-G., T.A.M., H.B., E.C.-M., F.I.A., and G.P.; data curation, M.G.-E., F.O.-M., and G.P.; writing—original draft preparation, M.G.-E.; writing—review and editing, M.G.-E. and G.P.; visualization, M.G.-E. and G.P.; supervision, G.P.; project administration, G.P.; funding acquisition, J.M.S.-O., F.I.A., and G.P. All authors have read and agreed to the published version of the manuscript.

Funding

This research was funded by the Alicante Institute for Health and Biomedical Research (ISABIAL) (UGP 16-149 and UGP 180184) and Navarro-Tripodi Foundation (BOLA00150). M.G.E. was supported by fellowships issued by the Valencian Government of Spain (GVA) and the European Social Fund (ACIF/2016/004).

Institutional Review Board Statement

The study was conducted according to the guidelines of the Declaration of Helsinki, and approved by the Institutional Ethics Committee of University General Hospital of Alicante (protocol code PI2014/39, approved on 24 September 2014).

Informed Consent Statement

Informed consent was obtained from all subjects involved in the study by the Biobank of the University General Hospital of Alicante.

Data Availability Statement

The data presented in this study are available on request from the corresponding author.

Conflicts of Interest

The authors declare no conflict of interest. The funders had no role in the study’s design; in the collection, analyses, or interpretation of data; in the writing of the manuscript, or in the decision to publish the results.

References

  1. Ferlay, J.; Colombet, M.; Soerjomataram, I.; Mathers, C.; Parkin, D.M.; Pineros, M.; Znaor, A.; Bray, F. Estimating the global cancer incidence and mortality in 2018: GLOBOCAN sources and methods. Int. J. Cancer 2019, 144, 1941–1953. [Google Scholar] [CrossRef] [PubMed] [Green Version]
  2. Niell, B.L.; Freer, P.E.; Weinfurtner, R.J.; Arleo, E.K.; Drukteinis, J.S. Screening for Breast Cancer. Radiol. Clin. N. Am. 2017, 55, 1145–1162. [Google Scholar] [CrossRef] [PubMed]
  3. Coates, A.S.; Winer, E.P.; Goldhirsch, A.; Gelber, R.D.; Gnant, M.; Piccart-Gebhart, M.; Thurlimann, B.; Senn, H.J.; Panel, M. Tailoring therapies--improving the management of early breast cancer: St Gallen International Expert Consensus on the Primary Therapy of Early Breast Cancer 2015. Ann. Oncol. 2015, 26, 1533–1546. [Google Scholar] [CrossRef] [PubMed]
  4. SEER Cancer Statistics Review, 1975–2015. Available online: https://seer.cancer.gov/csr/1975_2015/ (accessed on 4 April 2019).
  5. Matsumoto, A.; Jinno, H.; Ando, T.; Fujii, T.; Nakamura, T.; Saito, J.; Takahashi, M.; Hayashida, T.; Kitagawa, Y. Biological markers of invasive breast cancer. Jpn. J. Clin. Oncol. 2016, 46, 99–105. [Google Scholar]
  6. American Cancer Society. Available online: https://www.cancer.org/cancer/breast-cancer/understanding-a-breast-cancer-diagnosis/breast-cancer-survival-rates.html (accessed on 5 April 2019).
  7. Stovgaard, E.S.; Nielsen, D.; Hogdall, E.; Balslev, E. Triple negative breast cancer - prognostic role of immune-related factors: A systematic review. Acta Oncol. 2018, 57, 74–82. [Google Scholar] [CrossRef] [PubMed]
  8. Benezra, R.; Davis, R.L.; Lockshon, D.; Turner, D.L.; Weintraub, H. The protein Id: A negative regulator of helix-loop-helix DNA binding proteins. Cell 1990, 61, 49–59. [Google Scholar] [CrossRef]
  9. Ling, F.; Kang, B.; Sun, X.H. Id proteins: Small molecules, mighty regulators. Curr. Top. Dev. Biol. 2014, 110, 189–216. [Google Scholar]
  10. Riechmann, V.; van Cruchten, I.; Sablitzky, F. The expression pattern of Id4, a novel dominant negative helix-loop-helix protein, is distinct from Id1, Id2 and Id3. Nucleic Acids Res. 1994, 22, 749–755. [Google Scholar] [CrossRef]
  11. Roschger, C.; Cabrele, C. The Id-protein family in developmental and cancer-associated pathways. Cell Commun. Signal. 2017, 15, 7. [Google Scholar] [CrossRef] [Green Version]
  12. Zhang, N.; Yantiss, R.K.; Nam, H.S.; Chin, Y.; Zhou, X.K.; Scherl, E.J.; Bosworth, B.P.; Subbaramaiah, K.; Dannenberg, A.J.; Benezra, R. ID1 is a functional marker for intestinal stem and progenitor cells required for normal response to injury. Stem Cell Rep. 2014, 3, 716–724. [Google Scholar] [CrossRef] [Green Version]
  13. Colacino, J.A.; Azizi, E.; Brooks, M.D.; Harouaka, R.; Fouladdel, S.; McDermott, S.P.; Lee, M.; Hill, D.; Madden, J.; Boerner, J.; et al. Heterogeneity of Human Breast Stem and Progenitor Cells as Revealed by Transcriptional Profiling. Stem Cell Rep. 2018, 10, 1596–1609. [Google Scholar] [CrossRef] [Green Version]
  14. Nam, H.S.; Benezra, R. High levels of Id1 expression define B1 type adult neural stem cells. Cell Stem Cell. 2009, 5, 515–526. [Google Scholar] [CrossRef] [PubMed] [Green Version]
  15. Schaefer, B.M.; Koch, J.; Wirzbach, A.; Kramer, M.D. Expression of the helix-loop-helix protein ID1 in keratinocytes is upregulated by loss of cell-matrix contact. Exp. Cell Res. 2001, 266, 250–259. [Google Scholar] [CrossRef] [PubMed]
  16. Lasorella, A.; Benezra, R.; Iavarone, A. The ID proteins: Master regulators of cancer stem cells and tumour aggressiveness. Nat. Rev. Cancer 2014, 14, 77–91. [Google Scholar] [CrossRef] [PubMed]
  17. Amaral, L.H.P.; Bufalo, N.E.; Peres, K.C.; Barreto, I.S.; Campos, A.; Ward, L.S. ID Proteins May Reduce Aggressiveness of Thyroid Tumors. Endocr Pathol. 2019, 30, 24–30. [Google Scholar] [CrossRef] [PubMed]
  18. Damdinsuren, B.; Nagano, H.; Kondo, M.; Yamamoto, H.; Hiraoka, N.; Yamamoto, T.; Marubashi, S.; Miyamoto, A.; Umeshita, K.; Dono, K.; et al. Expression of Id proteins in human hepatocellular carcinoma: Relevance to tumor dedifferentiation. Int. J. Oncol. 2005, 26, 319–327. [Google Scholar] [CrossRef] [PubMed]
  19. Ding, R.; Han, S.; Lu, Y.; Guo, C.; Xie, H.; Zhang, N.; Song, Z.; Cai, L.; Liu, J.; Dou, K. Overexpressed Id-1 is associated with patient prognosis and HBx expression in hepatitis B virus-related hepatocellular carcinoma. Cancer Biol. Ther. 2010, 10, 299–307. [Google Scholar] [CrossRef] [Green Version]
  20. Ciarrocchi, A.; Piana, S.; Valcavi, R.; Gardini, G.; Casali, B. Inhibitor of DNA binding-1 induces mesenchymal features and promotes invasiveness in thyroid tumour cells. Eur. J. Cancer 2011, 47, 934–945. [Google Scholar] [CrossRef]
  21. Lin, C.Q.; Singh, J.; Murata, K.; Itahana, Y.; Parrinello, S.; Liang, S.H.; Gillett, C.E.; Campisi, J.; Desprez, P.Y. A role for Id-1 in the aggressive phenotype and steroid hormone response of human breast cancer cells. Cancer Res. 2000, 60, 1332–1340. [Google Scholar]
  22. Perk, J.; Gil-Bazo, I.; Chin, Y.; de Candia, P.; Chen, J.J.; Zhao, Y.; Chao, S.; Cheong, W.; Ke, Y.; Al-Ahmadie, H.; et al. Reassessment of id1 protein expression in human mammary, prostate, and bladder cancers using a monospecific rabbit monoclonal anti-id1 antibody. Cancer Res. 2006, 66, 10870–10877. [Google Scholar] [CrossRef] [Green Version]
  23. Schoppmann, S.F.; Schindl, M.; Bayer, G.; Aumayr, K.; Dienes, J.; Horvat, R.; Rudas, M.; Gnant, M.; Jakesz, R.; Birner, P. Overexpression of Id-1 is associated with poor clinical outcome in node negative breast cancer. Int. J. Cancer 2003, 104, 677–682. [Google Scholar] [CrossRef] [PubMed]
  24. Wazir, U.; Jiang, W.G.; Sharma, A.K.; Newbold, R.F.; Mokbel, K. The mRNA expression of inhibitors of DNA binding-1 and -2 is associated with advanced tumour stage and adverse clinical outcome in human breast cancer. Anticancer Res. 2013, 33, 2179–2183. [Google Scholar] [PubMed]
  25. Zhou, X.L.; Zeng, D.E.; Ye, Y.H.; Sun, S.M.; Lu, X.F.; Liang, W.Q.; Chen, C.F.; Lin, H.Y. Prognostic values of the inhibitor of DNAbinding family members in breast cancer. Oncol. Rep. 2018, 40, 1897–1906. [Google Scholar]
  26. Li, K.; Yao, L.; Chen, L.; Cao, Z.G.; Yu, S.J.; Kuang, X.Y.; Hu, X.; Shao, Z.M. ID2 predicts poor prognosis in breast cancer, especially in triple-negative breast cancer, and inhibits E-cadherin expression. Onco. Targets Ther. 2014, 7, 1083–1094. [Google Scholar] [PubMed] [Green Version]
  27. Zhou, J.D.; Ma, J.C.; Zhang, T.J.; Li, X.X.; Zhang, W.; Wu, D.H.; Wen, X.M.; Xu, Z.J.; Lin, J.; Qian, J. High bone marrow ID2 expression predicts poor chemotherapy response and prognosis in acute myeloid leukemia. Oncotarget 2017, 8, 91979–91989. [Google Scholar] [CrossRef] [PubMed]
  28. Wieczorek, A.; Balwierz, W. The Role of Id2 Protein in Neuroblatoma in Children. Pathol. Oncol. Res. 2015, 21, 999–1004. [Google Scholar] [CrossRef] [PubMed] [Green Version]
  29. Stighall, M.; Manetopoulos, C.; Axelson, H.; Landberg, G. High ID2 protein expression correlates with a favourable prognosis in patients with primary breast cancer and reduces cellular invasiveness of breast cancer cells. Int. J. Cancer 2005, 115, 403–411. [Google Scholar] [CrossRef]
  30. Huang, L.; Cai, J.; Guo, H.; Gu, J.; Tong, Y.; Qiu, B.; Wang, C.; Li, M.; Xia, L.; Zhang, J.; et al. ID3 Promotes Stem Cell Features and Predicts Chemotherapeutic Response of Intrahepatic Cholangiocarcinoma. Hepatology 2019, 69, 1995–2012. [Google Scholar] [CrossRef]
  31. Sachindra, L.L.; Novak, D.; Wu, H.; Huser, L.; Granados, K.; Orouji, E.; Utikal, J. New role of ID3 in melanoma adaptive drug-resistance. Oncotarget 2017, 8, 110166–110175. [Google Scholar] [CrossRef] [Green Version]
  32. Chen, Y.S.; Aubee, J.; DiVito, K.A.; Zhou, H.; Zhang, W.; Chou, F.P.; Simbulan-Rosenthal, C.M.; Rosenthal, D.S. Id3 induces an Elk-1-caspase-8-dependent apoptotic pathway in squamous carcinoma cells. Cancer Med. 2015, 4, 914–924. [Google Scholar] [CrossRef]
  33. Chen, F.F.; Lv, X.; Zhao, Q.F.; Xu, Y.Z.; Song, S.S.; Yu, W.; Li, X.J. Inhibitor of DNA binding 3 reverses cisplatin resistance in human lung adenocarcinoma cells by regulating the PI3K/Akt pathway. Oncol. Lett. 2018, 16, 1634–1640. [Google Scholar] [CrossRef] [PubMed] [Green Version]
  34. Patel, D.; Morton, D.J.; Carey, J.; Havrda, M.C.; Chaudhary, J. Inhibitor of differentiation 4 (ID4): From development to cancer. Biochim. Biophys. Acta 2015, 1855, 92–103. [Google Scholar] [CrossRef] [PubMed] [Green Version]
  35. Jen, Y.; Manova, K.; Benezra, R. Expression patterns of Id1, Id2, and Id3 are highly related but distinct from that of Id4 during mouse embryogenesis. Dev. Dyn. 1996, 207, 235–252. [Google Scholar] [CrossRef]
  36. Sharma, P.; Chinaranagari, S.; Chaudhary, J. Inhibitor of differentiation 4 (ID4) acts as an inhibitor of ID-1, -2 and -3 and promotes basic helix loop helix (bHLH) E47 DNA binding and transcriptional activity. Biochimie 2015, 112, 139–150. [Google Scholar] [CrossRef] [PubMed] [Green Version]
  37. Zhang, Y.; Zhang, L.X.; Liu, X.Q.; Zhao, F.Y.; Ge, C.; Chen, T.Y.; Yao, M.; Li, J.J. Id4 promotes cell proliferation in hepatocellular carcinoma. Chin. J. Cancer 2017, 36, 19. [Google Scholar] [CrossRef] [PubMed] [Green Version]
  38. Zeng, W.; Rushing, E.J.; Hartmann, D.P.; Azumi, N. Increased inhibitor of differentiation 4 (id4) expression in glioblastoma: A tissue microarray study. J. Cancer 2010, 1, 1–5. [Google Scholar] [CrossRef] [PubMed] [Green Version]
  39. Peretz, Y.; Wu, H.; Patel, S.; Bellacosa, A.; Katz, R.A. Inhibitor of DNA Binding 4 (ID4) is highly expressed in human melanoma tissues and may function to restrict normal differentiation of melanoma cells. PLoS ONE 2015, 10, e0116839. [Google Scholar] [CrossRef] [Green Version]
  40. Sharma, P.; Chinaranagari, S.; Patel, D.; Carey, J.; Chaudhary, J. Epigenetic inactivation of inhibitor of differentiation 4 (Id4) correlates with prostate cancer. Cancer Med. 2012, 1, 176–186. [Google Scholar] [CrossRef]
  41. Noetzel, E.; Veeck, J.; Niederacher, D.; Galm, O.; Horn, F.; Hartmann, A.; Knuchel, R.; Dahl, E. Promoter methylation-associated loss of ID4 expression is a marker of tumour recurrence in human breast cancer. BMC Cancer 2008, 8, 154. [Google Scholar] [CrossRef] [Green Version]
  42. Beger, C.; Pierce, L.N.; Kruger, M.; Marcusson, E.G.; Robbins, J.M.; Welcsh, P.; Welch, P.J.; Welte, K.; King, M.C.; Barber, J.R.; et al. Identification of Id4 as a regulator of BRCA1 expression by using a ribozyme-library-based inverse genomics approach. Proc. Natl. Acad. Sci. USA 2001, 98, 130–135. [Google Scholar] [CrossRef] [Green Version]
  43. Welcsh, P.L.; Lee, M.K.; Gonzalez-Hernandez, R.M.; Black, D.J.; Mahadevappa, M.; Swisher, E.M.; Warrington, J.A.; King, M.C. BRCA1 transcriptionally regulates genes involved in breast tumorigenesis. Proc. Natl. Acad. Sci. USA 2002, 99, 7560–7565. [Google Scholar] [CrossRef] [Green Version]
  44. Cheang, M.C.; Chia, S.K.; Voduc, D.; Gao, D.; Leung, S.; Snider, J.; Watson, M.; Davies, S.; Bernard, P.S.; Parker, J.S.; et al. Ki67 index, HER2 status, and prognosis of patients with luminal B breast cancer. J. Natl. Cancer Inst. 2009, 101, 736–750. [Google Scholar] [CrossRef] [PubMed] [Green Version]
  45. Kaplan-Meier Plotter. Available online: https://kmplot.com/analysis/ (accessed on 7 July 2019).
  46. Jang, K.S.; Han, H.X.; Paik, S.S.; Brown, P.H.; Kong, G. Id-1 overexpression in invasive ductal carcinoma cells is significantly associated with intratumoral microvessel density in ER-negative/node-positive breast cancer. Cancer Lett. 2006, 244, 203–210. [Google Scholar] [CrossRef] [PubMed]
  47. de Candia, P.; Akram, M.; Benezra, R.; Brogi, E. Id4 messenger RNA and estrogen receptor expression: Inverse correlation in human normal breast epithelium and carcinoma. Hum. Pathol. 2006, 37, 1032–1041. [Google Scholar] [CrossRef] [PubMed]
  48. Turner, N.C.; Reis-Filho, J.S.; Russell, A.M.; Springall, R.J.; Ryder, K.; Steele, D.; Savage, K.; Gillett, C.E.; Schmitt, F.C.; Ashworth, A.; et al. BRCA1 dysfunction in sporadic basal-like breast cancer. Oncogene 2007, 26, 2126–2132. [Google Scholar] [CrossRef] [Green Version]
  49. Agboola, A.O.J.; Banjo, A.A.F.; Anunobi, C.; Salami, B.; Deji-Agboola, M.; Musa, A.; Nolan, C.C.; Rakha, E.A.; Green Ellis, I.O.A.R. Helix-loop-helix protein inhibitor of differentiation 4 (ID4) expression is an indicator of poor survival in Nigerian breast cancer women. J. Afr. Cancer 2014, 6, 129–137. [Google Scholar] [CrossRef]
  50. Thike, A.A.; Tan, P.H.; Ikeda, M.; Iqbal, J. Increased ID4 expression, accompanied by mutant p53 accumulation and loss of BRCA1/2 proteins in triple-negative breast cancer, adversely affects survival. Histopathology 2016, 68, 702–712. [Google Scholar] [CrossRef]
  51. Donzelli, S.; Milano, E.; Pruszko, M.; Sacconi, A.; Masciarelli, S.; Iosue, I.; Melucci, E.; Gallo, E.; Terrenato, I.; Mottolese, M.; et al. Expression of ID4 protein in breast cancer cells induces reprogramming of tumour-associated macrophages. Breast Cancer Res. 2018, 20, 59. [Google Scholar] [CrossRef]
  52. Fontemaggi, G.; Dell’Orso, S.; Trisciuoglio, D.; Shay, T.; Melucci, E.; Fazi, F.; Terrenato, I.; Mottolese, M.; Muti, P.; Domany, E.; et al. The execution of the transcriptional axis mutant p53, E2F1 and ID4 promotes tumor neo-angiogenesis. Nat. Struct. Mol. Biol. 2009, 16, 1086–1093. [Google Scholar] [CrossRef]
  53. Junankar, S.; Baker, L.A.; Roden, D.L.; Nair, R.; Elsworth, B.; Gallego-Ortega, D.; Lacaze, P.; Cazet, A.; Nikolic, I.; Teo, W.S.; et al. ID4 controls mammary stem cells and marks breast cancers with a stem cell-like phenotype. Nat. Commun. 2015, 6, 6548. [Google Scholar] [CrossRef]
  54. Baker, L.A.; Holliday, H.; Roden, D.; Krisp, C.; Wu, S.Z.; Junankar, S.; Serandour, A.A.; Mohammed, H.; Nair, R.; Sankaranarayanan, G.; et al. Proteogenomic analysis of Inhibitor of Differentiation 4 (ID4) in basal-like breast cancer. Breast Cancer Res. 2020, 22, 63. [Google Scholar] [CrossRef] [PubMed]
  55. Ruzinova, M.B.; Benezra, R. Id proteins in development, cell cycle and cancer. Trends Cell Biol. 2003, 13, 410–418. [Google Scholar] [CrossRef]
  56. Olmeda, D.; Moreno-Bueno, G.; Flores, J.M.; Fabra, A.; Portillo, F.; Cano, A. SNAI1 is required for tumor growth and lymph node metastasis of human breast carcinoma MDA-MB-231 cells. Cancer Res. 2007, 67, 11721–11731. [Google Scholar] [CrossRef] [PubMed] [Green Version]
  57. Wojnarowicz, P.M.; Lima, E.S.R.; Ohnaka, M.; Lee, S.B.; Chin, Y.; Kulukian, A.; Chang, S.H.; Desai, B.; Garcia Escolano, M.; Shah, R.; et al. A Small-Molecule Pan-Id Antagonist Inhibits Pathologic Ocular Neovascularization. Cell Rep. 2019, 29, 62–75. [Google Scholar] [CrossRef] [Green Version]
  58. McShane, L.M.; Altman, D.G.; Sauerbrei, W.; Taube, S.E.; Gion, M.; Clark, G.M. REporting recommendations for tumor MARKer prognostic studies (REMARK). Breast Cancer Res. Treat. 2006, 100, 229–235. [Google Scholar] [CrossRef]
  59. Peiro, G.; Adrover, E.; Sanchez-Tejada, L.; Lerma, E.; Planelles, M.; Sanchez-Paya, J.; Aranda, F.I.; Giner, D.; Gutierrez-Avino, F.J. Increased insulin-like growth factor-1 receptor mRNA expression predicts poor survival in immunophenotypes of early breast carcinoma. Mod. Pathol. 2011, 24, 201–208. [Google Scholar] [CrossRef] [Green Version]
  60. Sanmartin, E.; Ortiz-Martinez, F.; Pomares-Navarro, E.; Garcia-Martinez, A.; Rodrigo-Banos, M.; Garcia-Escolano, M.; Andres, L.; Lerma, E.; Aranda, F.I.; Martinez-Peinado, P.; et al. CD44 induces FOXP3 expression and is related with favorable outcome in breast carcinoma. Virchows Arch. 2017, 470, 81–90. [Google Scholar] [CrossRef]
  61. Wolff, A.C.; Hammond, M.E.H.; Allison, K.H.; Harvey, B.E.; Mangu, P.B.; Bartlett, J.M.S.; Bilous, M.; Ellis, I.O.; Fitzgibbons, P.; Hanna, W.; et al. Human Epidermal Growth Factor Receptor 2 Testing in Breast Cancer: American Society of Clinical Oncology/College of American Pathologists Clinical Practice Guideline Focused Update. J. Clin. Oncol. 2018, 36, 2105–2122. [Google Scholar] [CrossRef] [Green Version]
  62. Maisonneuve, P.; Disalvatore, D.; Rotmensz, N.; Curigliano, G.; Colleoni, M.; Dellapasqua, S.; Pruneri, G.; Mastropasqua, M.G.; Luini, A.; Bassi, F.; et al. Proposed new clinicopathological surrogate definitions of luminal A and luminal B (HER2-negative) intrinsic breast cancer subtypes. Breast Cancer Res. 2014, 16, R65. [Google Scholar] [CrossRef] [Green Version]
Figure 1. mRNA expression of ID genes (A: ID1, B: ID2; C: ID3; D: ID4) in six breast tumor cell lines (MCF-7, T47-D, BT-474, SK-BR-3, MDA-MB-231, and MDA-MB-468) and the breast epithelium cell line 184A1. All experiments were done three times. Each graph shows the average and standard derivation (error bars) of the three measurements. * p < 0.05 compared to all the other cell lines.
Cancers 13 00492 g001
Figure 2. Heat map representing the expression of ID genes in all BC samples (n = 307) according to BC phenotypes. Normal–low expression (FC < 2) is represented in blue and overexpression (FC ≥ 2) is represented in red. Samples with no available data (n = 10) are colored gray.
Cancers 13 00492 g002
Figure 3. Percentage of samples overexpressing ID1 (A) and ID4 (B) at mRNA level in each breast cancer immunophenotype. TNBL, triple-negative basal-like.
Cancers 13 00492 g003
Figure 4. Kaplan–Meier plot for overall survival (A,B) and disease-free survival (C,D) rates (%) for all patients classified according to tumor ID1 (A,C) or ID4 (B,D) mRNA expression.
Cancers 13 00492 g004
Table 1. Correlation between ID1 and ID4 mRNA expression and clinicopathological variables.
Patients
(n = 297)
ID1ID4
FC < 2 (236)FC ≥ 2 (61)OR (95% CI)p *FC < 2 (248)FC ≥ 2 (49)OR (95% CI)p *
% (n)% (n)% (n)% (n)
Age
 ≥5018864.4% (152)59.0% (36)0.8 (0.5–1.4)ns61.3% (152)73.5% (36)1.8 (0.9–3.5)ns (0.071)
 <5010935.6% (84)41.0% (25)1 38.7% (96)26.5% (13)1
Size
 ≥2016251.3% (121)68.3% (41)2.1 (1.1–3.7)0.01252.2% (129)67.3% (33)1.9 (1.0–3.6)0.036
 <2013448.7% (115)31.7% (19)1 47.8% (118)32.7% (16)1
 NA1
Histological Grade
 13011.9% (28)3.3% (2)1 11.7% (29)2.0% (1)1
 28933.1% (78)18.0% (11)2.0 (0.4–9.5)ns32.3% (80)18.4% (9)3.3 (0.4–26.9)ns
 317855.1% (130)78.7% (48)5.2 (1.2–22.5)0.02956.0% (139)79.6% (39)8.1 (1.1-61.6)0.042
Necrosis
 Present10029.9% (70)50.0% (30)2.3 (1.3–4.2)0.00330.5% (75)52.1% (25)2.5 (1.3–4.6)0.004
 Absent19470.1% (164)50.0% (30)1 69.5% (171)47.9% (23)1
 NA3
Vascular Invasion
 Present10733.8% (79)45.9% (28)1.7 (0.9–3.0)ns (0.055)33.3% (82)51.0% (25)2.1 (1.1–3.9)0.015
 Absent18866.2% (155)54.1% (33)1 66.7% (164)49.0% (24)1
 NA2
Lymph Nodes Status
 Positive11738.1% (90)44.3% (27)1.3 (0.7–2.3)ns37.9% (94)46.9% (23)1.5 (0.8–2.7)ns
 Negative18061.9% (146)55.7% (34)1 62.1% (154)53.1% (26)1
OR: Odds Ratio; CI: Confidence Interval; NA: not available; ns: not significant (p > 0.05). * Chi-Square Test.
Table 2. Univariate and multivariate analysis of OS and DFS for all variables included in the study.
Overall SurvivalDisease-Free Survival
Univariate AnalysisMultivariate AnalysisUnivariate AnalysisMultivariate Analysis
HR (95% CI)p *HR (95% CI)p *HR (95% CI)p *HR (95% CI)p *
Age
 ≥50 1.3 (0.7–2.3)ns 0.7 (0.4–1.1)ns
 <501 1
Size
 ≥20 2.8 (1.5–5.2)0.0021.7 (0.8–3.5)ns1.8 (1.0–3.2)0.0341.3 (0.7–2.4)ns
 <201 1 1
Histological Grade
 11 1 1
 24.2 (0.5–32.9)ns2.5 (0.3–20.0)ns1.3 (0.4–3.9)0.702
 38.1 (1.1–58.8)0.0402.6 (0.3–21.4)ns2.1 (0.8–5.9)0.157
Necrosis
 Present1.8 (1.0–3.2)0.0421.4 (0.7–2.6)ns1.8 (1.0–3.1)0.0411.8 (1.0–3.1)0.050
 Absent1 1 1
Vascular Invasion
 Present 2.6 (1.4–4.6)0.0011.6 (0.8–3.1)ns2.5 (1.4–4.2)0.0011.9 (1.1–3.5)0.031
 Absent1 1 1
Lymph Nodes
 Positive 2.6 (1.4–4.6)0.0011.6 (0.8–3.1)ns1.6 (0.9–2.7)0.107
 Negative1 1 1
HR Status
 Negative 1.8 (1.0–3.3)0.0391.3 (0.6–2.4)ns1.6 (0.9–2.8)ns (0.080)
 Positive1 1 1
ID1 FC
 ≥2 1.3 (0.7–2.5)ns 2.0 (1.1–3.6)0.0160.6 (0.3–1.5)ns
 <21 1
ID2 FC
 ≥20.8 (0.4–1.7)ns 0.9 (0.4–1.7)ns
 <21 1
ID3 FC
 ≥2 1.0 (0.5–2.3)ns 0.9 (0.4–1.9)ns
 <21 1
ID4 FC
 ≥2 2.1 (1.2–3.9)0.0161.6 (0.8–3.0)ns (0.167)3.4 (1.9–6.0)<0.0014.0 (1.8–8.9)0.001
 <21 1 1
HR, hazard ratio; CI, confidence interval; HR status, hormonal receptor status; ns, not significant (p > 0.05). * Cox model.
Publisher’s Note: MDPI stays neutral with regard to jurisdictional claims in published maps and institutional affiliations.

