Article

Clinicopathological and Molecular Profiles of Sporadic Microsatellite Unstable Colorectal Cancer with or without the CpG Island Methylator Phenotype (CIMP)

1
Division of Colon & Rectal Surgery, Department of Surgery, Taipei Veterans General Hospital, Taipei 11217, Taiwan
2
Department of Surgery, Faculty of Medicine, School of Medicine, National Yang-Ming University, Taipei 11121, Taiwan
3
Department of Pathology, Taipei Veterans General Hospital, Taipei 11217, Taiwan
4
Department of Clinical Pathology, Yang-Ming Branch, Taipei City Hospital, Taipei 11146, Taiwan
5
Department of Health and Welfare, University of Taipei, Taipei 11153, Taiwan
6
Division of Genomic Medicine, National Health Research Institutes, Zhunan 35053, Taiwan
*
Author to whom correspondence should be addressed.
Cancers 2020, 12(11), 3487; https://doi.org/10.3390/cancers12113487
Submission received: 27 September 2020 / Revised: 7 November 2020 / Accepted: 17 November 2020 / Published: 23 November 2020

Abstract

:

Simple Summary

The 5’-C-phosphate-G-3’ island methylator phenotype (CIMP) is a phenotype of colorectal cancer associated with microsatellite instability (MSI). The aim of the present study was to analyze the CIMP phenotype and genetic mutations in MSI-high colorectal cancer. Our results demonstrated that among MSI-high colorectal cancer patients, CIMP-high tumors were associated with specific mutation profiles and clinicopahtological features compared with CIMP-low or CIMP-0 tumors, however, the CIMP status was not an independent prognostic factor.

Abstract

Background: The 5’-C-phosphate-G-3’ island methylator phenotype (CIMP) is a specific phenotype of colorectal cancer (CRC) associated with microsatellite instability-high (MSI-high) tumors. Methods: In this study, we determined the CIMP status using eight methylation markers in 92 MSI-high CRC patients after excluding five germline mismatch repair (MMR) gene mutations analyzed by next-generation sequencing (NGS) and confirmed by Sanger sequencing. The mutation spectra of 22 common CRC-associated genes were analyzed by NGS. Results: Of the 92 sporadic MSI-high tumors, 23 (25%) were considered CIMP-high (expressed more than 5 of 8 markers). CIMP-high tumors showed proximal colon preponderance and female predominance. The mutation profiles of CIMP-high tumors were significantly different from those of CIMP-low or CIMP-0 tumors (i.e., higher frequencies of BRAF, POLD1, MSH3, and SMAD4 mutations but lower frequencies of APC, TP53, and KRAS mutations). Multivariate analysis demonstrated that tumor, node, metastasis (TNM) stage was the independent prognostic factor affecting overall survival (OS). Among the MSI-high cases, the CIMP status did not impact the outcome of patients with MSI-high tumors. Conclusions: Only TNM stage was a statistically significant predictor of outcomes independent of CIMP profiles in MSI-high CRC patients. Sporadic MSI-high CRCs with different mechanisms of carcinogenesis have specific mutation profiles and clinicopathological features.

1. Introduction

Approximately 10–15% of colorectal cancers (CRCs) have a high frequency of microsatellite instability (MSI) [1,2,3]. MSI-high CRC showed a proximal colon predominance, a female predominance, and a more mucinous histology than microsatellite-stable (MSS) CRC [4,5,6]. The majority of MSI-high CRCs are believed to originate from defects in or the loss of expression of DNA mismatch repair (MMR) proteins, including MLH1, MSH2, MSH6, PMS2, and EPCAM [7,8,9]. A deficiency in MMR genes results in the inefficient correction of errors in repetitive sequences (microsatellite DNA) during DNA synthesis [10,11].
Germline mutations in a DNA MMR gene are observed in ninety percent of CRC patients with Lynch syndrome (LS), and these patients have the MSI-high phenotype, the most frequent cause of hereditary CRC, with a frequency of 1–3% of CRCs [1,2]. Germline mutations in MMR genes, MLH1 silencing due to hypermethylation of the promoter of MLH1, or somatic mutations in MMR genes in tumor cells are the other causes of MSI [8,9,10].
A subset of CRCs (up to 15%) are associated with the 5’-C-phosphate-G-3’ island methylator phenotype (CIMP), which includes MLH1 hypermethylation [11,12,13]. The clinicopathological features of CIMP-positive CRCs are unique and overlap with those of MSI-high CRCs [14,15]. Studies have demonstrated that the rate of BRAF mutations is higher in MSI-high CRCs than in MSS CRCs, especially those associated with MLH1 hypermethylation [16,17]. Because the BRAF mutation is found exclusively in individuals without LS [18,19,20], it can be used as a surrogate marker to differentiate LS from sporadic MSI-high CRC. The mechanisms of carcinogenesis and molecular profiles of LS have been well studied. However, the molecular profiles of sporadic MSI-high CRC with/without CIMP positivity are not well understood.
In gene promoter regions, there are many 5’-C-phosphate-G-3’ (CpG) dinucleotides, also called CpG islands. Methylation usually occurs at the cytosine bases of CpG dinucleotides, and promoter methylation can regulate gene expression [21]. The dysregulation of methylation increases in response to chronic inflammation, other stimuli, aging, etc. [22,23,24]. The hypermethylation of promoter regions can result in the silencing of tumor suppressor genes and induce the carcinogenesis of many cancers, including CRC [21,22,23,24,25]. The definition of CIMP-positive tumors is inconclusive. Most studies have applied one of two panels: the Ogino panel and the Weisenberger panel [14,17]. The advantage of the Ogino panel is that this panel consists of eight markers, including five markers used in the Weisenberger panel.
In this study, we selected 92 sporadic MSI-high CRCs after excluding germline mutations in five MMR genes: EPCAM, MLH1, MSH2, MSH6, and PMS2. According to the Ogino panel [4], we identified twenty-three (25%) CIMP-high tumors as having at least five positive markers with hypermethylation. Furthermore, we compared the difference in somatic mutations in five MMR genes and another 17 common genes associated with CRC analyzed by next-generation sequencing (NGS) between CIMP-high, CIMP-low, and CIMP-0 tumors.

2. Results

2.1. Clinical Data

As shown in Table 1, of the 92 patients with MSI-high CRC, 43 were females (46.7%) The mean age at the time of tumor resection was 69.0 ± 14.6 (median: 71.5) years. The histological examination showed 11 (12.0%) patients with stage I, 48 (52.2%) with stage II, 20 (21.8%) with stage III, and 13 (14.1%) with stage IV disease as defined by the TNM staging system. LVI, mucinous histology, and poor differentiation were present in 14 (15.2%), 15 (16.3%), and 13 (14.1%) patients, respectively.

2.2. Alterations in Molecular Profiles

The case numbers and frequencies of hypermethylation markers were as follows: CRABP1 (44, 47.8%); CDKN2A (40, 43.5%); CACNA1G (36, 39.1%); IGF2 (31, 33.7%); RUNX3 (30, 32.6%); MLH1 (26, 28.3%); NEUROG1 (18, 19.6%); and SOCS1 (16, 17.4%). Twenty-three (25%) CRC were considered CIMP-high. The case numbers and frequencies of somatic mutations in five MMR genes were as follows: MSH6 (41, 44.6%), MLH1 (20, 21.7%), PMS2 (19, 20.7%), MSH2 (16, 17.4%), and EPCAM (6, 7.5%). Twenty-eight patients with sporadic MSI-high CRC (30.4%) did not have somatic mutations in these five MMR genes. Twenty-two patients (23.9%) had neither CIMP-positive nor MMR mutations. The case numbers and frequencies of 17 common CRC-associated genes are shown in Table 2. In sporadic MSI-high CRC, the most common mutated genes (more than 40%) were PMS1 (76, 82.7%), BAX (48, 52.2%), KRAS (45, 48.9%), POLE (44, 47.8%), TP53 (41, 44.6%), and APC (40, 43.4%).

2.3. Clinicopathological Features and Molecular Signatures of Microsatellite Instability (MSI)-High Colorectal Cancer (CRC) Classified by the 5′-C-phosphate-G-3′ Island Methylator Phenotype (CIMP) Status

The relationships between the CIMP and clinicopathological features are shown in Table 1. Patients with sporadic MSI-high and CIMP-high CRCs showed a female predominance (73.9%), a proximal tumor location predominance (82.6%), and poorer differentiation (34.8%) than those with CIMP-low or CIMP-0 CRCs.
Table 2 and Figure 1 show the different mutation frequencies between CIMP-high, CIMP-low, and CIMP-0 CRCs with MSI-high tumors. CIMP-high tumors had a significantly lower frequency of mutations in APC (13%), TP53 (8.7%), and KRAS (17.4%) than CIMP-low or CIMP-0 tumors. In contrast, CIMP-high tumors had a significantly higher frequency of mutations in BRAF (60.9%), POLD1 (60.9%), MSH3 (52.2%), and SMAD4 (30.4%) than CIMP-low or CIMP-0 tumors. The somatic mutations in five major MMR genes were distributed similarly among CIMP-high, CIMP-low, and CIMP-0 tumors (73.9% vs. 70.5% vs. 64.0%, p = 0.745).
As shown in Table S1, CIMP-high tumors had a higher frequency of loss of MMR protein expression than CIMP-low or CIMP-0 tumors (73.9% vs. 38.6% vs. 32.0%, p = 0.006), especially in MLH1 (56.5% vs. 22.7% vs. 12.0%, p = 0.002) and PMS2 (60.9% vs. 38.6% vs. 24.0%, p = 0.032).

2.4. Clinicopathological Features and Molecular Signatures of MSI-High CRC Classified by Somatic Mismatch Repair (MMR) Mutations

The correlations between clinicopathological features and somatic MMR mutations are shown in Table 3. Mucinous histology was found in 20.3% of MSI-high tumors with MMR mutations; this rate was significantly higher than that in MSI-high tumors without MMR mutations (0%, p = 0.008). The other clinicopathological features were similar between these two groups of tumors. As shown in Table 4, the frequency of POLD1 mutations was significantly higher in MSI-high tumors with somatic MMR mutations than in those without MMR mutations (46.9% vs. 21.4%, p = 0.036).

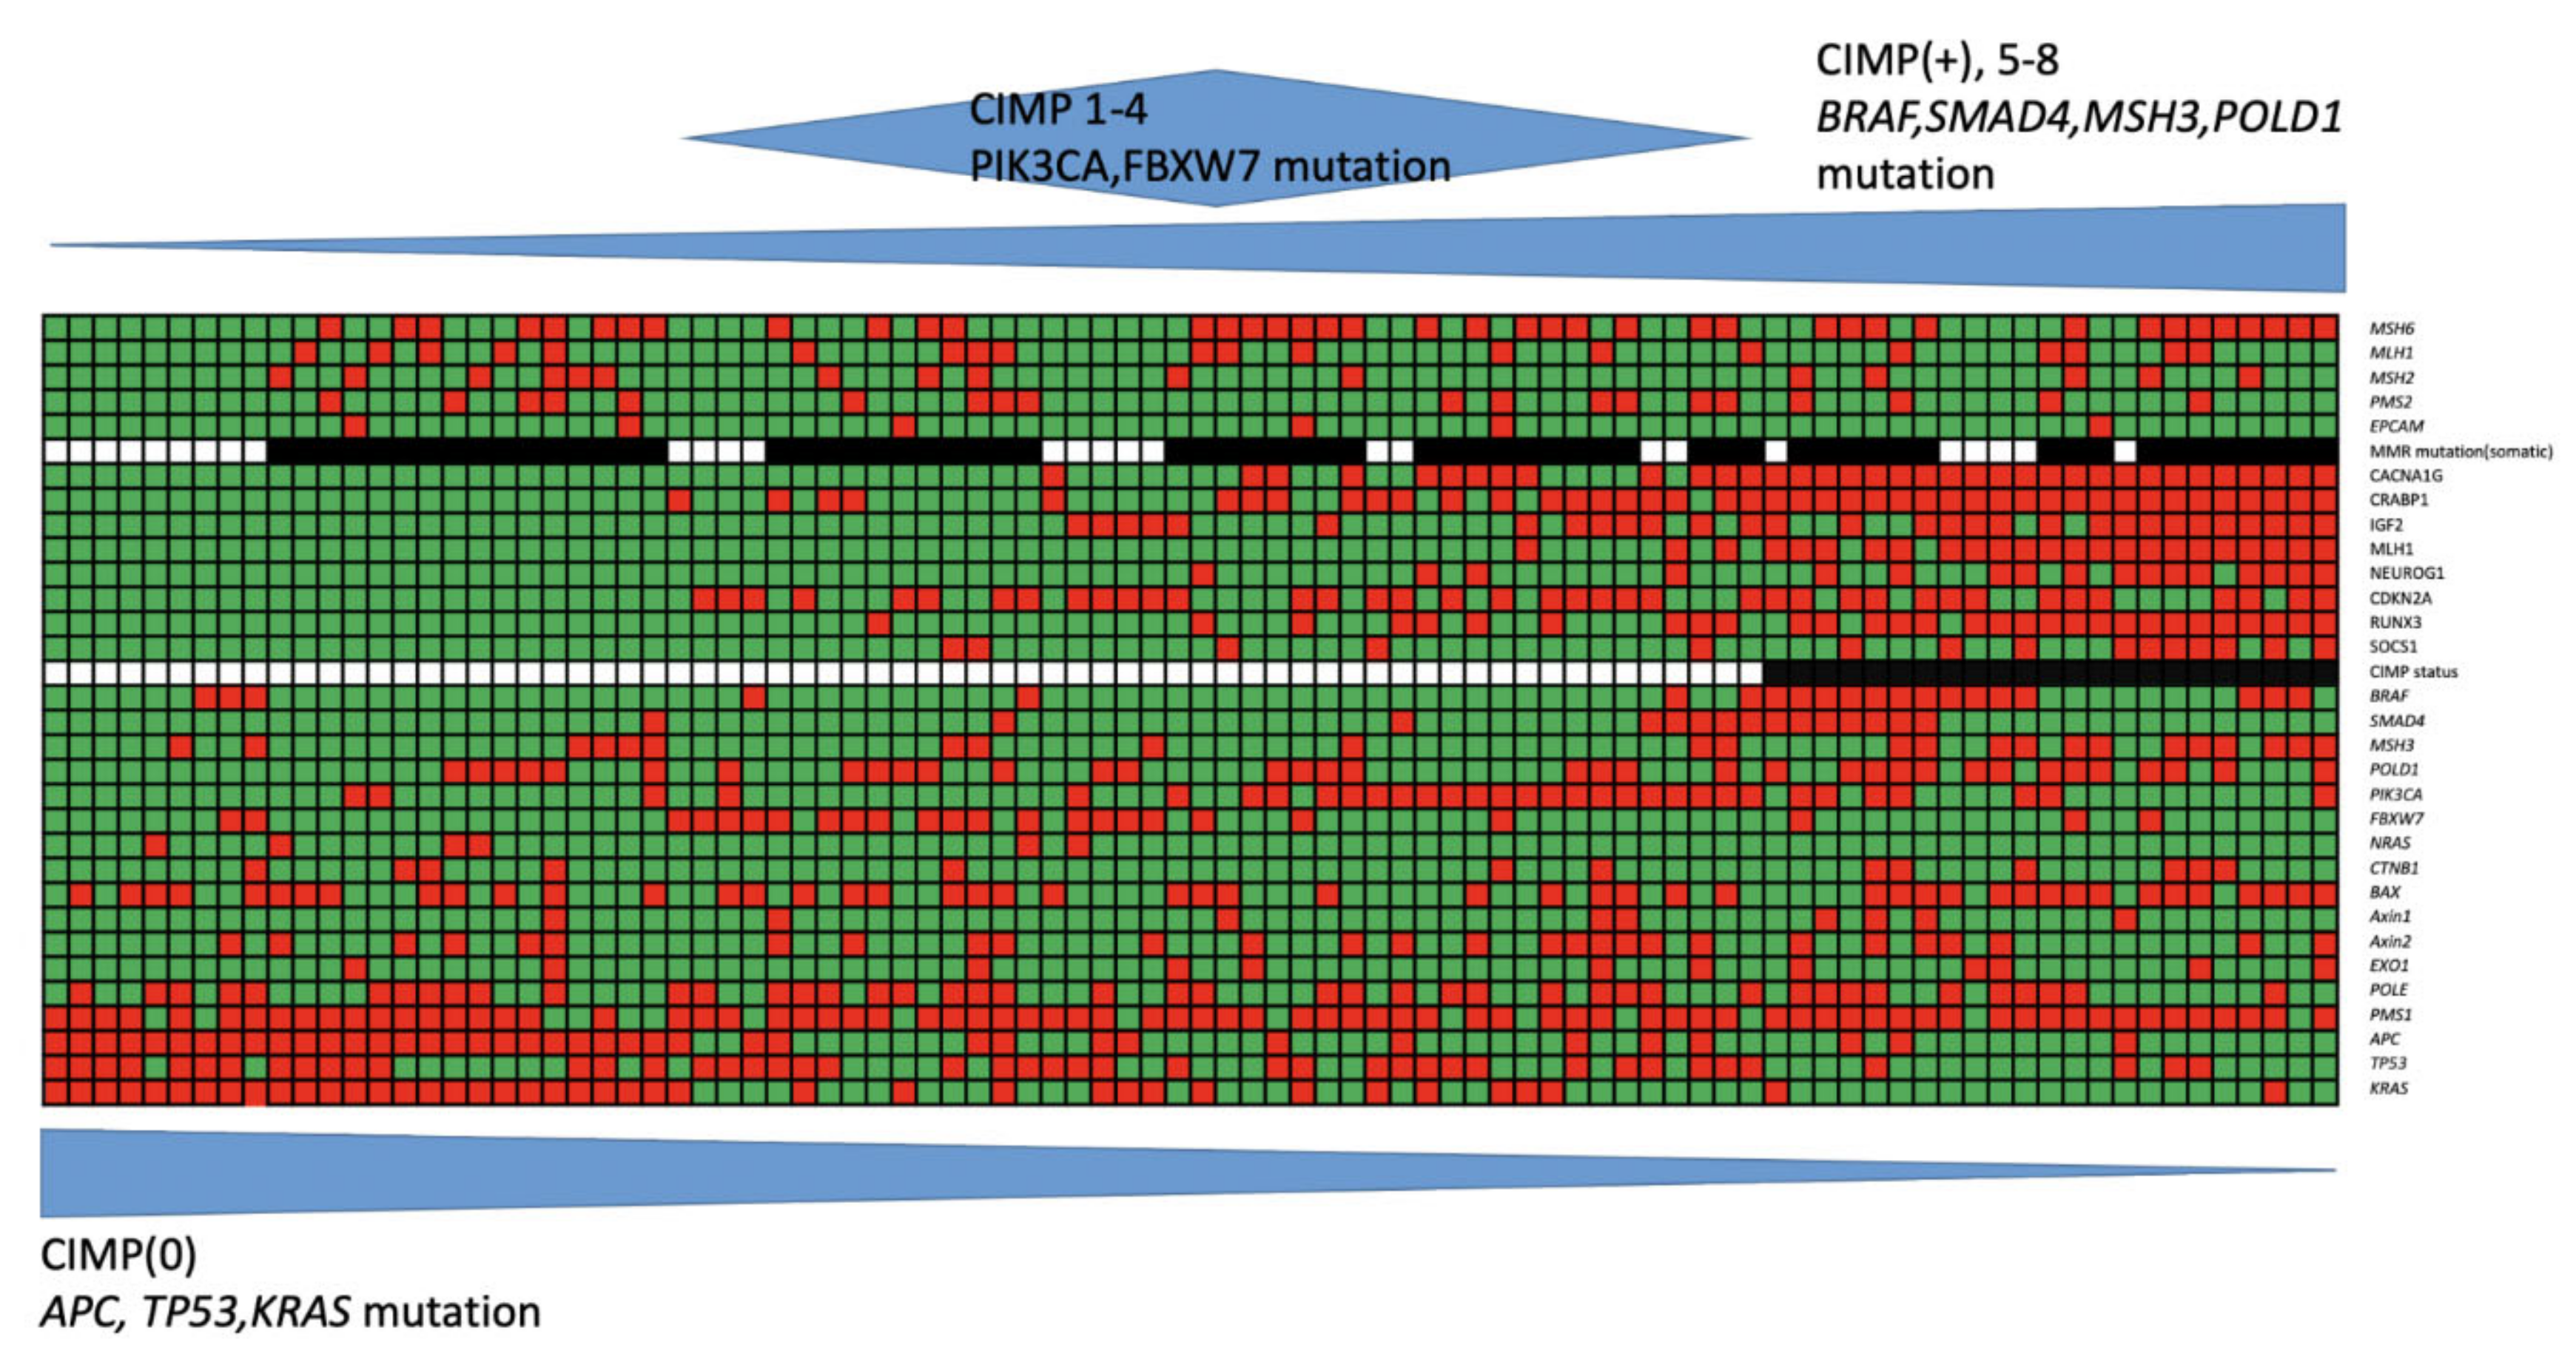
2.5. The Mutational Profiles in MSI-High CRC Classified by the Cause of MSI

As shown in Figure 2A, for MSI-high CRC with MLH1 methylation (n = 24), the most common mutated MMR gene was MSH6, followed by MLH1 and MSH2. Most of the patients (87.5%, 21/24) had CIMP-high tumors. The most common mutated gene was PMS1, followed by BAX.
As shown in Figure 2B, for MSI-high CRC with an MMR mutation (n = 64), the most common mutated MMR gene was MSH6, followed by MLH1. Among the 64 patients, 17 (26.6%) had CIMP-high tumors. The most common mutated gene was PMS1.
As shown in Figure 2C, for MSI-high CRC with no obvious cause of MSI-high (n = 21), there were no patients with an MMR mutation or CIMP-high tumors. The most common mutated gene was PMS1, followed by KRAS, APC, and TP53.

2.6. Impact of the CIMP and Somatic MMR Statuses on Outcomes of Colorectal Cancer Patients

The 5-year DFS rate of 23 patients with CIMP-high CRC was slightly better than that of 69 patients with CIMP-low or CIMP-0 CRC, without statistical significance (79.9% vs. 52.5%, p = 0.158). The CIMP status did not impact the 5-year OS rate of CRC patients with MSI-high tumors (61.4% vs. 59.3%, p = 0.921). Patients with somatic MMR mutations and those without MMR mutations had similar 5-year DFS and OS rates.
As shown in Table 5, the univariate analysis demonstrated that TNM stage, LVI, and adjuvant chemotherapy were significantly associated with OS in these 92 patients with MSI-high CRC. The aforementioned three covariates were included in the multivariate analysis. Multivariate Cox regression analysis demonstrated that TNM stage was the independent prognosticator for patients with MSI-high CRC. Neither CIMP nor the somatic MMR status impacted the OS of patients with MSI-high CRC.

3. Discussion

Our results address three major issues regarding sporadic MSI-high CRC. First, 25% of sporadic MSI-high CRCs were associated with aberrant DNA methylation; second, the molecular and clinicopathologic features of CIMP-high CRCs were specific to sporadic MSI-high CRCs; third, the molecular and clinicopathological features of sporadic MSI tumors with and without MMR mutations were similar.
Because the patients enrolled in the present study were diagnosed between 2000 and 2010, the original MSI definition by the National Cancer Institute from 1998 was used [4]. The definition of MSI-H was updated in 2008, with at least one mononucleotide repeat marker needing to be mutated to warrant an MSI-H classification [16]. Using the original MSI definition rather than the version updated in 2008, a substantial proportion of the MSI-H tumors without a somatic MMR gene mutation or MLH1 methylation may actually reflect a low level of MSI, which might have impacted our data.
Regarding the CIMP status, most studies have one of two panels: the Ogino panel [14] or the Weisenberger panel [17]. There are eight markers used in the Ogino panel, and the rate of CIMP-high in sporadic MSI-H CRC was 72.7% (88/121), whereas the rate of BRAF mutation was 45% (53/118); the definition of the MSI phenotype in the Ogino study [26] using 10 markers defined MSI-H as the presence of instability in ≥30% of the markers. In contrast, the Weisenberger panel consists of five markers, all of which are included in the eight markers of the Ogino panel, and the rate of CIMP-high in sporadic MSI-H CRC was 57.1% (12/21). The definition of the MSI phenotype in the Weisenberger study consisted of five markers: two mononucleotides (BAT25, BAT26) and three dinucleotides (D5S346, D2S123, and D17S250) [4]. The CIMP used in the present study was the same as that used in the study by Ogino et al. [14], while the MSI phenotype used in the present study was the same as that used in the study by Weisenberger et al. [17].
In the general population of CRC patients, the CIMP-high rate varies widely and ranges from 6.4–48% [11,12,13,14,15,16,17,27,28,29,30]. Ogino’s study demonstrated that the frequency of CIMP-high tumors varied depending on the cutoffs and genes included in a panel [31]. The present study followed Ogino’s definition, including the cutoff value of hypermethylation. Because we selected samples from sporadic MSI-high tumors, it was reasonable that 25% of tumors were considered CIMP-high. In the present study, among MSI-H CRC tumors, the rate of CIMP-high was 25% and the rate of BRAF mutation was 22.8%, which was lower than that in the study by Ogino et al. among a Western population (72.7% CIMP-H and 45% BRAF mutation) [14]. The discrepancies between studies might be due to differences in the definitions of CIMP and MSI or in the patient population, ethnicities, or environmental and genetic factors.
All eight markers used in the Ogino panel showed sensitivities of >60% and specificities of ≥80% for CIMP+ tumors [31]. The Ogino panel with eight markers was more accurate in reflecting the true CIMP status than any other marker combination: thus, the eight-marker panel has been designated as the gold standard [31]. In addition, regarding the BRAF and KRAS mutation frequencies, the authors demonstrated that the Ogino panel with eight markers was a superior gold-standard panel (44% KRAS-mutated, and 33% BRAF-mutated) to the Weisenberger panel with five markers (43% KRAS-mutated, and 28% BRAF-mutated) [31]. Ogino et al. stated that all eight markers are good surrogate markers for determining the CIMP status, and at least four markers, namely, RUNX3, CACNA1G, IGF2, and MLH1 constitute a sensitive and specific CIMP panel [31]. In contrast, the five markers used in the Weisenberger panel are CACNA1G, IGF2, NEUROG1, RUNX3, and SOCS1, and the panel does not include MLH1. Despite of the facts mentioned above, the Weisenberger panel is used more often than the Ogino panel. The reason might be that it is easier to analyze the CIMP status using fewer markers. However, investigating the CIMP status according to the different panels among different races as well as their clinical relevance is necessary.
Regarding the Ogino panel, the percentage of CIMP was 71.9% (92/128) among MSI-H tumors with a PMR cutoff of 4, which was decreased to 15.6% (20/128) with a PMR cutoff of 6 [31]. In the present study, among the 92 MSI-H CRCs, the percentage of CIMP was 25% (23/92) with a PMR cutoff of 4, which was decreased to 9.8% (9/92) with a PMR cutoff of 6. As a result, a PMR cutoff of 4 was used in the present study to increase the number of CIMP-high patients.
An earlier study concluded that most sporadic MSI-high CRCs originated from hypermethylation of the MLH1 gene promoter [32]. In vitro, the MLH1 promoter was demethylated in MSI-high CRC cell lines, providing evidence that the number of MSI events decreases as MLH1 is reactivated (i.e., in expression and function) [33,34]. Therefore, aberrant DNA methylation is considered the cause but not the consequence of sporadic MSI-high CRC. However, our results showed that only 26.1% (24/92) and 25% of sporadic MSI-high tumors had MLH1 hypermethylation and were considered CIMP-high, respectively. Another mechanism, such as somatic mutations in MMR genes, was demonstrated in several studies to be a possible cause of sporadic MSI-high CRC [5,6,35]. Our results demonstrated that most sporadic MSI-high CRCs originated from somatic MMR mutations (69.6%). Seventeen patients (18.5%) had both CIMP-high tumors and somatic MMR mutations. Compatible with previous studies showing that somatic mutations in MMR genes were frequent causes of MMR deficiency in LS-like tumors [5,6,34], half of the sporadic MSI-high tumors in our series (46/92) had somatic mutations in MMR genes after exclusion of the CIMP-positive status or MLH1 hypermethylation. In total, seventy tumors (76.1%) were classified as MSI-high. MSI-high tumors with and without somatic MMR mutations had similar clinicopathological features. The mutation rates of other genes were also similar between MSI-high tumors with and without somatic mutations. Patient outcomes were also similar between the two groups. These results indicate that MSI determines the tumor signatures but not the origin of mutations.
It was reported that CIMP-high CRC was strongly associated with MLH1 hypermethylation and BRAF mutations [30], which was similar to our results as shown in Figure 2A,B. For CIMP-high CRC, MLH1 hypermethylation was associated with MSI-H status [36]. It seems that MLH1 methylation plays an important role in CIMP-high CRC with MSI-H.
Our results demonstrated that CIMP-high tumors were more likely to lose expression of MMR protein, especially MLH1 and PMS2. In addition, among the 24 CRC patients with MLH1 hypermethylation, 16 patients (66.7%) had loss of expression of MLH1. In the present study, all of the 26 patients (100%) with loss of expression of MLH1 had loss of expression of PMS2. The heterodimeric nature of the MMR proteins is possibly the reason to explain our findings. Loss of expression of one MMR protein may be due to the loss of expression of its paired protein [37].
In the present study, 44 (47.8%) tumors were CIMP-low and 25 (27.2%) were CIMP-0. As shown in Figure 1, all of the CIMP-0 tumors had APC (100%) and TP53 (100%) mutations, and the mutation frequency decreased as the number of methylation markers decreased. The meta-analysis also showed that the CIMP-high status was inversely associated with the TP53 mutation [38]. In addition, the mutation frequency of KRAS reached up to 60% in CIMP-0 and CIMP-low tumors but only 17.4% in CIMP-high tumors.
Interestingly, we found that CIMP-low tumors had a significantly higher mutation rate in FBXW7 than CIMP-high and CIMP-0 tumors. Nearly 50% of CIMP-low tumors had the FBXW7 mutation. As shown in Figure 1, the majority of tumors with the FBXW7 mutation had fewer than three hypermethylation markers. To date, no report has mentioned the association between the FBXW7 mutation and aberrant DNA methylation. In The Cancer Genome Atlas (TCGA) study, the majority of MSI-high CRCs with silenced MLH1 expression had few APC, KRAS, TP53, and FBXW7 mutations [29]. Another validation study showed that 50% of non-MLH1-methylated MSI-high CRCs contained truncating APC mutations [39]. Our results combined with previous results suggest that sporadic MSI-high CRCs with a low level of aberrant DNA methylation have a relatively higher mutation rate of proteins involved in canonical pathways, including APC, KRAS, TP53, and FBXW7, than those with a high level of aberrant DNA methylation [40,41,42].
Another interesting finding was that CIMP-low tumors had a significantly higher mutation rate in PIK3CA than CIMP-high and CIMP-0 tumors. Nearly 50% of CIMP-low tumors had PIK3CA mutations. These findings were in contrast to those from previous studies [35,43] that showed that the CIMP-high status was significantly associated with the PIK3CA mutation. However, the frequency of PIK3CA mutations in CIMP-high tumors was approximately 20% in these studies and similar to the frequency of PIK3CA mutations in CIMP-high (21.2%) tumors in our series. Another possible explanation for this difference is the level of the CIMP. As shown in Figure 1, most tumors with PIK3CA mutations had at least three hypermethylation markers. Therefore, PIK3CA mutations might overlap with aberrant DNA methylation pathways.
In contrast, MSI-high and CIMP-high CRCs had a significantly higher frequency of mutations in BRAF, SMAD4, MSH3, and POLD1 than CIMP-0 and CIMP-low tumors. Despite its crucial role in cellular function, the dysregulation of CpG methylation is considered mutagenic. Ehrlich’s study found that methylated cytosines more easily undergo spontaneous deamination than unmethylated cytosines, leading to a cytosine to thymine mismatch in DNA synthesis [44]. Poulos’s study analyzed tissue-specific methylation data including the TCGA and International Cancer Genome Consortium (ICGC) data. They found a strong association between C>T mutations and methylation at CpG dinucleotides in many cancer types [45]. Furthermore, their results and those from other studies also suggested that MMR proteins are partly involved in the correction of C>T mutations [45,46]. However, the difference between mutations in specific genes and different CIMP statuses still deserves attention.
Patients with sporadic MSI-high and CIMP-positive CRCs were older in age and showed a proximal colon predominance and a mucinous histology [12,13,14,15]. Over time, the DNA methylation pattern becomes altered, especially global hypomethylation and hypermethylation in specific CpG islands [22,23,24]. Similar to other studies, we also found that MSI-high CRCs with the CIMP were located predominantly in the proximal colon. One possible explanation for this observation is that the carcinogen in the proximal colon affects DNA methylation, resulting in cytosine to thymine mutations, as mentioned in a previous study [41]. Deficient MMR results in the accumulation of mutations and CRC carcinogenesis. Further mutations in specific genes, including SMAD4 and BRAF, alter the TGF-beta and MAPK signaling pathways. In vitro and clinical observation studies have reported associations between differentiation, mucinous histology, and altered TGF-beta and MAPK signaling pathways [47,48,49].
In contrast to other studies’ conclusions that the prognosis of CRC patients with the CIMP is poor [14,15], our results showed that patients with sporadic MSI-high and CIMP-high CRC tended to have higher DFS rates than those with CIMP-low or CIMP-0 CRC, although the difference was not statistically significant. This finding may be explained by the fact that slightly more patients with CIMP-low or CIMP-0 tumors were in stage IV than those with CIMP-high tumors (15.9% vs. 8.7%). In the multivariate analysis, the prognoses of CIMP-positive and CIMP-negative patients were similar.

4. Materials and Methods

After obtaining approval from the Institutional Review Board of Taipei Veterans General Hospital (2017-12-011CC), we obtained information on 92 patients who were diagnosed with MSI-high CRC from a database consisting of 1505 patients with CRC who received surgery at the hospital between 2000 and 2010. These 92 patients were confirmed to have no germline mutation in 5 major MMR genes (EPCAM, MLH1, MSH2, MSH6, and PMS2) by NGS and Sanger sequencing. This database prospectively collected clinical information including age, sex, personal and family medical histories, tumor location, and carcinoembryonic antigen level and pathological data including tumor, node, metastasis (TNM) stage, differentiation, mucinous histology, inflammation in the stroma, and lymphovascular invasion (LVI). Before data collection, informed consent was signed before the patients received surgery. This database did not include patients who died within 30 days of surgery, received preoperative chemoradiotherapy, or underwent emergent operations. The follow-up timeline was described as follows: patients were monitored every 3 months for the first 2 years and semiannually thereafter. The follow-up protocol included a physical examination, digital rectal examination, carcinoembryonic antigen analysis, chest radiography, abdominal sonogram, and computerized tomography, if needed. Proton emission tomography or magnetic resonance imaging was arranged for patients with elevated levels of carcinoembryonic antigen but an unknown site of tumor recurrence.

4.1. MSI Analysis

According to international criteria [4], the following five reference microsatellite markers were used to determine the MSI phenotype: D5S345, D2S123, BAT25, BAT26, and D17S250. DNA from the tumor and corresponding normal mucosa were amplified with polymerase chain reaction (PCR) [50,51]. The PCR products were genotyped on an ABI 3700 automated sequencer (Applied Biosystems, Foster City, CA, USA). Samples with ≥2 positive MSI markers were defined as MSI-high, and those with 0–1 positive MSI markers were defined as MSS.

4.2. Targeted NGS

We took advantage of the high-throughput Illumina HiSeq2500 system (Illumina Inc., San Diego, CA, USA) to comprehensively explore the DNA sequences of all exons of 5 well-known MMR genes (EPCAM, MLH1, MSH2, MSH6, and PMS2) and another 17 common CRC-associated genes (APC, AXIN1, AXIN2, BAX, BRAF, CTNNB1, EXO1, FBXW7, KRAS, NRAS, MSH3, PIK3CA, PMS1, POLD1, POLE, SMAD4, and TP53) (selected from a previous study and the COSMIC database) [40,52]. A total of 100 ng of DNA from each individual was used to construct a sample library using the Roche KAPA Library Preparation Kit (KAPA Biosystems, Wilmington, MA, USA). Each DNA was fragmented and then used to prepare the DNA library by performing end-repair, a-overhang addition, adaptor ligation, and size selection (150~350 bp). The target DNAs of the DNA repair-related genes were enriched using probe-based methods. The probes were synthesized by Integrated DNA Technologies (Coralville, IA, USA) according to our previously designed probe sequences, and the capture procedure was performed following IDT guidelines. After probe-based enrichment, the library of each pool was amplified with 14 cycles. The amplified libraries were quantified using a qPCR system and pooled into a new 1.5 mL tube as a 10nM pooled DNA library. The final pool was used for sequencing (Illumina HiSeq2500 sequencer, 2 × 100 bp). The raw output of each individual was 250 Mb, and the average depth of the target region was >1000X. The sequence of each read was trimmed based on the quality score (Q30), and the length of each read less than 45 bp was discarded in the subsequent analysis. Reads were aligned to the human hg19 reference genome using BWA-MEM (http://bio-bwa.sourceforge.net/), and GATK Unifiedgenotyper program (GATK Lite version 2.3–9; https://gatk.broadinstitute.org/hc/en-us) [53] was used to call variants. After variant calling, we used Variant Effect Predictor (http://grch37.ensembl.org/Homo_sapiens/Tools/VEP) [54] to annotate the identified variants for the subsequent statistical analysis. The mean read depths were 2404.2 ± 1457.7 and 4119.4 ± 2991.1 in the germline and somatic mutation analyses, respectively.

4.3. Sanger Sequencing

To detect germline mutations in EPCAM, MLH1, MSH2, MSH6, and PMS2, DNA obtained from the blood was amplified and sequenced with primers used in previous studies [55,56,57]. Sequencing of these five MMR genes covered their exons and the intronic regions adjacent to all splice sites. Briefly, the extracted DNA was amplified selectively by PCR in a DNA thermocycler. A negative control containing no DNA template was included for each PCR amplification round. The PCR products were analyzed on an automated sequencer (ABI Prism 3100 Genetic Analyzer; Perkin Elmer Applied Biosystems, Waltham, MA, USA). Each sample was sequenced on both the sense and antisense strands. Each mutation was confirmed by a second sequencing procedure on new PCR products. By comparing the obtained sequence with the known sequence, nonsense, missense, and frameshift mutations were identified. Nonsense and frameshift mutations were considered pathogenic. Because missense changes in MMR genes do not necessarily affect the function of the protein, we considered a missense mutation in an MMR gene without abnormal protein expression [58,59].

4.4. CIMP Analysis

DNA samples of tumor tissues were bisulfite-converted using the EpiTect Fast Bisulfite Conversion Kit (Qiagen, Valencia, CA, USA). The converted DNA samples were analyzed for their methylation status of eight CIMP target genes (CACNA1G, CDKN2A (P16), CRABP1, IGF2, MLH1, NEUROG1, RUNX3, and SOCS1) and ALU markers using methylation-specific real-time quantitative PCR technology. The DNA methylation status of each examined marker was quantified and is reported as the percent of the methylated reference (PMR), which was proposed in a previous study [4,60]. The PMR represents 100 × ((methylated reaction/ALU) sample/(methylated reaction/ALU) reference). A CpG island locus was considered methylated when an exponential amplification curve was present and the PMR value was >4. Each tumor was classified as CIMP-high, CIMP-low, or CIMP-0 if it exhibited methylation of >4 markers, 1–4 markers, or no marker, respectively.

4.5. Statistical Analysis

The statistical endpoint for disease-free survival (DFS) and overall survival (OS) was measured from the date of surgery until the date the patient experienced tumor recurrence or died from any cause. Patients with an unknown survival status were censored on the date of their last follow-up. Kaplan–Meier survival curves were plotted and compared using the log-rank test. The impact of the molecular and clinicopathological features on OS was assessed using univariate analysis. The covariates significantly associated with OS by univariate analysis were included in the multivariate Cox regression analysis. Chi-squared and two-tailed Fisher’s exact tests were used to compare the genotype frequency of clinicopathological features. Numerical values were compared using Student’s t-test. Data are expressed as the mean ± standard deviation. Statistical significance was defined as p < 0.05. Statistical analyses were performed using IBM SPSS Statistics 25.0 (IBM Corp., Armonk, NY, USA).

5. Conclusions

Only TNM stage was a statistically significant predictor of outcomes independent of CIMP profiles in MSI-high CRC patients. Sporadic MSI-high CRCs with different mechanisms of carcinogenesis have specific mutation profiles and clinicopathological features.

Supplementary Materials

The following are available online at https://www.mdpi.com/2072-6694/12/11/3487/s1, Table S1: The MMR immunohistochemical status for each protein, methylation status for each CIMP marker, and mutation status of MMR genes stratified by CIMP status in MSI-H CRC.

Author Contributions

Conceptualization, S.-C.C., P.-C.L., A.F.-Y.L., C.-C.L., H.-H.L., S.-C.H., C.-H.L., W.-Y.L., W.-S.C., J.-K.J., J.-K.L., S.-H.Y., and Y.-T.L.; data curation: C.-H.L.; formal analysis: S.-C.C. and Y.-T.L.; funding acquisition: S.-C.C. and P.-C.L.; investigation: C.-H.L.; methodology: C.-H.L.; writing—original draft: S.-C.C. and Y.-T.L.; writing—review and editing: S.-C.C. and Y.-T.L. All authors have read and agreed to the published version of the manuscript.

Funding

This study was supported by the Taipei Veterans General Hospital (V105C-043, V106C-027, V107C-004), Ministry of Science and Technology, Taiwan (105-2314-B-075-010-MY2), and Taipei City Hospital (10601-62-059,10701-62-050). The funding body did not play role in the design of the study and collection, analysis, and interpretation of data and in writing the manuscript.

Conflicts of Interest

All authors declare that they have no conflicts of interests.

Abbreviations

CRCColorectal Cancer
MSIMicrosatellite Instability
MSSMicrosatellite Stable
MMRMismatch Repair
LSLynch syndrome
CIMPCpG Island Methylation Phenotype
NGSNext-Generation Sequencing
LVILymphovascular Invasion
PCRPolymerase Chain Reaction
PMRPercent Of The Methylated Reference
OSOverall Survival
DFSDisease-Free Survival
TNMTumor, Node, Metastasis
TCGAThe Cancer Genome Atlas
ICGCInternational Cancer Genome Consortium

References

  1. Fearon, E.R.; Vogelstein, B. A genetic model for colorectal tumorigenesis. Cell 1990, 61, 759–767. [Google Scholar] [CrossRef]
  2. Vogelstein, B.; Fearon, E.R.; Hamilton, S.R.; Kern, S.E.; Preisinger, A.C.; Leppert, M.; Smits, A.M.; Bos, J.L. Genetic Alterations during Colorectal-Tumor Development. N. Engl. J. Med. 1988, 319, 525–532. [Google Scholar] [CrossRef] [PubMed] [Green Version]
  3. Cunningham, J.M.; Kim, C.-Y.; Christensen, E.R.; Tester, D.J.; Parc, Y.; Burgart, L.J.; Halling, K.C.; McDonnell, S.K.; Schaid, D.J.; Vockley, C.W.; et al. The Frequency of Hereditary Defective Mismatch Repair in a Prospective Series of Unselected Colorectal Carcinomas. Am. J. Hum. Genet. 2001, 69, 780–790. [Google Scholar] [CrossRef] [PubMed] [Green Version]
  4. Boland, C.R.; Thibodeau, S.N.; Hamilton, S.R.; Sidransky, D.; Eshleman, J.R.; Burt, R.W.; Meltzer, S.J.; A Rodriguez-Bigas, M.; Fodde, R.; Ranzani, G.N.; et al. A National Cancer Institute Workshop on Microsatellite Instability for cancer detection and familial predisposition: Development of international criteria for the determination of microsatellite instability in colorectal cancer. Cancer Res. 1998, 58, 5248–5257. [Google Scholar] [PubMed]
  5. Haraldsdottir, S.; Hampel, H.; Tomsic, J.; Frankel, W.L.; Pearlman, R.; De La Chapelle, A.; Pritchard, C.C. Colon and Endometrial Cancers With Mismatch Repair Deficiency Can Arise From Somatic, Rather Than Germline, Mutations. Gastroenterology 2014, 147, 1308–1316.e1. [Google Scholar] [CrossRef] [PubMed] [Green Version]
  6. Mensenkamp, A.R.; Vogelaar, I.P.; Van Zelst–Stams, W.A.; Goossens, M.; Ouchene, H.; Hendriks–Cornelissen, S.J.; Kwint, M.P.; Hoogerbrugge, N.; Nagtegaal, I.D.; Ligtenberg, M.J. Somatic Mutations in MLH1 and MSH2 Are a Frequent Cause of Mismatch-Repair Deficiency in Lynch Syndrome-Like Tumors. Gastroenterology 2014, 146, 643–646.e8. [Google Scholar] [CrossRef]
  7. Provenzale, D.; Gupta, S.; Ahnen, D.J.; Bray, T.; Cannon, J.A.; Cooper, G.; David, D.S.; Early, D.S.; Erwin, D.; Ford, J.M.; et al. Genetic/Familial High-Risk Assessment: Colorectal Version 1.2016, NCCN Clinical Practice Guidelines in Oncology. J. Natl. Compr. Cancer Netw. 2016, 14, 1010–1030. [Google Scholar] [CrossRef]
  8. Sekine, S.; Ogawa, R.; Saito, S.; Ushiama, M.; Shida, D.; Nakajima, T.; Taniguchi, H.; Hiraoka, N.; Yoshida, T.; Sugano, K. Cytoplasmic MSH2 immunoreactivity in a patient with Lynch syndrome with anEPCAM-MSH2fusion. Histopathology 2017, 70, 664–669. [Google Scholar] [CrossRef]
  9. Ponti, G.; Castellsagueé, E.; Ruini, C.; Percesepe, A.; Tomasi, A. Mismatch repair genes founder mutations and cancer susceptibility in Lynch syndrome. Clin. Genet. 2015, 87, 507–516. [Google Scholar] [CrossRef] [Green Version]
  10. Liu, D.; Keijzers, G.; Rasmussen, K.J.R. DNA mismatch repair and its many roles in eukaryotic cells. Mutat. Res. 2017, 773, 174–187. [Google Scholar] [CrossRef]
  11. Toyota, M.; Ahuja, N.; Ohe-Toyota, M.; Herman, J.G.; Baylin, S.B.; Issa, J.-P.J. CpG island methylator phenotype in colorectal cancer. Proc. Natl. Acad. Sci. USA 1999, 96, 8681–8686. [Google Scholar] [CrossRef] [PubMed] [Green Version]
  12. Issa, J.-P. CpG island methylator phenotype in cancer. Nat. Rev. Cancer 2004, 4, 988–993. [Google Scholar] [CrossRef] [PubMed]
  13. Kondo, Y.; Issa, J.-P.J. Epigenetic changes in colorectal cancer. Cancer Metastasis Rev. 2004, 23, 29–39. [Google Scholar] [CrossRef] [PubMed]
  14. Ogino, S.; Nosho, K.; Kirkner, G.J.; Kawasaki, T.; Meyerhardt, J.A.; Loda, M.; Giovannucci, E.L.; Fuchs, C.S. CpG island methylator phenotype, microsatellite instability, BRAF mutation and clinical outcome in colon cancer. Gut 2009, 58, 90–96. [Google Scholar] [CrossRef] [Green Version]
  15. Simons, C.C.J.M.; Hughes, L.A.E.; Smits, K.M.; Bakker, C.A.K.-D.; De Bruïne, A.P.; Carvalho, B.; Meijer, G.A.; Schouten, L.J.; Brandt, P.A.V.D.; Weijenberg, M.P.; et al. A novel classification of colorectal tumors based on microsatellite instability, the CpG island methylator phenotype and chromosomal instability: Implications for prognosis. Ann. Oncol. 2013, 24, 2048–2056. [Google Scholar] [CrossRef]
  16. Nagasaka, T.; Koi, M.; Kloor, M.; Gebert, J.; Vilkin, A.; Nishida, N.; Shin, S.K.; Sasamoto, H.; Tanaka, N.; Matsubara, N.; et al. Mutations in Both KRAS and BRAF May Contribute to the Methylator Phenotype in Colon Cancer. Gastroenterology 2008, 134, 1950–1960.e1. [Google Scholar] [CrossRef] [Green Version]
  17. Weisenberger, D.J.; Siegmund, K.D.; Campan, M.; Young, J.; I Long, T.; A Faasse, M.; Kang, G.H.; Widschwendter, M.; Weener, D.; Buchanan, D.; et al. CpG island methylator phenotype underlies sporadic microsatellite instability and is tightly associated with BRAF mutation in colorectal cancer. Nat. Genet. 2006, 38, 787–793. [Google Scholar] [CrossRef]
  18. Boissière-Michot, F.; Frugier, H.; Ho-Pun-Cheung, A.; Lopez-Crapez, E.; Duffour, J.; Bibeau, F. Immunohistochemical staining for p16 and BRAFV600E is useful to distinguish between sporadic and hereditary (Lynch syndrome-related) microsatellite instable colorectal carcinomas. Virchows Archiv 2016, 469, 135–144. [Google Scholar] [CrossRef]
  19. Capper, D.; Voigt, A.Y.; Bozukova, G.; Ahadova, A.; Kickingereder, P.; Von Deimling, A.; Doeberitz, M.V.K.; Kloor, M. BRAF V600E-specific immunohistochemistry for the exclusion of Lynch syndrome in MSI-H colorectal cancer. Int. J. Cancer 2013, 133, 1624–1630. [Google Scholar] [CrossRef]
  20. Lagerstedt-Robinson, K.; Liu, T.; Vandrovcova, J.; Halvarsson, B.; Clendenning, M.; Frebourg, T.; Papadopoulos, N.; Kinzler, K.W.; Vogelstein, B.; Peltomäki, P.; et al. Lynch Syndrome (Hereditary Nonpolyposis Colorectal Cancer) Diagnostics. J. Natl. Cancer Inst. 2007, 99, 291–299. [Google Scholar] [CrossRef]
  21. Baylin, S.B.; Herman, J.G. DNA hypermethylation in tumorigenesis: Epigenetics joins genetics. Trends Genet. 2000, 16, 168–174. [Google Scholar] [CrossRef]
  22. Issa, J.P.; Baylin, S.B.; A Belinsky, S. Methylation of the estrogen receptor CpG island in lung tumors is related to the specific type of carcinogen exposure. Cancer Res. 1996, 56, 3655–3658. [Google Scholar] [PubMed]
  23. Issa, J.-P.J.; Ahuja, N.; Toyota, M.; Bronner, M.P.; A Brentnall, T. Accelerated age-related CpG island methylation in ulcerative colitis. Cancer Res. 2001, 61, 3573–3577. [Google Scholar] [PubMed]
  24. Weisenberger, D.J.; Levine, A.J.; Long, T.I.; Buchanan, D.D.; Walters, R.; Clendenning, M.; Rosty, C.; Joshi, A.D.; Stern, M.C.; Le Marchand, L.; et al. Association of the Colorectal CpG Island Methylator Phenotype with Molecular Features, Risk Factors, and Family History. Cancer Epidemiol. Biomark. Prev. 2015, 24, 512–519. [Google Scholar] [CrossRef] [Green Version]
  25. Deng, G.; Nguyen, A.; Tanaka, H.; Matsuzaki, K.; Bell, I.; Mehta, K.R.; Terdiman, J.P.; Waldman, F.M.; Kakar, S.; Gum, J.; et al. Regional hypermethylation and global hypomethylation are associated with altered chromatin conformation and histone acetylation in colorectal cancer. Int. J. Cancer 2006, 118, 2999–3005. [Google Scholar] [CrossRef]
  26. Ogino, S.; Brahmandam, M.; Cantor, M.; Namgyal, C.; Kawasaki, T.; Kirkner, G.J.; A Meyerhardt, J.; Loda, M.; Fuchs, C.S. Distinct molecular features of colorectal carcinoma with signet ring cell component and colorectal carcinoma with mucinous component. Mod. Pathol. 2005, 19, 59–68. [Google Scholar] [CrossRef]
  27. Ogino, S.; Kawasaki, T.; Kirkner, G.J.; Loda, M.; Fuchs, C.S. CpG Island Methylator Phenotype-Low (CIMP-Low) in Colorectal Cancer: Possible Associations with Male Sex and KRAS Mutations. J. Mol. Diagn. 2006, 8, 582–588. [Google Scholar] [CrossRef] [Green Version]
  28. Shen, L.; Toyota, M.; Kondo, Y.; Lin, E.; Zhang, L.; Guo, Y.; Hernandez, N.S.; Chen, X.; Ahmed, S.; Konishi, K.; et al. Integrated genetic and epigenetic analysis identifies three different subclasses of colon cancer. Proc. Natl. Acad. Sci. USA 2007, 104, 18654–18659. [Google Scholar] [CrossRef] [Green Version]
  29. Yagi, K.; Akagi, K.; Hayashi, H.; Nagae, G.; Tsuji, S.; Isagawa, T.; Midorikawa, Y.; Nishimura, Y.; Sakamoto, H.; Seto, Y.; et al. Three DNA Methylation Epigenotypes in Human Colorectal Cancer. Clin. Cancer Res. 2009, 16, 21–33. [Google Scholar] [CrossRef] [Green Version]
  30. Hinoue, T.; Weisenberger, D.J.; Lange, C.P.; Shen, H.; Byun, H.-M.; Berg, D.V.D.; Malik, S.; Pan, F.; Noushmehr, H.; Van Dijk, C.M.; et al. Genome-scale analysis of aberrant DNA methylation in colorectal cancer. Genome Res. 2012, 22, 271–282. [Google Scholar] [CrossRef] [Green Version]
  31. Ogino, S.; Kawasaki, T.; Kirkner, G.J.; Kraft, P.; Loda, M.; Fuchs, C.S. Evaluation of Markers for CpG Island Methylator Phenotype (CIMP) in Colorectal Cancer by a Large Population-Based Sample. J. Mol. Diagn. 2007, 9, 305–314. [Google Scholar] [CrossRef] [PubMed] [Green Version]
  32. Veigl, M.L.; Kasturi, L.; Olechnowicz, J.; Ma, A.; Lutterbaugh, J.D.; Periyasamy, S.; Li, G.-M.; Drummond, J.; Modrich, P.L.; Sedwick, W.D.; et al. Biallelic inactivation of hMLH1 by epigenetic gene silencing, a novel mechanism causing human MSI cancers. Proc. Natl. Acad. Sci. USA 1998, 95, 8698–8702. [Google Scholar] [CrossRef] [PubMed] [Green Version]
  33. Arnold, C.N.; Goel, A.; Boland, C.R. Role of hMLH1 promoter hypermethylation in drug resistance to 5-fluorouracil in colorectal cancer cell lines. Int. J. Cancer 2003, 106, 66–73. [Google Scholar] [CrossRef] [PubMed]
  34. Steele, N.; Finn, P.W.; Brown, R.C.; A Plumb, J. Combined inhibition of DNA methylation and histone acetylation enhances gene re-expression and drug sensitivity in vivo. Br. J. Cancer 2009, 100, 758–763. [Google Scholar] [CrossRef] [PubMed] [Green Version]
  35. Geurts-Giele, W.R.R.; Leenen, C.H.M.; Dubbink, H.J.; Meijssen, I.C.; Post, E.; Sleddens, H.F.B.M.; Kuipers, E.J.; Goverde, A.; Ouweland, A.M.W.V.D.; Van Lier, M.G.F.; et al. Somatic aberrations of mismatch repair genes as a cause of microsatellite-unstable cancers. J. Pathol. 2014, 234, 548–559. [Google Scholar] [CrossRef]
  36. Kim, J.H.; Bae, J.M.; Cho, N.-Y.; Kang, G.H. Distinct features between MLH1-methylated and unmethylated colorectal carcinomas with the CpG island methylator phenotype: Implications in the serrated neoplasia pathway. Oncotarget 2016, 7, 14095–14111. [Google Scholar] [CrossRef] [Green Version]
  37. Richman, S. Deficient mismatch repair: Read all about it (Review). Int. J. Oncol. 2015, 47, 1189–1202. [Google Scholar] [CrossRef] [Green Version]
  38. Advani, S.M.; Advani, P.; DeSantis, S.M.; Brown, D.; VonVille, H.M.; Lam, M.; Loree, J.M.; Sarshekeh, A.M.; Bressler, J.; Lopez, D.S.; et al. Clinical, Pathological, and Molecular Characteristics of CpG Island Methylator Phenotype in Colorectal Cancer: A Systematic Review and Meta-analysis. Transl. Oncol. 2018, 11, 1188–1201. [Google Scholar] [CrossRef]
  39. Donehower, L.A.; Creighton, C.J.; Schultz, N.; Shinbrot, E.; Chang, K.; Gunaratne, P.H.; Muzny, N.; Sander, C.; Hamilton, S.R.; Gibbs, R.A.; et al. MLH1-Silenced and Non-Silenced Subgroups of Hypermutated Colorectal Carcinomas Have Distinct Mutational Landscapes. J. Pathol. 2013, 229, 99–110. [Google Scholar] [CrossRef] [Green Version]
  40. Network, T.C.G.A. Comprehensive molecular characterization of human colon and rectal cancer. Nat. Cell Biol. 2012, 487, 330–337. [Google Scholar] [CrossRef] [Green Version]
  41. Tahara, T.; Yamamoto, E.; Madireddi, P.; Suzuki, H.; Maruyama, R.; Chung, W.; Garriga, J.; Jelinek, J.; Yamano, H.-O.; Sugai, T.; et al. Colorectal Carcinomas With CpG Island Methylator Phenotype 1 Frequently Contain Mutations in Chromatin Regulators. Gastroenterology 2014, 146, 530–538.e5. [Google Scholar] [CrossRef] [PubMed] [Green Version]
  42. Bettington, M.; Walker, N.; Rosty, C.; Brown, I.; Clouston, A.; Wockner, L.; Whitehall, V.; Leggett, B. Critical Appraisal of the Diagnosis of the Sessile Serrated Adenoma. Am. J. Surg. Pathol. 2014, 38, 158–166. [Google Scholar] [CrossRef] [PubMed]
  43. Rosty, C.; Young, J.P.; Walsh, M.D.; Clendenning, M.; Sanderson, K.; Walters, R.J.; Parry, S.; A Jenkins, M.; Win, A.K.; Southey, M.C.; et al. PIK3CA Activating Mutation in Colorectal Carcinoma: Associations with Molecular Features and Survival. PLoS ONE 2013, 8, e65479. [Google Scholar] [CrossRef] [PubMed] [Green Version]
  44. Ehrlich, M.; Norris, K.F.; Wang, R.Y.; Kuo, K.C.; Gehrke, C.W. DNA cytosine methylation and heat-induced deamination. Biosci. Rep. 1986, 6, 387–393. [Google Scholar] [CrossRef]
  45. Alexandrov, L.B.; Initiative, A.P.C.G.; Nik-Zainal, S.; Wedge, D.C.; Aparicio, S.A.J.R.; Behjati, S.; Biankin, A.V.; Bignell, G.R.; Bolli, N.; Borg, A.; et al. Signatures of mutational processes in human cancer. Nature 2013, 500, 415–421. [Google Scholar] [CrossRef] [Green Version]
  46. Poulos, R.C.; Olivier, J.; Wong, J.W. The interaction between cytosine methylation and processes of DNA replication and repair shape the mutational landscape of cancer genomes. Nucleic Acids Res. 2017, 45, 7786–7795. [Google Scholar] [CrossRef]
  47. Bardeesy, N.; Cheng, K.-H.; Berger, J.H.; Chu, G.C.; Pahler, J.; Olson, P.; Hezel, A.F.; Horner, J.; Lauwers, G.Y.; Hanahan, D.; et al. Smad4 is dispensable for normal pancreas development yet critical in progression and tumor biology of pancreas cancer. Genes Dev. 2006, 20, 3130–3146. [Google Scholar] [CrossRef] [Green Version]
  48. Kojima, K.; Vickers, S.M.; Adsay, N.V.; Jhala, N.C.; Kim, H.-G.; Schoeb, T.R.; Grizzle, W.E.; Klug, C.A. Inactivation of Smad4 Accelerates KrasG12D-Mediated Pancreatic Neoplasia. Cancer Res. 2007, 67, 8121–8130. [Google Scholar] [CrossRef] [Green Version]
  49. Izeradjene, K.; Combs, C.; Best, M.; Gopinathan, A.; Wagner, A.; Grady, W.M.; Deng, C.X.; Hruban, R.H.; Adsay, N.V.; Tuveson, D.A.; et al. Kras(G12D) and Smad4/Dpc4 haploinsufficiency cooperate to induce mucinous cystic neoplasms and invasive adenocarcinoma of the pancreas. Cancer Cell 2007, 11, 229–243. [Google Scholar] [CrossRef] [Green Version]
  50. Lin, J.-K.; Chang, S.-C.; Yang, Y.-C.; Li, A.F.-Y. Loss of heterozygosity and DNA aneuploidy in colorectal adenocarcinoma. Ann. Surg. Oncol. 2003, 10, 1086–1094. [Google Scholar] [CrossRef]
  51. Chang, S.-C.; Lin, J.-K.; Yang, S.H.; Wang, H.-S.; Li, A.F.-Y.; Chi, C.-W. Relationship between genetic alterations and prognosis in sporadic colorectal cancer. Int. J. Cancer 2006, 118, 1721–1727. [Google Scholar] [CrossRef] [PubMed]
  52. Catalogue of Somatic Mutations in Cancer. Available online: https://cancer.sanger.ac.uk/cosmic (accessed on 28 January 2019).
  53. DePristo, M.A.; Banks, E.; Poplin, R.; Garimella, K.V.; Maguire, J.R.; Hartl, C.; Philippakis, A.A.; del Angel, G.; Rivas, M.A.; Hanna, M.; et al. A framework for variation discovery and genotyping using next-generation DNA sequencing data. Nat. Genet. 2011, 43, 491–498. [Google Scholar] [CrossRef] [PubMed]
  54. McLaren, W.; Gil, L.; Hunt, S.E.; Riat, H.S.; Ritchie, G.R.S.; Thormann, A.; Flicek, P.; Cunningham, F. The Ensembl Variant Effect Predictor. Genome Biol. 2016, 17, 122. [Google Scholar] [CrossRef] [Green Version]
  55. Aaltonen, L.A.; Salovaara, R.; Kristo, P.; Canzian, F.; Hemminki, A.; Peltomäki, P.; Chadwick, R.B.; Kääriäinen, H.; Eskelinen, M.; Järvinen, H.; et al. Incidence of Hereditary Nonpolyposis Colorectal Cancer and the Feasibility of Molecular Screening for the Disease. N. Engl. J. Med. 1998, 338, 1481–1487. [Google Scholar] [CrossRef] [PubMed]
  56. Chadwick, R.B.; Pyatt, R.E.; Niemann, T.H.; Richards, S.K.; Johnson, C.K.; Stevens, M.W.; Meek, J.E.; Hampel, H.; Prior, T.W.; de la Chapelle, A. Hereditary and somatic DNA mismatch repair gene mutations in sporadic endometrial carcinoma. J. Med. Genet. 2001, 38, 461–466. [Google Scholar] [CrossRef] [PubMed] [Green Version]
  57. Rumilla, K.; Schowalter, K.V.; Lindor, N.M.; Thomas, B.C.; Mensink, K.A.; Gallinger, S.; Holter, S.; Newcomb, P.A.; Potter, J.D.; Jenkins, M.A.; et al. Frequency of Deletions of EPCAM (TACSTD1) in MSH2-Associated Lynch Syndrome Cases. J. Mol. Diagn. 2011, 13, 93–99. [Google Scholar] [CrossRef] [PubMed]
  58. Cotton, R.G.; Scriver, C.R. Proof of “disease causing” mutation. Hum. Mutat. 1998, 12, 1–3. [Google Scholar] [CrossRef]
  59. Samowitz, W.S.; Curtin, K.; Lin, H.H.; Robertson, M.A.; Schaffer, D.; Nichols, M.; Gruenthal, K.; Leppert, M.F.; Slattery, M.L. The colon cancer burden of genetically defined hereditary nonpolyposis colon cancer. Gastroenterology 2001, 121, 830–838. [Google Scholar] [CrossRef]
  60. Kim, J.H.; Rhee, Y.-Y.; Bae, J.-M.; Kwon, H.-J.; Cho, N.-Y.; Kim, M.J.; Kang, G.H. Subsets of microsatellite-unstable colorectal cancers exhibit discordance between the CpG island methylator phenotype and MLH1 methylation status. Mod. Pathol. 2013, 26, 1013–1022. [Google Scholar] [CrossRef] [Green Version]
Figure 1. The mutational profiles in microsatellite instability (MSI)-high colorectal cancer (CRC) with 5′-C-phosphate-G-3′ island methylator phenotype CIMP-high, CIMP-low, and CIMP-0 CRCs. Green field: genetic mutation (−); red field: genetic mutation (+); white field: MMR mutation (−) or CIMP−; black field: MMR mutation (+) or CIMP+; blue field: rate of genetic mutation.
Cancers 12 03487 g001
Figure 2. The mutational profiles in MSI-high CRC according to the cause of MSI-high. (A) MSI-high CRC with MLH1 methylation, (B) MSI-high CRC with MMR mutation, (C) MSI-high CRC with no obvious cause for MSI-high. Green field: genetic mutation (−); red field: genetic mutation (+); white field: no MMR mutation or CIMP−; black field: MMR mutation or CIMP+.
Cancers 12 03487 g002
Table 1. Clinicopathological features of microsatellite instability (MSI)-high colorectal cancers (CRC) classified by 5’-C-phosphate-G-3’ island methylator phenotype (CIMP) status.
VariablesTotal Patients
n = 92
n (%)
CIMP-0
n = 25
n (%)
CIMP-Low
n = 44
n (%)
CIMP-High
n = 23
n (%)
p Value
Age69.0 ± 14.668.0 ± 15.268.4 ± 15.771.3 ± 12.10.690
Gender
Male49 (53.2)18 (72.0)25 (56.8)6 (26.1)0.005
Female43 (57.6)7 (28.0)19 (43.2)17 (73.9)
Location
Proximal colon45 (48.9)9 (36.0)17 (38.6)19 (82.6)0.002
Distal colon20 (21.7)7 (28.0)9 (20.5)4 (17.4)
Rectum27 (29.3)9 (36.0)8 (40.9)0
TNM stage
I11 (12.0)4 (16.0)4 (9.1)3 (13.0)0.415
II48 (52.2)15 (60.0)20 (45.5)13 (56.5)
III20 (21.7)5 (20.0)10 (22.7)5 (21.7)
IV13 (14.1)1 (4.0)10 (22.7)2 (8.7)
Lymphovascular invasion
Positive14 (15.2)5 (20.0)6 (13.6)3 (13.0)0.736
Negative78 (8.7)20 (80.0)38 (86.4)20 (87.0)
Cell Differentiation
Well/moderate77 (83.7)23 (92.0)39 (88.6)15 (65.2)0.020
Poor15 (16.3)2 (8.0)5 (11.4)8 (34.8)
Mucinous component
≥50%13 (14.1)3 (12.0)5 (11.4)5 (21.7)0.480
<50%79 (85.9)22 (88.0)39 (88.6)18 (78.3)
CIMP: 5’-C-phosphate-G-3’ islands methylation phenotype; TNM: tumor, node, metastasis; bold: statistically significant.
Table 2. Molecular signatures of MSI-high CRC classified by CIMP status.
Genetic MutationTotal Patients
n = 92
n (%)
CIMP-0
n = 25
n (%)
CIMP-Low
n = 44
n (%)
CIMP-High
n = 23
n (%)
p Value
APC40 (43.4)25 (100)12 (27.3)3 (13.0)<0.001
TP5341 (44.6)25 (100)14 (31.8)2 (8.7)<0.001
KRAS45 (48.9)15 (60.0)26 (59.1)4 (17.4)0.001
PIK3CA33 (35.9)3 (12.0)23 (52.3)7 (30.4)0.003
FBXW724 (26.1)2 (8.0)19 (43.2)3 (13.0)0.002
NRAS6 (7.5)4 (16.0)2 (4.5)00.062
CTNB113 (14.1)4 (16.0)3 (6.8)6 (26.1)0.094
BAX48 (52.2)13 (52.0)19 (43.2)16 (69.6)0.122
AXIN110 (10.9)1 (4.0)4 (9.1)5 (21.7)0.125
AXIN228 (30.4)6 (24.0)15 (34.1)7 (30.4)0.692
EXO112 (13.0)2 (8.0)5 (11.4)5 (21.7)0.332
POLE44 (47.8)11 (44.0)23 (52.3)10 (43.5)0.715
PMS176 (82.7)19 (76.0)36 (81.8)21 (91.3)0.370
BRAF21 (22.8)3 (12.0)4 (9.1)14 (60.9)<0.001
SMAD415 (16.3)1 (4.0)7 (15.9)7 (30.4)0.046
MSH324 (26.1)6 (24.0)6 (13.6)12 (52.2)0.003
POLD136 (39.1)6 (24.0)16 (36.4)14 (60.9)0.029
CIMP: 5’-C-phosphate-G-3’ islands methylation phenotype; bold: statistically significant.
Table 3. The clinicopathological features between CRC patients with and without mismatch repair (MMR) mutation.
VariablesMMR Mutation (+)
n = 64
n (%)
MMR Mutation (−)
n = 28
n (%)
p Value
Age (year)69.3 ± 14.968.4 ± 14.20.804
Gender
Male36 (56.3)13 (46.4)0.496
Female28 (43.8)15 (53.6)
Location
Proximal colon33 (51.6)12 (42.4)0.739
Distal colon13 (20.3)7 (20.3)
Rectum18 (28.1)9 (32.1)
TNM stage
I7 (10.9)4 (14.3)0.365
II37 (57.8)11 (39.3)
III13 (20.3)7 (25.0)
IV7 (10.9)6 (21.4)
Lymphovascular invasion
Positive7 (10.9)7 (25.0)0.115
Negative57 (89.1)21 (75.0)
Cell Differentiation
Well/moderate54 (84.4)23 (82.1)0.768
Poor10 (15.6)5 (17.9)
Mucinous component
≥50%13 (20.3)00.008
<50%51 (79.7)28 (100)
TNM: tumor, node, metastasis; MMR: mismatch repair; bold: statistically significant.
Table 4. The molecular signatures of MSI-high CRC classified by somatic MMR mutations.
Genetic MutationMMR Mutation (+)
n = 64
n (%)
MMR Mutation (−)
n = 28
n (%)
p Value
APC24 (37.5)16 (57.1)0.110
TP5328 (43.8)17 (60.7)0.265
KRAS41 (59.3)4 (17.4)0.175
BRAF11 (17.2)10 (35.7)0.063
SMAD411 (17.2)4 (14.3)1.000
MSH319 (29.7)5 (17.9)0.306
POLD130 (46.9)6 (21.4)0.036
CTNB111 (1.2)2 (7.1)0.330
BAX36 (56.3)12 (42.9)0.254
AXIN19 (14.2)1 (3.6)0.273
AXIN222 (34.4)6 (21.4)0.325
FBXW714 (21.9)10 (35.7)0.200
EXO110 (15.6)2 (7.1)0.333
NRAS4 (6.3)2 (7.1)1.000
POLE31 (48.4)13 (46.4)1.000
PIK3CA26 (40.6)7 (25.0)0.166
TGFBR264 (100)28 (100)1.000
PMS153 (82.8)23 (82.1)1.000
MMR: mismatch repair; bold: statistically significant.
Table 5. Univariate and multivariate analysis of factors affecting overall survival (OS) of CRC patients.
FactorsUnivariate AnalysisMultivariate Analysis
Hazard Ratio95% CIp ValueHazard Ratio95% CIp Value
TNM stage3.392.17–5.30<0.0014.222.245–7.923<0.001
LVI3.491.54–7.910.0032.300.927–5.6910.073
Mucinous histology0.440.13–1.470.182
Poor differentiation1.980.85–4.610.115
CIMP status0.990.44–2.220.982
Somatic MMR mutation0.690.33–1.440.320
Adjuvant chemotherapy2.801.36–5.760.0050.490.166–1.4450.196
CI: confidence interval; CIMP: CpG islands methylation phenotype; MMR: mismatch repair; LVI: lymphovascular invasion; bold: statistically significant
Publisher’s Note: MDPI stays neutral with regard to jurisdictional claims in published maps and institutional affiliations.

