Blockage of Store-Operated Ca2+ Influx by Synta66 is Mediated by Direct Inhibition of the Ca2+ Selective Orai1 Pore

 , , , , , , and
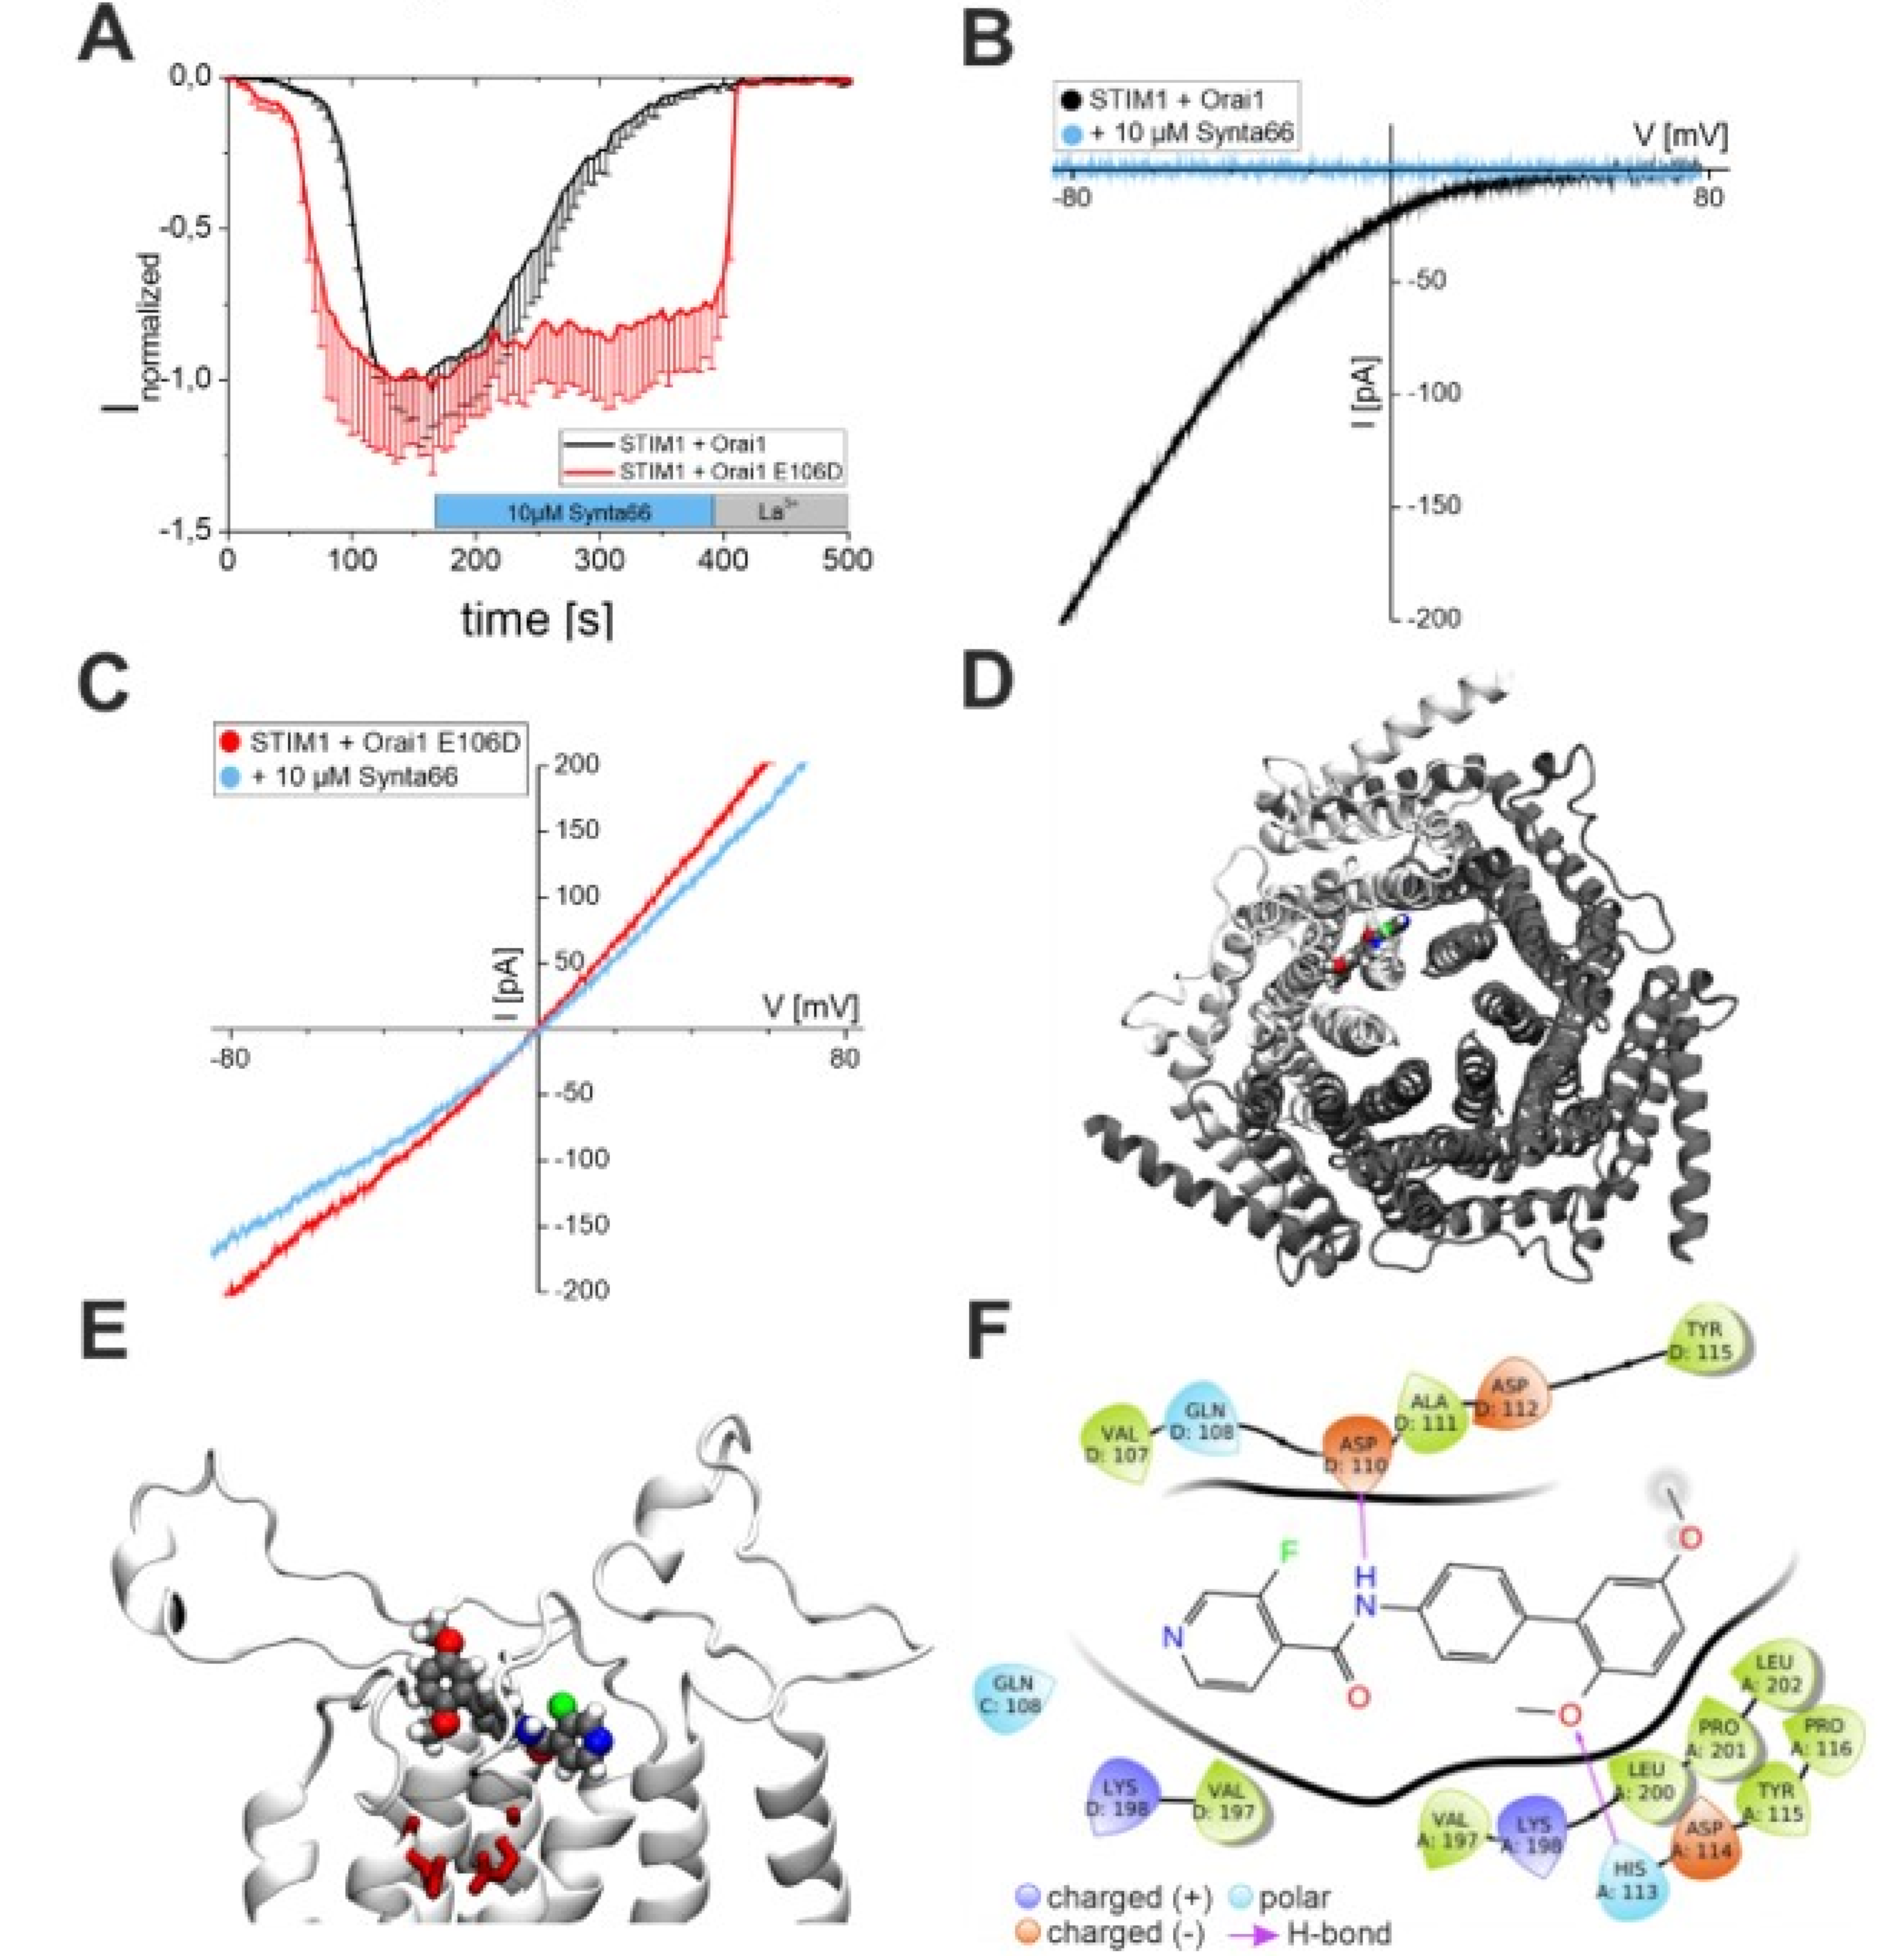
Abstract
:Simple Summary
Abstract
1. Introduction
2. Results
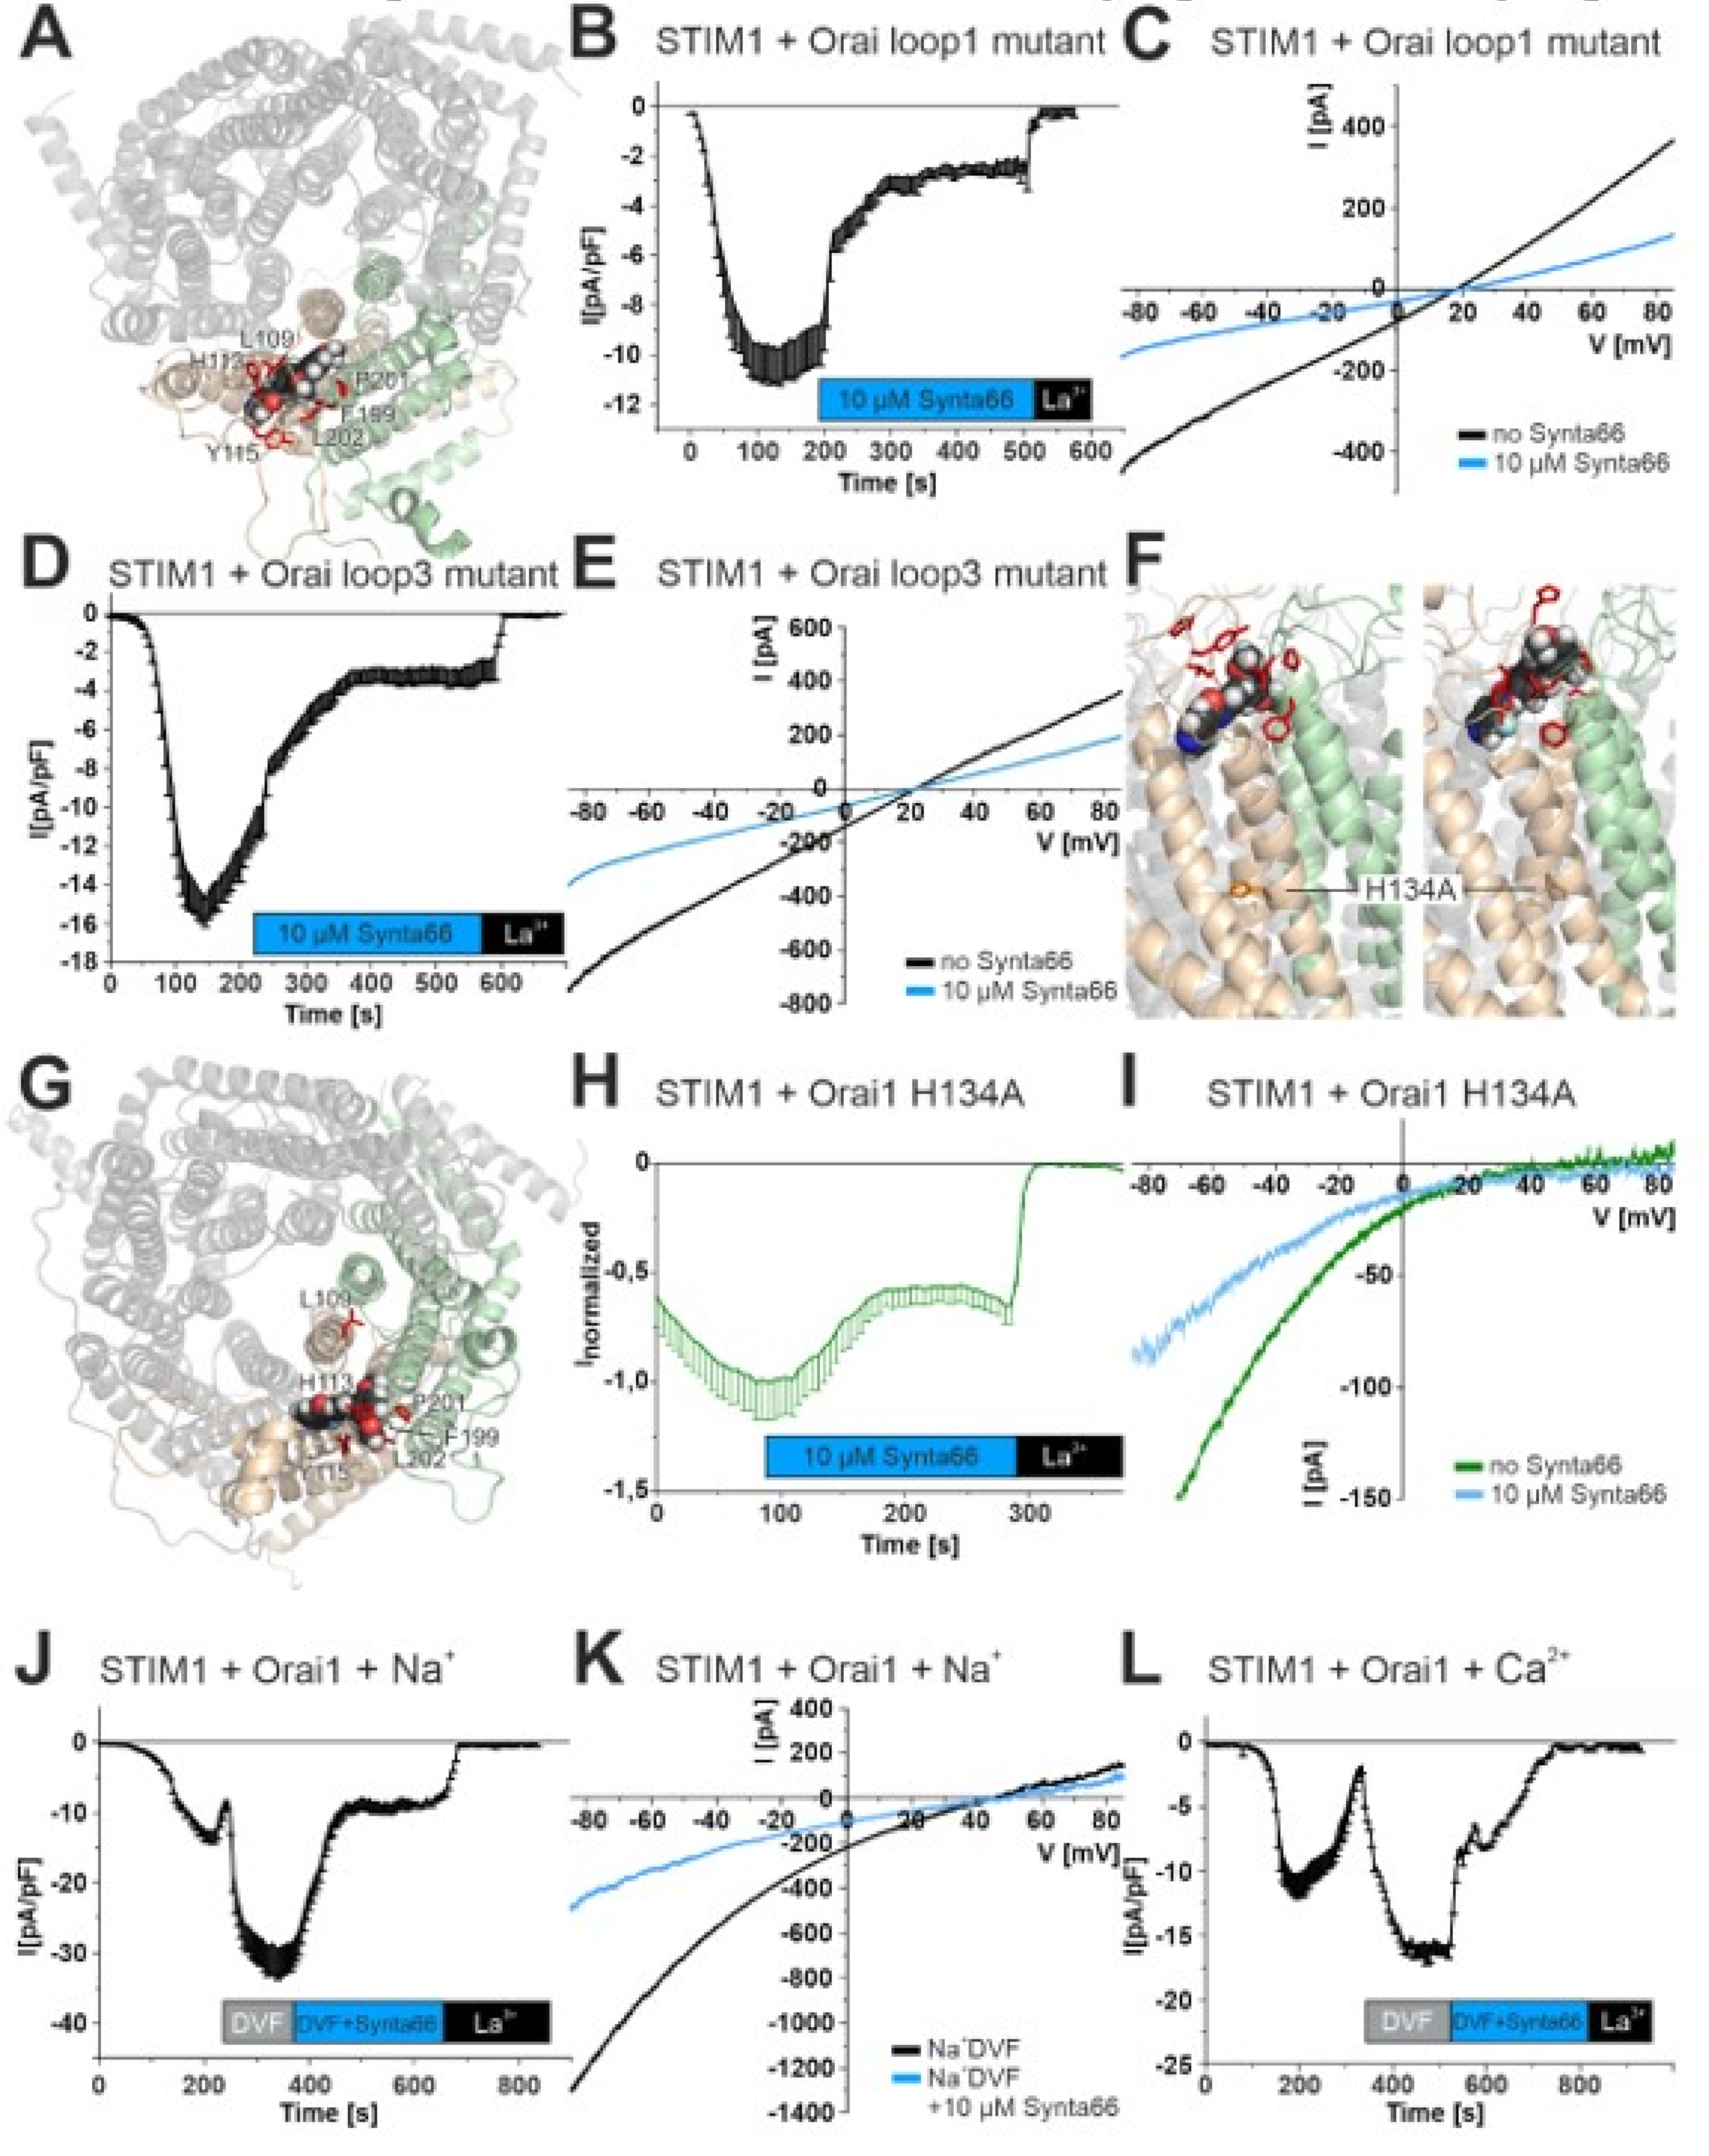
2.1. Synta66 is a Direct Blocker of the Orai1 Pore
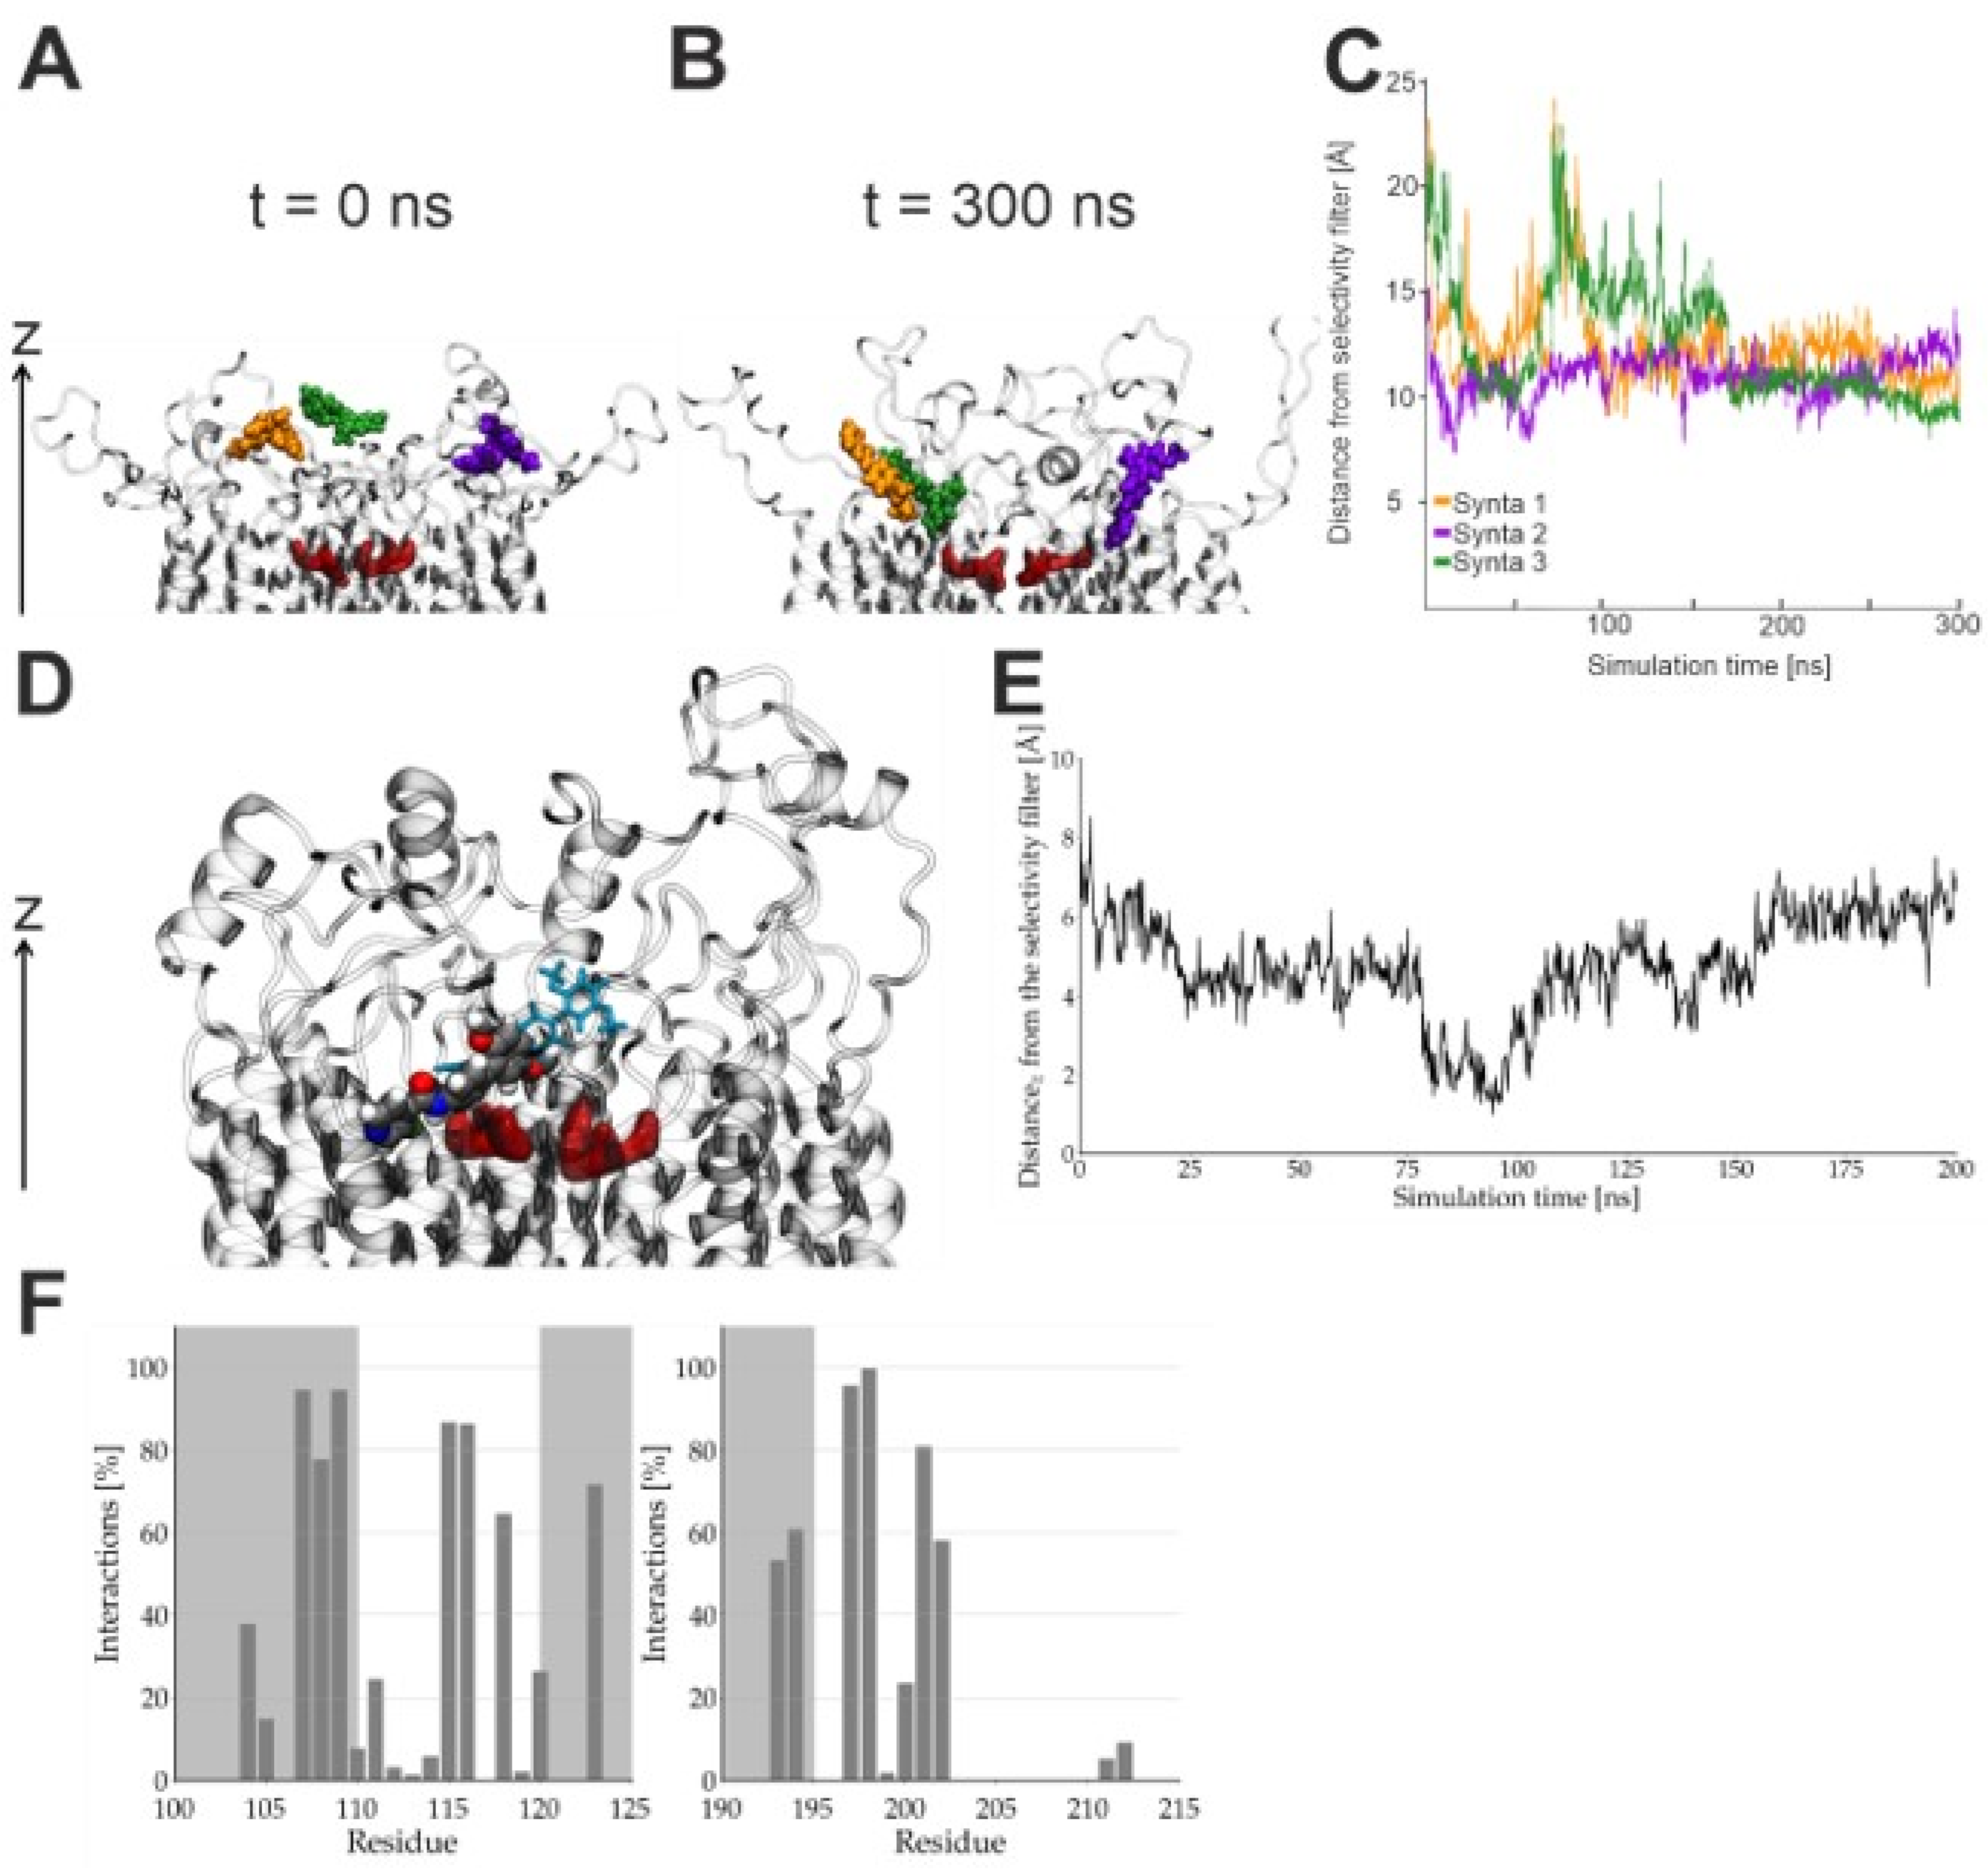
2.2. Synta66 Binds Close to the Selectivity Filter and Extracellular Loop Region
2.3. Inhibition of Orai1 Currents by Synta66 is Impaired by Ion Hydration
2.4. Effect of Synta66 on Orai1 Pore Hydration
2.5. Synta66 Does Not Affect STIM1 Di-/Oligo-Merization
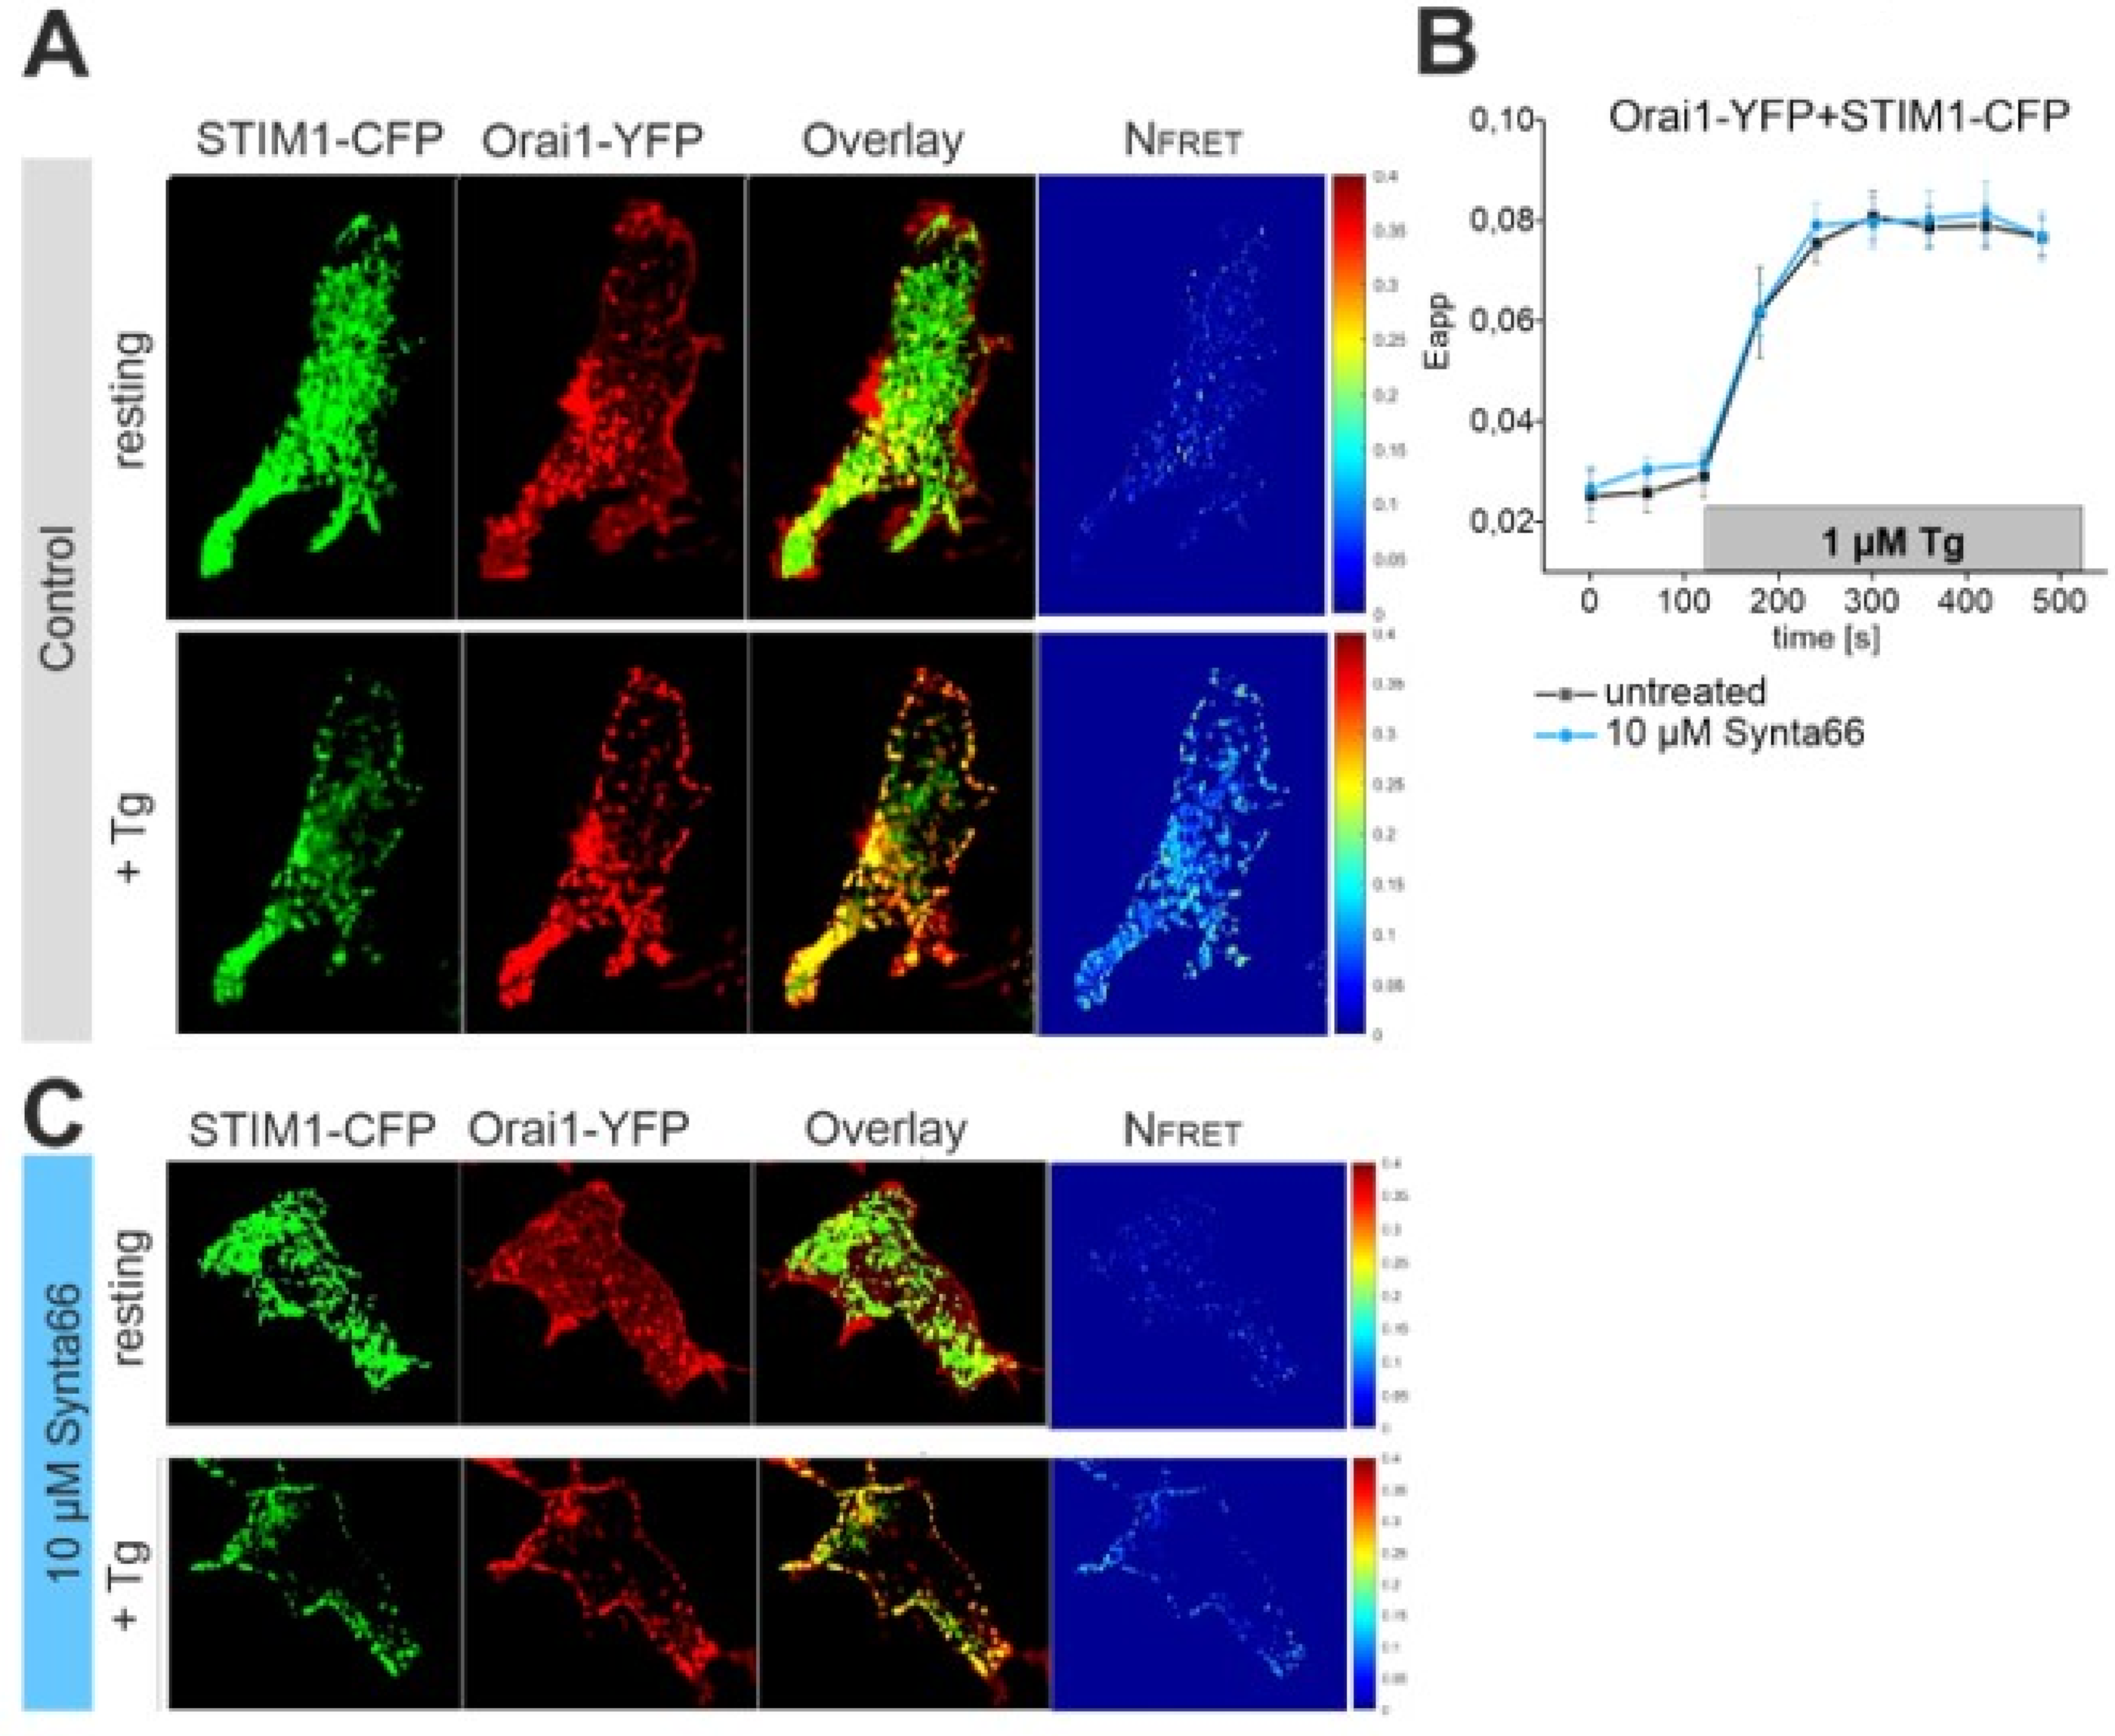
2.6. STIM1-Orai1 Coupling is Unaffected by Synta66
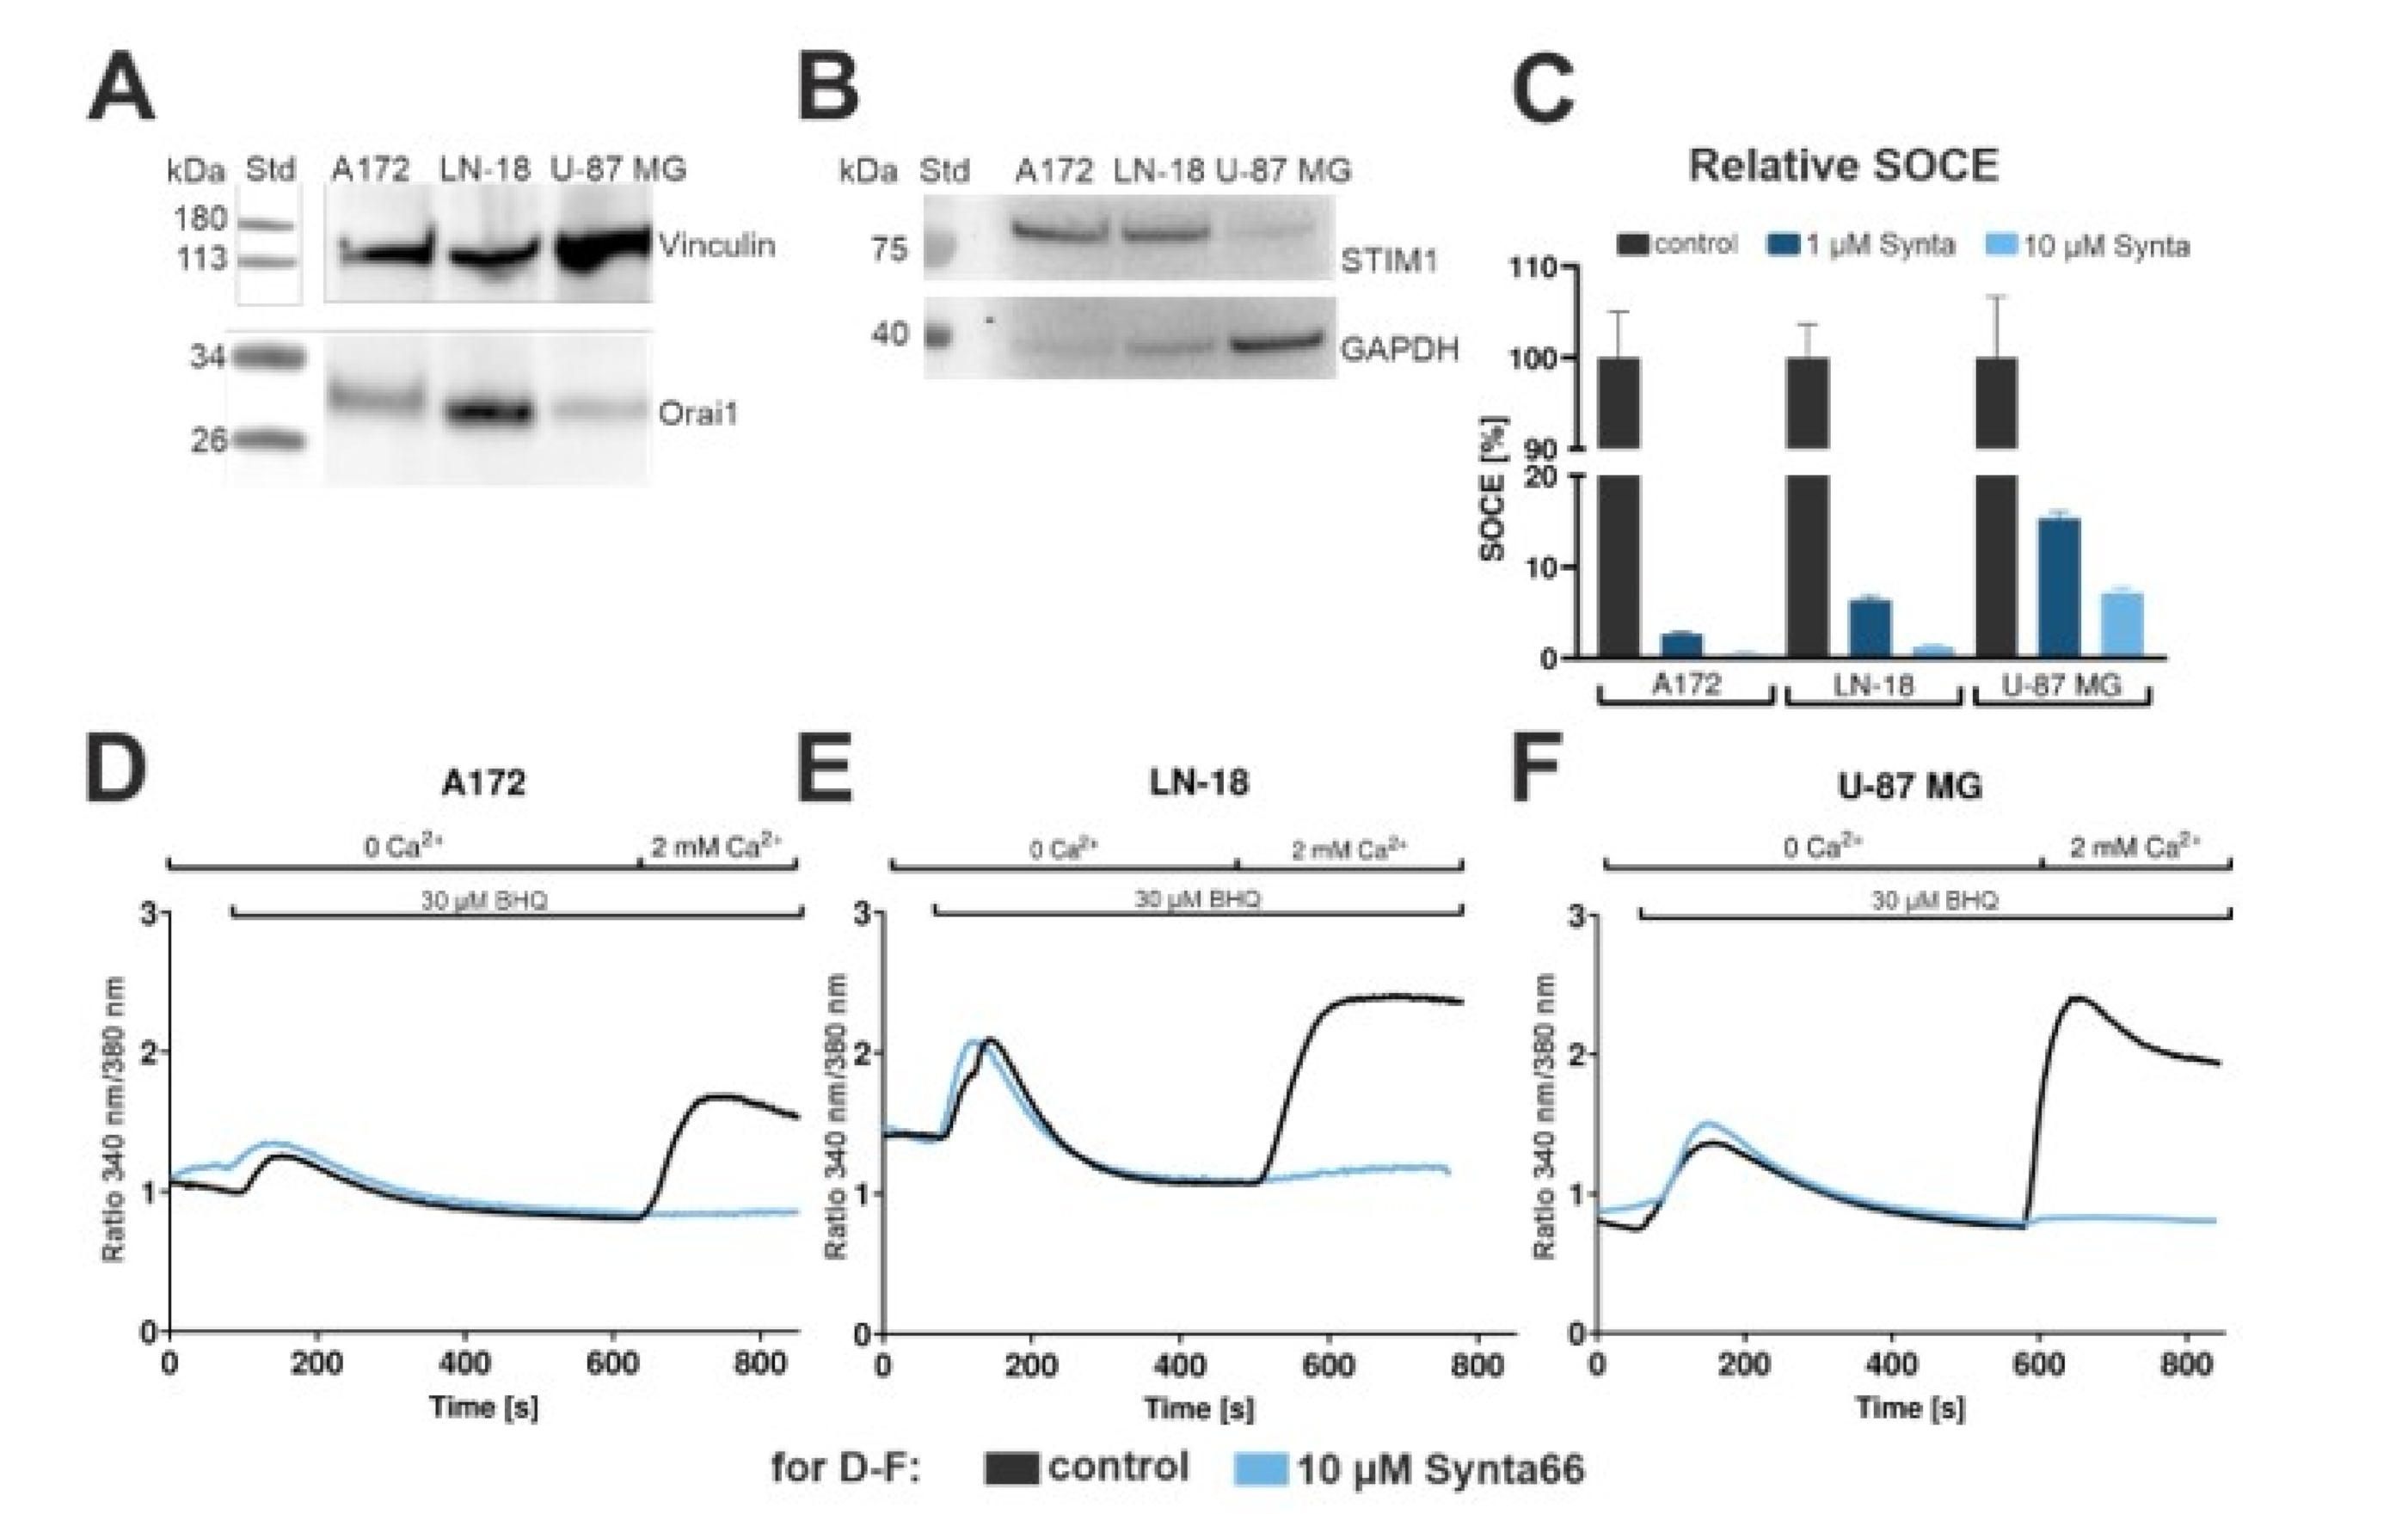
2.7. Calcium Recordings in Synta66-Treated GBM Cell Lines
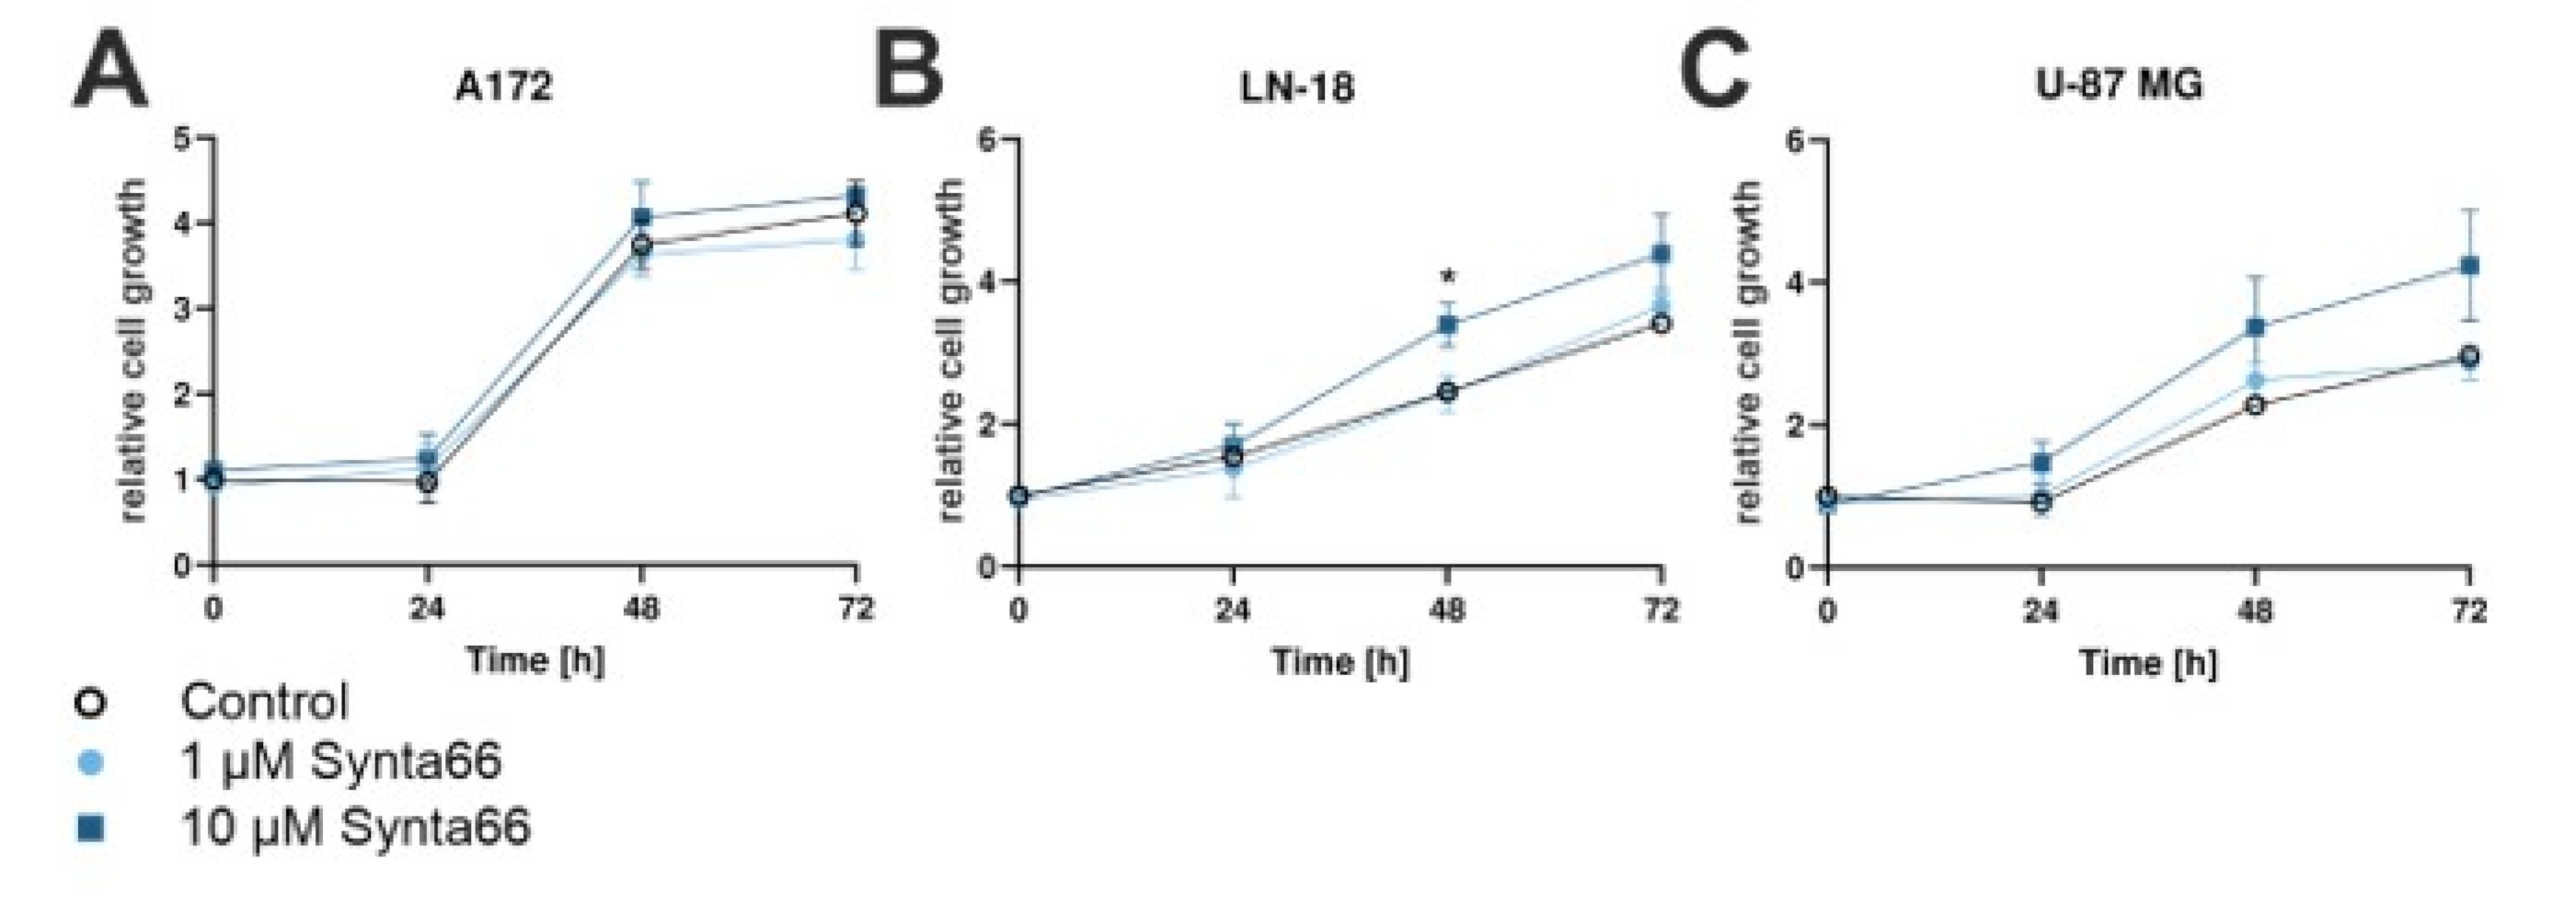
2.8. Synta66 Moderately Enhances Growth of LN-18 and U-87 MG GBM Cells
2.9. Synta66 Synergizes Moderately with TMZ Treatment in U-87 MG Cells
2.10. Synta66 Effects upon Cell Migration
3. Discussion
4. Materials and Methods
4.1. Cell Culture
4.2. Compounds
4.3. Electrophysiology
4.4. Confocal FRET Microscopy
4.5. Calcium Imaging
4.6. Western Blotting
4.7. Cell Viability (MTS Assay)
4.8. Cell Growth (Hoechst Assay)
4.9. IC50 with Synta66 and TMZ
4.10. Scratch Assay
4.11. Synta66 Docking and MD Simulations
5. Conclusions
Supplementary Materials
Author Contributions
Funding
Conflicts of Interest
References
- Prevarskaya, N.; Skryma, R.; Shuba, Y. Ion Channels in Cancer: Are Cancer Hallmarks Oncochannelopathies? Physiol. Rev. 2018, 98, 559–621. [Google Scholar] [CrossRef] [PubMed] [Green Version]
- Sánchez-Collado, J.; López, J.J.; Jardin, I.; Camello, P.J.; Falcón, D.; Regodon, S.; Salido, G.M.; Smani, T.; Rosado, J.A.; Collado, S. Adenylyl Cyclase Type 8 Overexpression Impairs Phosphorylation-Dependent Orai1 Inactivation and Promotes Migration in MDA-MB-231 Breast Cancer Cells. Cancers 2019, 11, 1624. [Google Scholar] [CrossRef] [PubMed] [Green Version]
- Khan, H.Y.; Mpilla, G.B.; Sexton, R.; Viswanadha, S.; Penmetsa, K.V.; Aboukameel, A.; Diab, M.; Kamgar, M.; Al-Hallak, M.N.; Szlaczky, M.; et al. Calcium Release-Activated Calcium (CRAC) Channel Inhibition Suppresses Pancreatic Ductal Adenocarcinoma Cell Proliferation and Patient-Derived Tumor Growth. Cancers 2020, 12, 750. [Google Scholar] [CrossRef] [PubMed] [Green Version]
- Prakriya, M.; Lewis, R.S. Store-Operated Calcium Channels. Physiol. Rev. 2015, 95, 1383–1436. [Google Scholar] [CrossRef] [PubMed] [Green Version]
- Bonhenry, D.; Schober, R.; Schmidt, T.; Waldherr, L.; Ettrich, R.H.; Schindl, R. Mechanistic insights into the Orai channel by molecular dynamics simulations. Semin. Cell Dev. Biol. 2019, 94, 50–58. [Google Scholar] [CrossRef]
- Schober, R.; Waldherr, L.; Schmidt, T.; Graziani, A.; Stilianu, C.; Legat, L.; Groschner, K.; Schindl, R. STIM1 and Orai1 regulate Ca(2+) microdomains for activation of transcription. Biochim. Biophys. Acta Mol. Cell Res. 2019, 1866, 1079–1091. [Google Scholar] [CrossRef]
- Luik, R.M.; Wang, B.; Prakriya, M.; Wu, M.M.; Lewis, R.S. Oligomerization of STIM1 couples ER calcium depletion to CRAC channel activation. Nature 2008, 454, 538–542. [Google Scholar] [CrossRef]
- Zhang, S.L.; Yu, Y.; Roos, J.; Kozak, J.A.; Deerinck, T.J.; Ellisman, M.H.; Stauderman, K.A.; Cahalan, M.D. STIM1 is a Ca2+ sensor that activates CRAC channels and migrates from the Ca2+ store to the plasma membrane. Nature 2005, 437, 902–905. [Google Scholar] [CrossRef]
- Brandman, O.; Liou, J.; Park, W.S.; Meyer, T. STIM2 is a feedback regulator that stabilizes basal cytosolic and endoplasmic reticulum Ca2+ levels. Cell 2007, 131, 1327–1339. [Google Scholar] [CrossRef] [Green Version]
- Enomoto, M.; Nishikawa, T.; Back, S.-I.; Ishiyama, N.; Zheng, L.; Stathopulos, P.B.; Ikura, M. Coordination of a Single Calcium Ion in the EF-hand Maintains the Off State of the Stromal Interaction Molecule Luminal Domain. J. Mol. Biol. 2020, 432, 367–383. [Google Scholar] [CrossRef]
- Schober, R.; Bonhenry, D.; Lunz, V.; Zhu, J.; Krizova, A.; Frischauf, I.; Fahrner, M.; Zhang, M.; Waldherr, L.; Schmidt, T.; et al. Sequential activation of STIM1 links Ca(2+) with luminal domain unfolding. Sci. Signal. 2019, 12, eaax3194. [Google Scholar] [CrossRef] [PubMed]
- Sallinger, M.; Tiffner, A.; Schmidt, T.; Bonhenry, D.; Waldherr, L.; Frischauf, I.; Lunz, V.; Derler, I.; Schober, R.; Schindl, R. Luminal STIM1 Mutants that Cause Tubular Aggregate Myopathy Promote Autophagic Processes. Int. J. Mol. Sci. 2020, 21, 4410. [Google Scholar] [CrossRef] [PubMed]
- Liou, J.; Fivaz, M.; Inoue, T.; Meyer, T. Live-cell imaging reveals sequential oligomerization and local plasma membrane targeting of stromal interaction molecule 1 after Ca2+ store depletion. Proc. Natl. Acad. Sci. USA 2007, 104, 9301. [Google Scholar] [CrossRef] [PubMed] [Green Version]
- Subedi, K.P.; Ong, H.L.; Son, G.Y.; Liu, X.; Ambudkar, I.S. STIM2 Induces Activated Conformation of STIM1 to Control Orai1 Function in ER-PM Junctions. Cell Rep. 2018, 23, 522–534. [Google Scholar] [CrossRef] [PubMed] [Green Version]
- Stathopulos, P.B.; Ikura, M. Structure and function of endoplasmic reticulum STIM calcium sensors. Curr. Top. Membr. 2013, 71, 59–93. [Google Scholar]
- Muik, M.; Frischauf, I.; Derler, I.; Fahrner, M.; Bergsmann, J.; Eder, P.; Schindl, R.; Hesch, C.; Polzinger, B.; Fritsch, R.; et al. Dynamic coupling of the putative coiled-coil domain of ORAI1 with STIM1 mediates ORAI1 channel activation. J. Boil. Chem. 2008, 283, 8014–8022. [Google Scholar] [CrossRef] [PubMed] [Green Version]
- Park, C.Y.; Hoover, P.J.; Mullins, F.M.; Bachhawat, P.; Covington, E.D.; Raunser, S.; Walz, T.; Garcia, K.C.; Dolmetsch, R.E.; Lewis, R.S. STIM1 clusters and activates CRAC channels via direct binding of a cytosolic domain to Orai1. Cell 2009, 136, 876–890. [Google Scholar] [CrossRef] [Green Version]
- Yuan, J.P.; Zeng, W.; Dorwart, M.R.; Choi, Y.J.; Worley, P.F.; Muallem, S. SOAR and the polybasic STIM1 domains gate and regulate Orai channels. Nat. Cell Biol. 2009, 11, 337–343. [Google Scholar] [CrossRef]
- Zhou, Y.; Meraner, P.; Kwon, H.T.; Machnes, D.; Oh-Hora, M.; Zimmer, J.; Huang, Y.; Stura, A.; Rao, A.; Hogan, P.G. STIM1 gates the store-operated calcium channel ORAI1 in vitro. Nat. Struct. Mol. Biol. 2010, 17, 112–116. [Google Scholar] [CrossRef] [Green Version]
- Peinelt, C.; Vig, M.; Koomoa, D.L.; Beck, A.; Nadler, M.J.S.; Koblan-Huberson, M.; Lis, A.; Fleig, A.; Penner, R.; Kinet, J.-P. Amplification of CRAC current by STIM1 and CRACM1 (Orai1). Nat. Cell Biol. 2006, 8, 771–773. [Google Scholar] [CrossRef] [Green Version]
- Prakriya, M.; Feske, S.; Gwack, Y.; Srikanth, S.; Rao, A.; Hogan, P.G. Orai1 is an essential pore subunit of the CRAC channel. Nature 2006, 443, 230–233. [Google Scholar] [CrossRef] [PubMed]
- Frischauf, I.; Litviňuková, M.; Schober, R.; Zayats, V.; Svobodová, B.; Bonhenry, D.; Lunz, V.; Cappello, S.; Tociu, L.; Řeha, D.; et al. Transmembrane helix connectivity in Orai1 controls two gates for calcium-dependent transcription. Sci. Signal. 2017, 10, eaao0358. [Google Scholar] [CrossRef] [PubMed] [Green Version]
- Feske, S.; Gwack, Y.; Prakriya, M.; Srikanth, S.; Puppel, S.-H.; Tanasa, B.; Hogan, P.G.; Lewis, R.S.; Daly, M.; Rao, A. A mutation in Orai1 causes immune deficiency by abrogating CRAC channel function. Nature 2006, 441, 179–185. [Google Scholar] [CrossRef] [PubMed]
- Toth, A.B.; Hori, K.; Novakovic, M.M.; Bernstein, N.G.; Lambot, L.; Prakriya, M. CRAC channels regulate astrocyte Ca(2+) signaling and gliotransmitter release to modulate hippocampal GABAergic transmission. Sci. Signal. 2019, 12, eaaw5450. [Google Scholar] [CrossRef]
- Motiani, R.K.; Hyzinski-García, M.C.; Zhang, X.; Henkel, M.M.; Abdullaev, I.F.; Kuo, Y.-H.; Matrougui, K.; Mongin, A.A.; Trebak, M. STIM1 and Orai1 mediate CRAC channel activity and are essential for human glioblastoma invasion. Pflug. Arch. 2013, 465, 1249–1260. [Google Scholar] [CrossRef] [Green Version]
- Monteith, G.R.; Prevarskaya, N.; Roberts-Thomson, S.J. The calcium-cancer signalling nexus. Nat. Rev. Cancer 2017, 17, 367–380. [Google Scholar] [CrossRef] [Green Version]
- Hoth, M. CRAC channels, calcium, and cancer in light of the driver and passenger concept. Biochim. Biophys. Acta 2016, 1863, 1408–1417. [Google Scholar] [CrossRef]
- Davis, M.E. Glioblastoma: Overview of Disease and Treatment. Clin. J. Oncol. Nurs. 2016, 20 (Suppl. 5), S2–S8. [Google Scholar] [CrossRef] [Green Version]
- Shergalis, A.; Bankhead, A., 3rd; Luesakul, U.; Muangsin, N.; Neamati, N. Current Challenges and Opportunities in Treating Glioblastoma. Pharmacol. Rev. 2018, 70, 412–445. [Google Scholar] [CrossRef] [Green Version]
- Mrugala, M.M. Advances and challenges in the treatment of glioblastoma: A clinician’s perspective. Discov. Med. 2013, 15, 221–230. [Google Scholar]
- Liu, H.; Hughes, J.D.; Rollins, S.; Chen, B.; Perkins, E. Calcium entry via ORAI1 regulates glioblastoma cell proliferation and apoptosis. Exp. Mol. Pathol. 2011, 91, 753–760. [Google Scholar] [CrossRef] [PubMed]
- Kovacs, G.G.; Zsembery, A.; Anderson, S.J.; Komlosi, P.; Gillespie, G.Y.; Bell, P.D.; Benos, D.J.; Fuller, C.M. Changes in intracellular Ca2+ and pH in response to thapsigargin in human glioblastoma cells and normal astrocytes. Am. J. Physiol. Cell Physiol. 2005, 289, C361–C371. [Google Scholar] [CrossRef] [PubMed]
- Shi, Z.-X.; Rao, W.; Wang, H.; Wang, N.-D.; Si, J.-W.; Zhao, J.; Li, J.-C.; Wang, Z.-R. Modeled microgravity suppressed invasion and migration of human glioblastoma U87 cells through downregulating store-operated calcium entry. Biochem. Biophys. Res. Commun. 2015, 457, 378–384. [Google Scholar] [CrossRef]
- Zhu, M.; Chen, L.; Zhao, P.; Zhou, H.; Zhang, C.; Yu, S.; Lin, Y.; Yang, X. Store-operated Ca(2+) entry regulates glioma cell migration and invasion via modulation of Pyk2 phosphorylation. J. Exp. Clin. Cancer Res. 2014, 33, 98. [Google Scholar] [CrossRef] [PubMed] [Green Version]
- Derler, I.; Fritsch, R.; Schindl, R.; Romanin, C. CRAC inhibitors: Identification and potential. Expert Opin. Drug Discov. 2008, 3, 787–800. [Google Scholar] [CrossRef] [PubMed]
- Takezawa, R.; Cheng, H.; Beck, A.; Ishikawa, J.; Launay, P.; Kubota, H.; Kinet, J.-P.; Fleig, A.; Yamada, T.; Penner, R. A pyrazole derivative potently inhibits lymphocyte Ca2+ influx and cytokine production by facilitating transient receptor potential melastatin 4 channel activity. Mol. Pharmacol. 2006, 69, 1413–1420. [Google Scholar] [CrossRef] [PubMed]
- Schindl, R.; Bergsmann, J.; Frischauf, I.; Derler, I.; Fahrner, M.; Muik, M.; Fritsch, R.; Groschner, K.; Romanin, C. 2-aminoethoxydiphenyl borate alters selectivity of Orai3 channels by increasing their pore size. J. Boil. Chem. 2008, 283, 20261–20267. [Google Scholar] [CrossRef] [Green Version]
- Lis, A.; Peinelt, C.; Beck, A.; Parvez, S.; Monteilh-Zoller, M.; Fleig, A.; Penner, R. CRACM1, CRACM2, and CRACM3 are store-operated Ca2+ channels with distinct functional properties. Curr. Biol. 2007, 17, 794–800. [Google Scholar] [CrossRef] [Green Version]
- Kappel, S.; Kilch, T.; Baur, R.; Lochner, M.; Peinelt, C. The Number and Position of Orai3 Units within Heteromeric Store-Operated Ca(2+) Channels Alter the Pharmacology of ICRAC. Int. J. Mol. Sci. 2020, 21, 2458. [Google Scholar] [CrossRef] [Green Version]
- Derler, I.; Schindl, R.; Fritsch, R.; Heftberger, P.; Riedl, M.C.; Begg, M.; House, D.; Romanin, C. The action of selective CRAC channel blockers is affected by the Orai pore geometry. Cell Calcium 2013, 53, 139–151. [Google Scholar] [CrossRef]
- Tian, C.; Du, L.; Zhou, Y.; Li, M. Store-operated CRAC channel inhibitors: Opportunities and challenges. Future Med. Chem. 2016, 8, 817–832. [Google Scholar] [CrossRef] [PubMed] [Green Version]
- Jairaman, A.; Prakriya, M. Molecular pharmacology of store-operated CRAC channels. Channels 2013, 7, 402–414. [Google Scholar] [CrossRef] [PubMed] [Green Version]
- Chen, G.; Panicker, S.; Lau, K.-Y.; Apparsundaram, S.; Patel, V.A.; Chen, S.-L.; Soto, R.; Jung, J.K.; Ravindran, P.; Okuhara, D.; et al. Characterization of a novel CRAC inhibitor that potently blocks human T cell activation and effector functions. Mol. Immunol. 2013, 54, 355–367. [Google Scholar] [CrossRef] [PubMed]
- Stauderman, K.A. CRAC channels as targets for drug discovery and development. Cell Calcium 2018, 74, 147–159. [Google Scholar] [CrossRef] [PubMed]
- Di Sabatino, A.; Rovedatti, L.; Kaur, R.; Spencer, J.; Wilde, J.; Scott, L.; Corazza, G.; Lee, K.; Gunthorpe, M.; McLean, P.; et al. Targeting gut T cell Ca2+ release-activated Ca2+ channels inhibits T cell cytokine production and T-box transcription factor T-bet in inflammatory bowel disease. J. Immunol. 2009, 183, 3454–3462. [Google Scholar] [CrossRef] [PubMed] [Green Version]
- Ng, S.W.; di Capite, J.; Singaravelu, K.; Parekh, A.B. Sustained activation of the tyrosine kinase Syk by antigen in mast cells requires local Ca2+ influx through Ca2+ release-activated Ca2+ channels. J. Biol. Chem. 2008, 283, 31348–31355. [Google Scholar] [CrossRef] [PubMed] [Green Version]
- Yeromin, A.V.; Zhang, S.L.; Jiang, W.; Yu, Y.; Safrina, O.; Cahalan, M.D. Molecular identification of the CRAC channel by altered ion selectivity in a mutant of Orai. Nature 2006, 443, 226–229. [Google Scholar] [CrossRef] [PubMed]
- Vig, M.; Beck, A.; Billingsley, J.M.; Lis, A.; Parvez, S.; Peinelt, C.; Koomoa, D.L.; Soboloff, J.; Gill, D.L.; Fleig, A.; et al. CRACM1 multimers form the ion-selective pore of the CRAC channel. Curr. Biol. 2006, 16, 2073–2079. [Google Scholar] [CrossRef] [Green Version]
- Yeung, P.S.; Yamashita, M.; Ing, C.E.; Pomes, R.; Freymann, D.M.; Prakriya, M. Mapping the functional anatomy of Orai1 transmembrane domains for CRAC channel gating. Proc. Natl. Acad. Sci. USA 2018, 115, E5193–E5202. [Google Scholar] [CrossRef] [Green Version]
- Dong, H.; Fiorin, G.; Carnevale, V.; Treptow, W.; Klein, M.L. Pore waters regulate ion permeation in a calcium release-activated calcium channel. Proc. Natl. Acad. Sci. USA 2013, 110, 17332–17337. [Google Scholar] [CrossRef] [Green Version]
- Dörr, K.; Kilch, T.; Kappel, S.; AlAnsary, D.; Schwär, G.; Niemeyer, B.A.; Peinelt, C. Cell type-specific glycosylation of Orai1 modulates store-operated Ca2+ entry. Sci. Signal. 2016, 9, ra25. [Google Scholar] [CrossRef] [PubMed]
- Wen, L.; Voronina, S.; Javed, M.A.; Awais, M.; Szatmary, P.; Latawiec, D.; Chvanov, M.; Collier, D.; Huang, W.; Barrett, J.; et al. Inhibitors of ORAI1 Prevent Cytosolic Calcium-Associated Injury of Human Pancreatic Acinar Cells and Acute Pancreatitis in 3 Mouse Models. Gastroenterology 2015, 149, 481–492. [Google Scholar] [CrossRef] [PubMed] [Green Version]
- Yang, S.; Zhang, J.J.; Huang, X.Y. Orai1 and STIM1 are critical for breast tumor cell migration and metastasis. Cancer Cell 2009, 15, 124–134. [Google Scholar] [CrossRef] [PubMed] [Green Version]
- Chen, Y.-F.; Chiu, W.-T.; Lin, P.-Y.; Huang, H.-J.; Chou, C.-Y.; Chang, H.-C.; Tang, M.J.; Shen, M.-R.; Chen, Y.-F.; Chen, Y.-T. Calcium store sensor stromal-interaction molecule 1-dependent signaling plays an important role in cervical cancer growth, migration, and angiogenesis. Proc. Natl. Acad. Sci. USA 2011, 108, 15225–15230. [Google Scholar] [CrossRef] [Green Version]
- Franzius, D.; Hoth, M.; Penner, R. Non-specific effects of calcium entry antagonists in mast cells. Pflug. Arch. 1994, 428, 433–438. [Google Scholar] [CrossRef]
- Zakharov, S.I.; Smani, T.; Dobrydneva, Y.; Monje, F.; Fichandler, C.; Blackmore, P.F.; Bolotina, V.M. Diethylstilbestrol is a potent inhibitor of store-operated channels and capacitative Ca(2+) influx. Mol. Pharmacol. 2004, 66, 702–707. [Google Scholar]
- Liu, Z.; Wei, Y.; Zhang, L.; Yee, P.P.; Johnson, M.; Zhang, X.; Gulley, M.; Atkinson, J.M.; Trebak, M.; Wang, H.-G.; et al. Induction of store-operated calcium entry (SOCE) suppresses glioblastoma growth by inhibiting the Hippo pathway transcriptional coactivators YAP/TAZ. Oncogene 2019, 38, 120–139. [Google Scholar] [CrossRef]
- DeHaven, W.I.; Smyth, J.T.; Boyles, R.R.; Bird, G.S.; Putney, J.W., Jr. Complex actions of 2-aminoethyldiphenyl borate on store-operated calcium entry. J. Biol. Chem. 2008, 283, 19265–19273. [Google Scholar] [CrossRef] [Green Version]
- Peinelt, C.; Lis, A.; Beck, A.; Fleig, A.; Penner, R. 2-Aminoethoxydiphenyl borate directly facilitates and indirectly inhibits STIM1-dependent gating of CRAC channels. J. Physiol. 2008, 586, 3061–3073. [Google Scholar] [CrossRef]
- Tamarina, N.A.; Kuznetsov, A.; Philipson, L.H. Reversible translocation of EYFP-tagged STIM1 is coupled to calcium influx in insulin secreting beta-cells. Cell Calcium 2008, 44, 533–544. [Google Scholar] [CrossRef]
- Zhang, X.; Xin, P.; Yoast, R.E.; Emrich, S.M.; Johnson, M.T.; Pathak, T.; Benson, J.C.; Azimi, I.; Gill, D.L.; Monteith, G.R.; et al. Distinct pharmacological profiles of ORAI1, ORAI2, and ORAI3 channels. Cell Calcium 2020, 91, 102281. [Google Scholar] [CrossRef] [PubMed]
- Frischauf, I.; Zayats, V.; Deix, M.; Hochreiter, A.; Jardin, I.; Muik, M.; Lackner, B.; Svobodova, B.; Pammer, T.; Litvinukova, M.; et al. A calcium-accumulating region, CAR, in the channel Orai1 enhances Ca(2+) permeation and SOCE-induced gene transcription. Sci. Signal. 2015, 8, ra131. [Google Scholar] [CrossRef] [PubMed] [Green Version]
- Dubois, C.; Abeele, F.V.; Lehenkyi, V.; Gkika, D.; Guarmit, B.; Lepage, G.; Slomianny, C.; Borowiec, A.S.; Bidaux, G.; Benahmed, M.; et al. Remodeling of channel-forming ORAI proteins determines an oncogenic switch in prostate cancer. Cancer Cell 2014, 26, 19–32. [Google Scholar] [CrossRef] [PubMed] [Green Version]
- Bhuvaneshwari, S.; Sankaranarayanan, K. Identification of potential CRAC channel inhibitors: Pharmacophore mapping, 3D-QSAR modelling, and molecular docking approach. SAR QSAR Environ. Res. 2019, 30, 81–108. [Google Scholar] [CrossRef]
- Schrödinger Release 2017-1: Canvas; Schrödinger, LLC: New York, NY, USA, 2017.
- Banks, J.L.; Beard, H.S.; Cao, Y.; Cho, A.E.; Damm, W.; Farid, R.; Felts, A.K.; Halgren, T.A.; Mainz, D.T.; Maple, J.R.; et al. Integrated Modeling Program, Applied Chemical Theory (IMPACT). J. Comput. Chem. 2005, 26, 1752–1780. [Google Scholar] [CrossRef] [PubMed] [Green Version]
- Friesner, R.A.; Banks, J.L.; Murphy, R.B.; Halgren, T.A.; Klicić, J.J.; Mainz, D.T.; Repasky, M.P.; Knoll, E.H.; Shelley, M.; Perry, J.K.; et al. Glide: A new approach for rapid, accurate docking and scoring. 1. Method and assessment of docking accuracy. J. Med. Chem. 2004, 47, 1739–1749. [Google Scholar] [CrossRef]
- Tribello, G.A.; Bonomi, M.; Branduardi, D.; Camilloni, C.; Bussi, G. PLUMED 2: New feathers for an old bird. Comput. Phys. Commun. 2014, 185, 604–613. [Google Scholar] [CrossRef] [Green Version]
- Huang, J.; MacKerell, A.D., Jr. CHARMM36 all-atom additive protein force field: Validation based on comparison to NMR data. J. Comput. Chem. 2013, 34, 2135–2145. [Google Scholar] [CrossRef] [Green Version]
- Klauda, J.B.; Venable, R.M.; Freites, J.A.; O’Connor, J.W.; Tobias, D.J.; Mondragon-Ramirez, C.; Vorobyov, I.; Mackerell, A.D., Jr.; Pastor, R.W. Update of the CHARMM All-Atom Additive Force Field for Lipids: Validation on Six Lipid Types. J. Phys. Chem. B 2010, 114, 7830–7843. [Google Scholar] [CrossRef] [Green Version]
- Jorgensen, W.L.; Chandrasekhar, J.; Madura, J.D.; Impey, R.W.; Klein, M.L. Comparison of Simple Potential Functions for Simulating Liquid Water. J. Chem. Phys. 1983, 79, 926–935. [Google Scholar] [CrossRef]
- Kohagen, M.; Mason, P.E.; Jungwirth, P. Accounting for Electronic Polarization Effects in Aqueous Sodium Chloride via Molecular Dynamics Aided by Neutron Scattering. J. Phys. Chem. B 2016, 120, 1454–1460. [Google Scholar] [CrossRef] [PubMed]
- Jo, S.; Kim, T.; Iyer, V.G.; Im, W. Software news and updates-CHARNIM-GUI: A web-based grraphical user interface for CHARMM. J. Comput. Chem. 2008, 29, 1859–1865. [Google Scholar] [CrossRef] [PubMed]
- Lee, J.; Patel, D.S.; Stahle, J.; Park, S.J.; Kern, N.R.; Kim, S.; Lee, J.; Cheng, X.; Valvano, M.A.; Holst, O.; et al. CHARMM-GUI Membrane Builder for Complex Biological Membrane Simulations with Glycolipids and Lipoglycans. J. Chem. Theory Comput. 2019, 15, 775–786. [Google Scholar] [CrossRef] [PubMed] [Green Version]
- Gutiérrez, I.S.; Lin, F.-Y.; Vanommeslaeghe, K.; Lemkul, J.A.; Armacost, K.A.; Brooks, C.L.; Mackerell, A.D., Jr. Parametrization of halogen bonds in the CHARMM general force field: Improved treatment of ligand-protein interactions. Bioorganic Med. Chem. 2016, 24, 4812–4825. [Google Scholar] [CrossRef] [PubMed] [Green Version]
- Vanommeslaeghe, K.; MacKerell, A.D. Automation of the CHARMM General Force Field (CGenFF) I: Bond Perception and Atom Typing. J. Chem. Inf. Model. 2012, 52, 3144–3154. [Google Scholar] [CrossRef] [PubMed]
- Abraham, M.; Murtola, T.; Schulz, R.; Páll, S.; Smith, J.C.; Hess, B.; Lindahl, E. GROMACS: High performance molecular simulations through multi-level parallelism from laptops to supercomputers. SoftwareX 2015, 1–2, 19–25. [Google Scholar] [CrossRef] [Green Version]
- Nose, S. A Molecular-Dynamics Method for Simulations in the Canonical Ensemble. Mol. Phys. 1984, 52, 255–268. [Google Scholar] [CrossRef]
- Hoover, W.G. Canonical dynamics: Equilibrium phase-space distributions. Phys. Rev. A Gen. Phys. 1985, 31, 1695–1697. [Google Scholar] [CrossRef] [PubMed] [Green Version]
- Hoover, P.J.; Lewis, R.S. Stoichiometric requirements for trapping and gating of Ca2+ release-activated Ca2+ (CRAC) channels by stromal interaction molecule 1 (STIM1). Proc. Natl. Acad. Sci. USA 2011, 108, 13299–13304. [Google Scholar] [CrossRef] [Green Version]
- Parrinello, M.; Rahman, A. Polymorphic transitions in single crystals: A new molecular dynamics method. J. Appl. Phys. 1981, 52, 7182–7190. [Google Scholar] [CrossRef]
- Nose, S.; Klein, M.L. Constant Pressure Molecular-Dynamics for Molecular-Systems. Mol. Phys. 1983, 50, 1055–1076. [Google Scholar] [CrossRef]
- Darden, T.; York, D.; Pedersen, L. Particle Mesh Ewald—An N.Log(N) Method for Ewald Sums in Large Systems. J. Chem. Phys. 1993, 98, 10089–10092. [Google Scholar] [CrossRef] [Green Version]
- Hess, B. P-LINCS: A Parallel Linear Constraint Solver for Molecular Simulation. J. Chem. Theory Comput. 2008, 4, 116–122. [Google Scholar] [CrossRef] [PubMed]


© 2020 by the authors. Licensee MDPI, Basel, Switzerland. This article is an open access article distributed under the terms and conditions of the Creative Commons Attribution (CC BY) license (http://creativecommons.org/licenses/by/4.0/).
Share and Cite
Waldherr, L.; Tiffner, A.; Mishra, D.; Sallinger, M.; Schober, R.; Frischauf, I.; Schmidt, T.; Handl, V.; Sagmeister, P.; Köckinger, M.; et al. Blockage of Store-Operated Ca2+ Influx by Synta66 is Mediated by Direct Inhibition of the Ca2+ Selective Orai1 Pore. Cancers 2020, 12, 2876. https://doi.org/10.3390/cancers12102876
Waldherr L, Tiffner A, Mishra D, Sallinger M, Schober R, Frischauf I, Schmidt T, Handl V, Sagmeister P, Köckinger M, et al. Blockage of Store-Operated Ca2+ Influx by Synta66 is Mediated by Direct Inhibition of the Ca2+ Selective Orai1 Pore. Cancers. 2020; 12(10):2876. https://doi.org/10.3390/cancers12102876
Chicago/Turabian StyleWaldherr, Linda, Adela Tiffner, Deepti Mishra, Matthias Sallinger, Romana Schober, Irene Frischauf, Tony Schmidt, Verena Handl, Peter Sagmeister, Manuel Köckinger, and et al. 2020. "Blockage of Store-Operated Ca2+ Influx by Synta66 is Mediated by Direct Inhibition of the Ca2+ Selective Orai1 Pore" Cancers 12, no. 10: 2876. https://doi.org/10.3390/cancers12102876