Article

Pre-Treatment Mutational and Transcriptomic Landscape of Responding Metastatic Melanoma Patients to Anti-PD1 Immunotherapy

1
Department of Medicine, Division of Medical Oncology, University of Colorado Denver Anschutz Medical Campus, Aurora, CO 80045, USA
2
Willamette Valley Cancer Institute and Research Center, Corvallis, OR 97330, USA
3
Saint Alphonsus Cancer Institute, Boise, ID 83706, USA
4
Department of Surgery, Division of Surgical Oncology, University of Colorado Denver Anschutz Medical Campus, Aurora, CO 80045, USA
5
Department of Dermatology, University of Colorado Denver Anschutz Medical Campus, Aurora, CO 80045, USA
6
Department of Biostatistics and Bioinformatics, Moffitt Cancer Center, Tampa, FL 33612, USA
*
Author to whom correspondence should be addressed.
Cancers 2020, 12(7), 1943; https://doi.org/10.3390/cancers12071943
Submission received: 30 May 2020 / Revised: 13 July 2020 / Accepted: 13 July 2020 / Published: 17 July 2020

Abstract

:
Immunotherapy, such as anti-PD1, has improved the survival of patients with metastatic melanoma. However, predicting which patients will respond to immunotherapy remains a significant knowledge gap. In this study we analyzed pre-immunotherapy treated tumors from 52 patients with metastatic melanoma and monitored their response based on RECIST 1.1 criteria. The responders group contained 21 patients that had a complete or partial response, while the 31 non-responders had stable or progressive disease. Whole exome sequencing (WES) was used to identify biomarkers of anti-PD1 response from somatic mutations between the two groups. Variants in codons G34 and G41 in NFKBIE, a negative regulator of NFkB, were found exclusively in the responders. Mutations in NKBIE-related genes were also enriched in the responder group compared to the non-responders. Patients that harbored NFKBIE-related gene mutations also had a higher mutational burden, decreased tumor volume with treatment, and increased progression-free survival. RNA sequencing on a subset of tumor samples identified that CD83 was highly expressed in our responder group. Additionally, Gene Set Enrichment Analysis showed that the TNFalpha signaling via NFkB pathway was one of the top pathways with differential expression in responders vs. non-responders. In vitro NFkB activity assays indicated that the G34E variant caused loss-of-function of NFKBIE, and resulted in activation of NFkB signaling. Flow cytometry assays indicated that G34E variant was associated with upregulation of CD83 in human melanoma cell lines. These results suggest that NFkB activation and signaling in tumor cells contributes to a favorable anti-PD1 treatment response, and clinical screening to include aberrations in NFkB-related genes should be considered.

1. Introduction

Immune checkpoint blockade (ICB) treatments, such as anti-PD1, are now standard of care for patients with advanced metastatic melanoma [1,2,3,4]. Unlike targeted therapies, immunotherapies lack a clear genomic mutational hallmark, such as the BRAFV600E mutation, that define response. Newer sequencing technologies allow for the analysis of tumor mutational burden or microsatellite instability that can be used to predict better response [5,6]. However, these measurements are often imprecise and are not sufficient to explain differences in response.
Recent whole genome and exome sequencing of melanoma tumors have uncovered other recurrent mutated genes besides the well-known BRAF, NRAS, or KIT somatic variants. For example, SF3B1 mutations are frequently found in mucosal and ocular melanoma [7,8,9]. Mutations in TERT, CDKN2A, NF1, and RAC1 are often mutated in cutaneous melanomas, and recurrent variants in NFKBIE are found in desmoplastic melanoma [7,10]. However, these studies often lack the clinical knowledge of patient outcomes such as treatment response, and thus do not address how the genomic variants delineates responsiveness to immunotherapy.
Our study builds on previous reports that define the genomic and transcriptomic landscape of melanoma patient responses to immunotherapy. We employ a combination of whole exome sequencing, RNA sequencing, and in vitro analysis to characterize the pre-therapeutic landscape of metastatic melanoma in order to predict response to anti-PD1 therapy. Here we categorized melanoma patients as responders (complete and partial) or non-responders (stable disease and progressive disease) to anti-PD1 therapy. We present results from whole exome sequencing that identified recurrent mutations in NFKBIE, a negative regulator of NFkB that were found only in patients with a favorable response to anti-PD1 immunotherapy. RNA sequencing also showed that differential expression patterns exist between responders and non-responders, notably in the TNFalpha/NFkB signaling pathway. In vitro NFKBIE mutant variants resulted in activation of the TNFalpha/NFkB pathway and associated TNFalpha-induced expression of proteins involved with antigen presentation or co-stimulatory molecules. Together, these results suggest that activation of NFkB signaling in tumors enhances patient response to immunotherapy, and lack of a strong activation of this pathway may decrease response

2. Materials and Methods

2.1. Clinical Review

The Melanoma Biorepository at the University of Colorado Cancer Center currently contains over 4000 patient tissue and blood samples. A clinical review led to the identification of 52 patients with 71 total tissue samples that had previously undergone immunotherapy and had a pre-therapeutic biopsy (Table S1). Patients were then classified according to best response, defined using RECIST1.1 criteria [11]. Patient scans typically occurred at 3 and 6 months. In total, 21 patients were categorized as responders (5 complete responders, 16 partial responders) and 31 patients were classified as non-responders (16 with stable disease, and 15 with progressive disease). Formalin-fixed paraffin-embedded, and/or fresh frozen tissue samples then were assessed for quality and based on those results each sample underwent whole exome sequencing (WES) (71 samples), and/or RNA-sequencing (14 samples), Table S2. When available, normal peripheral blood DNA was also sequenced (whole exome) for mutational analysis.

2.2. Sample Collection and Nucleic Acid Isolation

All samples were collected between 2008 and 2016 stored in the Melanoma Biorepository at the University of Colorado. Informed written consent was obtained in accordance with approval from the Colorado Multiple Institutional Review Board and with the patient’s written consent (COMIRB-05-0309). Our institutional review board (the Colorado Multiple Institutional Review Board) allows us to consent and collect specimens, including archived specimens, from patients at any time. Therefore, the time interval between sample collection and subsequent treatment varied from years to months. Peripheral blood samples were collected in PAXGene (Qiagen, Valencia, CA, USA) DNA tubes and until processed were stored at 4 °C. Genomic DNA from tissues was isolated using either the DNeasy Blood and Tissue kit (Qiagen, Valencia, CA, USA) or the QiaAmp DNA formalin-fixed paraffin-embedded kit (Qiagen, Valencia, CA, USA) depending on the material. The concentration of DNA was determined using an ultraviolet spectrophotometer and stored at 4 °C. Total RNA was extracted from frozen tissue or cells using the RNeasy Plus Mini Kit (Qiagen, Valencia, CA, USA), with on-column DNase digest and tissue homogenization using the TissueLyser II (Qiagen, Valencia, CA, USA).

2.3. Next-Generation Whole-Exome Sequencing and Analysis

DNA concentration and purity were determined using Qubit (Thermo Fisher Scientific, Waltham, MA, USA) and Agilent 2100 Bioanalyzer (Agilent Technologies, Santa Clara, CA, USA) analysis. Genomic DNA (200 ng) was sheared using Covaris (Woburn, MA, USA) S220 at 150 bp. Sheared DNA was used to construct the exome library following Agilent SureSelect XT Target Enrichment System (Agilent Technologies, Santa Clara, CA, USA) for Illumina Paired End Multiplexed Sequencing Library (catalog #G9641B; Illumina, San Diego, CA, USA). Sheared DNA was end repaired, followed by addition of adapter tags to construct DNA libraries through PCR amplification. Exome capture was performed through hybridization using XT5 probe. Resulting captured libraries were indexed and purified. The cDNA library was validated on the Agilent 2100 Bioanalyzer using DNA-1000 chip. Libraries were sequenced on the Illumina HiSeq 2000 with 125 bp paired-end reads. We obtained an average of 400× and 200× sequencing coverage for the cancer and normal exomes, respectively.
WES sequences were analyzed using our bioinformatics pipeline, IMPACT [12]. In brief, IMPACT is a discovery-oriented WES analysis pipeline designed to detect variant reads found in at least 10% of sequencing reads (minimum of four variant reads out of 20 mapped reads). To eliminate potential false positives, IMPACT performs a stringent filtering step, keeping only nonsynonymous somatic variants that are predicted to be deleterious by SIFT [13] and PolyPhen2 [14] or were present in the COSMIC database [15]. By doing this, IMPACT is able to detect more sub-clonal variants but only keeps those variants that are predicted to be the most deleterious. To remove germline variants, a normal blood DNA sample from the same patient was used as control when available. Somatic variants in genes were compared between responder and non-responder groups. A Fisher’s exact test was performed for each gene found in at least 30% of the samples. False discovery rate was applied to the gene list. Genes with a p-value less than 0.05 and false discovery rate less than 20% were considered for further analysis. Next generation sequencing data is deposited at the National Center for Biotechnology Information (Bethesda, MD, USA).

2.4. Next-Generation RNA Sequencing and Analysis

RNA library construction and sequencing were performed by the University of Colorado Cancer Center Genomics and Microarray Core. The Nugen Universal Plus mRNA seq kit was used for polyA selected RNA library construction. The libraries were sequenced as single-end reads at 150 cycle read lengths on the Illumina HiSeq2500 System. FASTQ files generated were processed using the Cufflinks/Cuffdiff RNAseq workflow and aligned to Ch37/hg19 [16]. Cuffdiff analysis generated fragment per kilobase per million mapped read (FPKM) values and performed differential gene expression analysis between sample groups. Differential gene expression and p-values were calculated using the Jensen–Shannon divergence method (JSD) and depicted as a heat map [17]. p-values were corrected for multiple testing and false discovery rates (FDR, q-values) using the Benjamini–Hochberg method, Table S3 [18]. Additionally, the fragment per kilobase per million (FPKM) values were analyzed by Gene Set Enrichment Analysis (GSEA, Broad Institute, v6.2MSigDB) to create a rank order gene list and identify pathways differentially utilized in the two sample groups [19]. Briefly, GSEA calculates and ranks the differential expression of genes, it further identifies pathways associated with those genes, and calculates a normalized enrichment score (NES) for a particular pathway. p-values (permutation method) were calculated and corrected for false discovery rates (q-values). For our analysis, the GSEA files included labels that assigned discrete phenotypes based on the clinical characteristics defined as responders and non-responders [20]. Collections used in this analysis include the HALLMARK gene sets from v6.2MSigDB [21].

2.5. Data Availability

The whole exome and whole transcriptome data have been deposited in NCBI’s Sequence Read Archive and Gene Expression Omnibus [22] and are accessible through SRA and GSE accessions: PRJNA639866 and GSE15996 (National Center for Biotechnology Information, Bethesda, MD, USA).

2.6. NFKBIE Wildtype and G34E Expression Vectors

NFKBIE cDNA sequences were inserted into the pLVX-EF1a-IRES-ZsGreen1 vector (Clontech/Takara Bio, Mountain View, CA, USA, #631982) by GenScript using the SpeI/NotI restriction enzyme sites (Genscript, Piscataway, NJ, USA). Each construct was transformed into TOP10 competent Escherichia coli (E. coli) cells (Invitrogen, Carlsbad, CA, USA). The plasmids were purified using the HiSpeed Plasmid Midi kit (Qiagen, Valencia, CA, USA).

2.7. NF-kB Luciferase Reporter Assay

HEK293t cells were cultured in DMEM media supplemented with 10% FBS, 1% penicillin/streptomycin, and 0.1 mM MEM non-essential amino acids (Invitrogen). In black, flat-bottomed tissue culture 96-well plates (Corning, Glendale, AZ, USA), NFKBIE expression vectors (0.4 ug), pGL4.32(luc2P/NF-kB-RE/Hygro) reporter vector (2.0 ug, Promega, Madison, WI, USA), and pRL-TK vector (0.2 ug, an internal transfection control, Promega) were transfected into HEK293t cells using Lipofectamine 2000 (Life Technologies). After 48 h, the cells were incubated with 10 ng/mL TNFalpha (Gemini Bio, Sacramento, CA, USA) for 4 h or media only. Reporter activity was measured using the Dual-Glo Luciferase assay system (Promega) and read on the Synergy 2 (BioTek, Winooski, VT, USA).

2.8. Cell Surface Protein Analysis

Flow cytometry was performed on cells fixed with 1.0% paraformaldehyde and stained overnight in primary antibody (BioLegend, San Diego, CA, USA; PE anti-human CD83). Fluorescent intensity was measured using CytoflexS (Beckman Coulter, Indianapolis, IN, USA).

3. Results

3.1. Clinical Analysis

We identified 52 patients with advanced (stage III unresectable and stage IV) metastatic melanoma who had tumor samples collected prior to undergoing immunotherapy, and with known clinical responses after immunotherapy. Sixty-four percent were male (34/52) with a median age of 56 years. Thirty-four patients had ctaneous melanoma (superficial spreading, nodular, or desmoplastic), and 8 patients (15%) had a non-sun exposed subtype. All patients had tumor samples taken before anti-PD1 immune checkpoint therapy of nivolumab (21%) or pembrolizumab (79%). According to RECIST1.1 criteria [11], 21 patients were categorized as responders (6 complete, 15 partial), and 31 were classified as non-responders (16 with stable disease and 15 with progressive disease). Approximately one-fifth of the patients (21%) had a tumor that was BRAFV600E mutant. Our cohort has a low frequency of patients with BRAF mutations; likely a reflection that the majority of such patients being seen at our institution would have been offered targeted therapy. The WES patient cohort is summarized in Table 1.

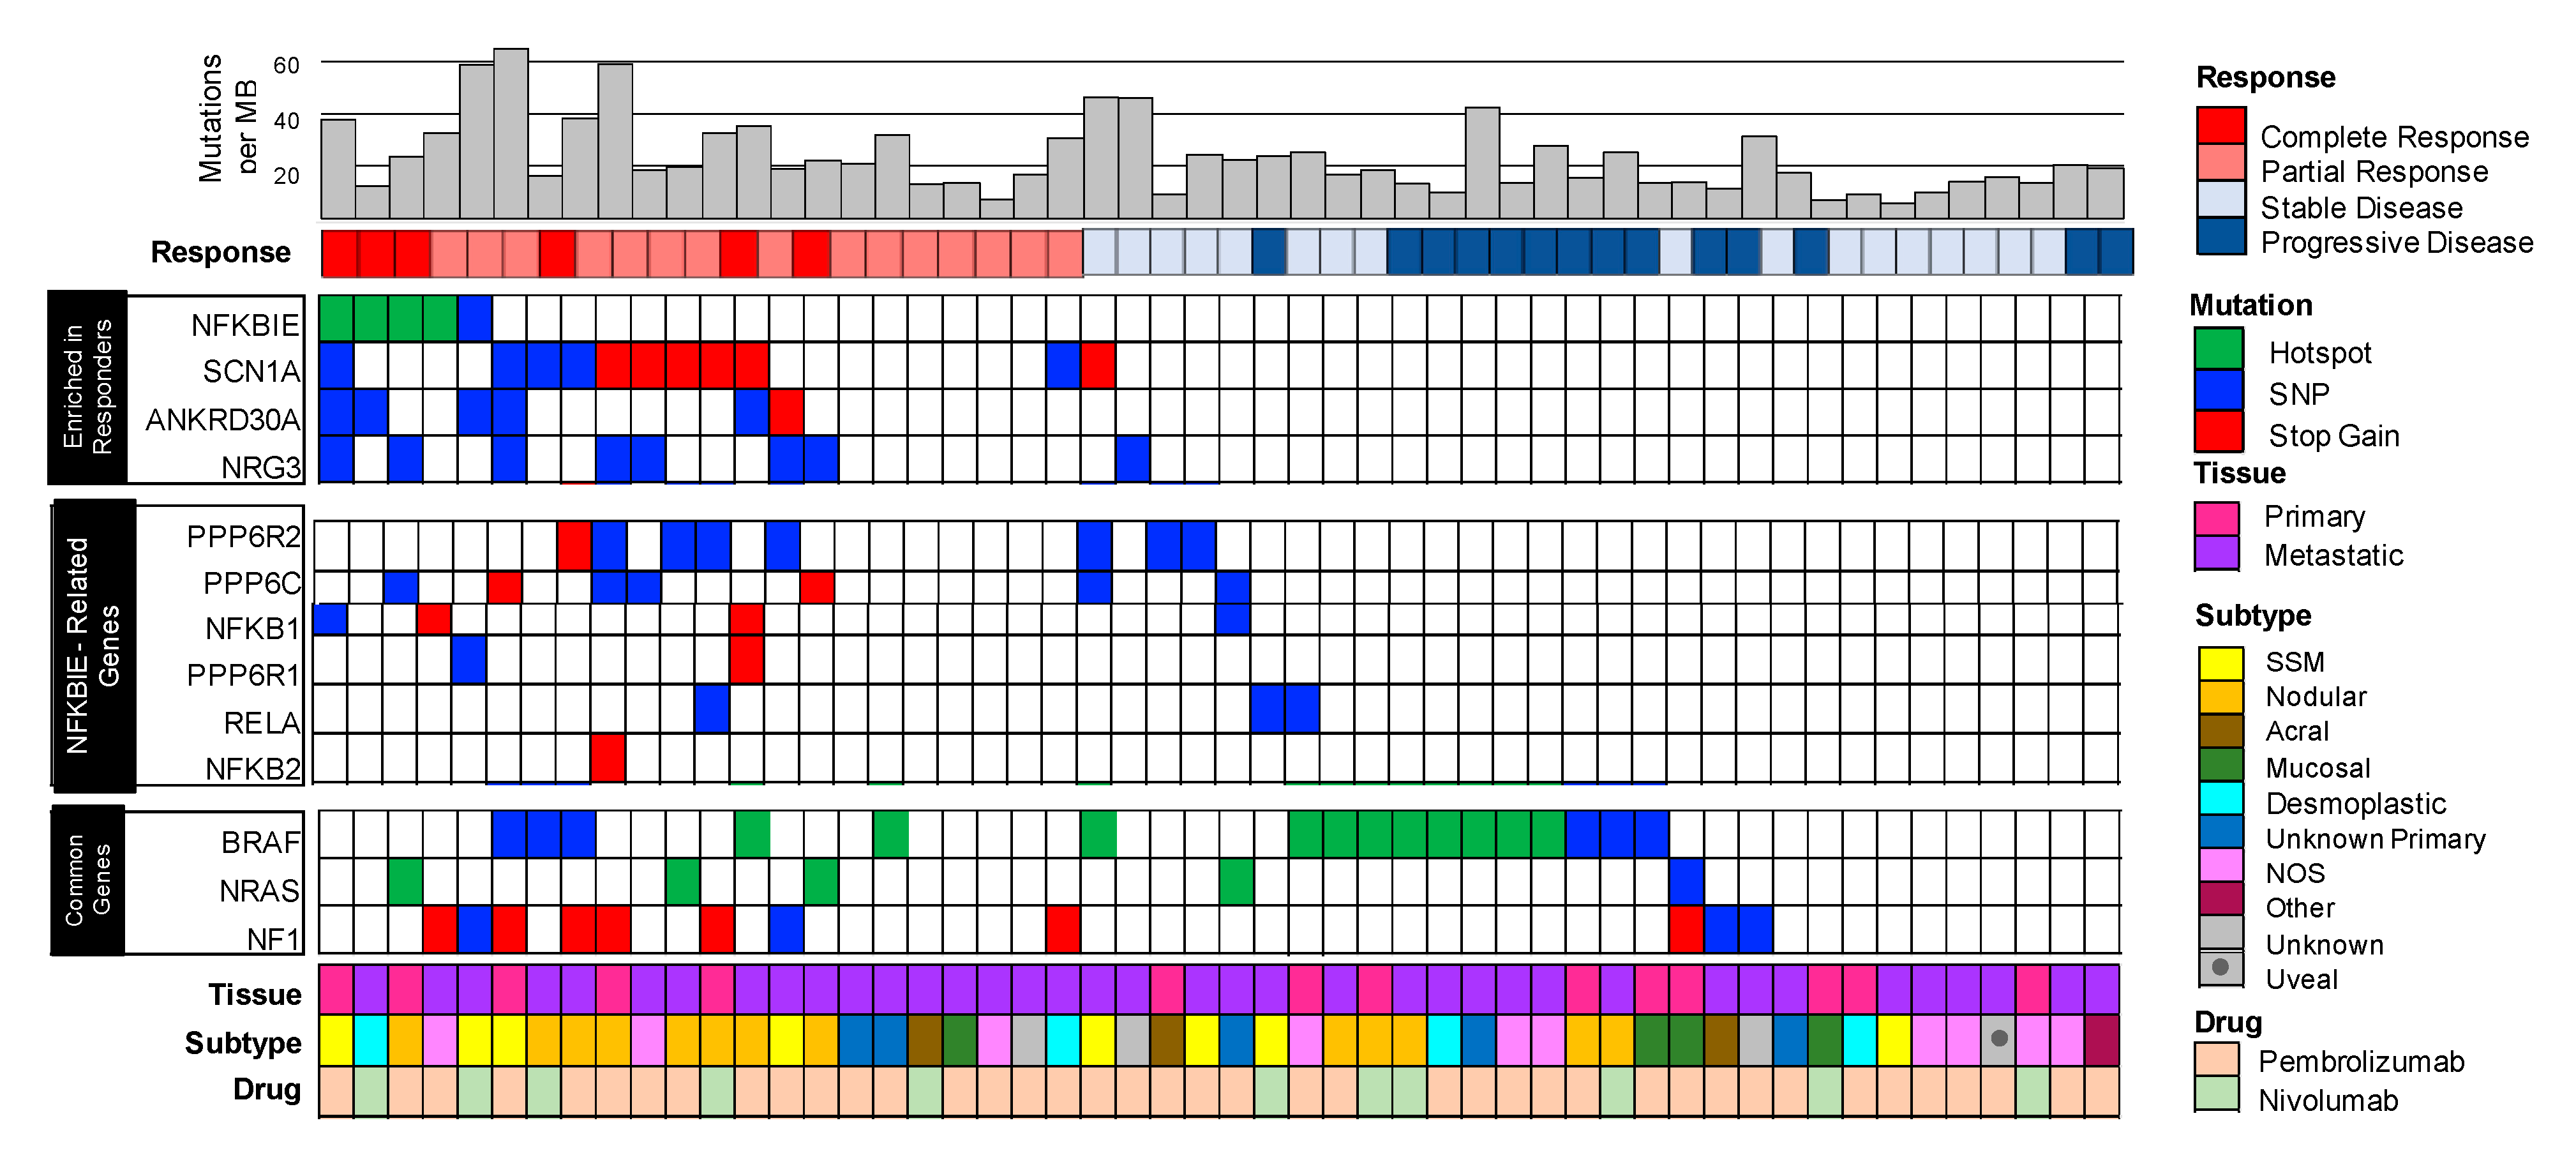
3.2. Mutated Genes Enriched in Patients that Responded to Immunotherapy Included the Hotspot Variant G34E in NFKBIE, (NFkB Inhibitor Epsilon) the Gene that Encodes for I-kappa-B-Epsilon (IkBe), a Negative Regulator of NFkB

The mutational landscape of pre-treated immunotherapy responders vs. non-responders is shown in Figure 1. Overall, 44 genes were found to be enriched (p < 0.05) in the responder group when compared to the non-responders group. SCN1A was the most significantly enriched gene and was mutated in 43% of responders compared to 6% of non-responders. ANKRD30A and NRG3 mutations were also enriched in the responding group with 28% and 33% of samples mutated, respectively. However, these genes lack recurrent hotspot mutations, making it difficult to evaluate their biological function or clinical utility. Perhaps the most interesting gene found to be mutated and enriched in responders was NFKBIE, a negative regulator of NFkB. Here we detected recurrent hotspot mutations in 24% (5/21) of responders. Four of these patients harbored a G34R/E mutation while one harbored a G41E mutation (Figure S1). We decided to pursue NFKBIE and the hotspot variant G34E for potential clinical implications and effects on NFkB signaling.

3.3. Enrichment of Mutations in NFKBIE-Related Genes Found in Responders Suggests Aberrations in the NFkB Signaling Pathway

NFKBIE is a negative regulator of the NFkB signaling cascade, a biological pathway which is important in cancer and inflammation [23,24]. In order to identify other potential mutants involved in this signaling cascade, the STRING (v10) database was used to identify other proteins that are known to interact with NFKBIE [25]. Six of these genes were also mutated more frequently in the responding cohort compared to the non-responders These genes along with NFKBIE comprise what we refer to here as the ‘NFKBIE-related genes’ and include: NFkB1, NFkB2, RELA, PPP6C, PPP6R1, and PPP6R2. In total, 67% (14/21) of responding patients had at least one mutation in one of the NFKBIE-related genes, compared to only 22% of non-responding patients (Figure 1).

3.4. Mutations in NFKBIE-Related Genes Correlate with Clinical Metrics Used to Measure Patient Responses to Immunotherapy

To further understand the clinical and genomic impact of mutations in the NFKBIE-related genes, mutational burden, tumor volume, and patient survival were analyzed (Figure 2). Patients that respond to immunotherapy have been shown to have a higher mutational burden [5]. Our study confirmed those results (Figure S2) while also showing that patients with a mutation in NFKBIE-related genes have a higher mutational burden (Figure 2C, p = 0.003). The percent change of each patient’s sample was calculated from baseline. As demonstrated in the waterfall plot in Figure 2A, 84% (16/19) patients with a mutation in the NFKBIE-related genes had a decreased tumor volume after immunotherapy treatment. Of these 16 patients, 14 demonstrated a decreased tumor volume of over 30% (Figure 2A). Patients with NFKBIE-related gene mutations in addition to decreased tumor volume also demonstrated a significant increase in progression free survival (Figure 2B, p = 0.03). These data establish that patients with NFKBIE mutations have an overall higher mutational burden, decreased tumor volume, and a statistically significant increase in survival.

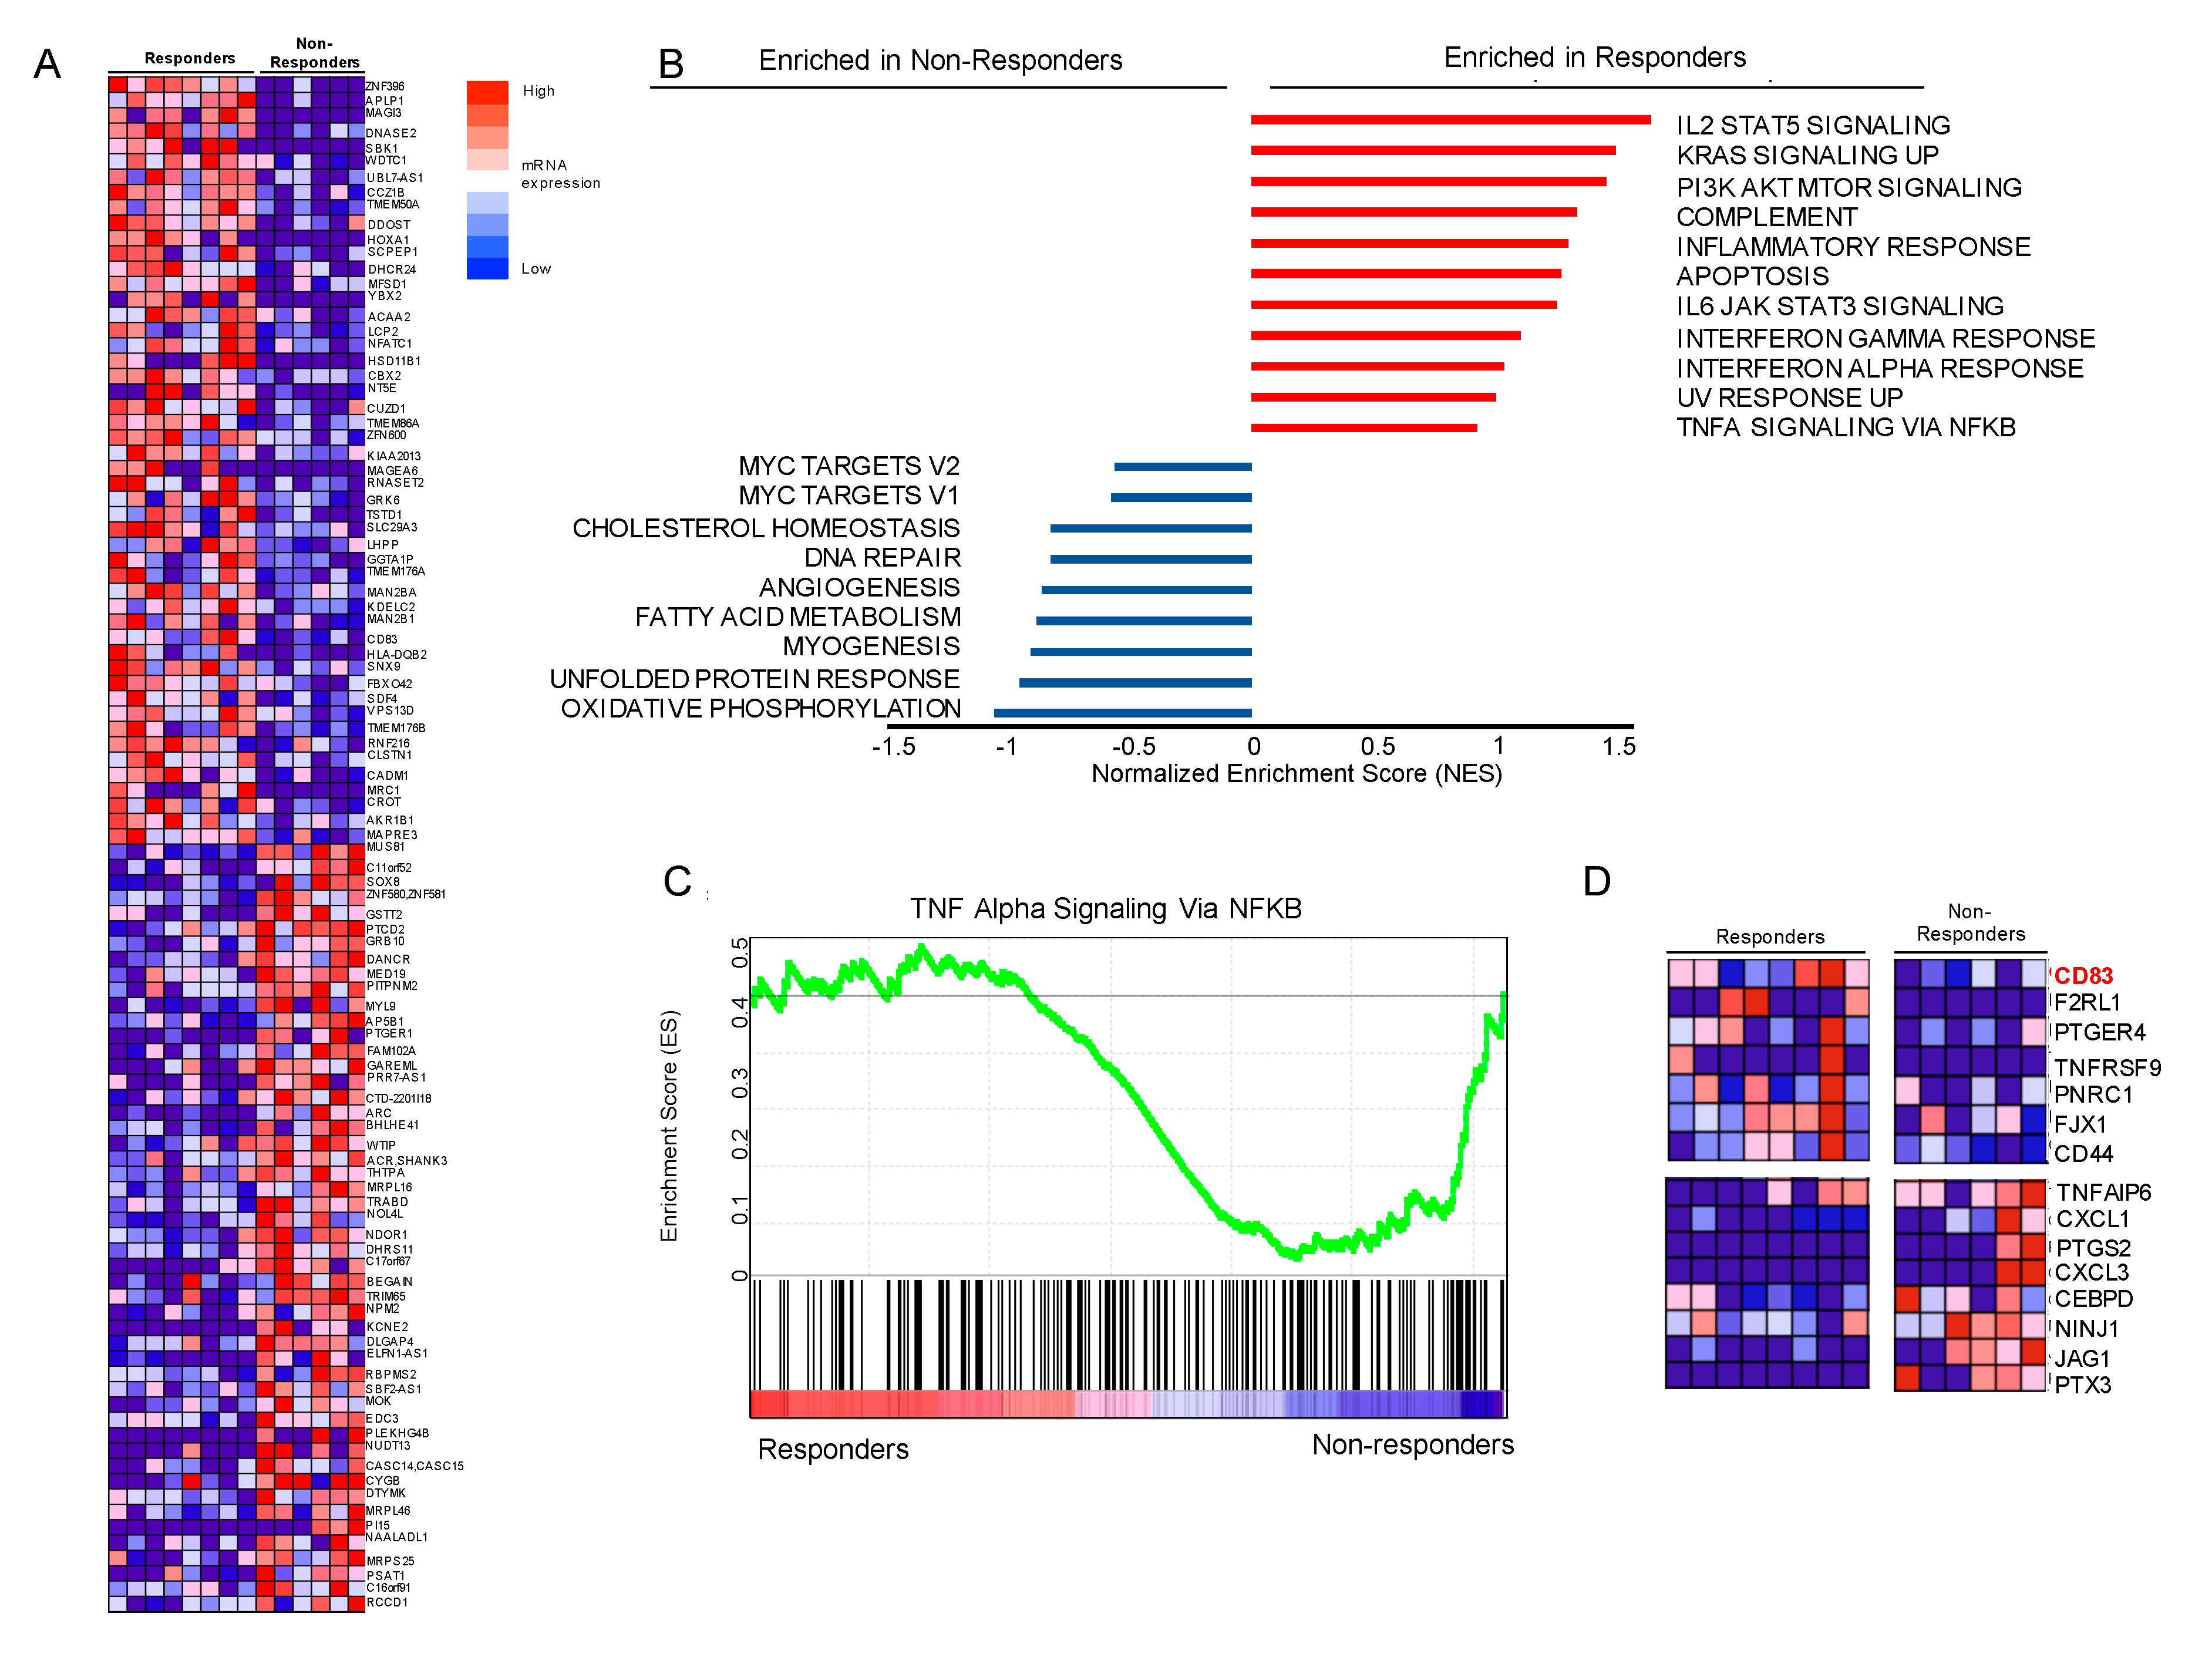
3.5. Gene Set Enrichment Analysis (GSEA) Suggests that Genes Involved in NFkB Signaling Are Differentially Expressed, Including Upregulation of CD83 in Our Responder Cohort

Whole transcriptome analysis (RNAseq) was performed on the tumor samples that were available and that passed quality control. The RNA cohort of samples consisted of 8 responding tumor samples and 6 non-responding tumor samples. The heatmap (Figure 3A) identifies the 100 mRNAs differentially expressed between the responder and non-responder tumors. Expression values are visualized as dark red being the highest expressed mRNA to dark blue as the lowest. To identify biological states or processes that are involved in the two different patient therapeutic outcome groups, we performed GSEA using the Molecular Signatures Database Hallmark collection (MSigDBv6.2, methods). Figure 3B highlights biological processes. In this panel they are ranked by normalized enrichment score (NES), a statistic used to assess gene set enrichment results. Based on these criteria, we concentrated on the TNFalpha signaling via NFkB pathway for possible gene candidates to follow up (Figure 3C, Tables S3 and S4). Located at the left and right edges of the graph are TNFalpha/NFkB pathway genes most differentially expressed in our cohort. They are pictured as a heatmap in Figure 3D and include CD83, upregulated in responders and a gene of recent interest in oncology, (Figure S3) [26,27].

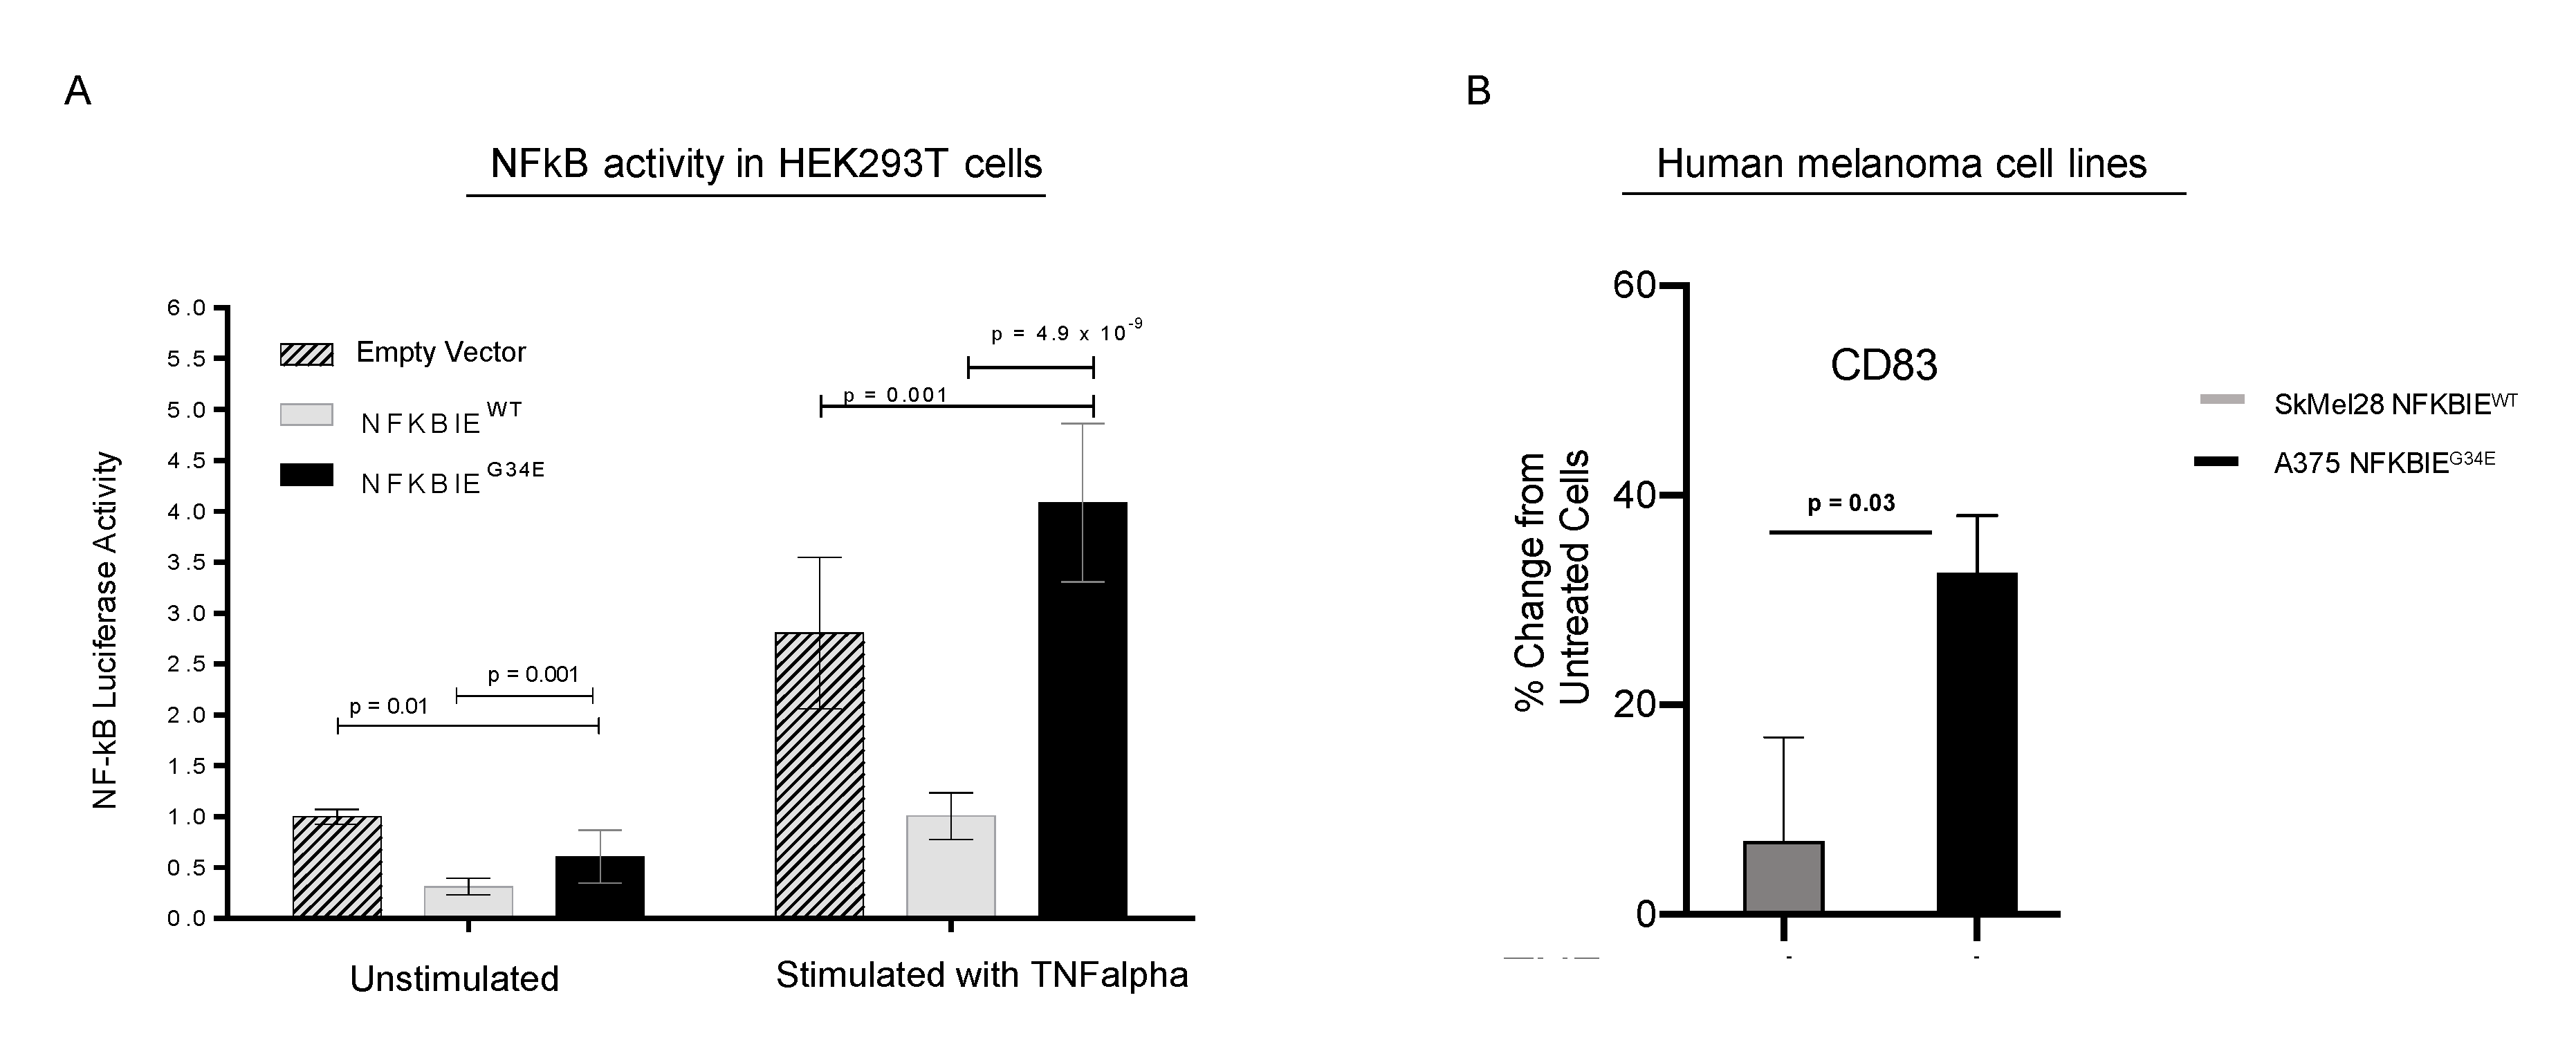
3.6. G34E of NFKBIE Is Likely a Loss-of-Function Variant, Resulting in Activation of NFkB Pathway

To determine how G34E affects NFKBIE’s inhibitory function on NFkB activity, we performed NFkB activity reporter assays using the HEK293T overexpression model (Figure 4A). Wildtype (WT), G34E NFKBIE cDNA plasmids, or empty vector (EV), with the luciferase-based NFkB reporter and normalizing plasmids were co-transfected into the cells, then incubated with and without TNFalpha ligand. We used luciferase as a readout for NFkB signaling and luminescent values were normalized to EV without stimulation. TNFalpha is a well-known activator of NFkB, while NFKBIE has been shown as a negative regulator of NFkB [28,29,30]. As expected, TNFalpha treatment induced NFkB activity drastically, and expressing WT NFKBIE blocked this induction, compared to EV. Moreover, expressing the G34E variant resulted in loss of NFKBIE’s inhibitory function, and significant activation of NFkB, as compared to cells transfected with WT, p = 4.9 × 10⁻⁹. G34E transfected cells even displayed higher NFkB activity than cells with EV (p = 0.001). At the basal level without TNFalpha stimulation, G34E cells also displayed slightly higher luciferase activity compared to the WT, further indicating that G34E is a loss-of-function variant. Consistent with the idea that CD83 is downstream of NFkB and can be affected by NFKBIE variants in melanomas, human melanoma cell line with G34E variant, A375, displayed TNFalpha-induced CD83 expression, compared to melanoma cell line with WT variant, SKEML28, (Figure 4B, Figure S4). Other downstream targets of NFkB, such as PDL1 and major histocompatability complex (MHC) class II, were also examined (Figure S4). However, the presence of these molecules was not particularly striking.

4. Discussion

Understanding how tumors evade the immune system marked a major turning point in the treatment of patients with metastatic melanoma and other cancers. With the use of single agent anti-PD1, 40–50% of patients with advanced or metastatic melanoma will have an initial response to therapy, and overall, 30–40% of patients will have a long-term durable clinical benefit [4]. However, the intersection of immunology and cancer biology creates challenges whereby a single genomic driver or biomarker (for example BRAF, KIT, or EGFR mutations in targeted therapies) do not adequately explain or predict response among patients being treated with anti-PD1 therapies. Therefore, it is important to explore mutational events that could predict favorable outcomes to anti-PD1 therapies.
Previous large-scale next generation sequencing studies of patients with melanoma undergoing immune checkpoint blockade have not fully investigated pre-therapeutic somatic mutations as predictors of response. Hugo et al. found that BRCA2 mutations were enriched in melanomas responsive to anti-PD1. These authors however did not link specific genomic variants with mRNA expression signatures in their transcriptome analysis [31]. Gide et al. combined RNAseq plus multiplex proteomics to analyze patients undergoing anti-PD1 monotherapy or in combination with anti-CTLA4. Their study focused on immune cell phenotyping and identified that EOMES + CD69 + CD45RO + T cells are associated with response [32]. In a large cohort of patients with metastatic melanoma, Liu et al. also analyzed pre-immune checkpoint blockade treated tumors using whole exome and whole transcriptome sequencing and suggested that MHC class I and II may predict response [33]. Interestingly, expression of MHC class I and class II molecules can be influenced by several factors including INFgamma, TNFalpha, and NFkB signaling [34,35]. Although they did not highlight any individual gene or variant that was significantly associated with response, their data support our finding. For example, the NFKBIE G34E variant and variants in related genes, such as PPP6R2, PPP6C, PPP6R1, RELA, NFKB2, and NFKB1, were found in several patients classified as complete or partial responders in the Liu et al. cohort. These are listed in the Liu et al. supplemental tables [33]. In a study similar to ours, Yu et al. used whole exome and transcriptome analysis of non-cutaneous melanoma and showed that CDK4 gene copy-number altered the expression of genes in TNFalpha/NFkB and INFgamma signaling pathways. It is unclear if they identified variants in NFKBIE-related genes; however, several cell cycle molecules are regulated by NFkB transcription [36,37]. We had too few non-cutaneous melanomas in our cohort to confirm their findings.
Our findings recapitulate current trends in which the average tumor mutational burden (TMB) is higher in the responder group compared to non-responders. Tumor mutational burden is commonly used as a predictor for immunotherapy response, yet it has weaknesses. In a review by Chan et al., one challenge of using this metric is that it “assigns equal weight to each tumor mutation” and ignores the need for integrating variants into treatment responses. Furthermore, patients with low TMB can respond to checkpoint inhibition suggesting that some mutations may be more important than others. In this study, we identified specific somatic mutations in NFKBIE with recurrent hotspot locations at codons G34 and G41, among patients who responded favorably to immunotherapy. By exploring other proteins that interact with NFKBIE, we also identified other mutations in NFKBIE-related genes that occurred more frequently in patients who responded positively to immunotherapy. Here, we show that samples with NFKBIE-related gene mutations had a significantly higher mutational burden than the wild-type cohort. High tumor mutational burden is often observed in cancers with deficiencies in genes involved with DNA damage response [38]. However, in this present study we cannot conclude if these mutations play a role in DNA damage response mechanisms. Patients with NFKBIE-related gene alterations also had significant clinical differences, including a greater shrinkage in tumor volume and a significant increase in progression free survival. Moreover, our study went beyond just sequencing the tumor which includes immune cells and the tumor microenvironment, and experimenting with melanoma cells. Our results indicated that the pathways we identified could be important within melanoma tumor cells, not immune cells. These data emphasized the potential functional impact the mutations caused in the melanoma itself that could ultimatley impact how the immune system responds.
NFKBIE is well described as a negative regulator of NFkB and NFKBIE has at least two isoforms, as described below. The genomic coordinates for the variants at codon G34 (chr6:44,233,400) are the same described by two separate genome sequencing studies in melanoma [7,39]. These studies did not address treatment outcomes in their patient cohorts. In desmoplastic melanoma, Shain et al. identified 20 clustered NFKBIE mutations in 15 of their tumor samples (across their study the overall frequency was 14.5%). The authors postulated two possible models for these NFKBIE variants—either they reside in the coding region of the long isoform or in the promoter region of the short isoform [39]. The G34E variant is in the coding region of the long isoform, and our in vitro data show that this mutation is loss-of-function, resulting in increased NFkB activity; as discussed below. Recent reports indicate that patients with desmoplastic melanomas have an overall response rate of 70% to immunotherapy [40]. Interestingly, our cohort contains one patient with desmoplastic melanoma who harbored a NFKBIE G34E mutation and had a complete response to immunotherapy. Further studies are needed to determine if this outcome would be similar in a larger desmoplastic melanoma patient set.
Our study confirms similar reports about the effect of NFKBIE variants on NFkB activity in rheumatoid arthritis (RA) and lymphoid malignancies (chronic lymphocytic leukemia (CLL), primary mediastinal B-cell lymphoma (PMBL) and Hodgkin lymphoma (HL)) [41,42,43]. In our overexpression experiments, NFkB activity was higher in the NFKBIE G34E transfected cells at both baseline and upon stimulation. The decrease in luciferase activity seen in stimulated and unstimulated wildtype transfected cells reflects the inhibitory nature of NFKBIE on NFkB signaling [29,30]. Similarly, non-synonymous single nucleotide polymorphisms in NFKBIE (6p21.1, rs2233433, and rs2233434) seen in patients with RA, leads to enhanced NFkB activity [43]. Likewise, in CLL, NFKBIE aberrations leads to functional loss of the protein it encodes, IkBe, resulting in nuclear translocation of RELA [42]. For these patients, NFkB signaling contributes to a worse outcome. However, our studies suggest the effects of NFKBIE variants may be from tumor cells, which are different from the RA or lymphoid malignancies.
As a transcription factor, NFkB modulates mRNA (and by extension protein) expression [44]. We speculated that these downstream targets ultimately interact with several diverse cellular pathways, particularly processes involved with immune function and inflammation [24,45]. To further investigate this, we examined the transcriptome of available patient tumors. Using Gene Set Enrichment Analysis (GSEA), we showed that tumors from responding patients in our cohort had enrichment of genes related to immune and inflammatory responses. Consistent with previous reports of patients with melanoma, our transcriptomic data also showed several differentially expressed genes involved with the IFNgamma and Interleukin/STAT signaling pathways [31,32,33,46]. Similar to Liu et al., we saw higher expression of MHC class II molecules in responders [33]. However, unique in the current study is the finding of enrichment of genes involved in TNFalpha/NFkB signaling. Of particular interest was CD83, a member of the immunoglobulin (Ig) superfamily, which is overexpressed in responders.
CD83 is a marker of mature dendritic cells and involved in the development of B and T cells. It has both soluble and membrane forms, and is emerging as an interesting immune-modulating molecule [47,48,49]. Prior studies have shown that CD83 is a downstream target of NFkB, and can be detected on solid and hematologic malignancies, and has been shown to influence the tumor microenvironment [50,51,52,53,54,55]. In patients with Hodgkin lymphoma, it can be secreted from tumor cells to influence expression of PD1 in surrounding T cells [26], and there are promising results using nivolumab in Hodgkin lymphoma patients [56,57]. Our study supports a role for CD83 in patients receiving anti-PD1 therapy. We propose that activation of NFkB signaling may lead to expression of CD83 at the mRNA and protein level. To expand on these findings, future studies are planned that would include the use of advanced techniques such as single cell RNA-seq or multiplex immunohistochemistry.

5. Conculusions

In summary, this study is the first to identify recurrent mutations in NFKBIE, a negative regulator of NFkB, as a partial genomic explanation for response to anti-PD1 immunotherapy in melanoma patients. Pre-treatment NFKBIE and NFKBIE-related gene mutations in patient samples correlated with clinical outcomes including decreased tumor volume and progression free survival. Additionally, by demonstrating that loss-of-function variants in NFKBIE activates NFkB signaling in tumor cells, and by identifying differentially expressed genes involved in TNFalpha/NFkB signaling in our cohort, we are able to show that this may be an important biological pathway in melanoma patients undergoing anti-PD1 therapy. The clinical, genomic, transcriptomic, and in vitro data presented indicate that increased tumor cell TNFalpha/NFkB signaling, as a consequence of an NFKBIE mutation, may contribute to a favorable anti-PD1 treatment response.

Supplementary Materials

The following are available online at https://www.mdpi.com/2072-6694/12/7/1943/s1, Figure S1. Validation of NFKBIE hotspot variants by PCR and Sanger sequencing; Integrative genomics viewer of patient tumors for Chr6:44,233,400, Figure S2. Tumor mutational burden in responders and non-responders to anti-PD, Figure S3. qRT-PCR validation of CD83 mRNA in tumor samples from responders and non-responders to anti-PD1, Figure S4. Downstream targets of NFkB including PDL1 and MHC class II proteins in NFKBIE G34E mutated specimens, Table S1. Patient clinical characteristics, Table S2. Specimen overview and analysis, Table S3. Gene Set Enrichment Analysis; HALLMARK Pathway Enrichment For the Cohort, Table S4. Gene Set Enrichment Analysis; Hallmark TNFalpha_signaling_via_NFkB Gene Enrichment Scores.

Author Contributions

Conceptualization, W.A.R. and K.W.; methodology, J.D.H., A.-C.T., K.W., and Y.G.S.; software, J.D.H., A.-C.T., and J.K.; formal Analysis, C.M.A. and J.D.H.; investigation, C.M.A., K.N., K.W., N.T.G., V.M.V., and R.P.T.; resources, W.A.R., K.W., A.A., N.T.G., T.M.M., M.R., K.D.L., R.G., and M.D.M.; data curation, C.M.A., J.D.H., K.W., N.T.G., and A.A.; writing—original draft preparation, C.M.A.; writing—review and editing, C.M.A., J.D.H., Y.G.S., and W.A.R.; supervision, W.A.R.; project administration, C.M.A. and A.A.; funding acquisition, K.W. and W.A.R. All authors have read and agreed to the published version of the manuscript.

Funding

This project was supported in part by a grant from The Cancer Leauge of Colorado (AWD-163263-WR). The authors wish to thank The Genomics and Microarray Shared Resource at the University of Colorado Denver Cancer Center for all next generation sequencing experimental design advice and technical support.

Acknowledgments

We also thank Tugy Chimed and Magdalena Glogowska for the immunohistochemistry support, and Rita Gonzalez for preparing patient peripheral blood DNA samples. A preliminary version of this work was presented as a poster at AACR 2019. C. Amato et al., Investigating the role of NFkB signaling and immune checkpoint blockade therapy in melanoma.

Conflicts of Interest

The authors declare no conflict of interest. The funders had no role in the design of the study; in the collection, analyses, or interpretation of data; in the writing of the manuscript, or in the decision to publish the results.

Abbreviations

Ankyrin Repeat Domain 30A(ANKRD30A); B-Raf Proto-Oncogene(BRAF); BRCA2 DNA Repair Associated(BRCA2); CD44 Molecule(CD44); CD83 Molecule(CD83); Cyclin Dependent Kinase 4(CDK4); Cyclin Dependent Kinase Inhibitor 2A(CDKN2A); CCAAT Enhancer Binding Protein Delta(CEBPD); Cytotoxic T-Lymphocyte Associated Protein 4(CTLA4); C-X-C Motif Chemokine Ligand 1(CXCL1); C-X-C Motif Chemokine Ligand 3(CXCL3); Epidermal Growth Factor Receptor(EGFR); F2R Like Trypsin Receptor 1(F2RL1); Four-Jointed Box Kinase 1(FJX1); Interferon Gamma(INFgamma); Jagged Canonical Notch Ligand 1(JAG1); KIT Proto-Oncogene(KIT); Neurofibromin 1(NF1); Nuclear Factor Kappa B(NFkB); Nuclear Factor Kappa B Subunit 1(NFKB1); Nuclear Factor Kappa B Subunit 2(NFKB2); NFKB Inhibitor Epsilon(NFKBIE); Ninjurin 1(NINJ1); NRAS Proto-Oncogene(NRAS); Neuregulin 3(NRG3); Programmed Cell Death 1(PD1); Programmed death ligand 1(PDL1); Proline Rich Nuclear Receptor Coactivator 1(PNRC1); Protein Phosphatase 6 Catalytic Subunit(PPP6C); Protein Phosphatase 6 Regulatory Subunit 1(PPP6R1); Protein Phosphatase 6 Regulatory Subunit 2(PPP6R2); Prostaglandin E Receptor 4(PTGER4); Prostaglandin-Endoperoxide Synthase 2(PTGS2); Pentraxin 3(PTX3); Rac Family Small GTPase 1(RAC1); Response Evaluation Criteria in Solid Tumours(RECIST); RELA Proto-Oncogene(RELA); Sodium Voltage-Gated Channel Alpha Subunit 1(SCN1A); Splicing Factor 3b Subunit 1(SF3B1); Telomerase Reverse Transcriptase(TERT); Tumor Necrosis Factor alpha(TNFA); TNF Alpha Induced Protein 6(TNFAIP6); TNF Receptor Superfamily Member 9(TNFRSF9).

References

  1. Achkar, T.; Tarhini, A.A. The use of immunotherapy in the treatment of melanoma. J. Hematol. Oncol. 2017, 10, 88. [Google Scholar] [CrossRef] [Green Version]
  2. Eggermont, A.M.M.; Blank, C.U.; Mandala, M.; Long, G.V.; Atkinson, V.; Dalle, S.; Haydon, A.; Lichinitser, M.; Khattak, A.; Carlino, M.S.; et al. Adjuvant Pembrolizumab versus Placebo in Resected Stage III Melanoma. N. Engl. J. Med. 2018, 378, 1789–1801. [Google Scholar] [CrossRef] [PubMed]
  3. Weber, J.; Mandala, M.; Del Vecchio, M.; Gogas, H.J.; Arance, A.M.; Cowey, C.L.; Dalle, S.; Schenker, M.; Chiarion-Sileni, V.; Marquez-Rodas, I.; et al. Adjuvant Nivolumab versus Ipilimumab in Resected Stage III or IV Melanoma. N. Engl. J. Med. 2017, 377, 1824–1835. [Google Scholar] [CrossRef] [PubMed]
  4. Hamid, O.; Robert, C.; Daud, A.; Hodi, F.S.; Hwu, W.J.; Kefford, R.; Wolchok, J.D.; Hersey, P.; Joseph, R.; Weber, J.S.; et al. Five-year survival outcomes for patients with advanced melanoma treated with pembrolizumab in KEYNOTE-001. Ann. Oncol. 2019, 30, 582–588. [Google Scholar] [CrossRef] [PubMed]
  5. Goodman, A.M.; Kato, S.; Bazhenova, L.; Patel, S.P.; Frampton, G.M.; Miller, V.; Stephens, P.J.; Daniels, G.A.; Kurzrock, R. Tumor mutational burden as an independent predictor of response to immunotherapy in diverse cancers. Mol. Cancer Ther. 2017, 16, 2598–2608. [Google Scholar] [CrossRef] [Green Version]
  6. Gibney, G.T.; Weiner, L.M.; Atkins, M.B. Predictive biomarkers for checkpoint inhibitor-based immunotherapy. Lancet Oncol. 2016, 17, e542–e551. [Google Scholar] [CrossRef] [Green Version]
  7. Hayward, N.K.; Wilmott, J.S.; Waddell, N.; Johansson, P.A.; Field, M.A.; Nones, K.; Patch, A.M.; Kakavand, H.; Alexandrov, L.B.; Burke, H.; et al. Whole-genome landscapes of major melanoma subtypes. Nature 2017, 545, 175–180. [Google Scholar] [CrossRef]
  8. Hintzsche, J.D.; Gorden, N.T.; Amato, C.M.; Kim, J.; Wuensch, K.E.; Robinson, S.E.; Applegate, A.J.; Couts, K.L.; Medina, T.M.; Wells, K.R.; et al. Whole-exome sequencing identifies recurrent SF3B1 R625 mutation and comutation of NF1 and KIT in mucosal melanoma. Melanoma Res. 2017, 27, 189–199. [Google Scholar] [CrossRef]
  9. Royer-Bertrand, B.; Torsello, M.; Rimoldi, D.; El Zaoui, I.; Cisarova, K.; Pescini-Gobert, R.; Raynaud, F.; Zografos, L.; Schalenbourg, A.; Speiser, D.; et al. Comprehensive Genetic Landscape of Uveal Melanoma by Whole-Genome Sequencing. Am. J. Hum. Genet. 2016, 99, 1190–1198. [Google Scholar] [CrossRef] [Green Version]
  10. Prickett, T.D.; Zerlanko, B.; Gartner, J.J.; Parker, S.C.J.; Dutton-Regester, K.; Lin, J.C.; Teer, J.K.; Wei, X.; Jiang, J.; Nisc Comparative Sequencing, P.; et al. Somatic mutations in MAP3K5 attenuate its proapoptotic function in melanoma through increased binding to thioredoxin. J. Investig. Dermatol. 2014, 134, 452–460. [Google Scholar] [CrossRef] [Green Version]
  11. Eisenhauer, E.A.; Therasse, P.; Bogaerts, J.; Schwartz, L.H.; Sargent, D.; Ford, R.; Dancey, J.; Arbuck, S.; Gwyther, S.; Mooney, M.; et al. New response evaluation criteria in solid tumours: Revised RECIST guideline (version 1.1). Eur. J. Cancer (Oxf. Engl. 1990) 2009, 45, 228–247. [Google Scholar] [CrossRef] [PubMed]
  12. Hintzsche, J.; Kim, J.; Yadav, V.; Amato, C.; Robinson, S.E.; Seelenfreund, E.; Shellman, Y.; Wisell, J.; Applegate, A.; McCarter, M.; et al. IMPACT: A whole-exome sequencing analysis pipeline for integrating molecular profiles with actionable therapeutics in clinical samples. J. Am. Med. Inform. Assoc. 2016, 23, 721–730. [Google Scholar] [CrossRef] [PubMed] [Green Version]
  13. Sim, N.L.; Kumar, P.; Hu, J.; Henikoff, S.; Schneider, G.; Ng, P.C. SIFT web server: Predicting effects of amino acid substitutions on proteins. Nucleic Acids Res. 2012, 40, W452–W457. [Google Scholar] [CrossRef] [PubMed]
  14. Adzhubei, I.A.; Schmidt, S.; Peshkin, L.; Ramensky, V.E.; Gerasimova, A.; Bork, P.; Kondrashov, A.S.; Sunyaev, S.R. A method and server for predicting damaging missense mutations. Nat. Methods 2010, 7, 248–249. [Google Scholar] [CrossRef] [Green Version]
  15. Bamford, S.; Dawson, E.; Forbes, S.; Clements, J.; Pettett, R.; Dogan, A.; Flanagan, A.; Teague, J.; Futreal, P.A.; Stratton, M.R.; et al. The COSMIC (Catalogue of Somatic Mutations in Cancer) database and website. Br. J. Cancer 2004, 91, 355–358. [Google Scholar] [CrossRef]
  16. University of California Santa Cruz Genomics Institute. Available online: https://www.genome.ucsc.edu. (accessed on 11 July 2020).
  17. Trapnell, C.; Roberts, A.; Goff, L.; Pertea, G.; Kim, D.; Kelley, D.R.; Pimentel, H.; Salzberg, S.L.; Rinn, J.L.; Pachter, L. Differential gene and transcript expression analysis of RNA-seq experiments with TopHat and Cufflinks. Nat. Protoc. 2012, 7, 562–578. [Google Scholar] [CrossRef] [Green Version]
  18. Trapnell, C.; Hendrickson, D.G.; Sauvageau, M.; Goff, L.; Rinn, J.L.; Pachter, L. Differential analysis of gene regulation at transcript resolution with RNA-seq. Nat. Biotechnol. 2012, 31, 46–53. [Google Scholar] [CrossRef]
  19. Subramanian, A.; Tamayo, P.; Mootha, V.K.; Mukherjee, S.; Ebert, B.L.; Gillette, M.A.; Paulovich, A.; Pomeroy, S.L.; Golub, T.R.; Lander, E.S.; et al. Gene set enrichment analysis: A knowledge-based approach for interpreting genome-wide expression profiles. Proc. Natl. Acad. Sci. USA 2005, 102, 15545. [Google Scholar] [CrossRef] [Green Version]
  20. Gene Set Enrichment Analysis User Guide. Available online: https://www.gsea-msigdb.org/gsea/doc/GSEAUserGuideFrame.html?Interpreting_GSEA (accessed on 11 July 2020).
  21. Liberzon, A.; Birger, C.; Thorvaldsdóttir, H.; Ghandi, M.; Mesirov, J.P.; Tamayo, P. The Molecular Signatures Database Hallmark Gene Set Collection. Cell Syst. 2015, 1, 417–425. [Google Scholar] [CrossRef] [Green Version]
  22. Edgar, R.; Domrachev, M.; Lash, A.E. Gene Expression Omnibus: NCBI gene expression and hybridization array data repository. Nucleic Acids Res. 2002, 30, 207–210. [Google Scholar] [CrossRef] [Green Version]
  23. Hoesel, B.; Schmid, J.A. The complexity of NF-kappaB signaling in inflammation and cancer. Mol. Cancer 2013, 12, 86. [Google Scholar] [CrossRef] [PubMed] [Green Version]
  24. Liu, T.; Zhang, L.; Joo, D.; Sun, S.C. NF-kappaB signaling in inflammation. Signal Transduct. Target Ther. 2017, 2. [Google Scholar] [CrossRef] [PubMed] [Green Version]
  25. Szklarczyk, D.; Franceschini, A.; Wyder, S.; Forslund, K.; Heller, D.; Huerta-Cepas, J.; Simonovic, M.; Roth, A.; Santos, A.; Tsafou, K.P.; et al. STRING v10: Protein-protein interaction networks, integrated over the tree of life. Nucleic Acids Res. 2015, 43, D447–D452. [Google Scholar] [CrossRef] [PubMed]
  26. Li, Z.; Ju, X.; Lee, K.; Clarke, C.; Hsu, J.L.; Abadir, E.; Bryant, C.E.; Pears, S.; Sunderland, N.; Heffernan, S.; et al. CD83 is a new potential biomarker and therapeutic target for Hodgkin lymphoma. Haematologica 2018, 103, 655–665. [Google Scholar] [CrossRef] [PubMed] [Green Version]
  27. Ananiev, J.; Gulubova, M.V.; Manolova, I.M. Prognostic significance of CD83 positive tumor-infiltrating dendritic cells and expression of TGF-beta 1 in human gastric cancer. Hepatogastroenterology 2011, 58, 1834–1840. [Google Scholar] [CrossRef] [PubMed]
  28. Yamamoto, Y.; Gaynor, R.B. IkappaB kinases: Key regulators of the NF-kappaB pathway. Trends Biochem. Sci. 2004, 29, 72–79. [Google Scholar] [CrossRef]
  29. Whiteside, S.T.; Epinat, J.C.; Rice, N.R.; Israël, A. I kappa B epsilon, a novel member of the IκB family, controls RelA and cRel NF-κB activity. EMBO J. 1997, 16, 1413–1426. [Google Scholar] [CrossRef]
  30. Oeckinghaus, A.; Ghosh, S. The NF-kappaB family of transcription factors and its regulation. Cold Spring Harb. Perspect. Biol. 2009, 1, a000034. [Google Scholar] [CrossRef]
  31. Hugo, W.; Zaretsky, J.M.; Sun, L.; Song, C.; Moreno, B.H.; Hu-Lieskovan, S.; Berent-Maoz, B.; Pang, J.; Chmielowski, B.; Cherry, G.; et al. Genomic and Transcriptomic Features of Response to Anti-PD-1 Therapy in Metastatic Melanoma. Cell 2016, 165, 35–44. [Google Scholar] [CrossRef] [Green Version]
  32. Gide, T.N.; Quek, C.; Menzies, A.M.; Tasker, A.T.; Shang, P.; Holst, J.; Madore, J.; Lim, S.Y.; Velickovic, R.; Wongchenko, M.; et al. Distinct Immune Cell Populations Define Response to Anti-PD-1 Monotherapy and Anti-PD-1/Anti-CTLA-4 Combined Therapy. Cancer Cell 2019, 35, 238–255.e6. [Google Scholar] [CrossRef] [Green Version]
  33. Liu, D.; Schilling, B.; Sucker, A.; Livingstone, E.; Jerby-Amon, L.; Zimmer, L.; Gutzmer, R.; Satzger, I.; Loquai, C.; Grabbe, S.; et al. Integrative molecular and clinical modeling of clinical outcomes to PD1 blockade in patients with metastatic melanoma. Nat. Med. 2019, 25, 1916–1927. [Google Scholar] [CrossRef] [Green Version]
  34. Maio, M.; Gulwani, B.; Morgano, A.; Ferrone, S. Differential modulation by tumor necrosis factor and immune interferon of HLA class-II antigens expressed by melanoma cells. Int. J. Cancer 1989, 44, 554–559. [Google Scholar] [CrossRef] [PubMed]
  35. Jongsma, M.L.M.; Guarda, G.; Spaapen, R.M. The regulatory network behind MHC class I expression. Mol. Immunol. 2019, 113, 16–21. [Google Scholar] [CrossRef] [PubMed]
  36. Ledoux, A.C.; Perkins, N.D. NF-κB and the cell cycle. Biochem. Soc. Trans. 2014, 42, 76–81. [Google Scholar] [CrossRef] [PubMed]
  37. Iwanaga, R.; Ozono, E.; Fujisawa, J.; Ikeda, M.A.; Okamura, N.; Huang, Y.; Ohtani, K. Activation of the cyclin D2 and cdk6 genes through NF-kappaB is critical for cell-cycle progression induced by HTLV-I Tax. Oncogene 2008, 27, 5635–5642. [Google Scholar] [CrossRef] [Green Version]
  38. Mei, P.; Freitag, C.E.; Wei, L.; Zhang, Y.; Parwani, A.V.; Li, Z. High tumor mutation burden is associated with DNA damage repair gene mutation in breast carcinomas. Diagn. Pathol. 2020, 15, 50. [Google Scholar] [CrossRef]
  39. Shain, A.H.; Garrido, M.; Botton, T.; Talevich, E.; Yeh, I.; Sanborn, J.Z.; Chung, J.; Wang, N.J.; Kakavand, H.; Mann, G.J.; et al. Exome sequencing of desmoplastic melanoma identifies recurrent NFKBIE promoter mutations and diverse activating mutations in the MAPK pathway. Nat. Genet. 2015, 47, 1194–1199. [Google Scholar] [CrossRef]
  40. Eroglu, Z.; Zaretsky, J.M.; Hu-Lieskovan, S.; Kim, D.W.; Algazi, A.; Johnson, D.B.; Liniker, E.; Ben, K.; Munhoz, R.; Rapisuwon, S.; et al. High response rate to PD-1 blockade in desmoplastic melanomas. Nature 2018, 553, 347–350. [Google Scholar] [CrossRef]
  41. Mansouri, L.; Noerenberg, D.; Young, E.; Mylonas, E.; Abdulla, M.; Frick, M.; Asmar, F.; Ljungstrom, V.; Schneider, M.; Yoshida, K.; et al. Frequent NFKBIE deletions are associated with poor outcome in primary mediastinal B-cell lymphoma. Blood 2016, 128, 2666–2670. [Google Scholar] [CrossRef] [Green Version]
  42. Mansouri, L.; Sutton, L.A.; Ljungstrom, V.; Bondza, S.; Arngarden, L.; Bhoi, S.; Larsson, J.; Cortese, D.; Kalushkova, A.; Plevova, K.; et al. Functional loss of IkappaBepsilon leads to NF-kappaB deregulation in aggressive chronic lymphocytic leukemia. J. Exp. Med. 2015, 212, 833–843. [Google Scholar] [CrossRef]
  43. Myouzen, K.; Kochi, Y.; Okada, Y.; Terao, C.; Suzuki, A.; Ikari, K.; Tsunoda, T.; Takahashi, A.; Kubo, M.; Taniguchi, A.; et al. Functional variants in NFKBIE and RTKN2 involved in activation of the NF-kappaB pathway are associated with rheumatoid arthritis in Japanese. PLoS Genet. 2012, 8, e1002949. [Google Scholar] [CrossRef] [PubMed]
  44. Mitchell, S.; Vargas, J.; Hoffmann, A. Signaling via the NFkappaB system. Wiley Interdiscip. Rev. Syst. Biol. Med. 2016, 8, 227–241. [Google Scholar] [CrossRef] [Green Version]
  45. Andreakos, E.; Williams, R.O.; Wales, J.; Foxwell, B.M.; Feldmann, M. Activation of NF-kappaB by the intracellular expression of NF-kappaB-inducing kinase acts as a powerful vaccine adjuvant. Proc. Natl. Acad. Sci. USA 2006, 103, 14459–14464. [Google Scholar] [CrossRef] [Green Version]
  46. Ayers, M.; Lunceford, J.; Nebozhyn, M.; Murphy, E.; Loboda, A.; Kaufman, D.R.; Albright, A.; Cheng, J.D.; Kang, S.P.; Shankaran, V.; et al. IFN-gamma-related mRNA profile predicts clinical response to PD-1 blockade. J. Clin. Investig. 2017, 127, 2930–2940. [Google Scholar] [CrossRef] [PubMed]
  47. Doebbeler, M.; Koenig, C.; Krzyzak, L.; Seitz, C.; Wild, A.; Ulas, T.; Baßler, K.; Kopelyanskiy, D.; Butterhof, A.; Kuhnt, C.; et al. CD83 expression is essential for Treg cell differentiation and stability. JCI Insight 2018, 3. [Google Scholar] [CrossRef] [Green Version]
  48. Hirano, N.; Butler, M.O.; Xia, Z.; Ansen, S.; von Bergwelt-Baildon, M.S.; Neuberg, D.; Freeman, G.J.; Nadler, L.M. Engagement of CD83 ligand induces prolonged expansion of CD8+ T cells and preferential enrichment for antigen specificity. Blood 2006, 107, 1528–1536. [Google Scholar] [CrossRef] [PubMed]
  49. Li, Z.; Ju, X.; Silveira, P.A.; Abadir, E.; Hsu, W.H.; Hart, D.N.J.; Clark, G.J. CD83: Activation Marker for Antigen Presenting Cells and Its Therapeutic Potential. Front. Immunol. 2019, 10, 1312. [Google Scholar] [CrossRef] [PubMed] [Green Version]
  50. Baleeiro, R.B.; Bergami-Santos, P.C.; Tomiyoshi, M.Y.; Gross, J.L.; Haddad, F.; Pinto, C.A.; Soares, F.A.; Younes, R.N.; Barbuto, J.A. Expression of a dendritic cell maturation marker CD83 on tumor cells from lung cancer patients and several human tumor cell lines: Is there a biological meaning behind it? Cancer Immunol. Immunother. 2008, 57, 265–270. [Google Scholar] [CrossRef]
  51. Baleeiro, R.B.; Barbuto, J.A. Local secretion/shedding of tumor-derived CD83 molecules as a novel tumor escape mechanism. Mol. Immunol. 2008, 45, 3502–3504. [Google Scholar] [CrossRef]
  52. Juric, D.; Lacayo, N.J.; Ramsey, M.C.; Racevskis, J.; Wiernik, P.H.; Rowe, J.M.; Goldstone, A.H.; O’Dwyer, P.J.; Paietta, E.; Sikic, B.I. Differential gene expression patterns and interaction networks in BCR-ABL-positive and -negative adult acute lymphoblastic leukemias. J. Clin. Oncol. 2007, 25, 1341–1349. [Google Scholar] [CrossRef]
  53. Huynh, M.Q.; Wacker, H.H.; Wündisch, T.; Sohlbach, K.; Kim, T.D.; Krause, M.; Stabla, K.; Roth, P.; Fischbach, W.; Stolte, M.; et al. Expression profiling reveals specific gene expression signatures in gastric MALT lymphomas. Leuk. Lymphoma 2008, 49, 974–983. [Google Scholar] [CrossRef] [PubMed]
  54. Mareschal, S.; Pham-Ledard, A.; Viailly, P.J.; Dubois, S.; Bertrand, P.; Maingonnat, C.; Fontanilles, M.; Bohers, E.; Ruminy, P.; Tournier, I.; et al. Identification of somatic mutations in primary cutaneous diffuse large b-cell lymphoma, leg type by massive parallel sequencing. J. Investig. Dermatol. 2017, 137, 1984–1994. [Google Scholar] [CrossRef] [PubMed] [Green Version]
  55. Berchtold, S.; Muhl-Zurbes, P.; Maczek, E.; Golka, A.; Schuler, G.; Steinkasserer, A. Cloning and characterization of the promoter region of the human CD83 gene. Immunobiology 2002, 205, 231–246. [Google Scholar] [CrossRef] [PubMed]
  56. Ansell, S.M.; Lesokhin, A.M.; Borrello, I.; Halwani, A.; Scott, E.C.; Gutierrez, M.; Schuster, S.J.; Millenson, M.M.; Cattry, D.; Freeman, G.J.; et al. PD-1 blockade with nivolumab in relapsed or refractory Hodgkin’s lymphoma. N. Engl. J. Med. 2015, 372, 311–319. [Google Scholar] [CrossRef] [Green Version]
  57. Armand, P.; Engert, A.; Younes, A.; Fanale, M.; Santoro, A.; Zinzani, P.L.; Timmerman, J.M.; Collins, G.P.; Ramchandren, R.; Cohen, J.B.; et al. Nivolumab for relapsed/refractory classic hodgkin lymphoma after failure of autologous hematopoietic cell transplantation: Extended follow-up of the multicohort single-arm phase ii checkmate 205 trial. J. Clin. Oncol. 2018, 36, 1428–1439. [Google Scholar] [CrossRef] [PubMed]
Figure 1. The pre-therapeutic mutational landscape of responders (n = 21) vs. non-responders (n = 31) to immunotherapy. Plot of clinical and genomic variants. Each column represents a separate patient. Each row represents, from top to bottom: mutational burden calculated as number of mutations per megabase, best response (RECIST criteria: from left to right complete and partial response; stable and progressive disease), gene variants enriched in responders (NFKBIE, SCN1A, ANKRD30A, and NRG3), variants in NFKBIE-related genes as identified by STRING v10, see methods (PPP6R2, PPP6C, NFKB1, PPP6R1, RELA, and NFKB2), common melanoma genes (BRAF, NRAS, and NF1). Patient clinical characteristics are described, from top to bottom as: type of tissue assayed (primary or metastatic lesion), primary type of melanoma (superficial spreading, nodular, acral, mucosal, desmoplastic, unknown primary, not otherwise specified, other, and unknown). Note in particular the genes enriched in responders including NFKBIE and NFKBIE-related genes. The common melanoma genes are evenly distributed between the groups.
Cancers 12 01943 g001
Figure 2. The clinical and genomic comparison of NFKBIE-related wild-type (n = 33) vs. mutant patients (n = 19). Patients with an NFKBIE-related gene mutation (either PPP6R2, PPP6C, NFKB1, PPP6R1, RELA, and NFKB2) are identified in green, and patients wild-type for these genes are identified in orange. (A) Waterfall plot depicting the percent change in tumor size by RECIST criteria. Fourteen patients with a mutation in a NFKBIE-related gene had tumor regression ≥ 30%, marked by grey dashed lines. (B) Progression free survival (PFS, p = 0.03) time in months for patients with and without a NFKBIE-related gene mutation. (Kaplan–Meier curves. p-values calculated using chi-squared, Mantel–Cox test). Patients harboring a tumor with a mutation in a NFKBIE-related gene had longer PFS times than patients who did not. (C) The difference in tumor mutational burden between tumors with a variant in a NFKBIE-related gene compared to those that are wildtype. Tumor mutational burden (TMB) is the measurement of the number of variants within the tumor as calculated by number of mutations per megabase as sequenced by whole exome, see methods (p = 0.003). The error bars represent standard deviation. p-values were calculated using an un-paired t-test.
Cancers 12 01943 g002
Figure 3. The pre-therapeutic transcriptional landscape of responders (n = 8) vs. non-responders (n = 6) to immunotherapy using Gene Set Enrichment Analysis (GSEA): The two outcome groups, responders and non-responders, were compared using GSEA (A) Heatmap of the expression profiles in patient tumors (columns) representing the 50 upregulated and 50 downregulated mRNA. The responders are on the left and non-responders are grouped on the right; the corresponding gene names are listed on the far-right side. Values represent gene expression calculated from the Jensen–Shannon divergence (JSD) method and are depicted as a range of colors: red being the highest to dark blue as the lowest. (B) The Hallmark pathway profiles of the two groups are graphed using their normalized enrichment score (NES). (C) Detailed enrichment plot of the Hallmark TNFalpha signaling via NFkB pathway. This depicts the following: Top panel-the running enrichment scores in green. Bottom panel—black vertical bars show position of genes within the ranked list (188 genes remain after filtering). (D) Emphasizing the ‘edge genes’ as a heatmap; the expression levels are represented for CD83, F2RL1, PTGER4, TNFRSF9, PNRC1, FJX1, and CD44 (highly expressed in responders), and TNFAIP6, CXCL1, PTGS2, CXCL3, CEBPD, NINJ1, JAG1, and PTX3 (downregulated in responders). Expression values and intensities are as described in (A).
Cancers 12 01943 g003
Figure 4. In vitro experiments to assess the effect of NFKBIE G34E on the NFKB pathway. Functional analysis of the NFKBIE G34E variant and wildtype was performed. Cells were stimulated with TNFalpha and monitored for NFkB activity via luciferase reporter assay or protein expression of CD83 by flow cytometry. (A) HEK293T cells were transiently transfected with a luciferase-based NFkB reporter, then either: empty vector or plasmids containing the NFKBIE G34E or NFKBIE wildtype cDNA sequences. Under TNFalpha stimulation, NFKBIE G34E transfected cells displayed an increase in luciferase activity when compared to cells transfected with empty vector (p = 0.001), and wildtype transfected cells (p = 4.9 × 10⁻⁹). When cultured without TNFalpha, transfected cells exhibited a decrease in luciferase activity. Values were normalized to empty vector in unstimulated conditions. (B) Flow cytometry analysis for CD83 in human melanoma cell lines that are NFKBIE wildtype and NFKBIE G34E mutant (SKMel28 and A375, respectively). Data are represented as the percent change in protein expression as compared to unstimulated cells. When stimulated, the A375 cell line showed a greater increase in CD83 protein expression as compared to SkMel28 (p = 0.03). For panels (A,B) all p-values were calculated using an un-paired t-test with Holm–Sidak correction for multiple tests. Data represent the standard deviation of the mean. The experiments were performed in technical triplicates, and independently repeated three times.
Cancers 12 01943 g004
Table 1. Cohort clinical characteristics.
Total Cohort52
Sex
Male34 (65%)
Female18 (35%)
Age (year)
Median56
Range22–87
Mutational Analysis
BRAF (V600E/K)11 (21%)
NRAS (G13_/Q61_)4 (7%)
NF111 (21%)
Immune Checkpoint Therapy
Nivolomab11 (21%)
Pembrolizumab41 (79%)
Response
Complete Response6 (11%)
Partial Response15 (28%)
Stable Disease16 (30%)
Progressive Disease15 (28%)
Melanoma Subtype
Superficial Spreading17 (33%)
Nodular13 (25%)
Desmoplastic4 (7%)
Unknown Primary5 (9%)
Acral3 (5%)
Mucosal4 (7%)
Ocular1 (2%)
Other5 (9%)
Stage at Diagnosis
III Unresectable1 (2%)
IIIB2 (3%)
IIIC10 (19%)
IV39 (75%)

