Knockout of MMP3 Weakens Solid Tumor Organoids and Cancer Extracellular Vesicles

 , , , , and
Abstract
:
1. Introduction
2. Results
2.1. MMP3 Knockout Reduces the Release of CD9 and CD63 within Extracellular Vesicles
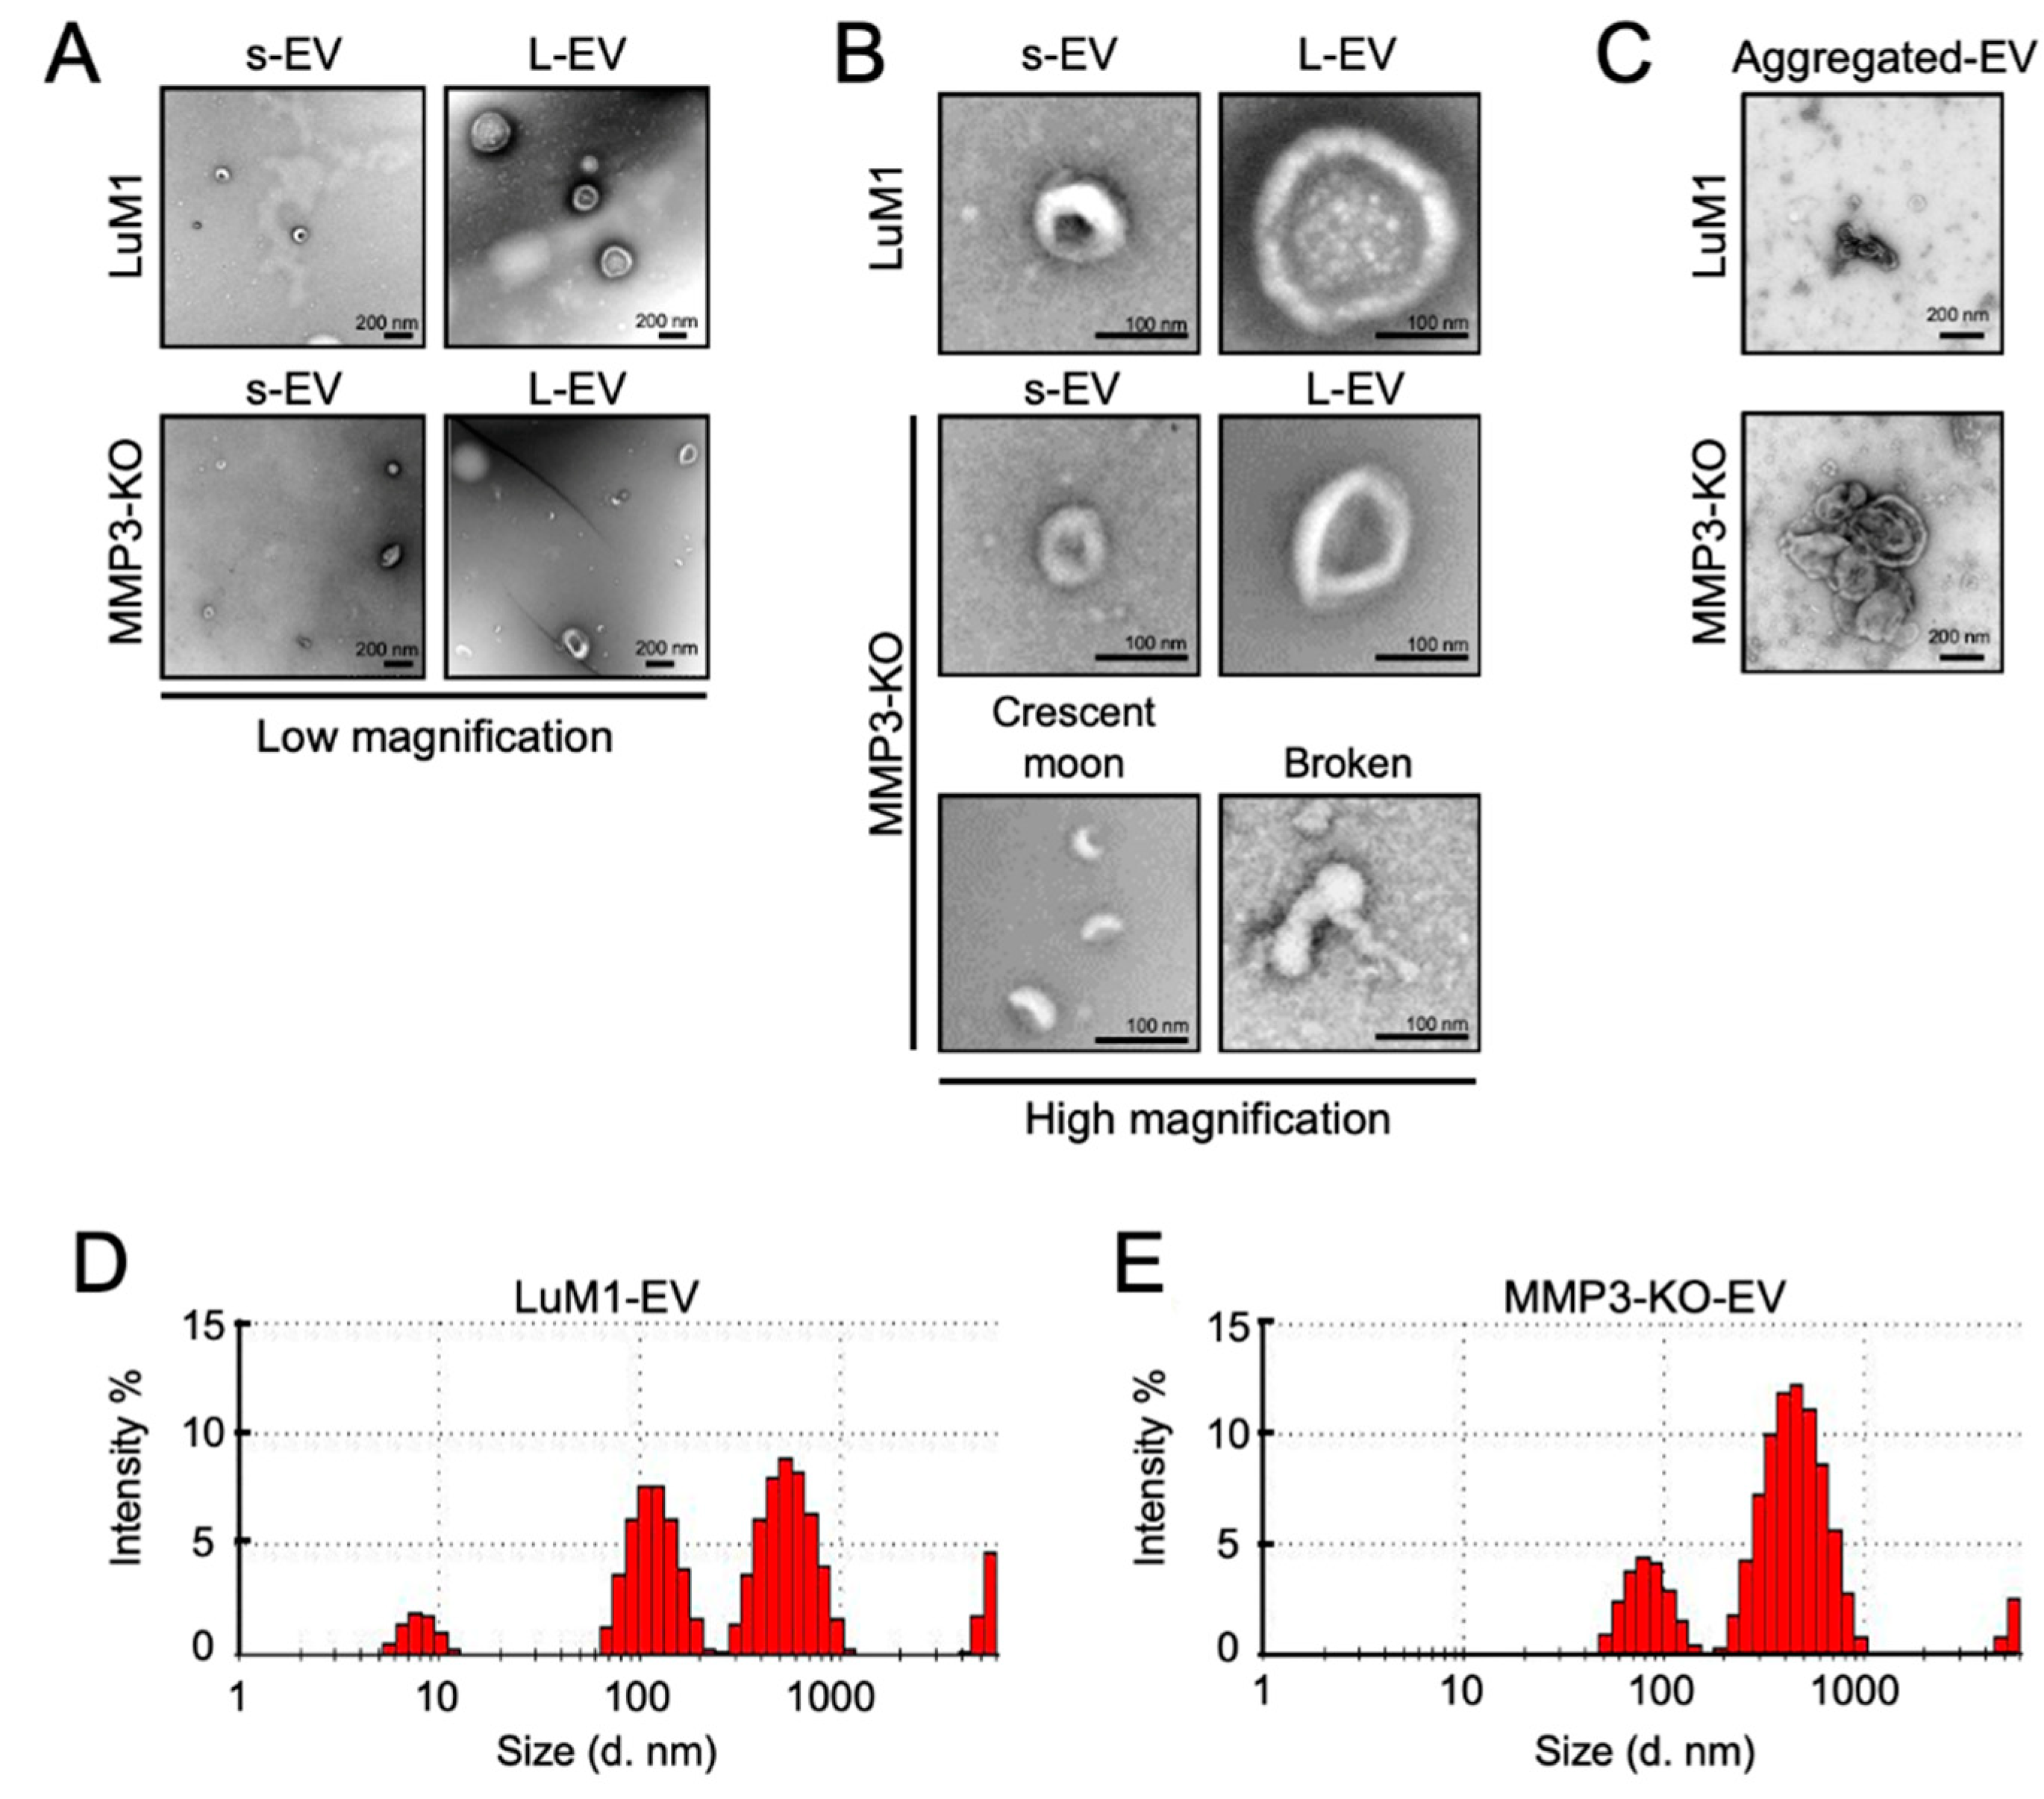
2.2. MMP3 Knockout Impacts Physical Integrities of Extracellular Vesicles
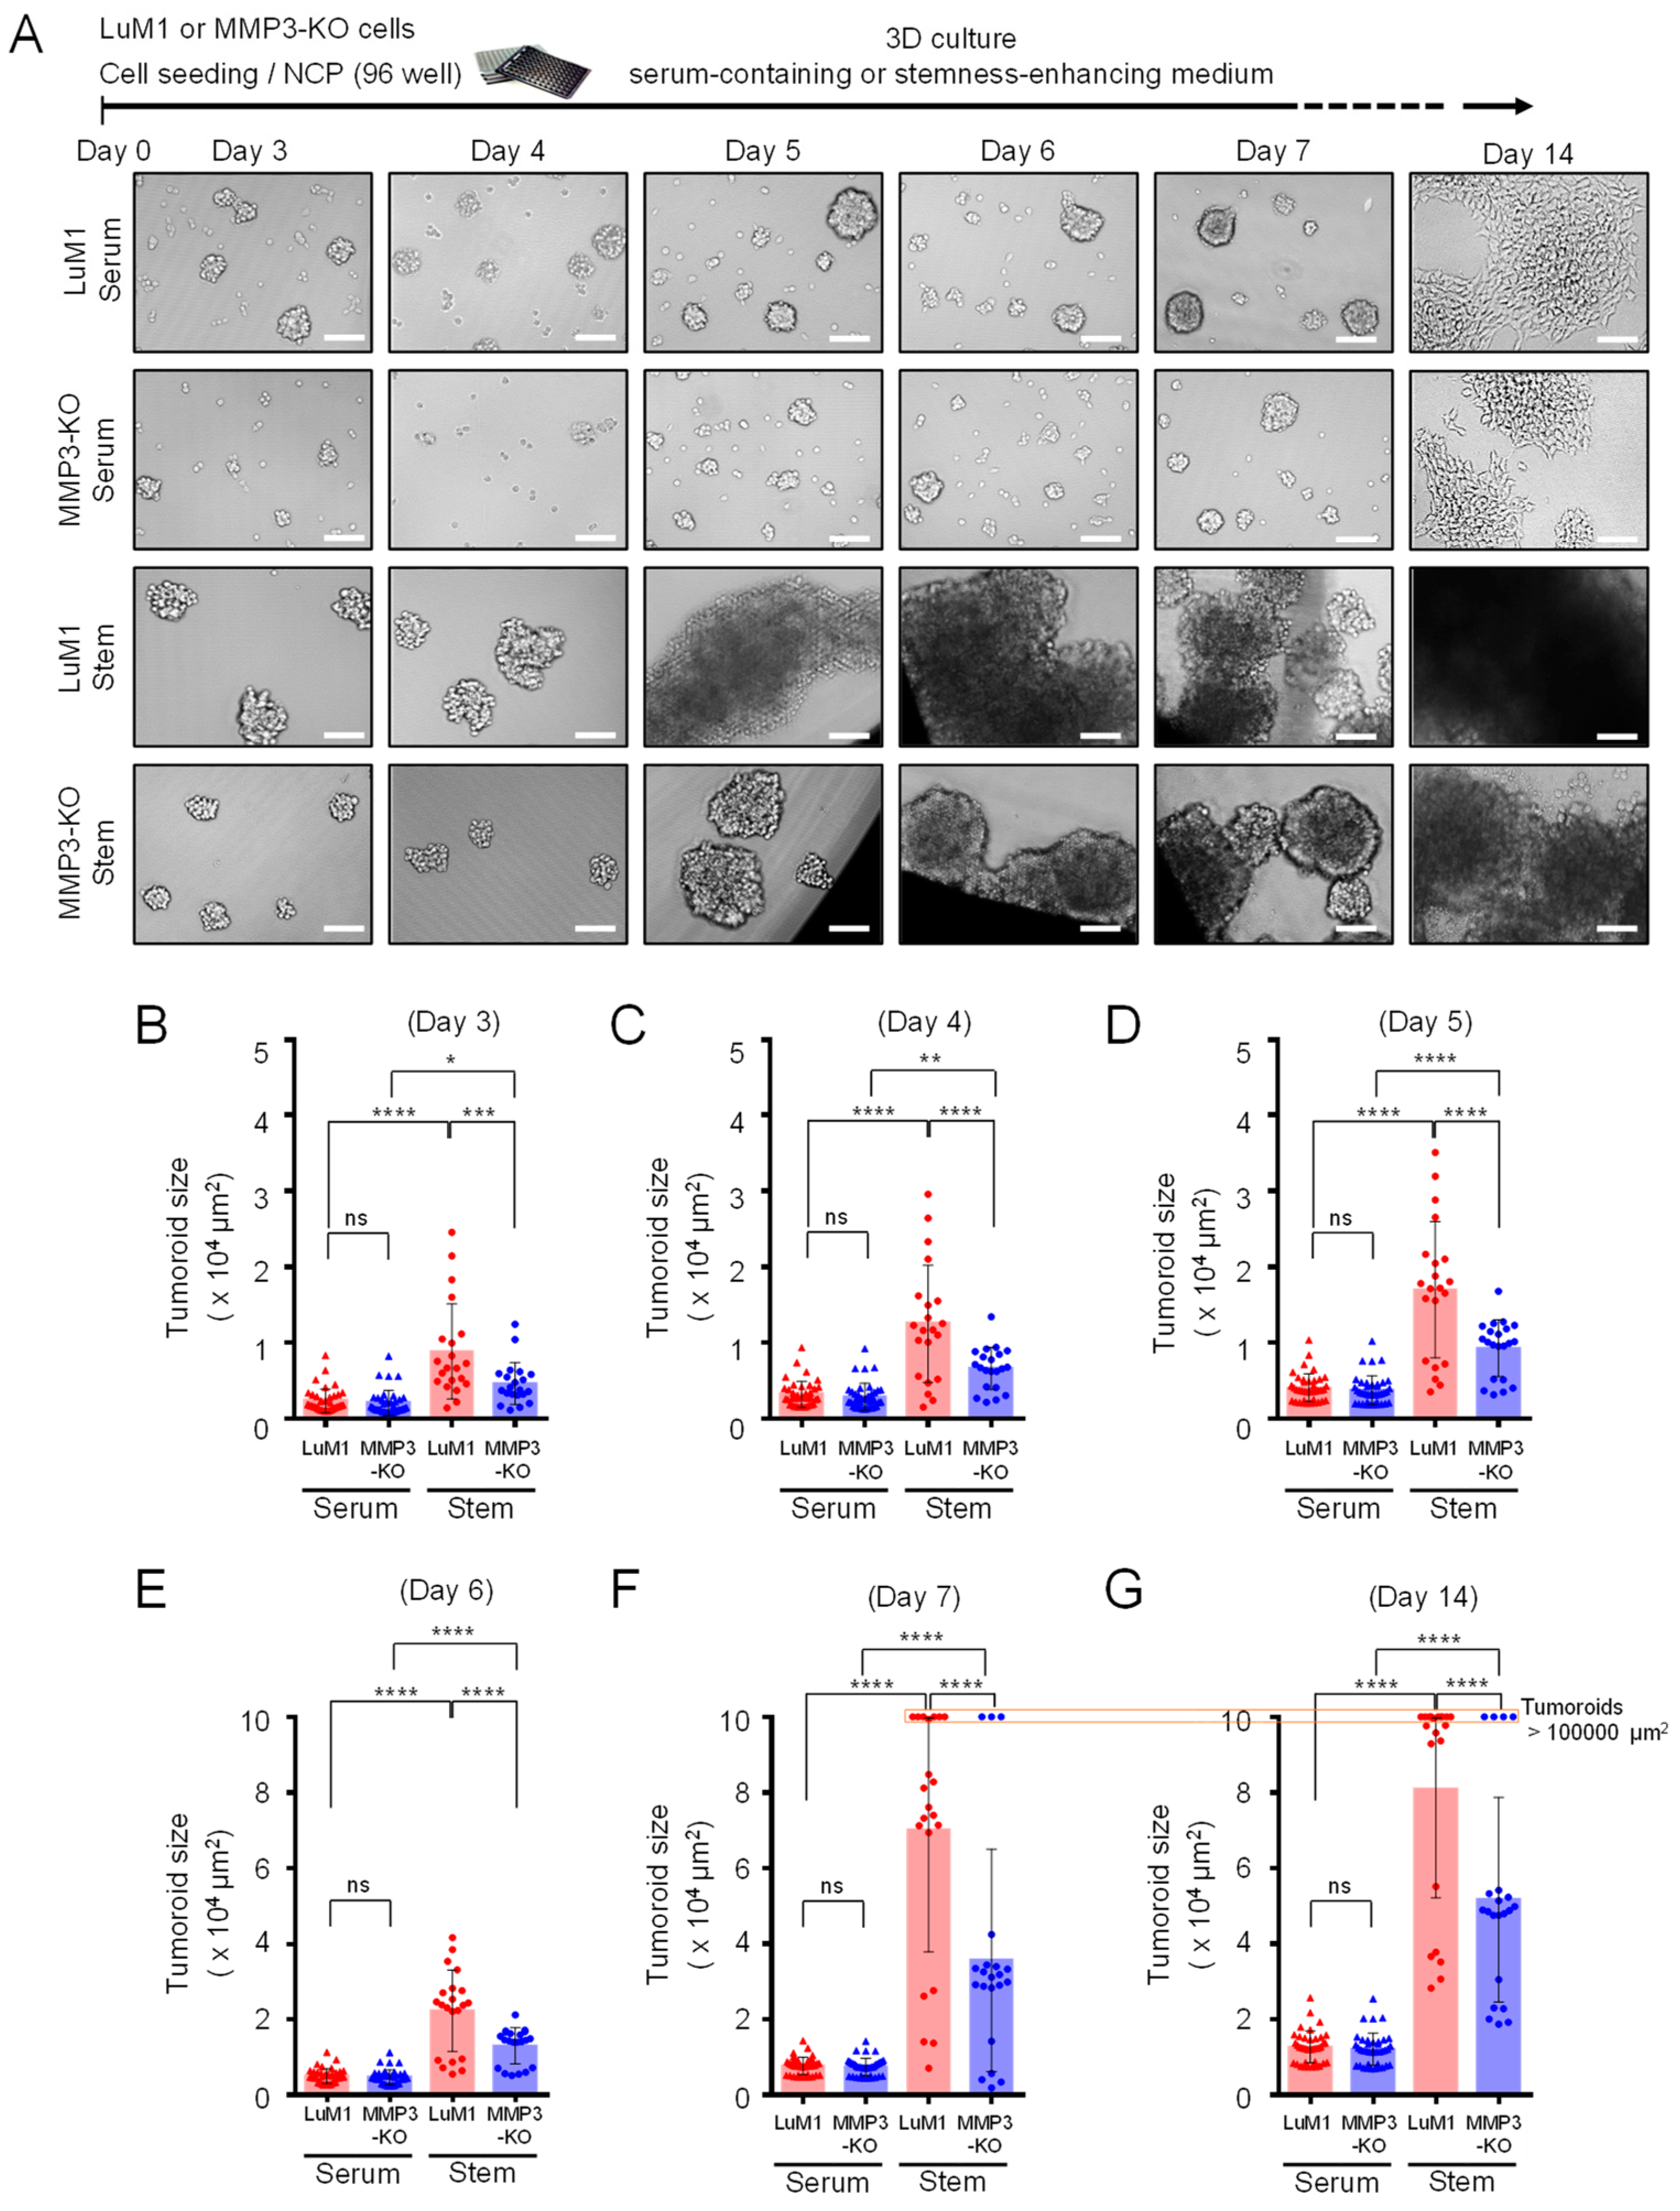
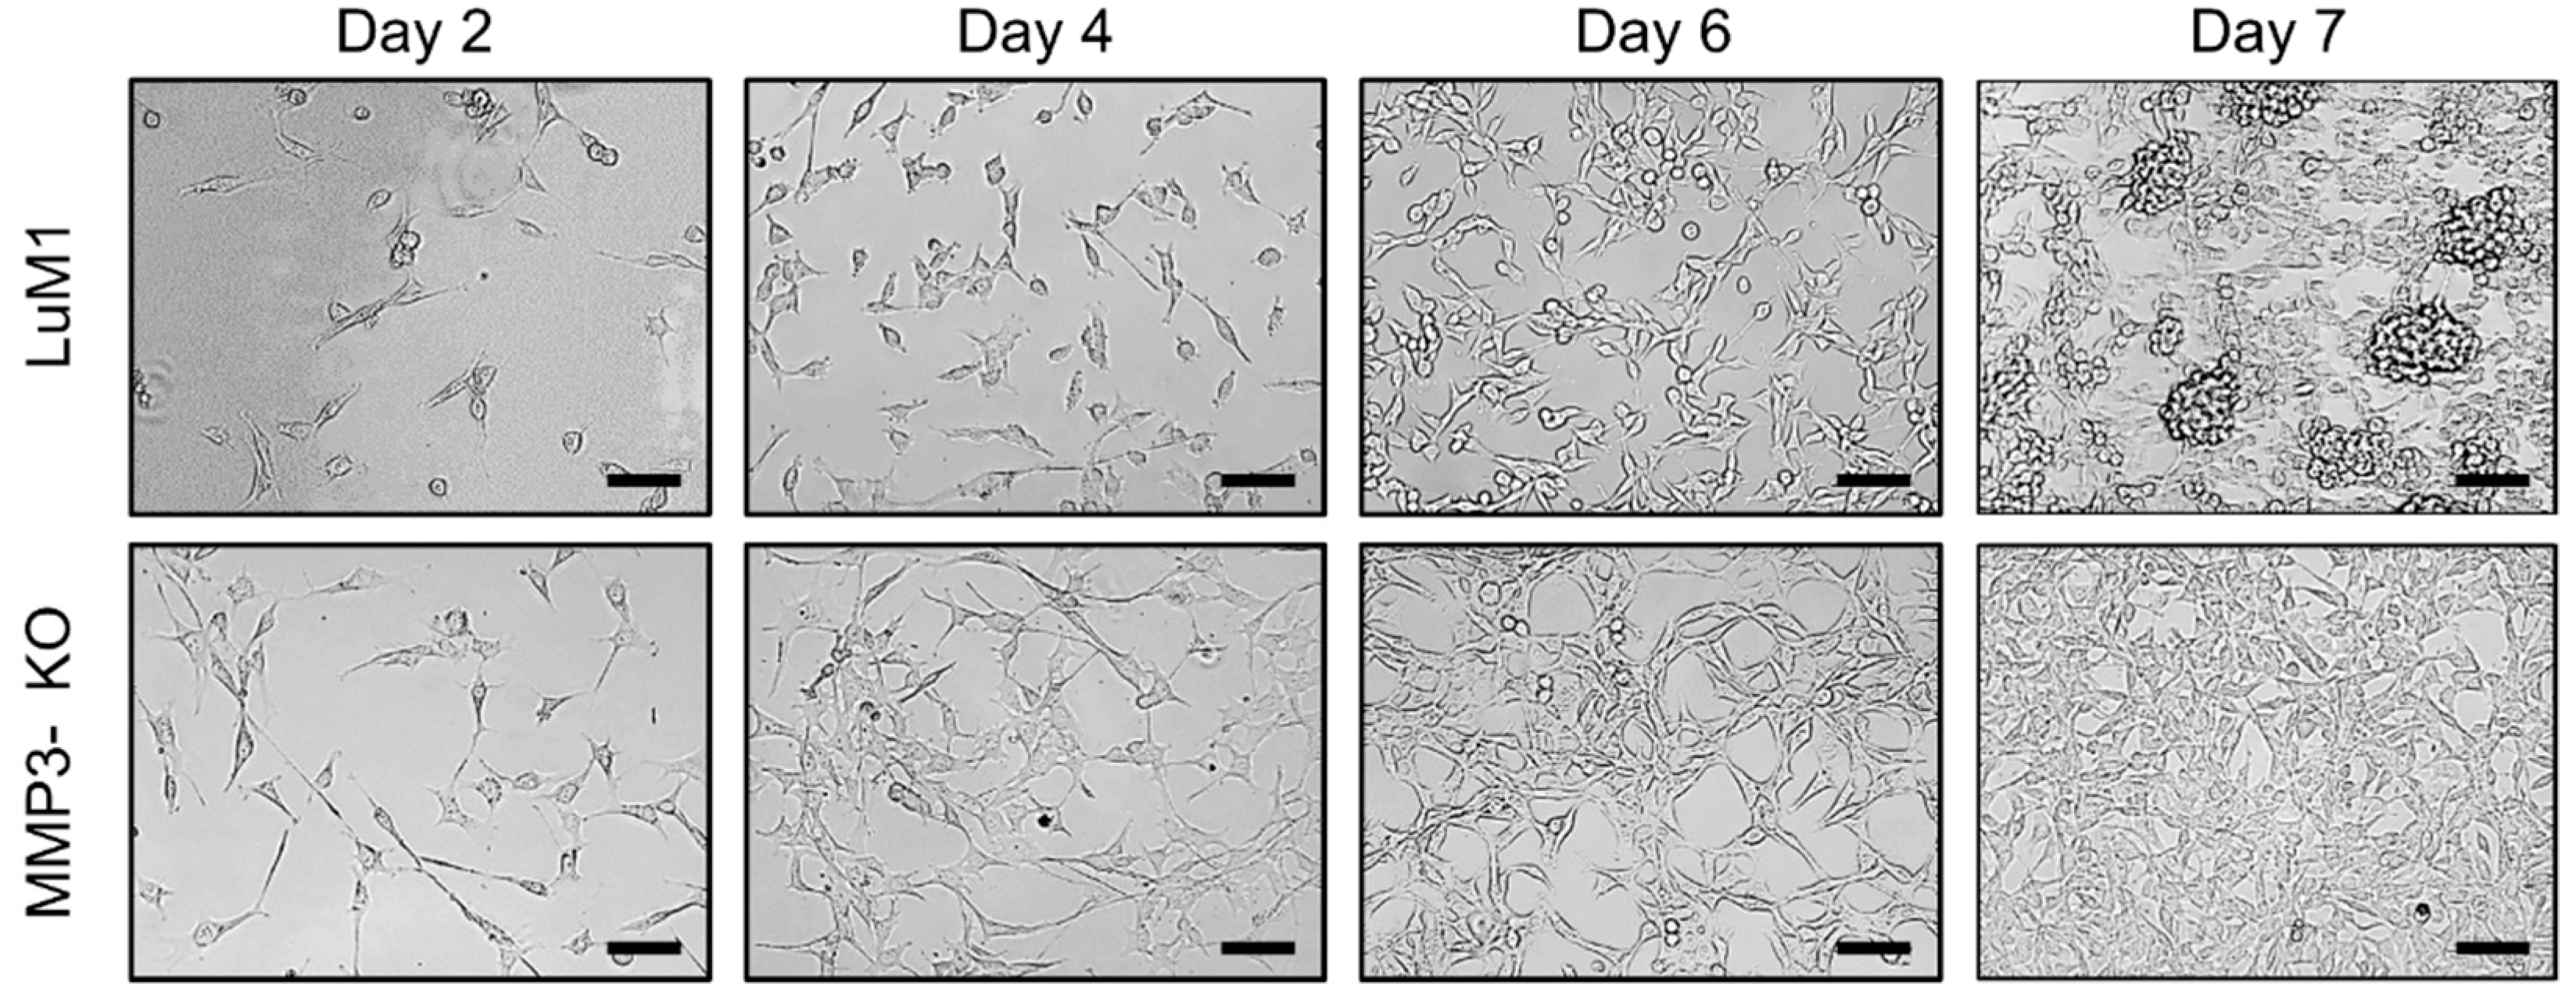
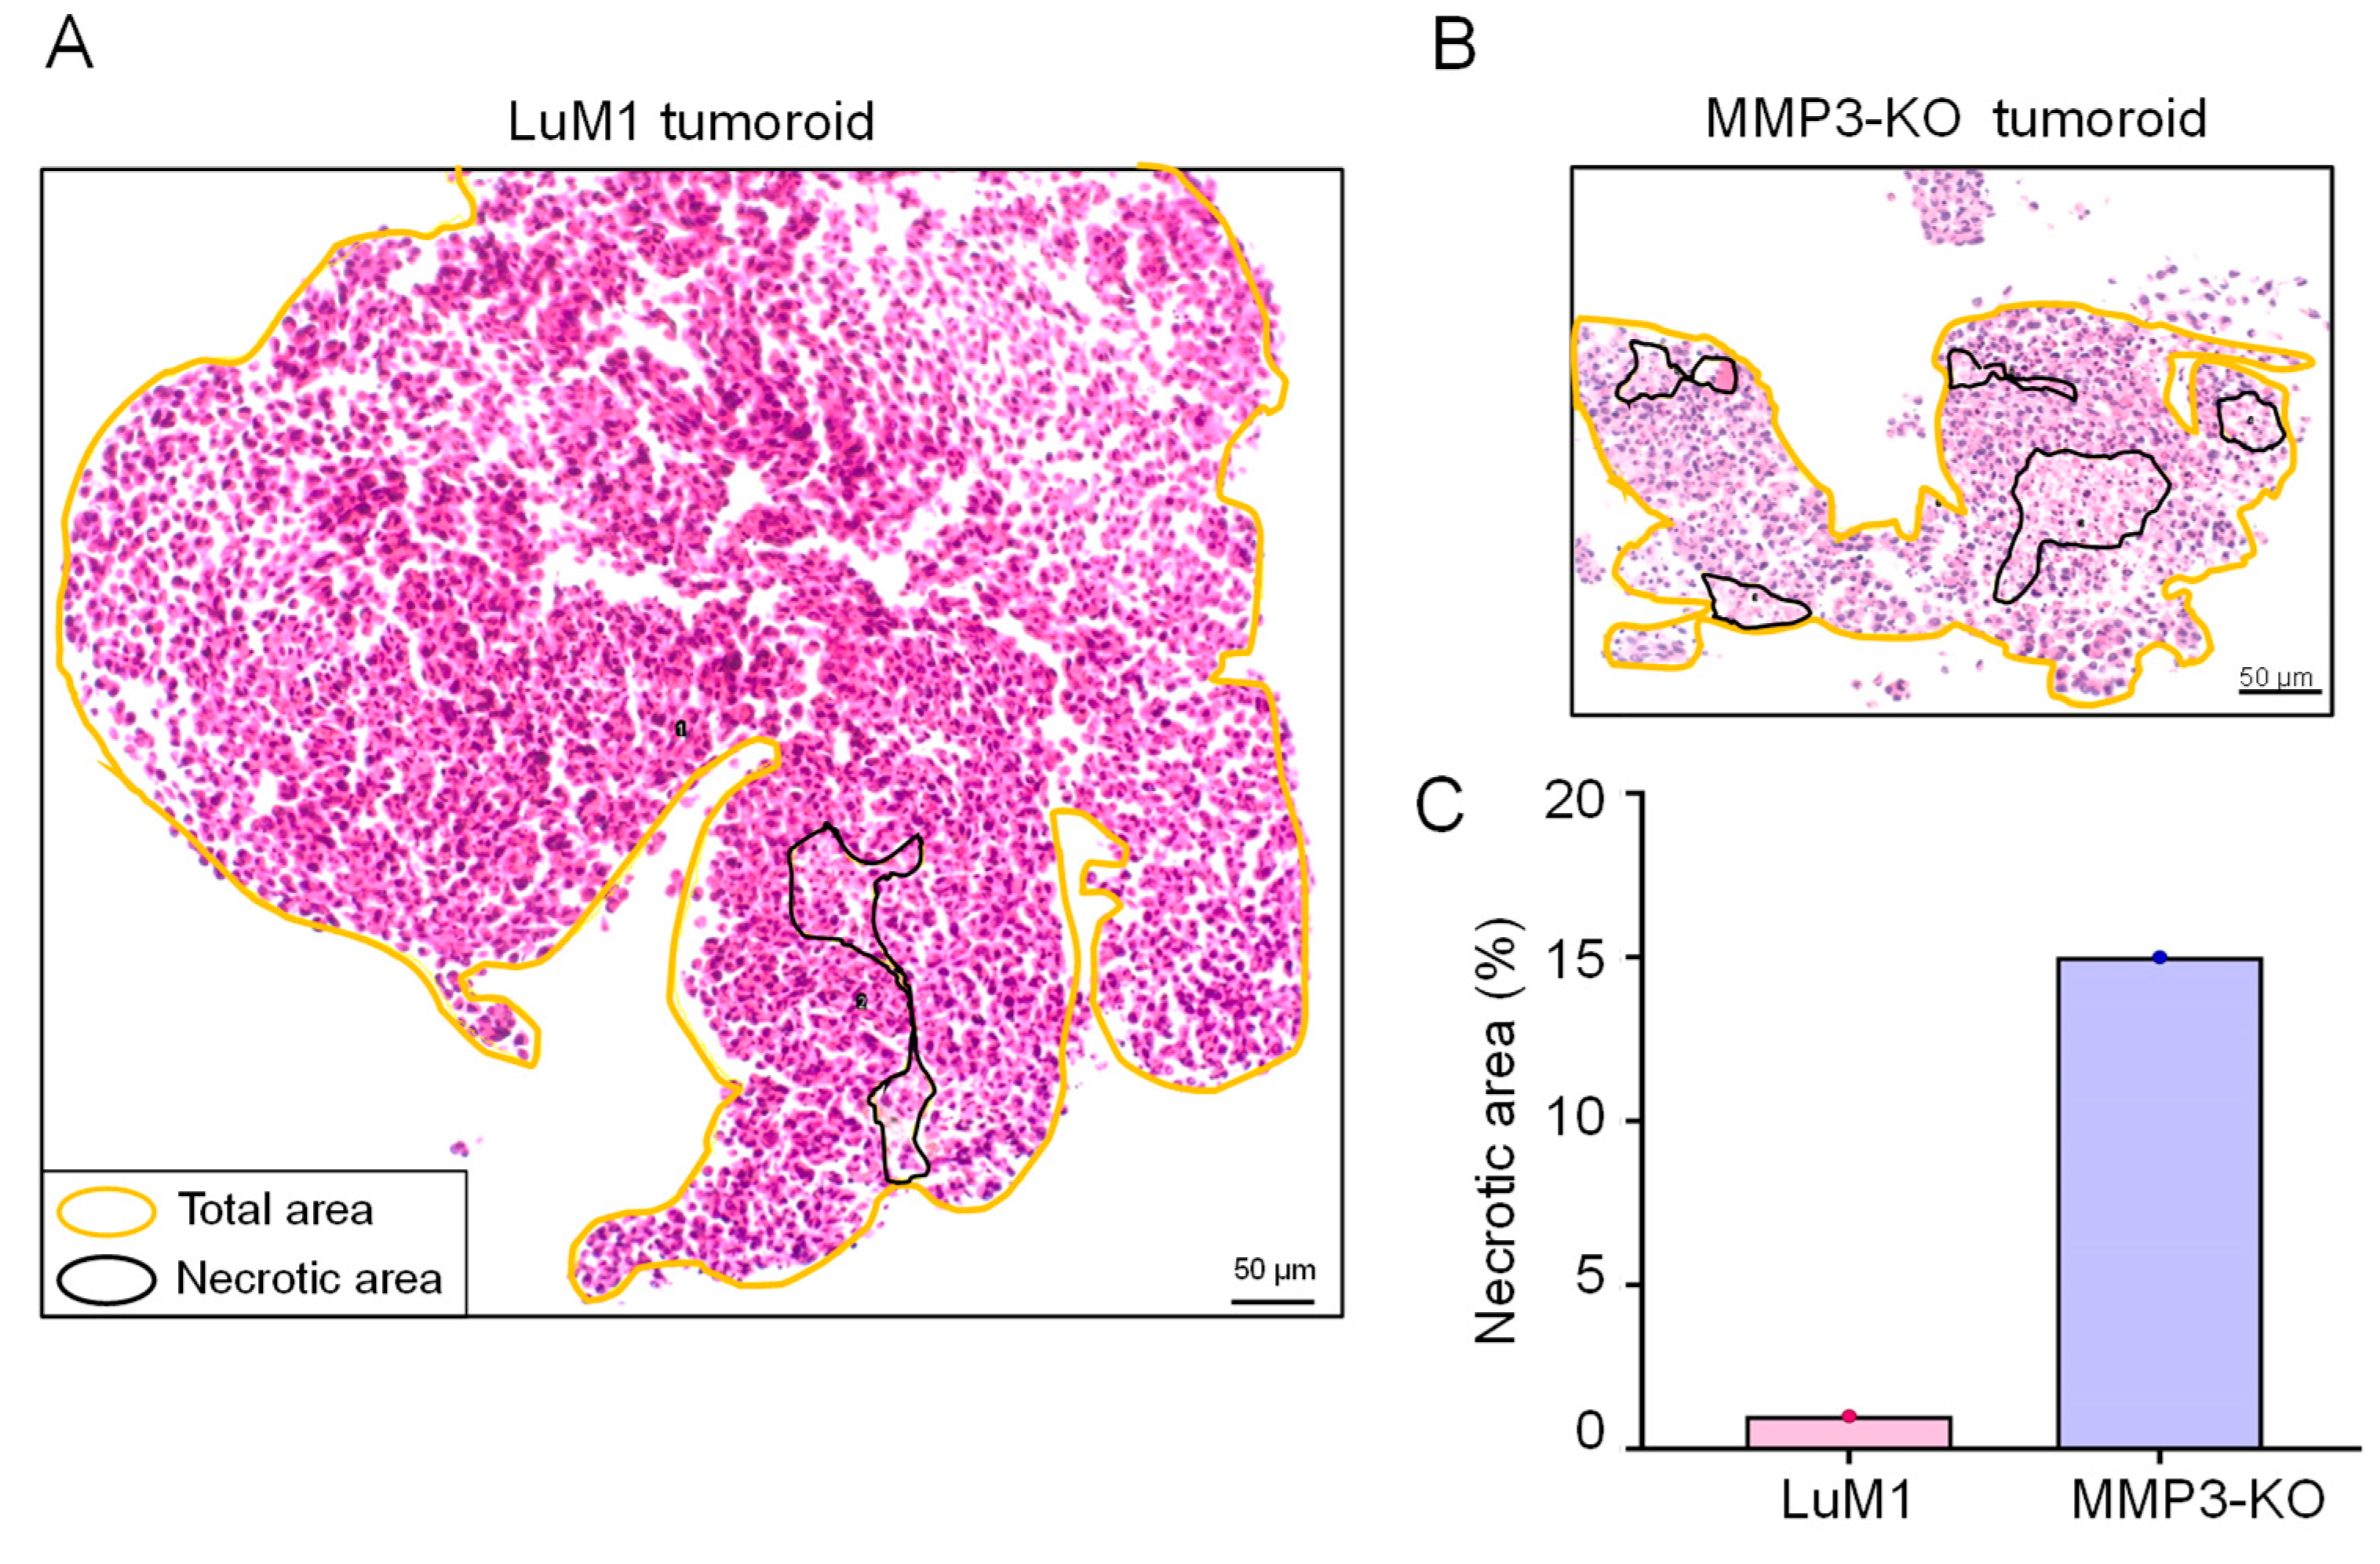
2.3. Loss of the Mmp3 Gene Reduces the In Vitro Tumorigenicity
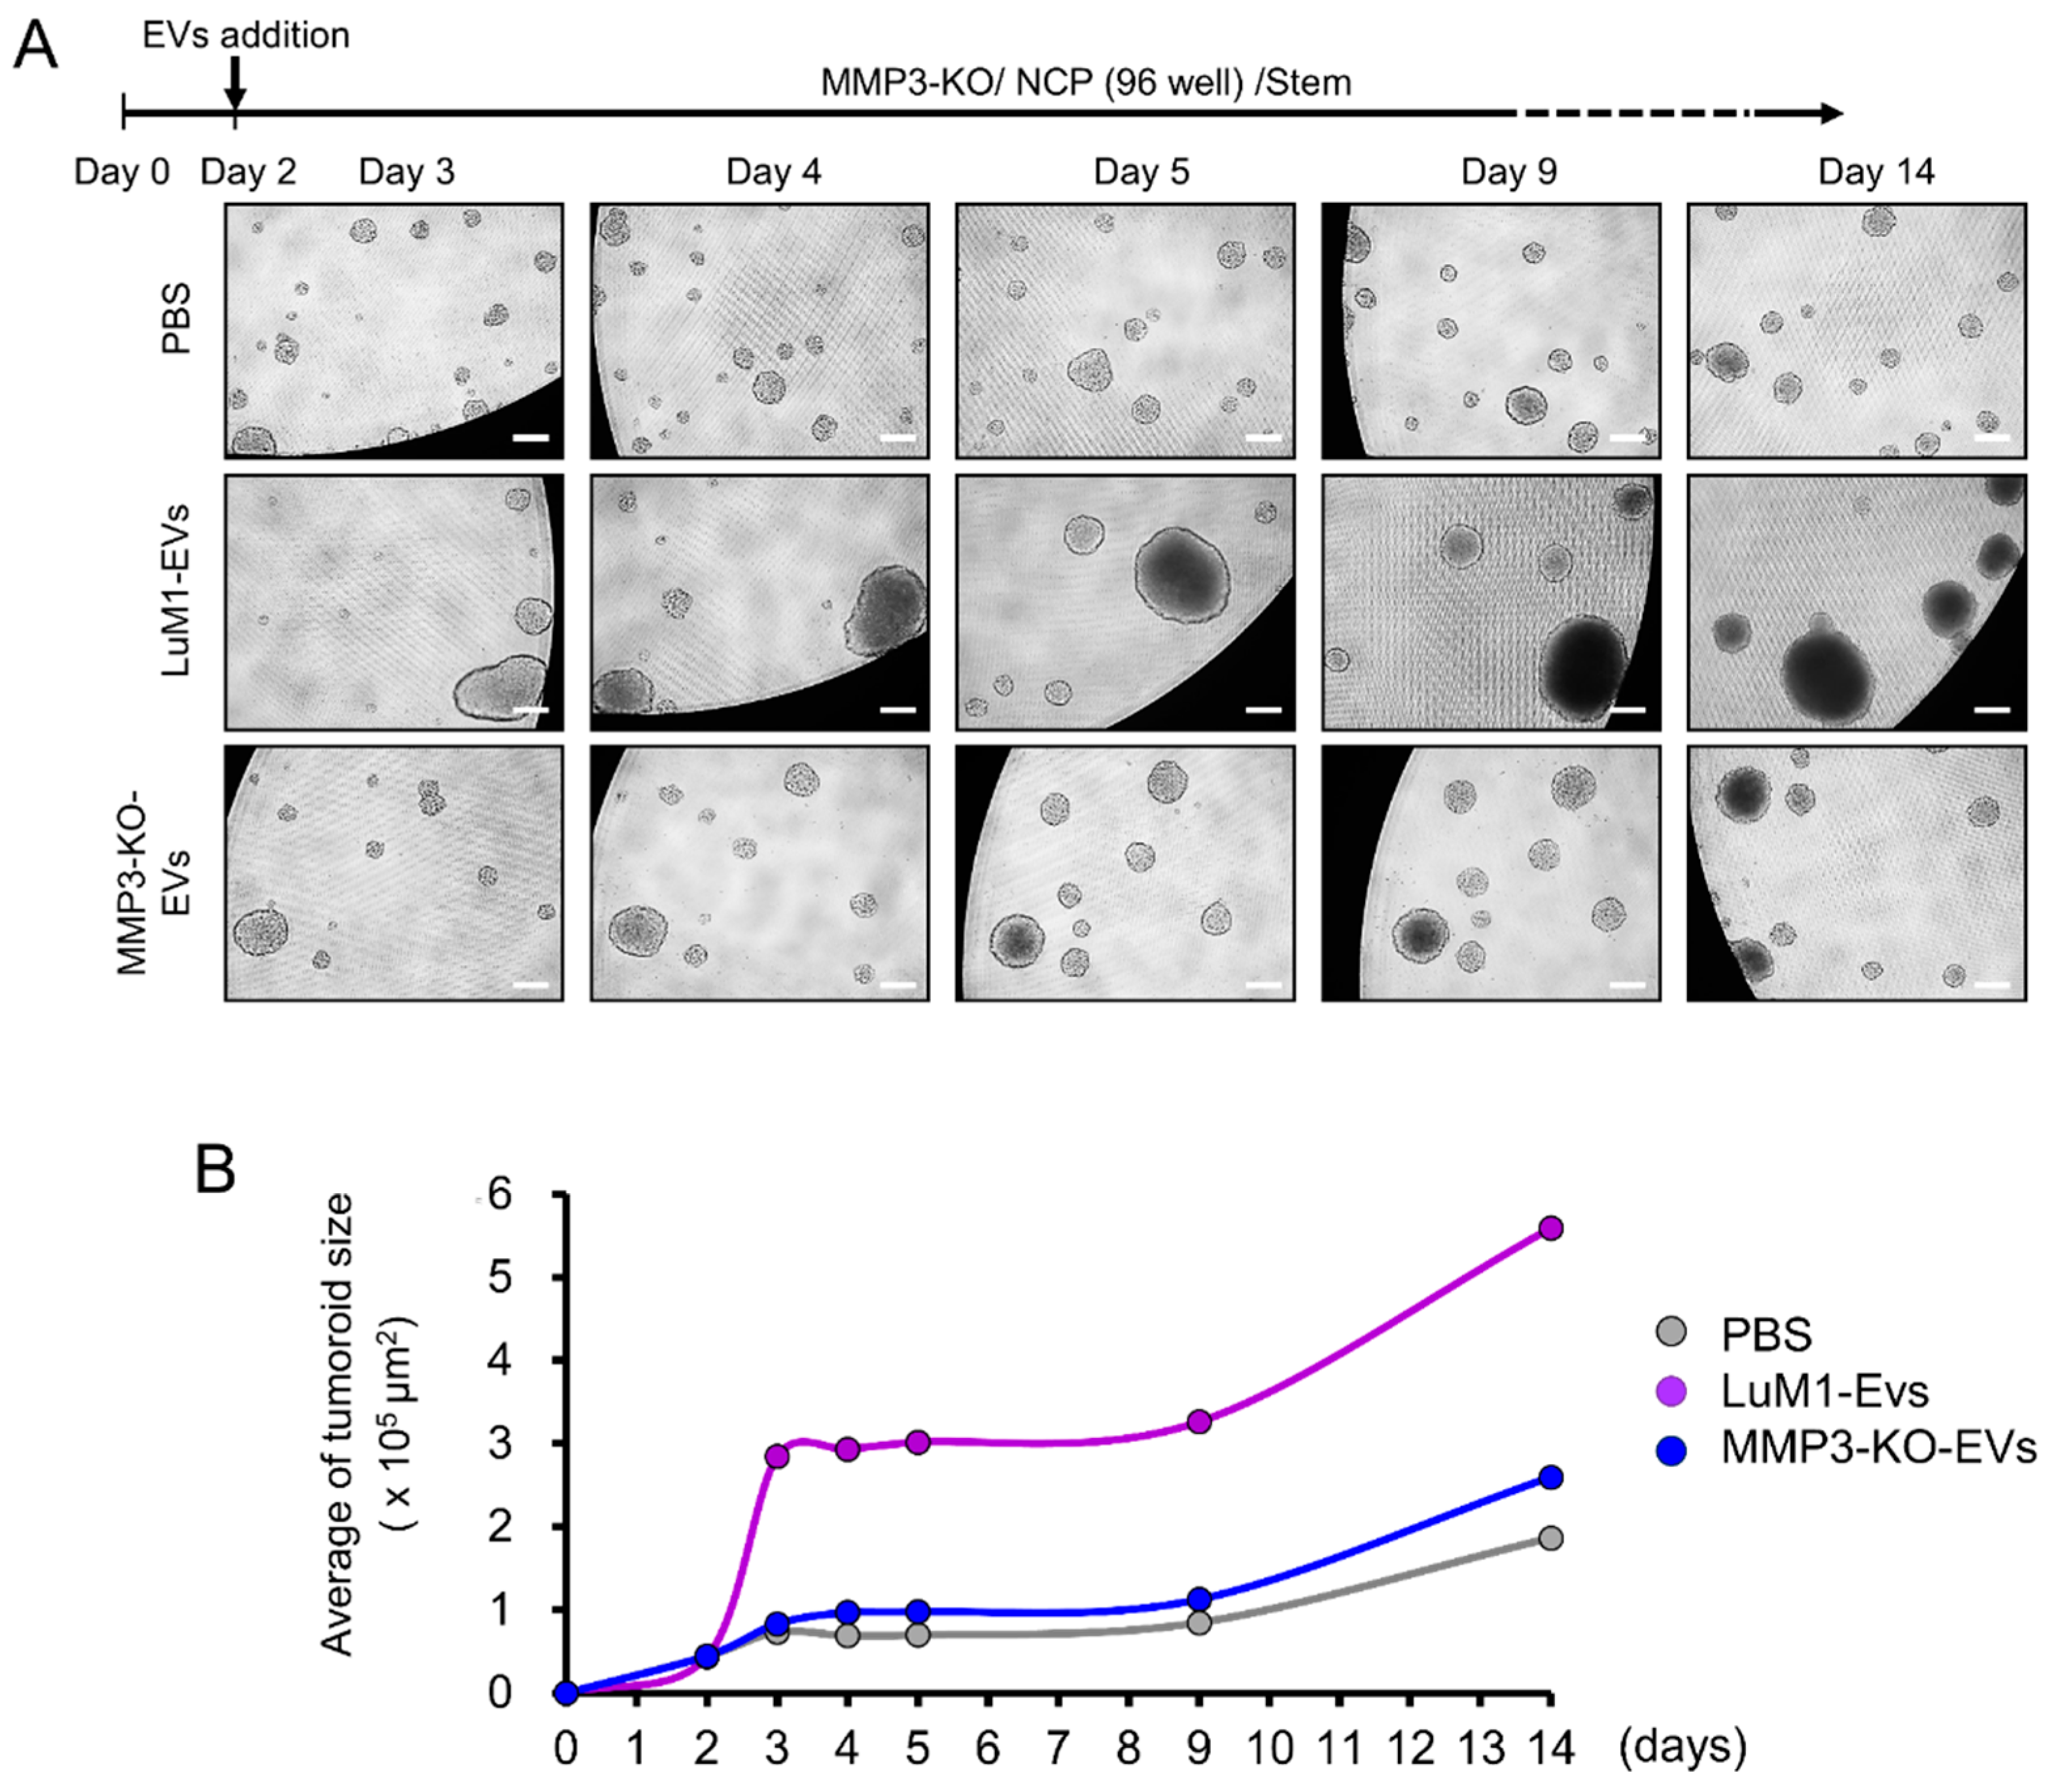
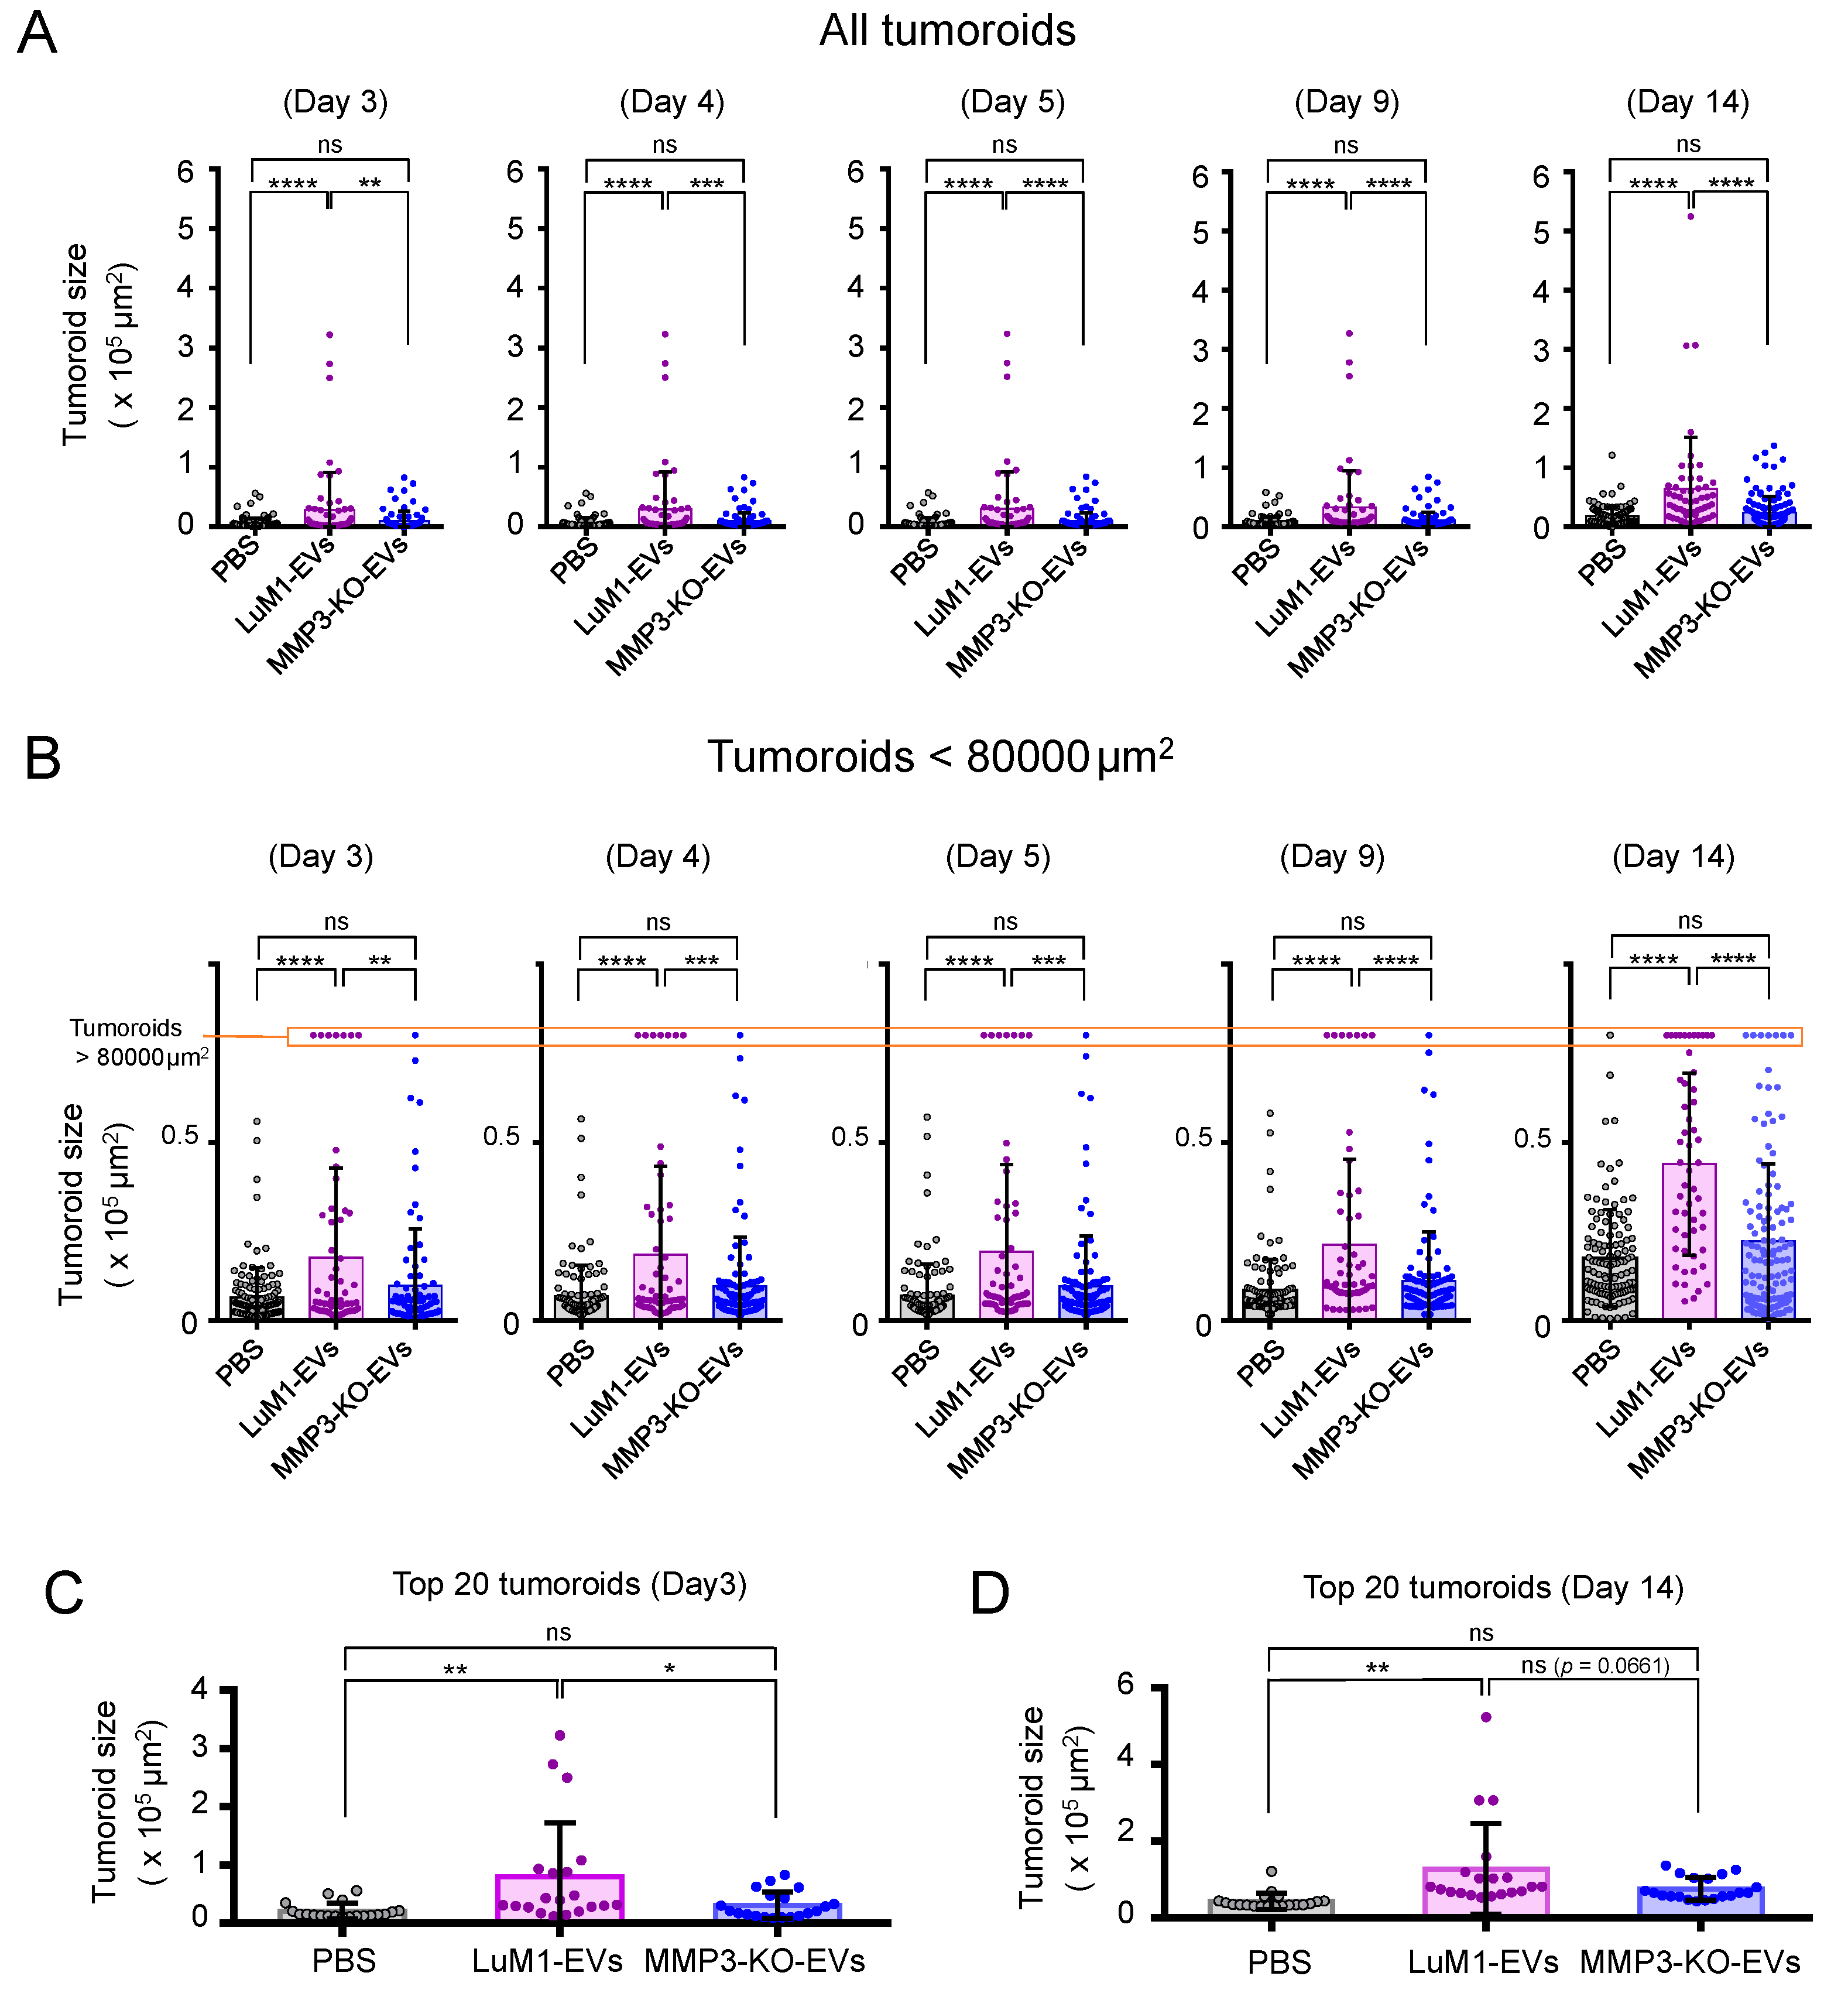
2.4. The Addition of MMP3-Rich EVs Accelerated the In Vitro Tumorigenesis of MMP3-KO Cells
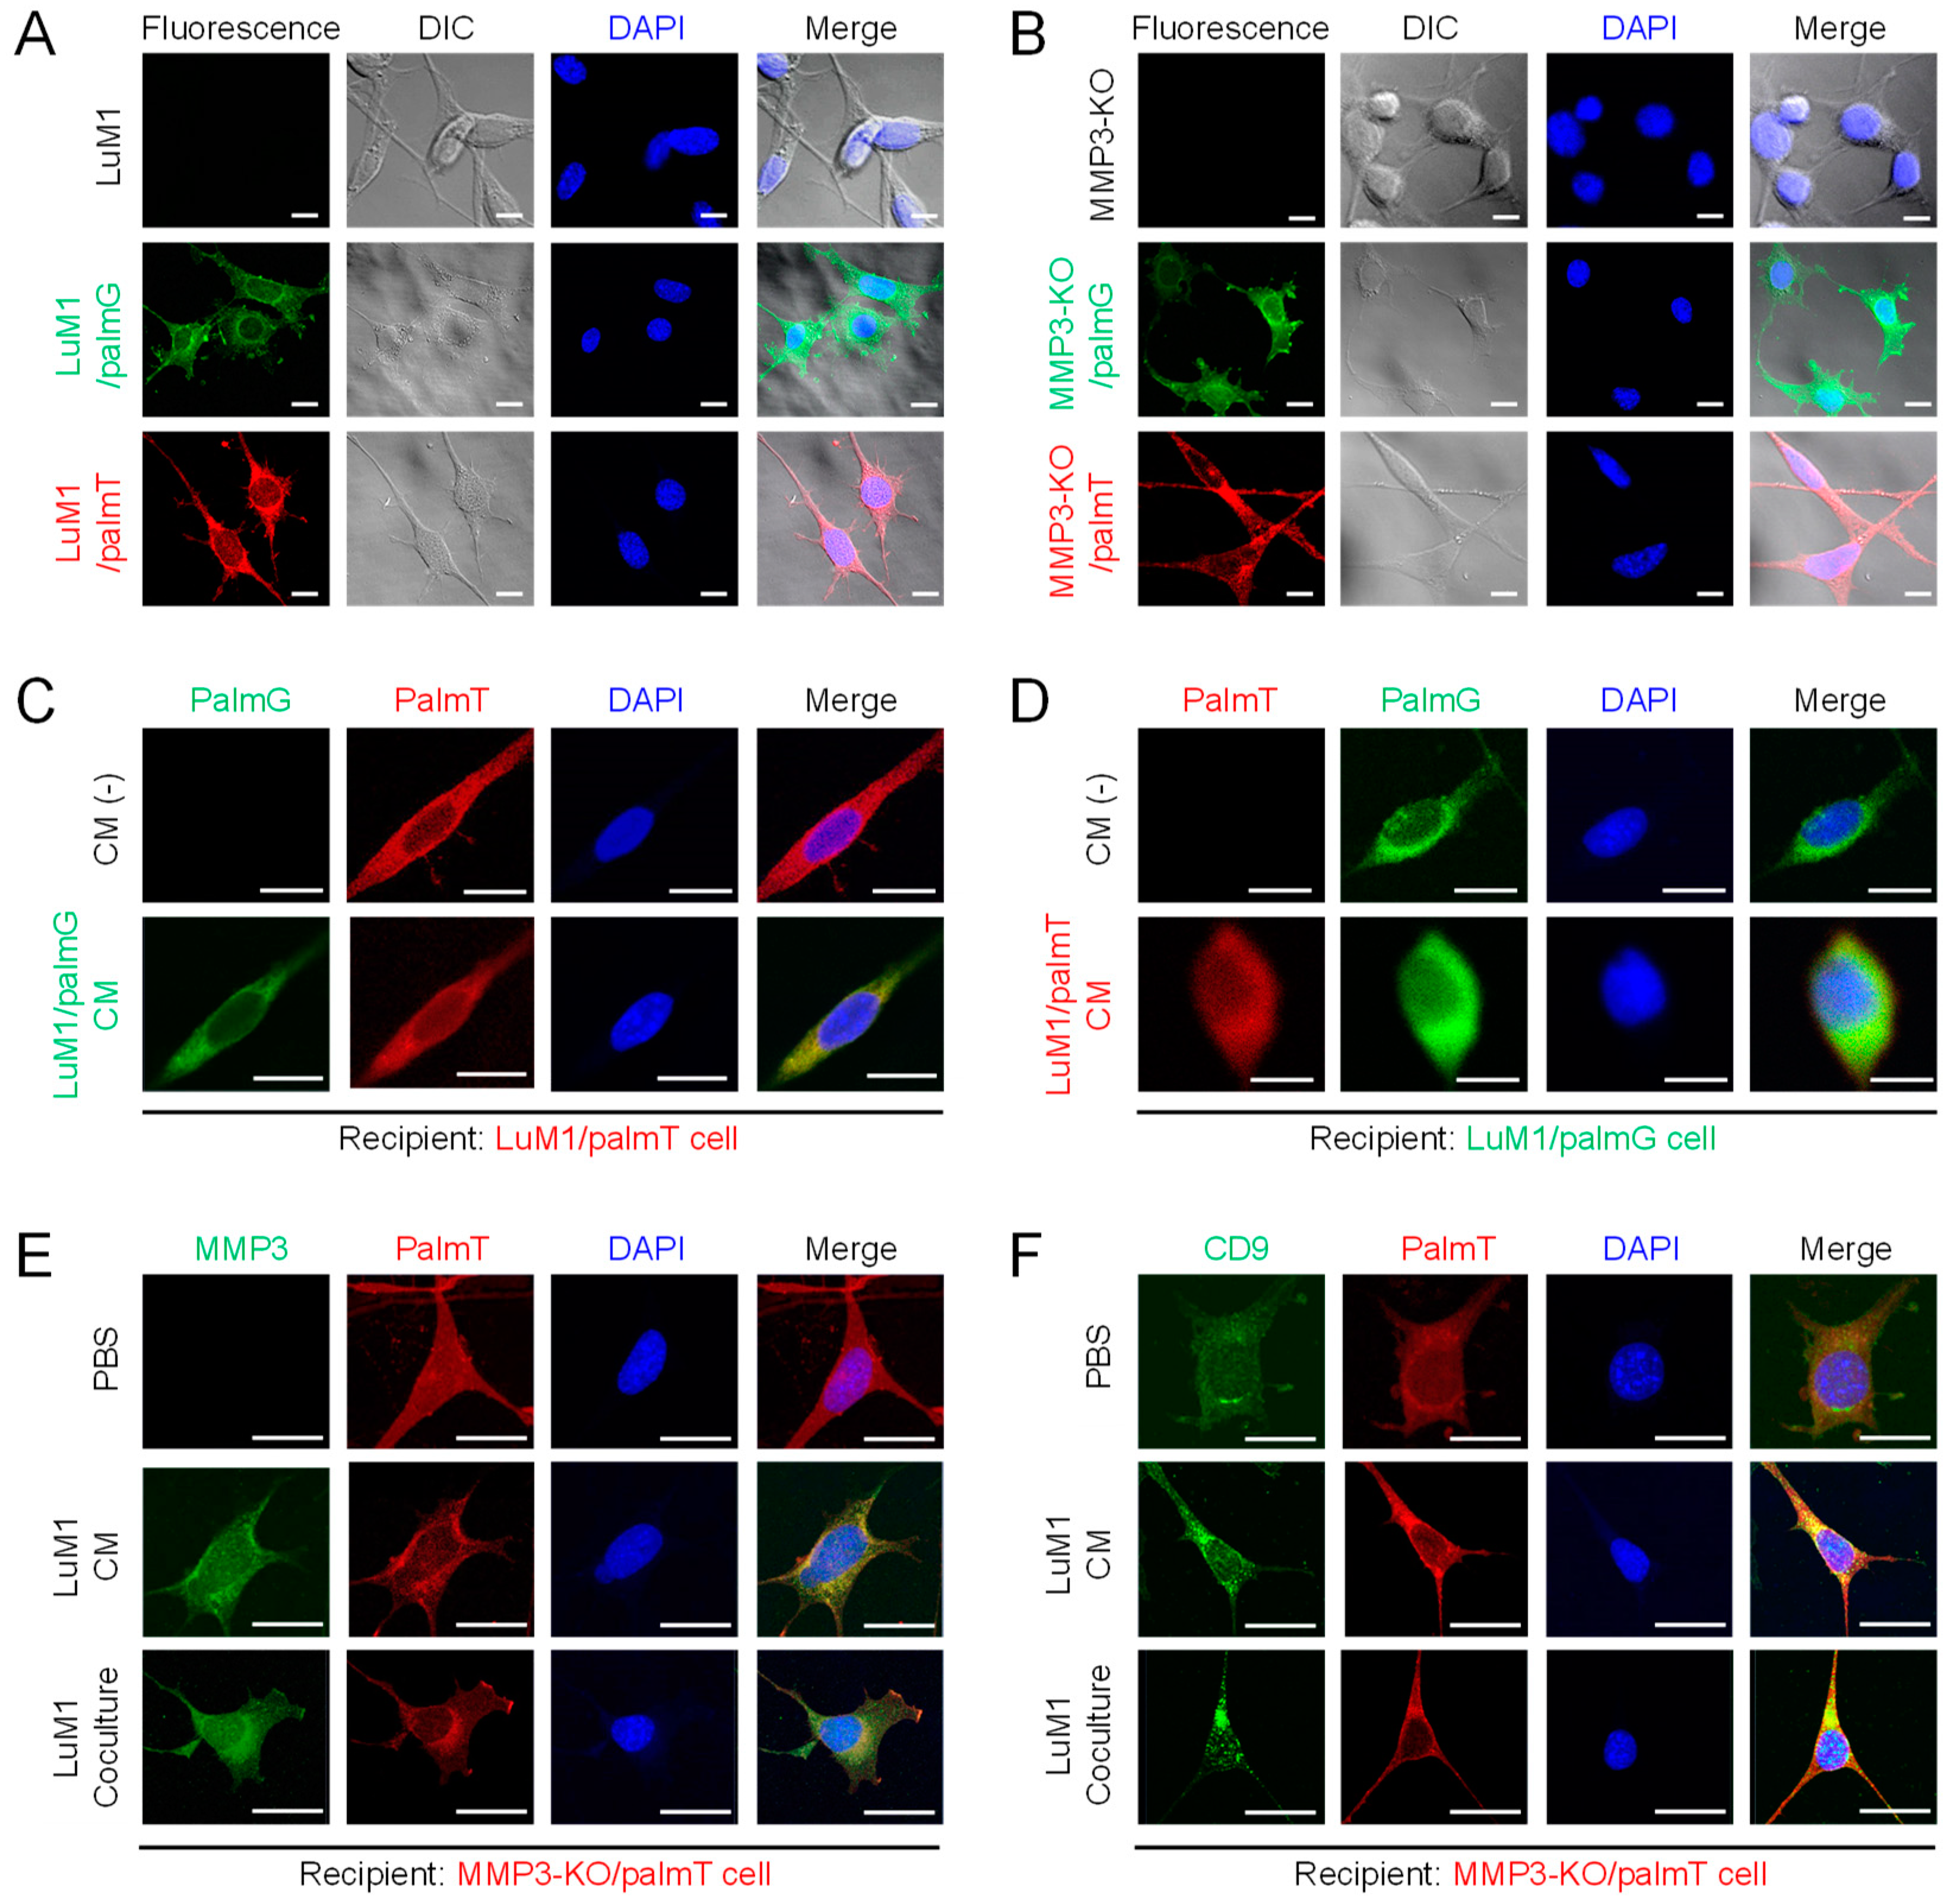
2.5. Establishment of Fluorescent-Labeled LuM1 and MMP3-Null Cells
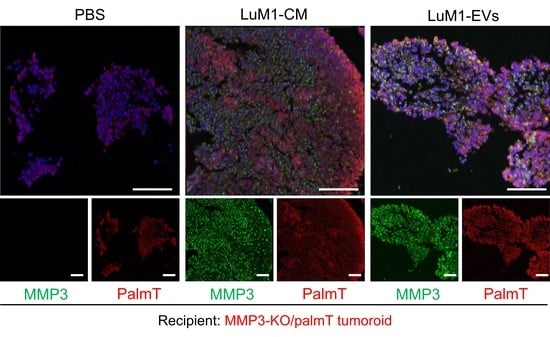
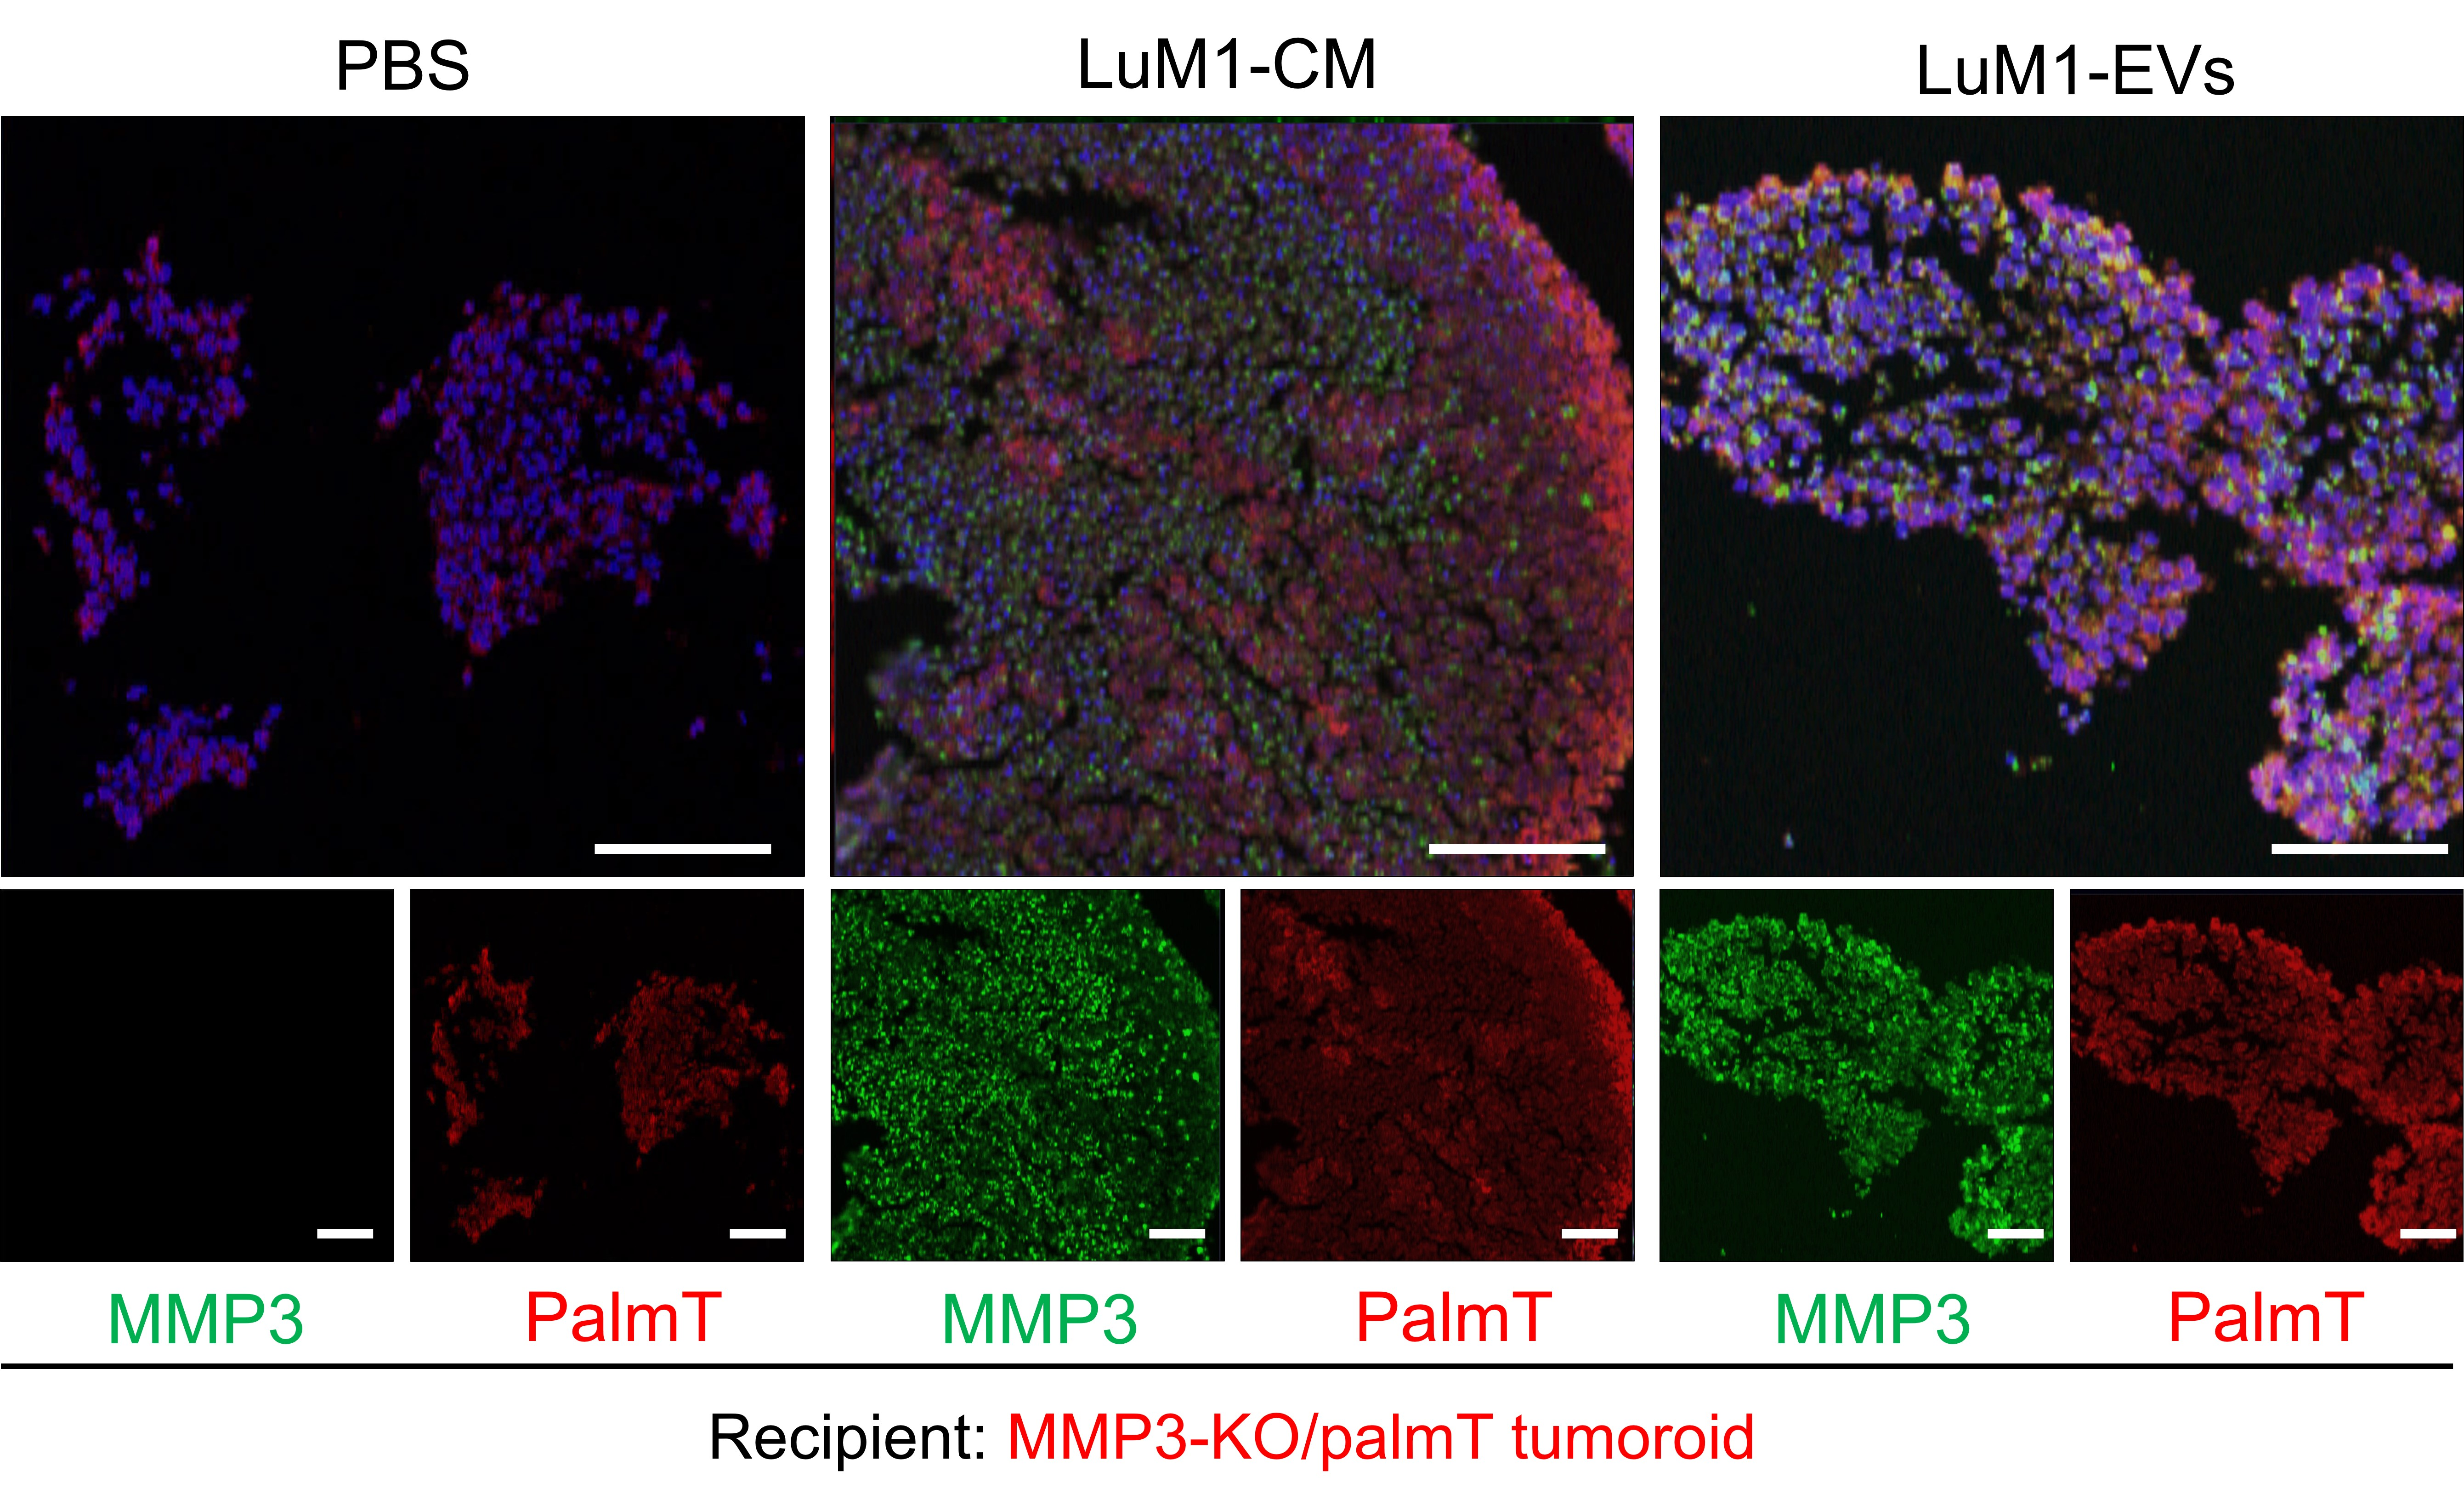
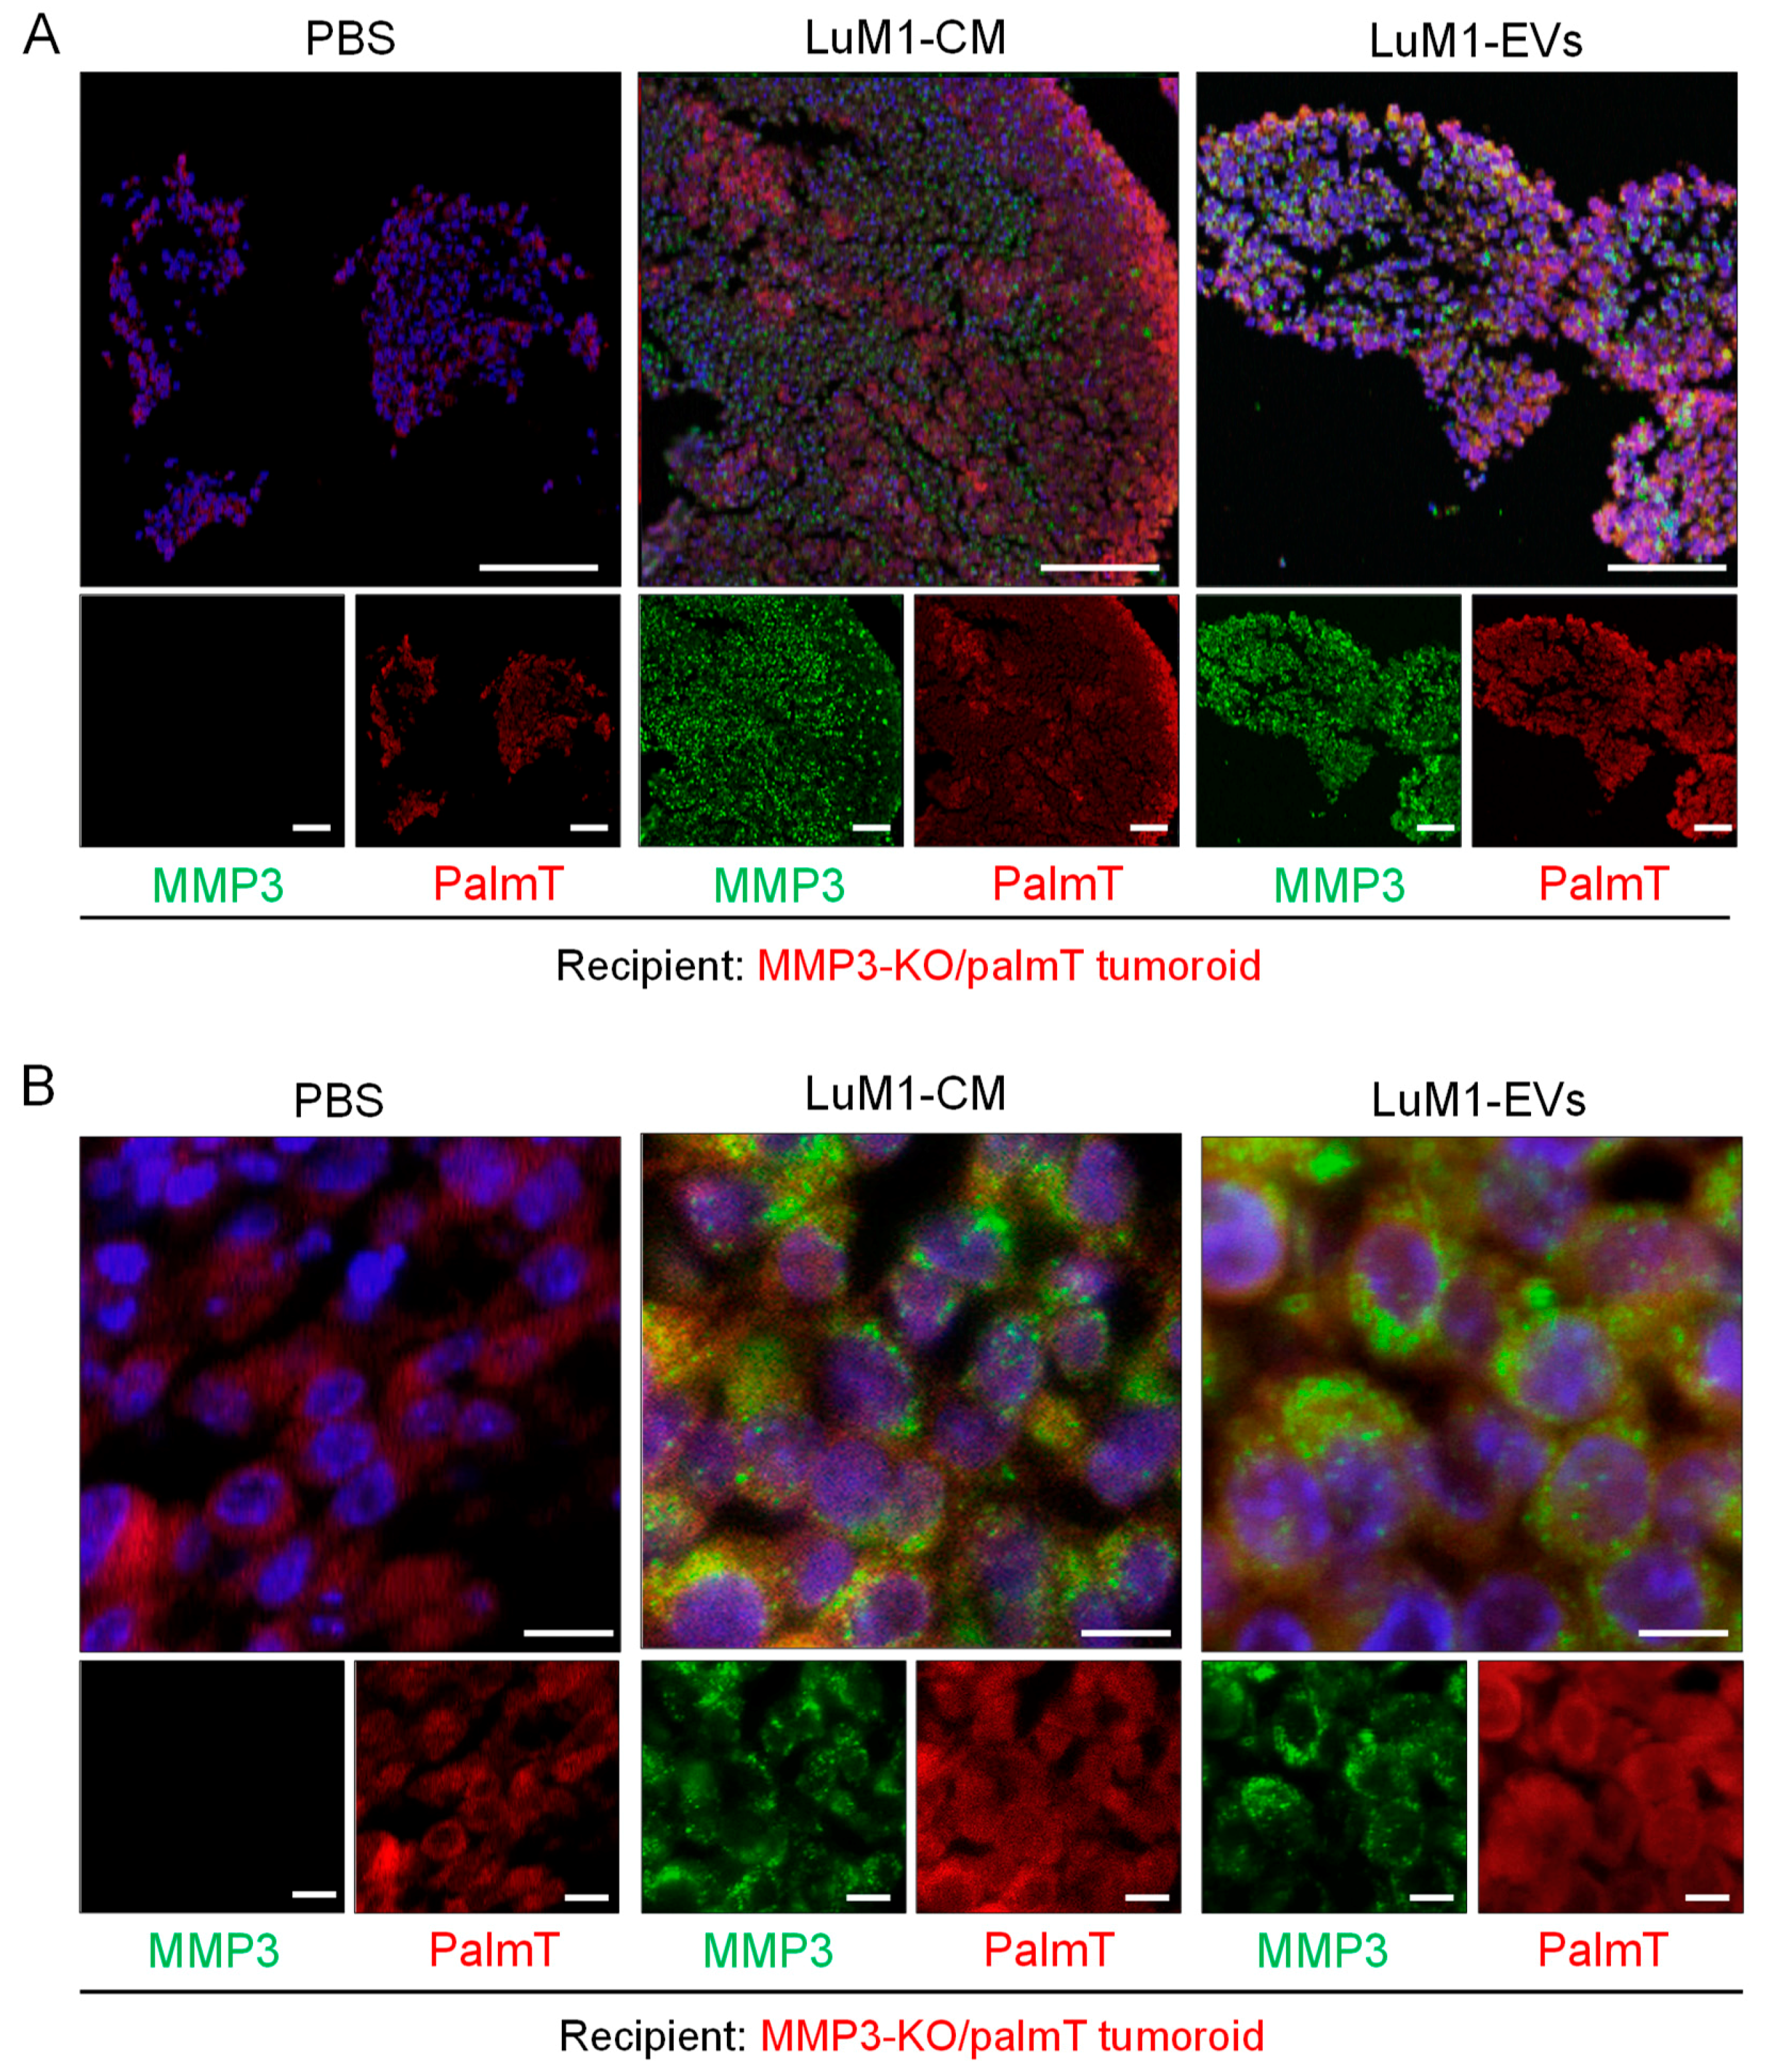
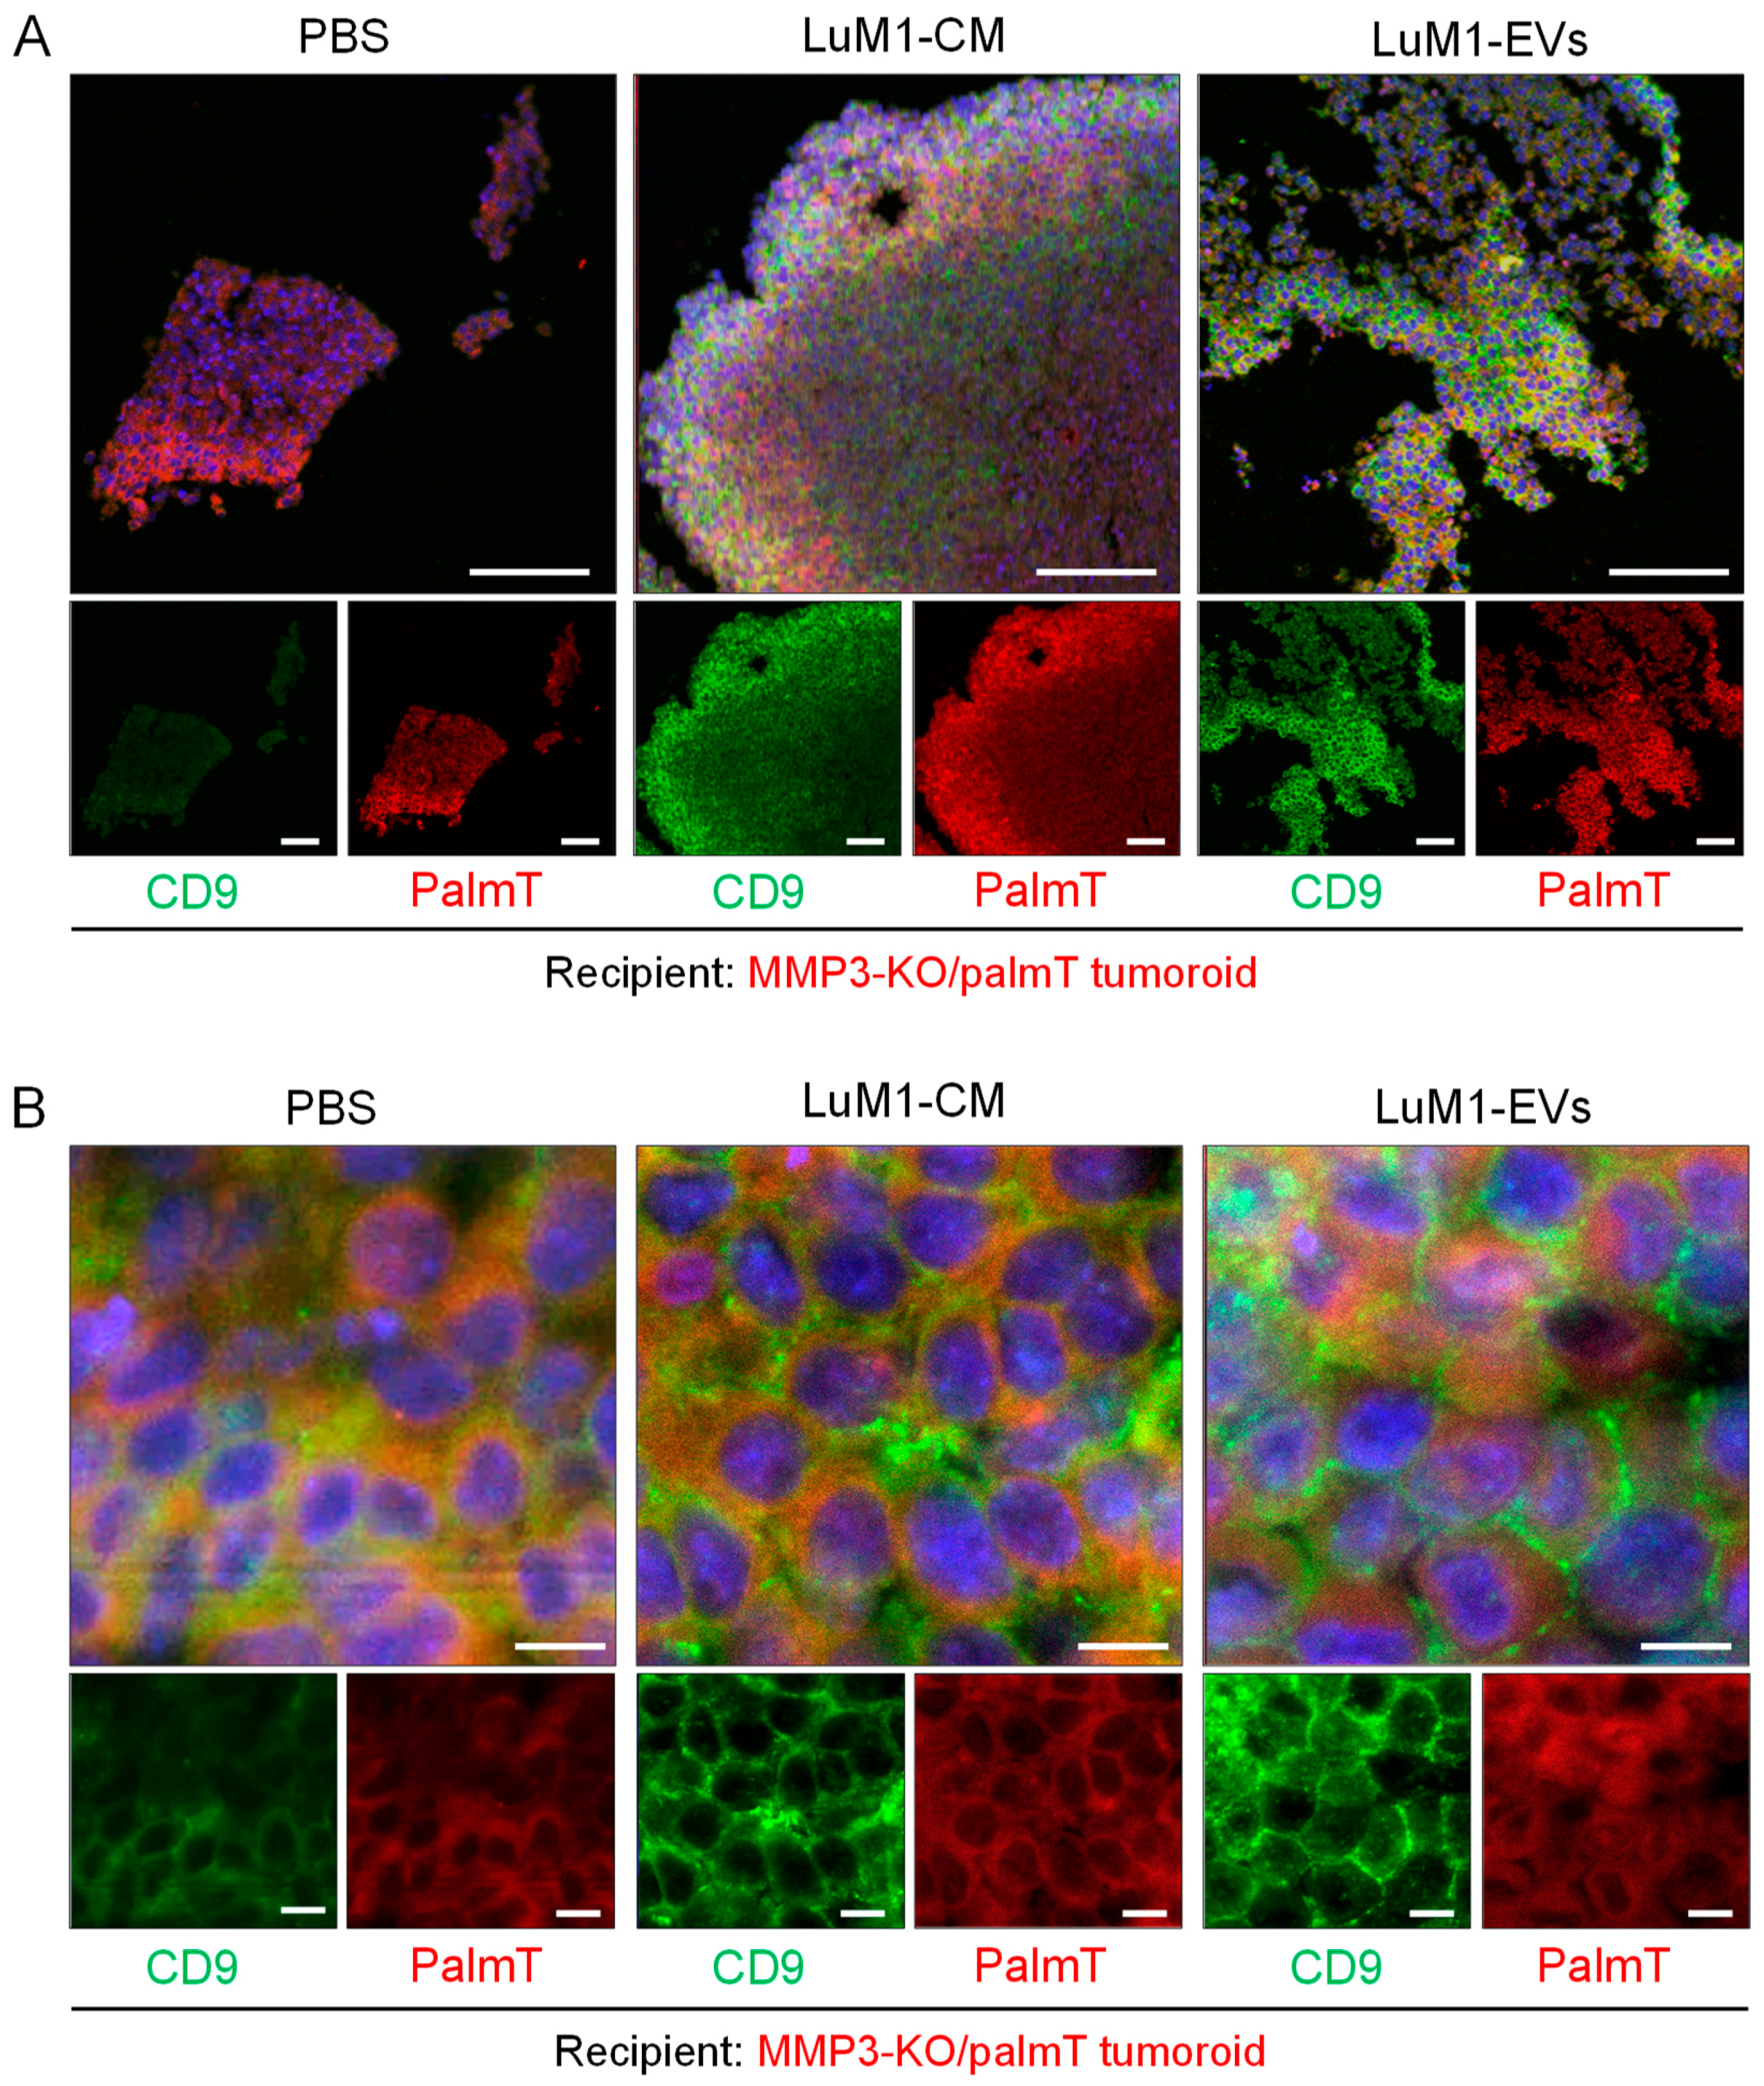
2.6. Penetration of MMP3-Rich EVs into Organoids
2.7. The Knockout of the Mmp3 Gene Significantly Decreased the Transmissive Potential of Tumoroid-Derived EVs
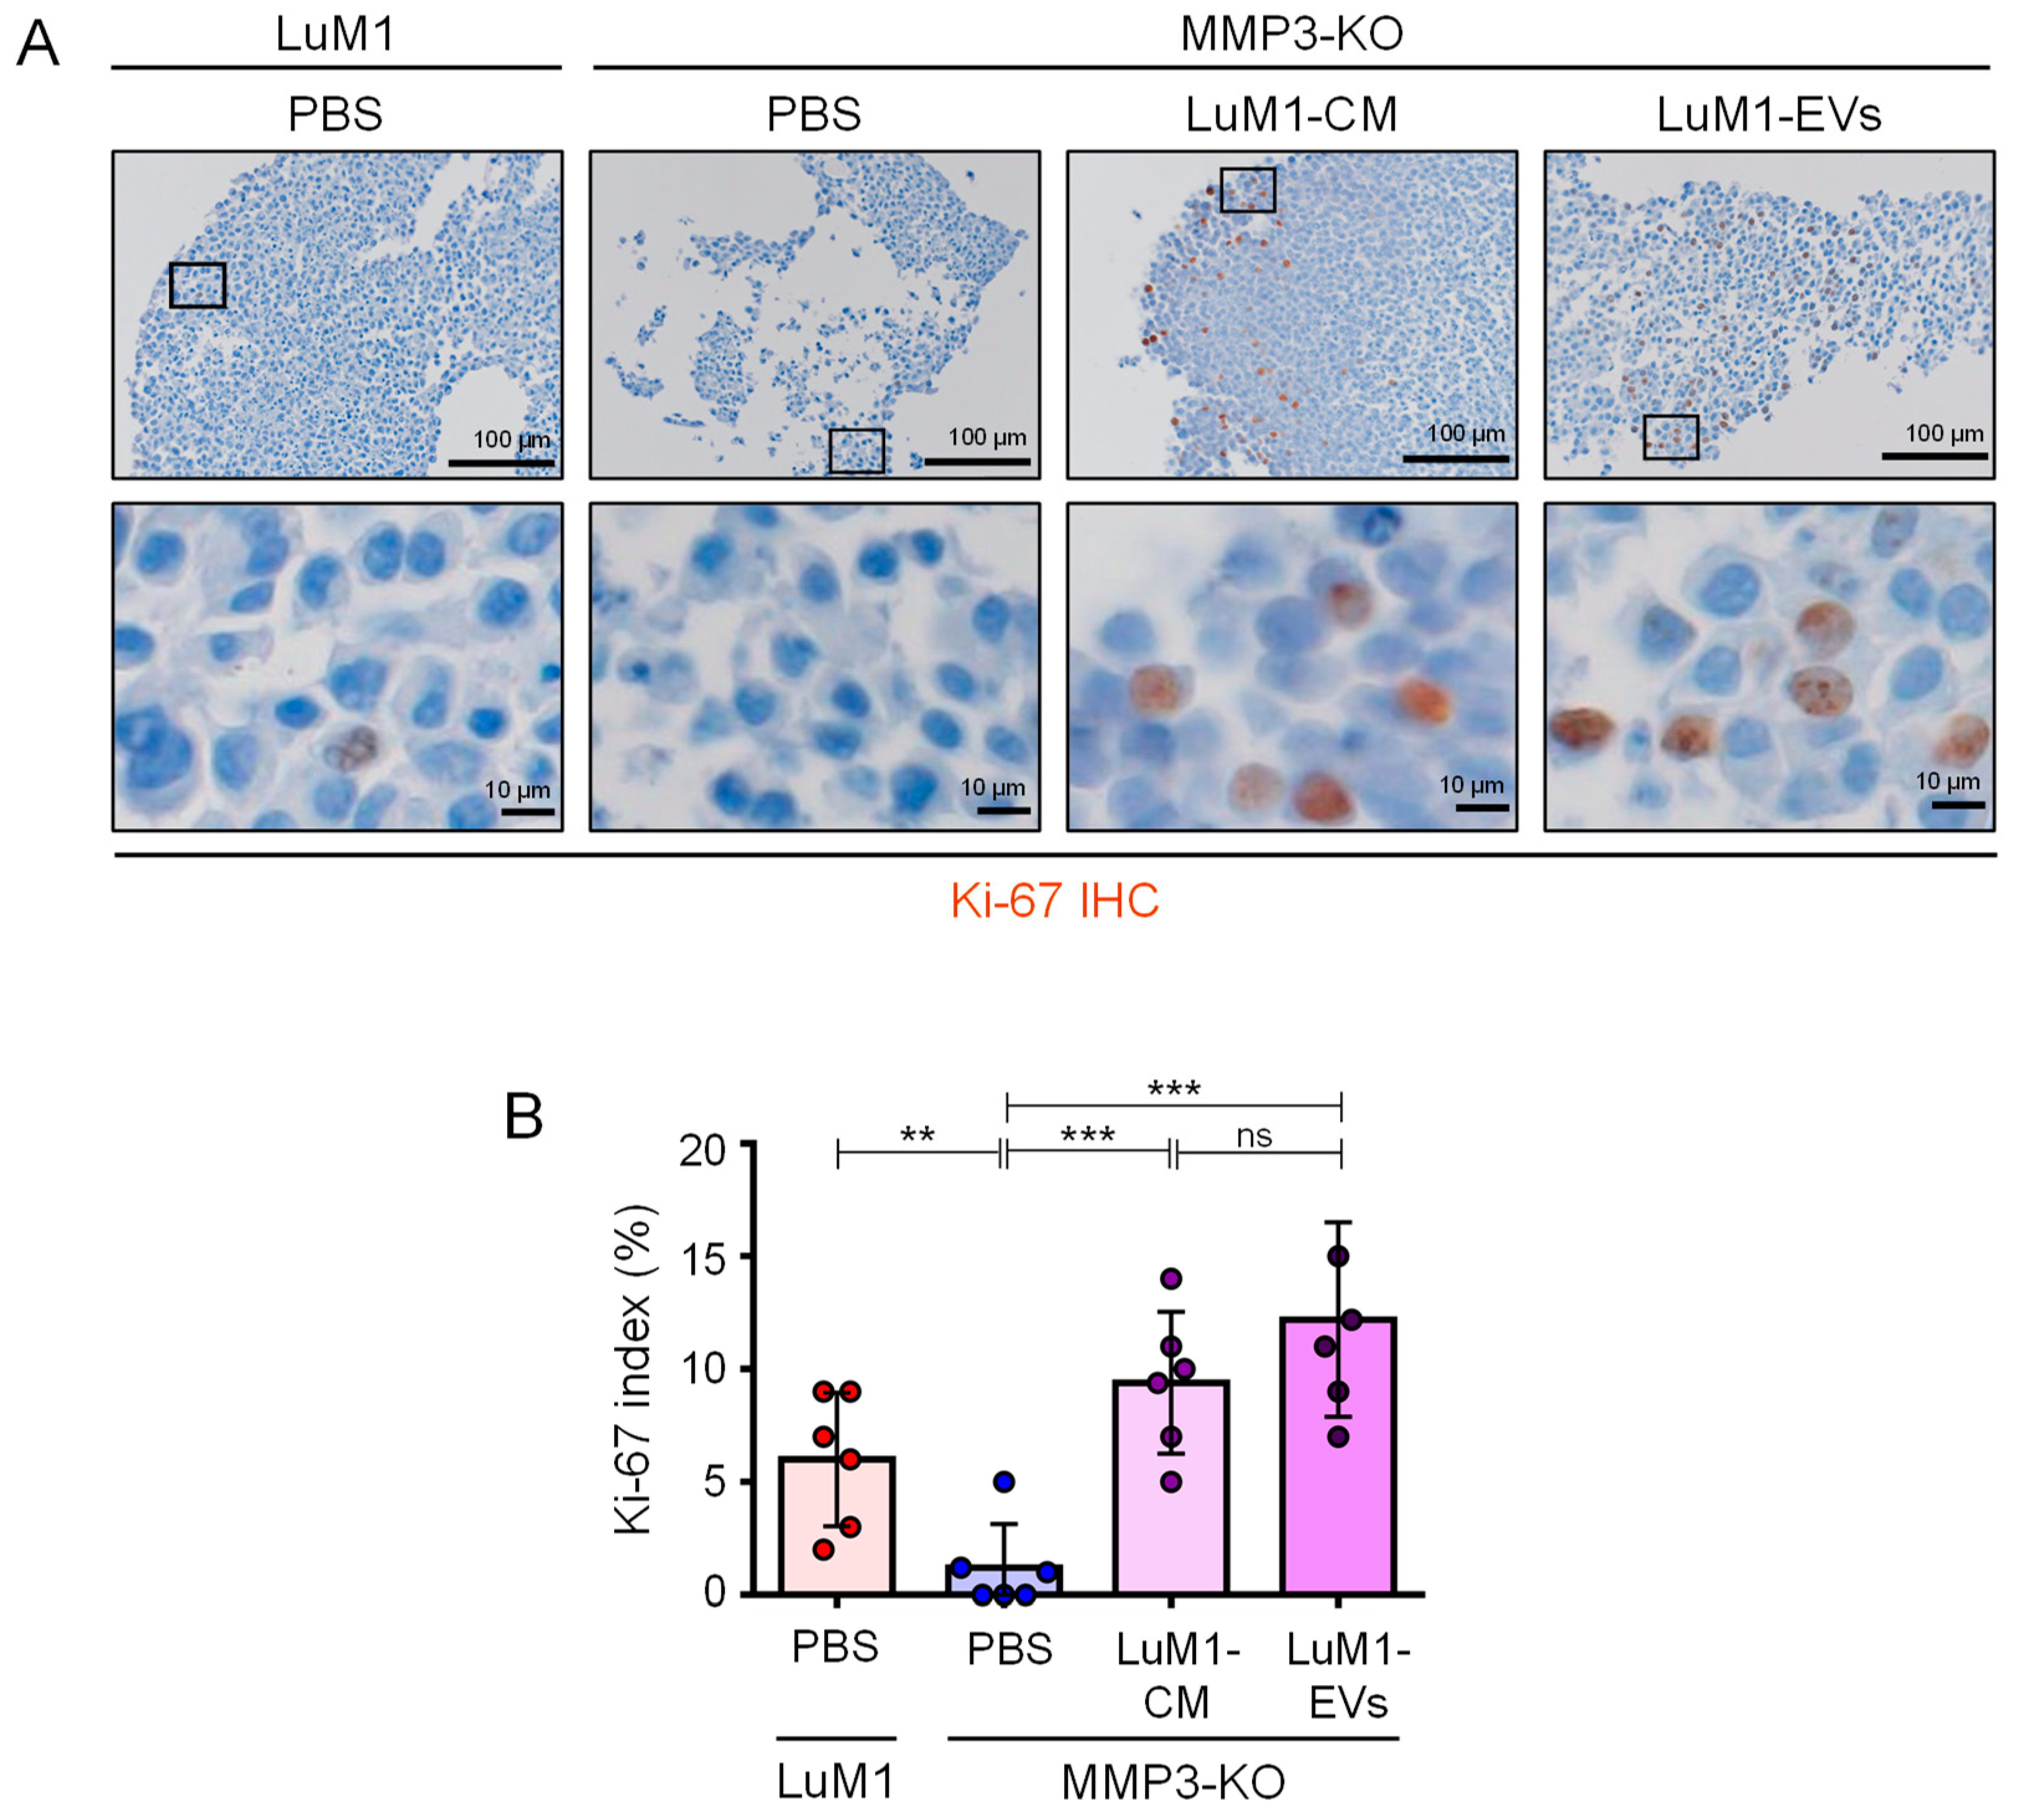
2.8. MMP3-Rich EVs and CM Rescue the Cell Proliferation of MMP3-KO Tumoroids
3. Discussion
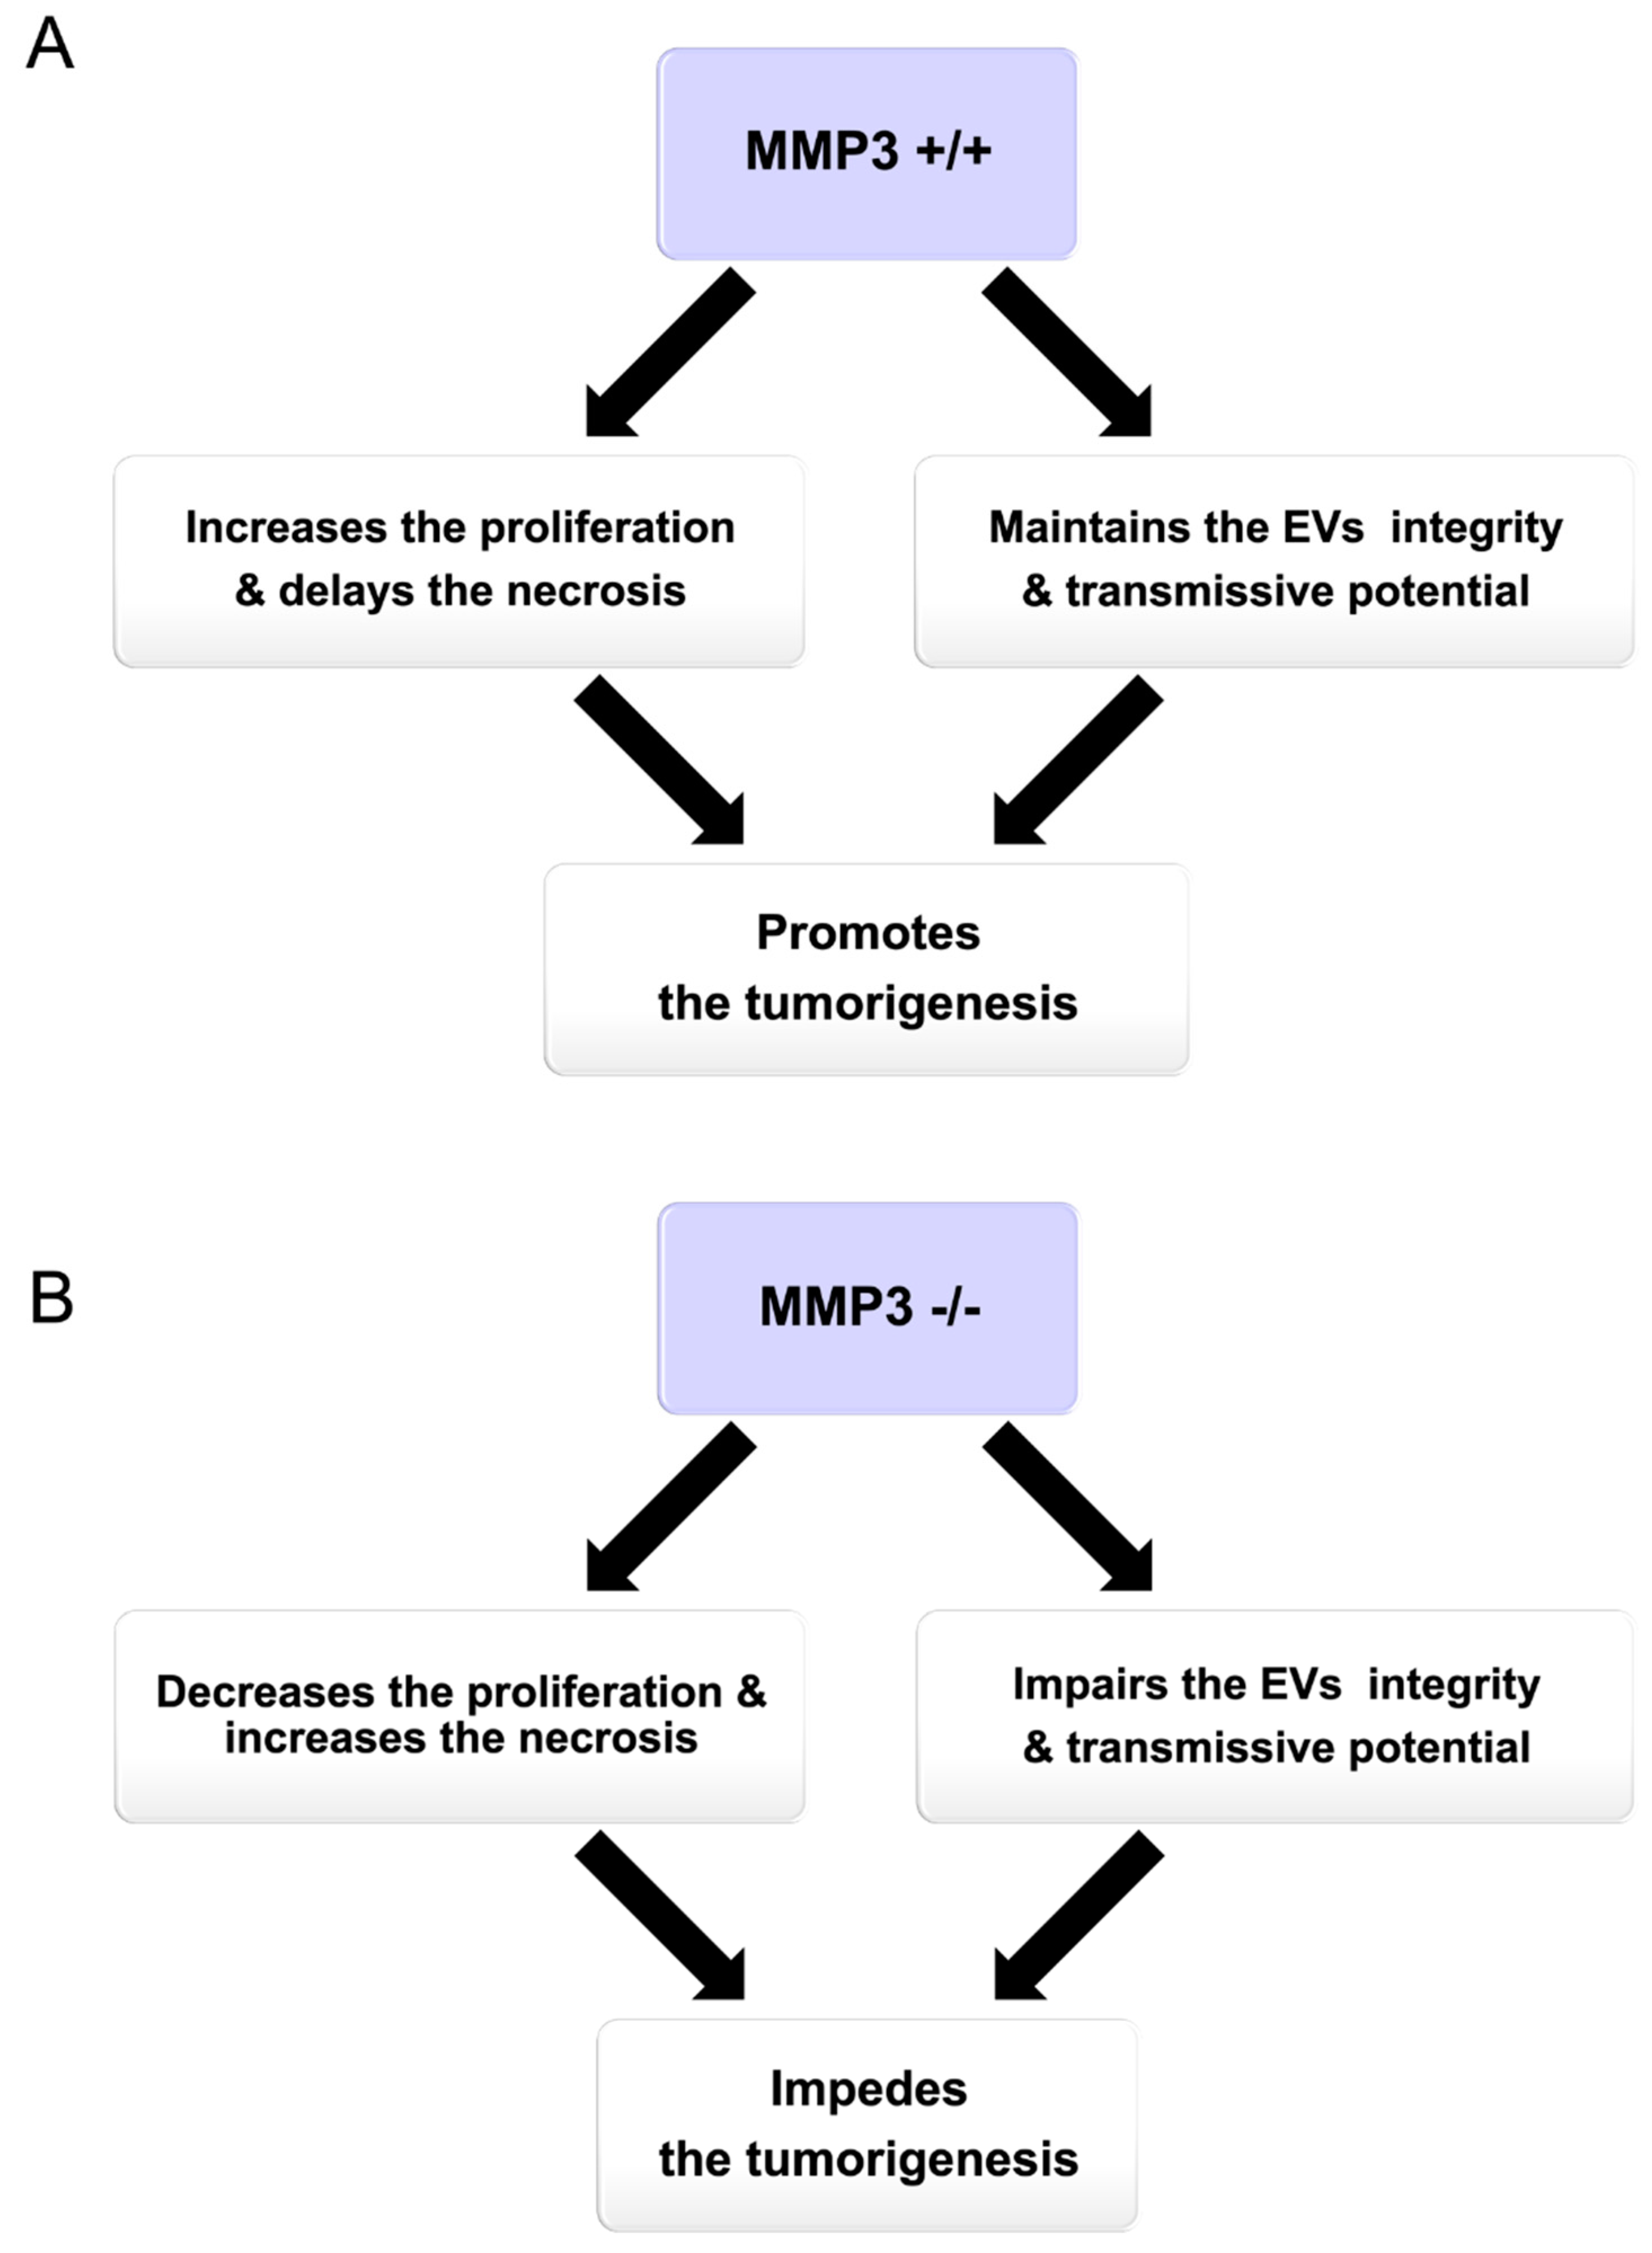
3.1. Summary
3.2. Potential Mechanism of How MMP3 Promotes Tumorigenesis
3.3. Potential Role of MMP3 in Cytoprotection
3.4. Release of L-EVs and s-EVs from 3D Tumoroids
3.5. Fluorescent Labeling of EVs
3.6. Inter MMPs Regulation
4. Materials and Methods
4.1. Cells
4.2. Tumoroid Culture
4.3. Re-Seeding Assay
4.4. Preparation of EVs and Conditioned Media
4.5. Transmission Electron Microscopy
4.6. Particle Diameter Distribution
4.7. Western Blotting
4.8. Coomassie Brilliant Blue Staining
4.9. EV-Driven In Vitro Tumorigenesis
4.10. Palm Fluorescent Cells
4.11. EVs Exchange Assay
4.12. Confocal Laser-Scanning Microscopy
4.13. Immunofluorescence of Tumoroids
4.14. Hematoxylin and Eosin Staining
4.15. Tracing EV-Uptake In Vitro
4.16. Statistical Analysis
5. Conclusions
Supplementary Materials
Author Contributions
Funding
Acknowledgments
Conflicts of Interest
References
- Yáñez-Mó, M.; Siljander, P.R.-M.; Andreu, Z.; Zavec, A.B.; Borràs, F.E.; Buzas, E.I.; Buzas, K.; Casal, E.; Cappello, F.; Carvalho, J.; et al. Biological properties of extracellular vesicles and their physiological functions. J. Extracell. Vesicles 2015, 4. [Google Scholar] [CrossRef] [Green Version]
- Colombo, M.; Raposo, G.; Théry, C. Biogenesis, secretion, and intercellular interactions of exosomes and other extracellular vesicles. Annu. Rev. Cell Dev. Biol. 2014, 30, 255–289. [Google Scholar] [CrossRef]
- Fujita, Y.; Yoshioka, Y.; Ochiya, T. Extracellular vesicle transfer of cancer pathogenic components. Cancer Sci. 2016, 107, 385–390. [Google Scholar] [CrossRef] [Green Version]
- Raposo, G.; Stoorvogel, W. Extracellular vesicles: Exosomes, microvesicles, and friends. J. Cell Biol. 2013, 200, 373–383. [Google Scholar] [CrossRef] [Green Version]
- Lawson, C.; Vicencio, J.M.; Yellon, D.M.; Davidson, S.M. Microvesicles and exosomes: New players in metabolic and cardiovascular disease. J. Endocrinol. 2016, 228, R57–R71. [Google Scholar] [CrossRef]
- Janowska-Wieczorek, A.; Wysoczynski, M.; Kijowski, J.; Marquez-Curtis, L.; Machalinski, B.; Ratajczak, J.; Ratajczak, M.Z. Microvesicles derived from activated platelets induce metastasis and angiogenesis in lung cancer. Int. J. Cancer 2005, 113, 752–760. [Google Scholar] [CrossRef]
- Andreola, G.; Rivoltini, L.; Castelli, C.; Huber, V.; Perego, P.; Deho, P.; Squarcina, P.; Accornero, P.; Lozupone, F.; Lugini, L.; et al. Induction of lymphocyte apoptosis by tumor cell secretion of FasL-bearing microvesicles. J. Exp. Med. 2002, 195, 1303–1316. [Google Scholar] [CrossRef]
- Zaborowski, M.P.; Lee, K.; Na, Y.J.; Sammarco, A.; Zhang, X.; Iwanicki, M.; Cheah, P.S.; Lin, H.-Y.; Zinter, M.; Chou, C.-Y.; et al. Methods for Systematic Identification of Membrane Proteins for Specific Capture of Cancer-Derived Extracellular Vesicles. Cell Rep. 2019, 27, 255–268.e6. [Google Scholar] [CrossRef] [Green Version]
- Borges, F.T.; Reis, L.A.; Schor, N. Extracellular vesicles: Structure, function, and potential clinical uses in renal diseases. Braz. J. Med. Biol. Res. 2013, 46, 824–830. [Google Scholar] [CrossRef] [Green Version]
- Vagner, T.; Spinelli, C.; Minciacchi, V.R.; Balaj, L.; Zandian, M.; Conley, A.; Zijlstra, A.; Freeman, M.R.; Demichelis, F.; De, S.; et al. Large extracellular vesicles carry most of the tumour DNA circulating in prostate cancer patient plasma. J. Extracell. Vesicles 2018, 7, 1505403. [Google Scholar] [CrossRef] [Green Version]
- Di Vizio, D.; Morello, M.; Dudley, A.C.; Schow, P.W.; Adam, R.M.; Morley, S.; Mulholland, D.; Rotinen, M.; Hager, M.H.; Insabato, L.; et al. Large Oncosomes in Human Prostate Cancer Tissues and in the Circulation of Mice with Metastatic Disease. Am. J. Pathol. 2012, 181, 1573–1584. [Google Scholar] [CrossRef] [PubMed]
- Schmidt, J.R.; Kliemt, S.; Preissler, C.; Moeller, S.; von Bergen, M.; Hempel, U.; Kalkhof, S. Osteoblast-released Matrix Vesicles, Regulation of Activity and Composition by Sulfated and Non-sulfated Glycosaminoglycans. Mol. Cell. Proteomics 2016, 15, 558–572. [Google Scholar] [CrossRef] [PubMed] [Green Version]
- Chen, Q.; Bei, J.-J.; Liu, C.; Feng, S.-B.; Zhao, W.-B.; Zhou, Z.; Yu, Z.-P.; Du, X.-J.; Hu, H.-Y. HMGB1 Induces Secretion of Matrix Vesicles by Macrophages to Enhance Ectopic Mineralization. PLoS ONE 2016, 11. [Google Scholar] [CrossRef]
- Mebarek, S.; Abousalham, A.; Magne, D.; Do, L.D.; Bandorowicz-Pikula, J.; Pikula, S.; Buchet, R. Phospholipases of Mineralization Competent Cells and Matrix Vesicles: Roles in Physiological and Pathological Mineralizations. Int. J. Mol. Sci. 2013, 14, 5036–5129. [Google Scholar] [CrossRef] [Green Version]
- Huang, Y.; Zucker, B.; Zhang, S.; Elias, S.; Zhu, Y.; Chen, H.; Ding, T.; Li, Y.; Sun, Y.; Lou, J.; et al. Migrasome formation is mediated by assembly of micron-scale tetraspanin macrodomains. Nat. Cell Biol. 2019, 21, 991–1002. [Google Scholar] [CrossRef]
- Ma, L.; Li, Y.; Peng, J.; Wu, D.; Zhao, X.; Cui, Y.; Chen, L.; Yan, X.; Du, Y.; Yu, L. Discovery of the migrasome, an organelle mediating release of cytoplasmic contents during cell migration. Cell Res. 2015, 25, 24–38. [Google Scholar] [CrossRef] [Green Version]
- Coelho, C.; Brown, L.; Maryam, M.; Vij, R.; Smith, D.F.Q.; Burnet, M.C.; Kyle, J.E.; Heyman, H.M.; Ramirez, J.; Prados-Rosales, R.; et al. Listeria monocytogenes virulence factors, including listeriolysin O, are secreted in biologically active extracellular vesicles. J. Biol. Chem. 2019, 294, 1202–1217. [Google Scholar] [CrossRef] [Green Version]
- Kim, O.Y.; Park, H.T.; Dinh, N.T.H.; Choi, S.J.; Lee, J.; Kim, J.H.; Lee, S.-W.; Gho, Y.S. Bacterial outer membrane vesicles suppress tumor by interferon-γ-mediated antitumor response. Nat. Commun. 2017, 8, 626. [Google Scholar] [CrossRef]
- van Niel, G.; D’Angelo, G.; Raposo, G. Shedding light on the cell biology of extracellular vesicles. Nat. Rev. Mol. Cell Biol. 2018, 19, 213–228. [Google Scholar] [CrossRef]
- Théry, C.; Witwer, K.W.; Aikawa, E.; Alcaraz, M.J.; Anderson, J.D.; Andriantsitohaina, R.; Antoniou, A.; Arab, T.; Archer, F.; Atkin-Smith, G.K.; et al. Minimal information for studies of extracellular vesicles 2018 (MISEV2018): A position statement of the International Society for Extracellular Vesicles and update of the MISEV2014 guidelines. J. Extracell. Vesicles 2018, 7, 1535750. [Google Scholar] [CrossRef] [Green Version]
- Eguchi, T.; Sogawa, C.; Ono, K.; Matsumoto, M.; Tran, M.T.; Okusha, Y.; Lang, B.J.; Okamoto, K.; Calderwood, S.K. Cell Stress Induced Stressome Release Including Damaged Membrane Vesicles and Extracellular HSP90 by Prostate Cancer Cells. Cells 2020, 9, 755. [Google Scholar] [CrossRef] [PubMed] [Green Version]
- Fujiwara, T.; Eguchi, T.; Sogawa, C.; Ono, K.; Murakami, J.; Ibaragi, S.; Asaumi, J.; Calderwood, S.K.; Okamoto, K.; Kozaki, K. Carcinogenic epithelial-mesenchymal transition initiated by oral cancer exosomes is inhibited by anti-EGFR antibody cetuximab. Oral Oncol. 2018, 86, 251–257. [Google Scholar] [CrossRef]
- Taha, E.A.; Ono, K.; Eguchi, T. Roles of Extracellular HSPs as Biomarkers in Immune Surveillance and Immune Evasion. Int. J. Mol. Sci. 2019, 20, 4588. [Google Scholar] [CrossRef] [Green Version]
- Berg, G.; Barchuk, M.; Miksztowicz, V. Behavior of Metalloproteinases in Adipose Tissue, Liver and Arterial Wall: An Update of Extracellular Matrix Remodeling. Cells 2019, 8, 158. [Google Scholar] [CrossRef] [Green Version]
- Nagase, H.; Visse, R.; Murphy, G. Structure and function of matrix metalloproteinases and TIMPs. Cardiovasc. Res. 2006, 69, 562–573. [Google Scholar] [CrossRef] [Green Version]
- Radisky, E.S.; Radisky, D.C. Matrix metalloproteinases as breast cancer drivers and therapeutic targets. Front. Biosci. (Landmark Ed.) 2015, 20, 1144–1163. [Google Scholar] [CrossRef]
- Tallant, C.; Marrero, A.; Gomis-Rüth, F.X. Matrix metalloproteinases: Fold and function of their catalytic domains. Biochim. Biophys. Acta Mol. Cell Res. 2010, 1803, 20–28. [Google Scholar] [CrossRef]
- Vandenbroucke, R.E.; Libert, C. Is there new hope for therapeutic matrix metalloproteinase inhibition? Nat. Rev. Drug Discov. 2014, 13, 904–927. [Google Scholar] [CrossRef]
- Visse, R.; Nagase, H. Matrix metalloproteinases and tissue inhibitors of metalloproteinases: Structure, function, and biochemistry. Circ. Res. 2003, 92, 827–839. [Google Scholar] [CrossRef] [Green Version]
- Eguchi, T.; Kubota, S.; Kawata, K.; Mukudai, Y.; Uehara, J.; Ohgawara, T.; Ibaragi, S.; Sasaki, A.; Kuboki, T.; Takigawa, M. Novel Transcription Factor-Like Function of Human Matrix Metalloproteinase 3 Regulating the CTGF/CCN2 Gene. Mol. Cell. Biol. 2008, 28, 2391–2413. [Google Scholar] [CrossRef] [Green Version]
- Okusha, Y.; Eguchi, T.; Sogawa, C.; Okui, T.; Nakano, K.; Okamoto, K.; Kozaki, K.-I. The intranuclear PEX domain of MMP involves proliferation, migration, and metastasis of aggressive adenocarcinoma cells. J. Cell. Biochem. 2018, 119, 7363–7376. [Google Scholar] [CrossRef] [Green Version]
- Okusha, Y.; Eguchi, T.; Tran, M.T.; Sogawa, C.; Yoshida, K.; Itagaki, M.; Taha, E.A.; Ono, K.; Aoyama, E.; Okamura, H.; et al. Extracellular Vesicles Enriched with Moonlighting Metalloproteinase Are Highly Transmissive, Pro-Tumorigenic, and Trans-Activates Cellular Communication Network Factor (CCN2/CTGF): CRISPR against Cancer. Cancers 2020, 12, 881. [Google Scholar] [CrossRef] [Green Version]
- Eguchi, T.; Taha, E.A. Extracellular Vesicle-associated Moonlighting Proteins. In Heat Shock Proteins in Human Diseases; Heat Shock Proteins; Chapter 15; Springer Nature: New York, NY, USA, 2020; Volume 22, in press. [Google Scholar]
- Namba, Y.; Sogawa, C.; Okusha, Y.; Kawai, H.; Itagaki, M.; Ono, K.; Murakami, J.; Aoyama, E.; Ohyama, K.; Asaumi, J.; et al. Depletion of Lipid Efflux Pump ABCG1 Triggers the Intracellular Accumulation of Extracellular Vesicles and Reduces Aggregation and Tumorigenesis of Metastatic Cancer Cells. Front. Oncol. 2018, 8, 376. [Google Scholar] [CrossRef] [Green Version]
- Sogawa, C.; Eguchi, T.; Okusha, Y.; Ono, K.; Ohyama, K.; Iizuka, M.; Kawasaki, R.; Hamada, Y.; Takigawa, M.; Sogawa, N.; et al. A Reporter System Evaluates Tumorigenesis, Metastasis, β-catenin/MMP Regulation, and Druggability. Tissue Eng. Part A 2019, 25, 1413–1425. [Google Scholar] [CrossRef]
- Sogawa, C.; Eguchi, T.; Tran, M.T.; Ishige, M.; Trin, K.; Okusha, Y.; Taha, E.A.; Lu, Y.; Kawai, H.; Sogawa, N.; et al. Antiparkinson Drug Benztropine Suppresses Tumor Growth, Circulating Tumor Cells, and Metastasis by Acting on SLC6A3/DAT and Reducing STAT3. Cancers 2020, 12, 523. [Google Scholar] [CrossRef] [Green Version]
- Yoshii, Y.; Waki, A.; Yoshida, K.; Kakezuka, A.; Kobayashi, M.; Namiki, H.; Kuroda, Y.; Kiyono, Y.; Yoshii, H.; Furukawa, T.; et al. The use of nanoimprinted scaffolds as 3D culture models to facilitate spontaneous tumor cell migration and well-regulated spheroid formation. Biomaterials 2011, 32, 6052–6058. [Google Scholar] [CrossRef]
- Edmondson, R.; Broglie, J.J.; Adcock, A.F.; Yang, L. Three-dimensional cell culture systems and their applications in drug discovery and cell-based biosensors. Assay Drug Dev. Technol. 2014, 12, 207–218. [Google Scholar] [CrossRef] [Green Version]
- Lv, D.; Hu, Z.; Lu, L.; Lu, H.; Xu, X. Three-dimensional cell culture: A powerful tool in tumor research and drug discovery. Oncol. Lett. 2017, 14, 6999–7010. [Google Scholar] [CrossRef] [Green Version]
- Duval, K.; Grover, H.; Han, L.-H.; Mou, Y.; Pegoraro, A.F.; Fredberg, J.; Chen, Z. Modeling Physiological Events in 2D vs. 3D Cell Culture. Physiol. (Bethesda) 2017, 32, 266–277. [Google Scholar] [CrossRef]
- Griffith, L.G.; Swartz, M.A. Capturing complex 3D tissue physiology in vitro. Nat. Rev. Mol. Cell Biol. 2006, 7, 211–224. [Google Scholar] [CrossRef]
- Eguchi, T.; Sogawa, C.; Okusha, Y.; Uchibe, K.; Iinuma, R.; Ono, K.; Nakano, K.; Murakami, J.; Itoh, M.; Arai, K.; et al. Organoids with cancer stem cell-like properties secrete exosomes and HSP90 in a 3D nanoenvironment. PLoS ONE 2018, 13, e0191109. [Google Scholar] [CrossRef] [Green Version]
- Hirschhaeuser, F.; Menne, H.; Dittfeld, C.; West, J.; Mueller-Klieser, W.; Kunz-Schughart, L.A. Multicellular tumor spheroids: An underestimated tool is catching up again. J. Biotechnol. 2010, 148, 3–15. [Google Scholar] [CrossRef]
- Arai, K.; Eguchi, T.; Rahman, M.M.; Sakamoto, R.; Masuda, N.; Nakatsura, T.; Calderwood, S.K.; Kozaki, K.; Itoh, M. A Novel High-Throughput 3D Screening System for EMT Inhibitors: A Pilot Screening Discovered the EMT Inhibitory Activity of CDK2 Inhibitor SU9516. PLoS ONE 2016, 11, e0162394. [Google Scholar] [CrossRef]
- Elsayed, M.; Merkel, O.M. Nanoimprinting of topographical and 3D cell culture scaffolds. Nanomedicine 2014, 9, 349–366. [Google Scholar] [CrossRef]
- Yoshimura, A.; Kawamata, M.; Yoshioka, Y.; Katsuda, T.; Kikuchi, H.; Nagai, Y.; Adachi, N.; Numakawa, T.; Kunugi, H.; Ochiya, T.; et al. Generation of a novel transgenic rat model for tracing extracellular vesicles in body fluids. Sci. Rep. 2016, 6, 31172. [Google Scholar] [CrossRef]
- Piao, Y.J.; Kim, H.S.; Moon, W.K. Noninvasive Photoacoustic Imaging of Dendritic Cell Stimulated with Tumor Cell-Derived Exosome. Mol. Imaging Biol. 2019. [Google Scholar] [CrossRef]
- Lai, C.P.; Kim, E.Y.; Badr, C.E.; Weissleder, R.; Mempel, T.R.; Tannous, B.A.; Breakefield, X.O. Visualization and tracking of tumour extracellular vesicle delivery and RNA translation using multiplexed reporters. Nat. Commun. 2015, 6, 7029. [Google Scholar] [CrossRef]
- Verpelli, C.; Schmeisser, M.J.; Sala, C.; Boeckers, T.M. Scaffold proteins at the postsynaptic density. Adv. Exp. Med. Biol. 2012, 970, 29–61. [Google Scholar] [CrossRef]
- Xu, W. PSD-95-like membrane associated guanylate kinases (PSD-MAGUKs) and Synaptic Plasticity. Curr. Opin. Neurobiol. 2011, 21, 306–312. [Google Scholar] [CrossRef] [Green Version]
- Triola, G.; Waldmann, H.; Hedberg, C. Chemical biology of lipidated proteins. ACS Chem. Biol. 2012, 7, 87–99. [Google Scholar] [CrossRef]
- Zacharias, D.A.; Violin, J.D.; Newton, A.C.; Tsien, R.Y. Partitioning of lipid-modified monomeric GFPs into membrane microdomains of live cells. Science 2002, 296, 913–916. [Google Scholar] [CrossRef] [Green Version]
- Zuber, M.X.; Strittmatter, S.M.; Fishman, M.C. A membrane-targeting signal in the amino terminus of the neuronal protein GAP-43. Nature 1989, 341, 345–348. [Google Scholar] [CrossRef]
- Ono, K.; Sogawa, C.; Kawai, H.; Tran, M.T.; Taha, E.A.; Lu, Y.; Oo, M.W.; Okusha, Y.; Okamura, H.; Ibaragi, S.; et al. Triple knockdown of CDC37, HSP90-alpha, and HSP90-beta diminishes extracellular vesicles-driven malignancy events and macrophage M2 polarization in oral cancer. J. Extracell. Vesicles 2020, in press. [Google Scholar] [CrossRef]
- Schumaker, V. Lipoproteins, Apolipoproteins, and Lipases, 1st ed.; Academic Press: Cambridge, MA, USA, 1994; Volume 45, ISBN 978-0-08-058218-4. [Google Scholar]
- Maacha, S.; Bhat, A.A.; Jimenez, L.; Raza, A.; Haris, M.; Uddin, S.; Grivel, J.-C. Extracellular vesicles-mediated intercellular communication: Roles in the tumor microenvironment and anti-cancer drug resistance. Mol. Cancer 2019, 18, 55. [Google Scholar] [CrossRef] [Green Version]
- Taha, E.A.; Sogawa, C.; Okusha, Y.; Kawai, H.; Satoh, A.; Okamoto, K.; Eguchi, T. Okayama University: Okayama, Japan, Unpublished work. 2020.
- Belhocine, M.; Gernigon-Spychalowicz, T.; Jacob, M.-P.; Benazzoug, Y.; Exbrayat, J.-M. Immunoexpression of gelatinase (MMP-2 and MMP-9) in the seminal vesicles and ventral prostate of Libyan jird (Meriones libycus) during the seasonal cycle of reproduction. Histol. Histopathol. 2010, 25, 619–636. [Google Scholar] [CrossRef]
- Dolo, V.; Ginestra, A.; Cassará, D.; Ghersi, G.; Nagase, H.; Vittorelli, M.L. Shed membrane vesicles and selective localization of gelatinases and MMP-9/TIMP-1 complexes. Ann. N. Y. Acad. Sci. 1999, 878, 497–499. [Google Scholar] [CrossRef]
- Reiner, A.T.; Tan, S.; Agreiter, C.; Auer, K.; Bachmayr-Heyda, A.; Aust, S.; Pecha, N.; Mandorfer, M.; Pils, D.; Brisson, A.R.; et al. EV-Associated MMP9 in High-Grade Serous Ovarian Cancer Is Preferentially Localized to Annexin V-Binding EVs. Dis. Markers 2017, 2017, 9653194. [Google Scholar] [CrossRef]
- Shimoda, M.; Khokha, R. Proteolytic factors in exosomes. Proteomics 2013, 13, 1624–1636. [Google Scholar] [CrossRef]
- Taraboletti, G.; D’Ascenzo, S.; Borsotti, P.; Giavazzi, R.; Pavan, A.; Dolo, V. Shedding of the Matrix Metalloproteinases MMP-2, MMP-9, and MT1-MMP as Membrane Vesicle-Associated Components by Endothelial Cells. Am. J. Pathol. 2002, 160, 673–680. [Google Scholar] [CrossRef] [Green Version]
- Radisky, E.S.; Radisky, D.C. Matrix Metalloproteinase-Induced Epithelial-Mesenchymal Transition in Breast Cancer. J. Mammary Gland Biol. Neoplasia 2010, 15, 201–212. [Google Scholar] [CrossRef] [Green Version]
- Yang, F.; Tuxhorn, J.A.; Ressler, S.J.; McAlhany, S.J.; Dang, T.D.; Rowley, D.R. Stromal expression of connective tissue growth factor promotes angiogenesis and prostate cancer tumorigenesis. Cancer Res. 2005, 65, 8887–8895. [Google Scholar] [CrossRef] [PubMed] [Green Version]
- Kothapalli, D.; Grotendorst, G.R. CTGF modulates cell cycle progression in cAMP-arrested NRK fibroblasts. J. Cell. Physiol. 2000, 182, 119–126. [Google Scholar] [CrossRef]
- Yin, D.; Chen, W.; O’Kelly, J.; Lu, D.; Ham, M.; Doan, N.B.; Xie, D.; Wang, C.; Vadgama, J.; Said, J.W.; et al. CTGF Associated with Oncogenic Activities and Drug Resistance in Glioblastoma Multiforme (GBM). Int. J. Cancer 2010, 127, 2257–2267. [Google Scholar] [CrossRef] [PubMed] [Green Version]
- Eguchi, T.; Calderwood, S.K.; Takigawa, M.; Kubota, S.; Kozaki, K. Intracellular MMP3 Promotes HSP Gene Expression in Collaboration with Chromobox Proteins. J. Cell. Biochem. 2017, 118, 43–51. [Google Scholar] [CrossRef] [Green Version]
- Nelson, A.R.; Fingleton, B.; Rothenberg, M.L.; Matrisian, L.M. Matrix metalloproteinases: Biologic activity and clinical implications. J. Clin. Oncol. 2000, 18, 1135–1149. [Google Scholar] [CrossRef]
- Hashimoto, G.; Inoki, I.; Fujii, Y.; Aoki, T.; Ikeda, E.; Okada, Y. Matrix Metalloproteinases Cleave Connective Tissue Growth Factor and Reactivate Angiogenic Activity of Vascular Endothelial Growth Factor 165. J. Biol. Chem. 2002, 277, 36288–36295. [Google Scholar] [CrossRef] [Green Version]
- Kaasbøll, O.J.; Gadicherla, A.K.; Wang, J.-H.; Monsen, V.T.; Hagelin, E.M.V.; Dong, M.-Q.; Attramadal, H. Connective tissue growth factor (CCN2) is a matricellular preproprotein controlled by proteolytic activation. J. Biol. Chem. 2018, 293, 17953–17970. [Google Scholar] [CrossRef] [Green Version]
- Suzuki, M.; Raab, G.; Moses, M.A.; Fernandez, C.A.; Klagsbrun, M. Matrix Metalloproteinase-3 Releases Active Heparin-binding EGF-like Growth Factor by Cleavage at a Specific Juxtamembrane Site. J. Biol. Chem. 1997, 272, 31730–31737. [Google Scholar] [CrossRef] [Green Version]
- Levi, E.; Fridman, R.; Miao, H.Q.; Ma, Y.S.; Yayon, A.; Vlodavsky, I. Matrix metalloproteinase 2 releases active soluble ectodomain of fibroblast growth factor receptor 1. Proc. Natl. Acad. Sci. USA 1996, 93, 7069–7074. [Google Scholar] [CrossRef] [Green Version]
- Ito, A.; Mukaiyama, A.; Itoh, Y.; Nagase, H.; Thogersen, I.B.; Enghild, J.J.; Sasaguri, Y.; Mori, Y. Degradation of interleukin 1beta by matrix metalloproteinases. J. Biol. Chem. 1996, 271, 14657–14660. [Google Scholar] [CrossRef] [Green Version]
- Haro, H.; Crawford, H.C.; Fingleton, B.; Shinomiya, K.; Spengler, D.M.; Matrisian, L.M. Matrix metalloproteinase-7-dependent release of tumor necrosis factor-alpha in a model of herniated disc resorption. J. Clin. Investig. 2000, 105, 143–150. [Google Scholar] [CrossRef] [PubMed] [Green Version]
- Walker, N.I.; Harmon, B.V.; Gobé, G.C.; Kerr, J.F. Patterns of cell death. Methods Achiev. Exp. Pathol. 1988, 13, 18–54. [Google Scholar] [PubMed]
- Nicotera, P.; Leist, M.; Manzo, L. Neuronal cell death: A demise with different shapes. Trends Pharmacol. Sci. 1999, 20, 46–51. [Google Scholar] [CrossRef]
- Yoshida, S.; Kawai, H.; Eguchi, T.; Sukegawa, S.; Oo, M.W.; Anqi, C.; Takabatake, K.; Nakano, K.; Okamoto, K.; Nagatsuka, H. Tumor Angiogenic Inhibition Triggered Necrosis (TAITN) in Oral Cancer. Cells 2019, 8, 761. [Google Scholar] [CrossRef] [PubMed] [Green Version]
- Parhamifar, L.; Andersen, H.; Wu, L.; Hall, A.; Hudzech, D.; Moghimi, S.M. Chapter Twelve—Polycation-Mediated Integrated Cell Death Processes. In Advances in Genetics; Nonviral Vectors for Gene Therapy, Huang, L., Liu, D., Wagner, E., Eds.; Academic Press: Cambridge, MA, USA, 2014; Volume 88, pp. 353–398. [Google Scholar]
- Naour, F.L. The tumor antigen epcam: Tetraspanins and the tight junction protein claudin-7, new partners, new functions. Front. Biosci. 2008, 13, 5847–5865. [Google Scholar] [CrossRef]
- Charrin, S.; Manié, S.; Oualid, M.; Billard, M.; Boucheix, C.; Rubinstein, E. Differential stability of tetraspanin/tetraspanin interactions: Role of palmitoylation. FEBS Lett. 2002, 516, 139–144. [Google Scholar] [CrossRef] [Green Version]
- Yang, X.; Kovalenko, O.V.; Tang, W.; Claas, C.; Stipp, C.S.; Hemler, M.E. Palmitoylation supports assembly and function of integrin–tetraspanin complexes. J. Cell Biol. 2004, 167, 1231–1240. [Google Scholar] [CrossRef] [Green Version]
- Durcin, M.; Fleury, A.; Taillebois, E.; Hilairet, G.; Krupova, Z.; Henry, C.; Truchet, S.; Trötzmüller, M.; Köfeler, H.; Mabilleau, G.; et al. Characterisation of adipocyte-derived extracellular vesicle subtypes identifies distinct protein and lipid signatures for large and small extracellular vesicles. J. Extracell. Vesicles 2017, 6, 1305677. [Google Scholar] [CrossRef]
- Jimenez, L.; Yu, H.; McKenzie, A.J.; Franklin, J.L.; Patton, J.G.; Liu, Q.; Weaver, A.M. Quantitative Proteomic Analysis of Small and Large Extracellular Vesicles (EVs) Reveals Enrichment of Adhesion Proteins in Small EVs. J. Proteome Res. 2019, 18, 947–959. [Google Scholar] [CrossRef]
- Parolini, I.; Federici, C.; Raggi, C.; Lugini, L.; Palleschi, S.; Milito, A.D.; Coscia, C.; Iessi, E.; Logozzi, M.; Molinari, A.; et al. Microenvironmental pH Is a Key Factor for Exosome Traffic in Tumor Cells. J. Biol. Chem. 2009, 284, 34211–34222. [Google Scholar] [CrossRef] [Green Version]
- Escrevente, C.; Keller, S.; Altevogt, P.; Costa, J. Interaction and uptake of exosomes by ovarian cancer cells. BMC Cancer 2011, 11, 108. [Google Scholar] [CrossRef] [PubMed] [Green Version]
- Feng, D.; Zhao, W.-L.; Ye, Y.-Y.; Bai, X.-C.; Liu, R.-Q.; Chang, L.-F.; Zhou, Q.; Sui, S.-F. Cellular Internalization of Exosomes Occurs Through Phagocytosis. Traffic 2010, 11, 675–687. [Google Scholar] [CrossRef] [PubMed]
- Fitzner, D.; Schnaars, M.; van Rossum, D.; Krishnamoorthy, G.; Dibaj, P.; Bakhti, M.; Regen, T.; Hanisch, U.-K.; Simons, M. Selective transfer of exosomes from oligodendrocytes to microglia by macropinocytosis. J. Cell Sci. 2011, 124, 447–458. [Google Scholar] [CrossRef] [PubMed] [Green Version]
- Morelli, A.E.; Larregina, A.T.; Shufesky, W.J.; Sullivan, M.L.G.; Stolz, D.B.; Papworth, G.D.; Zahorchak, A.F.; Logar, A.J.; Wang, Z.; Watkins, S.C.; et al. Endocytosis, intracellular sorting, and processing of exosomes by dendritic cells. Blood 2004, 104, 3257–3266. [Google Scholar] [CrossRef] [Green Version]
- Nanbo, A.; Kawanishi, E.; Yoshida, R.; Yoshiyama, H. Exosomes derived from Epstein-Barr virus-infected cells are internalized via caveola-dependent endocytosis and promote phenotypic modulation in target cells. J. Virol. 2013, 87, 10334–10347. [Google Scholar] [CrossRef] [Green Version]
- Svensson, K.J.; Christianson, H.C.; Wittrup, A.; Bourseau-Guilmain, E.; Lindqvist, E.; Svensson, L.M.; Mörgelin, M.; Belting, M. Exosome Uptake Depends on ERK1/2-Heat Shock Protein 27 Signaling and Lipid Raft-mediated Endocytosis Negatively Regulated by Caveolin-1. J. Biol. Chem. 2013, 288, 17713–17724. [Google Scholar] [CrossRef] [Green Version]
- Wang, J.; Wu, Y.; Guo, J.; Fei, X.; Yu, L.; Ma, S. Adipocyte-derived exosomes promote lung cancer metastasis by increasing MMP9 activity via transferring MMP3 to lung cancer cells. Oncotarget 2017, 8, 81880–81891. [Google Scholar] [CrossRef]
- Sakata, K.; Kozaki, K.; Iida, K.; Tanaka, R.; Yamagata, S.; Utsumi, K.R.; Saga, S.; Shimizu, S.; Matsuyama, M. Establishment and Characterization of High- and Low-lung-metastatic Cell Lines Derived from Murine Colon Adenocarcinoma 26 Tumor Line. Jpn. J. Cancer Res. 1996, 87, 78–85. [Google Scholar] [CrossRef]
- Ono, K.; Eguchi, T.; Sogawa, C.; Calderwood, S.K.; Futagawa, J.; Kasai, T.; Seno, M.; Okamoto, K.; Sasaki, A.; Kozaki, K. HSP-enriched properties of extracellular vesicles involve survival of metastatic oral cancer cells. J. Cell. Biochem. 2018, 119, 7350–7362. [Google Scholar] [CrossRef] [Green Version]


| LuM1-EV | MMP3-KO-EV | ||||||
|---|---|---|---|---|---|---|---|
| Peak | Diameter (nm) | Intensity (%) | Width (nm) | Peak | Diameter (nm) | Intensity (%) | Width (nm) |
| 1 | 561.4 | 48.6 | 164.9 | 1 | 464.9 | 76.6 | 155.3 |
| 2 | 119.3 | 38.3 | 31.8 | 2 | 83.9 | 20.2 | 20.4 |
| 3 | 8.0 | 6.8 | 1.53 | 3 | 5,374 | 3.2 | 326.1 |
| LuM1 | MMP3-KO | |
|---|---|---|
| Total tumoroid area (μm2) | 331,701 | 64,148 |
| Number of necrotic areas | 1 | 5 |
| Sum of necrotic areas (μm2) | 4807 | 9351 |
| Necrosis % | 1 | 15 |
© 2020 by the authors. Licensee MDPI, Basel, Switzerland. This article is an open access article distributed under the terms and conditions of the Creative Commons Attribution (CC BY) license (http://creativecommons.org/licenses/by/4.0/).
Share and Cite
Taha, E.A.; Sogawa, C.; Okusha, Y.; Kawai, H.; Oo, M.W.; Elseoudi, A.; Lu, Y.; Nagatsuka, H.; Kubota, S.; Satoh, A.; et al. Knockout of MMP3 Weakens Solid Tumor Organoids and Cancer Extracellular Vesicles. Cancers 2020, 12, 1260. https://doi.org/10.3390/cancers12051260
Taha EA, Sogawa C, Okusha Y, Kawai H, Oo MW, Elseoudi A, Lu Y, Nagatsuka H, Kubota S, Satoh A, et al. Knockout of MMP3 Weakens Solid Tumor Organoids and Cancer Extracellular Vesicles. Cancers. 2020; 12(5):1260. https://doi.org/10.3390/cancers12051260
Chicago/Turabian StyleTaha, Eman A., Chiharu Sogawa, Yuka Okusha, Hotaka Kawai, May Wathone Oo, Abdellatif Elseoudi, Yanyin Lu, Hitoshi Nagatsuka, Satoshi Kubota, Ayano Satoh, and et al. 2020. "Knockout of MMP3 Weakens Solid Tumor Organoids and Cancer Extracellular Vesicles" Cancers 12, no. 5: 1260. https://doi.org/10.3390/cancers12051260