Diclofenac Potentiates Sorafenib-Based Treatments of Hepatocellular Carcinoma by Enhancing Oxidative Stress

 , , , and
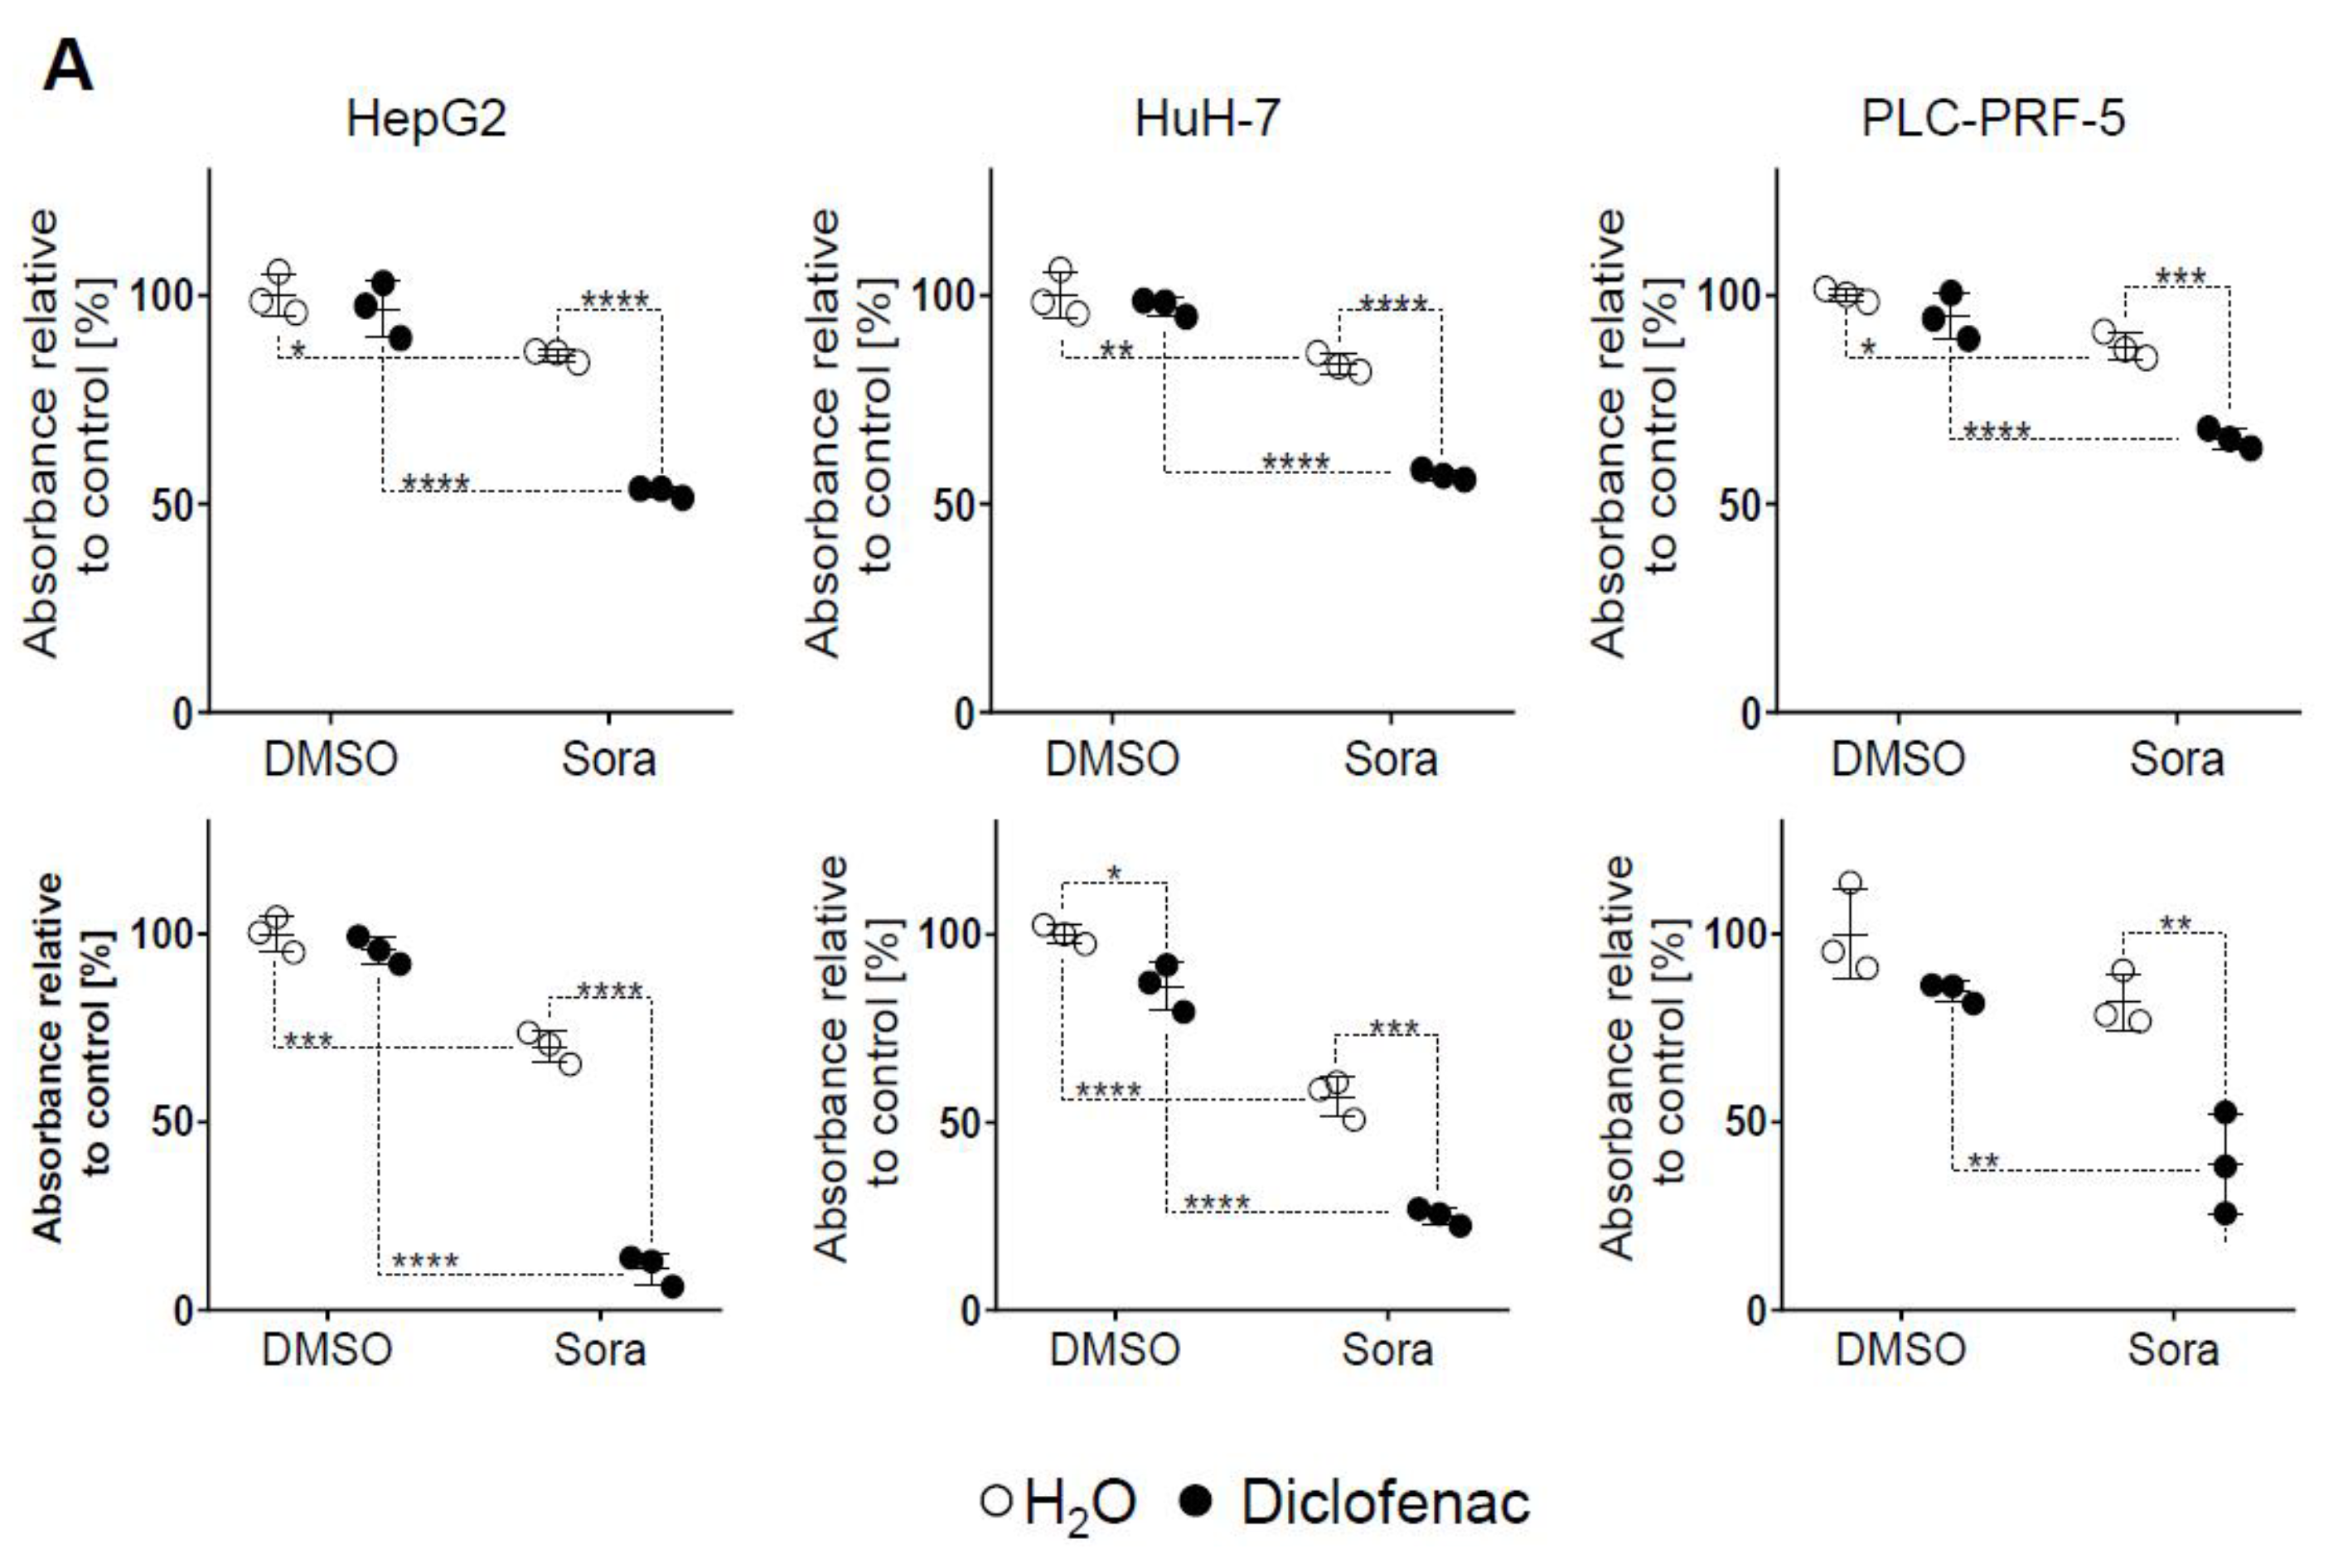
Abstract
:1. Introduction
2. Results
2.1. Sorafenib and Diclofenac Co-Therapy Increases HCC Cell Death
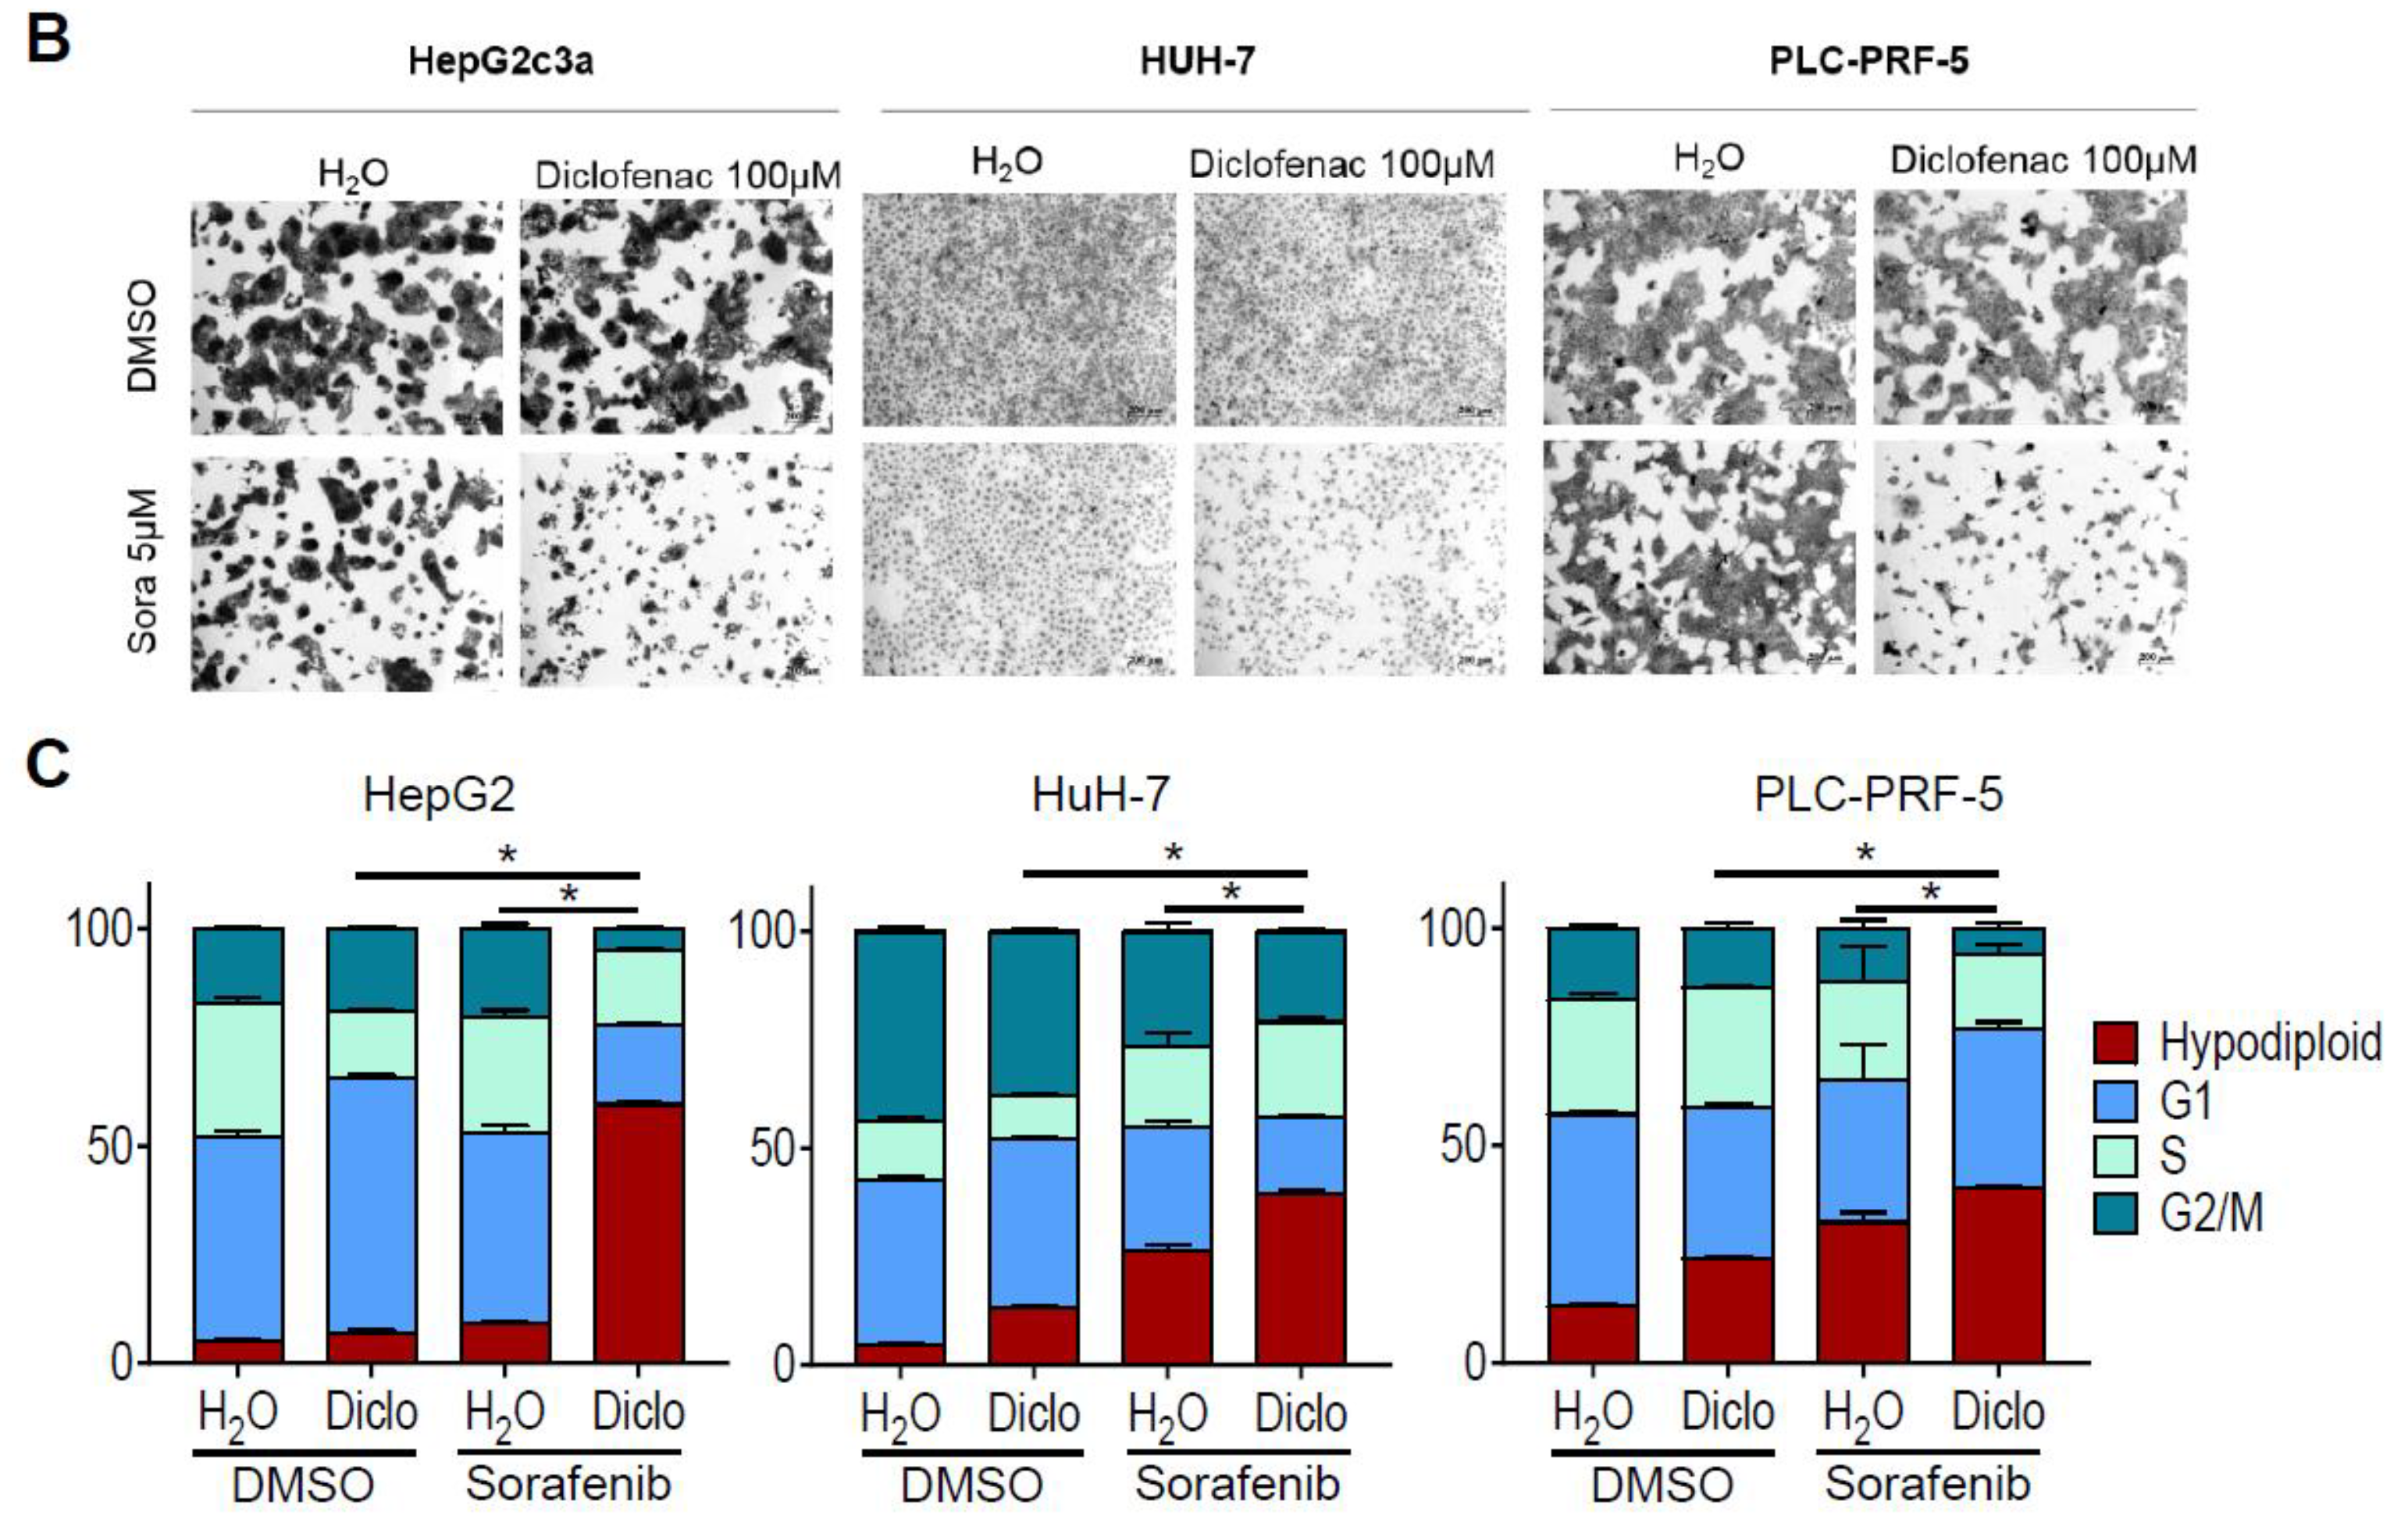
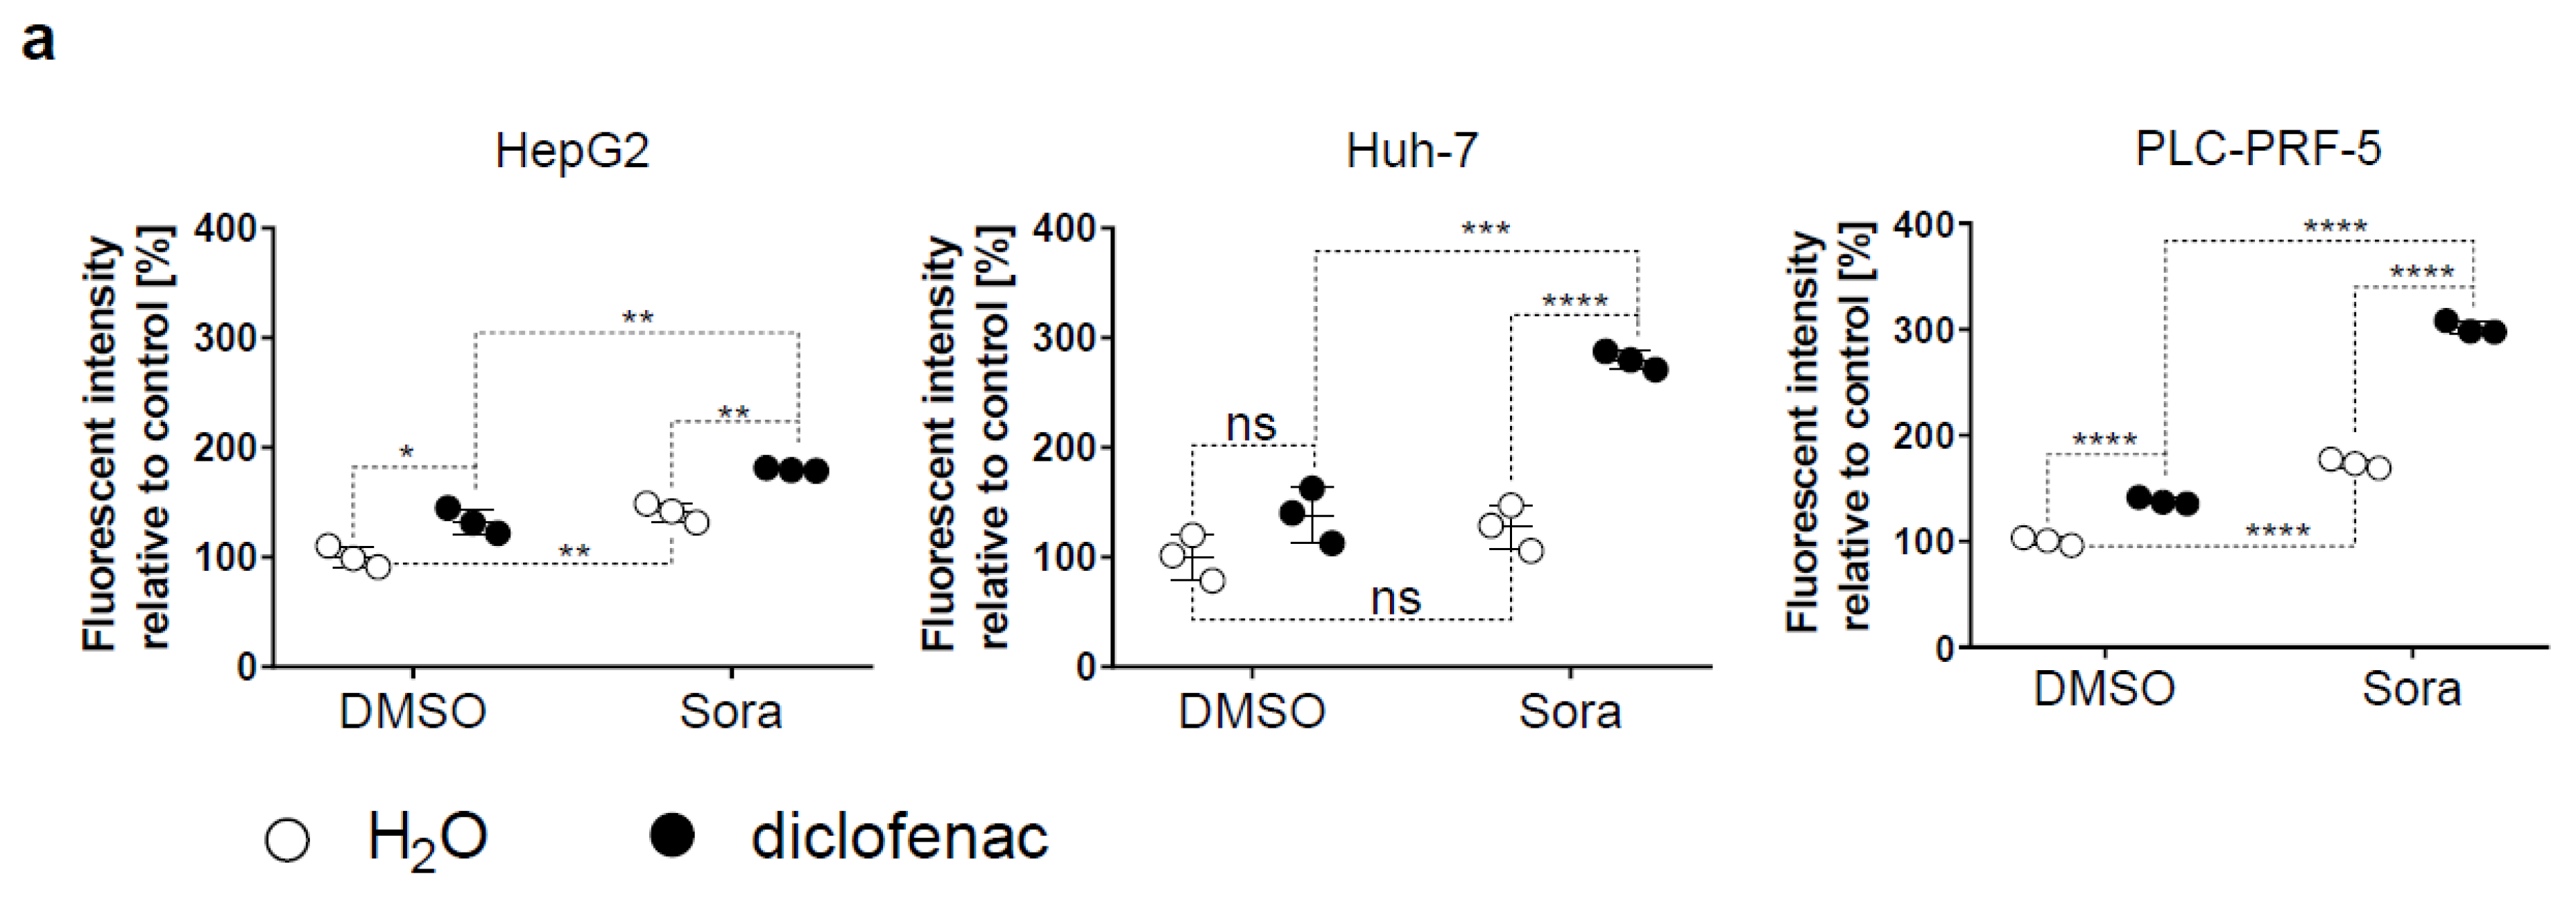
2.2. Sorafenib and Diclofenac Increase Oxidative Stress in HCC Cells
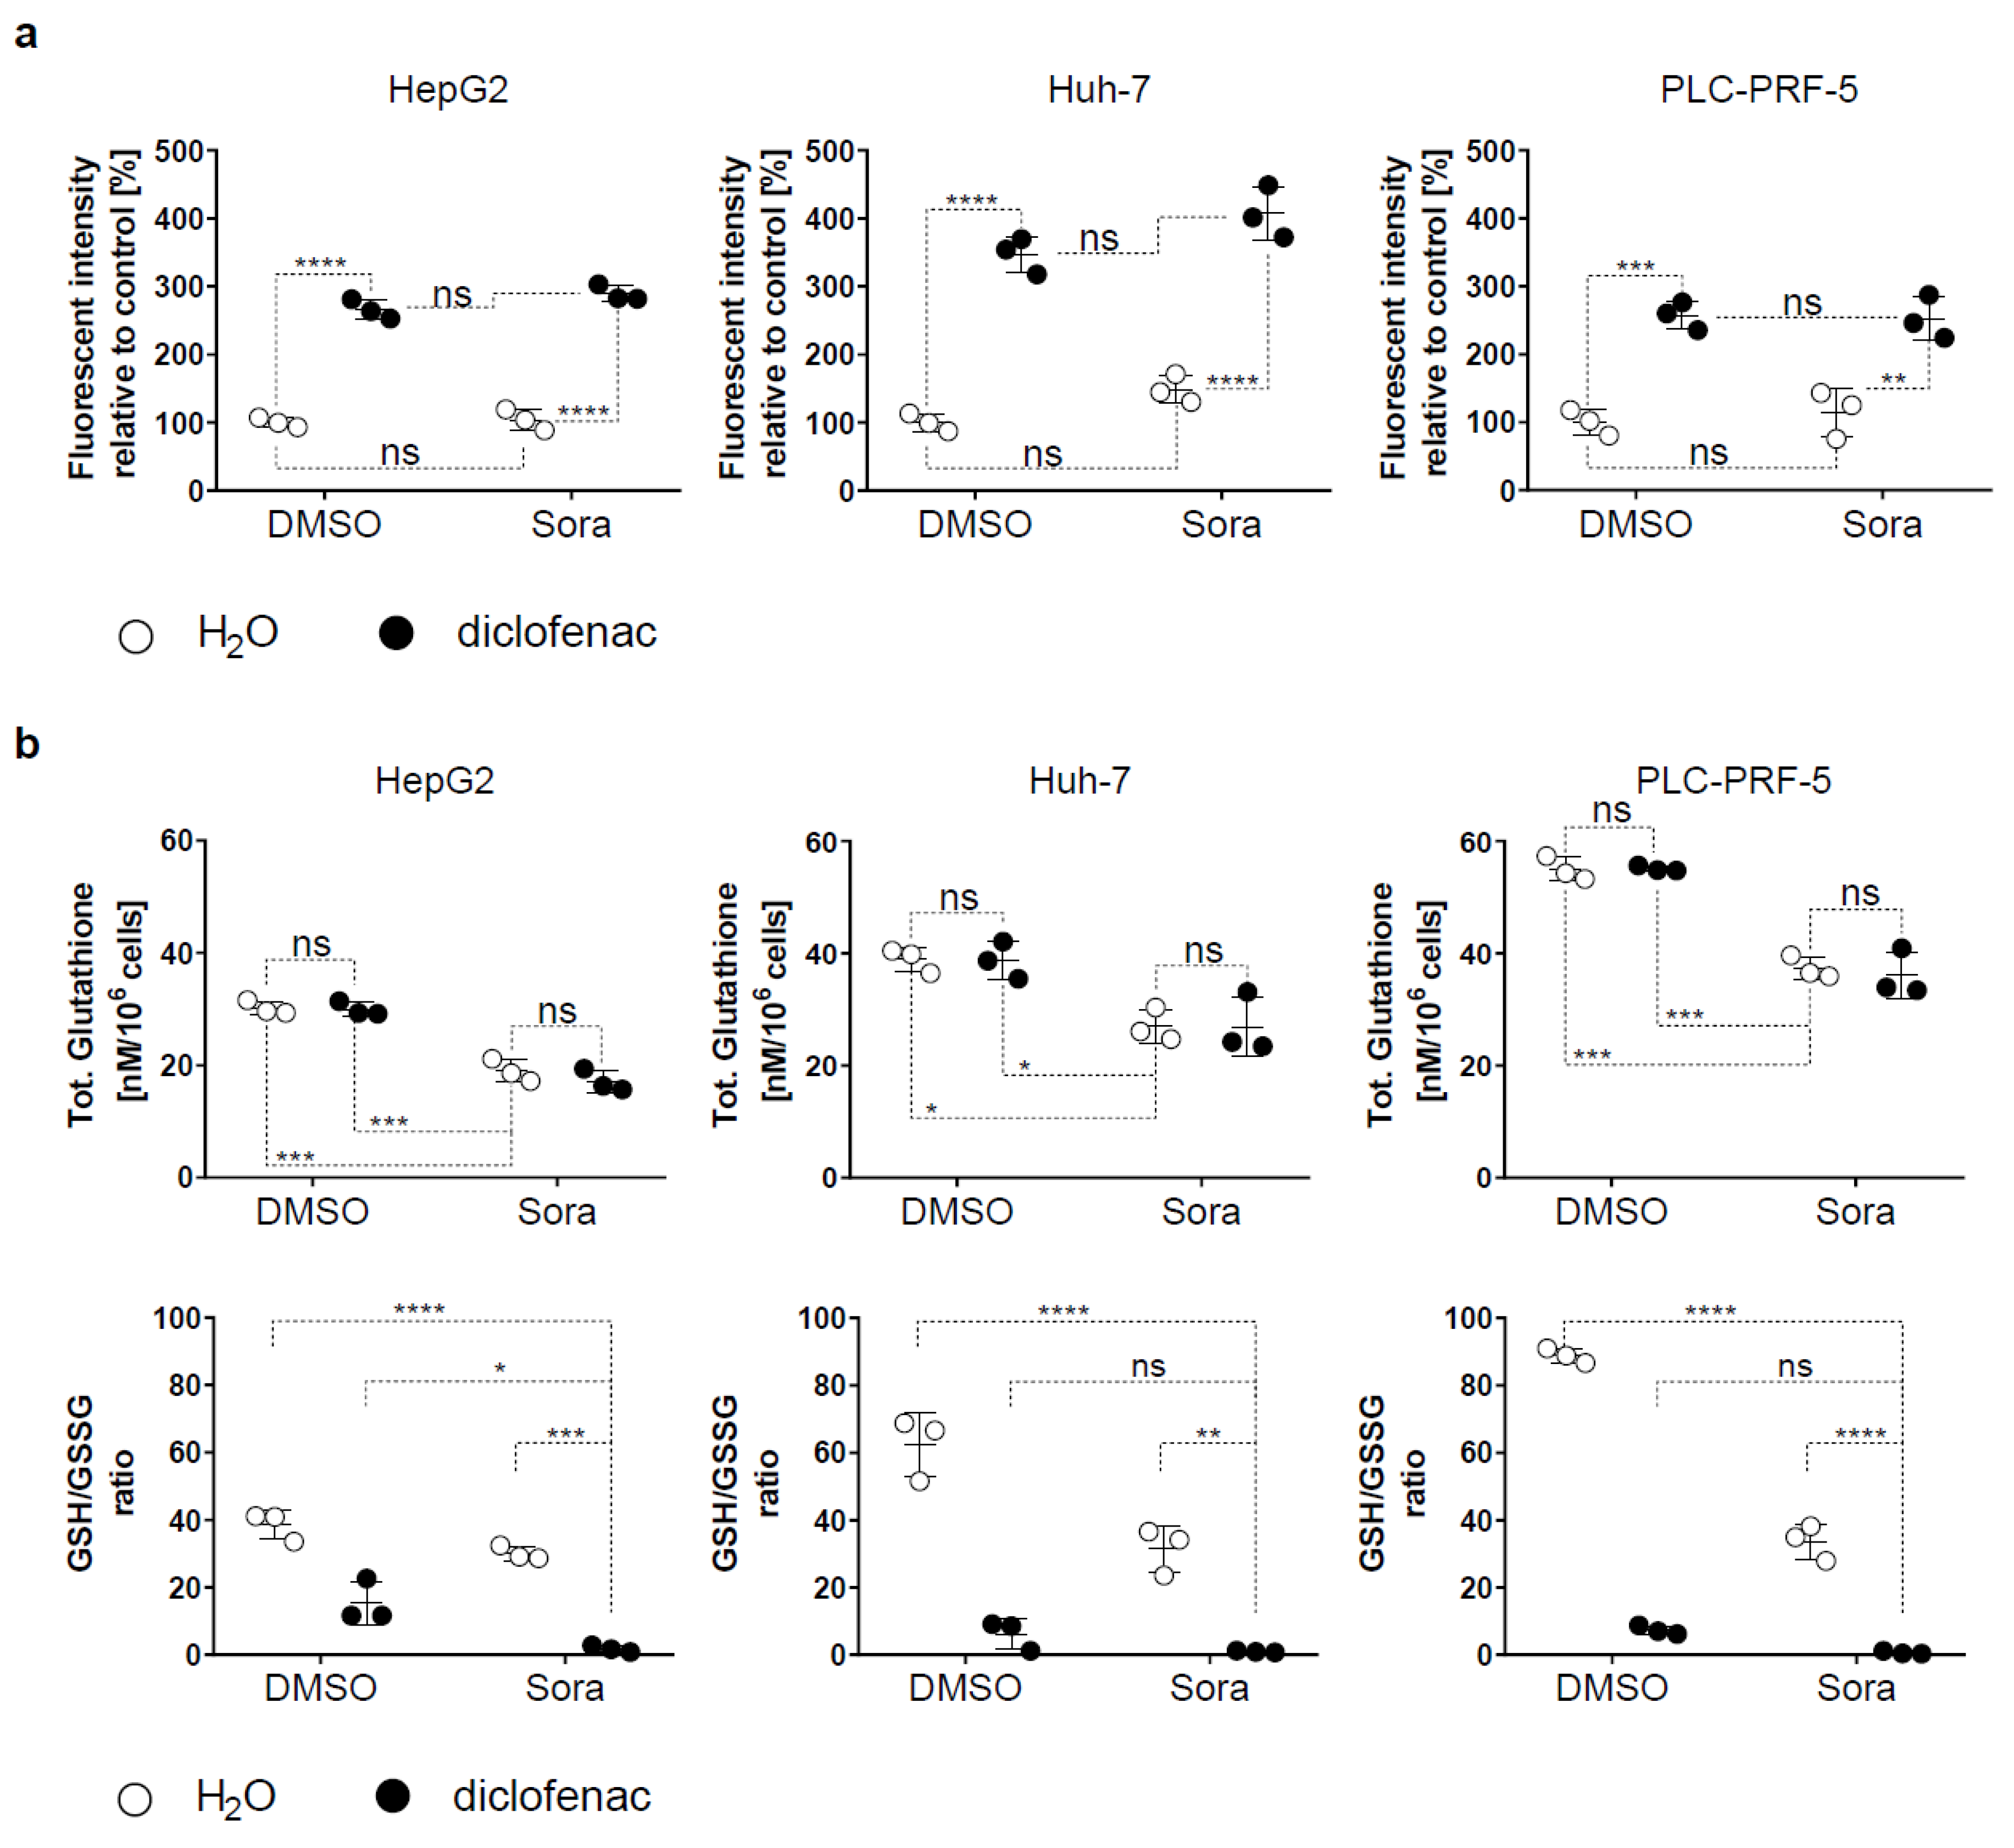
2.3. Blocking Oxidative Stress Prevents Sorafenib/Diclofenac-Mediated HCC Cell Death
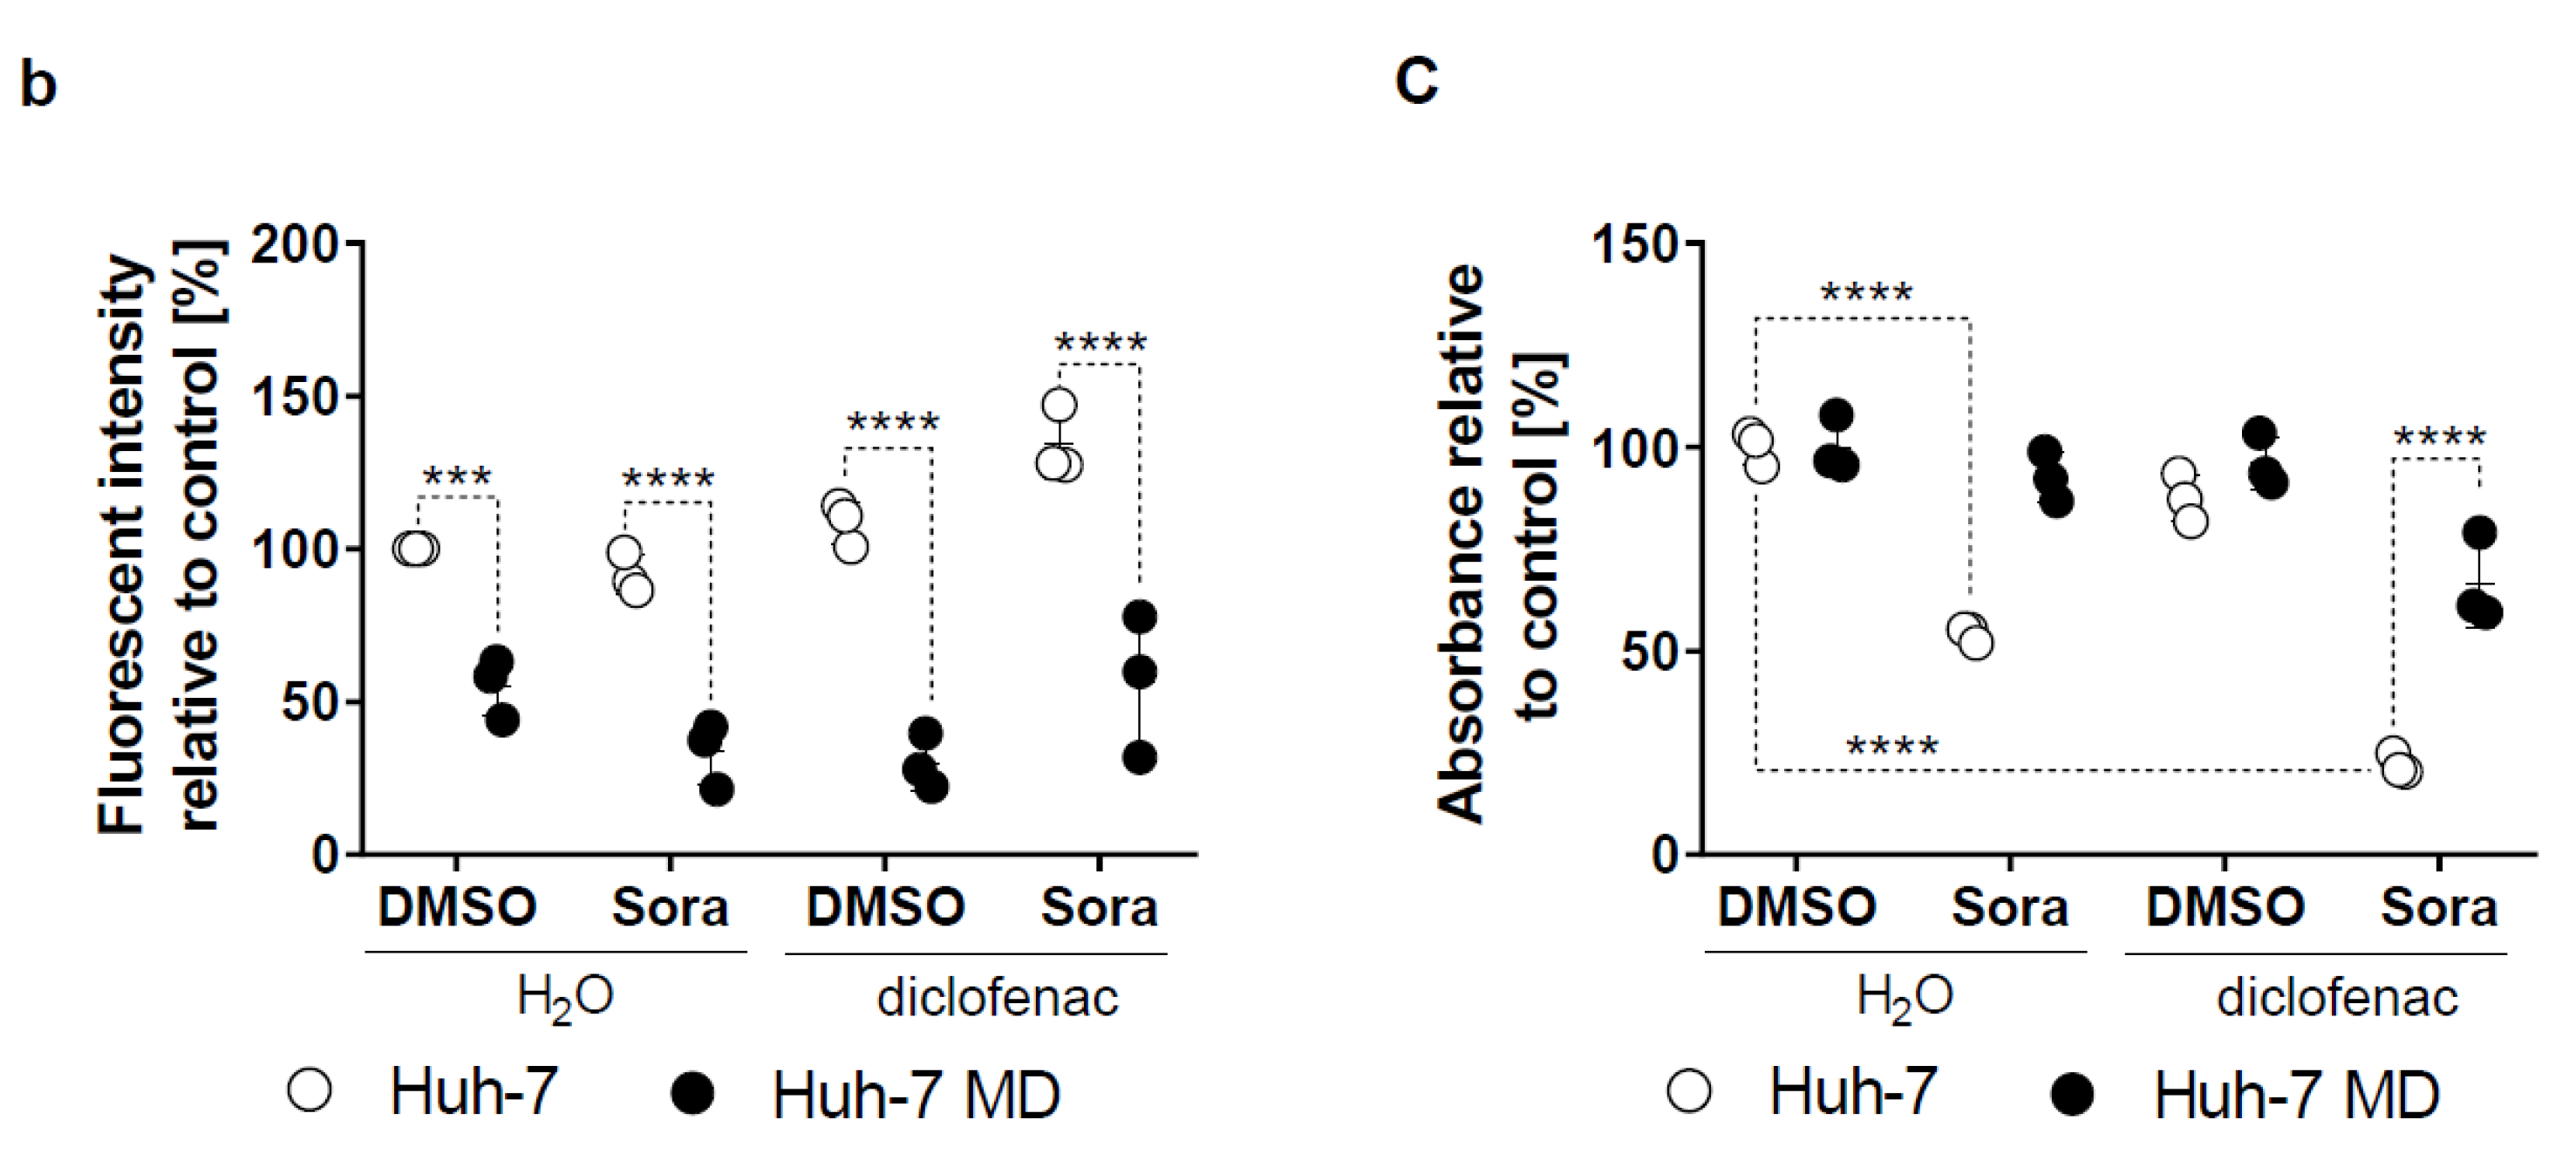
2.4. Increased Mitochondrial ROS in HCC by Sorafenib/Diclofenac
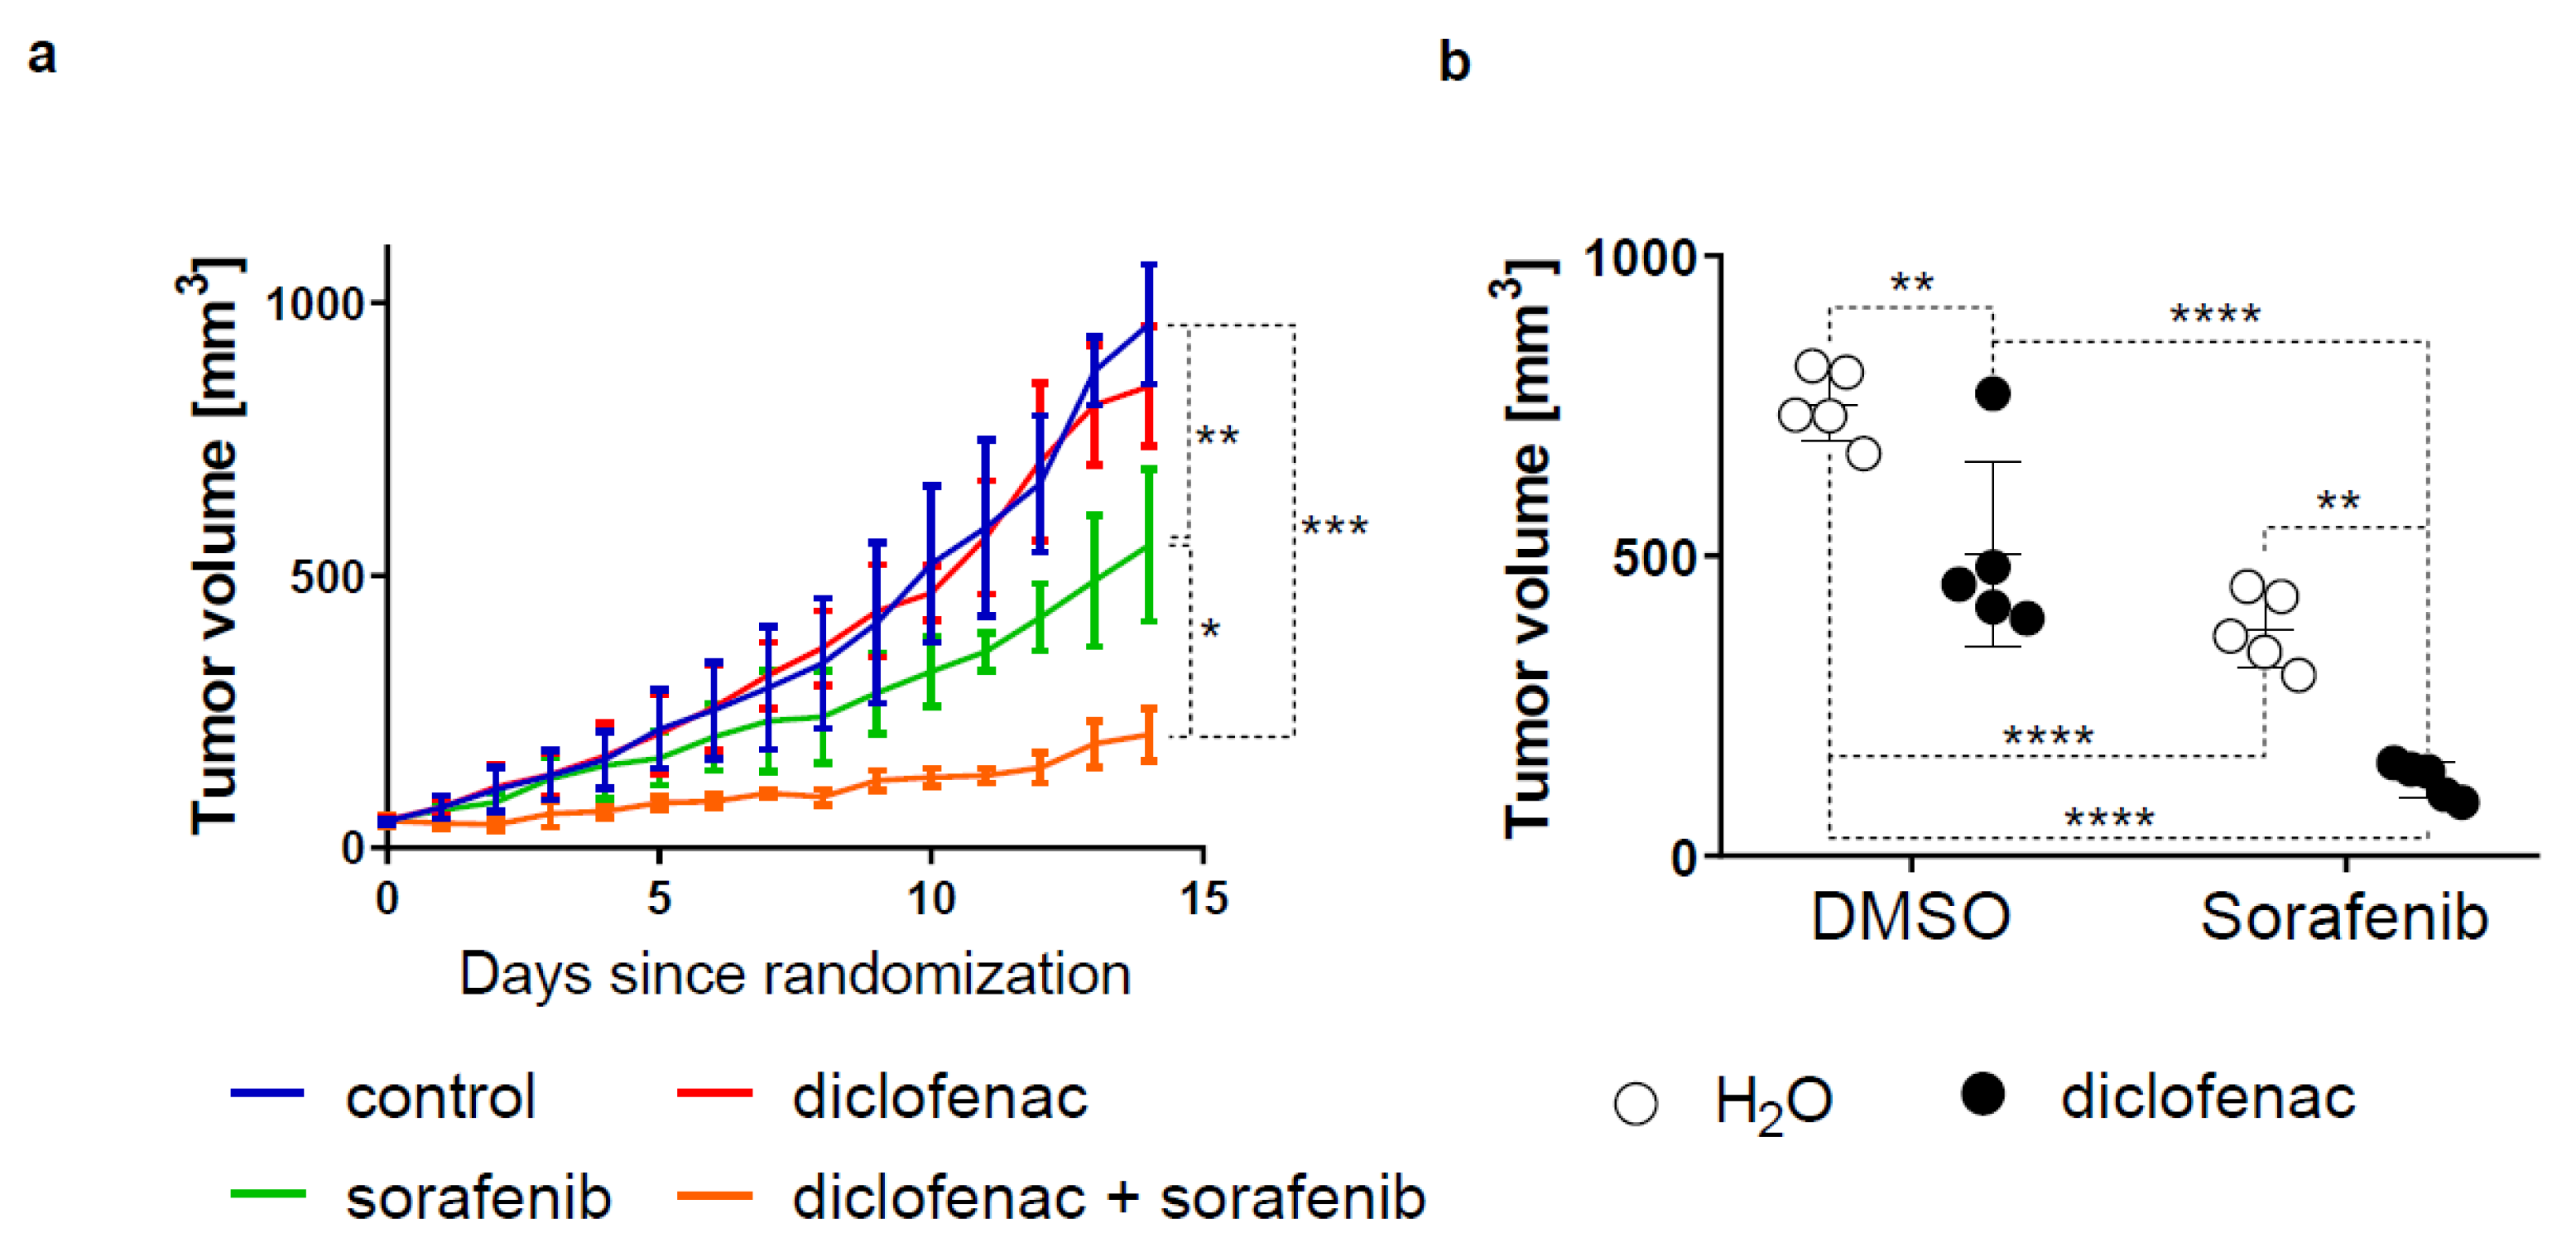
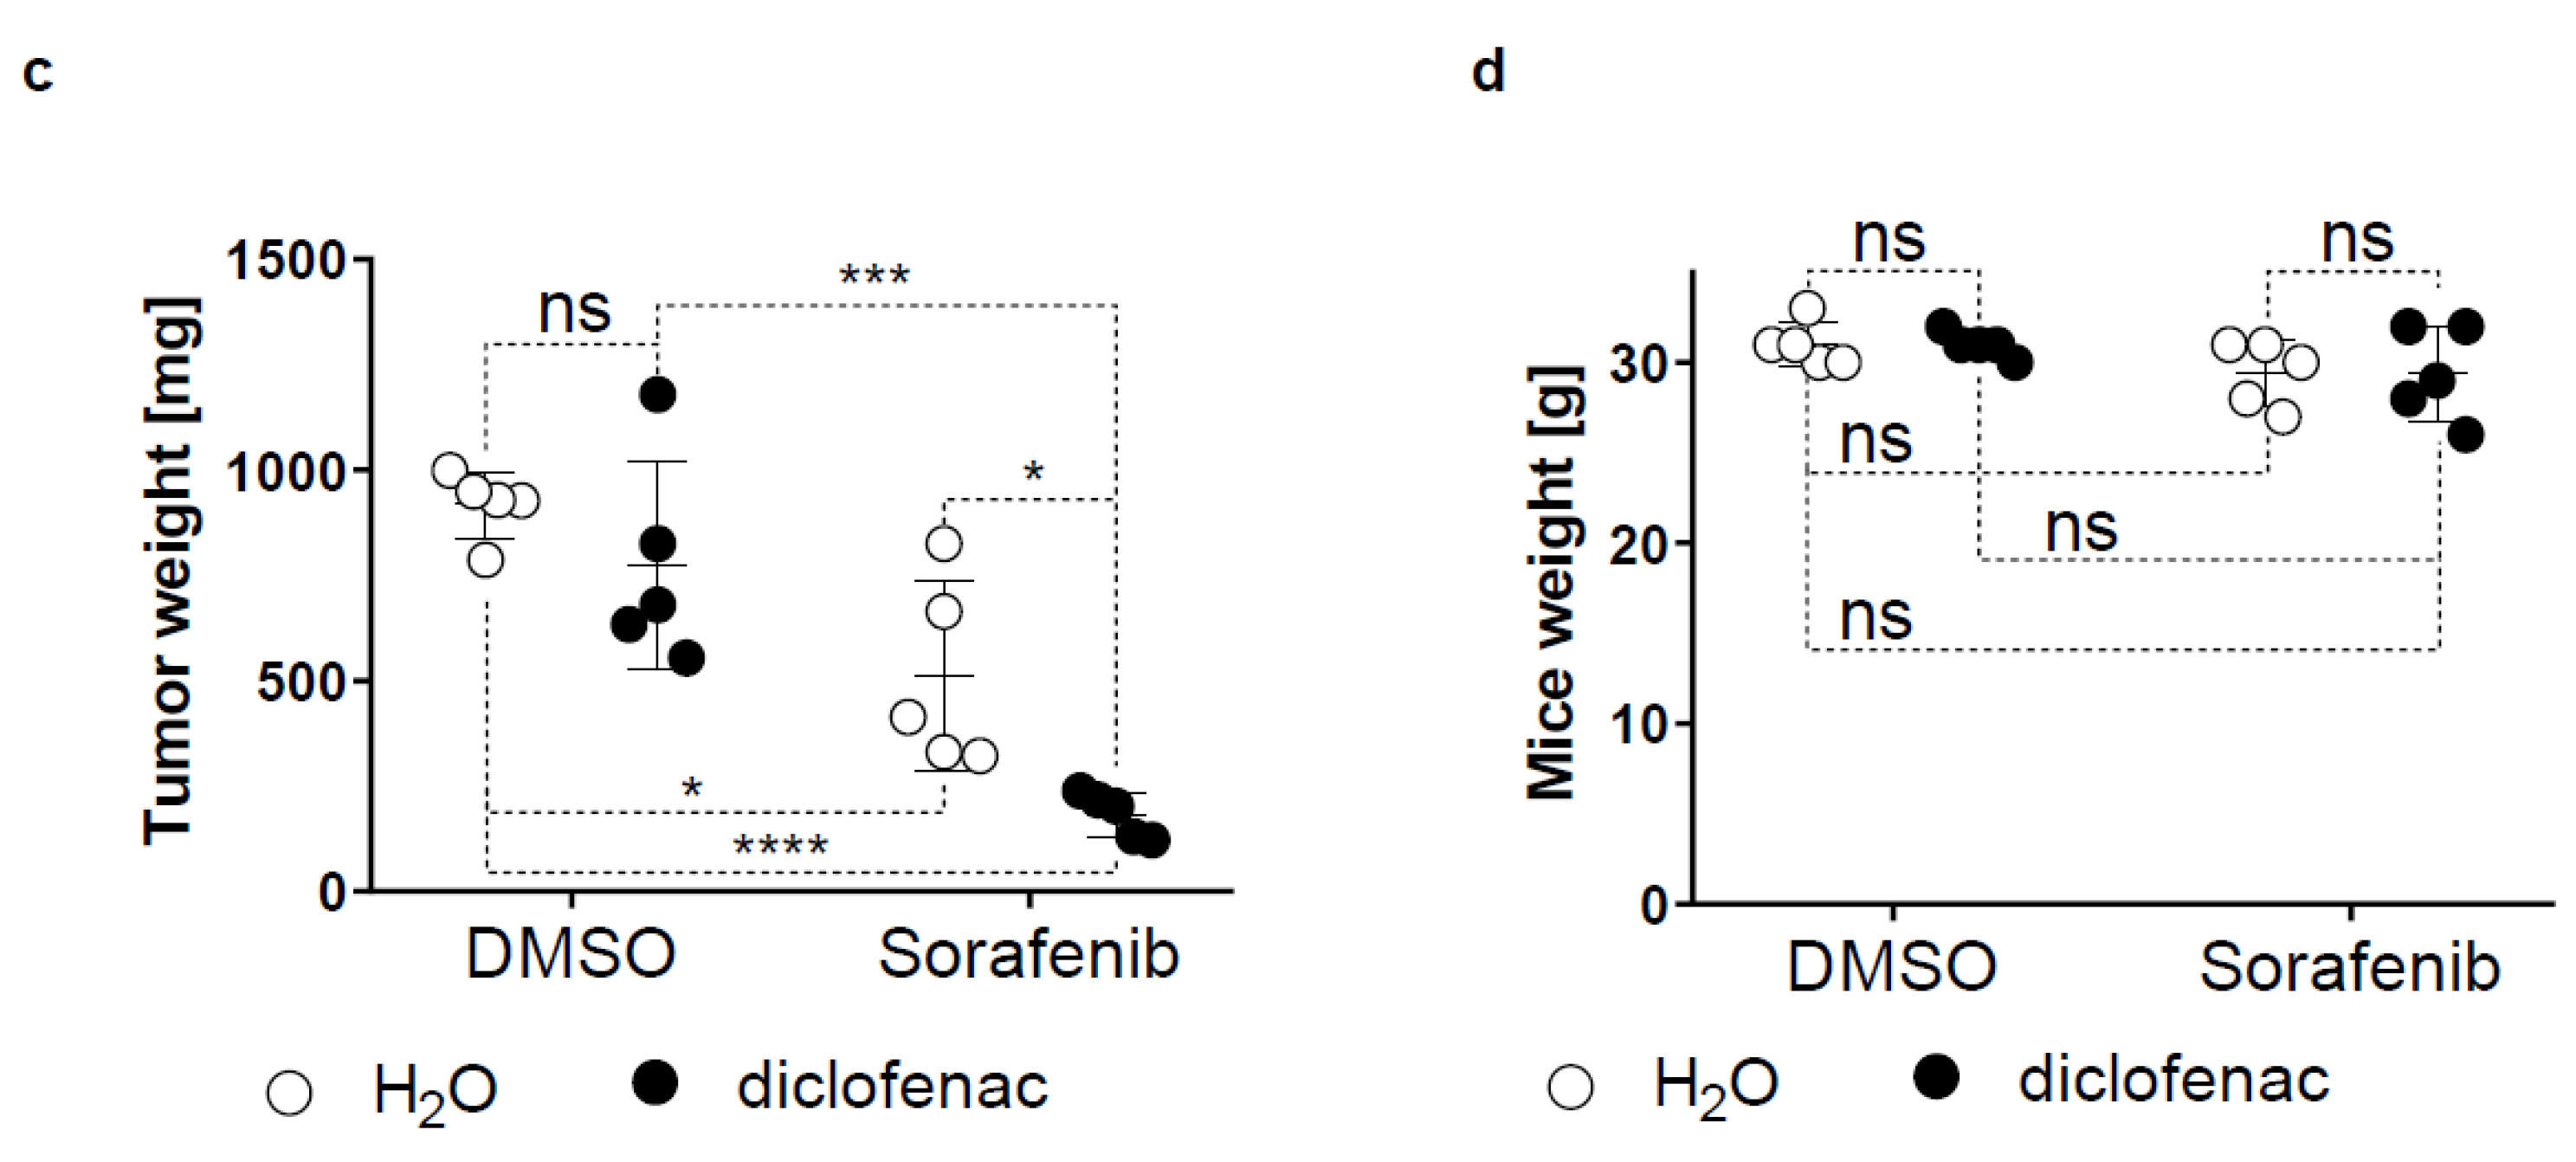
2.5. Diclofenac Potentiates the Anticancer Efficacy of Sorafenib In Vivo
3. Discussion
4. Materials and Methods
4.1. Cell Culture
4.2. Reagents
4.3. MTS Proliferation Assay
4.4. Crystal Violet Staining
4.5. Flow Cytometry
4.6. ROS Measurement
4.7. MitoSOX
4.8. GSH Measurement
4.9. Mouse Model
4.10. Statistics
5. Conclusions
Supplementary Materials
Author Contributions
Funding
Acknowledgments
Conflicts of Interest
References
- Bray, F.; Ferlay, J.; Soerjomataram, I.; Siegel, R.L.; Torre, L.A.; Jemal, A. Global cancer statistics 2018: Globocan estimates of incidence and mortality worldwide for 36 cancers in 185 countries. CA Cancer J. Clin. 2018, 68, 394–424. [Google Scholar] [CrossRef] [PubMed]
- Wong, M.C.; Jiang, J.Y.; Goggins, W.B.; Liang, M.; Fang, Y.; Fung, F.D.; Leung, C.; Wang, H.H.; Wong, G.L.; Wong, V.W.; et al. International incidence and mortality trends of liver cancer: A global profile. Sci. Rep. 2017, 7, 45846. [Google Scholar] [CrossRef]
- Wilhelm, S.; Carter, C.; Lynch, M.; Lowinger, T.; Dumas, J.; Smith, R.A.; Schwartz, B.; Simantov, R.; Kelley, S. Discovery and development of sorafenib: A multikinase inhibitor for treating cancer. Nat. Rev. Drug Discov. 2006, 5, 835–844. [Google Scholar] [CrossRef] [PubMed]
- Llovet, J.M.; Ricci, S.; Mazzaferro, V.; Hilgard, P.; Gane, E.; Blanc, J.F.; de Oliveira, A.C.; Santoro, A.; Raoul, J.L.; Forner, A.; et al. Sorafenib in advanced hepatocellular carcinoma. N. Engl. J. Med. 2008, 359, 378–390. [Google Scholar] [CrossRef] [PubMed]
- Coriat, R.; Nicco, C.; Chereau, C.; Mir, O.; Alexandre, J.; Ropert, S.; Weill, B.; Chaussade, S.; Goldwasser, F.; Batteux, F. Sorafenib-induced hepatocellular carcinoma cell death depends on reactive oxygen species production in vitro and in vivo. Mol. Cancer Ther. 2012, 11, 2284–2293. [Google Scholar] [CrossRef] [PubMed]
- Dixon, S.J.; Patel, D.N.; Welsch, M.; Skouta, R.; Lee, E.D.; Hayano, M.; Thomas, A.G.; Gleason, C.E.; Tatonetti, N.P.; Slusher, B.S.; et al. Pharmacological inhibition of cystine-glutamate exchange induces endoplasmic reticulum stress and ferroptosis. Elife 2014, 3, e02523. [Google Scholar] [CrossRef] [PubMed]
- Schieber, M.; Chandel, N.S. Ros function in redox signaling and oxidative stress. Curr. Biol. 2014, 24, R453–R462. [Google Scholar] [CrossRef]
- Finkel, T. Signal transduction by reactive oxygen species. J. Cell. Biol. 2011, 194, 7–15. [Google Scholar] [CrossRef] [Green Version]
- Sabharwal, S.S.; Schumacker, P.T. Mitochondrial ros in cancer: Initiators, amplifiers or an achilles’ heel? Nat. Rev. Cancer 2014, 14, 709–721. [Google Scholar] [CrossRef]
- Gray, L.H.; Conger, A.D.; Ebert, M.; Hornsey, S.; Scott, O.C. The concentration of oxygen dissolved in tissues at the time of irradiation as a factor in radiotherapy. Br. J. Radiol. 1953, 26, 638–648. [Google Scholar] [CrossRef]
- Gomez-Lechon, M.J.; Ponsoda, X.; O’Connor, E.; Donato, T.; Castell, J.V.; Jover, R. Diclofenac induces apoptosis in hepatocytes by alteration of mitochondrial function and generation of ros. Biochem. Pharmacol. 2003, 66, 2155–2167. [Google Scholar] [CrossRef] [PubMed]
- Roller, D.G.; Axelrod, M.; Capaldo, B.J.; Jensen, K.; Mackey, A.; Weber, M.J.; Gioeli, D. Synthetic lethal screening with small-molecule inhibitors provides a pathway to rational combination therapies for melanoma. Mol. Cancer Ther. 2012, 11, 2505–2515. [Google Scholar] [CrossRef] [PubMed]
- Pantziarka, P.; Sukhatme, V.; Bouche, G.; Meheus, L.; Sukhatme, V.P. Repurposing drugs in oncology (redo)-diclofenac as an anti-cancer agent. Ecancermedicalscience 2016, 10, 610. [Google Scholar] [CrossRef] [PubMed]
- Zafarullah, M.; Li, W.Q.; Sylvester, J.; Ahmad, M. Molecular mechanisms of n-acetylcysteine actions. Cell Mol. Life Sci. 2003, 60, 6–20. [Google Scholar] [CrossRef]
- Fuchs-Tarlovsky, V. Role of antioxidants in cancer therapy. Nutrition 2013, 29, 15–21. [Google Scholar] [CrossRef] [PubMed]
- Redza-Dutordoir, M.; Averill-Bates, D.A. Activation of apoptosis signalling pathways by reactive oxygen species. Biochim. Biophys. Acta. 2016, 1863, 2977–2992. [Google Scholar] [CrossRef] [PubMed]
- Chio, I.I.C.; Tuveson, D.A. Ros in cancer: The burning question. Trends. Mol. Med. 2017, 23, 411–429. [Google Scholar] [CrossRef] [PubMed]
- Kauffman, M.E.; Kauffman, M.K.; Traore, K.; Zhu, H.; Trush, M.A.; Jia, Z.; Li, Y.R. Mitosox-based flow cytometry for detecting mitochondrial ros. React. Oxyg. Species. (Apex.) 2016, 2, 361–370. [Google Scholar] [CrossRef]
- Llovet, J.M.; Montal, R.; Sia, D.; Finn, R.S. Molecular therapies and precision medicine for hepatocellular carcinoma. Nat. Rev. Clin. Oncol. 2018, 15, 599–616. [Google Scholar] [CrossRef] [PubMed]
- Sun, X.; Ou, Z.; Chen, R.; Niu, X.; Chen, D.; Kang, R.; Tang, D. Activation of the p62-keap1-nrf2 pathway protects against ferroptosis in hepatocellular carcinoma cells. Hepatology 2016, 63, 173–184. [Google Scholar] [CrossRef]
- Wan, J.; Liu, T.; Mei, L.; Li, J.; Gong, K.; Yu, C.; Li, W. Synergistic antitumour activity of sorafenib in combination with tetrandrine is mediated by reactive oxygen species (ros)/akt signaling. Br. J. Cancer 2013, 109, 342–350. [Google Scholar] [CrossRef] [PubMed]
- Lange, M.; Abhari, B.A.; Hinrichs, T.M.; Fulda, S.; Liese, J. Identification of a novel oxidative stress induced cell death by sorafenib and oleanolic acid in human hepatocellular carcinoma cells. Biochem. Pharmacol. 2016, 118, 9–17. [Google Scholar] [CrossRef] [PubMed]
- Roh, J.L.; Kim, E.H.; Jang, H.; Shin, D. Aspirin plus sorafenib potentiates cisplatin cytotoxicity in resistant head and neck cancer cells through xct inhibition. Free Radic. Biol. Med. 2017, 104, 1–9. [Google Scholar] [CrossRef] [PubMed]
- Ghosh, R.; Goswami, S.K.; Feitoza, L.; Hammock, B.; Gomes, A.V. Diclofenac induces proteasome and mitochondrial dysfunction in murine cardiomyocytes and hearts. Int. J. Cardiol. 2016, 223, 923–935. [Google Scholar] [CrossRef] [PubMed] [Green Version]
- Ito, H.; Matsui, H.; Hirayama, A.; Indo, H.P.; Majima, H.J.; Hyodo, I. Reactive oxygen species induced by non-steroidal anti-inflammatory drugs enhance the effects of photodynamic therapy in gastric cancer cells. J. Clin. Biochem. Nutr. 2016, 58, 180–185. [Google Scholar] [CrossRef] [PubMed] [Green Version]
- Minami, T.; Adachi, M.; Kawamura, R.; Zhang, Y.; Shinomura, Y.; Imai, K. Sulindac enhances the proteasome inhibitor bortezomib-mediated oxidative stress and anticancer activity. Clin. Cancer Res. 2005, 11, 5248–5256. [Google Scholar] [CrossRef] [PubMed]
- Giardina, C.; Inan, M.S. Nonsteroidal anti-inflammatory drugs, short-chain fatty acids, and reactive oxygen metabolism in human colorectal cancer cells. Biochim. Biophys. Acta. 1998, 1401, 277–288. [Google Scholar] [CrossRef] [Green Version]
- Costa, D.; Gomes, A.; Reis, S.; Lima, J.L.; Fernandes, E. Hydrogen peroxide scavenging activity by non-steroidal anti-inflammatory drugs. Life Sci. 2005, 76, 2841–2848. [Google Scholar] [CrossRef]
- Fernandes, E.; Toste, S.A.; Lima, J.L.; Reis, S. The metabolism of sulindac enhances its scavenging activity against reactive oxygen and nitrogen species. Free Radic. Biol. Med. 2003, 35, 1008–1017. [Google Scholar] [CrossRef]
- Tatebe, S.; Sinicrope, F.A.; Kuo, M.T. Induction of multidrug resistance proteins mrp1 and mrp3 and gamma-glutamylcysteine synthetase gene expression by nonsteroidal anti-inflammatory drugs in human colon cancer cells. Biochem. Biophys. Res. Commun. 2002, 290, 1427–1433. [Google Scholar] [CrossRef]
- Adachi, M.; Sakamoto, H.; Kawamura, R.; Wang, W.; Imai, K.; Shinomura, Y. Nonsteroidal anti-inflammatory drugs and oxidative stress in cancer cells. Histol. Histopathol. 2007, 22, 437–442. [Google Scholar] [PubMed]
- Gurpinar, E.; Grizzle, W.E.; Piazza, G.A. Nsaids inhibit tumorigenesis, but how? Clin. Cancer Res. 2014, 20, 1104–1113. [Google Scholar] [CrossRef] [PubMed]
- Piazza, G.A.; Rahm, A.K.; Finn, T.S.; Fryer, B.H.; Li, H.; Stoumen, A.L.; Pamukcu, R.; Ahnen, D.J. Apoptosis primarily accounts for the growth-inhibitory properties of sulindac metabolites and involves a mechanism that is independent of cyclooxygenase inhibition, cell cycle arrest, and p53 induction. Cancer Res. 1997, 57, 2452–2459. [Google Scholar] [PubMed]
- Yagi, K.; Kawasaki, Y.; Nakamura, H.; Miura, T.; Takeda, T.; Esumi, S.; Matsunaga, H.; Kitamura, Y.; Sendo, T. Differential combined effect of cox inhibitors on cell survival suppressed by sorafenib in the hepg2 cell line. Biol. Pharm. Bull. 2014, 37, 1234–1240. [Google Scholar] [CrossRef]
- Bessone, F. Non-steroidal anti-inflammatory drugs: What is the actual risk of liver damage? World J. Gastroenterol. 2010, 16, 5651–5661. [Google Scholar] [CrossRef] [PubMed]
- Van Booven, D.; Marsh, S.; McLeod, H.; Carrillo, M.W.; Sangkuhl, K.; Klein, T.E.; Altman, R.B. Cytochrome p450 2c9-cyp2c9. Pharmacogenet. Genomics 2010, 20, 277–281. [Google Scholar] [CrossRef]
- Pajares, B.; Torres, E.; Trigo, J.M.; Saez, M.I.; Ribelles, N.; Jimenez, B.; Alba, E. Tyrosine kinase inhibitors and drug interactions: A review with practical recommendations. Clin. Transl. Oncol. 2012, 14, 94–101. [Google Scholar] [CrossRef]
- Yin, Y.; Wu, Y.; dend, X.; Bai, L.; Li, Q. Acute liver failure induced by sorafenib combined with diclofenac sodium: A case report. J. Clin. Toxicol. 2019, 9, 407. [Google Scholar] [CrossRef]
- Zhu, Y.J.; Zheng, B.; Wang, H.Y.; Chen, L. New knowledge of the mechanisms of sorafenib resistance in liver cancer. Acta. Pharmacol. Sin. 2017, 38, 614–622. [Google Scholar] [CrossRef] [Green Version]
- Haga, Y.; Kanda, T.; Nakamura, M.; Nakamoto, S.; Sasaki, R.; Takahashi, K.; Wu, S.; Yokosuka, O. Overexpression of c-jun contributes to sorafenib resistance in human hepatoma cell lines. PLoS ONE 2017, 12, e0174153. [Google Scholar] [CrossRef]
- Chen, W.; Xiao, W.; Zhang, K.; Yin, X.; Lai, J.; Liang, L.; Chen, D. Activation of c-jun predicts a poor response to sorafenib in hepatocellular carcinoma: Preliminary clinical evidence. Sci. Rep. 2016, 6, 22976. [Google Scholar] [CrossRef] [PubMed]
- Xiang, D.M.; Sun, W.; Zhou, T.; Zhang, C.; Cheng, Z.; Li, S.C.; Jiang, W.; Wang, R.; Fu, G.; Cui, X.; et al. Oncofetal hlf transactivates c-jun to promote hepatocellular carcinoma development and sorafenib resistance. Gut 2019, 68, 1858–1871. [Google Scholar] [CrossRef] [PubMed]
- Singh, R.; Cadeddu, R.P.; Frobel, J.; Wilk, C.M.; Bruns, I.; Zerbini, L.F.; Prenzel, T.; Hartwig, S.; Brunnert, D.; Schroeder, T.; et al. The non-steroidal anti-inflammatory drugs sulindac sulfide and diclofenac induce apoptosis and differentiation in human acute myeloid leukemia cells through an ap-1 dependent pathway. Apoptosis 2011, 16, 889–901. [Google Scholar] [CrossRef] [PubMed]
- Brozik, A.; Hegedus, C.; Erdei, Z.; Hegedus, T.; Ozvegy-Laczka, C.; Szakacs, G.; Sarkadi, B. Tyrosine kinase inhibitors as modulators of atp binding cassette multidrug transporters: Substrates, chemosensitizers or inducers of acquired multidrug resistance? Expert. Opin. Drug Metab. Toxicol. 2011, 7, 623–642. [Google Scholar] [CrossRef] [PubMed]
- Di Giacomo, S.; Briz, O.; Monte, M.J.; Sanchez-Vicente, L.; Abete, L.; Lozano, E.; Mazzanti, G.; Di Sotto, A.; Marin, J.J.G. Chemosensitization of hepatocellular carcinoma cells to sorafenib by beta-caryophyllene oxide-induced inhibition of abc export pumps. Arch. Toxicol. 2019, 93, 623–634. [Google Scholar] [CrossRef] [PubMed]


© 2019 by the authors. Licensee MDPI, Basel, Switzerland. This article is an open access article distributed under the terms and conditions of the Creative Commons Attribution (CC BY) license (http://creativecommons.org/licenses/by/4.0/).
Share and Cite
Duval, A.P.; Troquier, L.; de Souza Silva, O.; Demartines, N.; Dormond, O. Diclofenac Potentiates Sorafenib-Based Treatments of Hepatocellular Carcinoma by Enhancing Oxidative Stress. Cancers 2019, 11, 1453. https://doi.org/10.3390/cancers11101453
Duval AP, Troquier L, de Souza Silva O, Demartines N, Dormond O. Diclofenac Potentiates Sorafenib-Based Treatments of Hepatocellular Carcinoma by Enhancing Oxidative Stress. Cancers. 2019; 11(10):1453. https://doi.org/10.3390/cancers11101453
Chicago/Turabian StyleDuval, Adrian Paul, Laetitia Troquier, Olga de Souza Silva, Nicolas Demartines, and Olivier Dormond. 2019. "Diclofenac Potentiates Sorafenib-Based Treatments of Hepatocellular Carcinoma by Enhancing Oxidative Stress" Cancers 11, no. 10: 1453. https://doi.org/10.3390/cancers11101453