Article

The Effect of Ventilation Strategies on Indoor Air Quality and Energy Consumptions in Classrooms

1
Department of Civil and Mechanical Engineering, University of Cassino and Southern Lazio, 03043 Cassino (FR), Italy
2
Center of Health Sciences and Sport, Santa Catarina State University, Florianopolis 88080-350, Brazil
*
Author to whom correspondence should be addressed.
Buildings 2019, 9(5), 110; https://doi.org/10.3390/buildings9050110
Submission received: 5 April 2019 / Revised: 27 April 2019 / Accepted: 1 May 2019 / Published: 2 May 2019

Abstract

:
Most of the school buildings in Italy are high energy-demanding buildings with no ad-hoc ventilation systems (i.e., naturally-ventilated buildings). Therefore, reducing the heat losses of schools represent the main aspect to be dealt with. Nonetheless, the indoor air quality of the building should be simultaneously considered. Indeed, to date, energy consumptions and air quality are considered as incompatible aspects especially in naturally-ventilated buildings. The aim of the present paper is to evaluate the effect of different ventilation and airing strategies on both indoor air quality and energy consumptions in high energy-demanding naturally-ventilated classrooms. To this purpose, an Italian test-classroom, characterized in terms of air permeability and thermophysical parameters of the envelope, was investigated by means of experimental analyses and simulations through CO2 mass balance equation during the heating season. The air quality was assessed in terms of indoor CO2 concentrations whereas the energy consumptions were evaluated through the asset rating approach. Results clearly report that not adequate indoor CO2 concentrations are measured in the classroom for free-running ventilation scenarios even in low densely populated conditions (2.2 m2 person−1), whereas scheduled airing procedures can reduce the indoor CO2 levels at the cost of higher energy need for ventilation. In particular, when airing periods leading to the air exchange rate required by standards are adopted, the CO2 concentration can decrease to values lower than 1000 ppm, but the ventilation losses increase up to 36% of the overall energy need for space heating of the classroom. On the contrary, when the same air exchange rate is applied through mechanical ventilation systems equipped with heat recovery units, the ventilation energy loss contribution decreases to 5% and the overall energy saving results higher than 30%. Such energy-saving was found even higher for occupancy scenarios characterized by more densely populated conditions of the classroom typically occurring in Italian classrooms.

1. Introduction

Indoor air quality and energy saving of existing buildings are often considered as incompatible goals [1,2]. Nonetheless, the introduction of the new regulation on the performance of buildings [3], i.e., the introduction of nearly zero energy buildings (NZEBs) as the new building target [4,5], will force the building sector to handle simultaneously the heat losses and the air quality issues, since ventilation approaches not properly designed will likely not fulfill the limitation on energy need for space heating typical of the NZEBs [6,7,8]. Apart from new constructions, the strategic challenge in view of the reduction of the energy consumption of the building sector is the energy retrofit of the existing buildings [9,10,11,12,13]. This is even more important in countries (like Italy) characterized by a huge percentage (roughly 70%) of buildings built before any regulatory indication on building energy efficiency [14,15,16] and then without any carefulness to the ventilation issues.
To date, energy retrofits are usually focused on energy loss reductions without any consideration of the air quality aspects. Indeed, the preferred retrofit solutions are related to the reduction of the transmission losses (double-glazed windows, envelope insulation, etc.) and the improvement of the heating systems (e.g., renewable energy plants such as solar heating collectors, high efficiency boilers, etc.) since important incentives were provided by the Italian and European governments to support such energy saving solutions [17,18]. On the contrary, retrofit solutions that could improve the air quality, i.e., ventilation retrofit to increase the air exchange rate of indoor environments, are less frequently adopted as they are often considered as energy-consuming methods. This is mainly due to the inaccurate approach often adopted to compare different solutions (e.g., pre-/post-retrofit) not considering the same indoor air quality targets.
The indoor air quality is currently condensed by the regulatory authorities in a single parameter: the CO2 concentration [19]. The CO2 is directly emitted by persons [20] and, then, it is considered as a proxy for the air quality of not adequately ventilated environments since it is strictly related to the amount of fresh air entering the room via building leakages, airing, or ad-hoc ventilation systems. Therefore, it is a good parameter to describe the behavior of all the indoor-generated gaseous compounds and pollutants, such as relative humidity, radon and volatile organic compounds (VOCs) [21,22,23]. On the contrary, the CO2 cannot be considered representative of other pollutants such as outdoor-generated gaseous and particle-phase compounds (e.g., ultrafine particles, NOx, heavy metals, polycyclic aromatic hydrocarbons mainly emitted by outdoor sources), and indoor-generated particles (e.g., PM10 due to resuspension phenomena and chalk use in schools, or ultrafine particles emitted by indoor combustion sources) due to their different dynamics and origins [24,25,26,27,28,29,30,31,32,33,34,35,36,37]. The current technical standards mostly impose air exchange rates for the different building use in order to maintain the CO2 concentrations below certain levels [19]. Such air exchange rates are evaluated considering ideal/regulated crowding indexes of the indoor microenvironments, then they are simply calculated on the basis of generic parameters such as the floor area of the room.
Within the building sector, educational buildings (schools, universities [38]) represent a high percentage of existing buildings in Italy (roughly 50% of the total floor area) then leading to a significant contribution to the national energy consumption. Indeed, the energy need of schools is mostly related to the heating during cold seasons (besides the hot water production) [39], and it was detected that 85% of the Italian school buildings are high energy-demanding buildings as they fall within the three lowest energy performance classes [40]. Nonetheless, even if the air-tightness of the Italian schools is not always adequate, high indoor CO2 concentrations were detected in classrooms, then showing not sufficient air exchange rates with respect to the CO2 emission sources (i.e., children) [29,41,42,43]. This is mainly due to the ventilation strategy typically used in schools, in fact, less than 2% of the Italian schools are equipped with ventilation systems (mechanical ventilation systems or “all-air” heating systems) able to guarantee the minimum ventilation rates required by the standards (http://dati.istruzione.it/opendata/approfondimenti/statistiche). This issue is even more important in overcrowded classrooms characterized by occupant densities [43] higher than those imposed by European standards and national regulations [19,44]. Nonetheless, even though the ventilation methods adopted in schools can play a significant role to handle simultaneously the energy consumption and indoor air quality issues [45], few data on the combined effect of the ventilation approach on both indoor air quality and energy saving are available so far.
In the present study, the effect of different ventilation strategies on indoor air quality (expressed as indoor CO2 concentrations) and energy consumption in high energy-demanding naturally-ventilated schools were investigated. To this end, experimental analyses and simulations through a CO2 mass balance equation were carried out on a test-classroom completely characterized in terms of air permeability and thermophysical parameters of the envelope. Moreover, the improvement reachable through mechanical ventilation methods in terms of energy saving and indoor air quality for different occupancy densities of the classroom was investigated. The findings of the paper could support the regulatory bodies in introducing strategic policies improving the indoor air quality in schools and obtaining, simultaneously, a significant energy saving.

2. Materials and Methods
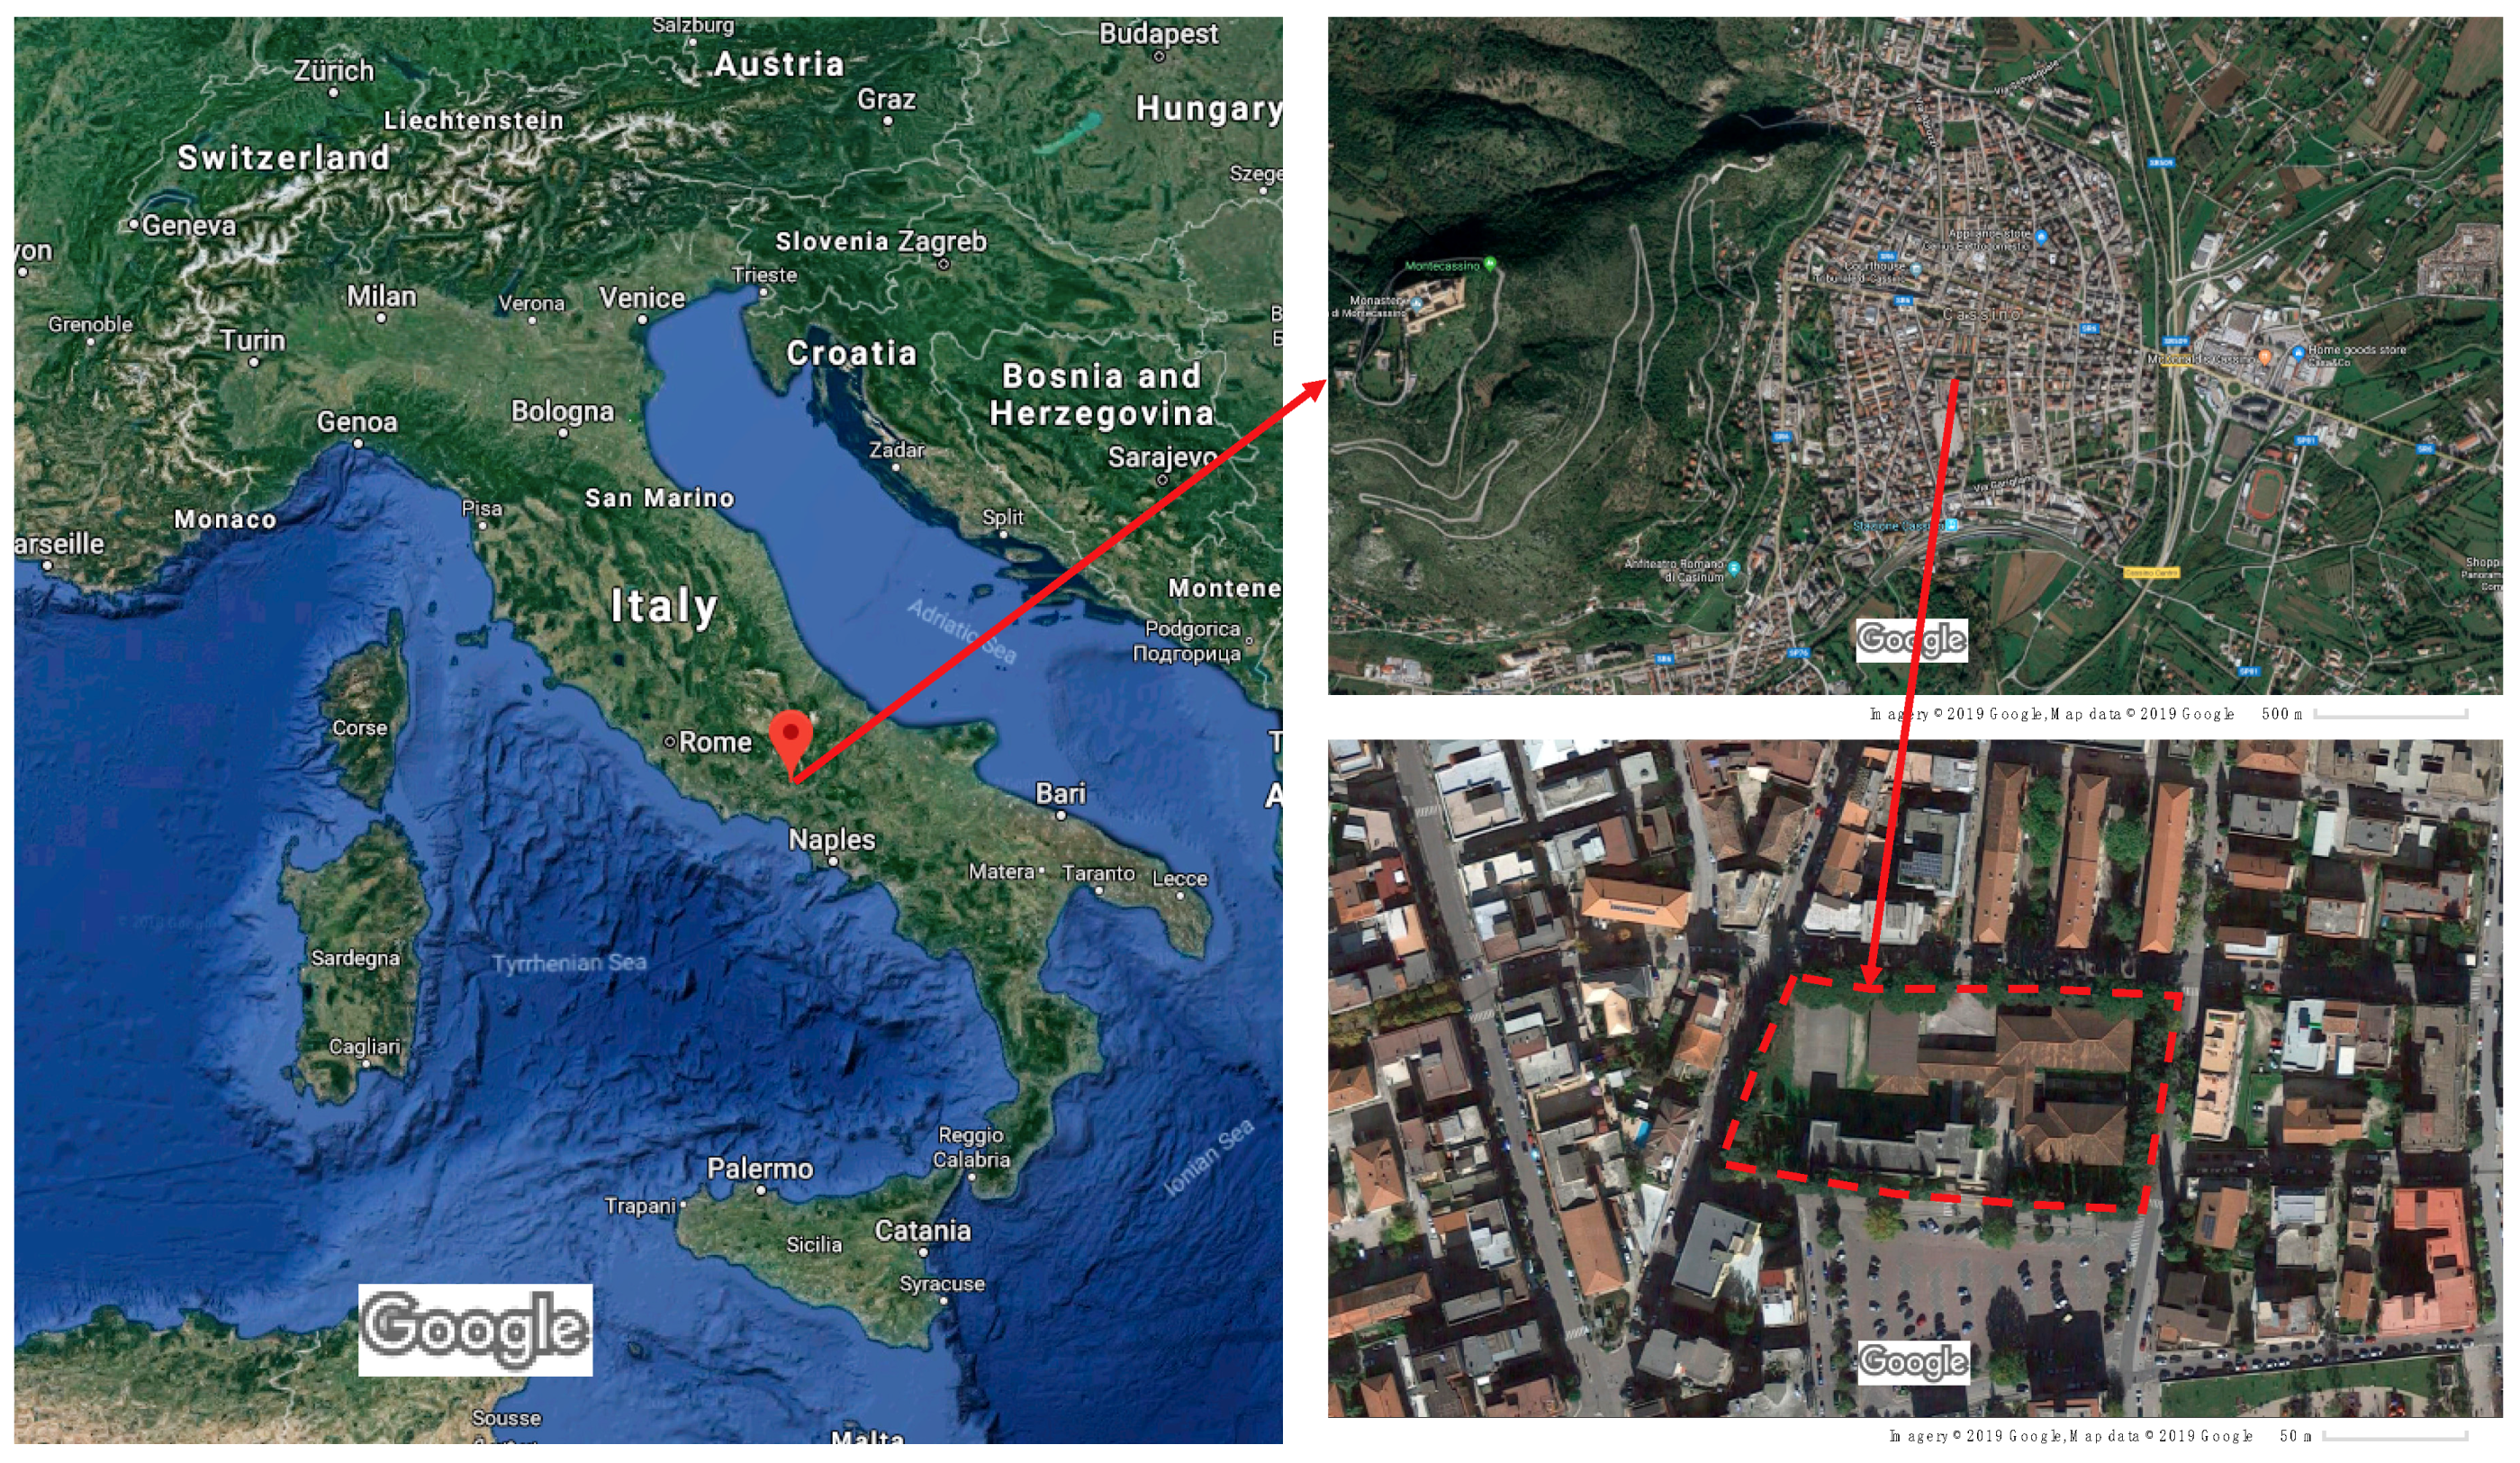
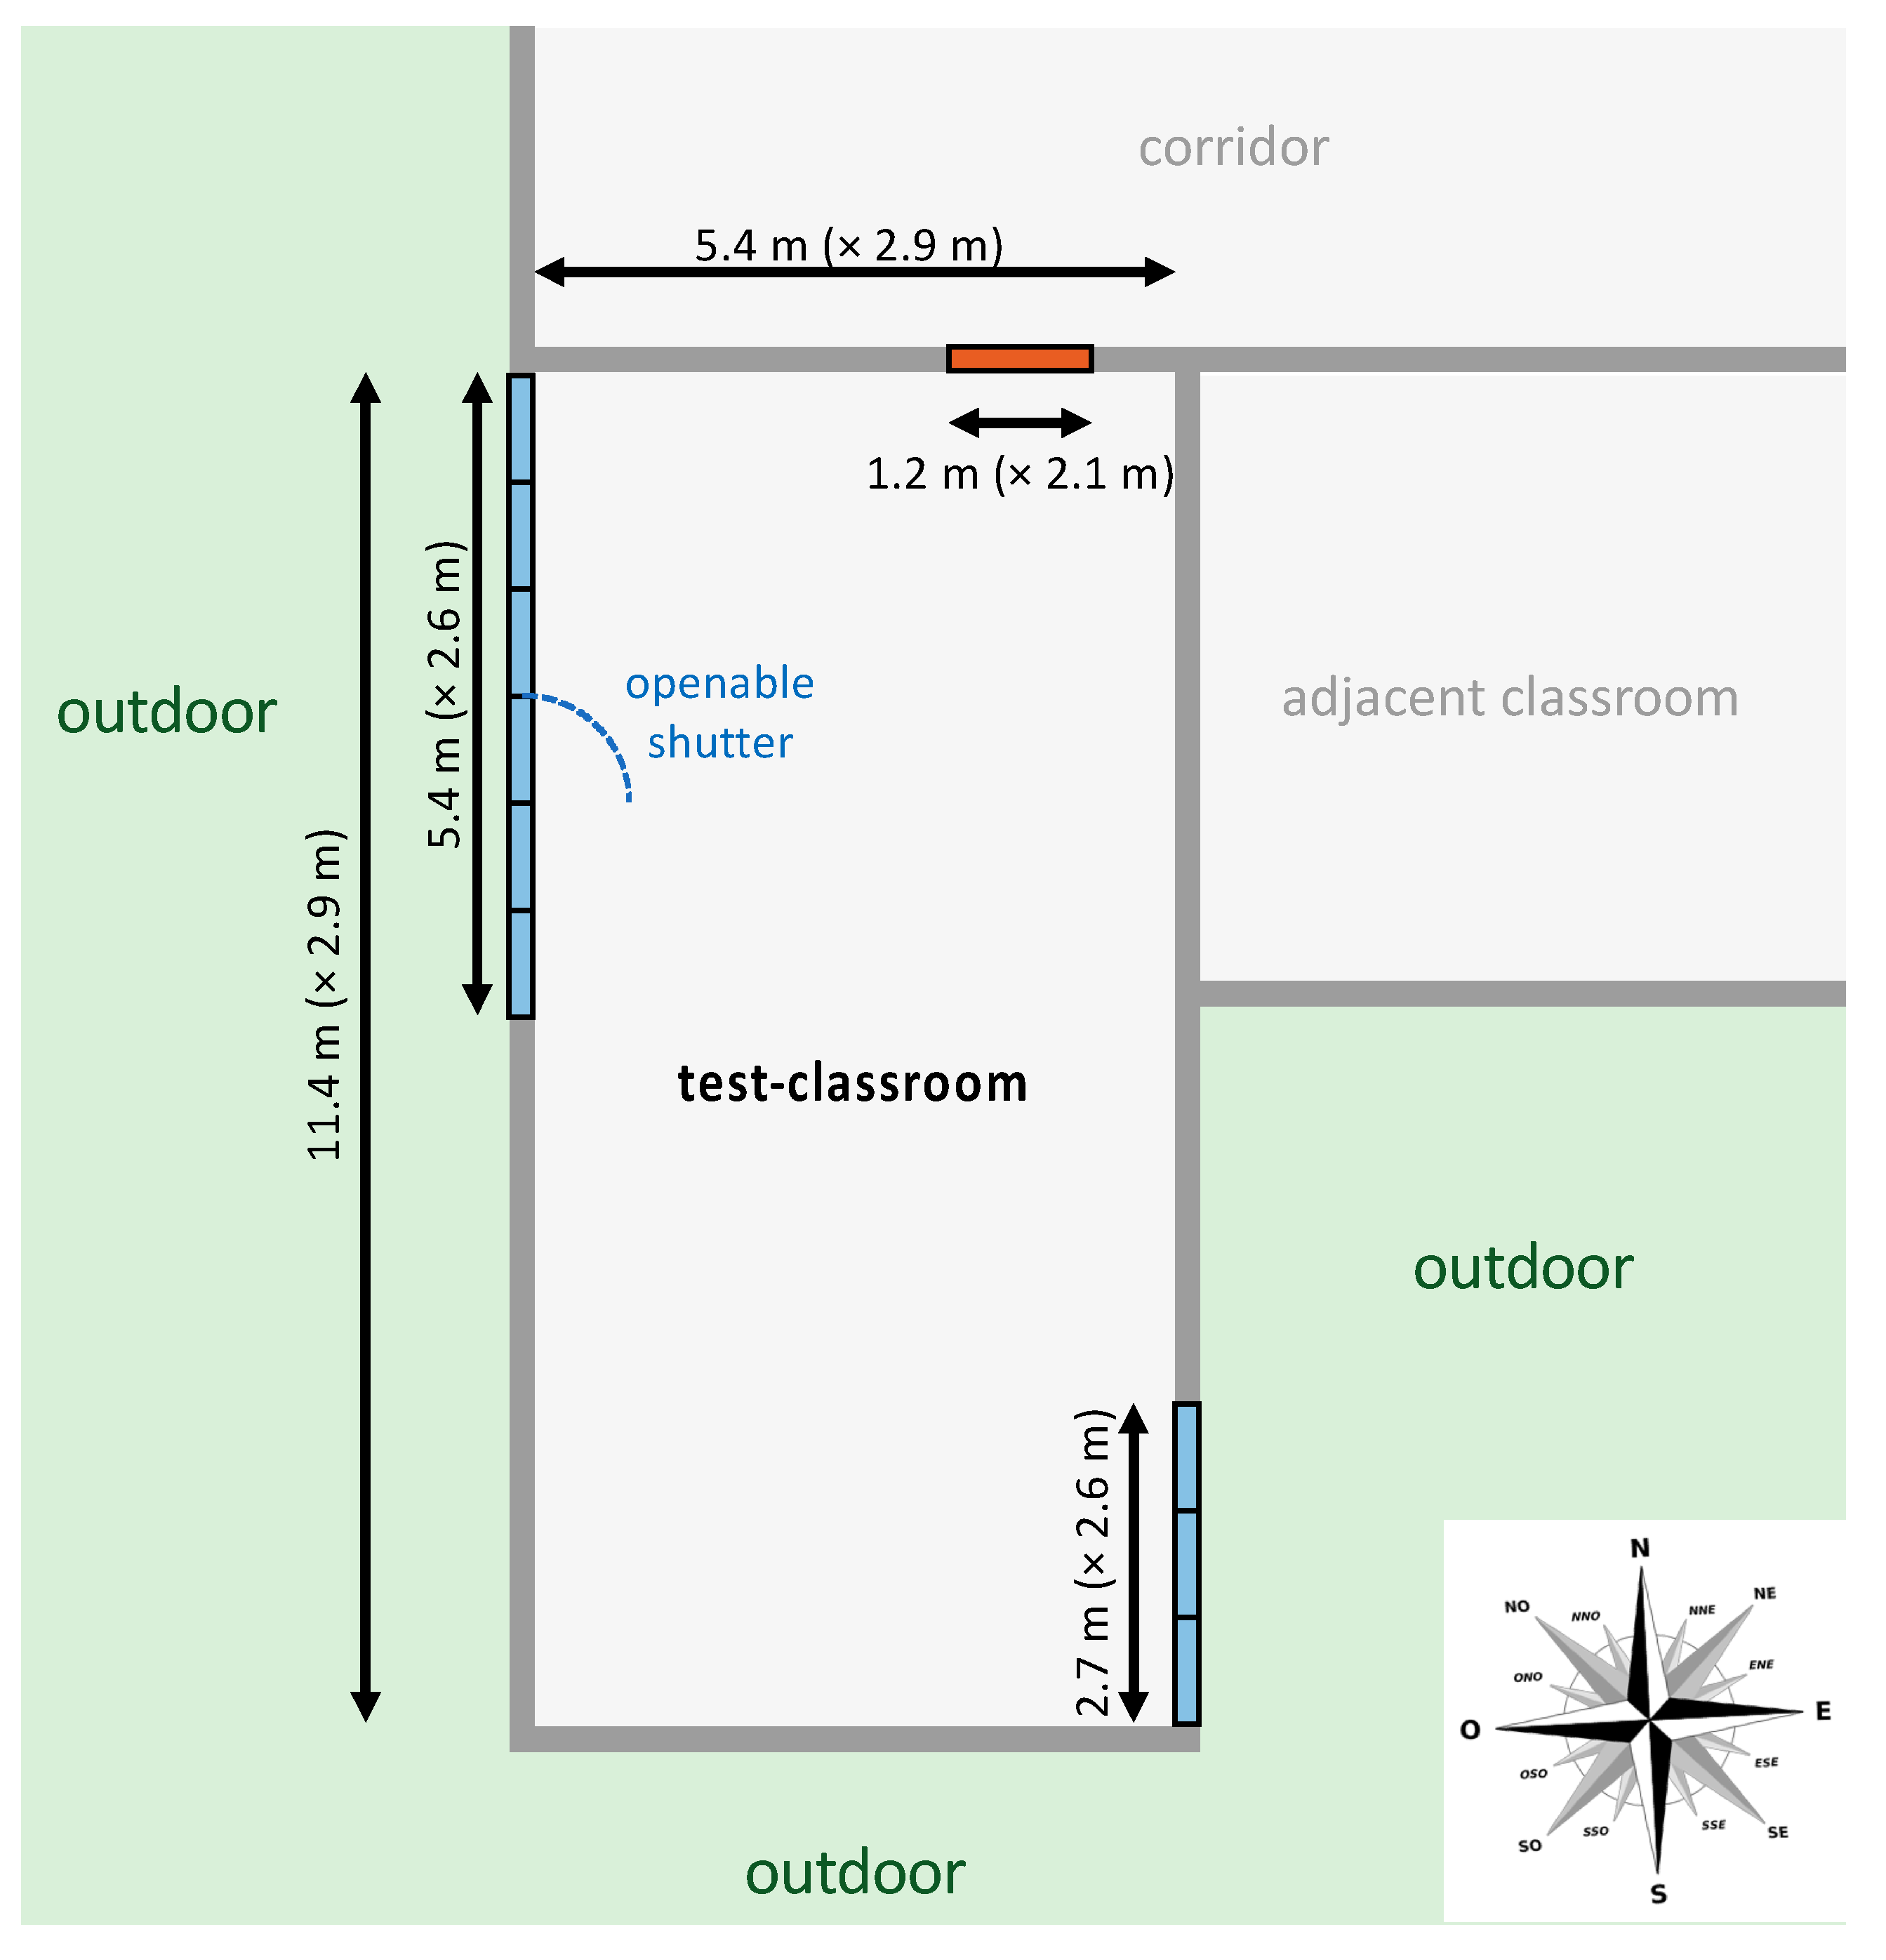
2.1. Sampling Site

The test-classroom investigated is an 11.4 m × 5.4 m × 2.9 m naturally-ventilated room (floor surface 61.6 m2, volume 178.5 m3) of a primary school placed in Cassino (Central Italy) and built in the 1980s (Figure 1). The school (two-story building) is located in the urban area of the city. The test-classroom is placed at ground floor and it is roofed by a terrace. It has two single-glazed aluminum inward opening doors on the longest walls of the classroom: one (2.7 × 2.6 m) facing east and the other one (5.4 × 2.6 m) facing west. The east wall of the test-classroom is partly adjacent to another (heated) classroom, the west and south walls face outdoors, whereas the south wall faces the main corridor of the school (Figure 2).
The stratigraphy and thermophysical parameters of the building envelope opaque components are summarized in Table 1. The thermal transmittance values here reported (U, expressed in Wm−2 K−1) were evaluated on the basis of the methodology described in the EN ISO 52016-1 standard [46]. The stratigraphy of the building represents the typical stratigraphy adopted in Central/South of Italy before energy saving regulations, indeed no insulation layers were used and the thermal transmittances were two, three times larger than the minimum values suggested by the current regulation [47] to guarantee reduced energy consumptions. Such stratigraphy, along with the lack of ad-hoc ventilation approaches, allows us to consider the building as a typical (not-retrofitted) high energy-demanding Italian school building. A not negligible shading effect on the classroom due to the presence of close trees and buildings was also recognized (Figure 1) and considered in the classroom heat balance hereinafter reported.

2.2. Characterization of the Air Permeability of the Test-Classroom: Pressurization and Tracer Gas Decay Tests

The characterization in terms of air permeability of the test-classroom was performed through two different methods: the room pressurization test [48] and the tracer gas decay test [49]. The pressurization test, specifically Blower-Door Test (BDT), was performed to characterize the test-classroom in terms of airtightness. In particular, the BDT is performed through a mechanical fan pressurization and/or depressurization of the room in order to provide the ventilation rates through the classroom envelope (qenv, m3 h−1) under a fixed indoor-outdoor pressure difference (Δp), which is higher than the natural pressure differences (ISO 9972; [48]). The pressure-flow relationship for the BDT is calculated as:
q e n v = C e n v · Δ p m ,
where m and Cenv are the air pressure exponent and the flow coefficient, respectively, estimated by means of a simple linear regression as reported in the ISO 9972 standard [48] and applied in our previous papers [50,51]. Equation (1) allows to calculate the air leakage rate, q50, at a reference pressure difference of 50 Pa: then, the air exchange rate at 50 Pa (n50) is obtained dividing the q50 by the room volume. The test-classroom was characterized performing both pressurization and depressurization BDTs according to the fan pressurization Method 1 (“test of a building in use”) reported in the ISO 9972 standard [48]. This method allowed to perform measurements under the real condition of the classroom envelope then not sealing/fixing intentional opening.
The experimental apparatus used to perform blower-door tests includes: (i) an airproof fan at calibrated flow rates fitted to the door by means of an extensible frame allowing the measurement of pressure differences (positive and negative); (ii) a flow rate regulation system producing indoor-outdoor pressure differences by varying the fan speed; (iii) two primary elements for the flow rate measurement; (iv) a digital micromanometer with an uncertainty of about 1 Pa, to measure the pressure difference both indoor/outdoor and up/downstream to the primary element (in order to calculate the flow rate); (v) a thermo-hygrometer for air temperature and humidity measurements, to correct flow rates at standard conditions. Further details on the BDT methodology are reported in our previous papers [50,52,53].
Along with BDT, tracer gas decay tests (ISO 12569:2017 [49]) were also performed in the classroom to characterize the air permeability under the actual climatic conditions (e.g., wind speed and direction, outside-inside temperature and pressure difference). In particular, the air exchange rate was calculated for two different ventilation conditions: windows open (ndecay_open) and windows closed (ndecay_close). Tests with windows open were performed just using the east-facing window: in particular, one 0.90 × 2.6 m openable shutter was used, whereas the other shutters were kept closed as well as the window facing the west side as shown in Figure 2.
The air exchange rates were evaluated measuring the CO2 concentration decay in the classroom as soon as the students left the classrooms for about 1 h. The CO2 probe was placed on a 0.8 m tall desk above the ground, away from blackboard and in the proximity of the student seating area. Data were post-processed considering 1-min average values. Ten measurements were performed with doors and windows closed in order to evaluate the air exchange rate of the classroom due to the room leakages solely (ndecay_close), and 10 measurements were carried out with windows open to evaluate the air exchange rate due to the window manual airing (ndecay_open), as also applied in previous papers [54,55,56,57]. The authors highlight that measuring the CO2 decay after school activities guarantee high and homogeneous CO2 concentrations inside the room. CO2 concentration measurements were performed through a non-dispersive infrared analyzer (Testo ambient CO2 probe; concentration range: 0–10,000 ppm) with 1 s time resolution. Since CO2 concentration in the room is uniform and no chemical reactions between the gas and other chemicals are expected, the air exchange rate of the room was determined according to the exponential decay equation [58]:
n = 1 Δ t · ln CO 2 peak CO 2 out CO 2 final CO 2 out ,   ( h 1 )
where CO2-peak, CO2-final and CO2-out represent the peak, final and outdoor CO2 concentrations and Δt the time interval between CO2-peak and CO2-final. Outdoor CO2 concentrations were measured before and after the decay test through a non-dispersive infrared sensor (TSI Model 7515 IAQ-CALCTM; concentration range: 0–5000 ppm) with 1 s time resolution: CO2-out here used represents the average value.

2.3. Measurements and Estimates of Indoor Air Quality Under Different Ventilation Scenarios

The indoor air quality was evaluated during the heating season measuring or simulating the indoor CO2 concentrations in the test-classroom under different ventilation scenarios: free-running ventilation (FRV) conditions and scheduled manual airing (MA) strategies were investigated through experimental analyses; whereas natural ventilation, scheduled manual airing with ventilation rates established by the current standard [19], and mechanical ventilation with ventilation rates established by the current standard [19] were simulated through CO2 mass balance equation. All these scenarios were tested for a crowding index of 2.2 m2 person−1 that is the actual occupancy density of the investigated test-classroom as hereinafter detailed. Further simulations of manual airing and mechanical ventilation with ventilation rates established by the current standard [19] were also carried out for more densely populated conditions as summarized in Section 2.3.3. A summary of the ventilation scenarios tested through direct measurements as well as through simulations is reported in Table 2.

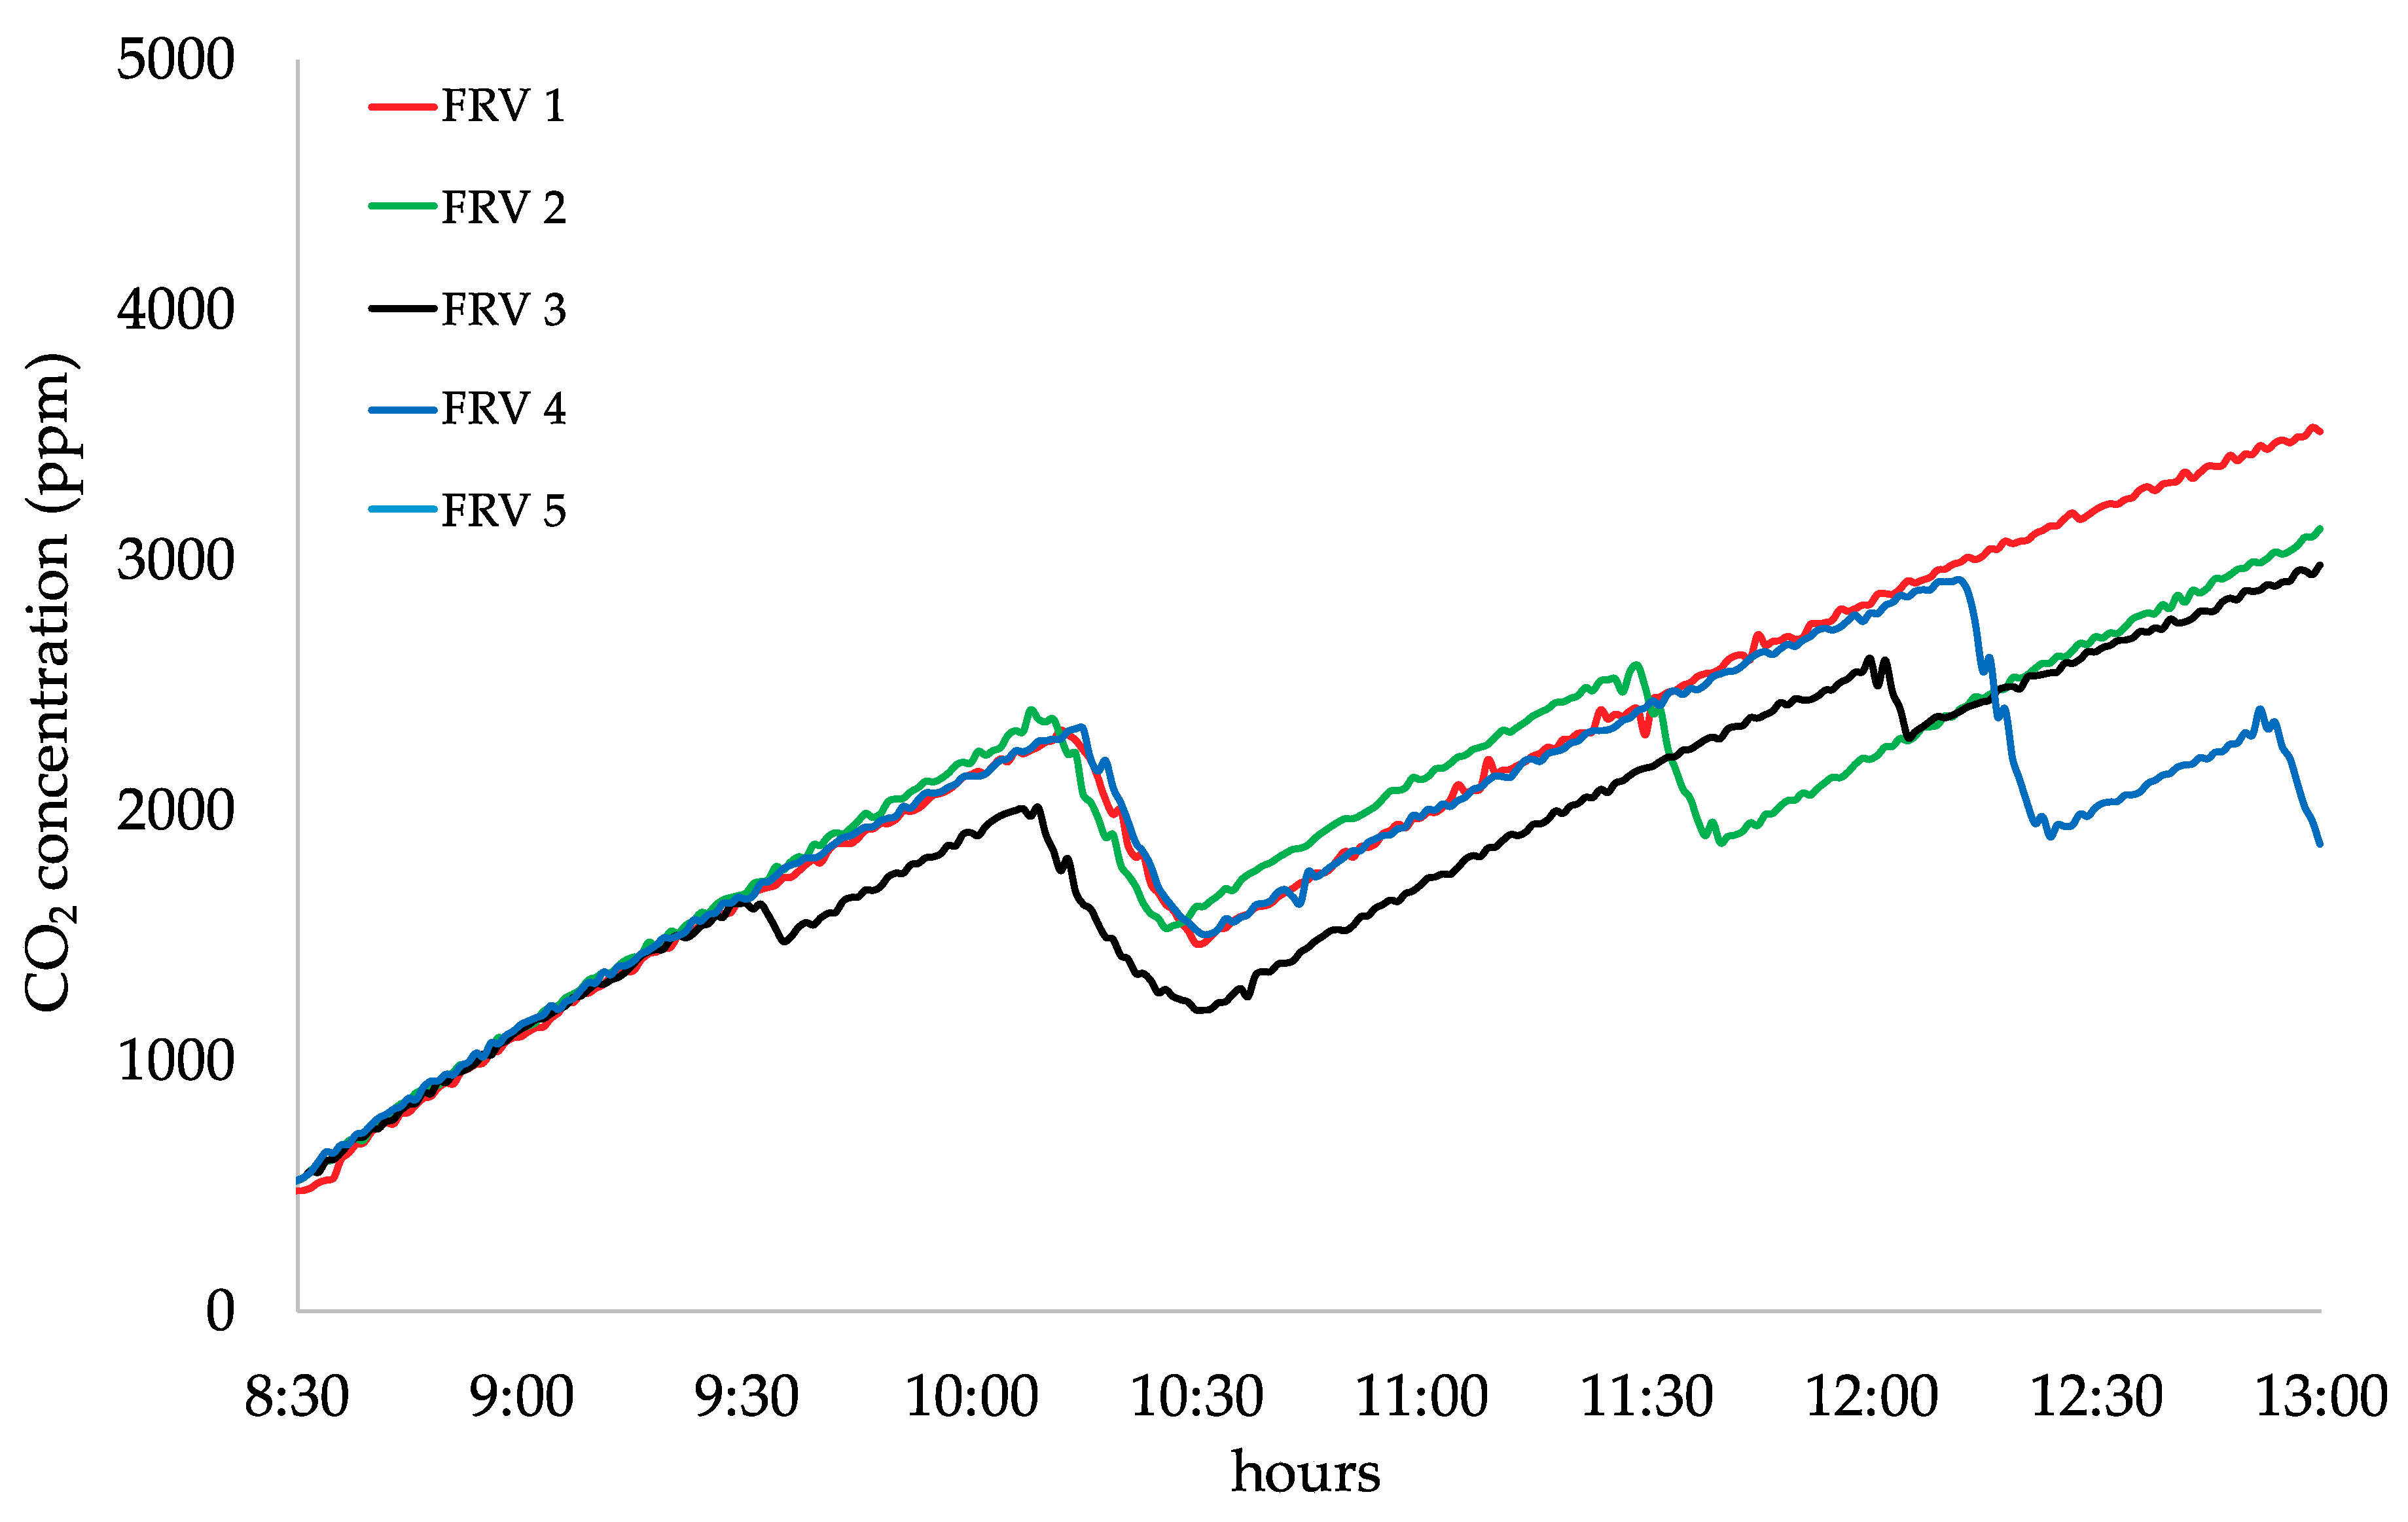
2.3.1. Measurements of Ventilation Scenarios

Free-running ventilation (FRV) tests were performed to measure the CO2 concentration levels of the school-time periods (08:30–13.00) in the test-classroom. Five FRV tests were performed in the period November 2014–March 2015 as summarized in Table 2. During the FRV tests, teachers/students were left free to open the windows according to their perception of the indoor air quality: no specific airing procedures through window opening were imposed, nonetheless, teachers were asked to use the door just to allow people entering and exiting the classroom (not for airing purposes). A questionnaire reporting window/door opening periods, classroom empty periods (e.g., recreational activities performed in other rooms) and the number of people/students in the room was filled out by the teachers. During the measurement period, classrooms were occupied by 26–27 children (and one or two teachers), i.e., a living area per student/teacher of about 2.2 m2 person−1. Therefore, the five FRV tests were carried out with the same crowding index and the same airing approach (i.e., not imposing scheduled airing procedures), thus, the CO2 concentration trends measured during the five tests are representatives of the typical indoor air quality conditions that can be met for free-running classrooms [29,41,53].
Manual airing (MA) tests of the indoor air quality in the test-classroom were performed on February–March 2016 by imposing scheduled airing procedures during the school-time period. Three different manual airing tests were performed opening the window for 10, 15 or 20 min every hour, respectively (referred in Table 2 as MA 1-MA 3). In particular, the airing was performed between two consecutive class hours (e.g., 20 min opening periods were roughly applied between 9.20 and 9.40, 10.20 and 10.40, etc.). The test-classroom was characterized by a crowding index of about 2.2 m2 person−1 (25–27 children, plus one or two teachers). During the airing tests the window facing the west side was locked, therefore, the air exchange rate relied upon the opening periods of the east-facing window (once again considering one 0.90 × 2.6 m openable shutter). In order to monitor scheduled or additional window and door openings, both on the door and on the east-facing window four wired thermoplastic magnetic contacts connected to a multimeter were installed to detect opening and closing periods of window/door with 1 s time resolution. The airing procedure was done by the teachers, they were asked to open the shutter wide, whereas the door was not used for airing purpose but just to allow people entering and exiting the classroom (just quick openings). Nonetheless, the imposed scheduled opening periods were also checked a posteriori analyzing the magnetic contact data stored by the multimeter.
Measurements of CO2 concentrations during FVR and MA tests were performed placing the probe on a 0.8 m tall desk above the ground, away from blackboard and in the proximity of the student seating area. Data were post-processed considering 1 min average values.
An estimate of the overall school-time air exchange rate during free-running ventilation tests and airing tests was carried out calculating a weighted average of the air exchange rates typical of window close configuration (ndecay_close) and window open configuration (ndecay_open) as:
n = ( n decay _ close · t decay _ close + n decay _ open · t decay _ open ) / ( t decay close + t decay open ) ,   ( h 1 )
where tdecay_close and tdecay_open represent the total time during which the windows were kept closed and open, respectively (the sum of tdecay_close and tdecay_open is the overall school time, 8.30–13.00, i.e., 270 min). The authors point out that the tdecay_close and tdecay_open for free-running ventilation tests were not measured but they were reported on the basis of the questionnaires/reports filled out by the teachers; therefore, they just represent indicative data.

2.3.2. Simulations of Ventilation Scenarios

Besides the ventilation methods investigated through the abovementioned experimental analyses, further ventilation scenarios were examined by applying a CO2 mass balance equation [58]. Indeed, CO2 trends in the classroom were calculated considering the CO2 generation rates of the children/teacher reported in Persily and de Jonge [20]. Such generation rates were estimated as average values between 1 and 1.2 met for males and females. A nominal occupancy of 28 persons (e.g., 27 students, 1 teacher), i.e., a crowding index of 2.2 m2 person−1, was considered in the calculation; moreover, a constant background CO2 concentration value of 500 ppm was adopted for all the simulated ventilation scenarios. In particular, the following ventilation scenarios were calculated: natural ventilation of the classroom with windows and doors closed during the entire school time (ventilation just relying on leakages of the building envelope; NV test), manual airing of the classroom to guarantee the EN 15251 minimum ventilation rate (MA EN 1 test); constant air volume mechanical ventilation of the classroom to guarantee the EN 15251 minimum ventilation rate (MV EN 1 test). The minimum required ventilation according to the current standards was determined on the basis of the EN 15251 [19] considering the method based on ventilation rate per person. In particular, the building category III in terms of required indoor air quality was considered (it represents the value suggested for existing buildings): thus, the air exchange rate value was evaluated adopting the suggested airflow per person of 4 Ls−1 person−1 and the airflow for building emission of 0.4 Ls−1m−2 (value suggested for low polluting buildings). The resulting air exchange rate was 2.76 h−1 (i.e., 4.88 Ls−1 person−1). The manual airing (MA EN 1 test) was simulated considering four opening periods between the end of an hour and the start of the next one as also adopted during the manual airing experimental tests (MA 1-MA 3).
In order to simulate the CO2 concentration trend characteristic of the constant air volume mechanical ventilation (MV EN 1 test), a fixed air exchange rate of 2.76 h−1 was considered during the entire school period. On the contrary, the CO2 concentration trend of the MA EN 1 scenario was obtained on the basis of the weighted average of the air exchange rates typical of median values of window close (ndecay_close) and window open configurations (ndecay_open).
In order to validate the CO2 mass balance equation approach, a comparison amongst the experimental and the simulated CO2 concentrations for the scenario MA 2 was performed. In particular, in order to simulate the CO2 concentration, the actual number of students present in the classroom on that specific day was considered and the actual opening and closing window periods as measured through the magnetic contacts were applied.

2.3.3. Effect of the Crowding Index

The experimental analyses (tests FRV 1, FRV 2, FRV 3, FRV 4, FRV 5, MA 1, MA 2, MA 3; Section 2.3.1) and the simulations (tests NV, MA EN 1, MV EN 1; Section 2.3.2) adopted to investigate the different ventilation scenarios in the test-classroom were carried out considering the actual crowding index of the classroom, i.e., a living area per student of 2.2 m2 person−1. Such crowding index is quite high with respect to the typical values recognized and/or imposed in classrooms [43]. Therefore, in order to analyze the possible effect of the crowding index on the air quality and the energy need, further analyses of the CO2 concentration trends and required air exchange rate in the classroom were performed considering higher occupant densities: 2 m2 person−1 (crowding index indicated by the European Committee for Standardization [19]), 1.8 m2 person−1 (crowding index imposed by the current Italian legislation for primary schools [44]), 1.6 m2 person−1 (here considered as representative of overcrowded classrooms).
The crowding index effect was analyzed considering the following ventilation scenarios: (a) manual airing required by the EN 15251 (MA EN 2 to MA EN 4 of Table 2), and (b) constant air volume mechanical ventilation required by the EN 15251 (MV EN 2 to MV EN 4 of Table 2). CO2 trends were calculated on the basis of a CO2 mass balance equation for both the ventilation scenarios considering the simulation hypotheses described in Section 2.3. In particular, a higher number of occupants leads to higher required ventilation rates as suggested by the EN 15251 standard [19] (method based on ventilation rate per person). Indeed, required air exchange rates of 3.00, 3.24, 3.57 h−1 are needed for 2.0 (tests MA EN 2 and MV EN 2), 1.8 (tests MA EN 3 and MV EN 3), and 1.6 m2 person−1 (tests MA EN 4 and MV EN 4) crowding indexes, respectively. The simulations of the CO2 trends corresponding to the mechanical ventilation scenarios were performed just adopting the abovementioned constant air exchange rates for the entire school period. On the contrary, the CO2 trends corresponding to the manual airing scenarios were performed applying Equation (1) (i.e., weighted average of the air exchange rates typical of window close and open configurations). Once again, the opening procedures were performed between two consecutive class hours.

2.4. Energy Need for Heating

The energy needs for space heating of the test-classroom was performed applying a steady-state heat balance on the basis of the EN ISO 52016-1:2017 standard [46] adopting the asset rating method and monthly calculation procedure [59,60] and standard values for climate data (monthly averaged outdoor temperatures and a 20 °C set point for the indoor temperature) [61]. The energy need for space heating (QH,nd) was calculated applying the energy balance reported in the EN ISO 52016-1:2017 standard [46] which takes into account for transmission (QH,tr) and ventilation (QH,ve) heat transfers as well as internal (Qint) and solar (Qsol) total heat gains:
Q H , n d = Q H , t r + Q H , v e η H , g n ( Q i n t + Q s o l ) .
Here the term ηH,gn represents the dimensionless utilization factor of internal and solar heat gains. Qint, Qsol, and ηH,gn were evaluated according to the standard [46] considering the actual occupancy of the room equal to 28 persons (27 students, 1 teacher) and taking into account for the site-specific shading effects.
The transmission heat transfer QH,tr involves the heat losses through the building envelope including walls facing outdoor or adjacent unconditioned rooms, windows, thermal bridges, floor and roof. For the sake of brevity, here is just reported the general equation to calculate QH,tr (EN ISO 52016-1:2017 standard [46]):
Q H , t r = i H t r , a d j ( θ i n t , s e t , H θ e , i ) t i ,   ( MJ )
where Htr,adj is the overall heat transfer coefficient by transmission (WK−1) of the classroom, θint,set,H is the indoor set-point temperature of the for heating (°C), θe is the temperature of the external environment of the i-th month of the heating season (°C), and t is the duration of the calculation step (s).
The ventilation heat transfer (QH,ve) is evaluated as:
Q H , v e = i H v e , a d j ( θ i n t , s e t , H θ e , i ) t i = i V · n · ρ a · c a ( θ i n t , s e t , H θ e , i ) t i ,   ( MJ )
where V is the room volume, cp is the specific heat capacity at constant pressure (1.01 kJkg−1K−1), ρ is the air density (calculated at 20 °C, 1.2 kgm−3), and n is the air exchange rate. Different air exchange rate values were considered on the basis of the different ventilation scenarios tested (Table 2), therefore different ventilation heat losses were evaluated as a function of the ventilation scenarios.

3. Results

3.1. Pressurization and Tracer Gas Decay Test Results

The air exchange rates at 50 Pa (n50, h−1) measured in the test-classroom investigated resulted equal to 3.76 h−1: such n50 represents the average between the values obtained for depressurization and pressurization. In particular, the pressurization and depressurization n50 values were measured equal to 2.97 e 4.55 h−1, respectively. The higher depressurization value is typical of rooms with inward-opening windows characterized by poor quality and poor sealing of the openings as recognized in previous papers for elder buildings/windows [50,52].
The median air exchange rates obtained through the tracer gas decay tests resulted equal to 0.22 h−1 (range of 0.18–0.26 h−1) and 3.77 h−1 (range of 2.99–4.88 h−1) for windows closed (ndecay_close) and windows open (ndecay_open), respectively. Such ndecay_close values are similar to the air exchange rate data measured with windows closed in Italian classrooms [29] as well as similar ndecay_open were measured by Wallace, Emmerich and Howard-Reed [57] in their tests performed with windows open.
On the basis of the pressurization and tracer gas test results, the median ratio between the BDT n50 value and the natural air exchange rate with windows closed (ndecay_close) was calculated: it is equal to 17 (range of 14–21), thus, within the empirical conversion factor range found in the scientific literature (10–30 [62]) and quite similar to the value (20) typically suggested by the scientific literature when no natural air exchange rate data are available [63,64]. The authors point out that such wide range of the conversion factor recognized in the research studies is due to the several boundary conditions (e.g., age of the building, frame and other openings, ventilation systems, meteo-climatic conditions) affecting the natural air exchange rate of buildings.

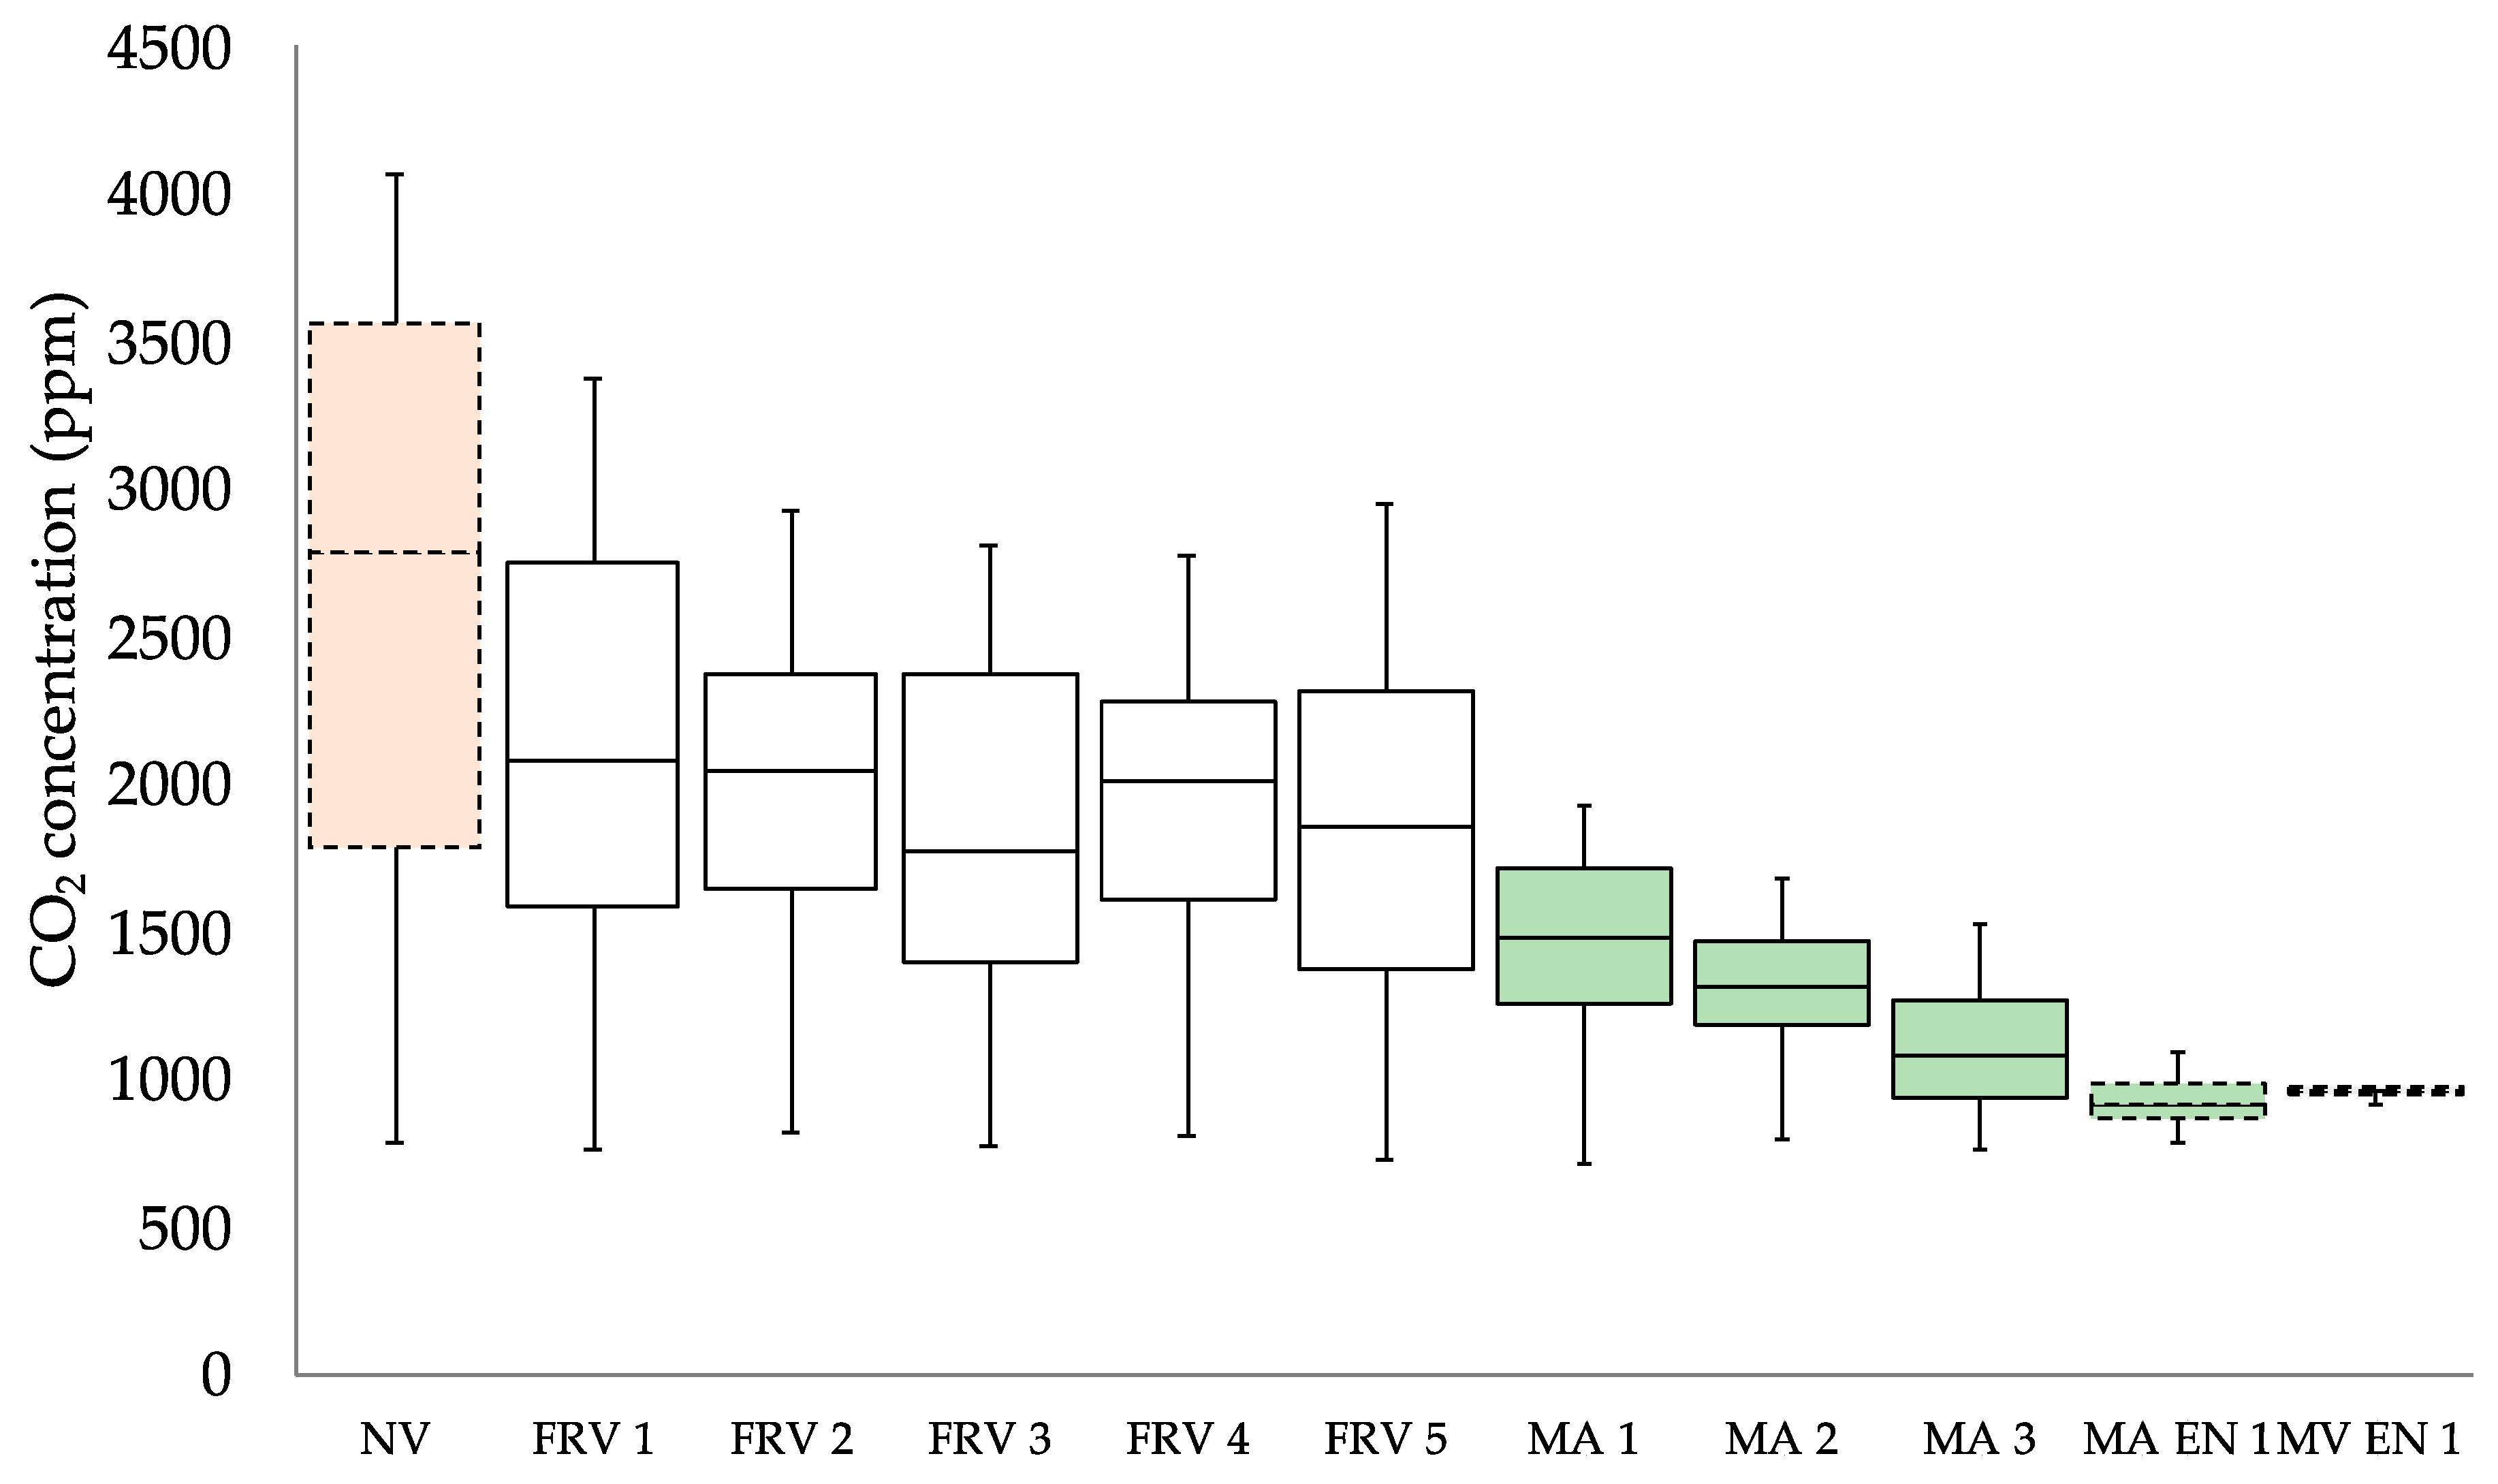
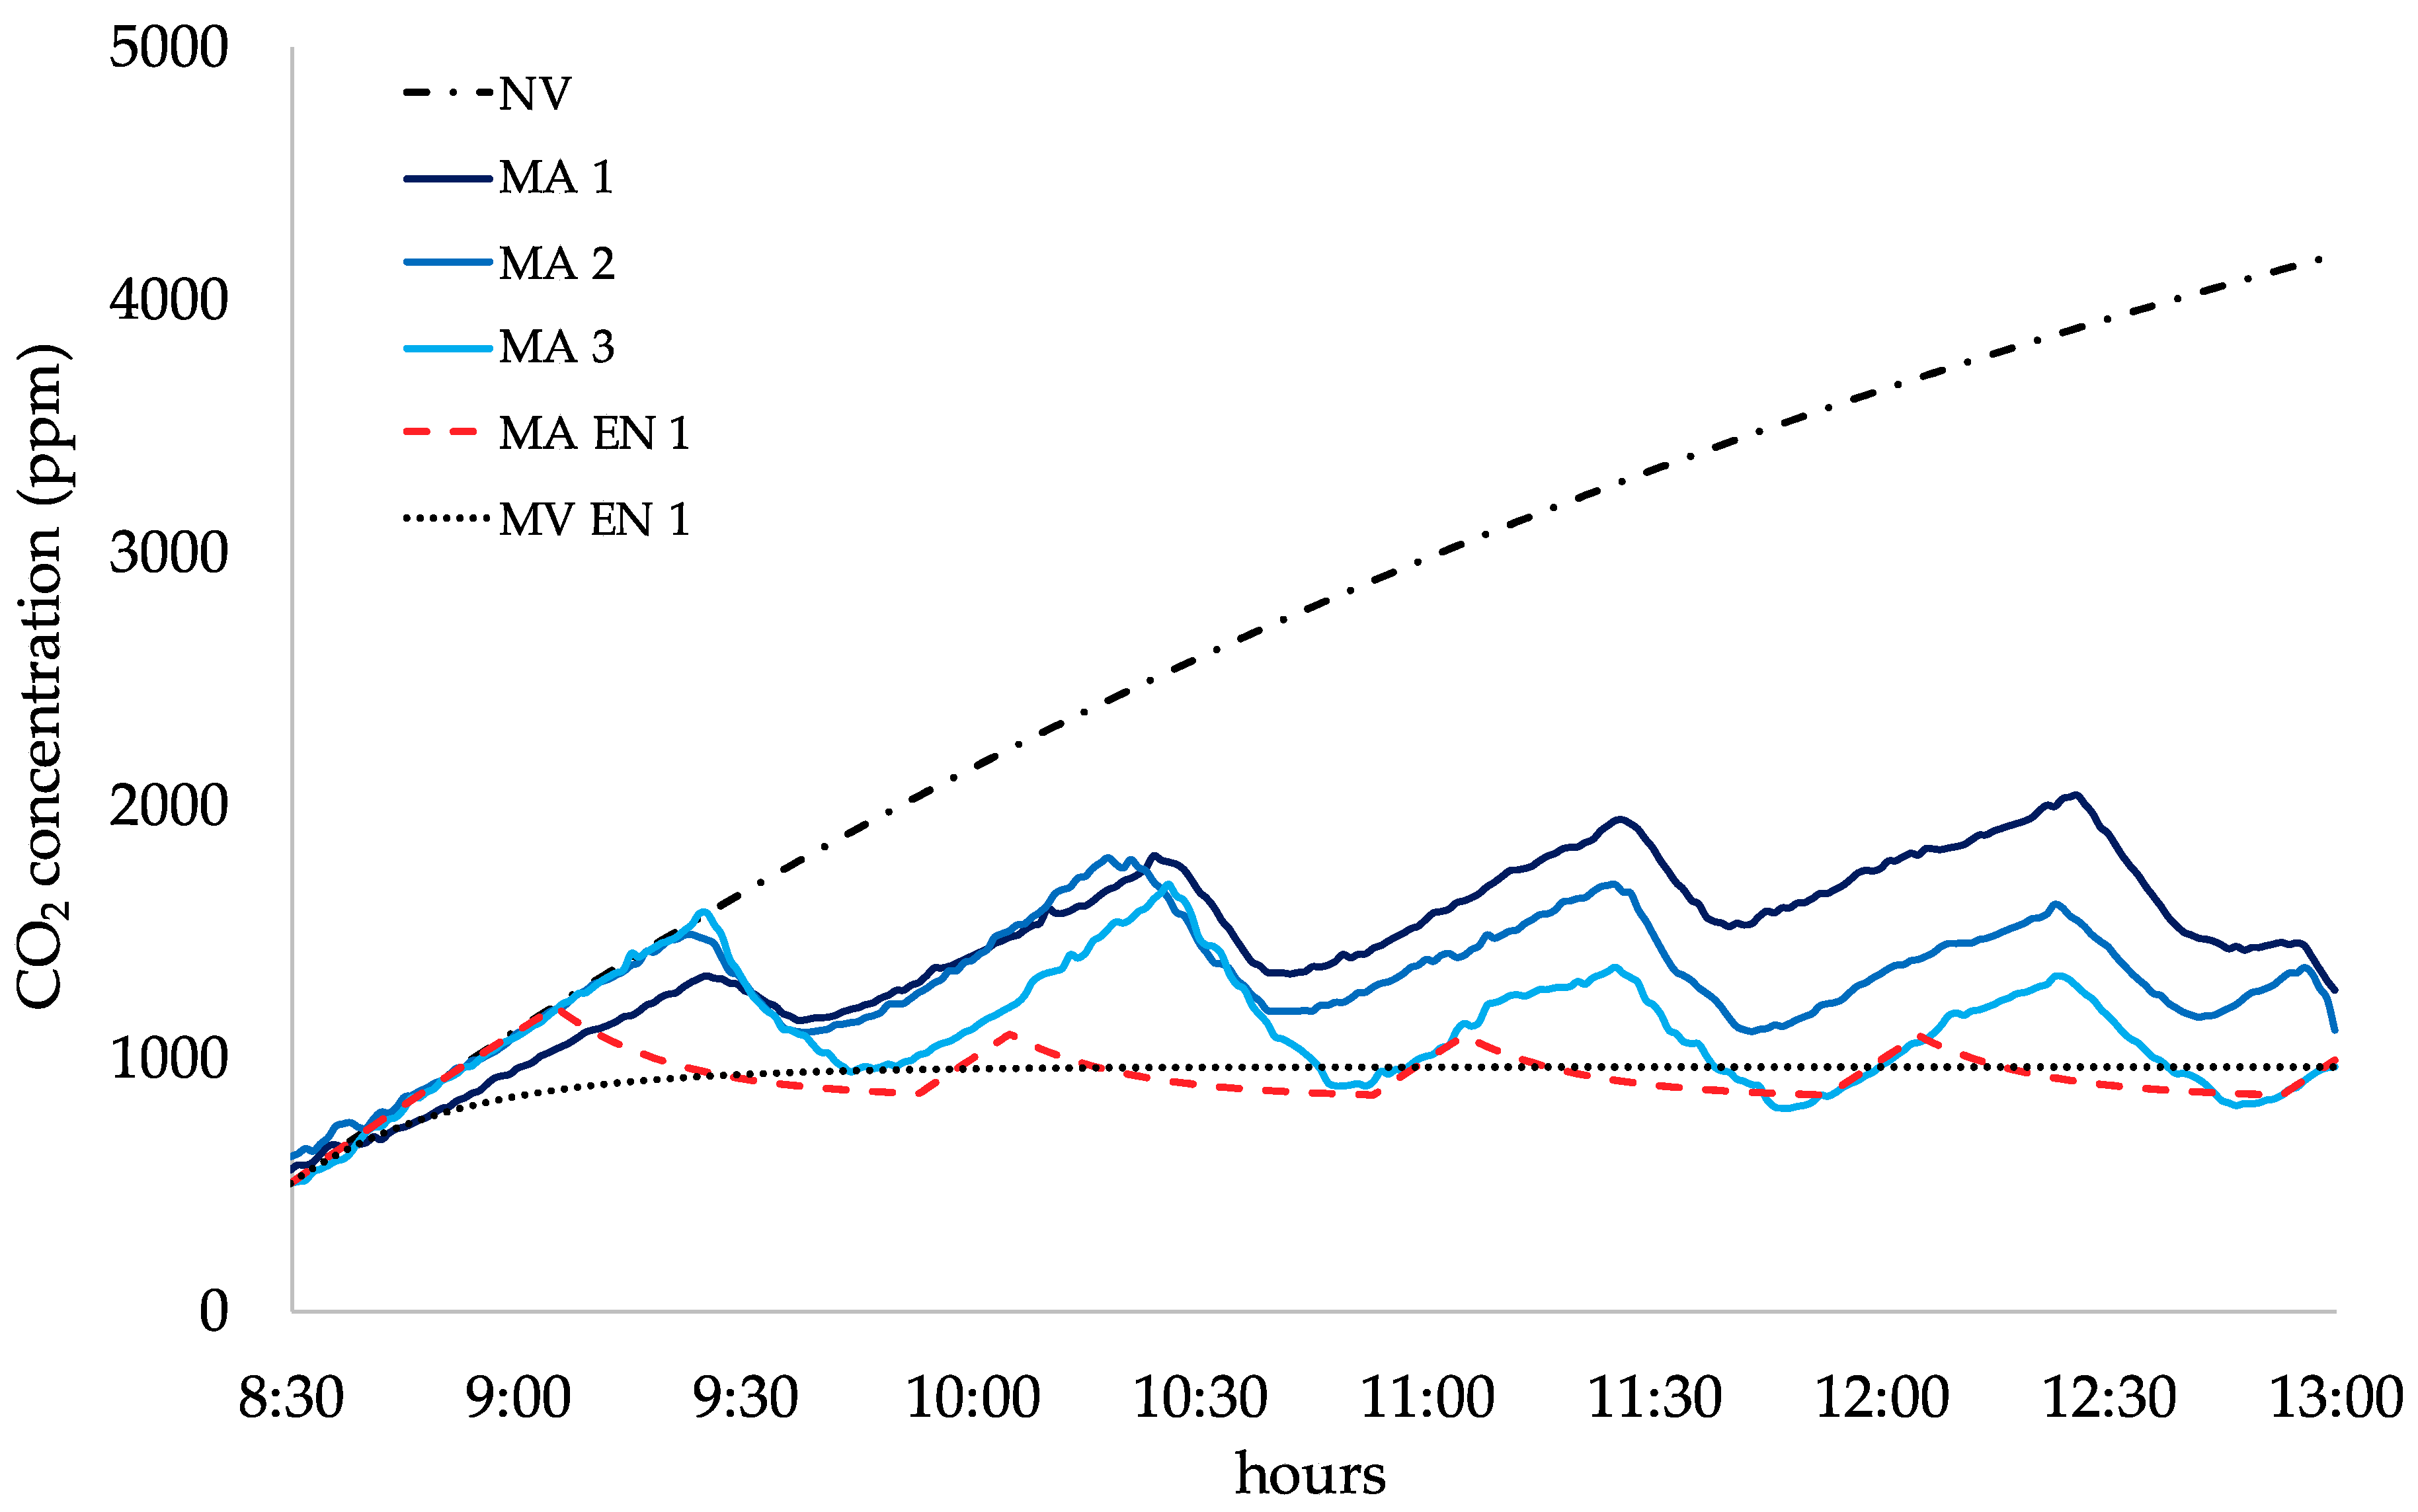
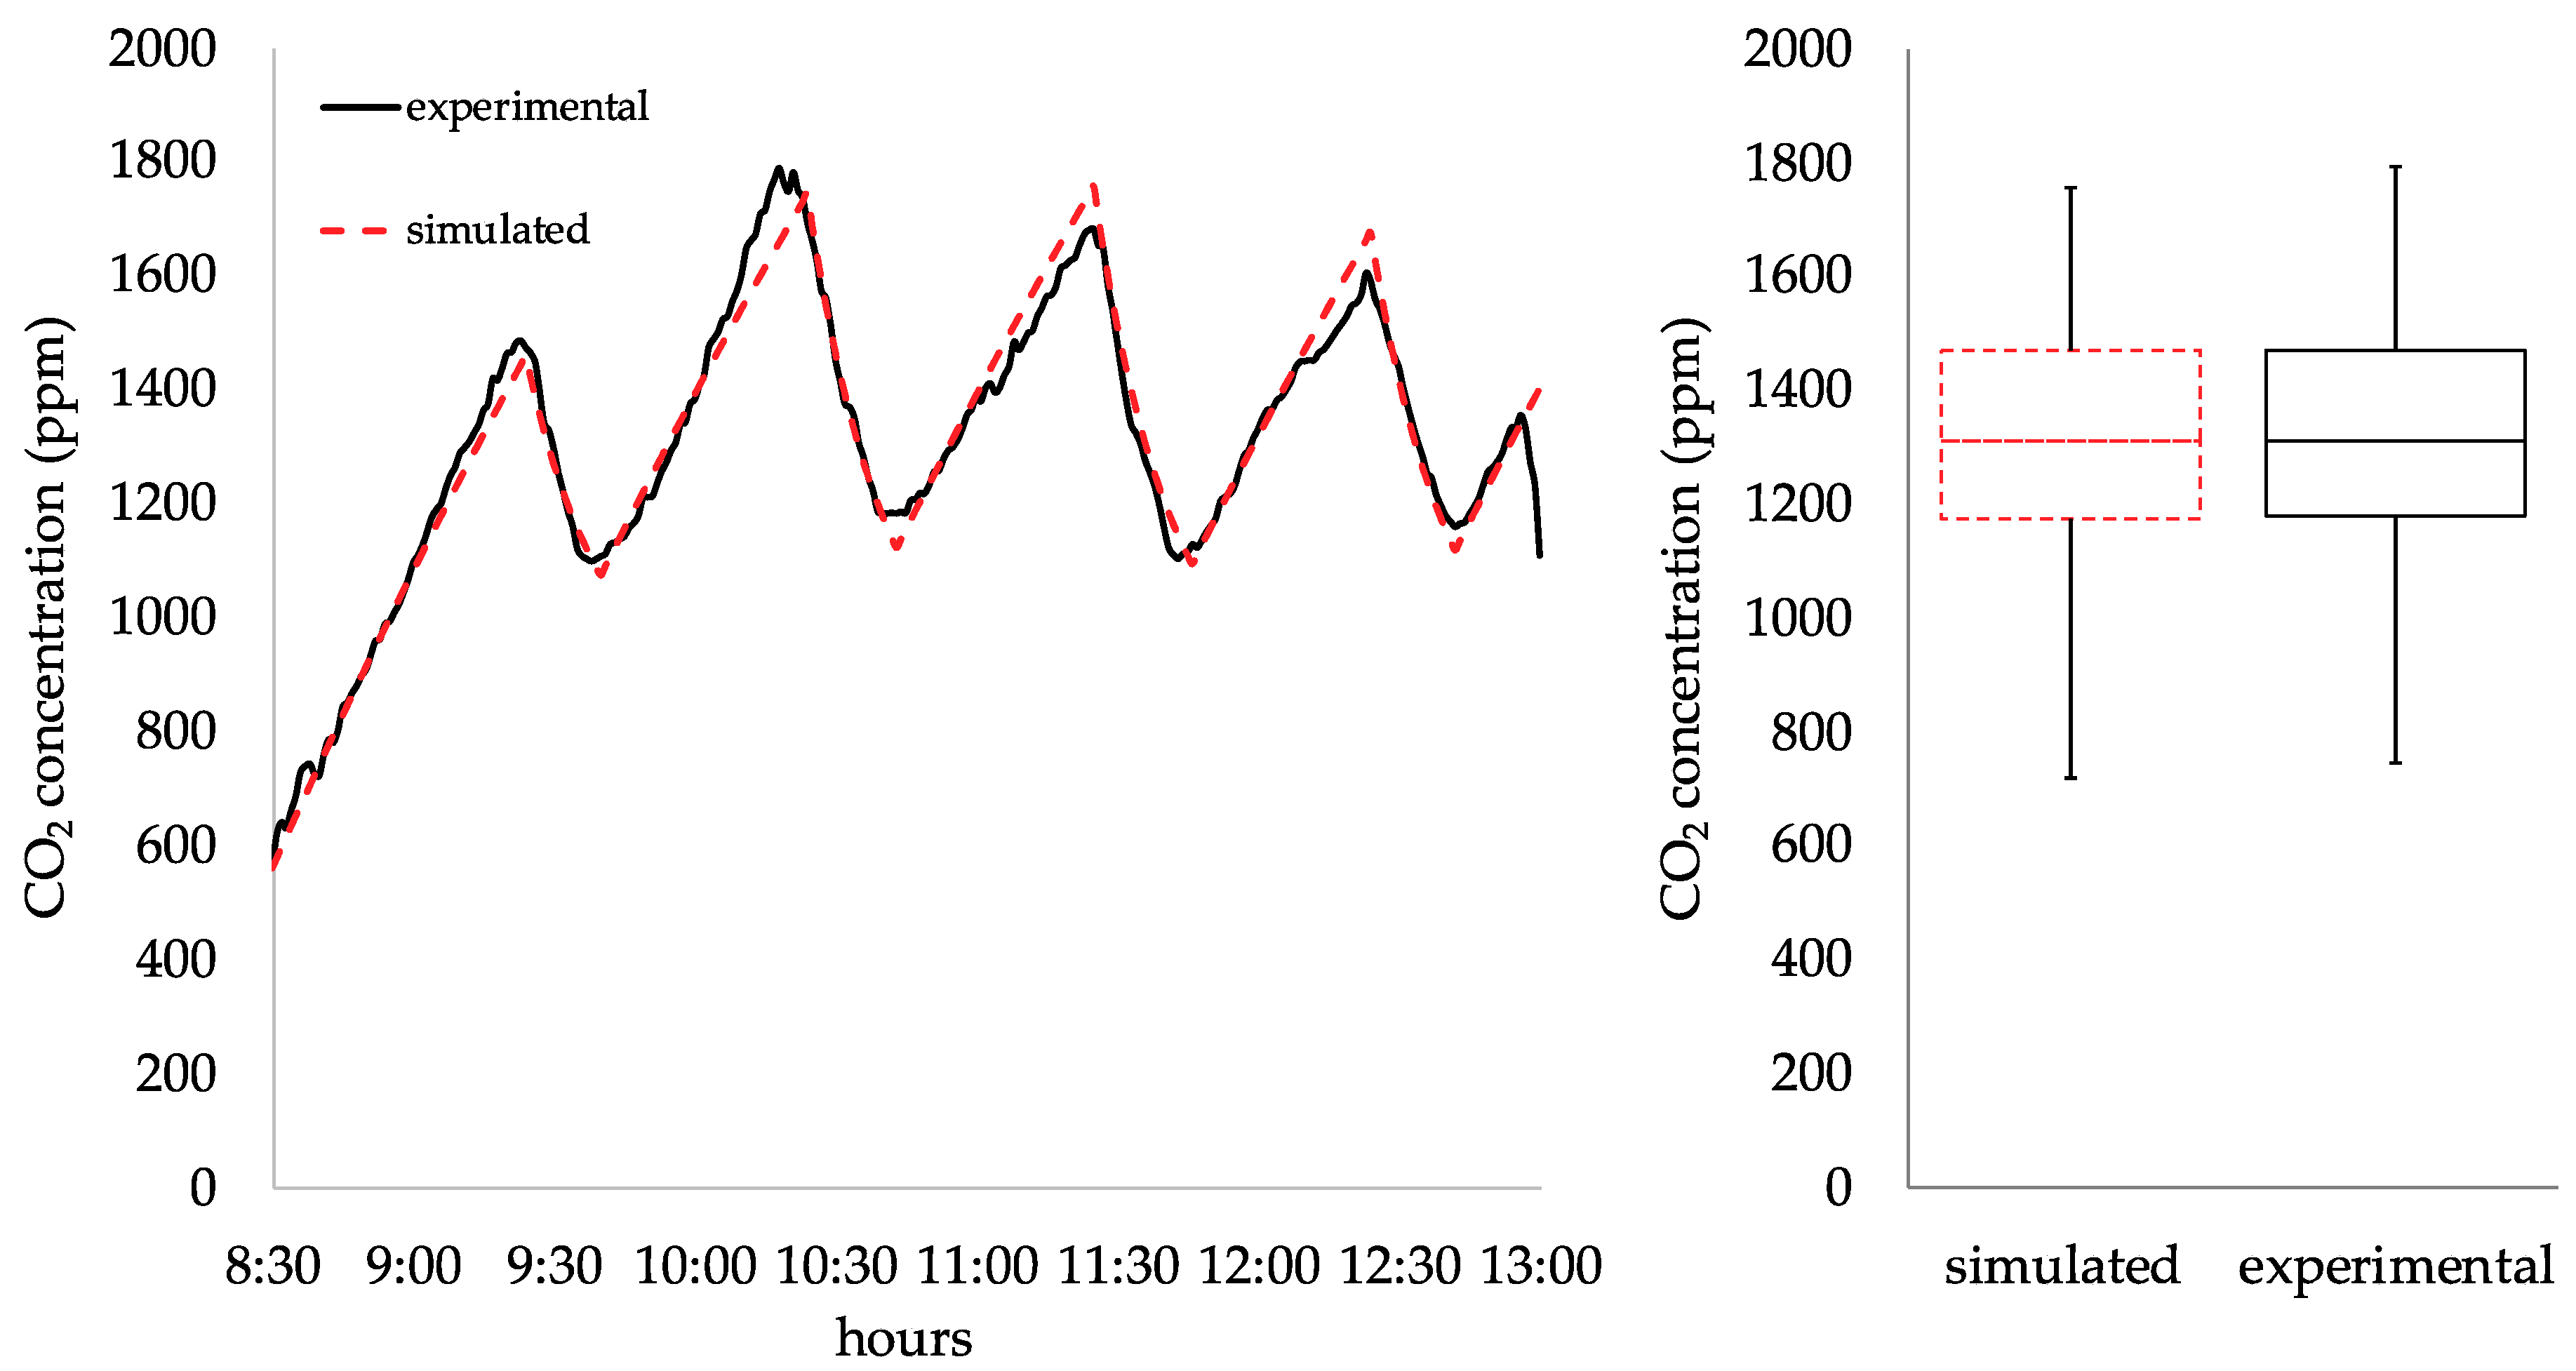
3.2. CO2 Concentrations for Different Ventilation Scenarios

In Figure 3, trends of CO2 concentrations measured during the free-running ventilation (FRV) tests are reported. The CO2 concentration in the classroom at 08:30 is similar to the outdoor one (roughly 500 ppm), then it exponentially raises due to the emission of the students/teachers themselves. CO2 levels are then partially reduced when windows are opened, indeed a CO2 decay is clearly recognizable. The authors, once again, point out that teachers/students were not asked to open the windows according to a specific procedure, on the contrary they opened the windows on the basis of their perception of the indoor air quality. Therefore, different CO2 trends were measured due to the different airing periods applied in those specific days. As an example, as resulted from the questionnaire filled out by the teacher, during the free-running ventilation test 1 (FRV 1), the window was opened just during the break; indeed a 16 min CO2 decay was detected during that day. On the other days, the teachers adopted slightly different strategies, e.g., windows opening periods longer than the school-break, short window opening periods before or after the school break etc. According to the questionnaires filled out by the teachers, the total window opening period of the five free-running ventilation tests were equal to 16, 25, 29, 31 and 50 min, respectively. Therefore, applying Equation (1), i.e., weighted average of the air exchange rates, and considering the median air exchange rates typical of window close (ndecay_close = 0.22 h−1) and open configuration (ndecay_open = 3.76 h−1), the median air exchange rates of the free-running ventilation tests were estimated equal to 0.43, 0.55, 0.60, 0.63, and 0.88 h−1, respectively. As expected, when longer opening periods were adopted, lower CO2 concentrations were measured, in fact, median CO2 values corresponding to the five free-running ventilation tests were equal to 2078, 2044, 1777, 2272, and 1859 ppm, respectively (Table 3 and Figure 4). Nonetheless, due to the wide CO2 data range of the FRV tests, CO2 levels measured during free-running ventilation tests resulted statistically similar (p < 0.01) as obtained from the Kruskal-Wallis rank test. In particular, all the FRV tests resulted in CO2 concentrations significantly higher than the commonly accepted value of 1000 ppm as also recognized in several naturally ventilated schools worldwide [65,66,67,68,69].
In Figure 5 the CO2 concentrations trends measured during the manual airing (MA) tests are shown. Once again, starting from roughly 500 ppm, the CO2 concentrations exponentially increased up to the window opening period. The trends clearly show the cyclical opening and closing periods typical of the scheduled airing strategy. The median CO2 concentrations measured during the airing tests, reported in Table 3 and Figure 4, are equal to 1482, 1310, and 1085 ppm for airing periods of 10 (test MA 1), 15 (test MA 2), and 20 min h−1 (test MA 3), respectively. The Kruskal-Wallis rank test applied to the four CO2 trends confirmed that the CO2 levels measured applying the three different airing procedures resulted statistically different (p < 0.01) amongst them as well as with respect to the free-running ventilation tests, then demonstrating that a properly scheduled manual airing procedure can positively affect the CO2 levels in classroom. Nonetheless, such improvement of the indoor air quality related to CO2 levels lead to higher energy consumptions (as hereinafter reported) and not predictable effects on other pollutants typically present in schools (e.g., ultrafine particles, PM10, PM2.5, NOx, radon, VOCs, etc.) [24,25,26,27,28,30,43,70,71,72,73].
As described in the methodology section, besides the experimental analyses, further ventilation scenarios were tested applying a CO2 mass balance equation on the test-classroom. In order to check the suitability of such simulated data, a validation of the simulation approach was performed applying it to the experimental test MA 2 (manual airing with scheduled window openings of 15 min every hour). The goodness of fit obtained through the simulated data is shown in Figure 6 were the measured (experimental) and simulated CO2 data are reported both as trends and box-plots. The figure clearly shows that the results of the simulation through a CO2 mass balance equation are comparable to the experimental data.
In Figure 5 the CO2 concentrations trends estimated through a mass balance equation for the following ventilation scenarios are also reported: i) natural ventilation (n = 0.22 h−1; NV), ii) mechanical ventilation with n = 2.76 h−1 (MV EN 1), iii) manual airing with n = 2.76 h−1 (MA EN 1). If the classroom was run with windows (and doors) kept closed during school-time (NV test), the low air exchange rate value would result in a very high CO2 concentration, with a median value of roughly 2800 ppm (Table 3 and Figure 4) and a peak higher than 4000 ppm. On the contrary, a constant air volume mechanical ventilation at n = 2.76 h−1 would guarantee low CO2 concentrations (median value lower than 1000 ppm likely due to the low densely populated condition of the classroom) and a constant level (plateau) after roughly one hour from the school starting time up to the school end. Concerning the hypothetical manual airing test at n = 2.76 h−1 (MA EN 1), to obtain such an air exchange rate value (considering the median ndecay_close and ndecay_open values), a total window opening period of roughly 190 min out of 270 min was needed. The median CO2 concentration resulted lower than 1000 ppm (once again due to the high crowding index) with a box-plot slightly wider than the mechanical ventilation one due to the presence of short exponential CO2 increases and decays, typical of the alternating window opening and closing periods. The Kruskal-Wallis rank test applied to the CO2 concentration estimated for mechanical ventilation test (MV EN 1) and manual airing test at n = 2.76 h−1 (MA EN 1) revealed that such concentrations were statistically similar (p < 0.01).

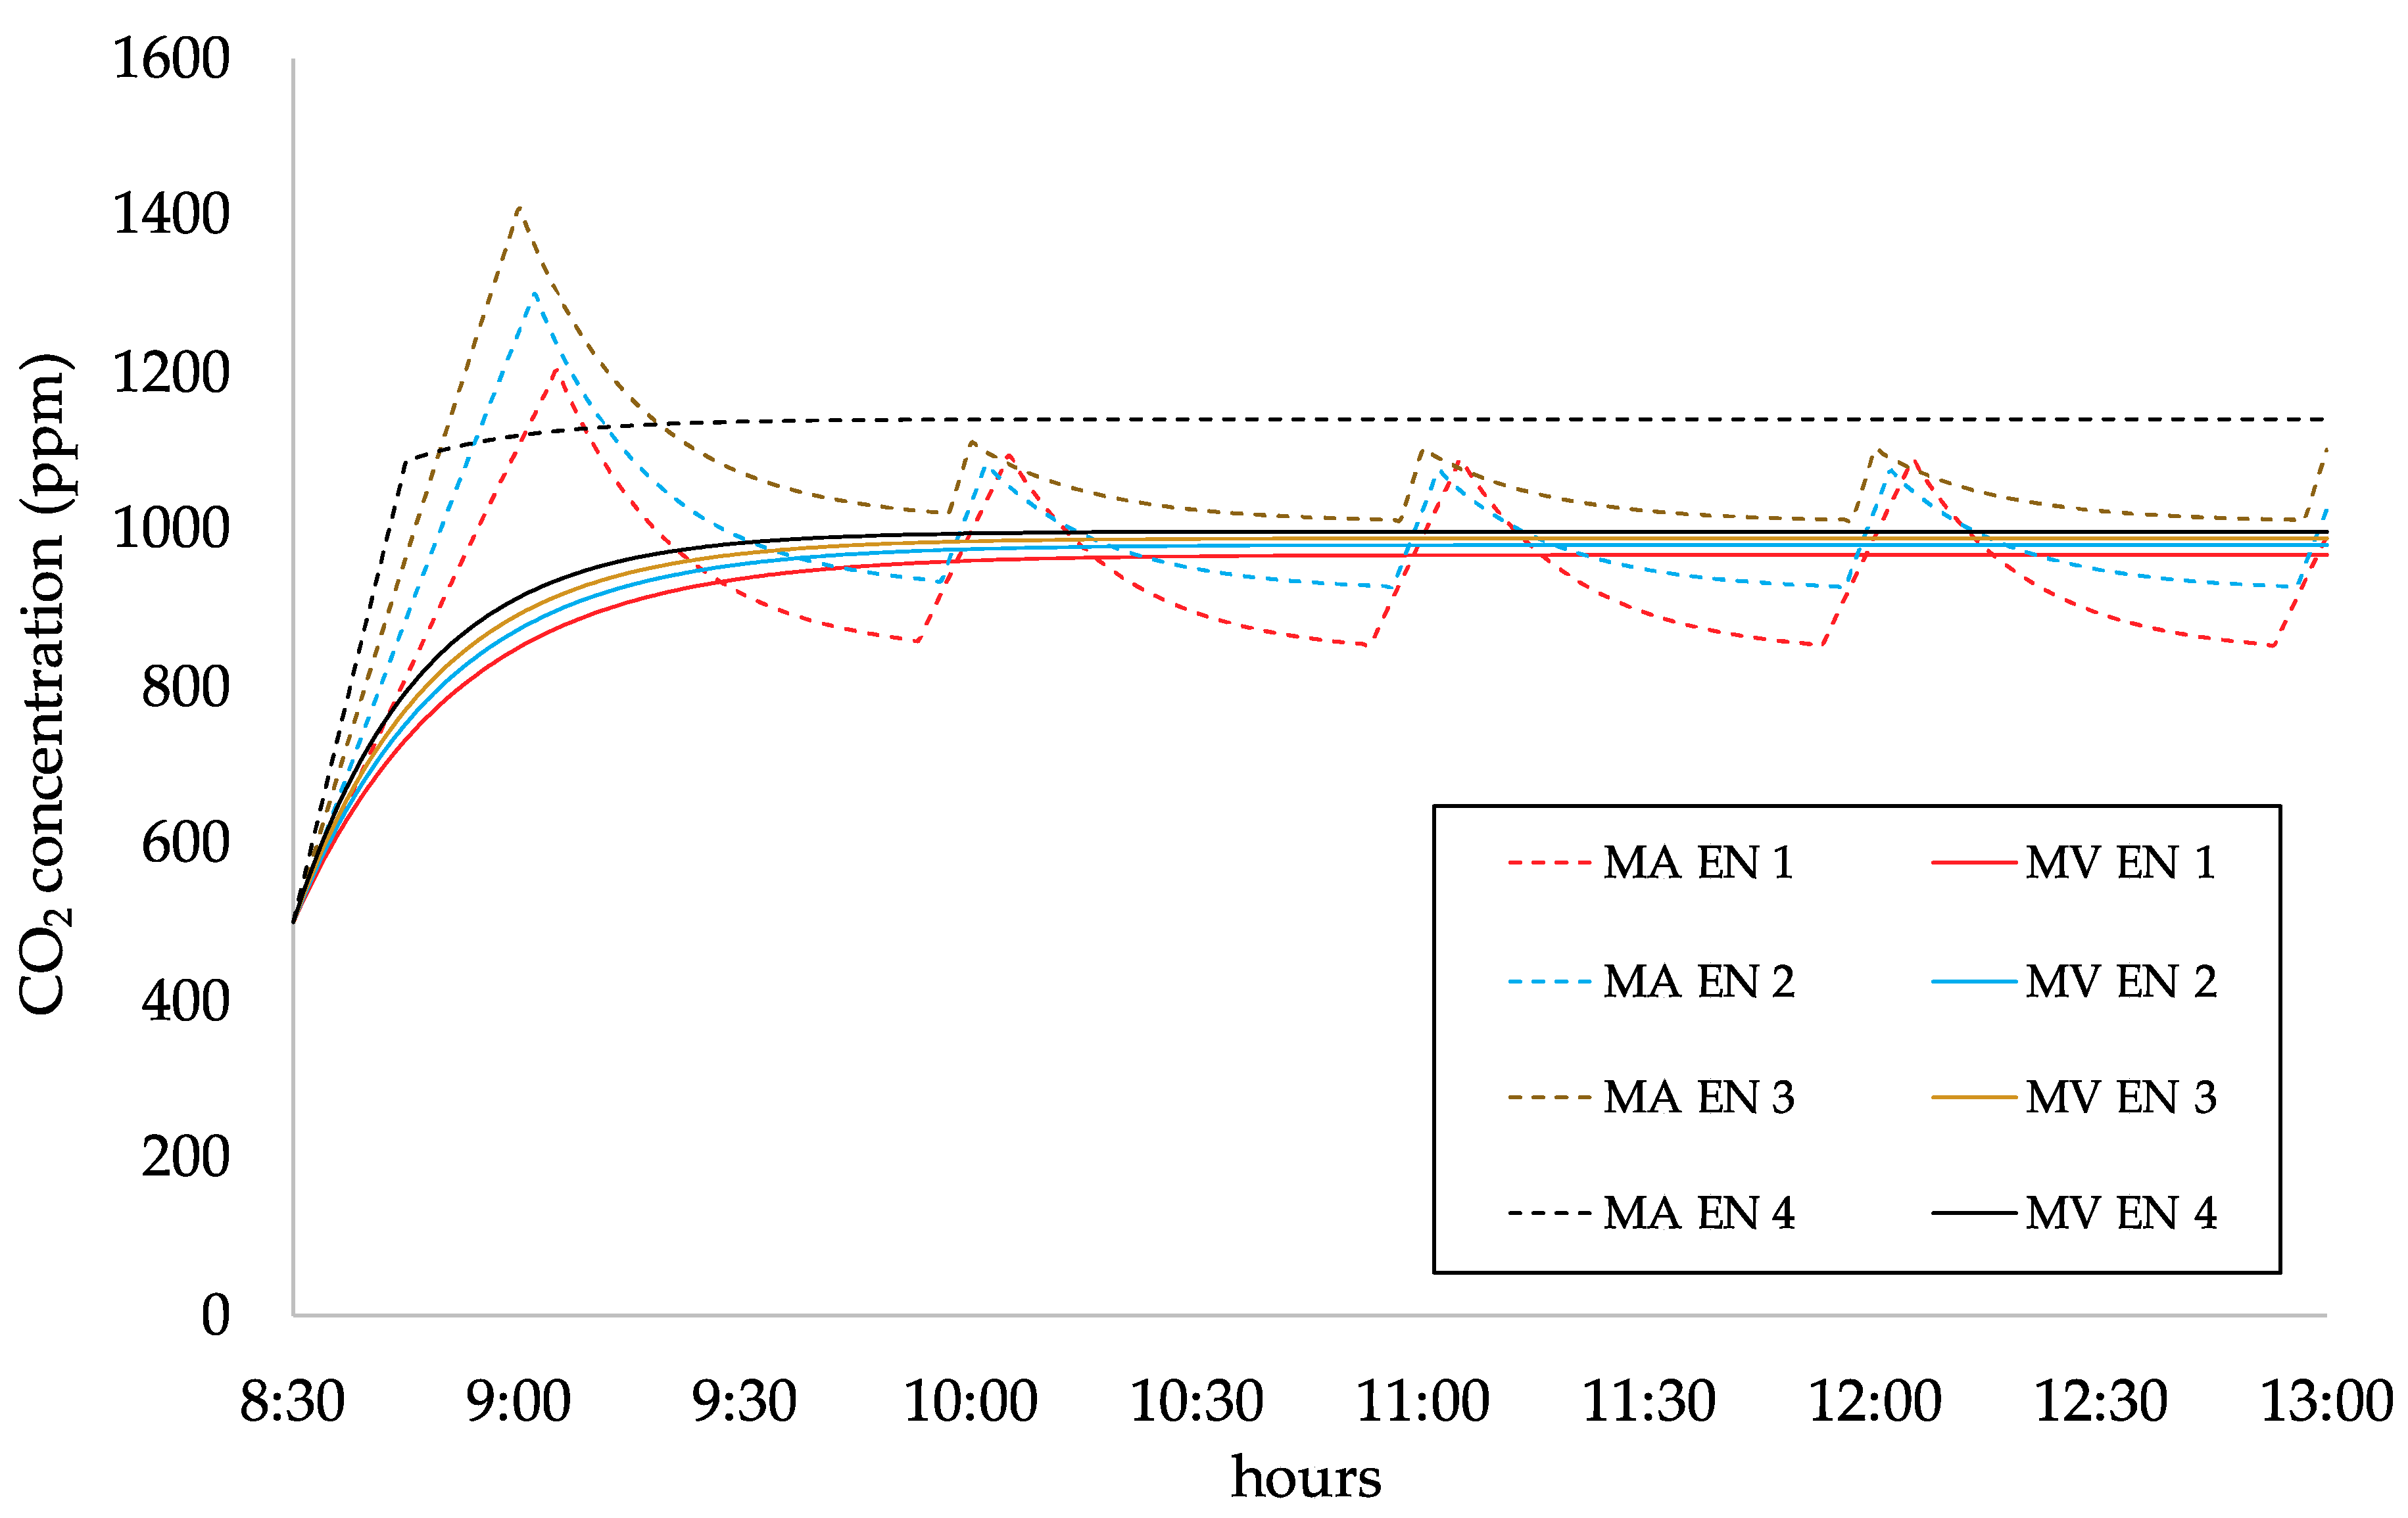
Effect of the Crowding Index on CO2 Concentrations

The data discussed above are characteristics of the actual crowding index of the classroom (2.2 m2 person−1) which is quite high with respect to the default occupant densities indicated by the European Committee for Standardization [19] (2 m2 person−1) and by the current Italian legislation (1.8 m2 person−1, [44]). In order to show the effect of the crowding index on the indoor air quality, in Figure 7 and Table 4 the CO2 concentrations calculated for mechanical ventilation and manual airing scenarios are reported as a function of the crowding indexes (2.2, 2.0, 1.8, and 1.6 m2 person−1) and the corresponding air exchange rates (2.76, 3.00, 3.24, and 3.57 h−1) reported in Section 2.3.3. In order to guarantee higher air exchange rates, longer manual airing periods are required; nonetheless, the effect of such alternating window opening and closing periods leads to higher CO2 median concentrations for more crowded scenarios (912, 959, 1033, and 1141 ppm for 2.2, 2.0, 1.8, and 1.6 m2 person−1, respectively): such values resulted statistically different amongst them (Kruskal-Wallis rank test, p < 0.01). The difference in terms of median CO2 concentrations between manual airing and mechanical ventilation resulted statistically not different (Kruskal-Wallis rank test, p < 0.01) for crowding index equal or higher than 2.0 m2 person−1, whereas for crowded scenarios of 1.8, and 1.6 m2 person−1 reductions of median CO2 levels for mechanical ventilation scenarios with respect manual airing scenarios were equal to 4% and 13%, respectively, when the same air exchange rate is adopted (Table 4). Therefore, as expected, the simplified approach to determine the air exchange rate suggested by the current standard (e.g., method based on ventilation rate per person), might result in CO2 median concentrations higher than 1000 ppm for overcrowded classrooms.

3.3. Energy Need for Different Ventilation Scenarios

In Table 3 the energy consumptions of the test-classroom evaluated through the asset rating method, described in Section 2.4, are reported. Ventilation heat losses (QH,ve) are strictly related to the air exchange ratios, indeed, for free-running ventilation tests, the losses increased from 3.51 × 10³ MJ (FRV 1, n = 0.43 h−1) to 7.18 × 10³ MJ (test FRV 5, n = 0.88 h−1), i.e., ventilation heat losses from 8% to 15% of the total energy need. As the indoor air quality is improved due to longer airing periods (e.g., manual airing tests, MA 1-MA 3), the ventilation energy losses worsened: ventilation losses for such tests were estimated in the range 6.09–10.4 × 10³ MJ (13–21% of the total energy need for space heating). When the required air exchange rate for the test-classroom under investigation (2.76 h−1) is applied through manual airing (MA EN 1 test), the indoor CO2 value decrease to the adequate concentrations, nonetheless, the ventilation heat losses raise up to 22.5 × 10³ MJ (36% of the total energy need for space heating), then showing that airing solutions cannot simultaneously handle air quality and energetic issues. In fact, as shown above, the natural ventilation technique (NV test) reduces the flow rate of fresh air entering the room so that the ventilation heat losses decrease up to 1.80 × 10³ MJ (n = 0.22 h−1), i.e., 4% of the total energy need for space heating. Nonetheless, as shown in Section 3.2, such ventilation scenario would lead to the highest indoor CO2 level amongst the ventilation scenarios under investigation (Table 3). Therefore, the potential energy saving due to such a scenario is misleading since it is obtained considering a not suitable indoor air quality.
Therefore, as expected, the only solution to improve simultaneously the energy consumption and the indoor air quality is a ventilation retrofit by installing a mechanical ventilation system equipped with a heat recovery unit. Indeed, the hypothesized constant air volume ventilation system with a heat recovery efficiency of 90% (MV EN 1) [13], could guarantee a reduction of the ventilation heat losses down to 2.25 × 10³ MJ (7% of the total energy need for space heating). Such QH,ve value is still higher than that typical of natural ventilation, but such scenarios are not comparable since they lead to extremely different indoor air quality. The energy saving of the mechanical ventilation scenario should be evaluated just with respect to the ventilation scenario MA EN 1, i.e., when the same air exchange rate is guaranteed. In this case, with a heat recovery efficiency of 90%, an energy saving of 32% can be obtained.

Effect of the Crowding Index on Energy Need

As regards to the effect of the crowding index on the energy consumption, in Table 4 the percent reduction of energy need for space heating as a function of the crowding indexes is reported. Moving from less (2.2 m2 person−1) to more (1.6 m2 person−1) densely populated conditions a higher ventilation rate is required by the EN 15251: this leads to higher air exchange rates. Therefore, the lower the crowding index, the larger the energy saving that could be obtained with a mechanical ventilation system equipped with a heat recovery unit with respect to airing methods when the same air exchange rate is guaranteed. As an example, for a 1.6 m2 person−1 crowding index, the energy saving of mechanical ventilation almost reaches 38%. This is key information in view of the potential improvement of energy need and air quality in classrooms considering that in some Italian schools crowding index lower than 1 m2 person−1 were recognized [43].

4. Conclusions

In the present paper, the effect of the different ventilation approaches in high energy-demanding naturally-ventilated schools on indoor air quality and energy consumption during the heating season was assessed. To this end, a test-classroom with a 2.2 m2 person−1 crowding index in a school placed in Cassino (Central Italy) was investigated. The classroom was firstly characterized in terms of air permeability performing experimental analyses aimed to characterize the airtightness of the envelope (Blower-Door Test) and the air exchange rates with windows open and closed (CO2 decay tests).
Indoor CO2 concentrations during free-running ventilation tests (window opening period decided by the occupants), scheduled manual airing tests (imposing window opening periods), manual airing and mechanical ventilation with an air exchange rate imposed by the standard (EN 15251) were evaluated through experimental analyses or simulations applying a CO2 mass balance equation. The calculation of the energy need for space heating characteristics of the different ventilation scenarios under investigations was also performed adopting an asset rating method.
The study clearly highlights that, even in a low densely populated condition (2.2 m2 person−1), indoor air quality and energy saving goals cannot be met simultaneously. Indeed, during free-running ventilation tests, i.e., when the occupants adopted manual airing on the basis of their air quality perception, the estimated air exchange rates resulted lower than 1 h−1 (0.43–0.88 h−1), then leading to reduced ventilation heat losses (8–15% of the total energy need) but high median CO2 concentrations (1777–2272 ppm). When scheduled manual airing procedures were applied, the CO2 concentrations resulted statistically lower than free-running ventilation tests (median values of 1482, 1310, and 1085 ppm for airing strategies with window opening periods of 10, 15, and 20 min·h−1, respectively), but a corresponding increase of the ventilation heat loss contribution was also calculated (13–21%) due to the higher air exchange rates (0.75–1.27 h−1). Nonetheless, such air exchange rates resulted still lower than that required by the EN 15251 standard; indeed, when a manual airing strategy guaranteeing such minimum air exchange rate was simulated (2.76 h−1), the median CO2 concentrations resulted lower than 1000 ppm but the heat ventilation losses raised up to 36% of the total energy need. In order to reduce simultaneously the indoor CO2 concentrations and energy consumption, the mechanical ventilation system with a heat recovery unit should be adopted. In that case, when the minimum required air exchange rate by the EN 15251 standard is adopted, the energy need for ventilation dropped to 5% then guaranteeing an overall energy saving with respect to the manual airing strategy higher than 30%. Finally, higher occupancy densities of the classroom were also simulated considering manual airing and mechanical ventilation scenarios. More densely populated conditions imply higher required air exchange rates then leading to longer airing periods for manual airing scenarios, this resulted in even higher energy savings reachable with mechanical ventilation (38% for 1.6 m2 person−1 crowding index).
In summary, the results of the study highlighted that the comparisons of different ventilation scenarios have to be performed for similar indoor air quality conditions: if that happens, the ventilation retrofit involving mechanical ventilation with heat recovery unit cannot be considered an energy-consuming method. This is a key aspect to be promoted since it could support governments to support energy retrofits not limited to the energy consumption reduction but also involving air quality aspects. In fact, considering that the majority of the Italian schools are high energy-demanding, the findings of the present paper could be useful to perform rough estimates of the possible energy saving obtainable if nation-based policies aiming at improving the indoor air quality in schools were put in place. Future development of the study should consider the simultaneous effect of the ventilation strategies on other pollutants (e.g., airborne particles, NOx) through ad-hoc experimental campaigns.

Author Contributions

Conceptualization, L.S. and M.D.; Methodology, L.S., M.D., and A.M.; Software, A.M., L.C., and L.S.; Validation, M.D., and A.A.; Investigation, L.S., A.R.; Resources, M.D.; Data Curation, L.S. and L.C.; Writing-Original Draft Preparation, L.S.; Writing-Review & Editing, L.S., L.C., and M.D.; Visualization, L.S.; Supervision, M.D.; Project Administration, M.D.; Funding Acquisition, M.D.

Funding

This research was funded by the project “PRIN Riqualificazione del parco edilizio esistente in ottica NZEB/Renovation of existing buildings in NZEB vision (nearly Zero Energy Buildings)” funded by MIUR (grant number 2015S7E247_002).

Conflicts of Interest

The authors declare no conflict of interest; The funders had no role in the design of the study; in the collection, analyses, or interpretation of data; in the writing of the manuscript, or in the decision to publish the results.

References

  1. Awbi, H.B. Ventilation for Good Indoor Air Quality and Energy Efficiency. Energy Procedia 2017, 112, 277–286. [Google Scholar] [CrossRef]
  2. Gil-Baez, M.; Barrios-Padura, Á.; Molina-Huelva, M.; Chacartegui, R. Natural ventilation systems in 21st-century for near zero energy school buildings. Energy 2017, 137, 1186–1200. [Google Scholar] [CrossRef]
  3. European Parliament and Council of the European Union. Directive 2010/31/EU of the European Parliament and of the Council of 19 May 2010 on the Energy Performance of Buildings (Recast). Official Journal of the European Union: 2010; Vol. L153/13. Available online: https://eur-lex.europa.eu (accessed on 20 April 2019).
  4. D’Agostino, D.; Mazzarella, L. What is a Nearly zero energy building? Overview, implementation and comparison of definitions. J. Buil. Eng. 2019, 21, 200–212. [Google Scholar] [CrossRef]
  5. Attia, S.; Eleftheriou, P.; Xeni, F.; Morlot, R.; Ménézo, C.; Kostopoulos, V.; Betsi, M.; Kalaitzoglou, I.; Pagliano, L.; Cellura, M.; et al. Overview and future challenges of nearly zero energy buildings (nZEB) design in Southern Europe. Energy Build. 2017, 155, 439–458. [Google Scholar] [CrossRef]
  6. Guillén-Lambea, S.; Rodríguez-Soria, B.; Marín, J.M. Review of European ventilation strategies to meet the cooling and heating demands of nearly zero energy buildings (nZEB)/Passivhaus. Comparison with the USA. Renew. Sustain. Energy Rev. 2016, 62, 561–574. [Google Scholar] [CrossRef]
  7. Guyot, G.; Sherman, M.H.; Walker, I.S. Smart ventilation energy and indoor air quality performance in residential buildings: A review. Energy Build. 2018, 165, 416–430. [Google Scholar] [CrossRef]
  8. D’Agostino, D.; Mazzarella, L. Data on energy consumption and Nearly zero energy buildings (NZEBs) in Europe. Data Brief 2018, 21, 2470–2474. [Google Scholar] [CrossRef] [PubMed]
  9. Ciampi, G.; Rosato, A.; Scorpio, M.; Sibilio, S. Energy and Economic Evaluation of Retrofit Actions on an Existing Historical Building in the South of Italy by Using a Dynamic Simulation Software. Energy Procedia 2015, 78, 741–746. [Google Scholar] [CrossRef]
  10. Ciulla, G.; Galatioto, A.; Ricciu, R. Energy and economic analysis and feasibility of retrofit actions in Italian residential historical buildings. Energy Build. 2016, 128, 649–659. [Google Scholar] [CrossRef]
  11. Luddeni, G.; Krarti, M.; Pernigotto, G.; Gasparella, A. An analysis methodology for large-scale deep energy retrofits of existing building stocks: Case study of the Italian office building. Sustain. Cities Soc. 2018, 41, 296–311. [Google Scholar] [CrossRef]
  12. Ma, Z.; Cooper, P.; Daly, D.; Ledo, L. Existing building retrofits: Methodology and state-of-the-art. Energy Build. 2012, 55, 889–902. [Google Scholar] [CrossRef]
  13. Stabile, L.; Buonanno, G.; Frattolillo, A.; Dell’Isola, M. The effect of the ventilation retrofit in a school on CO2, airborne particles, and energy consumptions. Build. Environ. 2019, 156, 1–11. [Google Scholar] [CrossRef]
  14. Canale, L.; Dell’Isola, M.; Ficco, G.; Di Pietra, B.; Frattolillo, A. Estimating the impact of heat accounting on Italian residential energy consumption in different scenarios. Energy Build. 2018, 168, 385–398. [Google Scholar] [CrossRef]
  15. Dell’Isola, M.; Ficco, G.; Arpino, F.; Cortellessa, G.; Canale, L. A novel model for the evaluation of heat accounting systems reliability in residential buildings. Energy Build. 2017, 150, 281–293. [Google Scholar] [CrossRef]
  16. Arpino, F.; Cortellessa, G.; Dell’Isola, M.; Ficco, G.; Marchesi, R.; Tarini, C. Influence of Installation Conditions on Heating Bodies Thermal Output: Preliminary Experimental Results. Energy Procedia 2016, 101, 74–80. [Google Scholar] [CrossRef]
  17. Intelligent Energy for Europe Programme. Energy Efficiency Trends and Policies in the Household and Tertiary Sectors. An Analysis Based on the ODYSSEE and MURE Databases. Available online: http://www.odyssee-mure.eu/publications/br/energy-efficiency-in-buildings.html (accessed on 20 April 2019).
  18. European SolarThermal Industry Federation. Solar Thermal Markets in Europe. Trends and Market Statistics 2014; European SolarThermal Industry Federation: Brussels, Belgium, 2015; Available online: http://www.estif.org/fileadmin/estif/content/market_data/downloads/2014_solar_thermal_markets_LR.pdf (accessed on 28 April 2019).
  19. European Committee for Standardisation. UNI EN 15251—Indoor Environmental Input Parameters for Design and Assessment of Energy Performance of Buildings Addressing Indoor Air Quality, Thermal Environment, Lighting and Acoustics; European Committee for Standardisation: Brussels, Belgium, 2008. [Google Scholar]
  20. Persily, A.; de Jonge, L. Carbon dioxide generation rates for building occupants. Indoor Air 2017, 27, 868–879. [Google Scholar] [CrossRef] [PubMed]
  21. Chatzidiakou, L.; Mumovic, D.; Summerfield, A. Is CO2 a good proxy for indoor air quality in classrooms? Part 2: Health outcomes and perceived indoor air quality in relation to classroom exposure and building characteristics. Build. Serv. Eng. Res. Technol. 2015, 36, 162–181. [Google Scholar] [CrossRef]
  22. Chatzidiakou, L.; Mumovic, D.; Summerfield, A. Is CO2 a good proxy for indoor air quality in classrooms? Part 1: The interrelationships between thermal conditions, CO2 levels, ventilation rates and selected indoor pollutants. Build. Serv. Eng. Res. Technol. 2015, 36, 129–161. [Google Scholar] [CrossRef]
  23. Ramalho, O.; Wyart, G.; Mandin, C.; Blondeau, P.; Cabanes, P.-A.; Leclerc, N.; Mullot, J.-U.; Boulanger, G.; Redaelli, M. Association of carbon dioxide with indoor air pollutants and exceedance of health guideline values. Build. Environ. 2015, 93, 115–124. [Google Scholar] [CrossRef]
  24. Madureira, J.; Paciência, I.; Pereira, C.; Teixeira, J.P.; Fernandes, E.D.O. Indoor air quality in Portuguese schools: levels and sources of pollutants. Indoor Air 2016, 26, 526–537. [Google Scholar] [CrossRef]
  25. Morawska, L.; Ayoko, G.A.; Bae, G.N.; Buonanno, G.; Chao, C.Y.H.; Clifford, S.; Fu, S.C.; Hanninen, O.; He, C.; Isaxon, C.; et al. Airborne particles in indoor environment of homes, schools, offices and aged care facilities: The main routes of exposure. Environ. Int. 2017, 108, 75–83. [Google Scholar] [CrossRef] [PubMed]
  26. Rivas, I.; Viana, M.; Moreno, T.; Bouso, L.; Pandolfi, M.; Alvarez-Pedrerol, M.; Forns, J.; Alastuey, A.; Sunyer, J.; Querol, X. Outdoor infiltration and indoor contribution of UFP and BC, OC, secondary inorganic ions and metals in PM2.5 in schools. Atmos. Environ. 2015, 106, 129–138. [Google Scholar] [CrossRef]
  27. Salthammer, T.; Uhde, E.; Schripp, T.; Schieweck, A.; Morawska, L.; Mazaheri, M.; Clifford, S.; He, C.; Buonanno, G.; Querol, X.; et al. Children’s well-being at schools: Impact of climatic conditions and air pollution. Environ. Int. 2016, 94, 196–210. [Google Scholar] [CrossRef]
  28. Stabile, L.; Dell’Isola, M.; Russi, A.; Massimo, A.; Buonanno, G. The effect of natural ventilation strategy on indoor air quality in schools. Sci. Total Environ. 2017, 595, 894–902. [Google Scholar] [CrossRef]
  29. Stabile, L.; Dell’Isola, M.; Frattolillo, A.; Massimo, A.; Russi, A. Effect of natural ventilation and manual airing on indoor air quality in naturally ventilated Italian classrooms. Build. Environ. 2016, 98, 180–189. [Google Scholar] [CrossRef]
  30. Viana, M.; Rivas, I.; Querol, X.; Alastuey, A.; Sunyer, J.; Álvarez-Pedrerol, M.; Bouso, L.; Sioutas, C. Indoor/outdoor relationships and mass closure of quasi-ultrafine, accumulation and coarse particles in Barcelona schools. Atmos. Chem. Phys. 2014, 14, 4459–4472. [Google Scholar] [CrossRef]
  31. Neft, I.; Scungio, M.; Culver, N.; Singh, S. Simulations of aerosol filtration by vegetation: Validation of existing models with available lab data and application to near-roadway scenario. Aerosol Sci. Technol. 2016, 50, 937–946. [Google Scholar] [CrossRef]
  32. Scungio, M.; Arpino, F.; Stabile, L.; Buonanno, G. Numerical Simulation of Ultrafine Particle Dispersion in Urban Street Canyons with the Spalart-Allmaras Turbulence Model. Aerosol Air Qual. Res. 2013, 13, 1423–1437. [Google Scholar] [CrossRef]
  33. Scungio, M.; Buonanno, G.; Arpino, F.; Ficco, G. Influential parameters on ultrafine particle concentration downwind at waste-to-energy plants. Waste Manag. 2015, 38, 157–163. [Google Scholar] [CrossRef]
  34. Scungio, M.; Stabile, L.; Rizza, V.; Pacitto, A.; Russi, A.; Buonanno, G. Lung cancer risk assessment due to traffic-generated particles exposure in urban street canyons: A numerical modelling approach. Sci. Total Environ. 2018, 631–632, 1109–1116. [Google Scholar] [CrossRef]
  35. Scungio, M.; Vitanza, T.; Stabile, L.; Buonanno, G.; Morawska, L. Characterization of particle emission from laser printers. Sci. Total Environ. 2017, 586, 623–630. [Google Scholar] [CrossRef]
  36. Stabile, L.; Massimo, A.; Rizza, V.; D’Apuzzo, M.; Evangelisti, A.; Scungio, M.; Frattolillo, A.; Cortellessa, G.; Buonanno, G. A novel approach to evaluate the lung cancer risk of airborne particles emitted in a city. Sci. Total Environ. 2019, 656, 1032–1042. [Google Scholar] [CrossRef]
  37. Stabile, L.; Scungio, M.; Buonanno, G.; Arpino, F.; Ficco, G. Airborne particle emission of a commercial 3D printer: the effect of filament material and printing temperature. Indoor Air 2017, 27, 398–408. [Google Scholar] [CrossRef]
  38. Radulov, L.; Kaloyanov, N.; Petran, H. European Commission Funded RePublic_ZEB Project. D2.1 Report on the Preliminary Assessment of the Public Building Stock. 2016. Available online: http://www.republiczeb.org (accessed on 20 April 2019).
  39. Agenzia Nazionale per l’Efficienza Energetica. Efficienza Energetica. Rapporto Annuale. Analisi e Risultati delle Policy di Efficienza Energetica nel Nostro Paese. 2017. Available online: http://www.efficienzaenergetica.enea.it/ (accessed on 20 April 2019).
  40. Legambiente. Ecosistema Scuola—XIX Rapporto di Legambiente Sulla Qualità Dell’ediliza Scolastica, Delle Strutture e dei Servizi; LEGAMBIENTE ONLUS: Roma, Italy, 2018; Available online: https://www.legambiente.it/wp-content/uploads/ecosistema_scuola_2018.pdf (accessed on 10 March 2019).
  41. Fuoco, F.; Stabile, L.; Buonanno, G.; Trassiera, C.; Massimo, A.; Russi, A.; Mazaheri, M.; Morawska, L.; Andrade, A. Indoor Air Quality in Naturally Ventilated Italian Classrooms. Atmosphere 2015, 6, 1652. [Google Scholar] [CrossRef]
  42. Rovelli, S.; Cattaneo, A.; Nuzzi, C.P.; Spinazzè, A.; Piazza, S.; Carrer, P.; Cavallo, D.M. Airborne particulate matter in school classrooms of northern Italy. Int. J. Environ. Res. Public Health 2014, 11, 1398–1421. [Google Scholar] [CrossRef]
  43. Ruggieri, S.; Longo, V.; Perrino, C.; Canepari, S.; Drago, G.; L’Abbate, L.; Balzan, M.; Cuttitta, G.; Scaccianoce, G.; Minardi, R.; et al. Indoor Air Quality in Schools of a Highly Polluted South Mediterranean Area. Indoor Air 2019, 29, 276–290. [Google Scholar] [CrossRef]
  44. Decreto Ministeriale 18/12/1975. Norme Tecniche Aggiornate Relative All’edilizia Scolastica, Ivi Compresi gli Indici di Funzionalità Didattica, Edilizia ed Urbanistica, da Osservarsi Nella Esecuzione di Opere di Edilizia Scolastica. 1975. Vol. Gazzetta Ufficiale n. 29 del 02/02/1976. Available online: http://anagrafeediliziascolastica.regione.marche.it/mappla/documentiedilizia/DM_18121975.pdf (accessed on 28 April 2019).
  45. Nabinger, S.; Persily, A. Impacts of airtightening retrofits on ventilation rates and energy consumption in a manufactured home. Energy Build. 2011, 43, 3059–3067. [Google Scholar] [CrossRef]
  46. European Committee for Standardisation. EN ISO 52016-1:2017. Energy Performance of Buildings—Energy Needs for Heating and Cooling, Internal Temperatures and Sensible and Latent Heat Loads—Part 1: Calculation Procedures; European Committee for Standardisation: Brussels, Belgium, 2017. [Google Scholar]
  47. Decreto Interministeriale 26/06/2015. Applicazione Delle Metodologie di Calcolo Delle Prestazioni Energetiche e Definizione delle Prescrizioni e dei Requisiti minimi Degli Edifici. 2015. Vol. Gazzetta Ufficiale n. 162 del 15/07/2015. Available online: https://www.gazzettaufficiale.it/eli/id/2015/07/15/15A05198/sg (accessed on 28 April 2019).
  48. International Organization for Standardization. ISO 9972—Thermal Performance of Buildings—Determination of Air Permeability of Buildings—Fan Pressurization Method. 2015. Available online: https://www.sis.se/api/document/preview/922341/ (accessed on 28 April 2019).
  49. International Organization for Standardization. ISO 12569:2017. Thermal Performance of Buildings and Materials—Determination of Specific Airflow Rate in Buildings—Tracer Gas Dilution Method; ISO: Geneva, Switzerland, 2017. [Google Scholar]
  50. d’Ambrosio Alfano, F.R.; Dell’Isola, M.; Ficco, G.; Tassini, F. Experimental analysis of air tightness in Mediterranean buildings using the fan pressurization method. Build. Environ. 2012, 53, 16–25. [Google Scholar] [CrossRef]
  51. d’Ambrosio Alfano, F.R.; Ficco, G.; Palella, B.I.; Riccio, G.; Ranesi, A. An Experimental Investigation on the Air Permeability of Passive Ventilation Grilles. Energy Procedia 2015, 78, 2869–2874. [Google Scholar] [CrossRef]
  52. d’Ambrosio Alfano, F.R.; Dell’Isola, M.; Ficco, G.; Palella, B.I.; Riccio, G. Experimental air-tightness analysis in mediterranean buildings after windows retrofit. Sustainability 2016, 8, 991. [Google Scholar] [CrossRef]
  53. Stabile, L.; Frattolillo, A.; Dell’Isola, M.; Massimo, A.; Russi, A. Air Permeability of Naturally Ventilated Italian Classrooms. Energy Procedia 2015, 78, 3150–3155. [Google Scholar] [CrossRef]
  54. Bekö, G.; Gustavsen, S.; Frederiksen, M.; Bergsøe, N.C.; Kolarik, B.; Gunnarsen, L.; Toftum, J.; Clausen, G. Diurnal and seasonal variation in air exchange rates and interzonal airflows measured by active and passive tracer gas in homes. Build. Environ. 2016, 104, 178–187. [Google Scholar] [CrossRef]
  55. Biler, A.; Unlu Tavil, A.; Su, Y.; Khan, N. A Review of Performance Specifications and Studies of Trickle Vents. Buildings 2018, 8, 152. [Google Scholar] [CrossRef]
  56. Howard-Reed, C.; Wallace, L.A.; Ott, W.R. The Effect of Opening Windows on Air Change Rates in Two Homes. J. Air Waste Manag. Assoc. 2002, 52, 147–159. [Google Scholar] [CrossRef]
  57. Wallace, L.A.; Emmerich, S.J.; Howard-Reed, C. Continuous measurements of air change rates in an occupied house for 1 year: The effect of temperature, wind, fans, and windows. J. Exposure Anal. Environ. Epidemiol. 2002, 12, 296–306. [Google Scholar] [CrossRef]
  58. Mahyuddin, N.; Awbi, H.B. A Review of CO2 Measurement Procedures in Ventilation Research. Int. J. Vent. 2012, 10, 353–370. [Google Scholar] [CrossRef]
  59. International Organization for Standardization. ISO 52003-1:2017. Energy Performance of Buildings—Indicators, Requirements, Ratings and Certificates—Part 1: General Aspects and Application to the Overall Energy Performance. 2017. Available online: https://www.sis.se/api/document/preview/921997/ (accessed on 28 April 2019).
  60. Decreto del Presidente della Repubblica 412/1993. Regolamento Recante Norme per la Progettazione, L’installazione, L’esercizio e la Manutenzione Degli Impianti Termici Degli Edifici ai Fini del Contenimento dei Consumi di Energia, in Attuazione dell’art. 4, Comma 4, Della L. 9 Gennaio 1991, n. 1. 1993. Vol. Gazzetta Ufficiale n. 242 del 14/10/1993. Available online: https://www.gazzettaufficiale.it/eli/id/1993/10/14/093G0451/sg (accessed on 28 April 2019).
  61. International Organization for Standardization. ISO 15927-6. Hygrothermal Performance of Buildings—Calculation and Presentation of Climatic Data—Part 6: Accumulated Temperature Differences (Degree-Days). Available online: https://www.sis.se/api/document/preview/909034/ (accessed on 28 April 2019).
  62. Dubrul, C. Inhabitant Behaviour with Respect to Ventilation—A Summary Report of IEA Annex VIII; Air Infiltration and Ventilation Centre: Coventry, UK, 1988. [Google Scholar]
  63. Persily, A.K.; Linteris, G.T. A comparison of measured and predicted infiltration rates. ASHRAE Trans. 1983, 89. [Google Scholar]
  64. Sherman, M.H. Estimation of infiltration from leakage and climate indicators. Energy Build. 1987, 10, 81–86. [Google Scholar] [CrossRef]
  65. Asif, A.; Zeeshan, M.; Jahanzaib, M. Indoor temperature, relative humidity and CO2 levels assessment in academic buildings with different heating, ventilation and air-conditioning systems. Build. Environ. 2018, 133, 83–90. [Google Scholar] [CrossRef]
  66. Krawczyk, D.A.; Rodero, A.; Gładyszewska-Fiedoruk, K.; Gajewski, A. CO2 concentration in naturally ventilated classrooms located in different climates—Measurements and simulations. Energy Build. 2016, 129, 491–498. [Google Scholar] [CrossRef]
  67. Shendell, D.G.; Prill, R.; Fisk, W.J.; Apte, M.G.; Blake, D.; Faulkner, D. Associations between classroom CO2 concentrations and student attendance in Washington and Idaho. Indoor Air 2004, 14, 333–341. [Google Scholar] [CrossRef]
  68. Cornaro, C.; Paravicini, A.; Cimini, A. Monitoring Indoor Carbon Dioxide Concentration and Effectiveness of Natural Trickle Ventilation in a Middle School in Rome. Indoor Built Environ. 2013, 22, 445–455. [Google Scholar] [CrossRef]
  69. Heebøll, A.; Wargocki, P.; Toftum, J. Window and door opening behavior, carbon dioxide concentration, temperature, and energy use during the heating season in classrooms with different ventilation retrofits—ASHRAE RP1624. Sci. Technol. Built Environ. 2018, 24, 626–637. [Google Scholar] [CrossRef]
  70. Azara, A.; Dettori, M.; Castiglia, P.; Piana, A.; Durando, P.; Parodi, V.; Salis, G.; Saderi, L.; Sotgiu, G. Indoor Radon Exposure in Italian Schools. Int. J. Environ. Res. Public Health 2018, 15, 749. [Google Scholar] [CrossRef]
  71. Mazaheri, M.; Reche, C.; Rivas, I.; Crilley, L.R.; Álvarez-Pedrerol, M.; Viana, M.; Tobias, A.; Alastuey, A.; Sunyer, J.; Querol, X.; et al. Variability in exposure to ambient ultrafine particles in urban schools: Comparative assessment between Australia and Spain. Environ. Int. 2016, 88, 142–149. [Google Scholar] [CrossRef]
  72. Reche, C.; Viana, M.; Rivas, I.; Bouso, L.; Alvarez-Pedrerol, M.; Alastuey, A.; Sunyer, J.; Querol, X. Outdoor and indoor UFP in primary schools across Barcelona. Sci. Total Environ. 2014, 493, 943–953. [Google Scholar] [CrossRef]
  73. Viana, M.; Rivas, I.; Querol, X.; Alastuey, A.; Álvarez-Pedrerol, M.; Bouso, L.; Sioutas, C.; Sunyer, J. Partitioning of trace elements and metals between quasi-ultrafine, accumulation and coarse aerosols in indoor and outdoor air in schools. Atmos. Environ. 2015, 106, 392–401. [Google Scholar] [CrossRef]
Figure 1. Maps of Cassino and identification of the school.
Buildings 09 00110 g001
Figure 2. Test-classroom scheme: dimensions in brackets are representative of the height.
Buildings 09 00110 g002
Figure 3. CO2 trends measured during the free-running ventilation tests (crowding index of about 2.2 m2 person−1).
Buildings 09 00110 g003
Figure 4. Box-plot of CO2 concentrations measured/estimated for the different ventilation scenarios for the same crowding index (2.2 m2 person−1). Dashed boxes represent estimated values, whereas solid boxes are used for measured values.
Buildings 09 00110 g004
Figure 5. CO2 trends measured during manual airing tests (MA 1, MA 2, and MA 3), estimated for natural ventilation (NV), manual airing (MA EN 1) and mechanical ventilation (MV EN 1) for the same crowding index (2.2 m2 person−1). Dashed lines represent estimated values, whereas solid lines are used for measured values.
Buildings 09 00110 g005
Figure 6. Comparison between the CO2 concentration (trends and box-plots) measured (experimental) and simulated through the mass balance equation for the manual airing test with scheduled window openings of 15 min every hour (MA 2)
Buildings 09 00110 g006
Figure 7. CO2 trends estimated manual airing (MA EN 1–MA EN 4) and mechanical ventilation (MV EN 1–MV EN 4) as a function of the crowding index of the classroom when the same air exchange rate is adopted.
Buildings 09 00110 g007
Table 1. Stratigraphy and thermophysical parameters of the building envelope opaque components.
Opaque ComponentStratigraphyU Value (W m−2 K−1)
outer walls
  • inner layer of lime/gypsum plaster
  • concrete and hollow clay bricks
  • outer layer of lime/gypsum plaster
0.72
floor
  • concrete slab
  • concrete bricks
1.10
roof
  • concrete slab
  • waterproof coat
  • ceramic tiles
0.99
Table 2. Summary and details of the ventilation scenarios investigated.
Ventilation ScenariosTestMethodologyCrowding Index
(m2 person−1)
Natural ventilationNV
(simulated)
CO2 concentration estimates carried out on the basis of CO2 mass balance equation considering the air exchange rate just relying on leakages of the classroom envelope (no manual door/window airing).2.2
Free-running ventilationFRV 1
FRV 2
FRV 3
FRV 4
FRV 5
(experimental)
Five different CO2 concentration measurements performed during school-time. No airing procedures were imposed. The windows were opened by classroom occupants according to their air quality perception. Short door opening periods were just allowed.2.2
Manual airingMA 1
MA 2
MA 3
(experimental)
Three different CO2 concentration measurements performed during school-time imposing scheduled windows opening periods: 10 min h−1 (MA 1), 15 min h−1 (MA 2), and 20 min h−1 (MA 3).2.2
MA EN 1
MA EN 2
MA EN 3
MA EN 4
(simulated)
CO2 concentration estimates carried out on the basis of CO2 mass balance equation considering measured air exchange rates and ventilation rates established by the EN 15251 standard [19].MA EN 1: 2.2
MA EN 2: 2.0
MA EN 3: 1.8
MA EN 4: 1.6
Constant air volume mechanical ventilationMV EN 1
MV EN 2
MV EN 3
MV EN 4
(simulated)
CO2 concentration estimates carried out on the basis of CO2 mass balance equation and ventilation rates established by the EN 15251 standard [19]. A steady-state ventilation flow rate was considered throughout the school-time.MV EN 1: 2.2
MV EN 2: 2.0
MV EN 3: 1.8
MV EN 4: 1.6
Table 3. Median values of air exchange rates (n), CO2 concentrations and energy needs (QH,ve, QH,nd) measured/estimated for the test-classroom under different ventilation scenarios.
Ventilation ScenariosTestn
(h−1)
CO2
(ppm)
QH,ve
(MJ)
QH,nd
(MJ)
QH,ve/QH,ndEnergy Saving with Respect to Manual Airing Imposed by Standard (%)
Natural ventilationNV0.22 °2783
(782–4064)
1.80 × 10341.9 × 1034%33%
Free-running ventilationFRV 10.43 Δ2078
(766–3377)
3.51 × 10343.6 × 1038%30%
FRV 20.55 Δ2044
(814–2922)
4.49 × 10344.6 × 10310%29%
FRV 30.60 Δ1777
(770–2809)
4.90 × 10345.0 × 10311%28%
FRV 40.63 Δ2272
(805–2778)
5.12 × 10345.3 × 10311%28%
FRV 50.88 Δ1859
(723–2952)
7.18 × 10347.3 × 10315%24%
Manual airingMA 10.75 *1482
(700–2044)
6.09 × 10346.2 × 10313%26%
MA 21.01 *1310
(710–1791)
8.23 × 10348.3 × 10317%23%
MA 31.27 *1085
(579–1688)
10.4 × 10350.5 × 10321%19%
MA EN 12.76 912
(792–1090)
22.5 × 10362.6 × 10336%-
Mechanical ventilationMV EN 12.76 965
(716–966)
2.25 × 10342.4 × 1035%32%
Δ estimated on the basis of the window opening and closing periods reported by the questionnaires filled out by the teachers. * estimated on the basis of the window opening and closing periods imposed through the airing strategies. imposed by the EN 15251 standard [19] considering the method based on ventilation rate per person (building category III). ° median value obtained from the decay tests with windows and doors closed (ndecay_close). energy saving calculated hypothesizing a heat recovery efficiency of 90%.
Table 4. Comparison between manual airing and mechanical ventilation tests in terms of CO2 concentrations and energy needs (QH,ve, QH,nd) estimated for the test-classroom for different required values of air exchange rates (n).
n
(h−1)
Manual Airing TestCO2
(ppm)
QH,nd
(MJ)
Mechanical Ventilation TestCO2
(ppm)
QH,nd
(MJ)
Energy Saving (%) ΔCO2 Difference (%) °
2.76MA EN 1912
(782–1090)
62.6 × 10³MV EN 1965
(716–966)
42.4 × 10332%*
3.00MA EN 2959
(849–1153)
64.6 × 10³MV EN 2978
(735–978)
42.6 × 10334%*
3.24MA EN 31033
(922–1244)
66.7 × 10³MV EN 3988
(753–988)
42.7 × 10336%4%
3.57MA EN 41141
(1030–1142)
69.2 × 10³MV EN 4998
(775–999)
43.0 × 10338%13%
imposed by the EN 15251 standard [19] considering the method based on ventilation rate per person (building category III). Δ energy saving evaluated as (QH,nd_mechanical − QH,nd_airing)/QH,nd_airing. ° CO2 difference evaluated as (CO2_mechanical − CO2_airing)/CO2_airing. * not statistically different (p < 0.01).

