Article

Experimental Investigation on Aging and Energy Savings Evaluation of High Solar Reflective Index (SRI) Paints: A Case Study on Residential Households in the GCC Region

by
Tirumala Uday Kumar Nutakki
1,*,
Waqar Ullah Kazim
1,
Kadhim Alamara
2,
Tareq Salameh
3 and
Mohammad Ali Abdelkareem
3
1
RAK Research and Innovation Center, American University of Ras Al Khaimah (AURAK), Ras Al Khaimah P.O. Box 10021, United Arab Emirates
2
School of Engineering, American University of Ras Al Khaimah (AURAK), Ras Al Khaimah P.O. Box 10021, United Arab Emirates
3
Department of Sustainable and Renewable Energy Engineering, College of Engineering, University of Sharjah, Sharjah P.O. Box 27272, United Arab Emirates
*
Author to whom correspondence should be addressed.
Buildings 2023, 13(2), 419; https://doi.org/10.3390/buildings13020419
Submission received: 23 November 2022 / Revised: 28 January 2023 / Accepted: 31 January 2023 / Published: 2 February 2023
(This article belongs to the Section Building Materials, and Repair & Renovation)

Abstract

:
Energy-efficient retrofitting of building envelopes is necessary to reduce global carbon emissions and to reach net-zero goals. Cooling energy demand-dominated countries in the GCC region require simple and effective strategies to reduce building sector energy loads. One such approach is using high solar reflective index (SRI) paints to retrofit building roofs and walls. However, the hot and desert conditions of the region pose a barrier to maintaining consistent radiative properties throughout their life cycle. To this extent, research is limited in the region. The novelty of this work is to qualitatively assess the aging characteristics of high SRI or cool paints and estimate the energy savings for their application in residential buildings. The work encompasses comprehensive lab, pilot, and real-scale experimental studies combined with theoretical modeling for dynamic evaluation. Dynamic simulations enabled to determine the time-dependent aging effect on the energy savings performance of the building retrofitted with cool roof and wall paints. A case study on a townhouse in UAE showed annual energy savings of 34% considering cool roofs, walls, and window films. Aging studies showed SRI reduction of 36% and 25%, respectively, for cool roofs and walls during the first 3 years. The corresponding energy-saving reductions ranged from 31 to 44% for the white roof to dark wall colors. Using the initial values of SRI in energy models overestimates saving by 10% per year. Considering the aging effects, this work provides insights into cool paint retrofit potential on energy, economic savings, and CO2 reductions for four major cities in the GCC region.

1. Introduction

The Paris Climate Conference in 2015 (COP21) led to an international climate agreement to keep global warming at 1.5–2 °C [1]. This necessitated the use of sustainable practices across the traditional fossil fuel-consuming sectors such as power generation, transportation, buildings, and manufacturing. The International Energy Agency’s (IEA) special report on net-zero emissions by 2050 emphasizes strengthening and implementing various nations’ energy efficiency and climate policies. Particular attention should be directed toward the buildings sector, which is responsible for one-third of global CO2 emissions [2]. In the past two decades, vast measures and strict implementation of building energy codes and regulations in large economies such as the United States of America (USA), United Kingdom (UK), the European Union (EU), China, and India enabled a reduction in building energy usage and corresponding CO2 emissions. However, during this period, Middle East nations experienced two-fold growth in building energy usage in commercial and residential buildings [3]. In fact, in 2019, the Middle East stood top as the highest per-capita consumer of electrical energy in buildings among non-OCED counties, leading the countries in the region to be the highest contributor to CO2 emission per capita [4]. One of the region’s most significant contributors to energy consumption in buildings is air-conditioning (AC) systems. In Abu-Dhabi, United Arab Emirates (UAE), the energy consumed by buildings is 80% of the total electricity consumption, and 70% of this energy is used for air conditioning [5]. Similar cooling energy consumptions between 60–70% are reported for other countries in the Gulf co-operative council (GCC), e.g., Bahrain, Qatar, Saudi Arabia, and Kuwait [6,7,8,9].

1.1. Building Energy Regulations in GCC Related to Mitigation of Urban Heat Island Effect

Many GCC nations are currently adapting building energy codes or regulations to benchmark and set requirements for various building design elements enabling cooling demand reduction [10]. One of the regulations is to mitigate the urban heat island (UHI) effect, as studies show that buildings’ cooling loads can increase up to 50% due to UHI alone [11]. UHI is envisaged as a future challenge for hot climatic conditions accompanied by increased cooling energy demand in the megacities of the GCC [12]. Therefore, building codes stipulated mandatory regulations against the UHI through adopting various retrofit strategies such as using solar reflective materials, improved shading and ambient cooling through urban vegetation, and use of high albedo surfaces. In addition to mitigating the UHI effect, these strategies can reduce building cooling loads [13]. Table 1 lists clauses and requirements stipulated by various building energy codes and regulations in the GCC region related to UHI and relevant requirements for high solar reflective index (SRI) materials applied for building envelopes [14,15,16,17,18,19,20,21].
As shown in Table 1, the mandatory use of opaque external roofing surfaces complying with a minimum roof Solar Reflective Index (SRI) value is one of the retrofit strategies mentioned as being implemented in GCC countries. High Solar Reflective Index (SRI) materials, also called “cool” materials, are used to reduce the solar heat gain on building roofs and other surfaces [22]. It is a very cost-effective method that could help reduce the urban heat island effect, thereby improving outdoor thermal comfort [23]. As per the requirements in Table 1, the materials with an initial SRI value of 78 or greater for flat and low-slope roofs and 29 or greater for steep-sloped roof surfaces must be used for the opaque buildings. Cool roof applications in different weather conditions and various building typologies have been proven to reduce cooling loads and improve urban air temperature [24]. For example, a study on multiple commercial building roofs in California, USA, with a 45% increase in solar reflectance enabled a reduction of the peak surface temperatures by 33–42 °C, which in turn reduced 52, 18, and 4% of cooling energy in a department store building, a school building, and cold storage facility, respectively [25].

1.2. Energy Savings Using High Solar Reflective Index Materials for Retrofitting

For many parts of the GCC having hot and arid climatic conditions, the accrued benefits in energy savings using high-SRI materials are even higher [26]. An experimental study in Bahrain assessed the performance of five real roofs, including lightweight concrete, roofing felt, metal sheets, and ceramic tiles. The results show that materials with low thermal mass and high SRI paint material on the surface can reflect large amounts of solar irradiation [26]. For typical roofing of buildings in Saudi Arabia, researchers showed that the replacement of black roofs with cool roofs resulted in annual energy savings of 25% and 34% of total energy loads without and with weekly cleaning, respectively [27]. Likewise, cool walls are another well-known retrofit strategy demonstrated in several climatic conditions with a significant energy savings impact than cool roofs [28]. A simulation study on retrofitting a villa in Abu Dhabi, United Arab Emirates (UAE) showed that combined annual energy savings of 14,785 kW could be obtained using cool roofs (31%) and cool walls (69%) in comparison with a reference villa [28]. However, applying cool walls in buildings is not common in the GCC region, and to that extent, even cool roof applications are not well assessed and adopted in the region due to certain limitations, especially the aging effect on radiative properties.

1.3. Ageing or Long-Term Exposure Effect on High SRI Materials
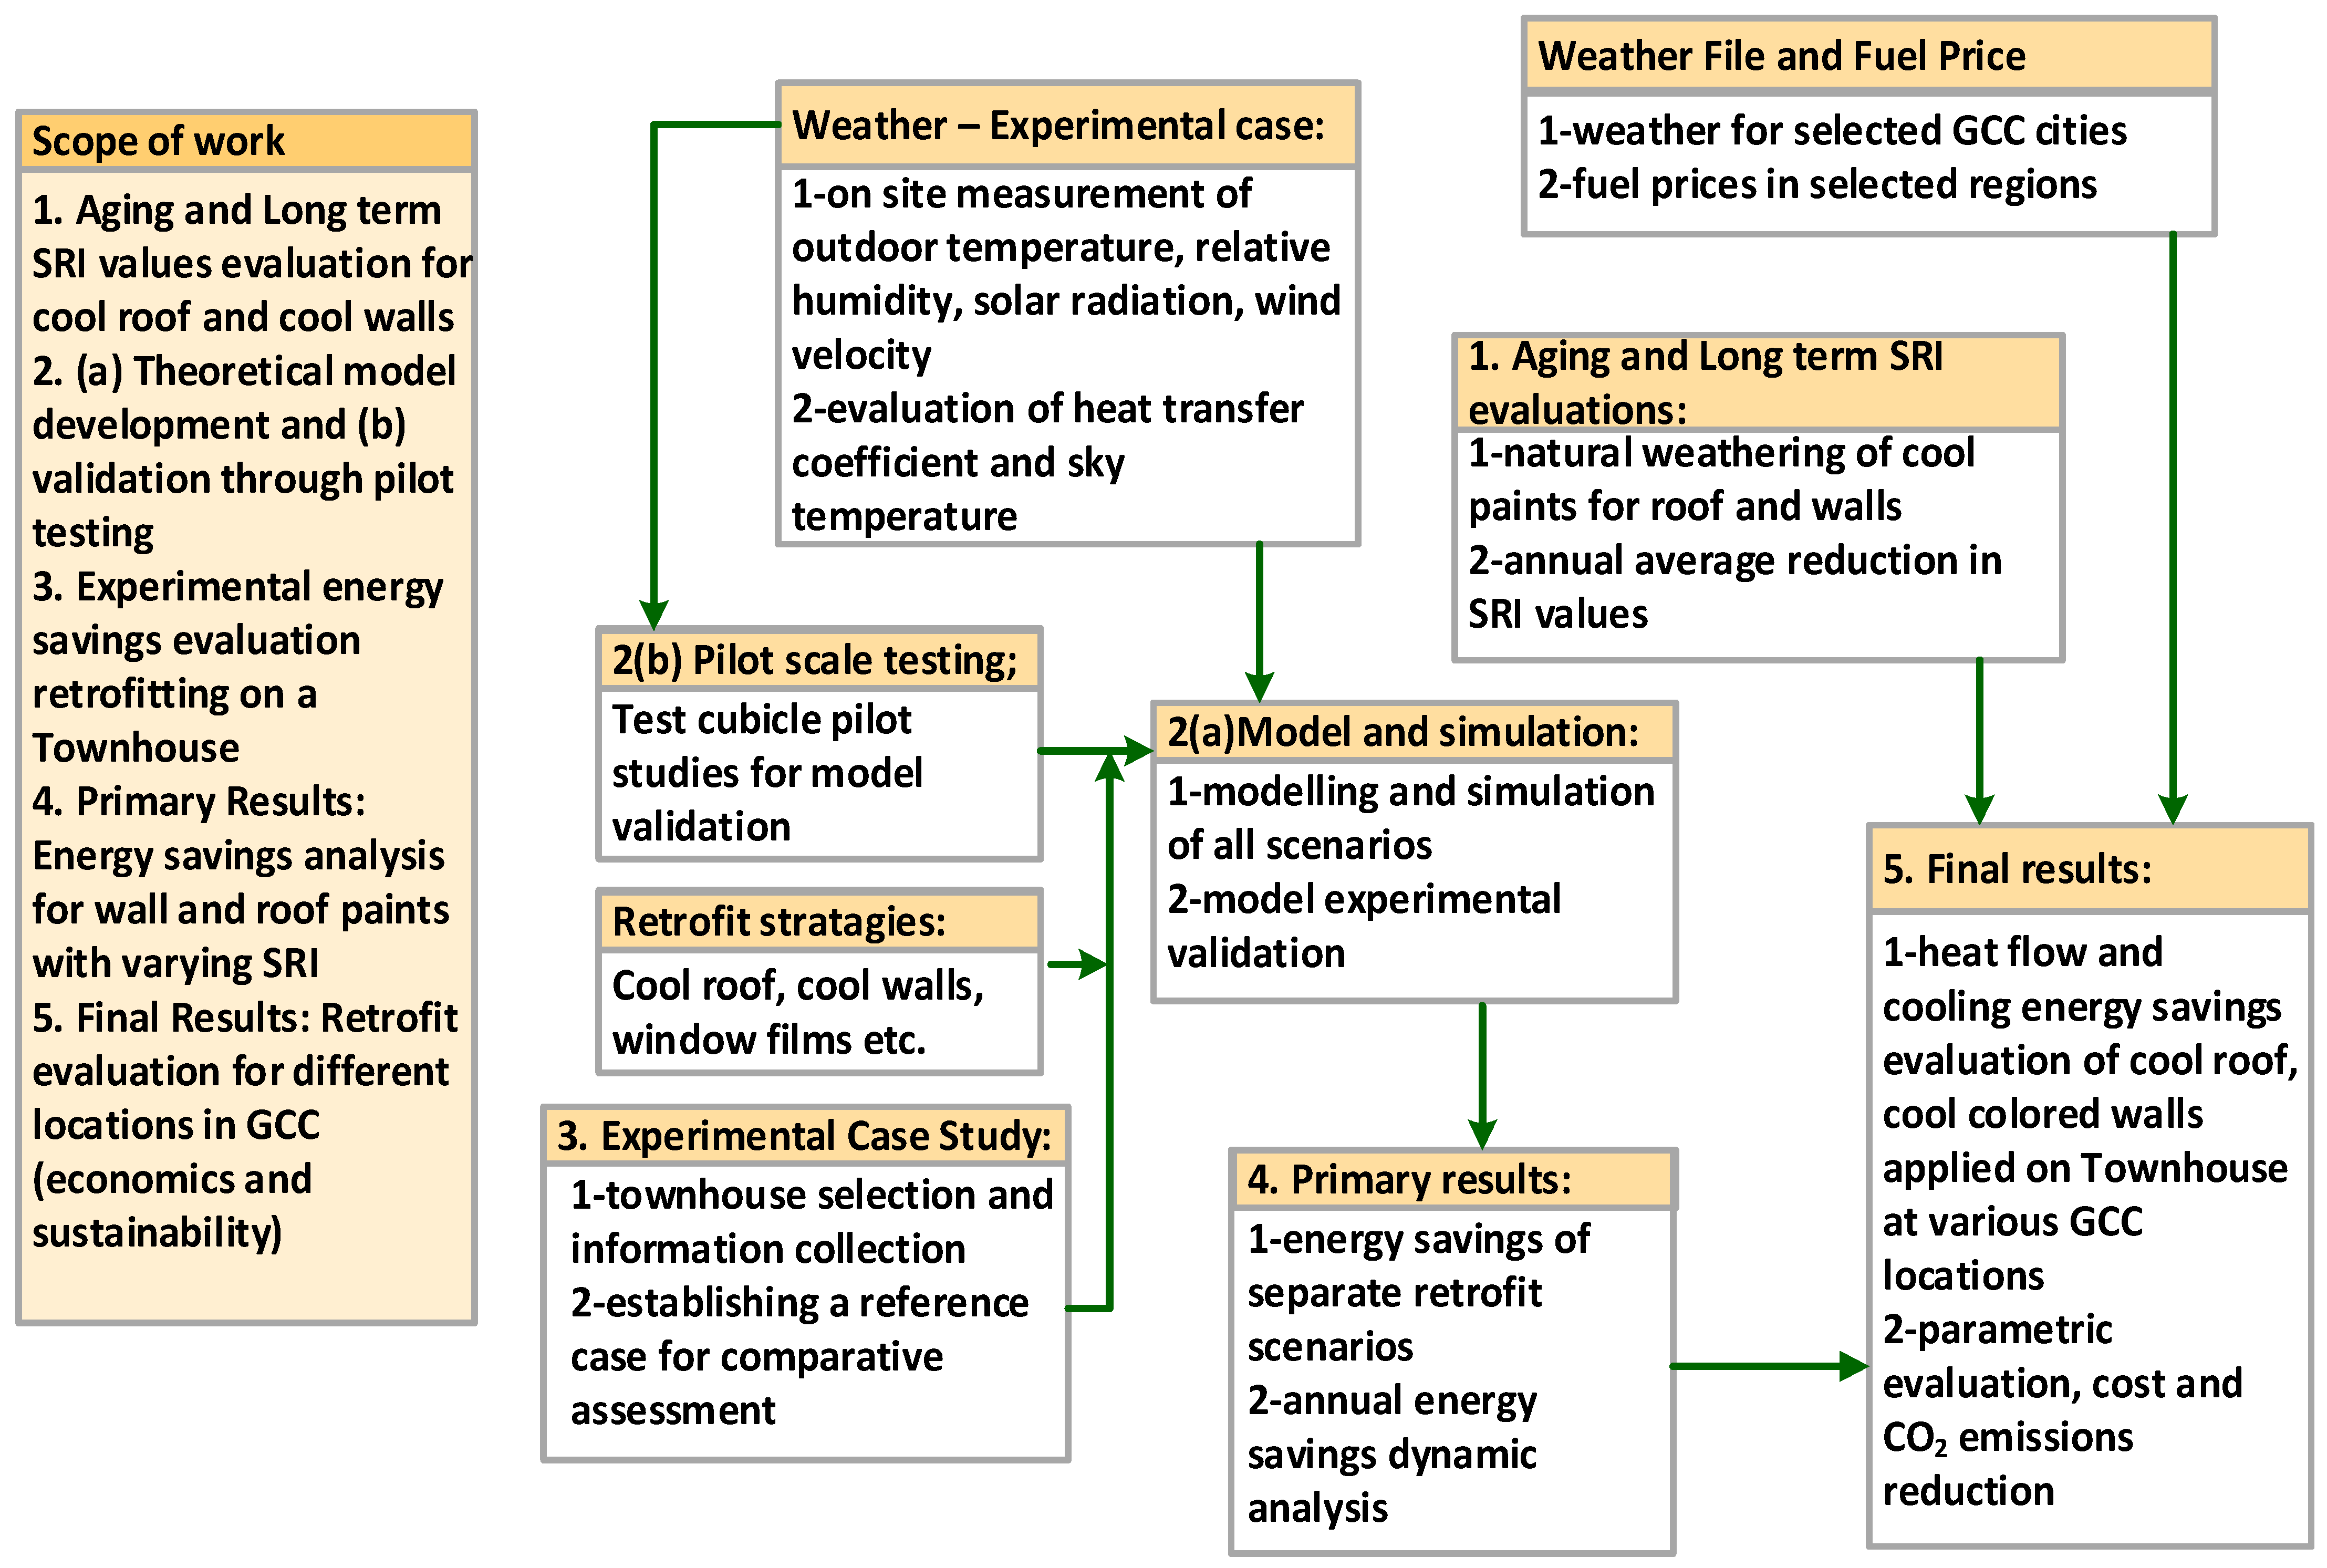
Although the cool roofs and cool walls retrofitting strategy has shown potential cooling load reduction, their long-term performance in terms of consistent energy savings would be challenging due to the harsh climatic conditions in the GCC region. Several studies reveal that the decrease in solar reflectance of roof coatings is a more dynamic and essential factor in evaluating the long-term energy and cost savings potential [29]. A dynamic simulation study on aged and restored cool roofs in Tunisia showed a payback period of 3.4 years and net savings of up to 44.53 Tunisian dirhams/m2 [30]. Moreover, the energy efficiency benefits achieved by retrofitting roofs and walls with cool or high SRI paints can be framed into the sustainable decarbonization process. For example, the high-scale implementation of cool roofs for residential buildings in Andalusia, Spain, could potentially avoid 136,000 metric tons of CO2 emissions every year from the production of electricity [31].
To the best of our knowledge, a gap in the literature exists in the GCC region regarding studies on dynamic assessment and long-term combined energy savings benefits of using cool roofs and cool walls. Notably, the literature does not explore using location-specific SRI value (accounting for both solar reflectance and thermal emittance) and its degradation over time. To this extent, this paper aims to evaluate the effect of aging on the energy performance of both cool roofs and cool walls based on their SRI values experimentally measured at a natural weathering site in UAE [32]. This requires a specific mathematical simulation model incorporating solar reflectance and emittance values and aging patterns to estimate the energy dynamics of the cool roof and cool walls separately and accurately when their SRI values decrease due to the aging effect. As commercial building energy simulation packages do not incorporate this ability, a simple energy model is developed in this work. The novelty of this paper is the dynamic evaluation and long-term assessment (the first 3 years) of cooling energy savings using high SRI paints envisioned practically and theoretically for the region. This paper provides a comprehensive numerical study for the simulation of the energy performance of cool roofs and walls when used to retrofit residential buildings belonging to a housing community in UAE. Further, all the findings reported in the study are validated with lab, pilot, and real-scale experimental work. Experimental investigations are done to determine the aging of cool paints, to validate the numerical model, and to ascertain the energy savings performance of cool roofs and walls through retrofitting an actual residential townhouse building in a housing community of Ras Al Khaimah (RAK), UAE. We considered that the weather of RAK makes this city a good choice representing the GCC to analyze the potential advantages of using high SRI cool roofs and walls in achieving considerable energy and economic savings. Given that the residential housing stock must be energy renovated in order to minimize energy consumption and to achieve indoor comfort conditions, which is especially crucial for housing communities in GCC region, this work attempts to clarify the relevance of adopting cool roofing as an effective method in various GCC counties. The findings of the numerical and experimental study are extended to other geographic scenarios in the GCC region having similar weather conditions to those existing in UAE.

2. Methodology

This study explored the cool roof and cool walls retrofit strategy for a typical townhouse building in the UAE. Experimental lab tests on cool paints, model development, pilot and real-scale building tests for validation, dynamic simulation, and parametric evaluation were carried out in the study. Figure 1 shows the flow chart of the methodology followed in this study organized within five main steps as the scope of the work.

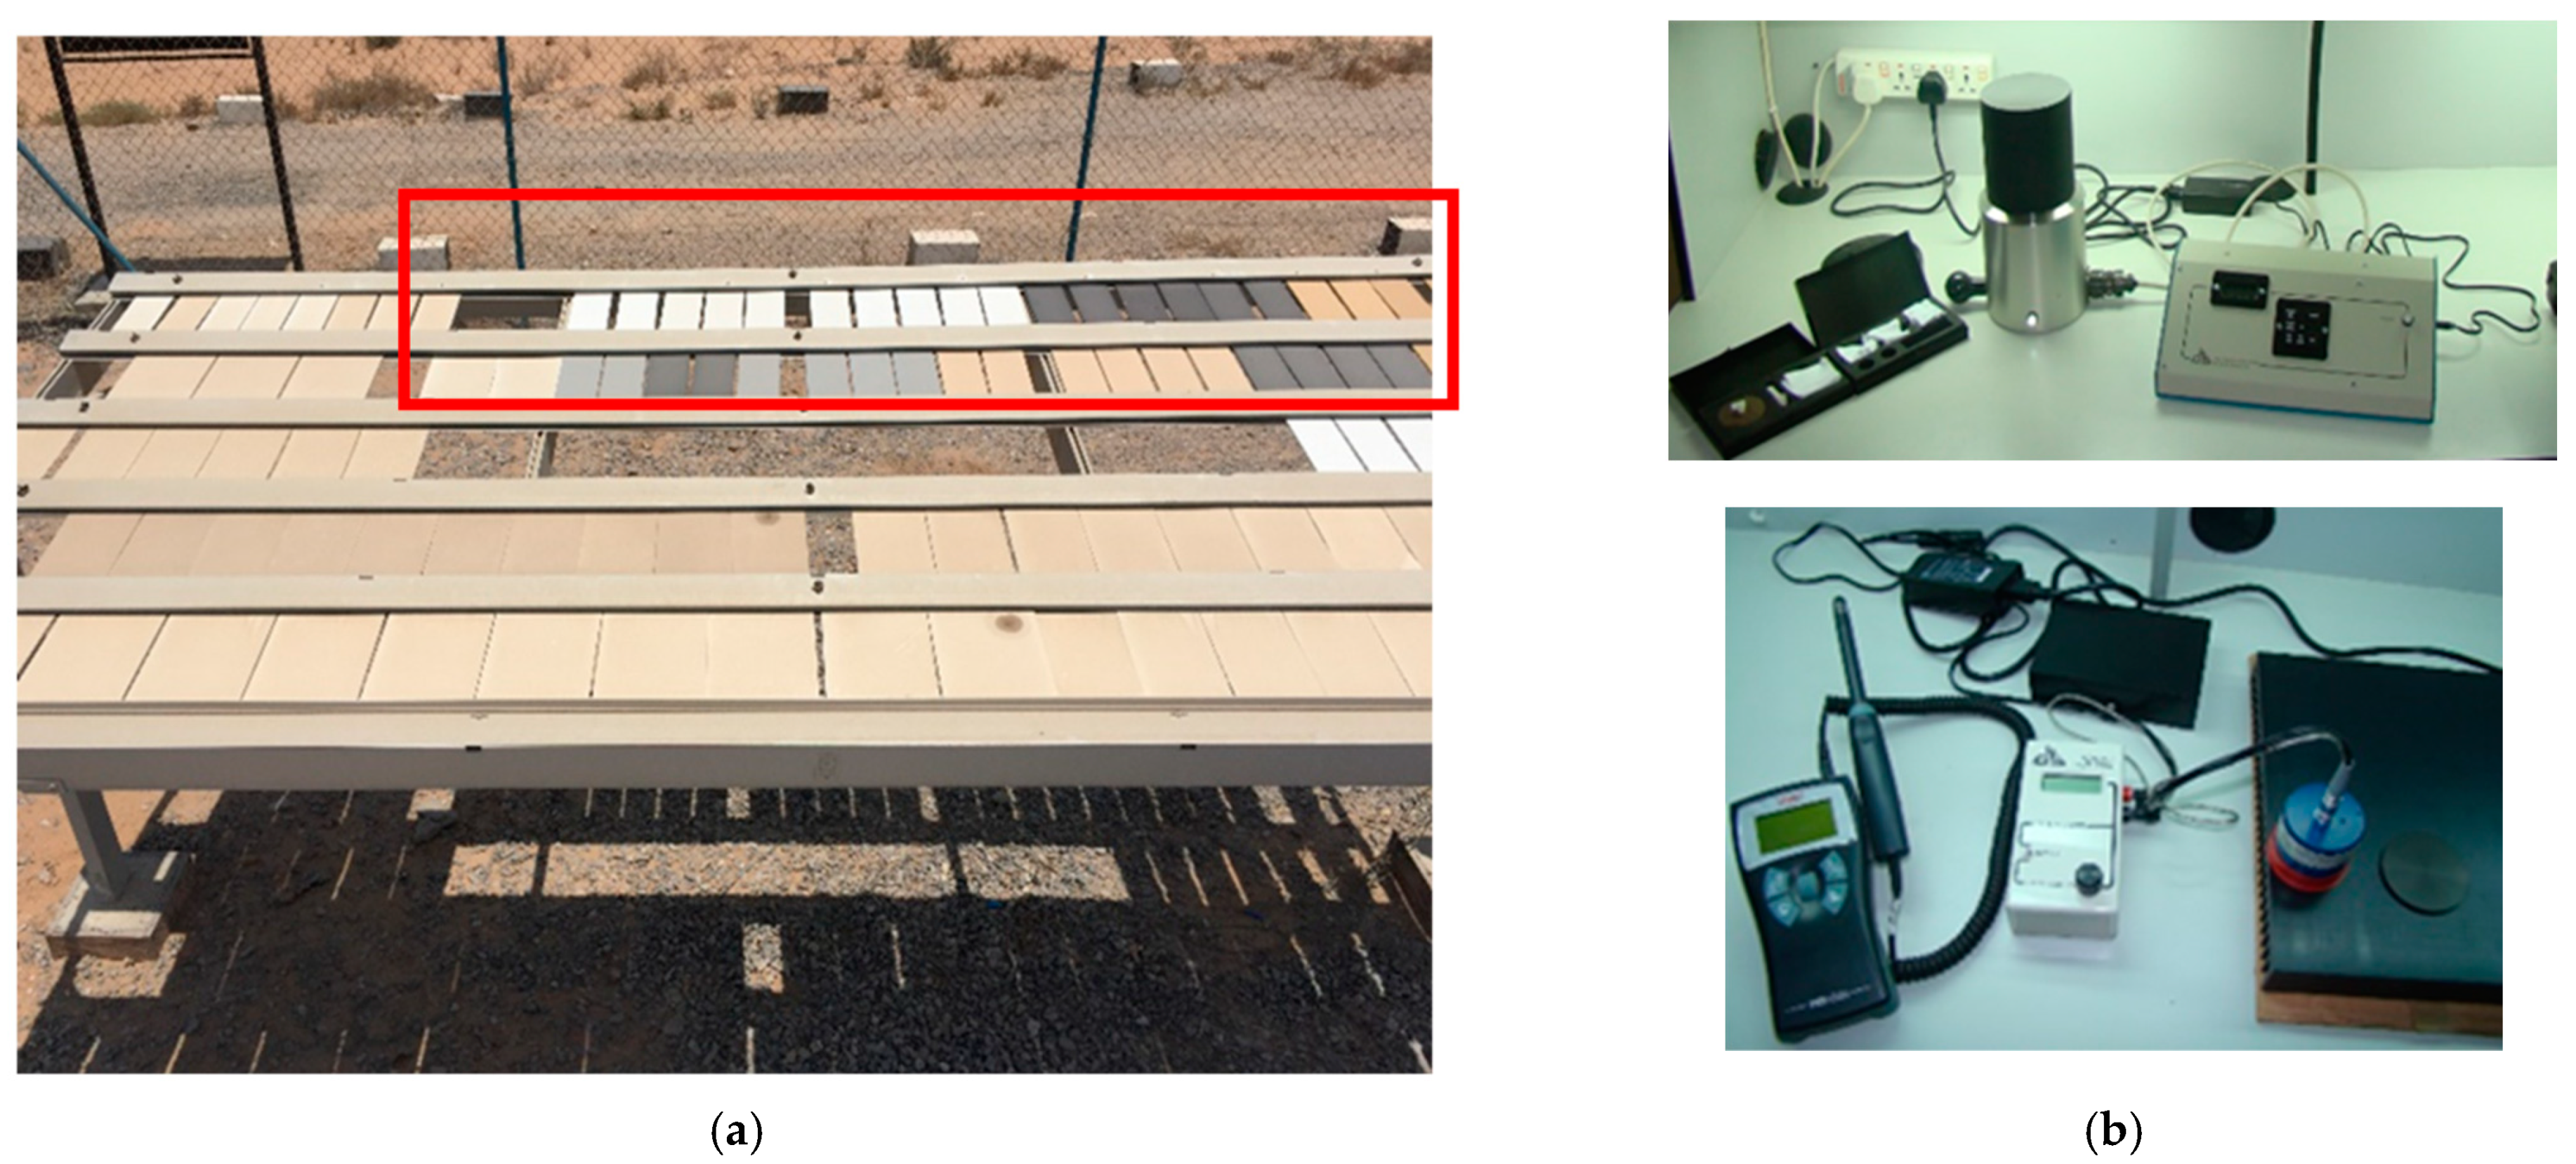
2.1. Natural Weathering and Long-Term SRI Values Evaluation

The major cool roof rating bodies, such as Energy Star, European Cool Roof Council (ECRC), and the US Cool Roof Rating Council (CRRC), prefer natural weathering tests for 3 years to determine the aging effects and long-term performance of the cool paints or coatings. For such an extended period, the loss of the reflective properties of the cool paints needs to be evaluated to adequately determine the energy savings pattern over time [22]. Many factors could lead to the reduction in SRI values; e.g., the loss could depend on the paint’s inherent characteristics and the substrate on which the paint is applied (glass transition temperature, porosity, dust, and water retention capacity) [33]. The reduction in SRI is also influenced by external environmental agents such as dust, rain, airborne contamination, moisture, and sun radiation [34]. The author’s previous work on natural weathering of high SRI paints in UAE shows that the material’s SRI values significantly dropped during the first year of exposure, and the overall reduction is evaluated to be 15–35% throughout 3 years of exposure [22]. The variation could be attributed to the changes in cool paint manufacturers’ formulations and weather factors such as high temperature, UV radiation, low rainfall, and dust accumulation. Another study in Athens, Greece, conducted on the weatherization of cool roofs of school buildings showed a 25% reduction in solar reflectance after four years of exposure [35]. In [36], information compiled through field surveys on unwashed reflective white roof coatings shows that 98% of aging occurs within the first three years of installation, with first-year solar reflectance losses of about 20–25% can be expected. The study concluded that the loss in reflectivity could significantly impact the buildings’ energy efficiency. The energy calculations should be based on at least one-year aged reflectivity values, typically 75–80% of the initial values. Solar-reflectance changes of plus or minus 2% might have a negligible effect on energy efficiency.
This paper aims to conduct a 3-year term energy savings assessment of cool roofs and walls based on the loss in the SRI values (experimentally tested using the ASTM method) each year of exposure [37]. Several white roofing and colored wall paints coated on fiber cement substrate were tested for SRI loss in the natural weathering farm located in UAE according to ASTM standards [38]. Figure 2 shows the picture of various samples exposed to static weathering at the farm (highlighted with red box) and the equipment used for measurements. Solar reflectance and thermal emittance were measured using a portable Solar Spectrum Reflectometer, model SSR–ER, Version 6.4 [39] and Emissometer Model AE1-RD1, respectively (Devices and Services Company, Dallas, TX, USA) [40].
The measurements were carried out before exposure, with periodical measurements every year. Using the solar reflectance and emittance of a test surface, SRI is calculated using the following equation [37].
S R I = 123.97 141.35   χ + 9.655   χ 2
where
χ = ( α 0.029 ε ) ( 8.797 + h c ) 9.5205 ε + h c
  • α = total solar absorptance = 1 − solar reflectance and ε = thermal emittance
  • hc = convective heat transfer coefficient with values of 5, 12, 30 W/m2K, corresponding to low-, medium-, and high-wind conditions, respectively.

2.2. Mathematical Model Formulation

To establish a mathematical model, the equations describing the heat diffusion through different layers of the roof and wall for the radiative heat transfer must be evaluated at each time step [41]. Such evaluation is complex, and when cooling/heating loads are calculated, and comparative assessment is involved, indoor conditions are assumed to be constant. However, dynamics in outdoor climatic conditions need to be considered to determine realistic cooling load estimation, especially when the annual, monthly, and daily variations are of considerable magnitude [42].
In this study, for heat flux analysis, one-dimensional heat conduction through the roof and walls was considered. The high SRI paint surface absorptivity (1 − solar reflectance) correlated with the paint surface temperature using the sol-air model. It is notable that resembling the effect of high SRI paints on the heat transfer from the exterior roof or walls, Tsol-air was used as the modified ambient temperature [43]. In this way, both the solar absorptance α, and emissivity ε of the surfaces were considered. These values are for concrete, cement, or regular paint before applying the cool paint, and the values for high SRI after the application are considered [44].
Further, in the hot climatic conditions of the UAE or GCC region, active heating is not necessary, and the benefit from thermal insulation using high SRI cool roofs or walls is obtained when the ambient temperature rises above the AC set point temperature. Therefore, the heat flow during the cooling degree hours (CDH) was considered in this study for determining the cooling energy saving. The total daily heat gain through a surface can be obtained from Equation (3) by summing up the amount of heat flow in each CDH of the day [43].
Q ˙ d a y = n h i ,   n A n ( T   n ( L , t ) T i , j )
in which An is the surface area and Tn (L,t) is the surface temperature of the nth element (including roof and walls) at the room side at time t. Tn is then determined by solving the one-dimensional transient heat conduction expression [45],
ρ n C p , n T n t = κ   2 T n x 2
where ρ is the density, Cp is the heat capacity, and k is the thermal conductivity of the elements. To solve Equation (4), boundary conditions are required for the external and internal surfaces of the building.
κ T x ( 0 ,   t ) = h o   ( T s o l a i r T o ( 0 ,   t )
κ T x ( L ,   t ) = h i   ( T ( L , t ) T i
in which To (0, t) represents outdoor temperature, Ti represents building indoor temperature, Tsol-air represents the external surface temperature obtained as follows,
T s o l a i r , n = T o + α n E T h o σ   ε n   ( T o 4 T s k y 4 )   h o
where ET is the radiation incident on the surface, αn and εn are the surface absorptance and emittance of the nth element (roof and walls), respectively. σ is Stephan–Boltzmann’s constant, and Tsky is the sky temperature calculated based on the dew point temperature (dew point is obtained using the correlation with relative humidity).
Internal convective heat transfer coefficient (CHTC), hi is taken as 8.3 W/m2K, which is often used in building heat transfer calculations and is recommended by ASHRAE [46]. Outdoor CHTC (ho) in Equations (5) and (7) is determined using the following correlation requiring hourly average wind velocity (vo) [47].
      h 0 = 10.5 + 4.5 v o
The reduction in daily heat flow through the wall and roofs compared with a non-retrofitted or base case building is obtained by Equation (9).
Δ Q d a y = Q d a y b a s e Q d a y c o o l
The daily electric power demand reduction for the air-conditioning is obtained using the following equation;
Δ P e l e c = Δ Q d a y S E E R   o r   C O P
In addition to the heat gain determination through the walls and roof, additional heat loads through the windows and heat gain due to occupancy and openings are also considered in this study to compare the AC energy consumption form the model with the actual energy consumption of the townhouse. Table 2 lists the equations for heat gain through windows, infiltration, and internal heat gain (occupancy, lighting, and appliances). The number of air changes is 0.4 per hour. The average heat released by each person is assumed to be 130 W, and the total heat gained from lighting and appliances is assumed to be 2 kW with a usage factor of 0.5. All the above model equations and radiation model equations are numerically solved using MATLAB, Version 7 to determine the total cooling load and energy savings behavior of cool paints retrofitted townhouses with reference to a base case.

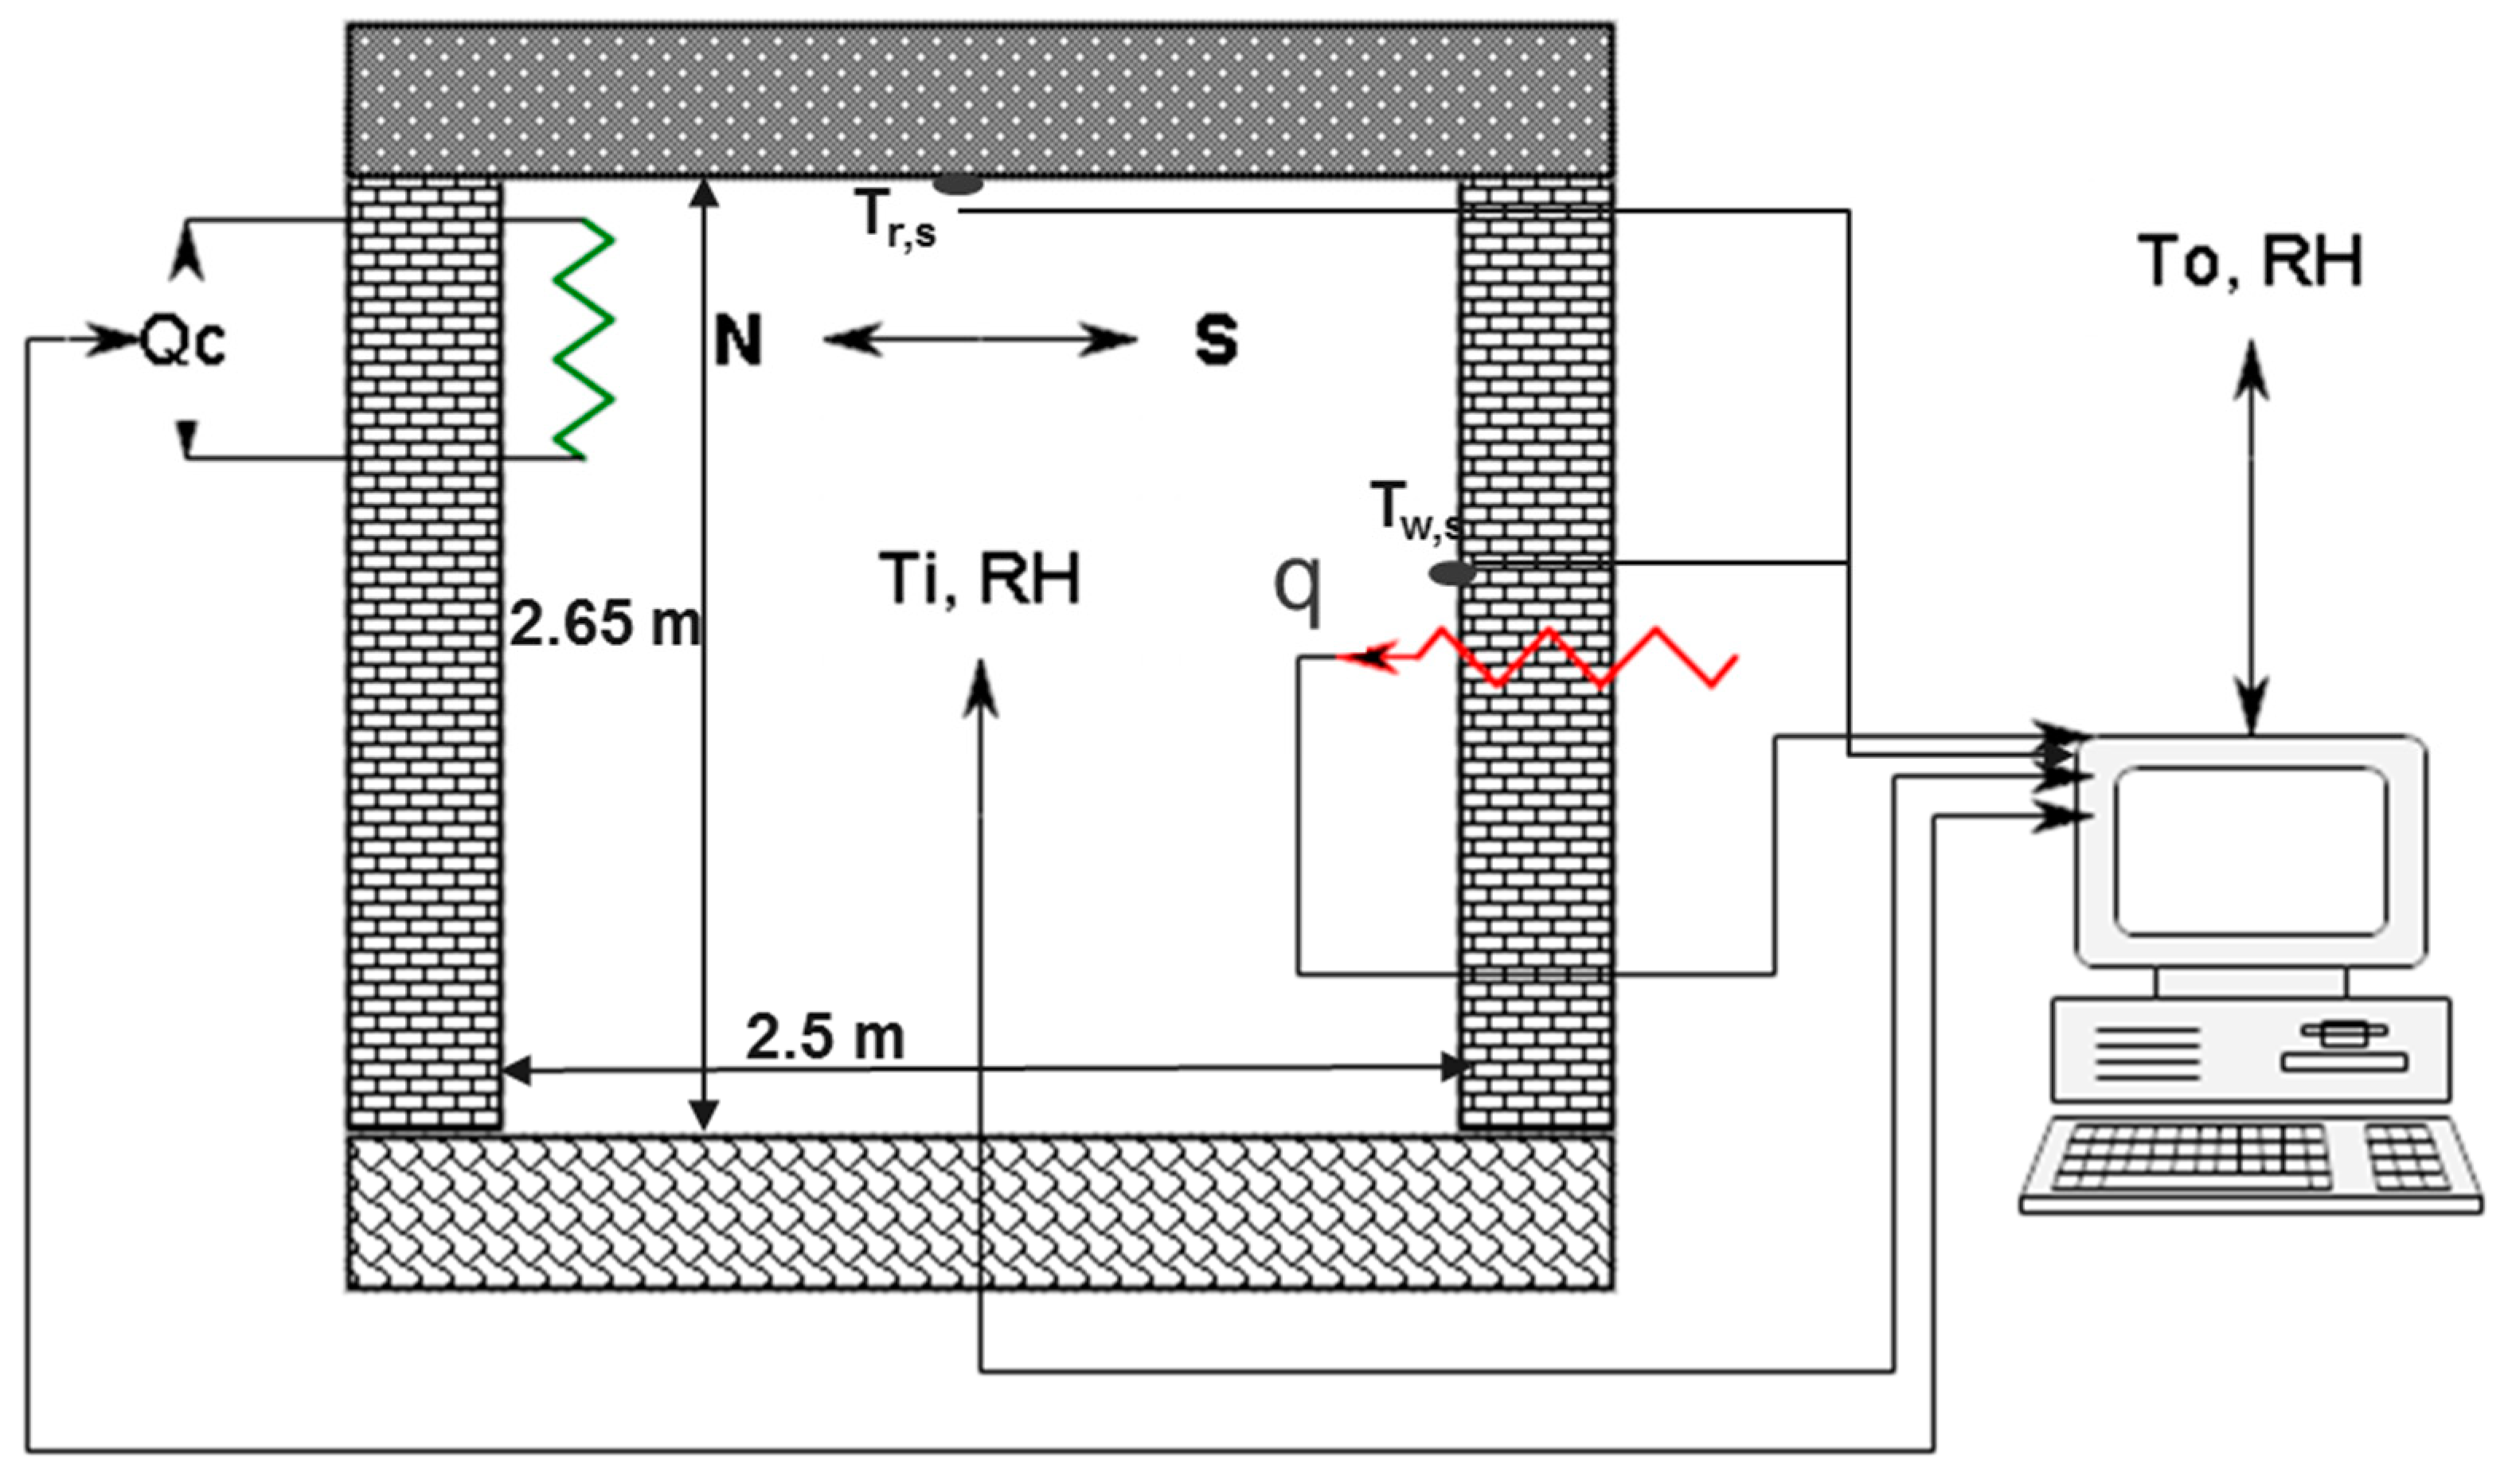
2.3. Pilot Scale Testing

The experimental investigation in this study consists of two stages (pilot and real scale). In the pilot scale testing shown in Figure 3, the reflective roof and wall coatings are applied on an outdoor full-scale test cell located in Ras Al Khaimah, UAE.
The exterior dimensions of the test cell 3 × 3 × 3 m with a concrete roof (15 cm plus 2 cm plaster on each side), hollow block walls (20 cm plus 2 cm plaster on each side) and concrete (15 cm) floor. Figure 3 shows the schematic of the test cubicle with the instrumentation layout. The pilot testing was conducted to determine the heat flux, internal wall, roof temperatures, heat flux, and AC energy consumption at fixed indoor setpoint temperature. The model described earlier in Section 2.2 was validated using the pilot testing facility. More details of the pilot test facility can be found in the author’s previous work [48].

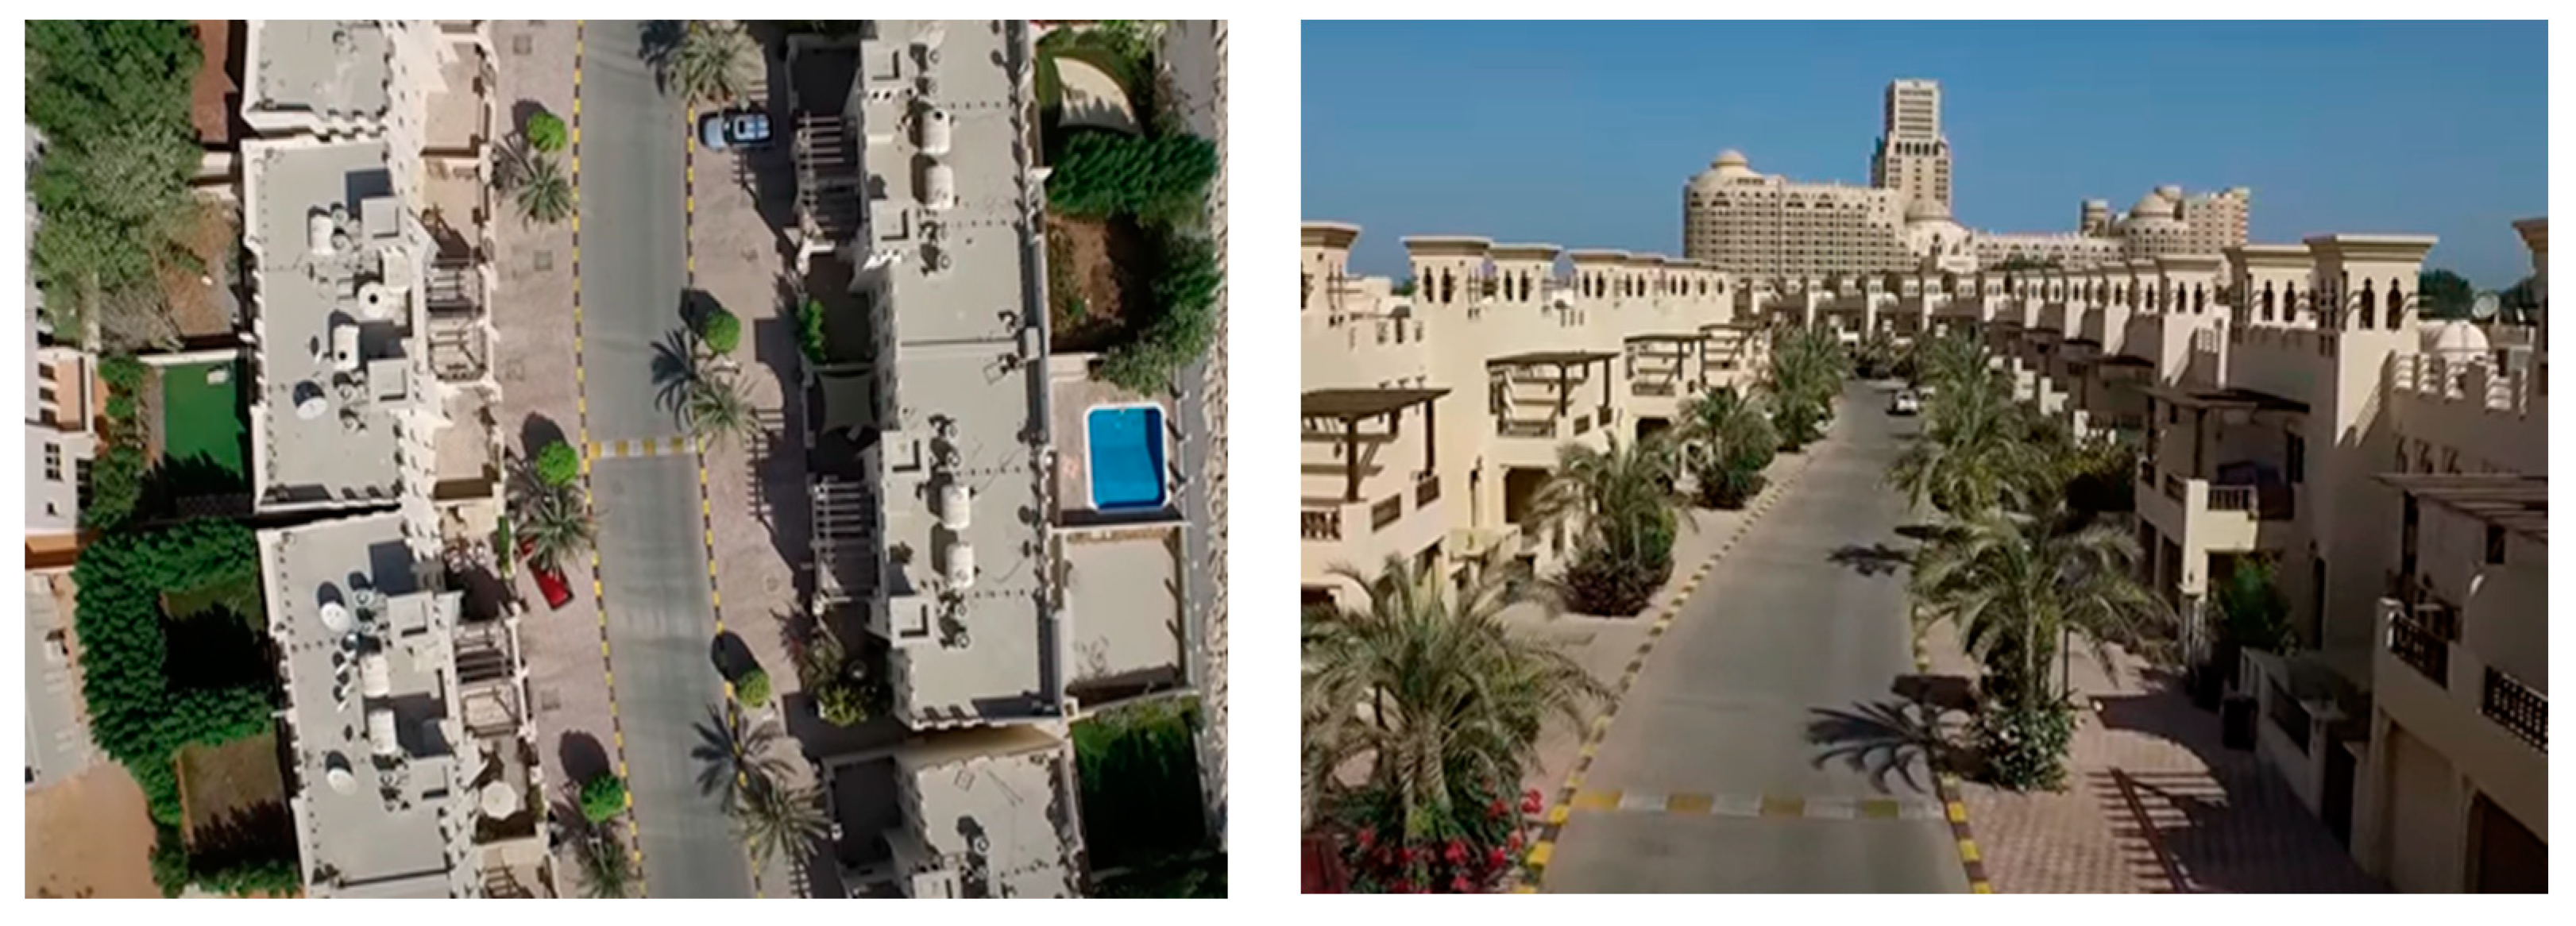
2.4. Experimental Case Study on the Townhouse

For real-scale testing, the townhouse selected and analyzed in this study is located Al Hamra village, Ras Al Khaimah, UAE. In Figure 4, the top and street view layout of the typical townhouse is shown. The buildings are designed for single families, and four members occupied the townhouse during the testing period. The building has two floors with three bedrooms with a total floor space of 192 m2 and a volume of 1190 m3. The building is oriented towards the south, and window to wall ratio (WWR) on the south and north walls is 22% and 44%, respectively. The HVAC system is based on temperature and humidity sensors located at different points of the house. The air conditioning system includes a dehumidifier to keep the relative humidity of the air at comfort levels (30–60%).

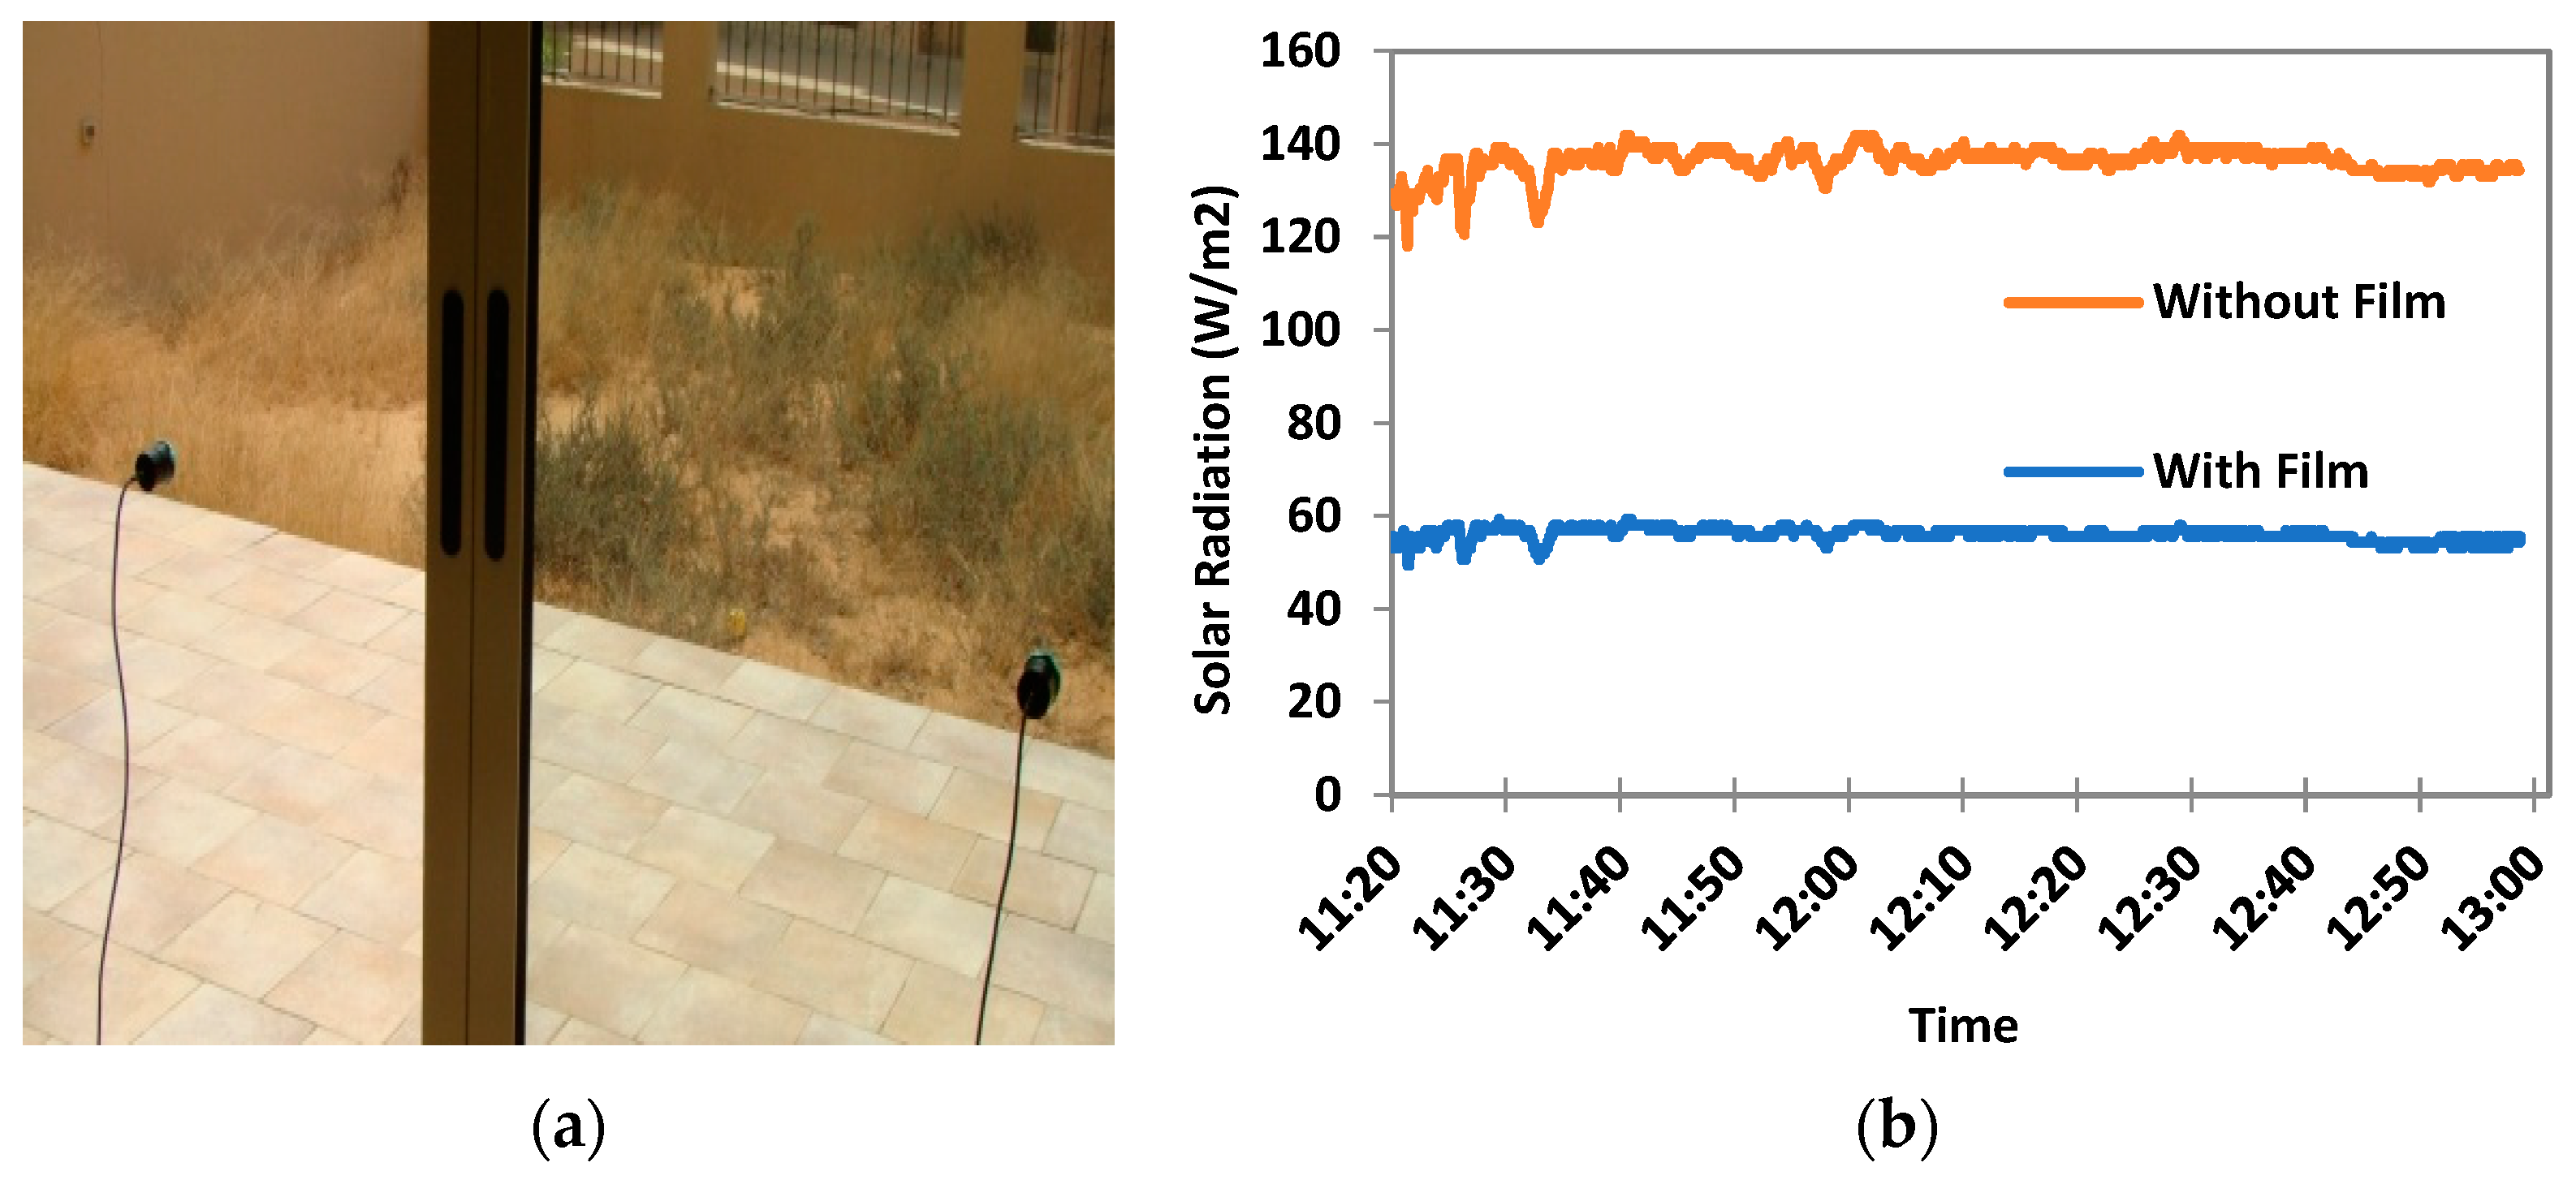
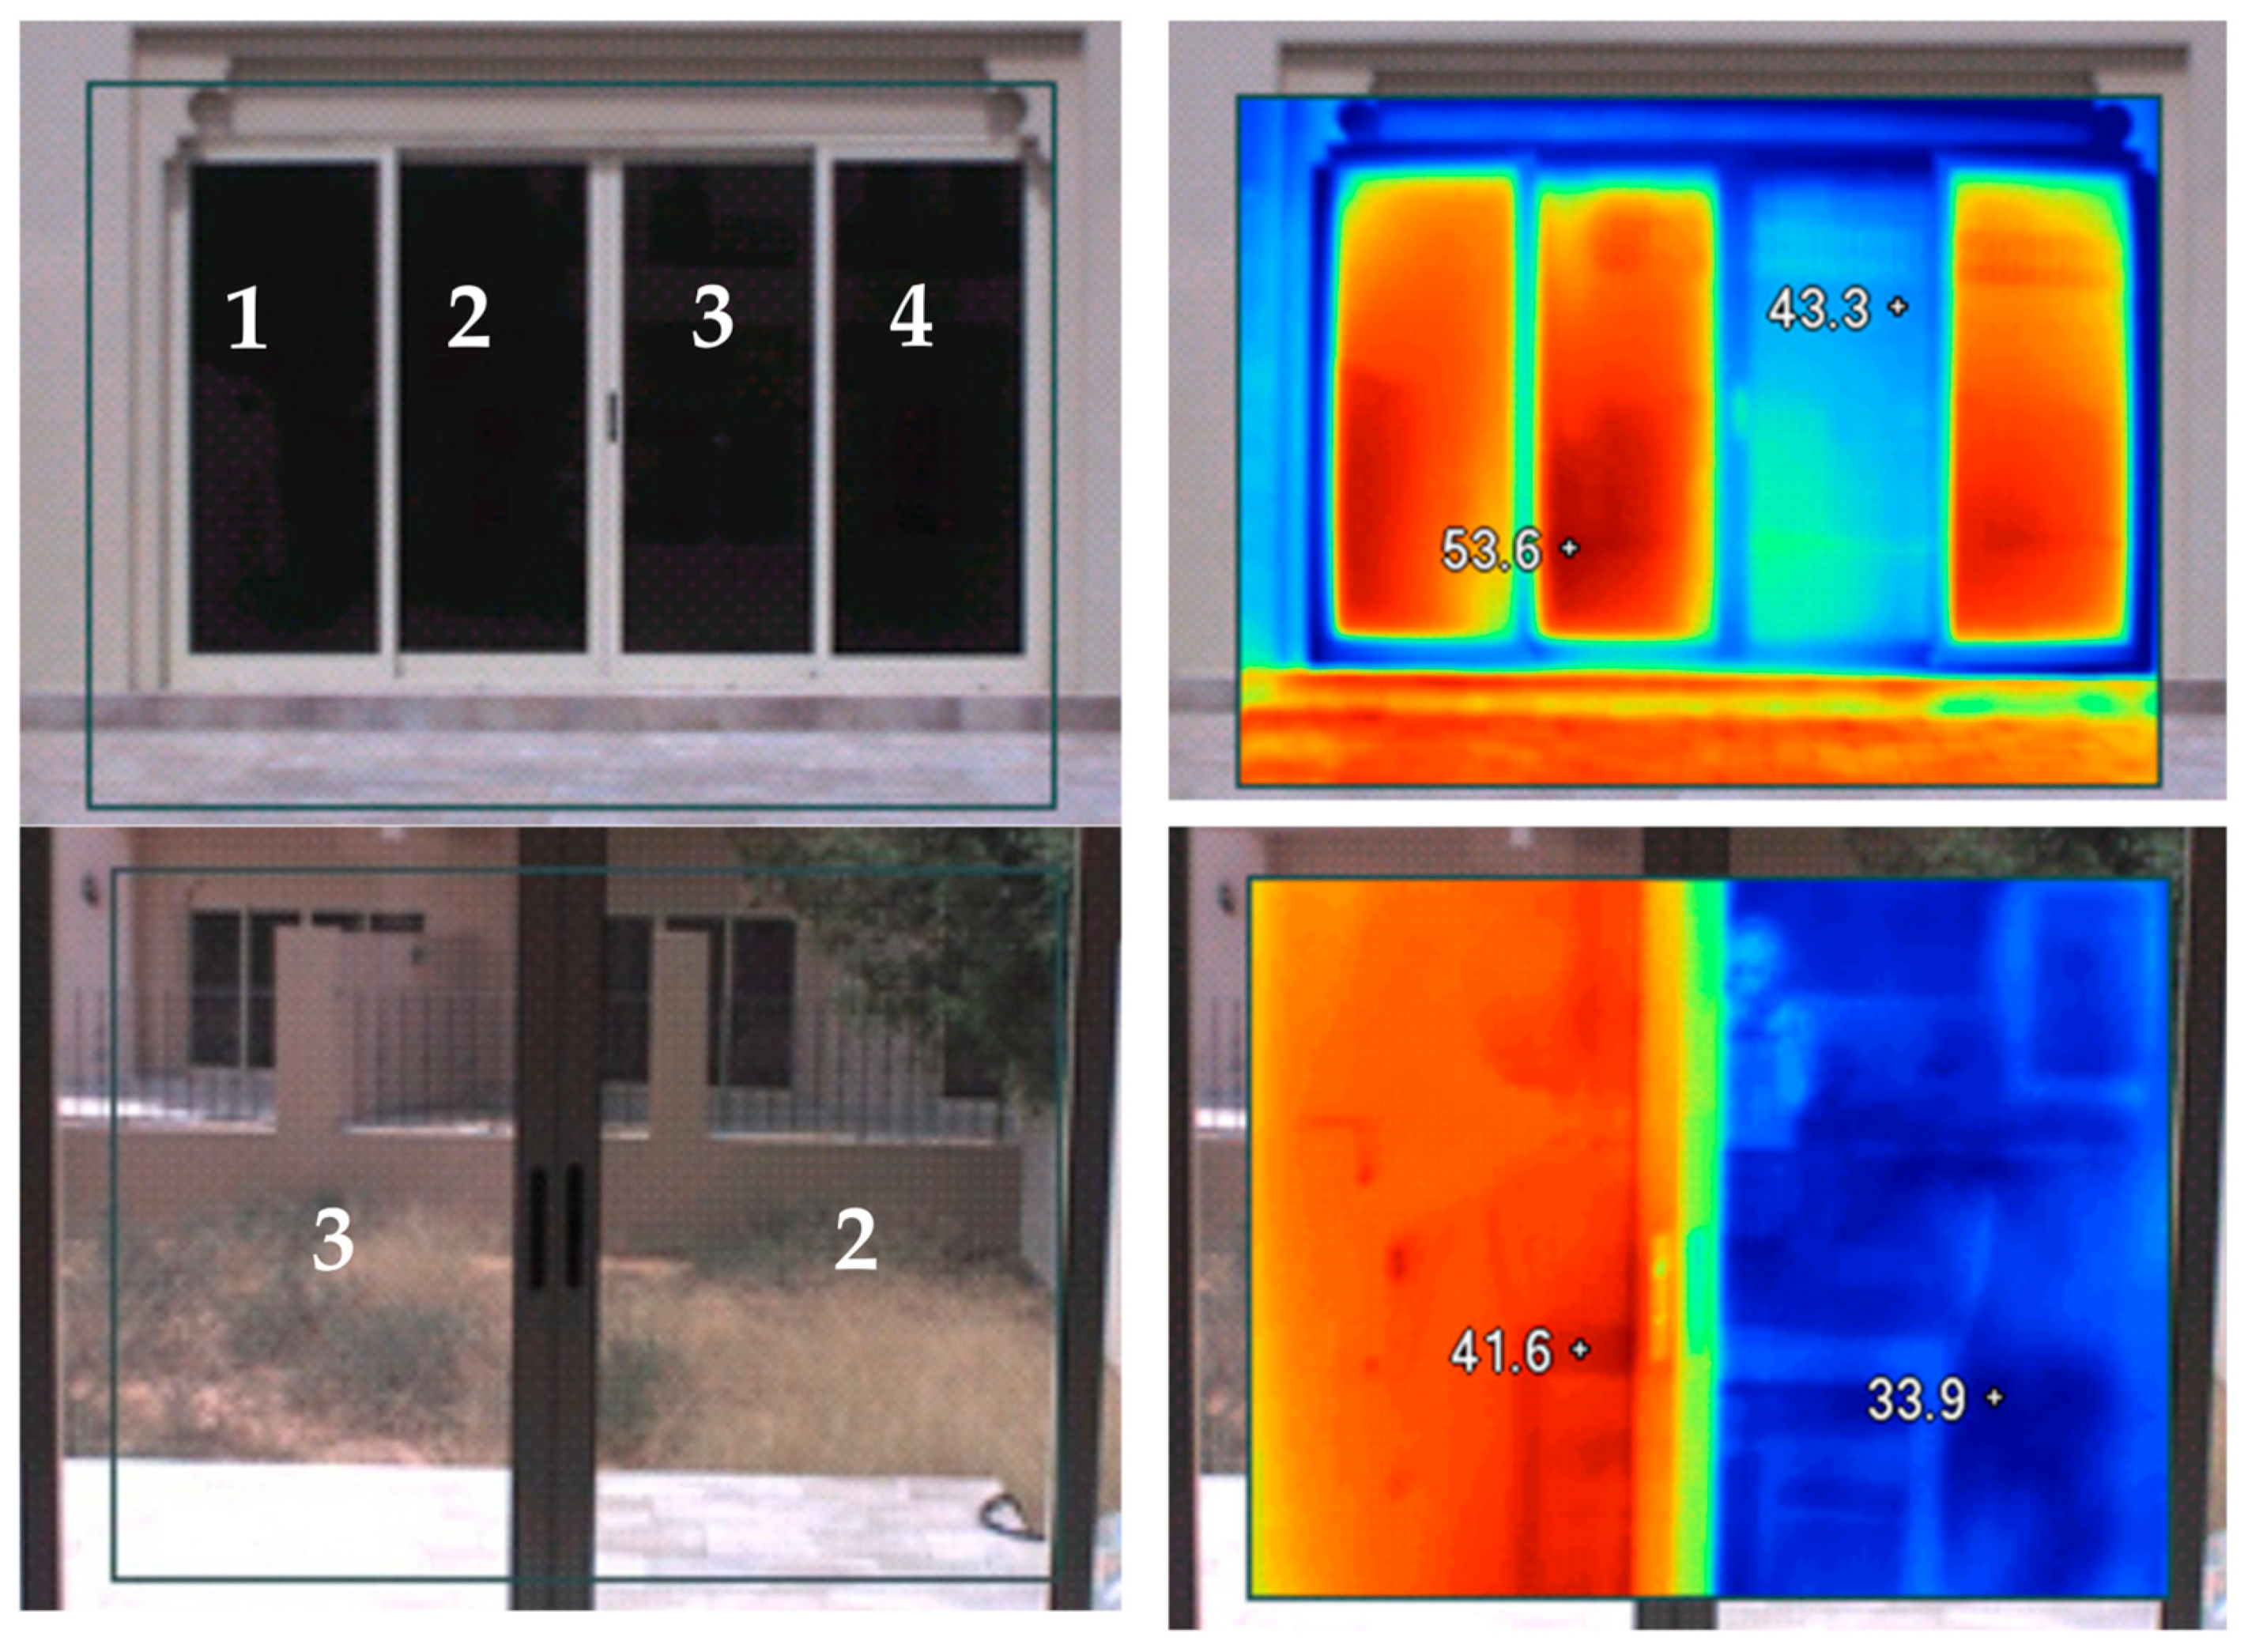
2.4.1. Windows Thermal Insulation Using Films

In addition to retrofitting using high SRI roof and wall paints, the windows were also insulated with thermal films to reduce solar heat gain into the building. The effect of the thermal films, especially the rejection of solar energy gain, depended on the house’s orientation. As the main window surface of the villa was located on the terrace side, the denial of solar radiation energy is more efficient if the terrace is oriented to the east (sunrise exposition) or west (sunset exposition). This is not the case for the test building, whose terrace was oriented to the south. A commercially available thermal film was installed on the windows, which rejects 94% of infrared and 99% of the ultraviolet spectrum and allows 73% of visible light to pass through. These films are installed on the interior side of windows to avoid deterioration due to external weather conditions. To test the performance of the films, two pyranometers (HOBO Micro Station, range: 300 to 1100 nm; resolution: 1.25 W/m2) are installed simultaneously on the interior side of the two windows; one was equipped with the thermal film, and the other without the thermal film, as shown in Figure 5a. Recordings during the installation stage showed a decrease in solar radiation of 59%, as shown in Figure 5b.
During the film installation, pictures were taken using an infrared camera (Fluke Thermal Imager—IR Flexcam Ti45). As shown in Figure 6, when viewed from outside (top row, Figure 6), the thermal imager showed an external surface temperature difference of around 10 °C between windows with film (1, 2, 4) and without (3). Imaging from the inside showed that the window without film (3) had an internal surface temperature higher (around 41.6 °C) than the window equipped with film (2) (about 34 °C). Further, the floor temperatures just behind the windows showed a temperature difference of around 7–8 °C. For the townhouse considered, the windows were located only on the South (Asw = 26.43 m2) and North (Anw = 7.95 m2) sides. The Solar heat gain coefficient (SHGC) for the double-glazing windows with 6 mm thickness was 0.47 and 0.24, respectively, for windows with and without thermal film.

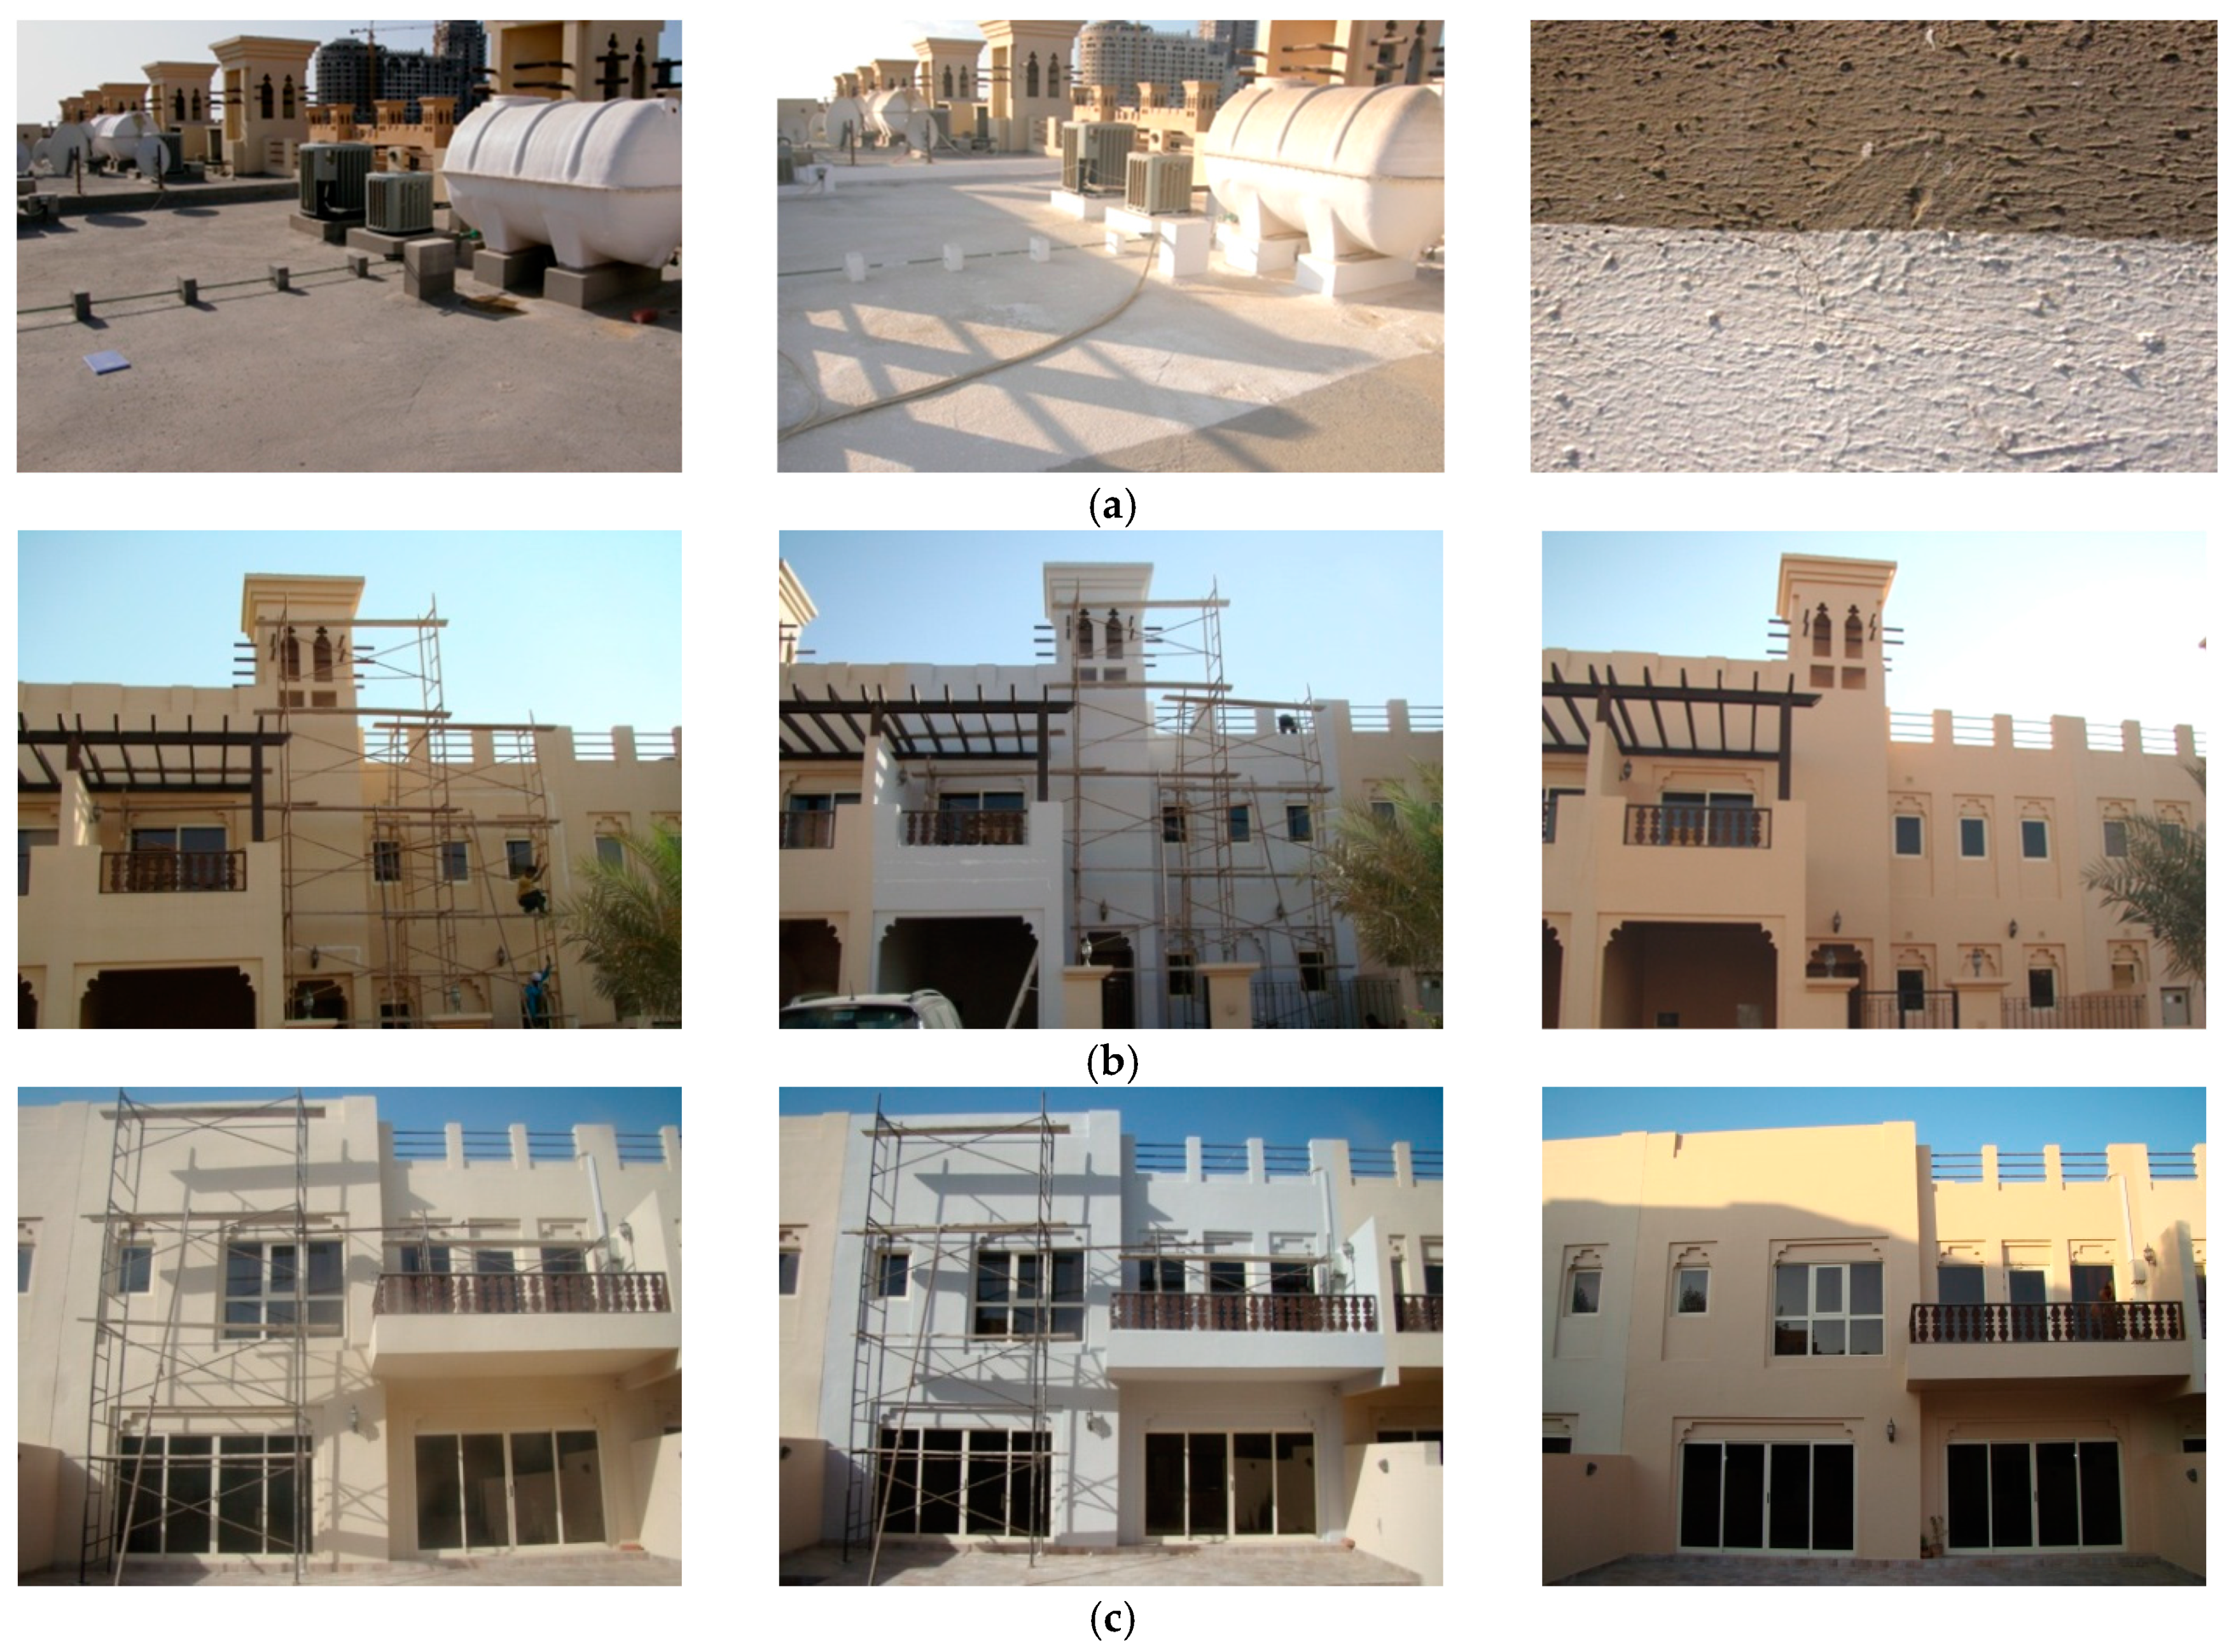
2.4.2. Townhouse Retrofitting with Cool Roof and Walls

The townhouse’s construction material properties and building plans were obtained from the Al Hamra Constructions (property management of the housing community). Table 3 lists the construction material characteristics of the townhouse in RAK used for the study and lists the properties of an Emirati villa model in Abu Dhabi [28]. Figure 7 shows pictures of retrofitting the townhouse with the cool roof and wall paints. The first part of the analysis was to build the base case, which acts as a primary reference model for the townhouse, and the second was to conduct testing on an existing operational townhouse.
As listed in Table 3, the base case townhouse has a roof without cool paint and a reflectance of 0.1 and walls with a reflectance of 0.2. These values are represented as the reference cases, which should be compared with the high SRI cool coatings [29]. The U-values of the roof and walls are dynamic and depend upon the outdoor wind velocity and convective heat transfer coefficient (CHTC). The next step consisted of a comparative assessment of the base case with different scenarios applied in the energy model, such as retrofitting with a cool roof, cool colored walls, window films, and changing the cooling setpoint temperature. All the information provided in Table 3 is included in the model calculations.

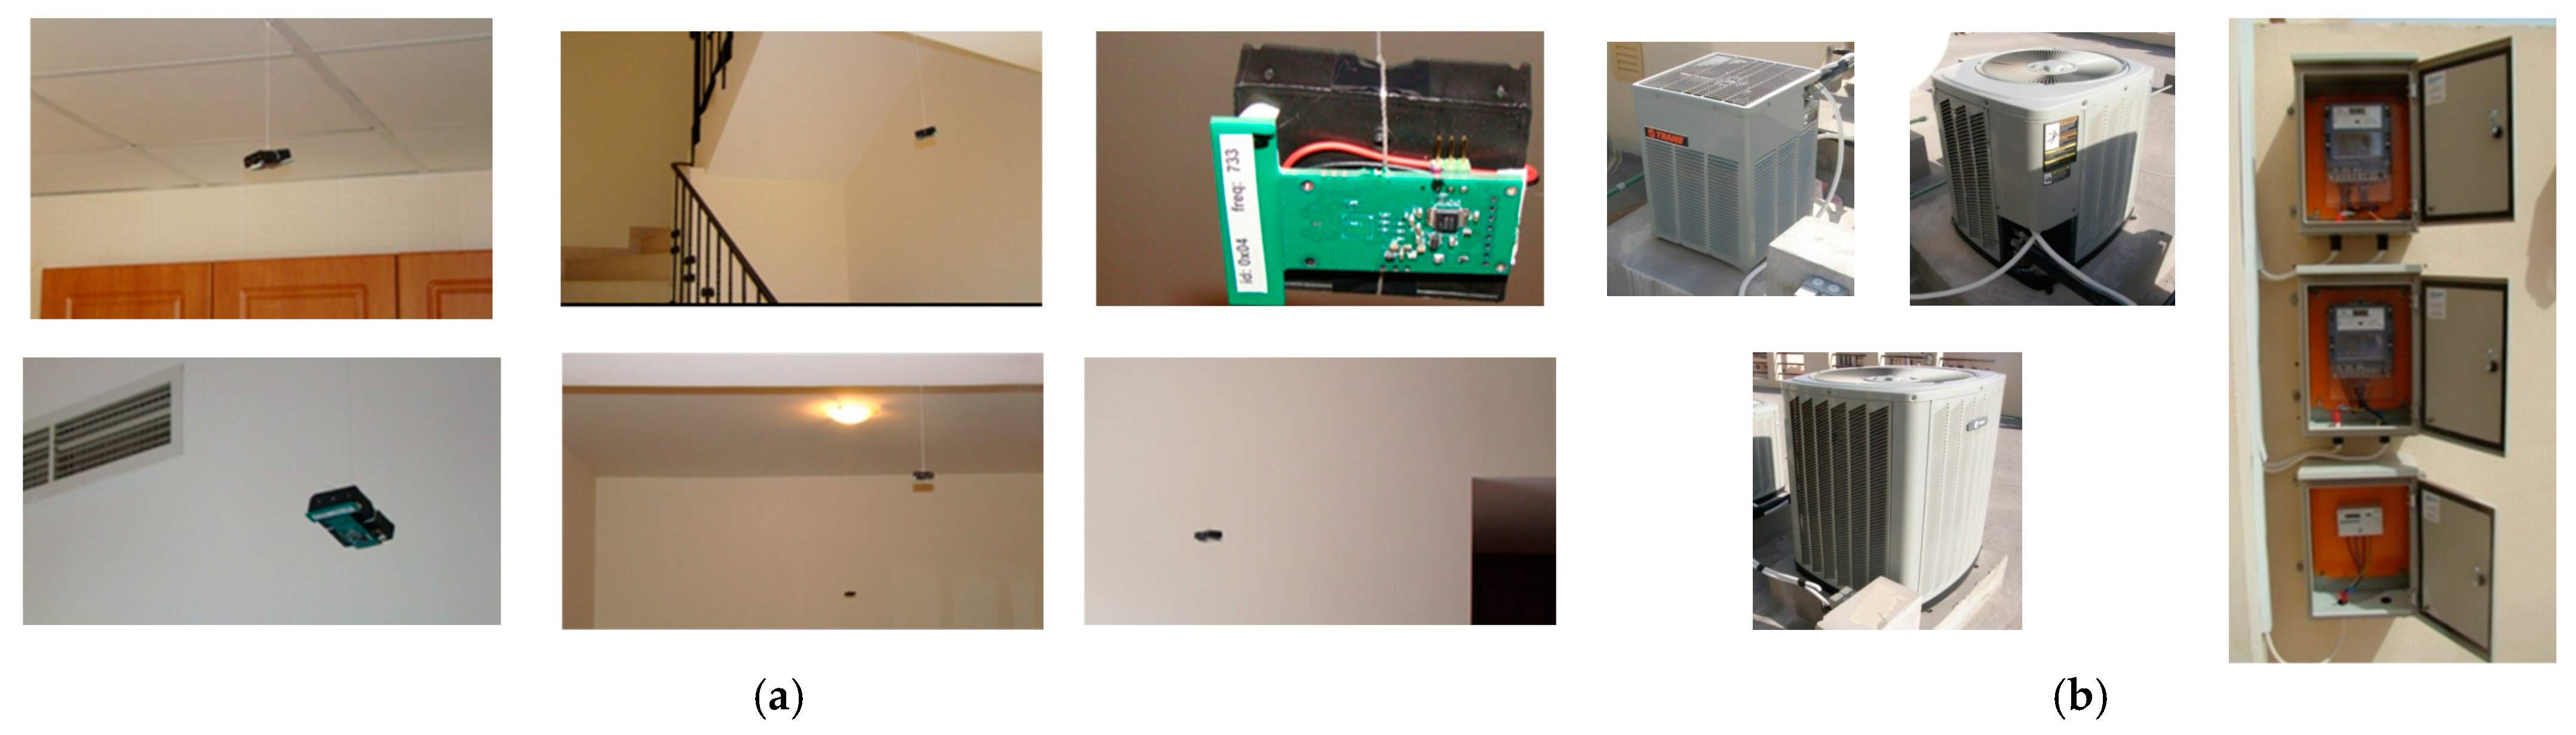
2.4.3. Temperature and AC Energy Measurements

The townhouse has three air conditioning systems with a total cooling capacity of 10.4 Tons of Refrigeration, representing 35 kW of power. As shown in Figure 8, various temperature sensors equipped with individual data loggers were distributed inside the townhouse (downstairs and upstairs) to record internal temperature during the experimental investigation. The sensors have an accuracy of ±1 °C, which are not highly accurate but provided adequate information on the control and stability of the inside temperatures during the whole study, before and after retrofitting. The users of the townhouse managed to keep similar temperature conditions of around 24–25 °C inside the townhouse during the entire experimentation. Further, each townhouse was equipped with only one electrical energy meter (EEM) that measures the overall energy consumption of the house, including AC and all electrical equipment (appliances, lighting, etc.) together. Due to this limitation, three separate EEM’s were been installed for the 3 AC machines on the roof of the townhouse, as shown in Figure 8.

2.5. Parametric Evaluation and Energy Savings

One of the parameters that can impact cooling energy savings is the AC set point temperature. Several studies in different climatic conditions have analyzed the impact of AC set points using reference models and compared the indoor thermal comfort changes and savings in cooling load. According to a study on set point temperature changes in seven climatic conditions for medium-sized office buildings, increasing the AC set point from 22.2 °C to 25 °C could reduce cooling energy reduction by 29% [49]. Studies on non-insulated villas in UAE suggested that the AC setpoint changes by a few degrees can achieve up to 20% cooling energy savings [50,51]. Another study in Abu Dhabi, UAE, showed 13.9% savings from reducing the base case set point of 20 °C to the optimal case set point of 26 °C [52]. Likewise, a study on retrofitting traditional villas in Dubai showed that an increase in COP of AC from 1.8 to 2.8 significantly lowers energy usage intensity (EUI) by 31% [53]. Another study on Emirati villas in Abu Dhabi reported 20.3% savings in annual energy savings by increasing COP from 2.6 to 3.5 [28]. This study presents the impact of long-term energy savings due to dynamic changes in SRI of the cool paint retrofitted roof and walls of the townhouse concerning changes in indoor set point temperature and COP of the AC units.

2.6. Cool Paints Retrofit Evaluation for GCC Region

Many studies demonstrated that the Gulf Corporation Council (GCC) regions face harsh and uncertain weather conditions [54]. The design or retrofitting of building envelopes to achieve energy savings could help manage energy demand over time. Even though cool roofs offer a low-cost solution for retrofitting, scientific studies on their regional performance are very scant. A study by [55] shows that in highly dusty cities of Kuwait and Saudi Arabia, cool roofs could save an average of 35% of annual cooling energy without cleaning and about 48% with cleaning. Another study reports that the cool roof strategy is the most cost-effective in Bahrain, which has a long cooling season [56]. In this context, this work comprehensively presents the effect of both cool roofs and walls on energy savings in various GCC locations listed in Table 4. Economic [57] and sustainability assessments [58] are based on the ensuing energy prices and emission factors for the selected locations. Weather data was obtained from weather database files embedded in the TRNSYS dynamic simulation software. Version 17 [59].

3. Results and Discussion
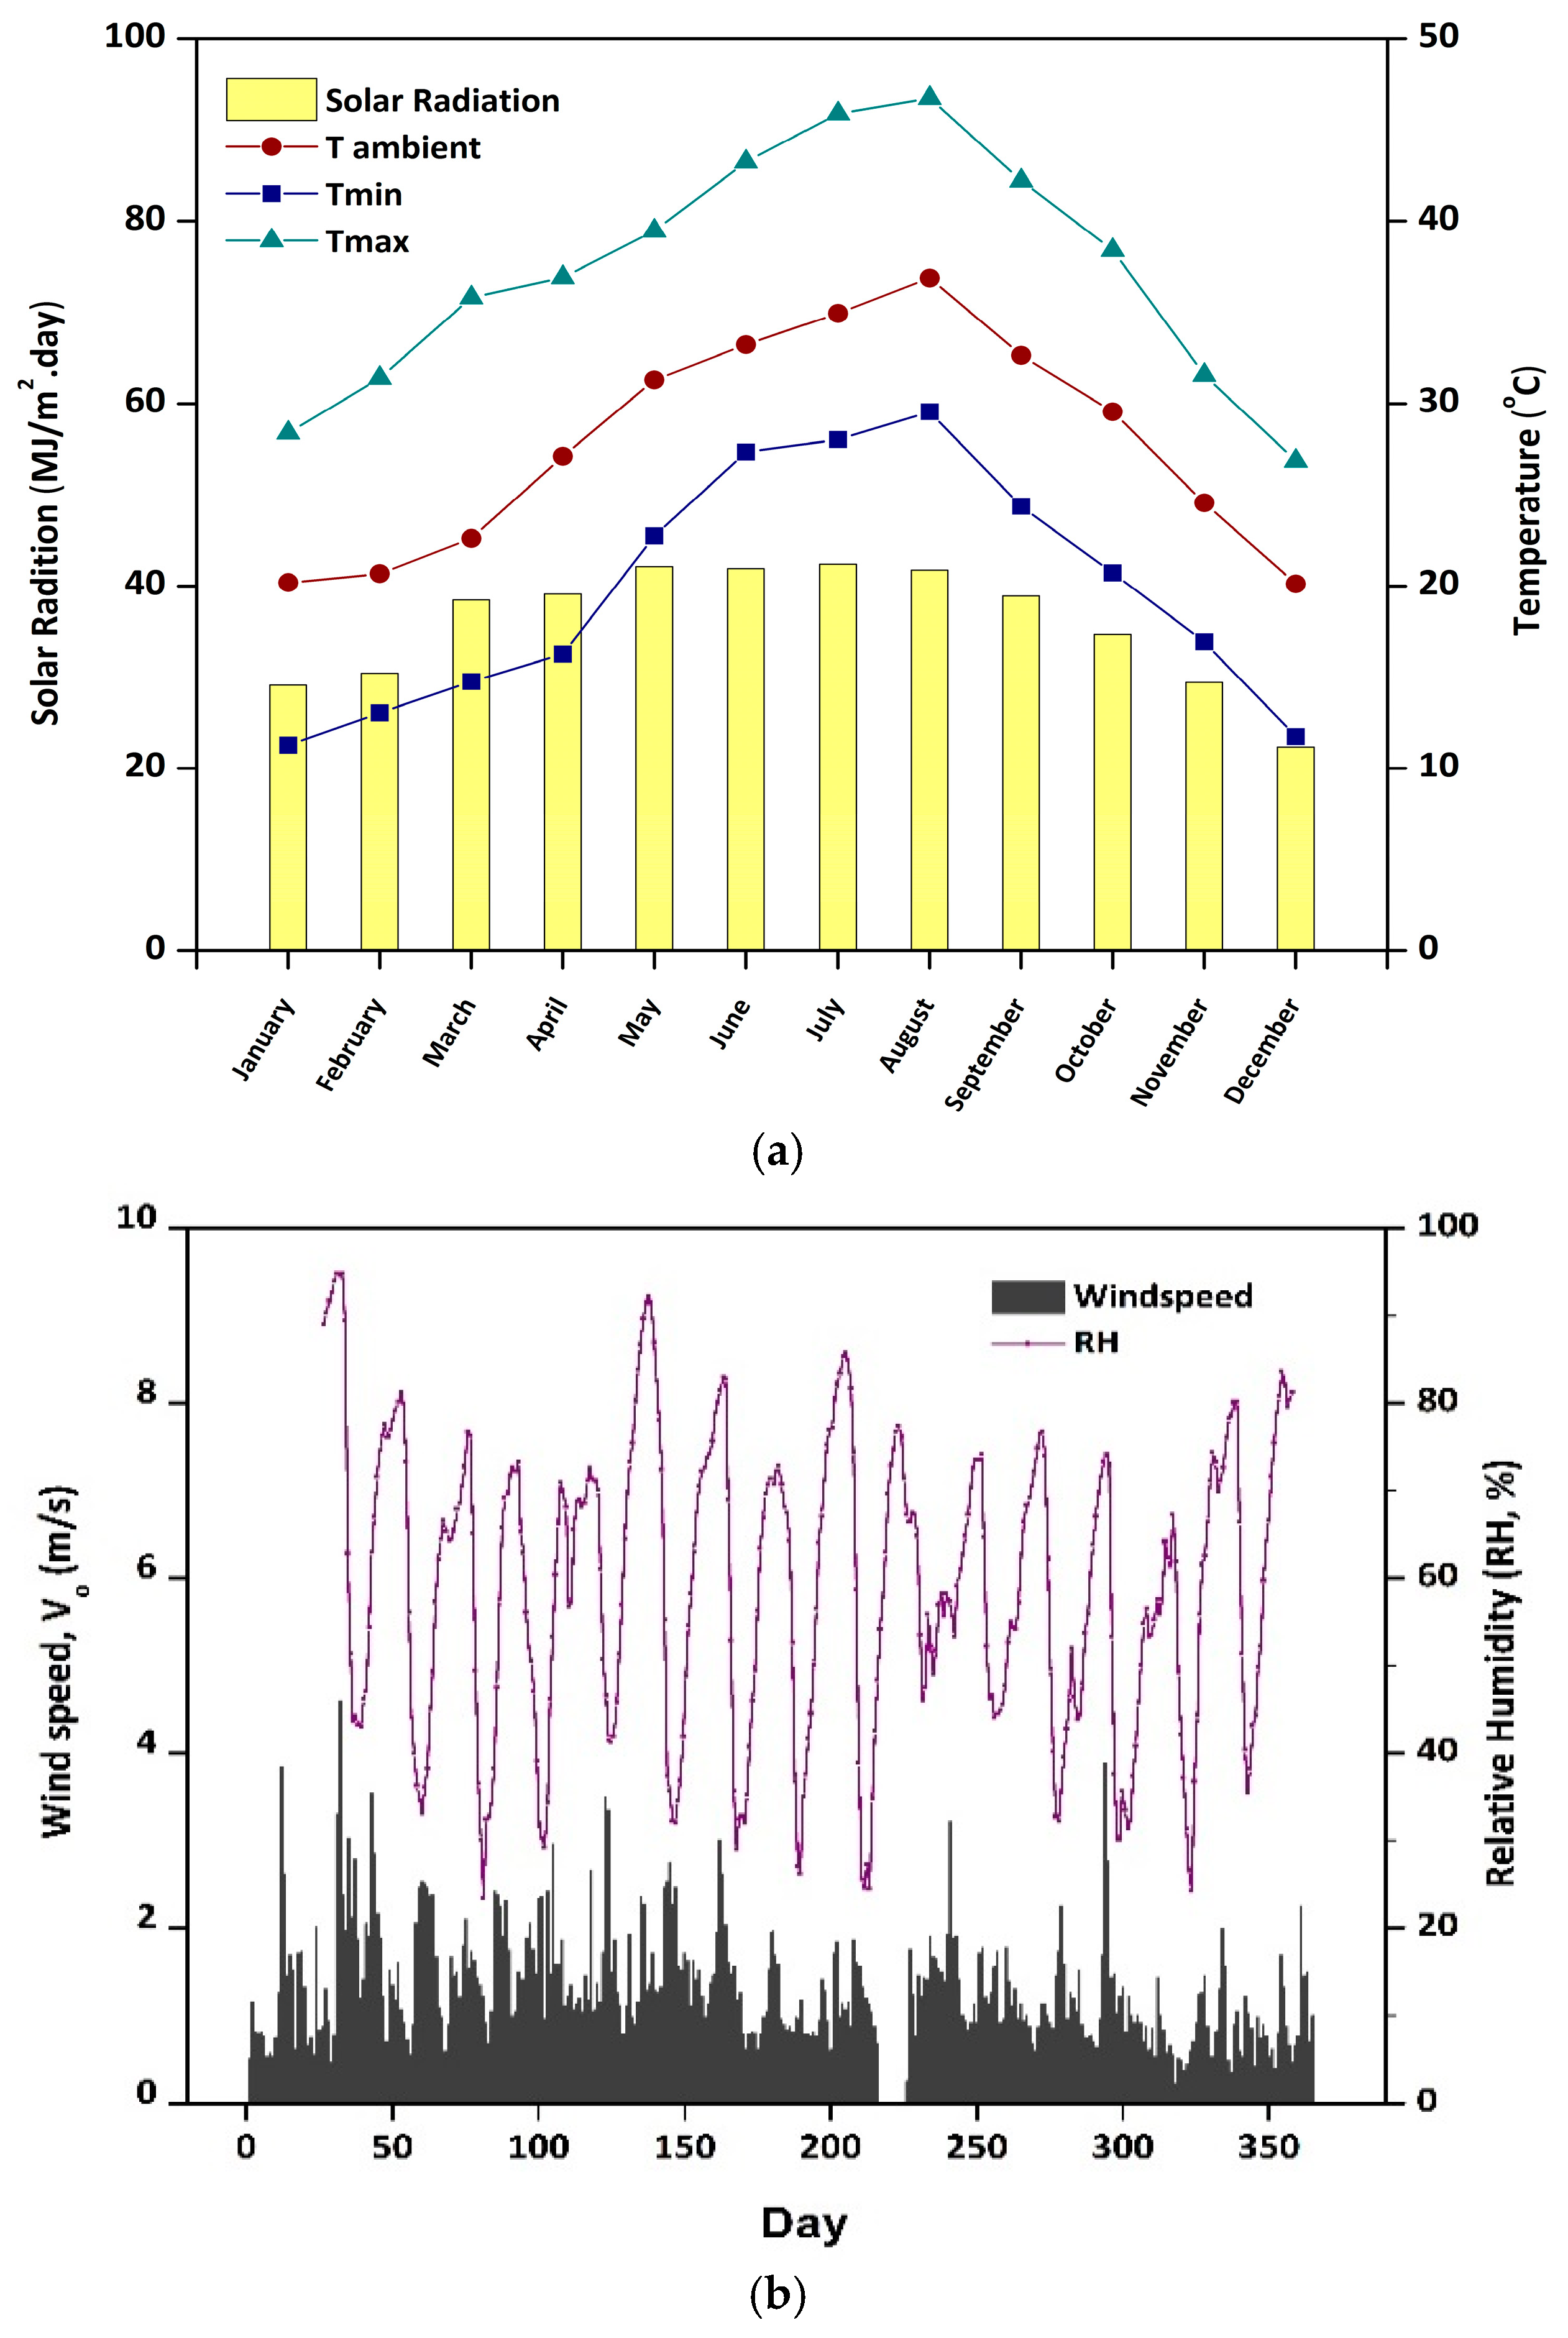
This paper aims to evaluate the effect of the high solar reflective index (SRI) paints (applied on walls and roofs) on long-term energy savings in reducing cooling loads for residential buildings in the GCC region’s hot and desert climatic conditions. To this extent, commercial and research-level high SRI paints were selected and tested for their initial and degraded values of SRI over a 3-year period at a natural weathering farm in UAE. A real-scale experimental investigation was conducted on a townhouse building to assess the energy savings of the tested paint samples. Further, the numerical model for heat flow was validated against the pilot and real-scale experimental tests. The simulations were further extended for daily, monthly, and annual evaluations considering the paints’ aging patterns in radiative properties. Additionally, parametric assessments were presented for variables such as AC set point temperature, COP of AC, the color of the paints, and location of the building, etc.

3.1. Weather Data

Figure 9 shows the meteorological information measured at the natural weathering test site, which is in proximity (200 m) to the test case housing community. As noted, summers are characterized by hot, low wind and dry conditions along with high solar radiation levels and mild winters. Data recorded from the weather station during the testing year showed an average annual temperature of 28 °C, with a maximum of up to 47 °C in August and a minimum average of 11.3 °C in January. The incident solar radiation had a maximum daily average of 11.7 kWh/m2 in July and a minimum value of 6.2 kWh/m2 in December. Based on these weather parameters, the area’s climate was classified as hot, arid desert climatic conditions according to the Koppen–Geiger climate classification. Figure 9b shows the daily wind profile with an annual average of 2 m/s, indicating very low wind conditions and a maximum daily average of 3–4 m/s observed in February. The yearly relative humidity (RH) average is around 52% at the test location.

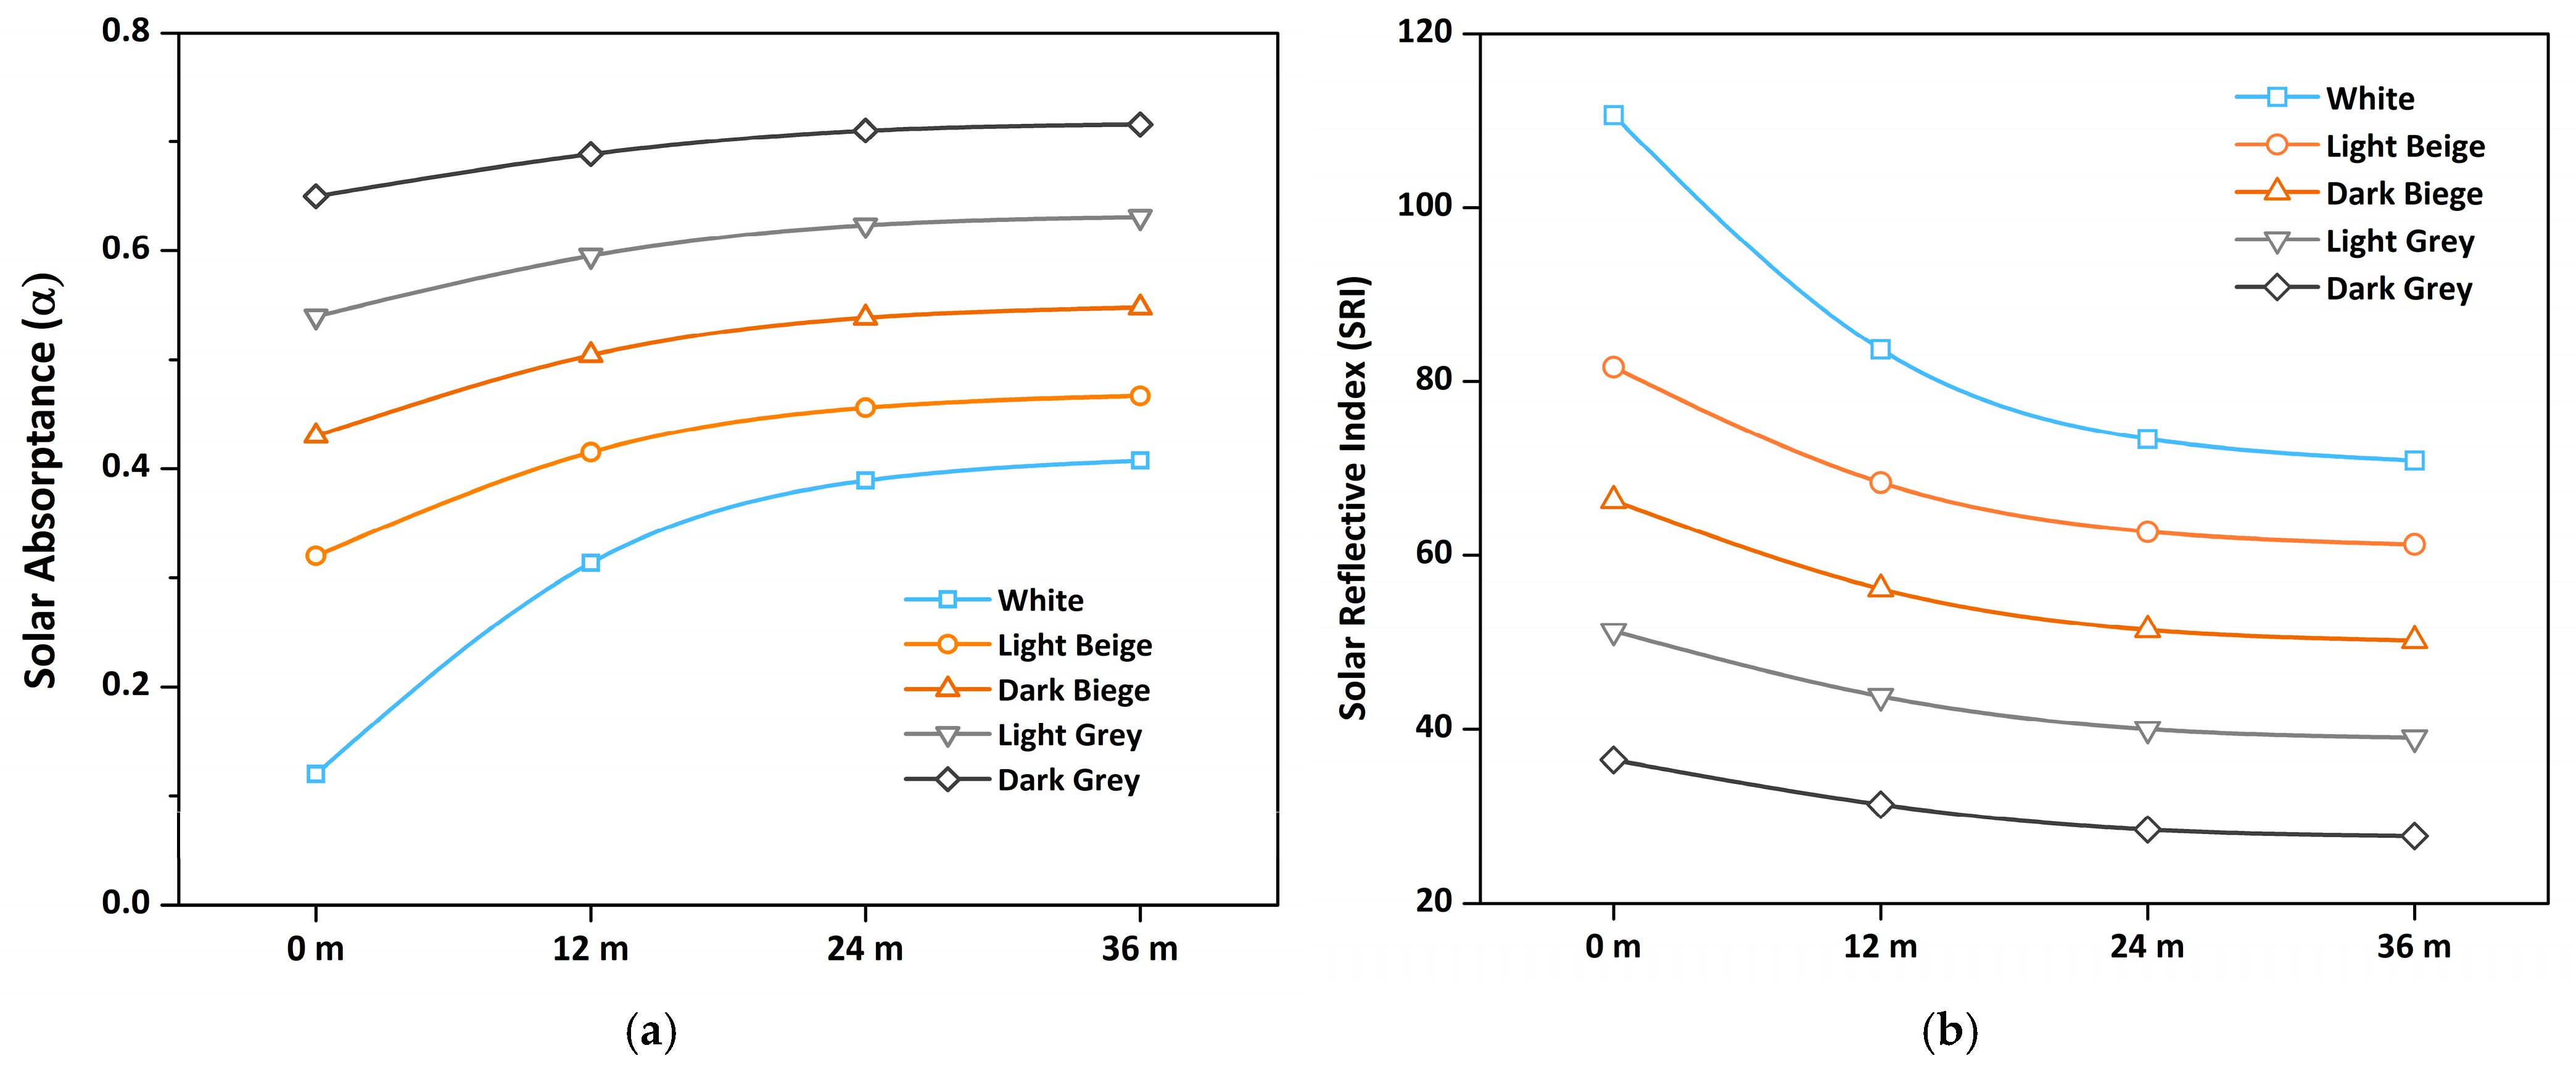
3.2. Natural Weathering/Aging Effect on SRI

The author’s previous work [22] on the effect of natural weathering on high SRI paints showed that apart from the climatic factors described above, other factors, such as low rainfall and high dust concentrations, would significantly impact the long-term performance of the cool paints. Figure 10 shows the annual accumulated loss (without washing) in solar absorptance and solar reflective index values of the cool paints used for roofing and wall applications.
It can be noted that the aging pattern for the cool white roof and colored wall coating differed due to the angle of exposure at the facility. While roof paints were applied for flat or low-slope surfaces, they were exposed at 5° tilt, and for the façade or wall paints, the exposure at 45° tilt was considered. At the end of the first year of exposure, white roof paints showed an increase in solar absorptance of 161%, corresponding to a decrease in SRI of 24.4%. Further, in the second and third years of exposure, the reduction in SRI was 12.3 and 3.4%, respectively. Notably, the studies in other climatic conditions (Mediterranean, Tropical) on the aging effect showed a solar reflectance reduction of 20% in the first year, 8.5% in the second year, and 0.9% in the third year [34]. The decrease tended to become stable, reaching a total reduction of 30% during the whole life cycle span [36]. For the wall-colored paints, light beige color experienced the highest increase in absorptance of about 30% during the first year, and dark grey had the smallest increase of about 7%. Corresponding loss in SRI is evaluated as 16.2 and 15.6% for light beige and dark grey, respectively. Further evaluation in the second and third years for the wall-colored samples showed an average loss of 8.7 and 2.5% in SRI values, respectively. The results highlight the significance of loss in reflectance with time, especially for light-colored paints, and affirm the importance of using dynamic losses in energy savings evaluation.

3.3. Polit Scale Experimental Investigation and Model Validation

The model described in Section 2.2 is validated experimentally using a test cubicle described in Section 2.3. The internal dimensions of the test cubicle are 2.50 m wide, 2.50 m deep, and 2.65 m high. The outer roof surface of the test cubicle is painted with a high SRI white coating having a solar absorptivity of 0.12 and a thermal emissivity of 0.9 (SRI = 110.6). The walls are painted with a beige color variation with an absorptivity of 0.45 and emissivity of 0.85 (SRI = 63.5). Figure 11 shows the pictures of the exterior and interior of the test cubicles, along with mounted instrumentation in test cells.
To validate the numerical model, most often used indices for energy models, such as the root mean square error (RMSE), the mean of the residuals γmean, the standard deviation of the residuals (SD γmean), and the coefficient of determination (R2) were evaluated [45]. A week in summer months was selected for the pilot tests cubicles to record the envelope interior surfaces temperatures and other parameters mentioned in Section 2.3. The data from test cells was recorded every 5 min along with weather data recorded on-site. Figure 12 provides experimentally recorded and model-estimated inner wall and roof surface temperatures. An AC unit maintained indoor room temperature at 24–25 °C, and average outdoor temperatures were measured to be around 36 °C. The average surface temperature of the roof and wall are recorded to be around 31 °C and 27 °C, respectively. The average predicted value from the model for the roof and wall were 30.5 °C and 27.6 °C, respectively. Table 5 presents the importance of the statistical indices computed for inside roof and wall surface temperatures (south wall) of the test cubicle. The obtained results assert that statistically, the numerical model computes the temperatures of the internal surfaces with good precision. Further, the values of different indices were coherent with those obtained in other validation works for building envelope energy models [60].

3.4. Townhouse Experimental Investigation

As shown in Figure 13, electrical energy consumption data is recorded continuously for 31 days between 9 September to 9 October. The cool coating application on the roof and wall and thermal films on windows was completed on 16 September, and after that day, a downtrend in AC energy consumption could be noticed. The electrical consumption for non-AC devices is observed to be consistent throughout the testing cycle.
The total electrical consumption during the experimental period is about 3344 kWh, out of which 71.5% is consumed by the three AC’s and the rest 28.5% by the non-AC electrical energy consuming devices (appliances, lightings ~30 kWh/day). For everyday comfort, the townhouse users set the AC thermostat between 25–26 °C in the living area (downstairs) and between 24–25 °C in the bedrooms (upstairs). The recorded temperatures by nine sensors showed variations in temperatures ranging between 24–26 °C, giving ±1 °C variation around the set point temperature. Based on these findings, an average indoor set point temperature of 25 °C is considered further for estimating cooling load using the model presented earlier in this study. The model was run twice for the base case (αroof = 0.9, αwalls = 0.8) and the retrofitted townhouse (αroof = 0.2, αwalls = 0.2) to evaluate the electrical consumption needed by the AC machines to remove the heat load entering in the townhouse through the walls, the roof, and the windows. Further additional heat loads due to openings, occupancy, lighting, and appliances were also included to validate the theoretical model with recorded data.
As a result, Figure 14 shows that the model is coherent. The estimation obtained by the model follows the actual AC consumption with a similar profile. Furthermore, regression analysis on the recorded and estimated data revealed the statistical significance of the model estimation with R2 = 0.92, the RMSE = 6.6 kWh, the mean of the residuals γmean = 4.68 kWh, the SD γmean = 4.72 kWh. The model was then further used to estimate the cooling energy consumptions without envelope retrofitting (base case). Compared with the estimated values of the townhouse without retrofits, during the test cycle, cooling energy savings of 14.3 and 16.9% were observed for retrofitted (wall, roof, windows) townhouse model estimation and for recorded values, respectively. Model evaluations were then extended for the whole year. Figure 15 shows a typical townhouse’s annual energy consumption trend (power bills obtained from the property management and corrected based on the tested townhouse) and model estimations for a non-retrofitted townhouse.
From Figure 15, one can observe that the highest heat load to be removed with AC was due to the heat transfer through walls and roof and hence necessitates energy efficiency retrofitting measures. As expected, the heat load through windows was more critical in autumn than summer due to the highest radiation incident angle, despite the lower external temperature. The consumption due to the internal heat gain (occupancy, openings, lighting, and appliances) appeared null in January and December. This was because it was absorbed by the cold load (negative heat load) essentially due to the external low temperatures (that also absorb complete load related to solar radiation). The model shows a deviation in winter months as the actual AC energy consumptions were higher than the estimated values. It is noteworthy to recall that the model estimations were based on cooling degree hours (CDH), and for the RAK weather data, only 100 h (70 in December and 30 in January) in the year are above the indoor set point temperature of 25 °C. Hence, the estimations were low in winter, and in real scenarios, occupants in the townhouse used the AC outside the CDH.

3.5. Townhouse Annual Energy Savings

Figure 16 (top) shows the annual heat load reduction of the retrofitted (cool roof, walls, thermal film on windows) townhouse in terms of AC electrical consumption. The yearly simulation results indicate that 34% of annual energy savings could be achieved by switching to cool surfaces and thermal film on windows. The highest savings were observed in the month of August and the least in January.
Figure 16 (bottom) presents the distribution of annual savings between the tested retrofitting options. Regarding percentage savings, 77% (38% walls and 39% roof) was achieved through cool roof and walls and 23% through window thermal insulation films. Observing Figure 15, it can be noticed the maximum cooling load and energy savings for the building contributed through the walls and roof. Since the focus of the present work was to evaluate the long-term energy-saving effectiveness of the cool paints, the subsequent discussion of results in the following sections are focused on retrofitting options for the roof and walls of the buildings.

3.6. Effect of AC Set Point Temperature and COP

Annual simulations are extended to determine the effect of change in AC set point temperature and seasonal energy efficiency ratio (SEER) or COP. As shown in Table 6, every two degrees decrease in set point from 26 °C to 20 °C increased the cooling energy savings by 10.4, 7.65, and 3.3%, respectively. Further, an increase in COP offsets the savings from cool paints as the savings from energy-efficient AC contributed more to the overall energy consumption reductions; literature studies agree with this fact. For example, studies on residential buildings in Saudi Arabia proposed envelope insulation and high COP AC systems as the most impactful energy-saving solutions [61]. HVAC improvement reduced energy intake by 35%, whereas envelope improvement energy reductions were 20% [62].
The traditional townhouses or villas have COPs between 2 to 3, and with the common practice of setpoint between 22–20 °C, the savings due to cool paints were 47.6–73.7 Wh/m2.day. On the other hand, for modern villas or townhouses retrofitted with efficient AC units having COPs between 3 to 4 and using the sustainable practice of setpoint between 24–26 °C, the savings ranged between 30.2–44.2 Wh/m2.day. Figure 17 shows the monthly trends of daily average heat flux through cool surfaces with different AC set point temperatures. The highest heat flux was estimated for the month of July with a set point of 20 °C, and as the indoor set point temperature increased, the average daily heat flow through cool surfaces decreased. Although the estimation presented in this work is based on a constant set point without seasonal variations, it is noteworthy that several literature studies suggested using dynamic set points of 20–21 °C in winter and 24–26 °C in summer for energy models [43]. Accounting for seasonal changes in lower set point temperatures increases the annual heat flux due to positive heat gain through surfaces in winter months.

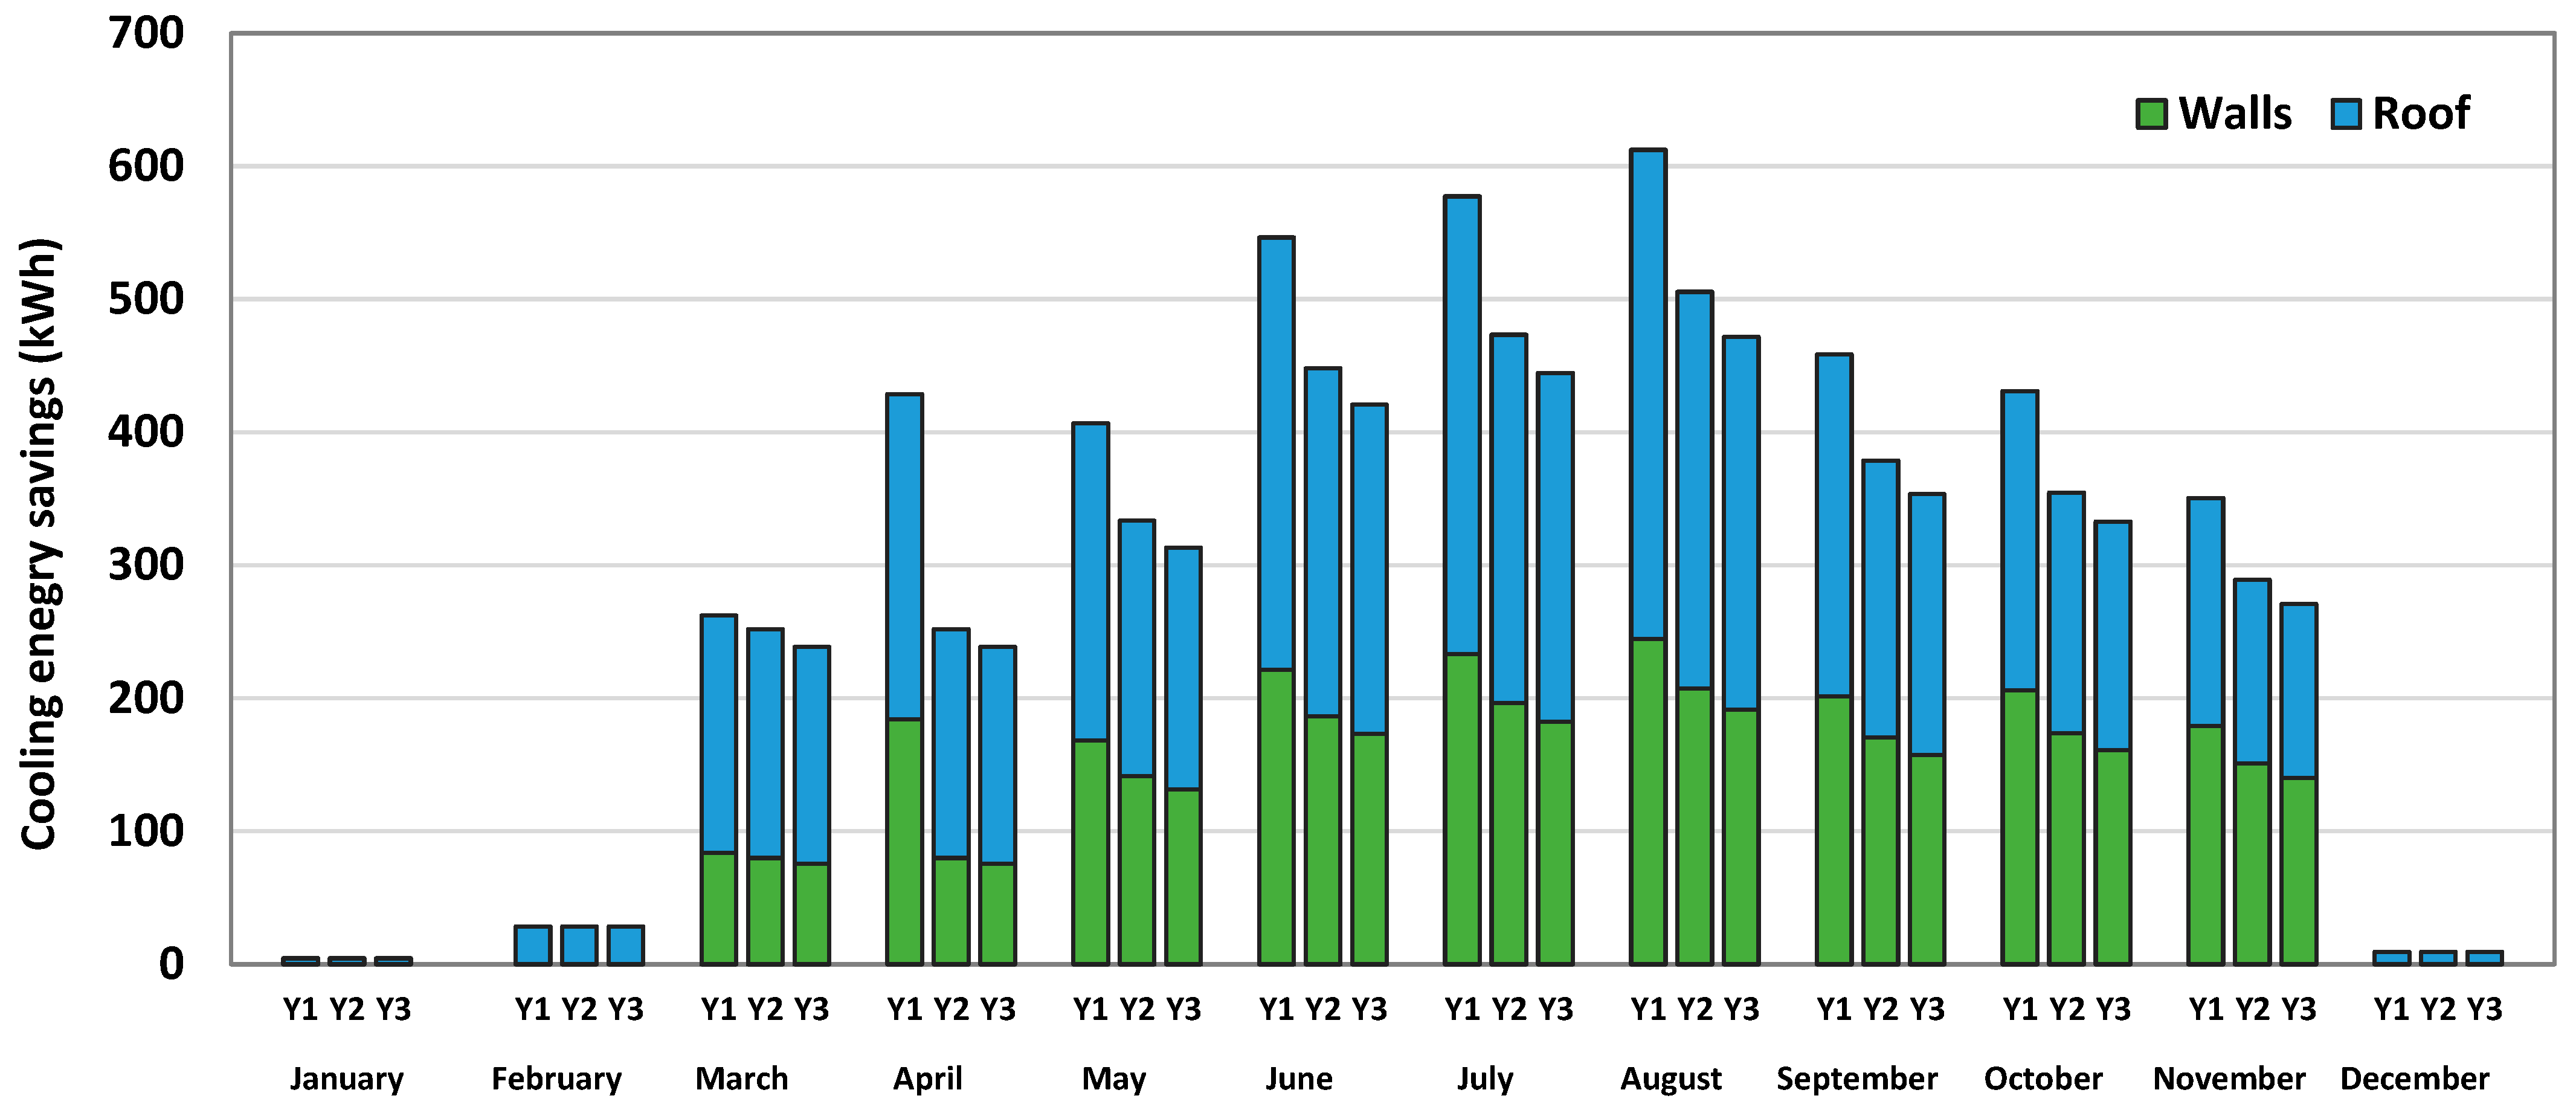
3.7. Effect of Aging of the High SRI Paints

The results presented in Figure 18 show the cooling energy savings for the townhouse in the first three years after the application of high SRI paint on walls (light beige, α = 0.32, SRI = 81.6) and roof (white, α = 0.12, SRI = 110). As mentioned in the literature, the aged reduction in radiative properties of cool paints needs to be considered for energy-saving evaluation [29]. For the present case, using initial values of SRI or solar reflectance, or solar absorbance overestimates the energy savings by about 10.3%. Likewise, using the year-end SRI value for annual evaluations underestimates energy savings performance. Therefore, a balanced approach is suggested in this work to account for location and weather-based yearly degradation variations of SRI during the evaluation cycle. Based on the experimental tests and natural weathering patterns described in Section 3.2, annual average values of SRI are considered for each year rather than initial or final values to estimate the cooling energy savings.
All the savings reported in this work are compared to the base case (αr = 0.9, SRIr = 6.6 αw = 0.8, SRIw = 16.7). During the first-year maximum energy savings are observed and declined after that due to a decrease in SRI of the cool surfaces. Total energy savings (walls and roof) of 4115 kWh is estimated using average SRI values in the first year, which are reduced by 16.7% and 6.2% in the second and third years, respectively. For retrofitting with a white roof and light beige wall color, a 30% overall reduction in energy savings (10% in y1, 15% in y2, and 5% in y3) is estimated at the end of three years. This estimation is based on considering annual average changes in SRI values (12.3% in y1, 19% in y2, and 8% in y3 for roofs and 8.2% in y1, 12.6% in y2, and 5.4% in y3 for walls). The results again stress the prominence of accounting for the annual degradation of the radiative properties. Figure 18 also shows that the decreasing trend was more prominent in roof paints compared to walls due to being flat and susceptible to dust accumulation and less runoff over time [22].

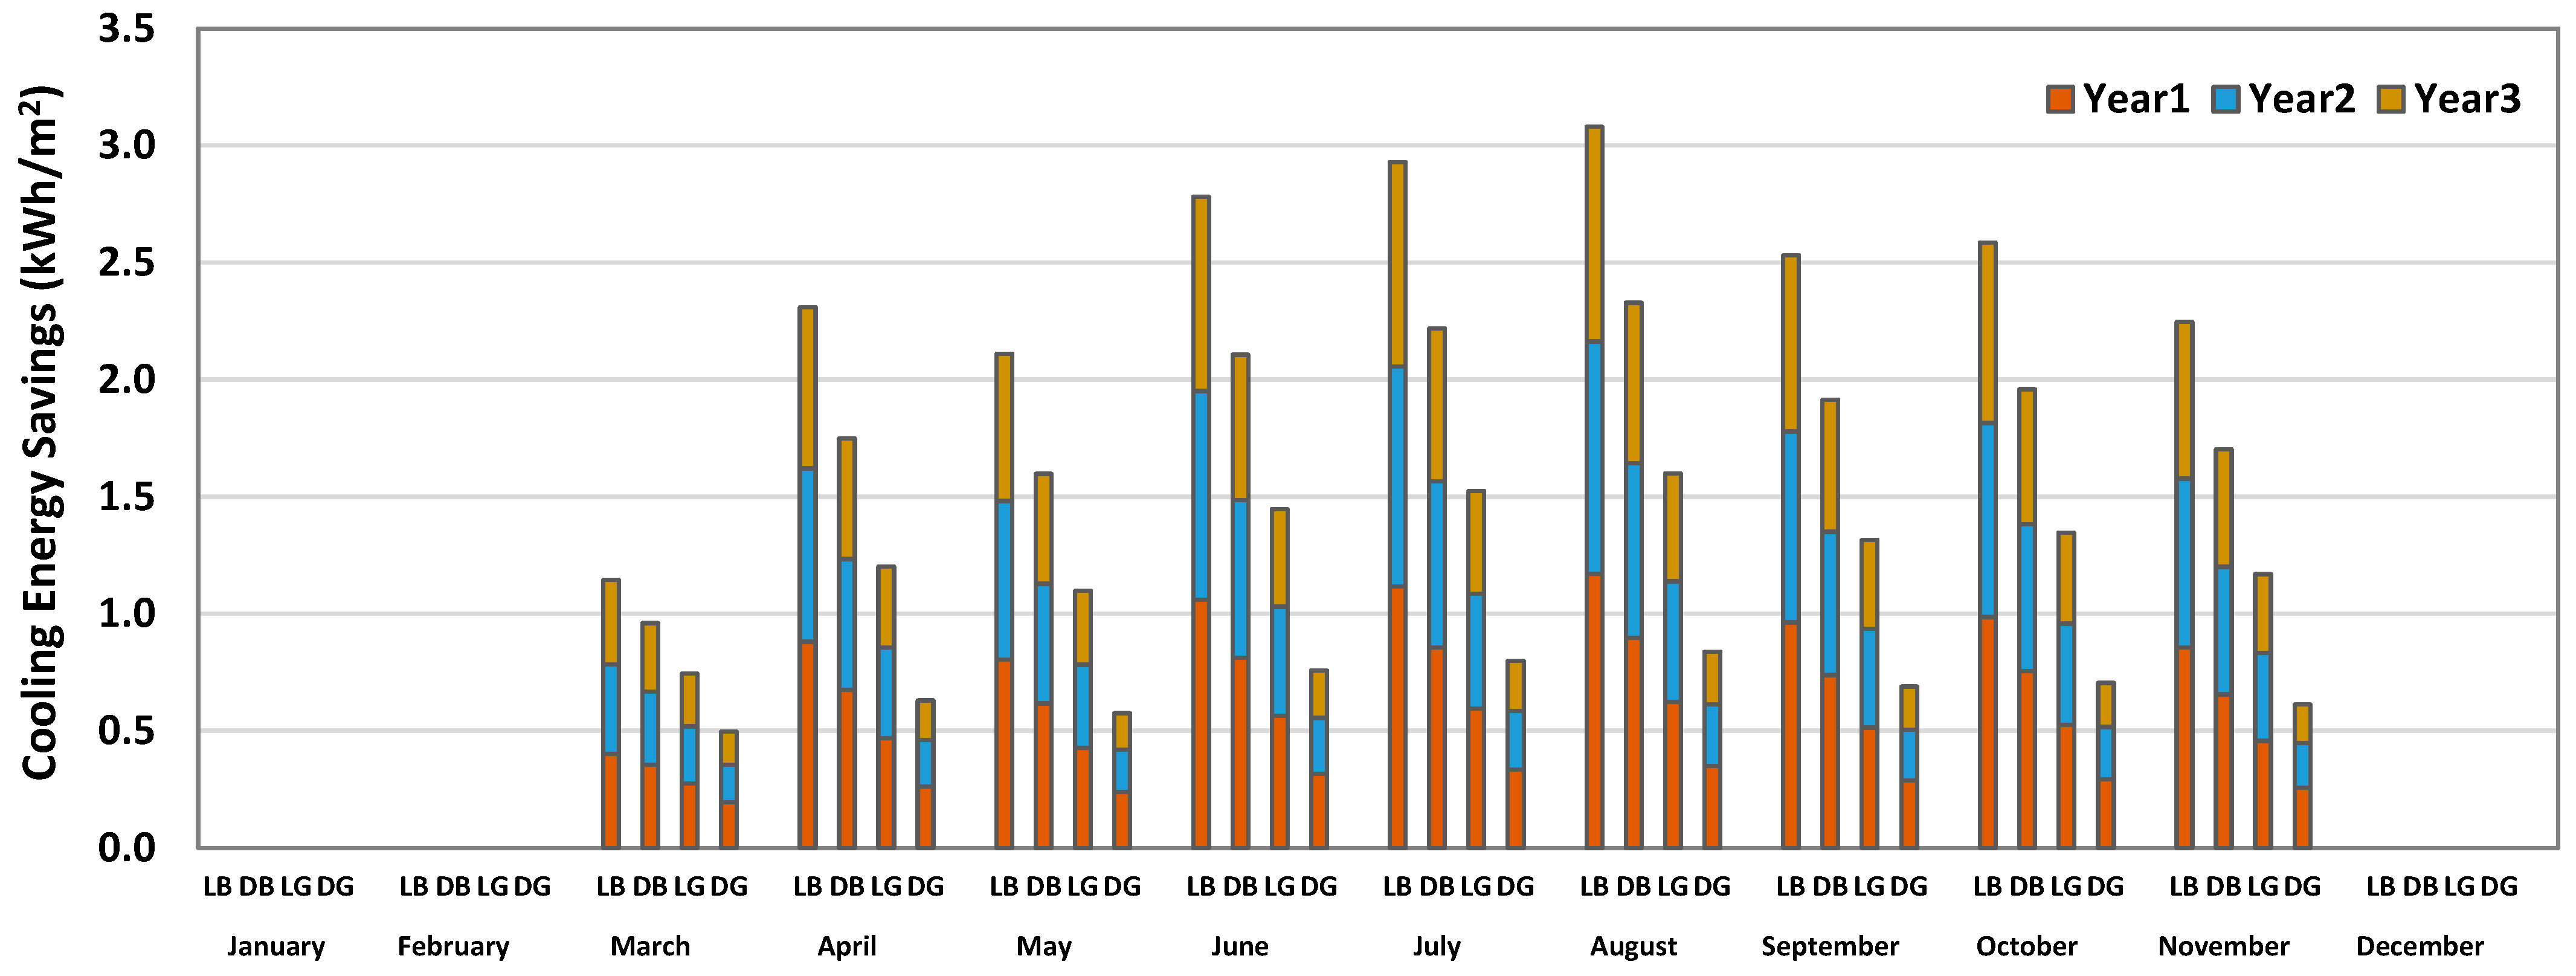
3.8. Effect of Cool Color Facades

Walls represent the highest external envelop surface areas in a building, especially for independent, isolated villas or buildings [28]. Our work further evaluates the cooling energy savings and their performance degradation with aging for different colors of wall paints typically applied in the region. As shown in Figure 19, light colors achieved the highest savings, and dark being the lowest. Owing to the cool paints’ natural weathering described in Section 3.2, it is interesting to observe that the aging patterns for dark colors show consistent energy saving year after year while the light colors have significant variations in annual energy savings. Table 7 provides information about the percentage annual energy savings reduction (%ESR) for cool roof and wall colors compared with the base case (αr = 0.1, αw = 0.2). As the changes in thermal emittance were not significant with aging, annual SRI value variations largely depend on solar reflectance properties. Considering the yearly SRI degradation rates, the %ESR increased from 11.4% (year 1) to 31.1% (year 3) for the white roof paint. On the other hand, the cumulative %ESR difference between the light (LB) and dark-colored (DG) walls is estimated to be 4.4, 11.6, and 15.4% in 1st, 2nd, and 3rd years, respectively. The corresponding yearly increase in absorptivity between the colors (LB and DG) is 66.7, 56.5, and 54.2%. The minimum %ESR of 9.2% was observed in 1st year for the light beige color, and a maximum cumulative %ESR of 43.9% was estimated for the dark grey color at the end of the 3rd year.
The results shown in Figure 20 stress further the importance of cool or high SRI walls’ contribution to annual and aged energy savings. Considering the cooling energy estimations for only cooling degree hours (set point—25 °C, COP-2.852) in a year, monthly total cooling energy savings are maximum (3.1 kWh/m2) for light beige color in August and minimum for dark grey (0.5 kWh/m2) in March.

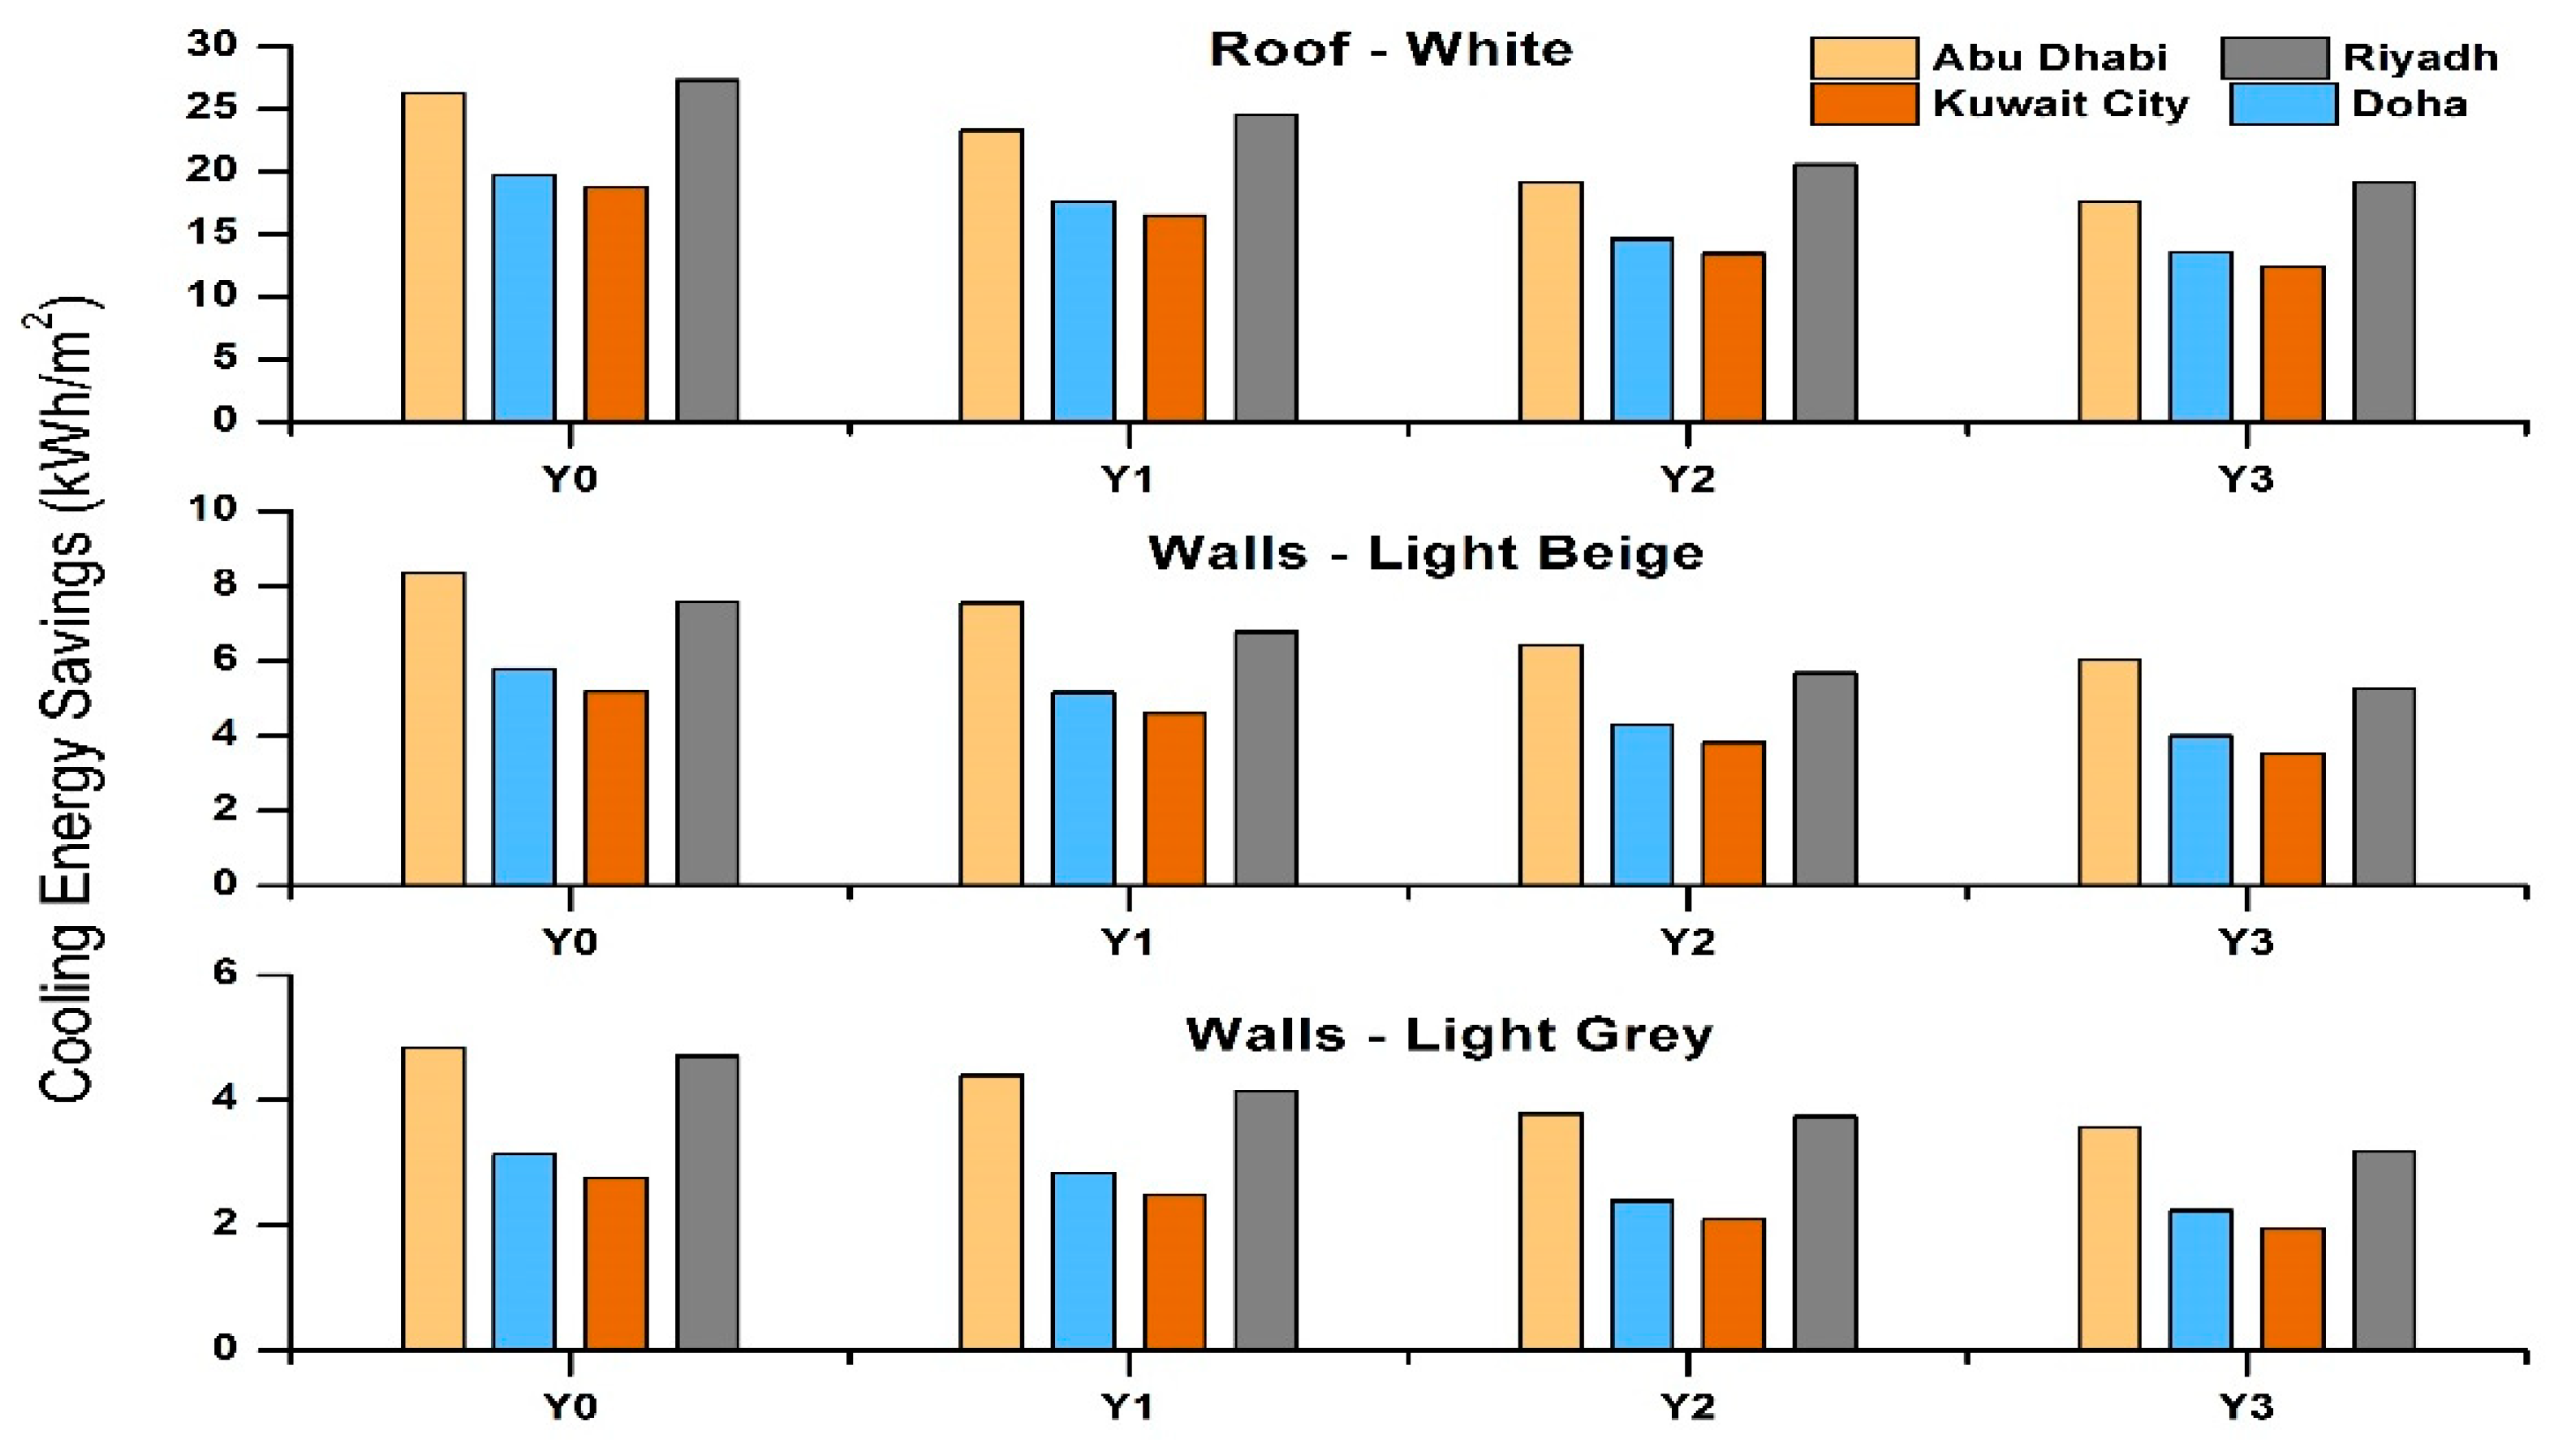
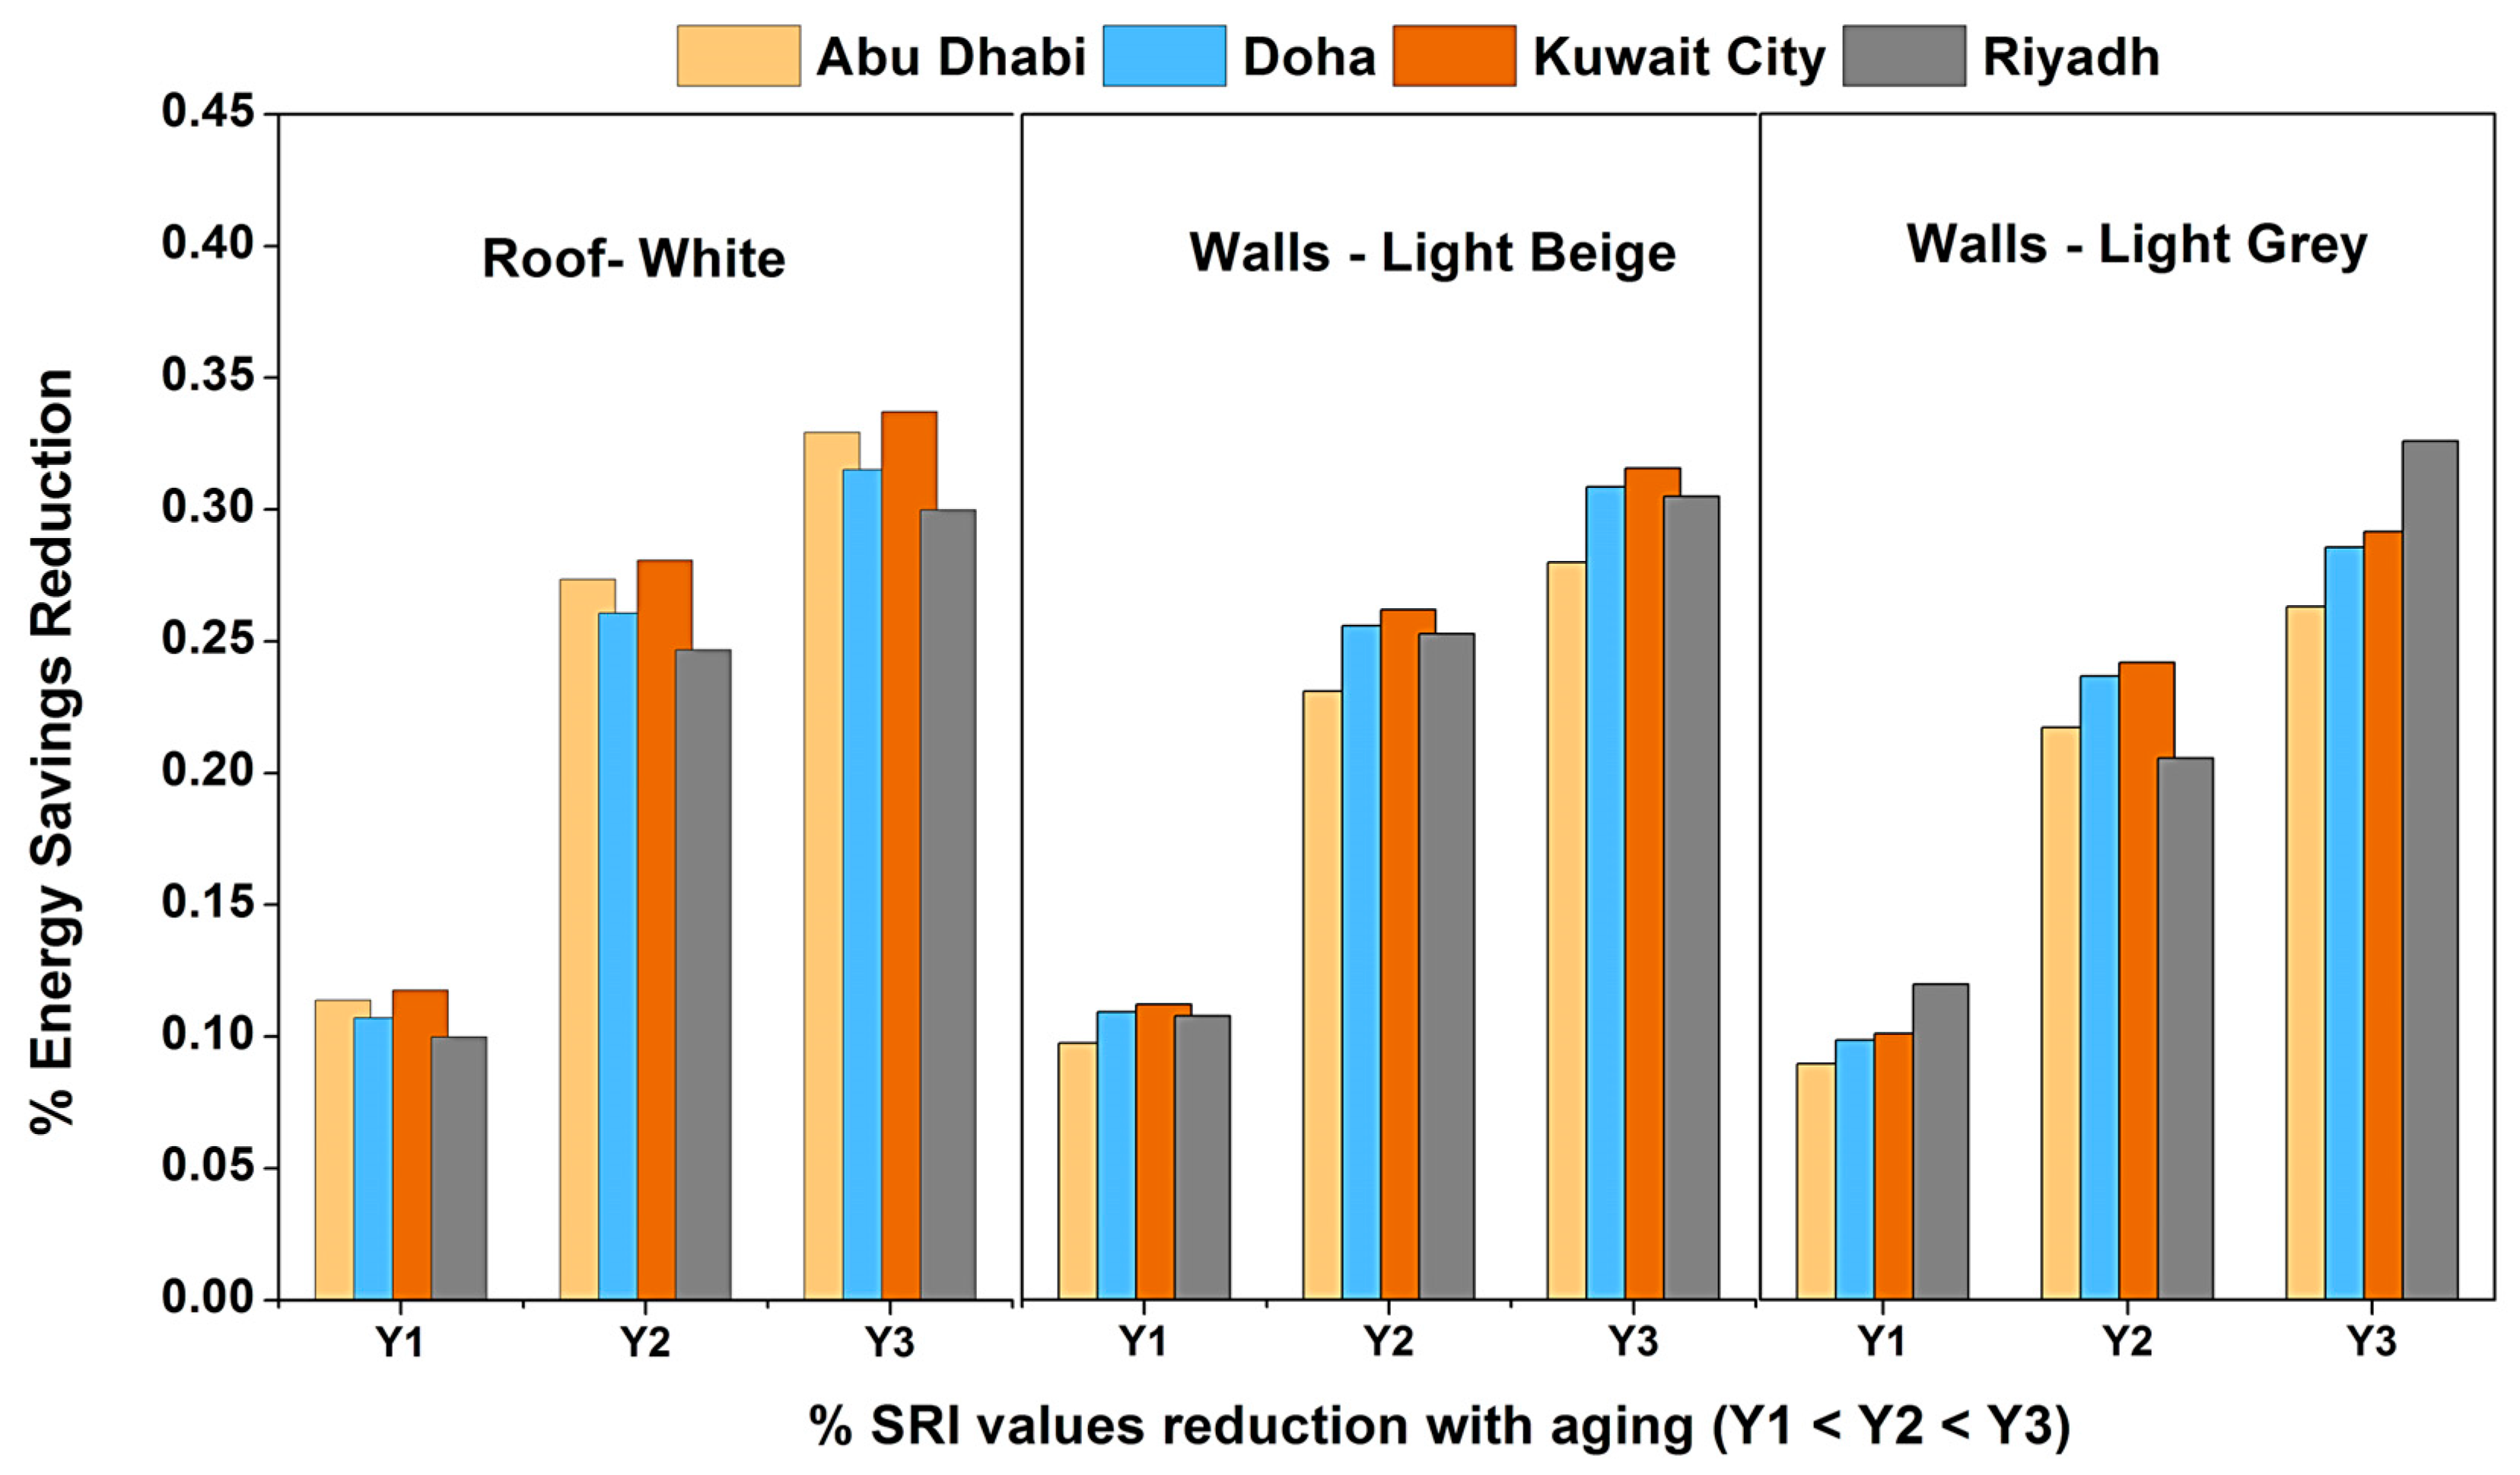
3.9. Evaluation of Energy Savings at Different GCC Locations

The final objective of this work is to apply the experimental and theoretical modeling results for other locations in the GCC region. For this purpose, four major cities in GCC were selected, and their weather characteristics are presented earlier in Section 2.6. Based on the findings observed for the test site location, the following information was considered for the energy savings assessment at various GCC locations.
  • The model parameters for base case residential building are kept the same;
  • The building is assumed to be facing true south and isolated from shading structures (trees, other buildings, etc.) around (on all sides). The wall-to-roof surface area ratio is 2.32;
  • The percentage annual degradation of SRI values is assumed to be similar;
  • Dynamic set point temperature considered; 20 °C in winter (December, January, and Febuary) and 24 °C in other months. The increasing order of annual percentages of cooling degree hours (CDH) is then 56.3, 60.1, 66.4, and 69.6% for Kuwait City, Riyadh, Qatar, and Abu Dhabi, respectively.
The results in Figure 21 indicate the annual cooling energy savings (COP-2.852) considering cool roof and walls retrofit separately. The yearly savings during the first 3 years (Y1, 2, and 3) after roof retrofit ranged between 12.4–25.6 kWh/m2 of building roof area. The least in Y3 for building roofs in Kuwait City and the highest in Riyadh. Based on the considered weather data, Kuwait City has the least CDH (average Tmin = 13 °C) requirement, and correspondingly savings were minimal. Although Riyadh was second in CDH requirement, it was accompanied by the highest annual incident radiation (47.2 MJ/m2) enhances heat load reduction, thus attaining maximum savings through the roofs.
On the other hand, for cool wall retrofitting, the highest savings were observed for Abu Dhabi (8.4 kWh/m2 for light beige) and the least for Kuwait (1.9 kWh/m2 for light grey) among the colors considered. It is noteworthy to observe here that Abu Dhabi had the highest CDH requirement and, accompanied by moderate radiation on wall surfaces, the savings edge past Riyadh’s values (important to note that the average Tmin for Abu Dhabi again was 4 °C higher than Riyadh). The results indicate the importance of “real-world” dynamic weather conditions’ influences on the cool paint’s performance over time. In this context, the %ESR with respect to changes in %SRI reduction with the aging of cool paints requires attention and is shown in Figure 22.
The results in Figure 22 indicate a cumulative annual average reduction in energy savings are 11, 26.5, and 32%, respectively, for cool roofs in all locations (maximum deviation of ±2%). At the end of the three years, this corresponds to around a 36% decrease in roof SRI values compared to initial values. Further cumulative %ESR after three years reached an average of 25% (maximum deviation of ±2%) for light beige and 22.5% (maximum variation of ±3%) for light grey, respectively. The corresponding cumulative %SRI loss of cool-colored wall paints is around 25% of the initial measurement. Further, these results on %ESR strengthen our argument on using dynamic and aged energy saving performance of high SRI paints in energy modeling and long-term evaluation. As a matter of fact, using constant initial SRI values (Y0) of the paints overestimates the energy savings by around 30% for the 3 years (10% each year).

3.10. Economics and Environmental Impact of Using Cool Paints in GCC

Although the cool walls and roofs aging contributes to the reduction in energy savings over time, one must embrace the overall energy, cost savings, and sustainability aspects of switching to these retrofit strategies. In this context, simple techno-economic and environmental impact assessments for the first three years after cool paint retrofitting can be visualized in Figure 23 for all GCC locations considered in this work.
As shown in the left chart of Figure 23, 3-year cumulative cooling load reductions are higher for Riyadh (82 kWh/m2) and least for the city of Doha (54.4 kWh/m2). The total contribution through the walls appears low due to the high wall-to-roof ratio (total walls surface area is more than twice that of the roof) for the residential building considered. Further, the results of the economic and emission reduction are evaluated based on ensuing electricity prices and CO2 emission factors (listed in Table 4). The middle chart of Figure 23 shows the highest economic savings obtained for Abu Dhabi (777$/3-years) and the least for Kuwait City (183$/3-years). These cost-saving values directly correlate with energy prices in which Abu Dhabi’s current residential electrical energy rates are 2.8 times higher than Kuwait’s. Finally, the right chart in Figure 23 shows the maximum CO2 emissions (80.2 kg of CO2/year) in Abu Dhabi, corresponding to its high cooling load reductions. The lowest emission reduction is obtained for Doha (19 kg of CO2/year), attributed to its lowest cooling load reductions and least emission factor among the GCC countries considered in this study. Considering the life cycle of the cool paints (20 years), the energy, cost, and CO2 reductions would be substantial for the regions in GCC. However, a dynamic approach like the current study is necessary considering various factors; the aging patterns, maintenance cycles, material type, inherent characteristics for dust resistance, and cost of the cool paint retrofit options.

4. Summary and Conclusions

The present work provides a comprehensive combined experimental and theoretical framework for evaluating the energy effectiveness of retrofitting residential buildings with high solar reflective index (SRI) paints (also termed cool paints). The study ensembles five major tasks, and each task’s key findings are summarized as follows.
  • Natural weathering and lab scale testing on selected cool paints (roof and walls) determined the aging patterns. After 3 years of exposure, maximum SRI reduction for cool roofs and walls is observed to be around 36% and 25%, respectively. An SRI reduction profile of 24.4, 12.3, and 3.4% is obtained for y1, y2, and y3, respectively, for cool roofs and 16, 8.5, and 2.5% for cool walls. Regarding the colors, light colors experienced higher annual degradation rates in the first year compared to dark colors.
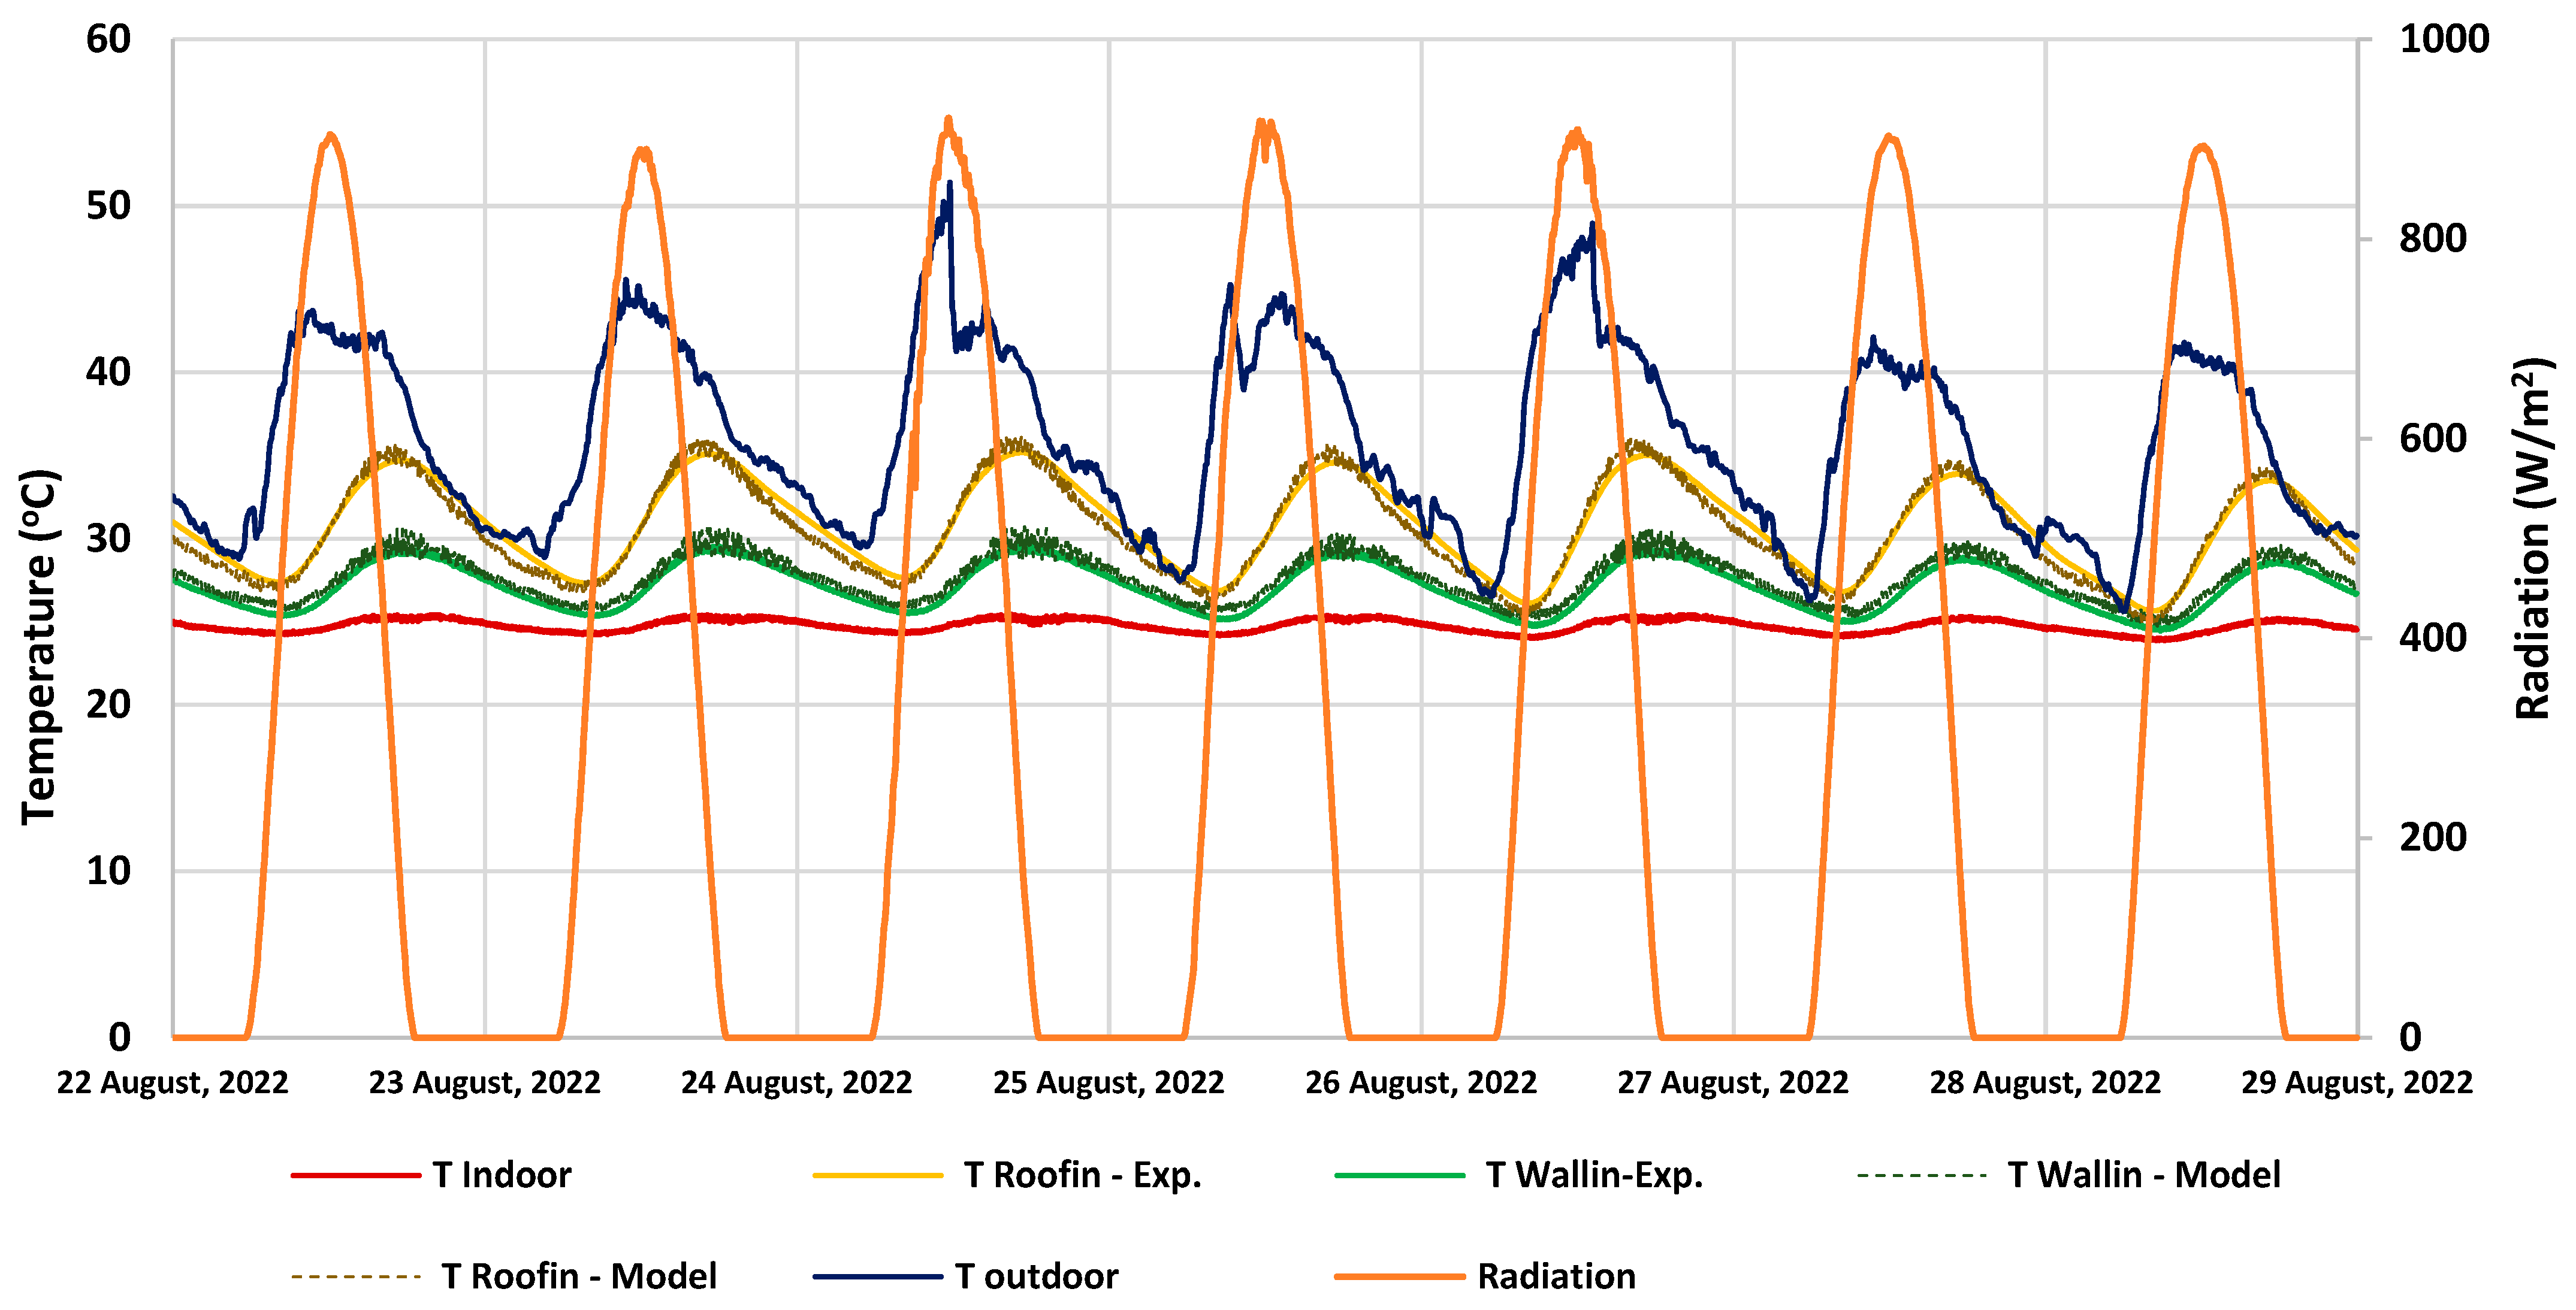
  • Accounting for SRI values, i.e., using both measured solar absorptance and thermal emittance values, requires a specific energy model. The 1-D heat transfer model presented in this work is successfully validated through experiments on a pilot scale test cubicle, and statistical significance is established.
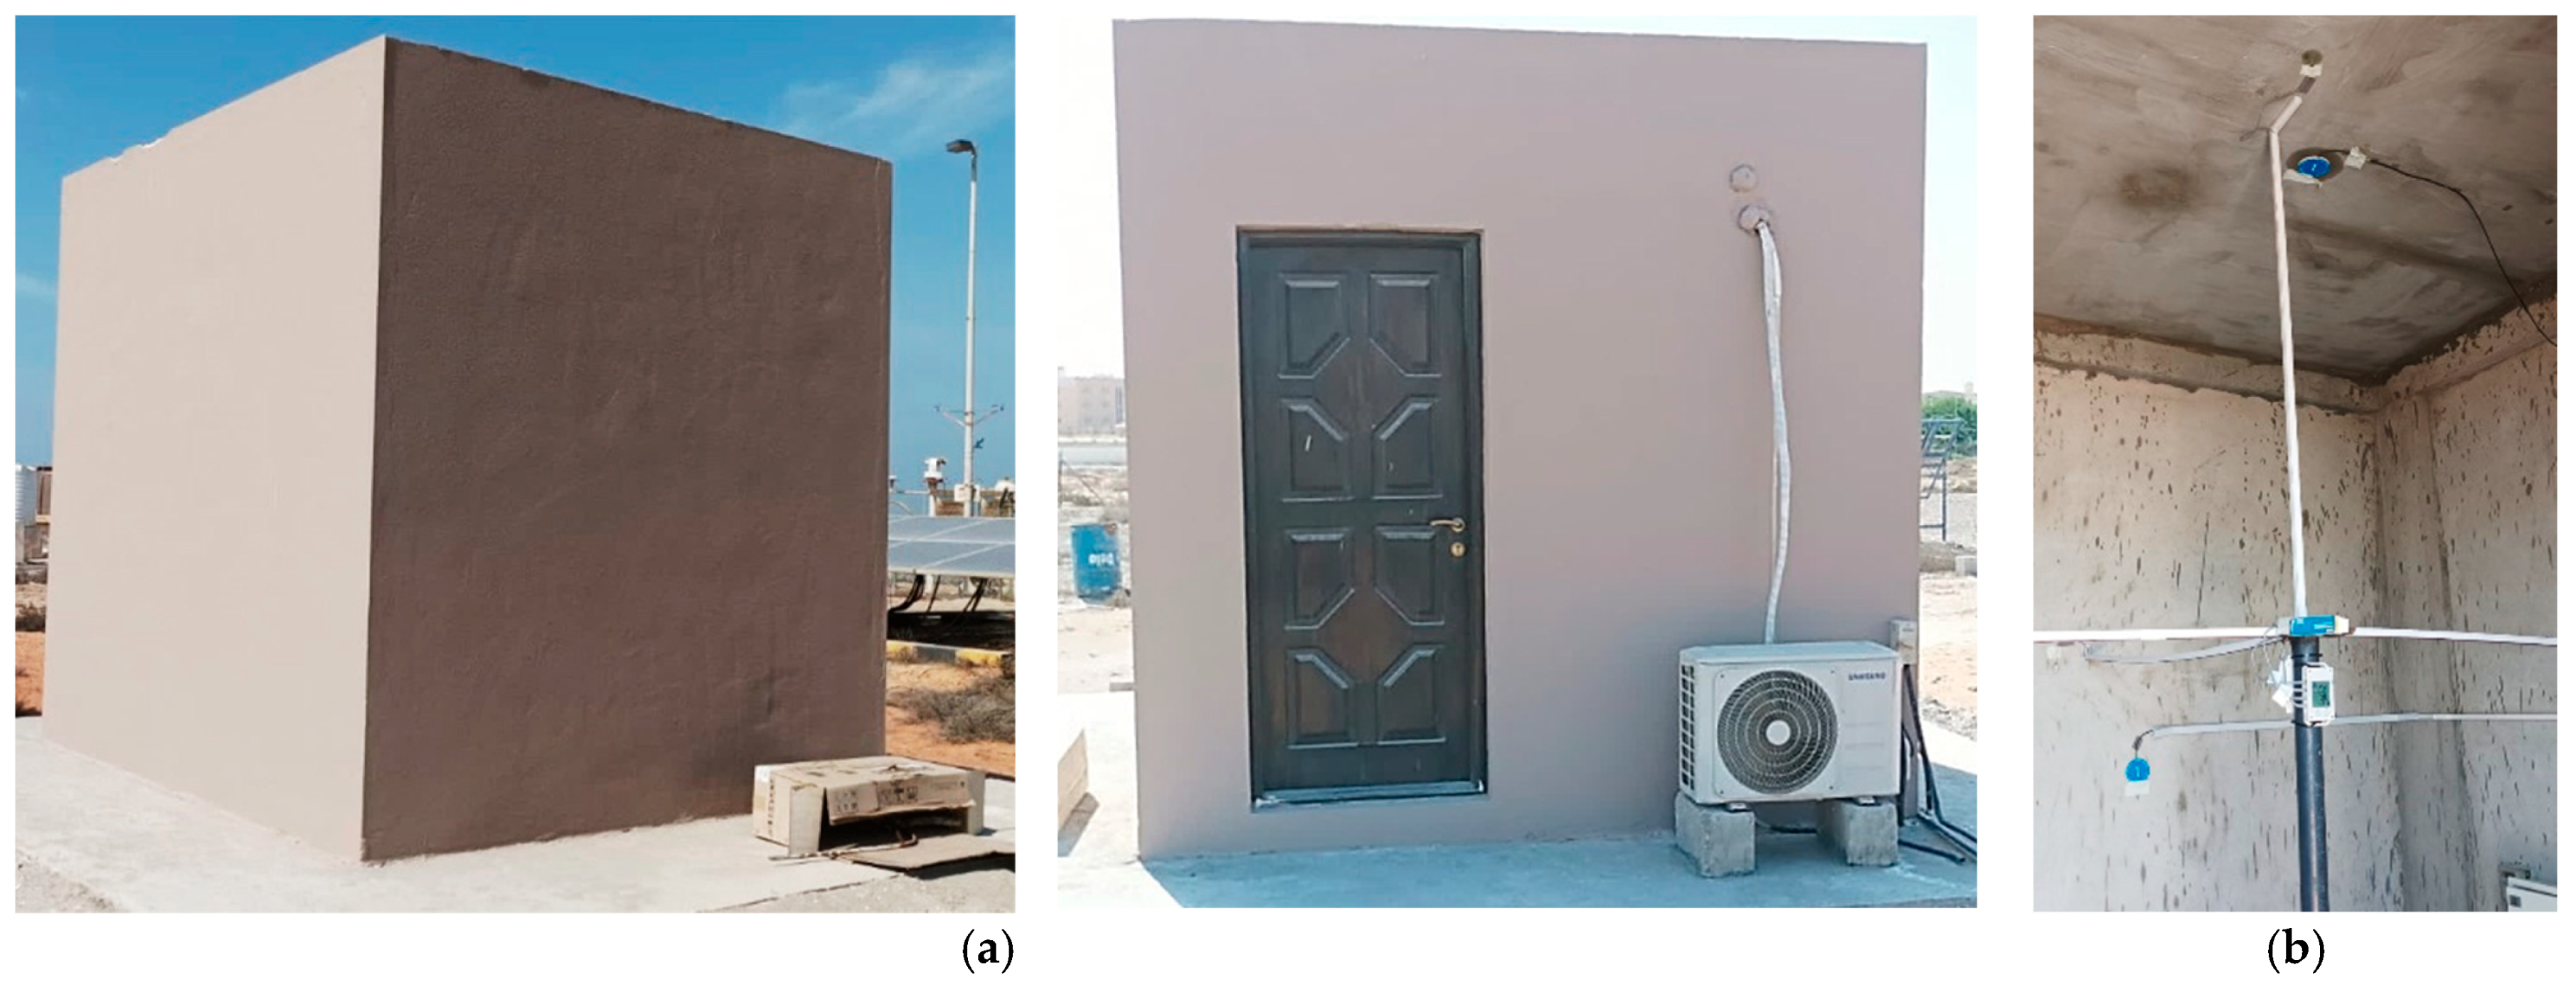
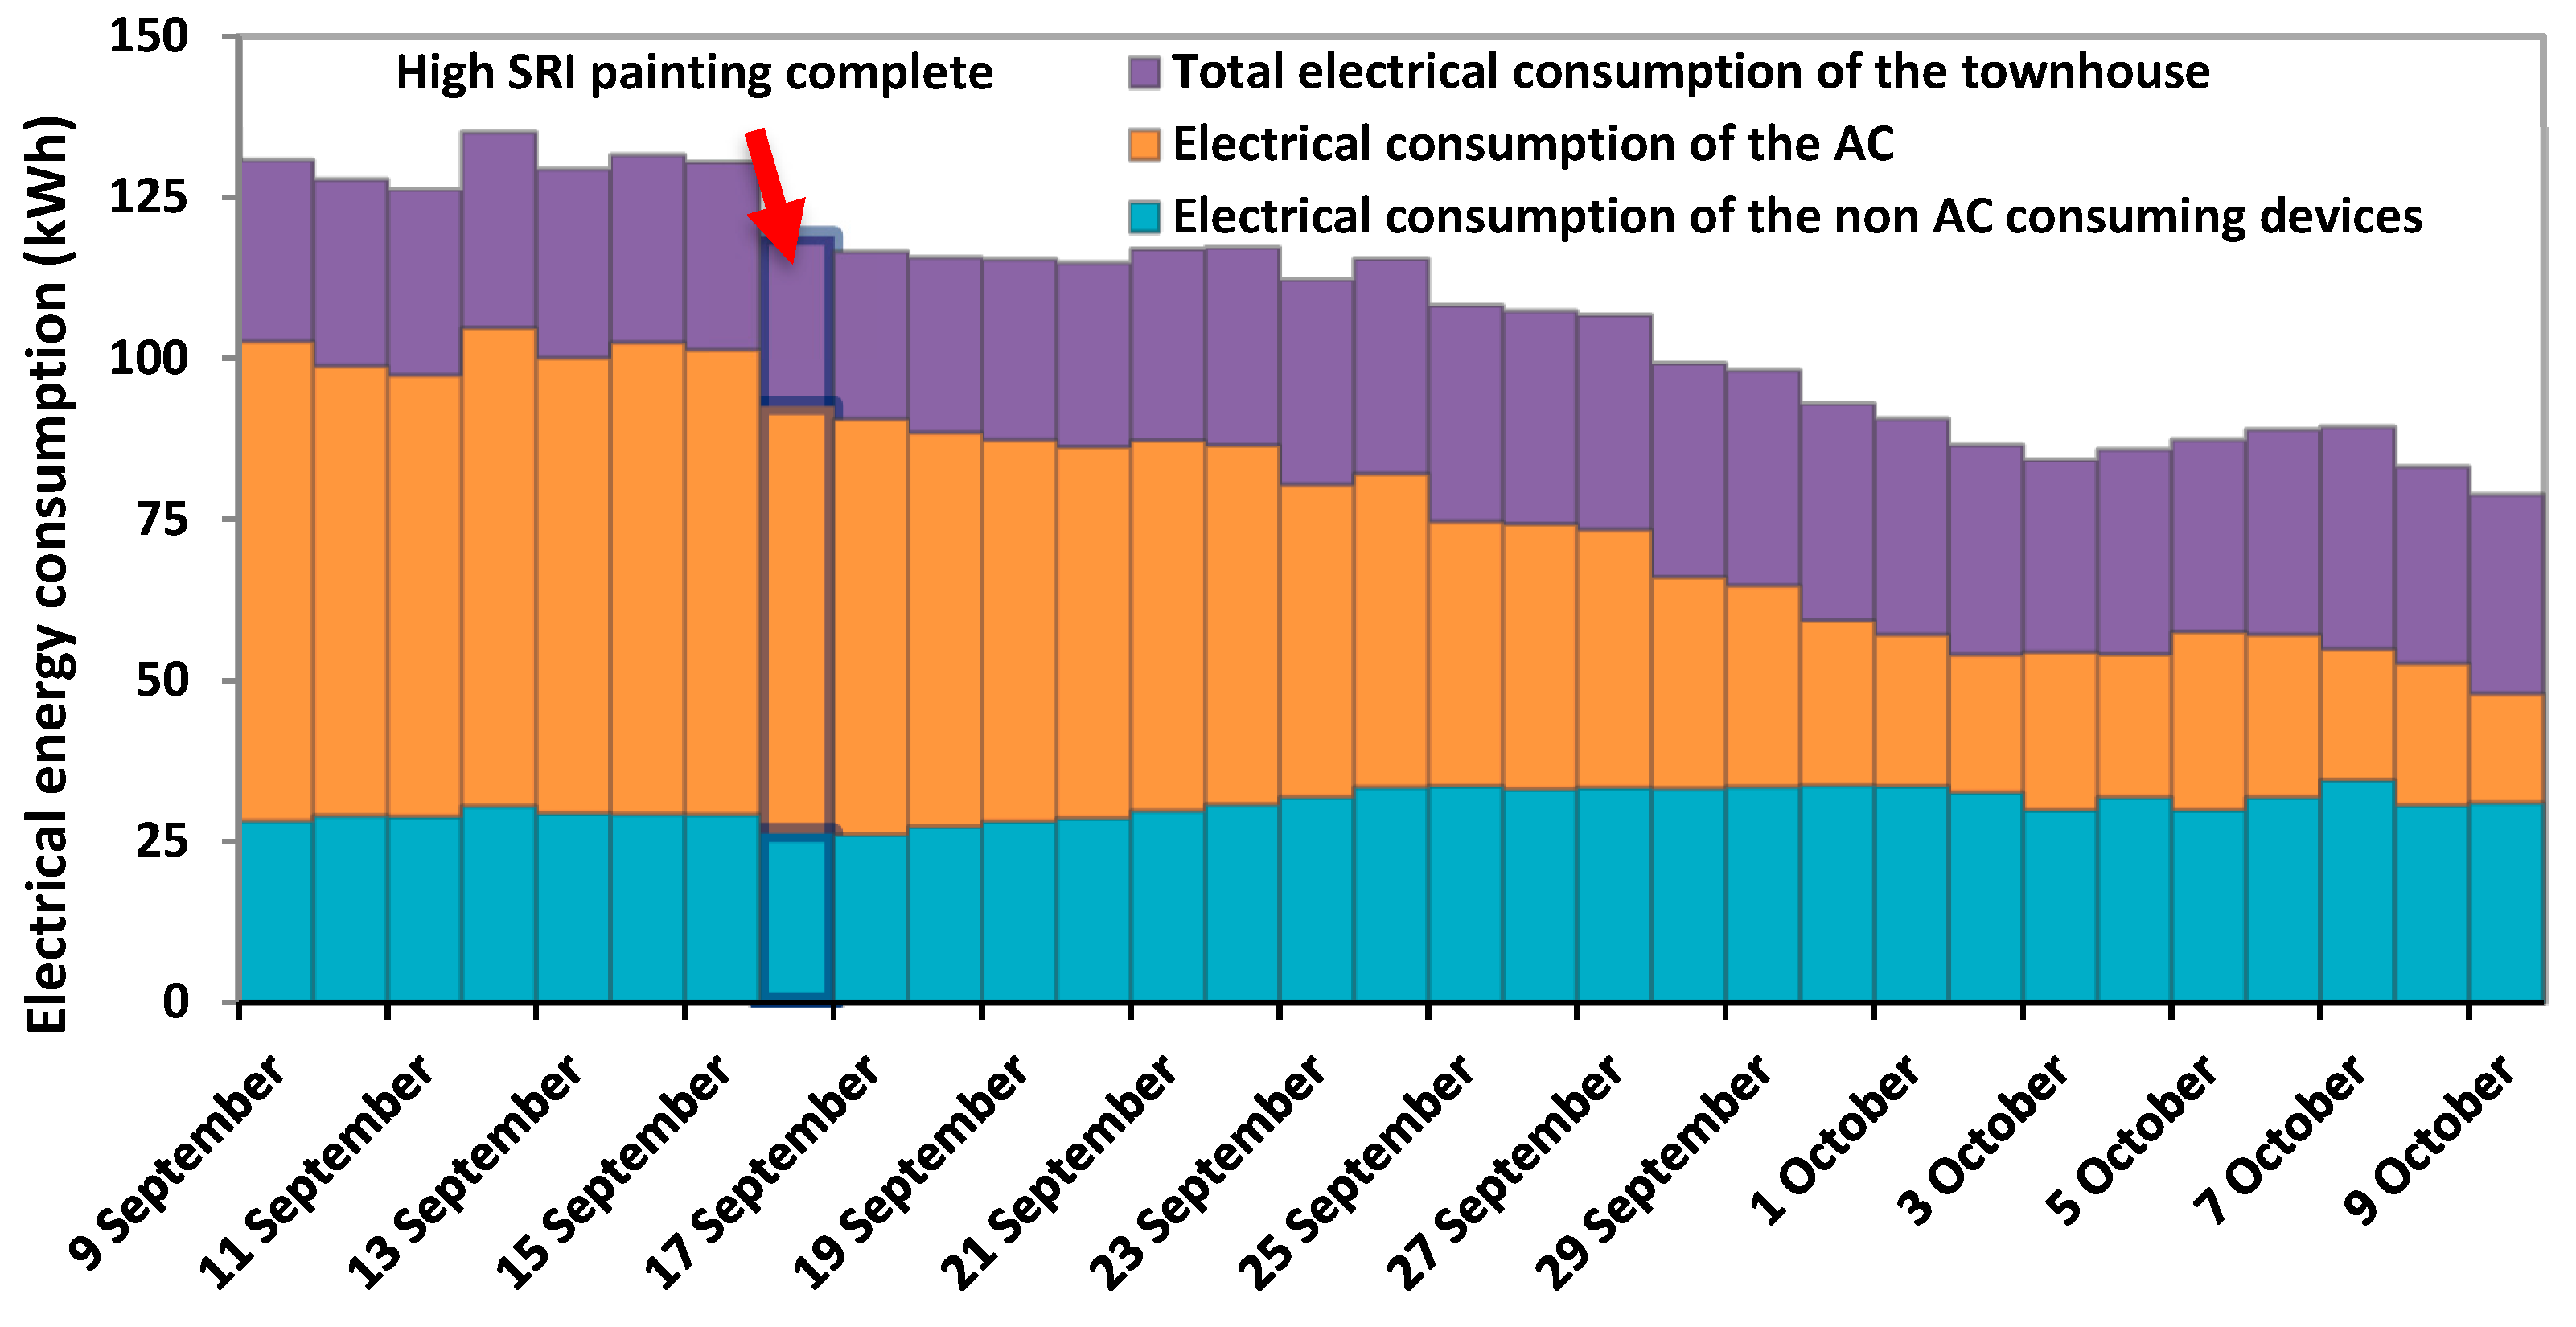
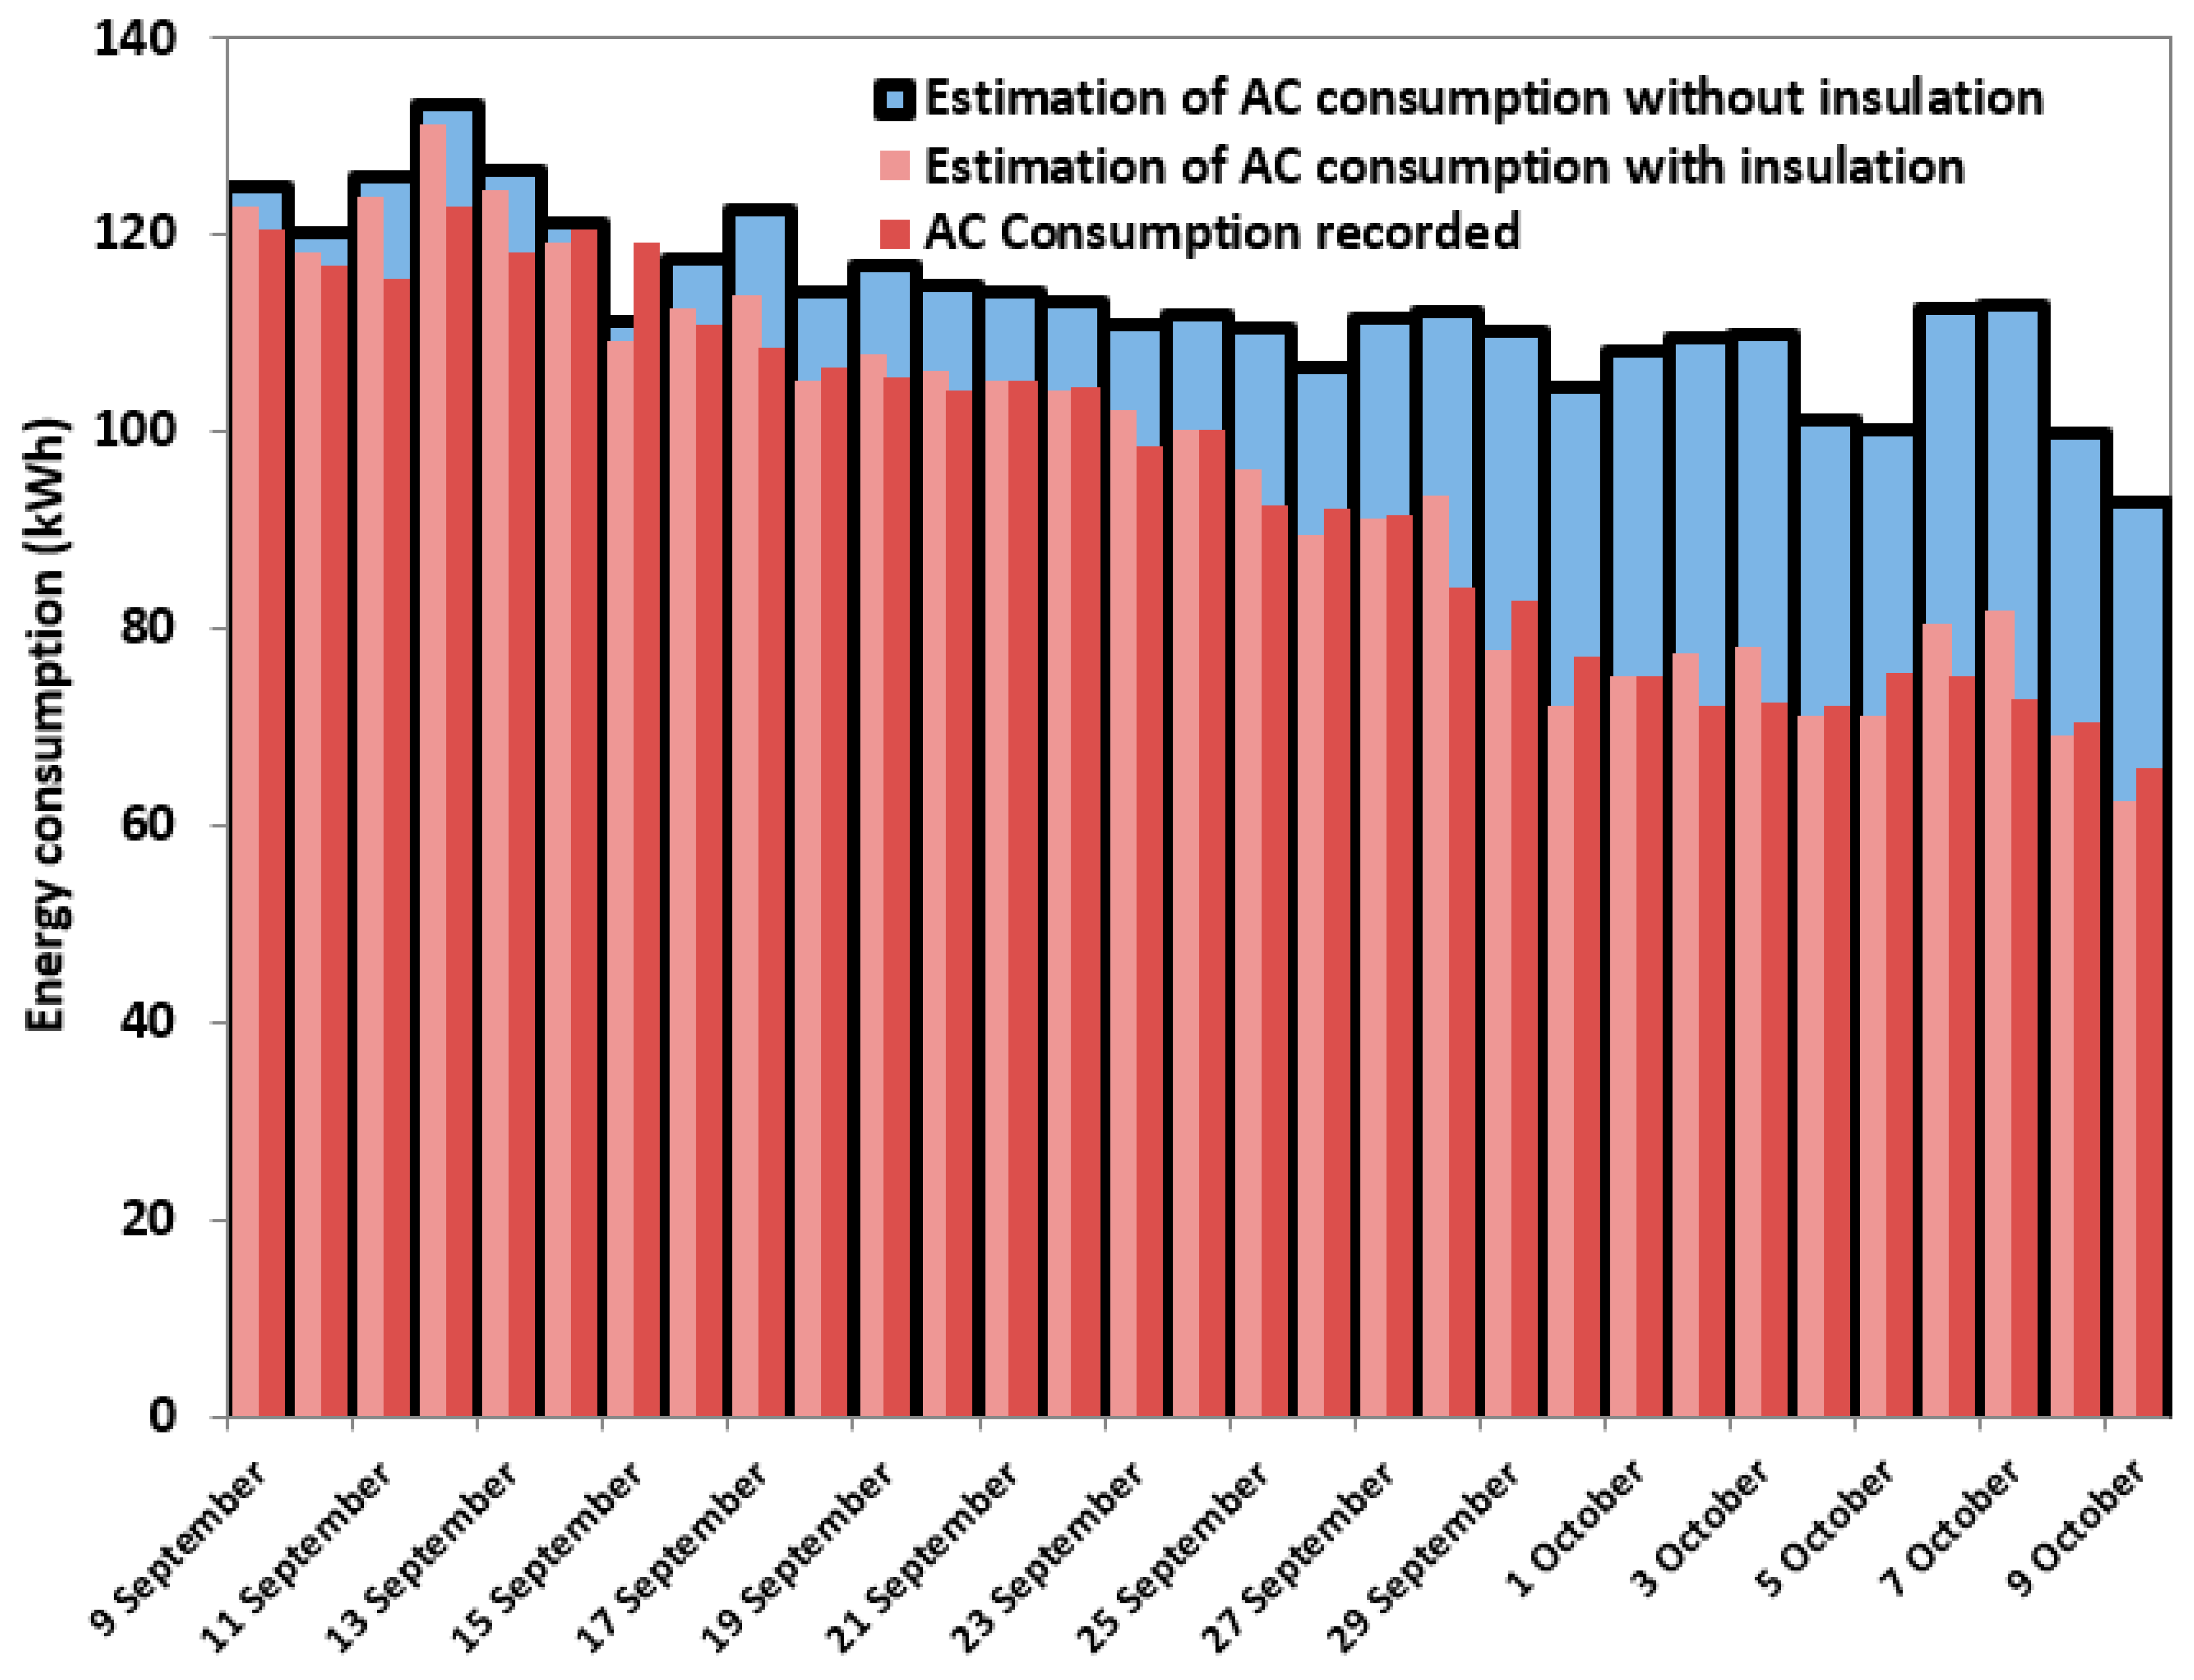
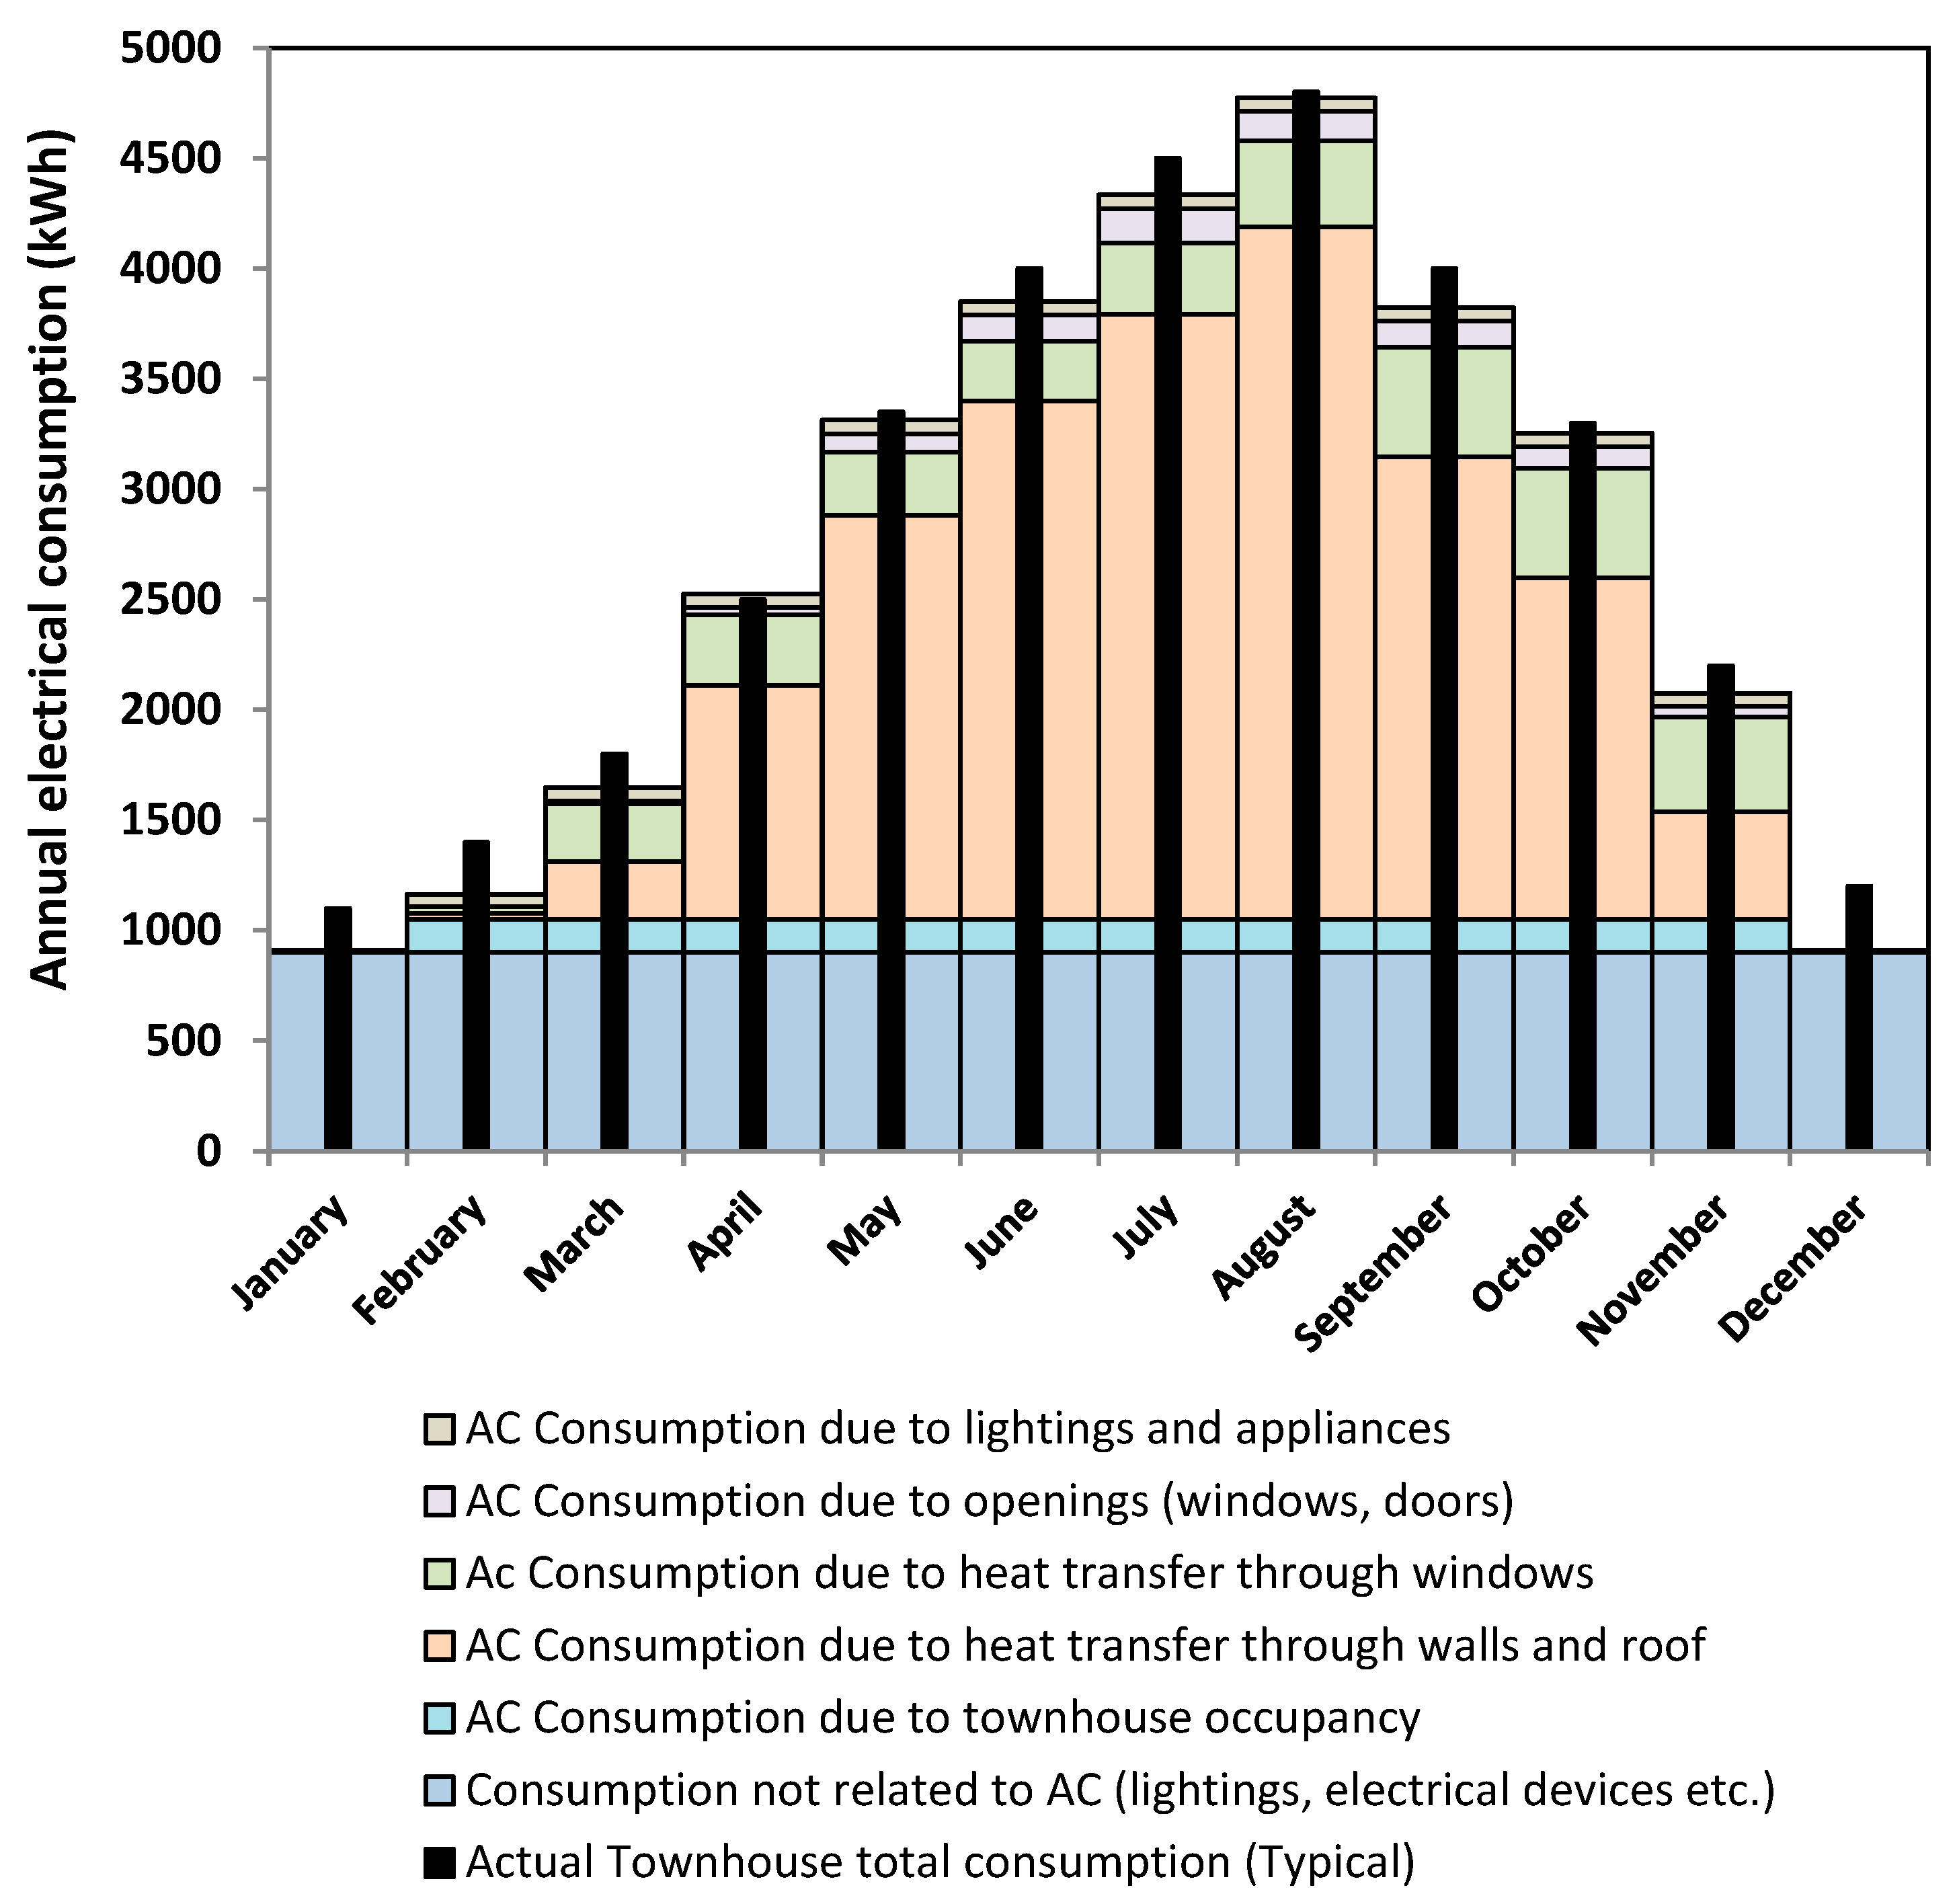
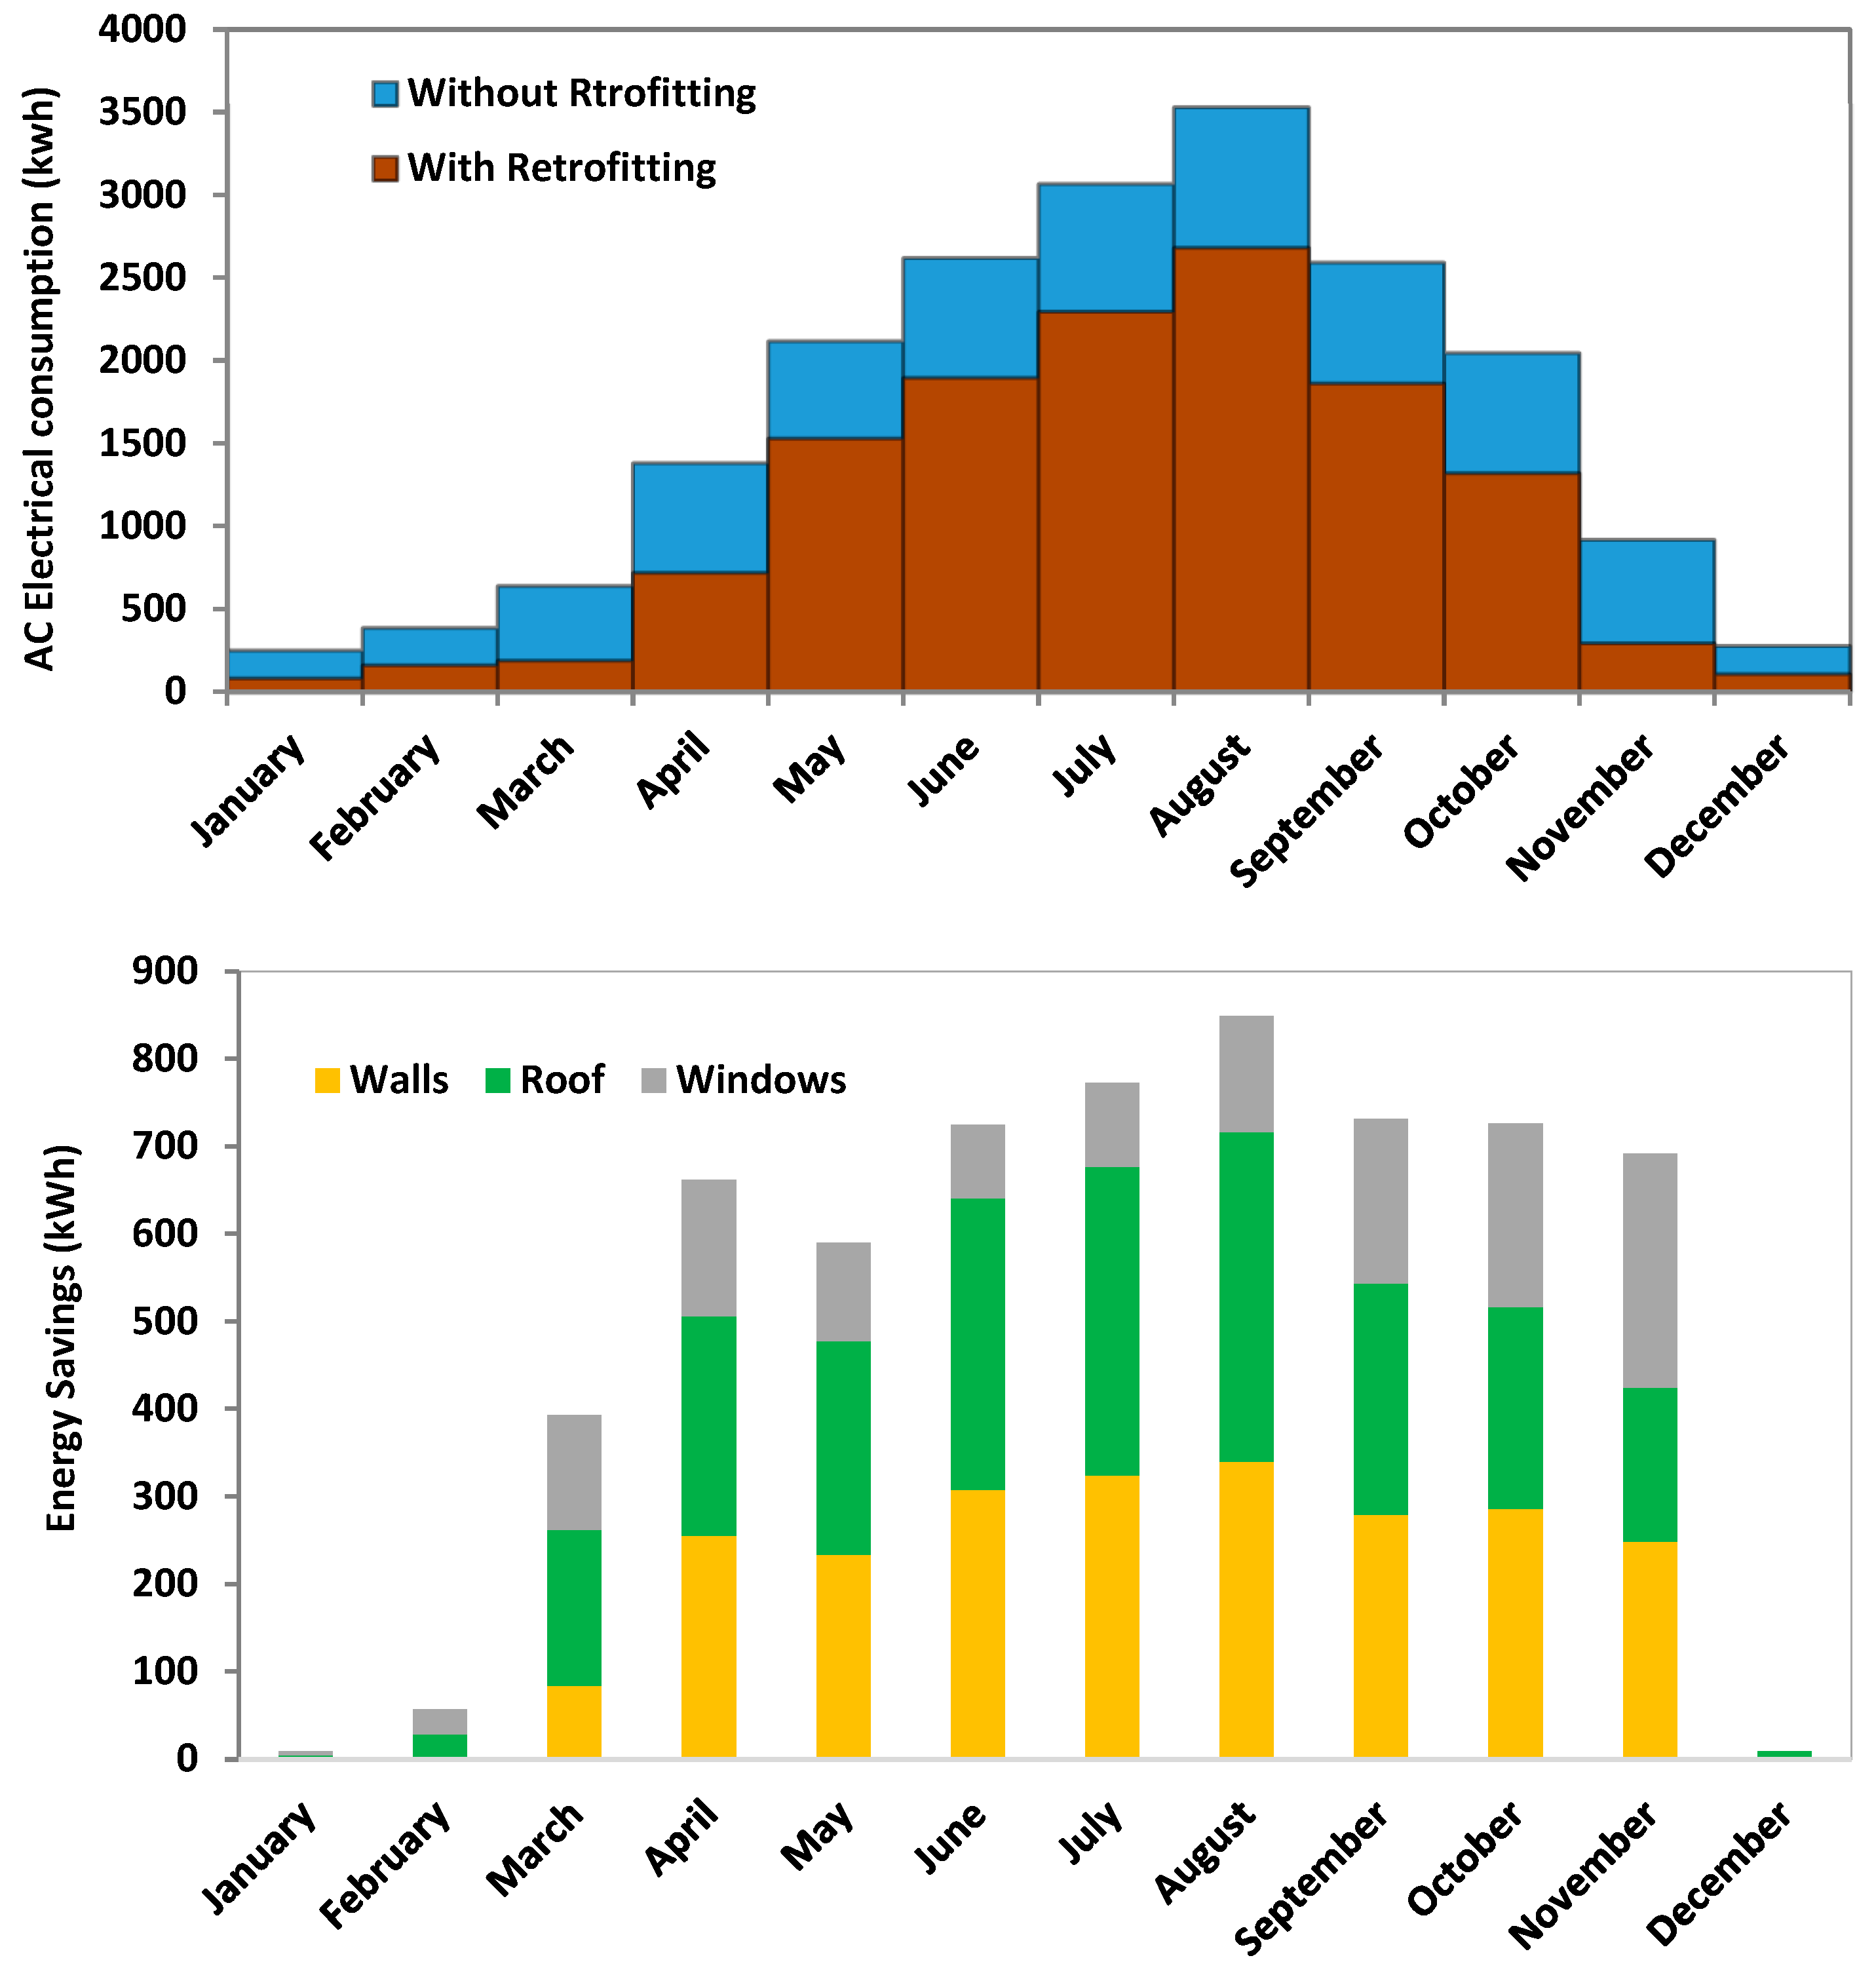
  • The third task is a month-long real-scale experimental campaign on a townhouse building near the natural weathering and pilot-scale facilities in Ras Al Khaimah, UAE. The cooling load reductions are estimated through the retrofitting options (cool wall, roof, and window films) and validated using experimental measurements with reasonable accuracy. A base case Townhouse model is established for comparative assessment and annual cooling load reduction of 34%, estimated with a contribution of 38, 39, and 23% for retrofitting with cool walls, roof, and thermal films. The corresponding retrofitting improvements are a 90 and 80% increase in solar reflectance for the roof and wall with cool paints and doubled SHGC for window glass with thermal films.
  • Task four involves detailed parametric evaluations beginning with AC set point and COP changes. As expected, lowering the setpoint improves the annual cooling energy savings while increasing the COP offsets the reduction of the savings through cool paint retrofitting (as savings due to efficient AC increases). Further, cool paint retrofitting of traditional townhouses with low COPs for HVAC units gains an advantage over modern buildings with other energy efficiency measures in place. The study further highlights the importance of the aging effects of cool paints in terms of long-term savings. The study assessed the necessity of considering the dynamic reduction of SRI values with time and proposed a balanced approach of using annual average SRI values for energy savings estimation (instead of initial or final values). Energy models using initial values overestimate energy savings by around 10%, and in long-term estimations, this could significantly mislead actual performance due to aging. Further, the estimation of %ESR shows 31% reductions for cool white roofs and 28.5 to 44% reduction for changing colors between lighter to darker shades.
  • Finally, the evaluations extended to four major cities in the GCC. During the first 3 years of the cool roof paint application, a maximum energy savings of 25.6 kWh/m2 is observed for Riyadh and a minimum of 12.4 kWh/m2 in Kuwait. The savings for cool color painted walls are higher in Abu Dhabi (8.4 kW/m2 for light beige) and least for Kuwait (1.9 kWh/m2 for light grey). In terms of energy efficiency through cooling energy reduction, cool paint application in Riyadh is highly favorable, and Doha is the least. Further, economic savings are highest for Abu Dhabi and least for Kuwait City. For CO2 emission reduction, buildings in Abu Dhabi stand better, and the least reductions are estimated for Doha.
In summary, combined cool roof and wall retrofitting in the GCC region could serve as a simple and effective approach to reducing cooling energy demands. The results showed significant operational energy savings for the various cool coatings and aging effect combinations. On this basis, it was discovered that the annual total loads through the walls and roofs had decreased. As the absorptivity of the roof or exterior wall coating decreased, the decline in cooling loads was more pronounced. Based on the acquired findings in terms of energy reduction and associated environmental benefits, the use of cool coatings with low solar absorptivity or high SRI values is advised for the refurbishing of the roofs and walls in the residential buildings in the climatic zones considered in this study. However, the long-term savings using these paints is debatable as they are susceptible to degradation with aging. The building energy regulation codes in the region stress upon using high SRI materials for energy efficiency, but no mandates are in place to qualitatively assess their long-term viability. This work provides experimental, theoretical methods for qualitative and quantitative assessment of aging and long-term energy savings through cool paint retrofitting in residential buildings in GCC. The present work had a great scope to be extended for life cycle assessment (LCA), considering maintenance, cost, and other factors. The life cycle analysis assesses the financial benefit of adopting such cool wall and roof retrofitting strategies in the region accounting for the aging effect.

Author Contributions

Conceptualization, T.U.K.N.; data curation, T.U.K.N. and W.U.K.; formal analysis, T.U.K.N., W.U.K., K.A., T.S. and M.A.A.; investigation, T.U.K.N. and W.U.K.; methodology, T.U.K.N.; project administration, T.U.K.N. and W.U.K.; resources, T.U.K.N., W.U.K. and K.A.; software, T.U.K.N. and T.S.; supervision, T.U.K.N., T.S. and M.A.A.; validation, T.U.K.N.; visualization, T.U.K.N., W.U.K., K.A., T.S. and M.A.A.; writing—original draft, T.U.K.N., W.U.K. and K.A.; writing—review and editing, T.U.K.N., W.U.K., K.A., T.S. and M.A.A. All authors have read and agreed to the published version of the manuscript.

Funding

This research received no external funding.

Data Availability Statement

The data presented in this study are available on request from the corresponding author.

Acknowledgments

The authors would like to thank RAKRIC current and ex-staff for their support during the experimental investigation.

Conflicts of Interest

The authors declare no conflict of interest.

Nomenclature

αsolar absorptance
σStefan–Boltzmann constant
εthermal emittance
Υresidual
hheat transfer coefficient (W/m2K)
κthermal conductivity (W/mK)
ρdensity (kg/m3)
νvelocity (m/s)
Asurface area (m2)
Cpheat capacity (J/kg K)
Eradiation (W/m2)
Ppower (W)
Q ˙ heat flow (W/time)
Ttemperature (K)
Uoverall hear transfer coefficient (W/m2K)
Vvolume (m3)
ACHair change hours
ASHRAEAmerican Society of Heating, Refrigerating and Air-Conditioning Engineers
ASTMAmerican Society for Testing and Materials
CDHcooling degree hours
CHTCconvective heat transfer coefficient
COPcoefficient of performance
CRRCcool roof rating council
ECRCEuropean cool roofing council
GCCGulf cooperation council
HVACheating, ventilation, and air conditioning
RAKRas Al khaimah
RMSEroot mean square error
SDstandard deviation
SEERseasonal energy efficiency ratio
SRIsolar reflective index
SHGCsolar heat gain coefficient
UAEUnited Arab Emirates
WWRwindow to wall ratio

References

  1. Rhodes, C.J. The 2015 Paris Climate Change Conference: Cop21. Sci. Prog. 2016, 99, 97–104. [Google Scholar]
  2. IEA. Global Status Report for Buildings and Construction IEA, 2019, Paris. Available online: https://www.iea.org/reports/global-status-report-for-buildings-and-construction-2019 (accessed on 10 November 2022).
  3. IEA. International Energy Outlook 2019, IEA. 2019. Available online: https://www.eia.gov/todayinenergy/detail.php?id=41493 (accessed on 12 October 2022).
  4. Edwin, R.-U.; Sarah, A.; Noura, A.; Mohamed, A.; Fatma, B.; Sgouris, S. Sustainability through energy conservation building codes: Comparative analysis of green building regulations in the middle east. WIT Trans. Ecol. Environ. 2020, 249, 85–100. [Google Scholar] [CrossRef]
  5. Salameh, T.; Assad, M.E.H.; Tawalbeh, M.; Ghenai, C.; Merabet, A.; Öztop, H.F. Analysis of cooling load on commercial building in UAE climate using building integrated photovoltaic façade system. Sol. Energy 2020, 199, 617–629. [Google Scholar] [CrossRef]
  6. Khan, M.; Hassabou, A.; Heithorst, B.; Spinnler, M. Energy efficient & sustainable buildings in Qatar & integration of solar assisted air-conditioning technology—A step towards grid free zero carbon living. In Proceedings of the ISES EuroSun 2018 Conference—12th International Conference on Solar Energy for Buildings and Industry, Rapperswil, Switzerland, 10–13 September 2018. [Google Scholar] [CrossRef]
  7. Kulaib, A.; Kalendar, A.; Hussain, S.; Alhendal, Y. A parametric study of the energy efficiency of existing air-conditioned buildings in Kuwait. J. Green Build. 2021, 16, 163–178. [Google Scholar] [CrossRef]
  8. Radhi, H. Can envelope codes reduce electricity and CO2 emission in different types of buildings in the hot climate of Bahrain? Energy 2009, 34, 205–215. [Google Scholar] [CrossRef]
  9. Abdullah, A.; Sgouridis, S.; Griffiths, S.; Gielen, D.; Saygin, D.; Wagner, N. Renewable Energy Prospects: United Arab Emirates, REmap 2030 Analysis. Abu Dhabi. 2015. Available online: https://www.irena.org/publications/2015/Apr/Renewable-Energy-Prospects-United-Arab-Emirates (accessed on 15 November 2022).
  10. Yang, X.; Jin, T.; Yao, L.; Zhu, C.; Peng, L.L. Assessing the impact of urban Heat Island effect on building cooling load based on the local climate zone scheme. Procedia Eng. 2017, 205, 2839–2846. [Google Scholar] [CrossRef]
  11. Mirzaei, P.A.; Aghamolaei, R. The Hot Climate of the Middle East. In Advances in 21st Century Human Settlements; Enteria, N., Santamouris, M., Eicker, U., Eds.; Urban Heat Island (UHI) Mitigation; Springer: Singapore, 2021. [Google Scholar] [CrossRef]
  12. McCarthy, M.P.; Best, M.J.; Betts, R.A. Climate change in cities due to global warming and urban effects. Geophys. Res. Lett. 2010, 37, L09705. [Google Scholar] [CrossRef]
  13. Kandya, A.; Mohan, M. Mitigating the Urban Heat Island effect through building envelope modifications. Energy Build. 2018, 164, 266–277. [Google Scholar] [CrossRef]
  14. Buildings Permits Portal, Unified Guidebook of Building Permit Regulations. Government of Bahrain (GBH). 2019. Available online: https://benayat.app.gov.bh/Building_Permit_Code_ENG_v1.1_en.pdf (accessed on 1 October 2022).
  15. Kingdom of Kuwait Ministry of Electricity and Water, Energy Conservation Program—Code of Practice, Supreme Counc. Energy. 2014. Available online: https://rise.esmap.org/data/files/library/kuwait/EE/EE%20-%20Energy%20conservation%20code.pdf (accessed on 1 October 2022).
  16. DM, Green Buildings Regulations and Specifications. Dubai Municipality, Dubai Electricity and Water Authority, Government of Dubai. UAE. 2011. Available online: www.login.dm.gov.ae (accessed on 1 October 2022).
  17. Abu Dhabi Quality and Conformity Council, Abu Dhabi certification Scheme for high SRI materials, ADQCC. 2016. Available online: https://jawdah.qcc.abudhabi.ae/en/Certifications/Product/pages/productcertificationdetails.aspx (accessed on 1 September 2022).
  18. Abu Dhabi Urban Planning Council, The Pearl Rating System for Estidama—Public Realm Rating System Design & Construction. 2016. Available online: https://www.dmt.gov.ae/-/media/Project/DMT/DMT/E-Library/0001-Manuals/PRRS/PRRS-Version-10.pdf (accessed on 1 September 2022).
  19. Ras Al Khaimah Municipality Department, Barjeel—Ras Al Khaimah Green Building Regulations. Government of Ras Al Khaimah. 2018. Available online: https://mun.rak.ae/Documents/EER/Barjeel%20-%20Green%20Building%20Regulations.pdf (accessed on 1 September 2022).
  20. Sustainable Building, Mostadam Rating System 2019. Kingdom of Saudi Arabia Ministry of Housing. 2019. Available online: https://www.mostadam.sa/sites/default/files/2020-12/Mostadam%20for%20Residential%20Buildings%20O%2BE%20Manual_0.pdf (accessed on 1 October 2022).
  21. Gulf Organization for Research & Development, GSAS Technical Guide 2019, no. 2. Government of Qatar. 2019. Available online: https://gsas.gord.qa/wp-content/uploads/2021/10/GSAS-Technical-Guide_2019.pdf (accessed on 12 October 2022).
  22. Nutakki, T.U.K.; Kazim, W.U. Effects of Natural Weathering on the Performance of High Solar Reflective Index Paint Surfaces Exposed in Harsh Climatic Conditions of United Arab Emirates. Buildings 2022, 12, 1002. [Google Scholar] [CrossRef]
  23. Muscio, A. The Solar Reflectance Index as a Tool to Forecast the Heat Released to the Urban Environment: Potentiality and Assessment Issues. Climate 2018, 6, 12. [Google Scholar] [CrossRef]
  24. Bande, L. Heat Island Mitigation Strategies, with Focus on the Urban Shading Devices. The Case Study of Abu Dhabi Main Island, United Arab Emirates. Ph.D. Thesis, Politecnico di Milano, Milano, Italy, 2017. [Google Scholar]
  25. Akbari, H.; Levinson, R.; Rainer, L. Monitoring the energy-use effects of cool roofs on California commercial buildings. Energy Build. 2005, 37, 1007–1016. [Google Scholar] [CrossRef]
  26. Radhi, H.; Assem, E.; Sharples, S. On the colours and properties of building surface materials to mitigate urban heat islands in highly productive solar regions. Build. Environ. 2013, 72, 162–172. [Google Scholar] [CrossRef]
  27. Saber, H.H. Experimental characterization of reflective coating material for cool roofs in hot, humid and dusty climate. Energy Build. 2021, 242, 110993. [Google Scholar] [CrossRef]
  28. Bande, L.; Cabrera, A.G.; Kim, Y.K.; Afshari, A.; Ragusini, M.F.; Cooke, M.G. A Building Retrofit and Sensitivity Analysis in an Automatically Calibrated Model Considering the Urban Heat Island Effect in Abu Dhabi, UAE. Sustainability 2019, 11, 6905. [Google Scholar] [CrossRef]
  29. Dominguez-Delgado, A.; Domínguez-Torres, H.; Domínguez-Torres, C.-A. Energy and Economic Life Cycle Assessment of Cool Roofs Applied to the Refurbishment of Social Housing in Southern Spain. Sustainability 2020, 12, 5602. [Google Scholar] [CrossRef]
  30. Saafi, K.; Daouas, N. A life cycle cost analysis for an optimum combination of cool coating and thermal insulation of residential building roofs in Tunisia. Energy 2018, 152, 925–938. [Google Scholar] [CrossRef]
  31. Boixo, S.; Diaz-Vicente, M.; Colmenar, A.; Castro, M.A. Potential energy savings from cool roofs in Spain and Andalusia. Energy 2012, 38, 425–438. [Google Scholar] [CrossRef]
  32. RAK Research and Innovation Center: Natural Weathering Farm. Available online: https://goo.gl/maps/95xUCLjKeCRoZ8wF6 (accessed on 1 September 2022).
  33. Shirakawa, M.A.; de Lima, L.N.; Gaylarde, C.C.; Silva Junior, J.A.; Loz, P.H.F.; John, V.M. Effects of natural aging on the properties of a cool surface exposed in different Brazilian environments. Energy Build. 2020, 221, 110031. [Google Scholar] [CrossRef]
  34. De Masi, R.F.; Ruggiero, S.; Vanoli, G.P. Acrylic white paint of industrial sector for cool roofing application: Experimental investigation of summer behavior and aging problem under Mediterranean climate. Sol. Energy 2018, 169, 468–487. [Google Scholar] [CrossRef]
  35. Mastrapostoli, E.; Santamouris, M.; Kolokotsa, D.; Vassilis, P.; Venieri, D.; Gompakis, K. On the ageing of cool roofs: Measure of the optical degradation, chemical and biological analysis and assessment of the energy impact. Energy Build. 2016, 114, 191–199. [Google Scholar] [CrossRef]
  36. Zeilink, A. Durability, Pausing for Reflection on Aging of the Cool Roof. Journal of Architect Coatings. 2008. Available online: https://www.paintsquare.com/library/articles/Durability_Pausing_for_reflection_on_aging_of_the_cool_roof.pdf (accessed on 12 October 2022).
  37. ASTM-E1980-11; Standard Practice for Calculating Solar Reflectance Index of Horizontal and Low-Sloped Opaque Surfaces. American Society for Testing and Materials: West Conshohocken, PA, USA, 2011.
  38. ANSI/CRRC S100; Standard Test Methods for Determining Radiative Properties of Materials. American National Standards Institute (ANSI): Washington, DC, USA, 2021. Available online: https://coolroofs.org/product-rating/ansi-crrc-s100 (accessed on 12 October 2022).
  39. ASTM-C1549-15; Standard Test Method for Determination of Solar Reflectance near Ambient Temperature Using a Portable Solar Reflectometer. American Society for Testing and Materials: West Conshohocken, PA, USA, 2015.
  40. ASTM-C1371-10; Test Method for Determination of Emittance of Materials Near Room Temperature Using Portable Emissometers. American Society for Testing and Materials: West Conshohocken, PA, USA, 2010.
  41. Domínguez-Torres, C.A.; Domínguez-Torres, H.; Domínguez-Delgado, A. Optimization of a Combination of Thermal Insulation and Cool Roof for the Refurbishment of Social Housing in Southern Spain. Sustainability 2021, 13, 10738. [Google Scholar] [CrossRef]
  42. Burdick, A. Strategy Guideline: Accurate Heating and Cooling Load Calculations; National Renewable Energy Lab. (NREL): Golden, CO, USA, 2011. [Google Scholar] [CrossRef]
  43. Baneshi, M.; Maruyama, S. The impacts of applying typical and aesthetically-thermally optimized TiO2 pigmented coatings on cooling and heating load demands of a typical residential building in various climates of Iran. Energy Build. 2015. [Google Scholar] [CrossRef]
  44. Baneshi, M.; Gonome, H.; Maruyama, S. Cool black roof impacts into the cooling and heating load demand of a residential building in various climates. Sol. Energy Mater. Sol. Cells 2016, 152, 21–33. [Google Scholar] [CrossRef]
  45. Hickson, R.I.; Barry, S.I.; Mercer, G.N.; Sidhu, H.S. Finite difference schemes for multilayer diffusion. Math. Comput. Model. 2011, 54, 210–220. [Google Scholar] [CrossRef]
  46. Parsons, R.A. ASHRAE Fundamentals Handbook (SI); American Society of Heating, Refrigerating and Air Conditioning Engineers Inc.: Atlanta, GA, USA, 1997. [Google Scholar]
  47. Wang, S.K. Handbook of Air Conditioning and Refrigeration, 2nd ed.; McGraw-Hill: New York, NY, USA, 2001. [Google Scholar]
  48. Blanding, M.; Kyle, H.; Reddy, R.; Kumar, U.; Kayal, H. Design and Validation of Solar Calorimeter. Sustainability in Energy and Buildings. Res. Adv. 2012, 1, 17. Available online: http://nimbusvault.net/publications/koala/SEBRA/36.html (accessed on 1 September 2022).
  49. Suehrcke, H.; Peterson, E.L.; Selby, N. Effect of roof solar reflectance on the building heat gain in a hot climate. Energy Build. 2008, 40, 2224–2235. [Google Scholar] [CrossRef]
  50. Hoyt, T.; Arens, E.; Zhang, H. Extending air temperature setpoints: Simulated energy savings and design considerations for new and retrofit buildings. Build. Environ. 2015, 88, 89–96. [Google Scholar] [CrossRef]
  51. Friess, W.A.; Rakhshan, K.; Hendawi, T.A.; Tajerzadeh, S. Wall insulation measures for residential villas in Dubai: A case study in energy efficiency. Energy Build. 2012, 44, 26–32. [Google Scholar] [CrossRef]
  52. Aboulnaga, M.M.; Elsheshtawy, Y.H. Environmental sustainability assessment of buildings in hot climates: The case of the UAE. Renew. Energy 2001, 24, 553–563. [Google Scholar] [CrossRef]
  53. Rakhshan, K.; Friess, W.A. Effectiveness and viability of residential building energy retrofits in Dubai. J. Build. Eng. 2017, 13, 116–126. [Google Scholar] [CrossRef]
  54. Radwan, A.A.; Narayan, S. A recent review of energy efficiency and renewable energy in the Gulf Cooperation Council (GCC) region. Int. J. Green Energy 2021, 18, 1441–1468. [Google Scholar] [CrossRef]
  55. Fayad, F.A.; Maref, W.; Awad, M.M. Review of White Roofing Materials and Emerging Economies with Focus on Energy Performance Cost-Benefit, Maintenance, and Consumer Indifference. Sustainability 2021, 13, 9967. [Google Scholar] [CrossRef]
  56. Radhi, H.; Sharples, S.; Taleb, H.; Fahmy, M. Will cool roofs improve the thermal performance of our built environment? A study assessing roof systems in Bahrain. Energy Build. 2017, 135, 324–337. [Google Scholar] [CrossRef]
  57. Electricity Prices from Globalprices.com. 2022. Available online: https://www.globalpetrolprices.com/electricity_prices/ (accessed on 10 November 2022).
  58. UN Climate Change, Harmonized Grid Emission Factor Data Set. 2019. Available online: https://unfccc.int/documents/198197 (accessed on 10 November 2022).
  59. TRNSYS17, University of Wisconsin--Madison. Solar Energy Laboratory. TRNSYS, A Transient Simulation Program. Madison, Wis.: The Laboratory. 1975. Available online: https://www.trnsys.com/ (accessed on 1 August 2022).
  60. Cattarin, G.; Causone, F.; Kindinis, A.; Pagliano, L. Empirical and comparative validation of an original model to simulate the thermal behaviour of outdoor test cells. Energy Build. 2018, 158, 1711–1723. [Google Scholar] [CrossRef]
  61. Almushaikah, A.S.; Almasri, R.A. Evaluating the potential energy savings of residential buildings and utilizing solar energy in the middle region of Saudi Arabia—Case study. Energy Explor. Exploit. 2021, 39, 1457–1490. [Google Scholar] [CrossRef]
  62. Ahmed, W.; Asif, M.; Alrashed, F. Application of building performance simulation to design energy-efficient homes: Case study from Saudi Arabia. Sustainability 2019, 11, 6048. [Google Scholar] [CrossRef] [Green Version]
Figure 1. Methodology flow chart followed in this study.
Buildings 13 00419 g001
Figure 2. (a) Triplicate samples of the roof and wall paints exposed at weathering farm on a 5o tilt rack (red box) and (b) Equipment used for SRI evaluation, Solar reflectometer (top), emissometer (bottom).
Buildings 13 00419 g002
Figure 3. Instrumentation layout in pilot scale test cubicle.
Buildings 13 00419 g003
Figure 4. Top view and street view of the Townhouses in Al Hamra village, RAK, UAE.
Buildings 13 00419 g004
Figure 5. Window glass insulation with thermal film; (a) picture showing pyrometer, (b) solar radiation measured on glass with film and without film.
Buildings 13 00419 g005
Figure 6. Thermal imaging of windows outside (top row) and inside (bottom row).
Buildings 13 00419 g006
Figure 7. Picture showing retrofitting townhouse with cool roof and cool walls. (a) Roof coating: before (left) and after (middle); with and without SRI paint right). (b) Wall coating, front facade: before (left), after primer coating (middle) and after both top coatings (right). (c) Walls coating back facade: before (left), after primer coating (middle), and after both top coatings (right).
Buildings 13 00419 g007
Figure 8. Pictures of temperature sensors, AC equipment, and energy meter devices. (a) Temperature sensors installed at various locations. (b) AC units and energy meters.
Buildings 13 00419 g008
Figure 9. Weather charts for the location of the test site in Ras Al Khaimah, UAE. (a) Radiation and temperatures. (b) Wind speed and relative humidity.
Buildings 13 00419 g009
Figure 10. Natural weathering/aging trends for cool roof and wall paints. (a) Solar absorptance (1-solar reflectance). (b) Solar reflective index (SRI).
Buildings 13 00419 g010
Figure 11. Pictures showing the exterior and interior of the pilot test cubicles. (a) Test cubicle. (b) Interior of the cubicles.
Buildings 13 00419 g011
Figure 12. Experimentally measured and model estimated indoor roof and wall temperature profiles.
Buildings 13 00419 g012
Figure 13. Electrical energy consumption recorded in the townhouse during the test cycle.
Buildings 13 00419 g013
Figure 14. Model theoretical estimation versus recorded daily measurements.
Buildings 13 00419 g014
Figure 15. Annual electrical consumption profile of the townhouse without retrofitting.
Buildings 13 00419 g015
Figure 16. Annual energy savings for a retrofitted townhouse (top) with and without retrofits (bottom) savings distribution among options considered.
Buildings 13 00419 g016
Figure 17. Effect of AC set point temperature on average heat flow through high SRI surface.
Buildings 13 00419 g017
Figure 18. Trends showing the aging effect on cooling energy savings.
Buildings 13 00419 g018
Figure 19. Effect of cool wall colors on 3 year cooling energy savings.
Buildings 13 00419 g019
Figure 20. Monthly energy savings contributions of walls colored with high SRI paints.
Buildings 13 00419 g020
Figure 21. Cooling load reduction with the aging of high SRI paints aging for various GCC locations.
Buildings 13 00419 g021
Figure 22. Percentage reduction in Energy savings with aging at various locations.
Buildings 13 00419 g022
Figure 23. Charts depicting the first 3-year energy efficiency (left), cost savings (middle), and CO2 emission reductions of cool paints retrofitting in selected GCC locations in descending order.
Buildings 13 00419 g023
Table 1. Regulations or guidelines related to the use of high SRI materials for buildings.
CountryBuilding Energy Efficiency Regulation or CodeRequirement
Bahrain [14]Bahrain Energy Conservation Code—Thermal Insulation Requirements (1999), Clause 3.4:Cool roof solar reflectance > 0.65 and the thermal emittance > 0.75.
Kuwait [15]Energy Conservation Code of Practice No. R-6 (2014)Not specified
United Arab Emirates (UAE) [16,17,18,19]Estidama Pearl Building/Villa Rating System (PBRS/PVRS) “RE-2: Cool Building Strategies”Roofs − SRI ≥ 78
Abu Dhabi International Energy Conservation Code (AD IECC)SRI > 64 (3-year aged) OR
Solar Reflectance ≥ 0.55 AND
Thermal Emittance ≥ 0.75 Equivalent SRI = 60 (3-year aged)
Dubai Green Building Regulations 304.01 Urban Heat Island Effect “High SRI Roof”Steep-sloped (>1:6): SRI ≥ 29
Flat or low-sloped (<1:6): SRI ≥ 78 For 75% of roof area
Ras Al Khaimah—Barjeel, Green Building Regulations (2018), 405.02 Urban Heat Island Effect ReductionUse light-colored roof materials with a high SRI.
-
White color materials (SRI~90)
-
Beige color materials (SRI~80)
-
Light yellow or light grey materials (SRI~75)
Saudi Arabia [20]Saudi Energy Efficiency
Building Code (2007)
Minimum Solar Reflectance Index of 64 for roof
Qatar [21]Global Building Assessment System (GSAS)
Design and build Guidelines manual, 2019
[S.7] Heat island effect
Consider materials with high solar reflectance (SR) Install roofs with high-albedo values
Use building materials that are light in color
Table 2. Equations related to the evaluation of heat gain in the building [46].
Heat GainEquation
Windows Q ˙ W = S H G C A w   E T + U w A w   ( T o T i )
SHGC = solar heat gain coefficient, Uw = overall heat transfer coefficient of the window, Aw = surface area of fenestration glass
Infiltration or openings Q ˙ i n f = A C H ρ o ,     a i r   C p , a i r   V b u i l d i n g ( T o T i )
ACH = number of air exchanges per hour
Vbuilding = volume of the building
Occupancy Q ˙ o c = N o .   o f   o c c u p a n t s   Q ˙ s , l ,   p e r s o n
Q ˙ s , l ,   p e r s o n is the total sensible and latent heat gain per person
Table 3. Construction characteristics of townhouse used in the study.
Construction PropertyCurrent Study
(Townhouse RAK)
Reference Study [28]
(Villa-Abu Dhabi)
Roof thickness (cm)255 cm350 cm (including airspace)
Wall thickness (cm)220 cm250 cm
Roof reflectance—Base case0.1-
Wall reflectance—Base case0.2-
Roof reflectance—Cool paint0.80.7
Wall reflectance—Cool paint0.80.3
Roof Emittance—All scenarios0.9-
Wall reflectance—All scenarios0.85-
Roof-air internal CHTC (W/m2K)8.35
Wall-air internal CHTC (W/m2K)12.515
Roof-air external CHTC (W/m2K) 10–25 (Variable)20
Wall-air external CHTC (W/m2K)10–25 (Variable)25
Roof U value (W/m2K)1.5–1.75 (Variable)1 (Fixed)
Wall U value (W/m2K)2.5–3.0 (Variable)2 (Fixed)
COP of AC2.8522.6
Cooling set point25 °C24 °C
Table 4. Energy cost, emission factor, and metrological parameters for GCC cities.
GCC LocationEnergy Price ($) [57]Emission Factor (kg CO2/kWh) [58]Weather Parameters (Annual Averages) [59]
Solar Radiation (kWh/m2)Ambient Temp. (°C)Maximum Temp. (°C)Minimum Temp. (°C)Relative Humidity (%)Wind Speed (m/s)
Abu Dhabi, UAE0.0810.31041.926.738.416.1583.6
Doha, Qatar0.0320.25836.026.636.417.8573.2
Riyadh, SA0.0480.37447.825.637.512.9394.0
Kuwait City, KW0.0290.40042.225.938.213.0313.0
Table 5. Experimental validation of model statistical indices.
Building ElementR2γmean (°C)SD γmean (°C)RMSE (°C)
Roof0.9480.2680.5660.626
Wall0.9660.5190.2780.589
Table 6. Annual cooling energy savings of townhouse with changes in AC setpoint and SEER.
SEER or COPAnnual Energy Savings of TH Compared with the Base Case (kWh)
Set Point T = 20 °CSet Point T = 22 °CSet Point T = 24 °CSet Point T = 26 °C
WallsRoofWallsRoofWallsRoofWallsRoof
23903.324149.393752.914038.403528.563710.703204.283353.03
32602.212766.262501.942692.272352.382473.802136.192235.35
41951.662074.691876.462019.201764.281855.351602.141676.51
51561.331659.761501.1661615.361411.431484.281281.711341.21
Table 7. Year after year energy saving reduction for townhouse retrofitted with high SRI paints.
Surface AppliedColorsYear1Year2Year3
αavgSRI% ESRαavgSRI% ESRαavgSRI% ESR
Roof—rWhite0.31483.6911.4%0.38973.3827.4%0.40770.9031.1%
Wall—wLight Beige (LB)0.41568.379.2%0.45662.7322.9%0.46761.2328.5%
Dark Beige (DB)0.50855.6910.4%0.54251.0025.3%0.55149.7631.2%
Light Grey (LG)0.60043.1911.3%0.62839.4326.4%0.63538.4334.0%
Dark grey (DG)0.69330.7913.6%0.71427.9434.5%0.72027.1843.9%
Disclaimer/Publisher’s Note: The statements, opinions and data contained in all publications are solely those of the individual author(s) and contributor(s) and not of MDPI and/or the editor(s). MDPI and/or the editor(s) disclaim responsibility for any injury to people or property resulting from any ideas, methods, instructions or products referred to in the content.

