

A New Drive-by Method for Bridge Damage Inspection Based on Characteristic Wavelet Coefficient


1
Department of Bridge Engineering, Southwest Jiaotong University, Chengdu 610031, China
2
Department of Civil and Environmental Engineering, Colorado State University, Fort Collins, CO 80523, USA
3
School of Civil Engineering and Architecture, Southwest Petroleum University, Chengdu 610500, China
*
Author to whom correspondence should be addressed.
Buildings 2023, 13(2), 397; https://doi.org/10.3390/buildings13020397
Submission received: 25 December 2022
/
Revised: 24 January 2023
/
Accepted: 29 January 2023
/
Published: 1 February 2023
(This article belongs to the Special Issue Structural Identification and Damage Evaluation by Integrating Physics-Based Models with Data)
Abstract
:The drive-by method has become a popular indirect approach for bridge damage inspection (BDI) because of its simplicity in deployment by evaluating the bridge health status solely via the vehicle dynamic response. Derived from the vehicle dynamic response, the recent proposed contact-point response involves no vibration signal with the vehicle frequency, bearing great potential for drive-by BDI. However, an appropriate methodology for the application of contact-point response in drive-by BDI remains lacking. The present study proposes a novel drive-by method, in which a new damage factor index, i.e., the characteristic wavelet coefficient (CWC), is established for bridge damage identification in an efficient and accurate manner. The CWC is obtained by analyzing the contact-point response via the continuous wavelet transform (CWT) and complete ensemble empirical mode decomposition with adaptive noise (CEEMDAN) techniques. CEEMDAN is introduced to overcome the issue of modal aliasing and pseudo-frequency. First, the general framework of the proposed drive-by BDI method is introduced. Then, a demonstration case study is carried out to examine the effectiveness of the proposed method. Subsequently, a parametric study is carried out to explore the effects of several parameters on the performance of BDI including the scale factor, vehicle speed, environmental noise, and boundary effect. The results indicate that the proposed drive-by BDI method can better eliminate the mode mixing and pseudo-frequency problems during the extraction of the CWC, compared with the traditional ensemble empirical mode decomposition method. The extracted CWC curve is smooth, convenient for damage inspection, and has strong anti-noise performance. After adding white noise with a signal-to-noise ratio of 20, a bridge girder with a damage severity of 20% can be identified successfully. In addition, the selection of the scale factor is critical for bridge damage inspection based on the extracted CWC. The effective scale factor of the CWC extracted using the proposed method has a wide range, which improves the inspection efficiency. Finally, a low vehicle speed is beneficial to alleviate the adverse effect of the boundary effect on the damage inspection of bridge girder ends.
1. Introduction
Due to the increase in aging infrastructures worldwide, structural system inspection and damage detection have become increasingly important for structural health status assessment. For bridges in particular, it is also crucial to ensure their structural integrity and safety, because bridges usually serve as the critical links in transportation networks. In general, bridge health inspection methods are mainly divided into two categories, i.e., direct inspection methods and indirect inspection methods. Direct inspection methods aim to detect damage by installing sensors on bridges and analyzing vibration data collected by sensors [1,2,3,4]. Although direct inspection methods have been widely used, they often require a large-scale deployment of sensors on the bridge, leading to demanding costs and cumbersome maintenance. Therefore, a structural health motoring (SHM) system is typically installed on long-span bridges with a relatively higher budget than short- or medium-span bridges [5].
In order to overcome the limitations of direct inspection methods, indirect inspection methods have been proposed for the damage assessment of bridge structures, such as drive-by-based methods, global navigation satellite system (GNSS)-based methods [6], and unmanned aerial vehicle (UAV)-based methods [7]. Among them, the drive-by method was first proposed by Yang et al. [8], and it aims to assess the bridge health status indirectly via the vehicle dynamic response when traveling on the bridge, based on the vehicle–bridge interaction (VBI). The feasibility of the drive-by method was later verified through a real bridge test [9]. Since then, the drive-by method has been widely used by many scholars for detecting damage of bridge girders. In general, the drive-by method constructs the bridge damage index through either the modal related parameters or the non-modal related parameters. As the name implies, the modal-parameter-based drive-by method needs to first identify the frequency, vibration mode, or damping [10,11,12,13] of the bridge, and then further construct the bridge damage index. For example, OBrien et al. [14] presented a novel algorithm for bridge damage detection based on the mode shapes, in which the bridge response was measured from an instrumented vehicle with laser vibrometers and accelerometers. The algorithm was proved to be effective and accurate when the vehicle speed was less than 8 m/s. Similarly, Oshima et al. [15] evaluated two types of damage of a bridge, i.e., immobilization of a support, and a decrease in the stiffness of the bridge girder at the mid-span, via mode shapes estimated from the responses of passing vehicles. In a recent study conducted by Robert and Abdollah [16], the contact-point responses were utilized to extract the bridge frequencies for bridge damage detection, which avoids the effects of the vehicle frequency. It is noteworthy that, although much progress has been made in the last two decades, key challenges remain with the modal-parameter-based drive-by method for bridge damage inspection, including how to extract the modal parameters efficiently and accurately, and how to eliminate the effect of road roughness and noise.
Different from the modal-parameter-based method, the non-modal-parameter-based method does not rely on modal parameters and typically utilizes machine learning and signal processing techniques, which have been proven effective in detecting and locating damage. The advantage of machine learning algorithms is that they can make full use of the massive data collected by the drive-by system. Mei et al. [17] proposed a novel damage detection technique by combining the mel-frequency cepstrum (MFC) and principal component analysis (PCA) for bridge damage detection using drive-by data measured from vehicles. With the proposed method, the influence of temperature and road roughness under operating conditions can be adequately considered. Corbally and Malekjafarian [18] proposed a new data-driven approach for the drive-by monitoring of bridge condition using an artificial neural network (ANN), which is subsequently trained to predict the bridge behavior using acceleration measurements from multiple passes of a traversing vehicle. Sarwar and Cantero [19] proposed a vehicle-assisted bridge damage assessment approach based on a deep autoencoder (DAE) architecture, considering multiple convolutional layers and an LSTM layer. With the proposed approach, the relationship between vehicle responses and bridge dynamics is established successfully. Locke et al. [20] proposed a drive-by health monitoring technique to detect bridge damage considering environmental (temperature) and operational effects (road roughness and random traffic flow). One major challenge of machine-learning-based indirect inspection methods is that massive training data are required, and sometimes the data need to be manually classified or marked. In addition, machine-learning-based indirect inspection methods may not be applicable under complex operational conditions, e.g., road roughness, temperature, and random traffic flow, in practical applications.
Compared with machine-learning-based indirect inspection methods, signal-processing-based methods, e.g., wavelet transform (WT) and empirical mode decomposition (EMD), are more convenient and relatively easy to implement, and they have drawn increasing attention recently. For example, Abdulkareem et al. [21,22,23] proposed a series of wavelet analysis methods to extract the modal shapes of plate structures and to construct structural damage factors. Zhu and Law [24] employed the continuous wavelet transform (CWT) to identify cracks in bridge beam structures under a moving load. Hester and González [25] successfully detected the damage in a 40 m simply supported bridge beam model by analyzing its acceleration response under a moving load via the WT. Nguyen and Hai [26] proposed an approach for detecting a multi-cracked beam-like structure subjected to a moving vehicle based on the on-vehicle vibration signal and wavelet analysis. By using the continuous wavelet method, Khorram et al. [27] compared the effect of the signal obtained by the bridge mid-span sensor and the sensor installed at the contact point between the mobile vehicle and the bridge for damage inspection. The analysis results showed that the inspection method of the bridge contact sensor was more effective. Tan et al. [28] employed Shannon entropy to select the optimal scale factor in the process of the CWT, which improves the efficiency of bridge damage inspection. The aforementioned WT-based methods are mainly implemented on vehicle dynamic responses, while their performance on the vehicle–bridge contact-point response remains unclear. Yang and Chang [29] employed the EMD technique to decompose the vehicle response into a set of intrinsic mode functions (IMFs), with which the bridge frequencies, especially the higher modes, were successfully extracted. Obrien et al. [30] also utilized EMD to decompose the acceleration of a car body’s mass center (vehicle acceleration) to construct the damage index for accurate bridge damage detection. In recent years, ensemble empirical mode decomposition (EEMD) and extreme-point symmetric mode decomposition (ESMD) have been successively used by Zhu and Malekjafarian [31] and Yang et al. [32] to improve the efficiency and accuracy of the frequency inspection of bridges.
It is reported that the above signal decomposition methods such as EEMD still have modal aliasing and pseudo-modal problems [33]. In addition, the contact-point response is proved to be more efficient and accurate than the vehicle dynamic response for bridge damage inspection, yet there is currently a lack of related research in this field [34]. The present study proposes a novel drive-by-based method, in which a new damage factor index, i.e., the characteristic wavelet coefficient (CWC), is established for bridge damage identification in an efficient and accurate manner. The CWC is obtained by analyzing the contact-point response via the CWT and complete ensemble empirical mode decomposition with adaptive noise (CEEMDAN) techniques. CEEMDAN is introduced to overcome the issues of modal aliasing and pseudo-frequency. The remainder of this paper is organized as follows. First, the general framework of the proposed drive-by bridge damage inspection methodology is introduced. Then, a demonstration case study is carried out to examine the effectiveness of the proposed drive-by damage inspection methodology. Subsequently, a parametric study is carried out to explore the effects of several parameters on the performance of the proposed damage inspection methodology including the scale factor, vehicle speed, environmental noise, and boundary effect.
2. Bridge Damage Inspection Methodology
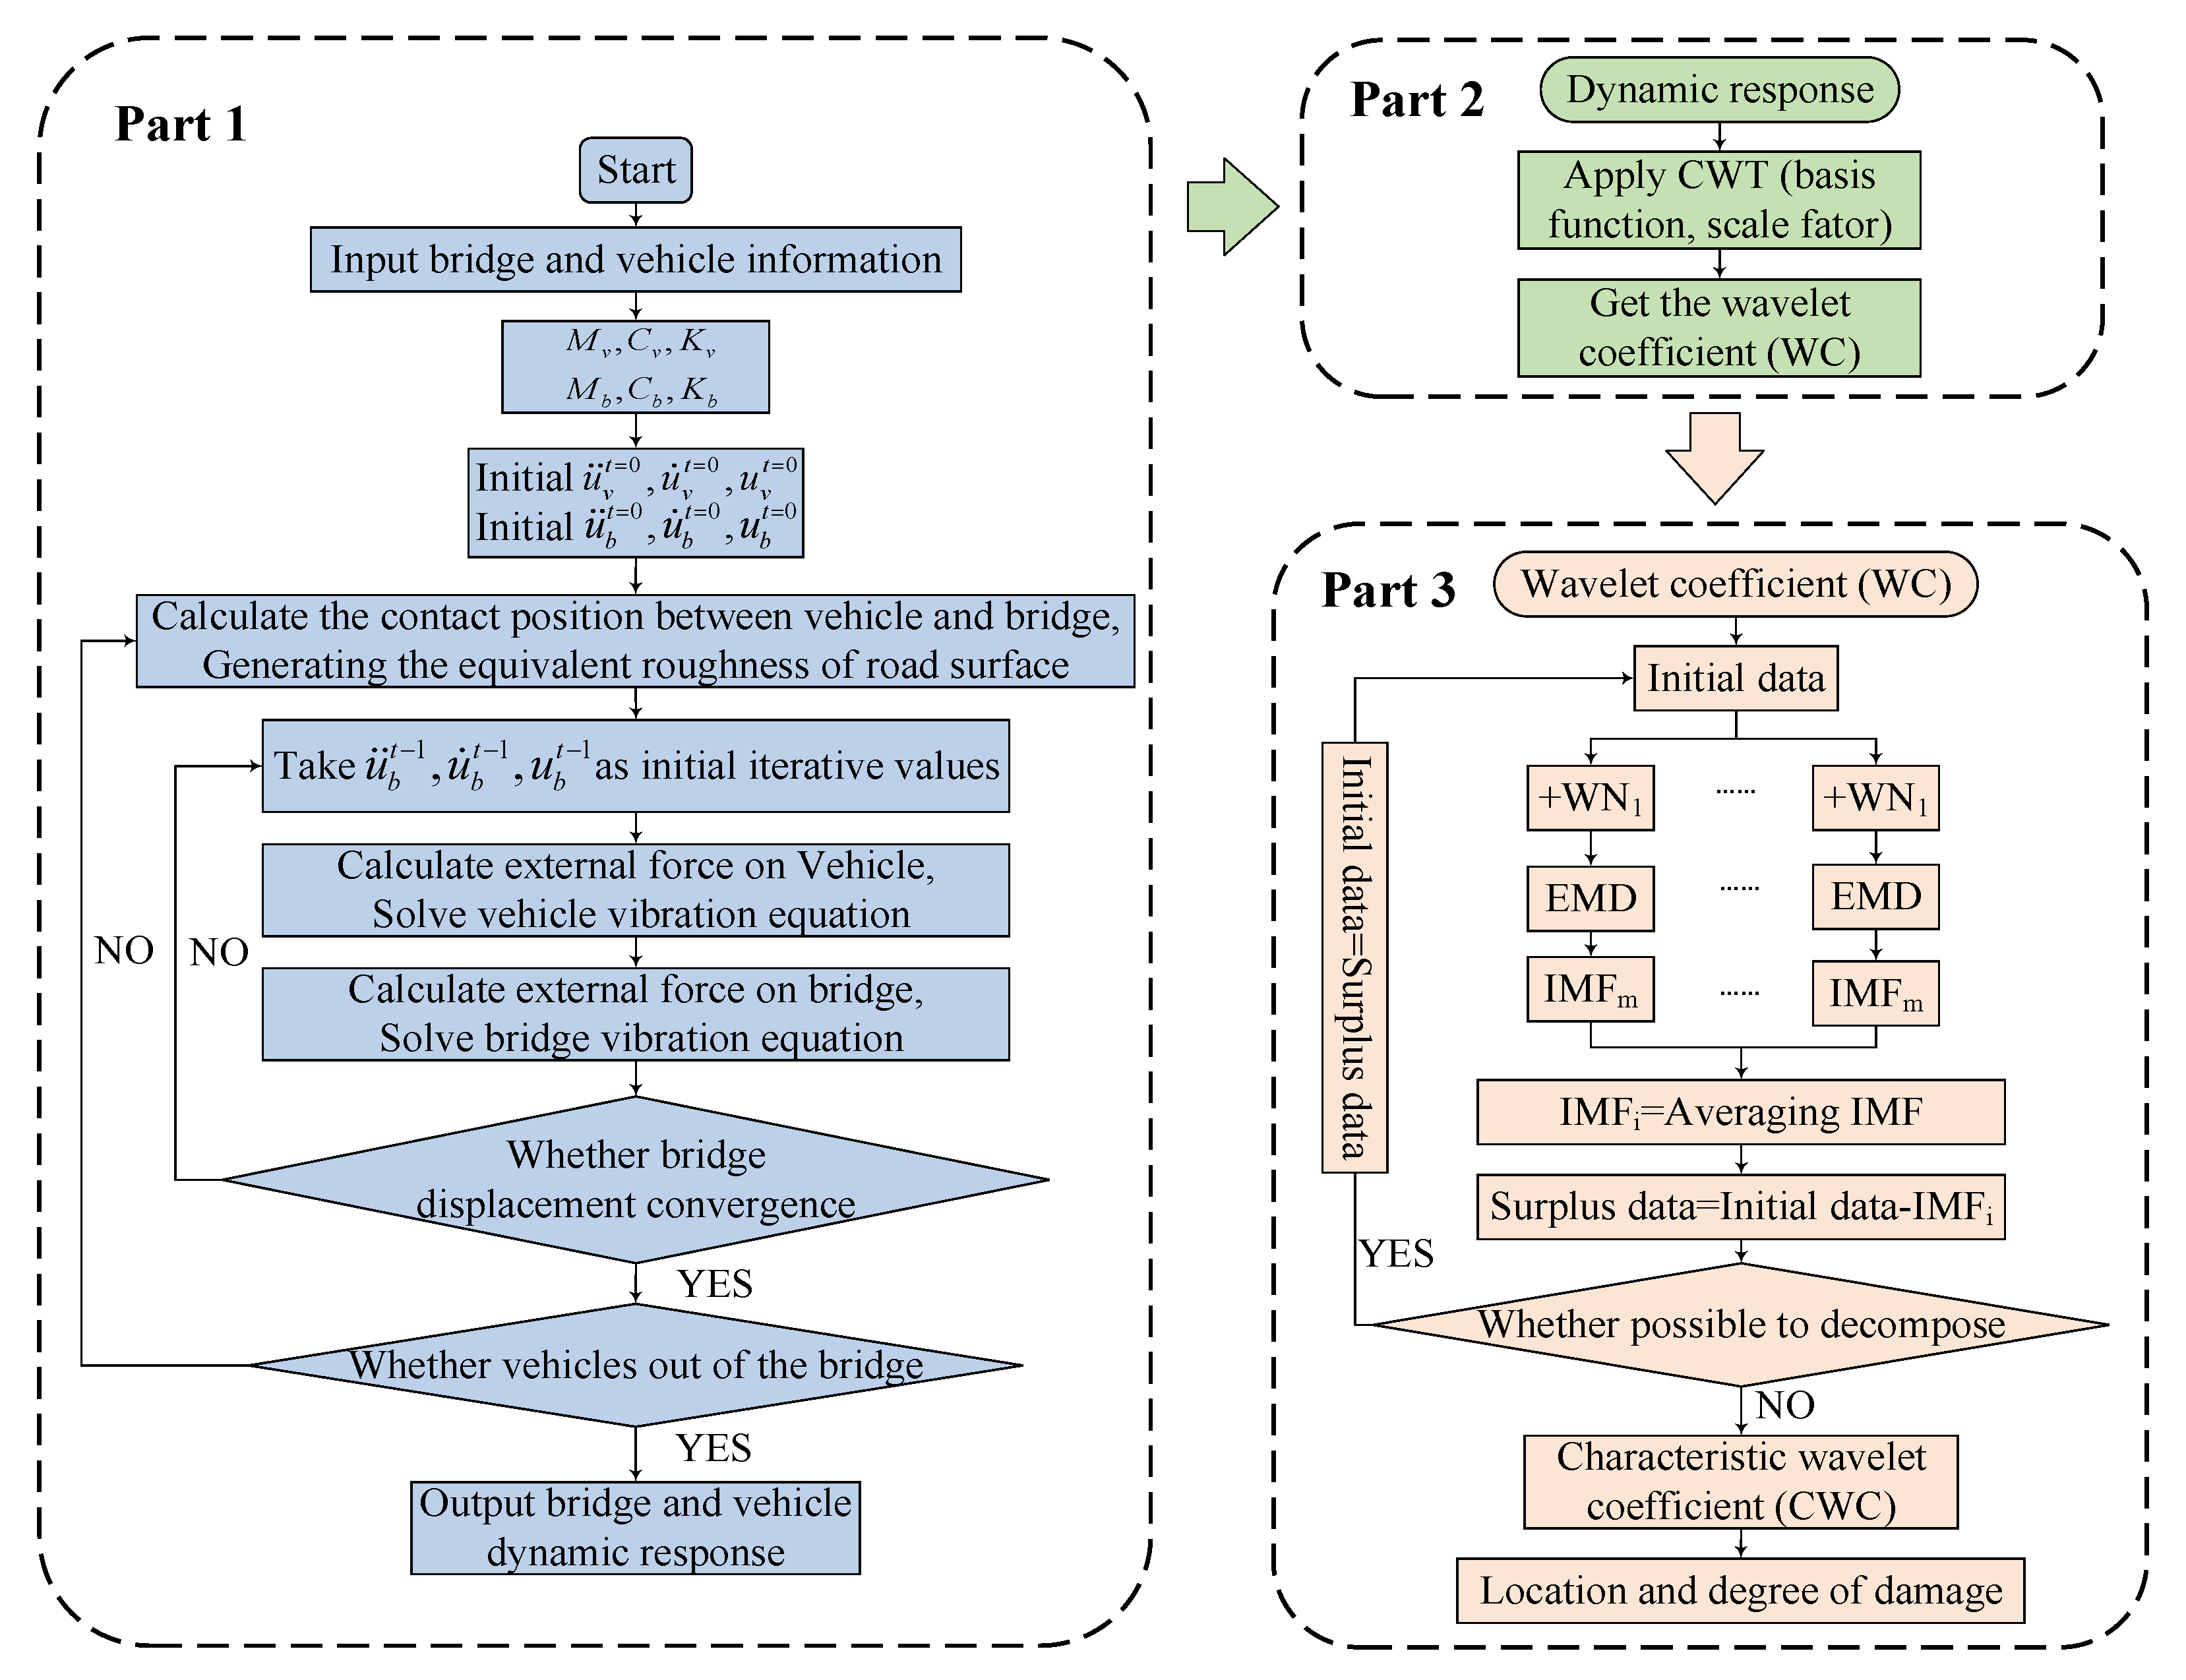
The proposed drive-by bridge damage inspection methodology consists of three parts, i.e., VBI analysis (part I), preliminary damage inspection (part II), and thorough damage inspection (part III), as illustrated in Figure 1. In part I, the VBI analysis is performed, in which the dynamic responses of the vehicle–bridge system are obtained. Subsequently, the dynamic responses of the vehicle–bridge system are analyzed using the CWT, in which the wavelet coefficient (WC) is extracted and used for the preliminary damage inspection of the bridge, as detailed in part II. It is noteworthy that the WC contains a variety of high-order frequency contents of bridge vibration, which has adverse effects on the damage inspection accuracy. To overcome this issue, the WC in part II is further processed by CEEMDAN, with which the CWC is extracted and used for thorough damage inspection, i.e., identifying the damage location and severity of the bridge accurately, as introduced in detail in part III. Each one of the three parts of the proposed drive-by bridge damage inspection methodology will be elaborated in the following subsections.
2.1. Vehicle–Bridge Interaction (VBI) Analysis
2.1.1. Analytical Solution
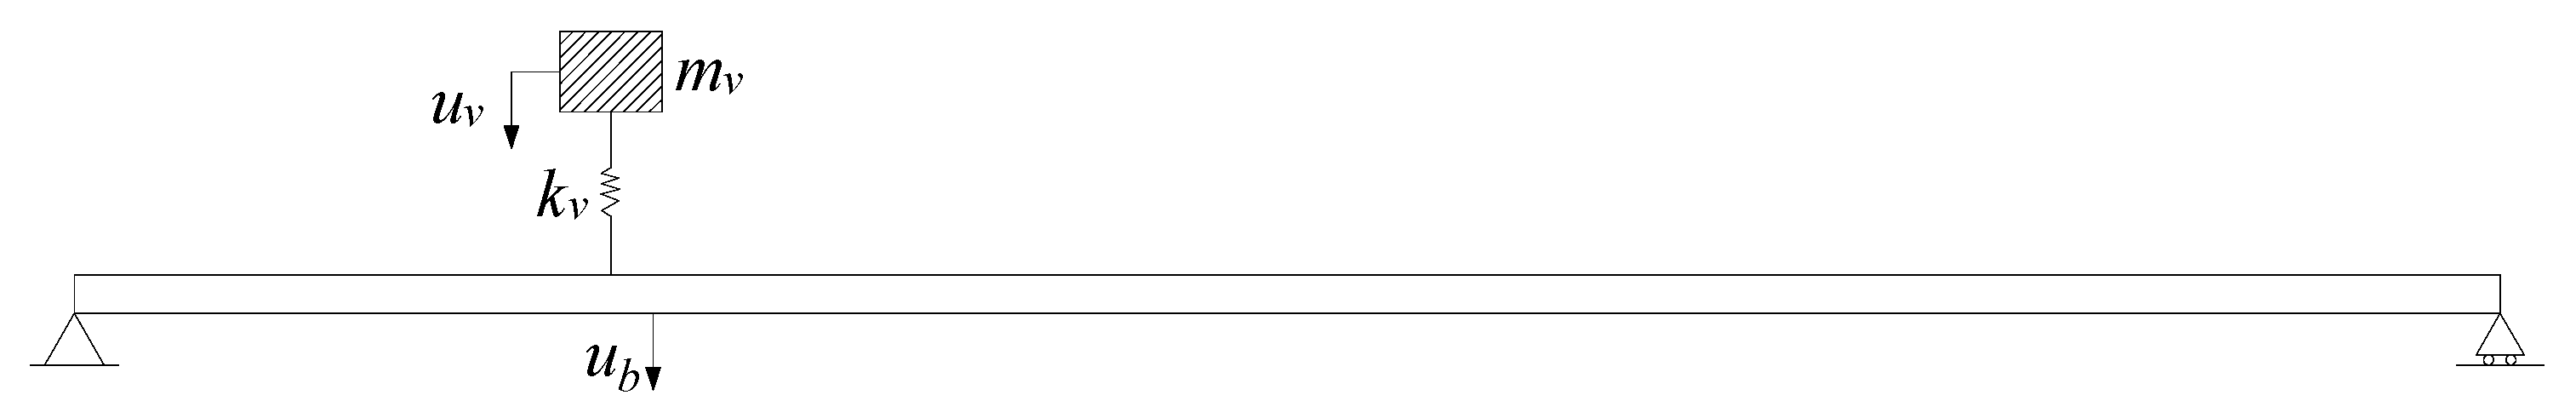
For illustration purposes, the coupled vehicle–bridge system is simplified as a lumped sprung mass moving on a simply supported beam, as shown in Figure 2. By neglecting the damping effects of the vehicle–bridge system, the corresponding equations of motion can be written as
where uv and ub are the vertical displacement of the vehicle body (lumped sprung mass) and the bridge (simply supported beam), respectively; the two dots represent quadratic differentials with respect to time t; mv and mb are the mass of the vehicle and bridge, respectively; Kv is the stiffness matrix of the vehicle; EI is the flexural rigidity of the bridge; x = vt is the position of the moving vehicle on the bridge; v is the moving speed of the vehicle; δ(t) is the Dirac function; and fc(t) is the contact force between the vehicle and bridge, which is given by
where g is the gravitational acceleration.
Based on the modal superposition method, the bridge displacement response ub(x,t) is expressed in terms of modal shapes sin (nπx/L) and generalized coordinates qb,n(t):
where L is the length of the bridge.
One can obtain the theoretical solution of the acceleration time histories of the bridge, vehicle, and contact point between the bridge and vehicle as [8,35]
in which the amplitude coefficients , , , and are
where Δst,n = 2mvgL3/EIπ4; μn = ωb/ωv; Sn = nπv/Lωb; ωbl,n and ωbr,n are the left and right frequencies of the bridge, respectively; ωv is the frequency of the vehicle; and ωd,n is the driving frequency.
2.1.2. Numerical Simulation
Generally, the bridge can be discretized as several beam elements, and the vehicle is idealized as a spring-mass model. To consider the vehicle–bridge interaction, it is common to formulate the governing equation of the coupled vehicle–bridge system as [8]
where mv and kv denote the mass and stiffness of the vehicle; [mb] and [kb] are the mass and stiffness matrixes of the bridge element supporting the vehicle; {ub} represents the displacement vector of the bridge element; {N} contains the cubic Hermitian interpolation functions associated with the transverse displacement of the element (i.e., vertical displacement for the bridge); and {N}c represents the realization of {N} at the vehicle–bridge contact point, as given below:
in which l is the length of the bridge element. The numerical solution of the coupling between the vehicle and the bridge system can be realized by the separation iteration between the vehicle and the bridge system. In the solving process of the vehicle–bridge interaction program, the geometric and mechanical coupling relationship between the vehicle and bridge systems is satisfied through the Newmark-β method and separation iteration, so as to realize the independent solution of the bridge and vehicle motion equations (Figure 1, part I). For more information about the numerical solution system in this article, see [36,37,38].
2.2. Preliminary Damage Inspection Based on CWT
The WT is a mathematical approach that enables the extraction of the prominent characteristics of the original dataset, such as discontinuities, trends, and breakdown points, which has been widely used for signal processing applications. The WT is divided into the CWT and discrete WT (DWT). In the present study, the CWT is employed to process the acceleration response of the vehicle–bridge system, which is given by
where f(t) is the signal (the acceleration response in the present study); is the wavelet basis function; represents the conjugate function of the basic wavelet function; t is the time; a is the scale factor; and b is the time shift factor. When the parameters t, a, and b are continuous variables, the above transformation is the CWT, and WTf (a,b) is the wavelet coefficient under scale factor a and shift factor b. The WC of the signal at a certain scale can be obtained by applying the CWT to the acceleration response of the vehicle–bridge system obtained in the previous section, which is subsequently used for the damage inspection of the bridge girder.
2.3. Thorough Damage Inspection Based on CWC
As mentioned previously, the WC contains a variety of high-order frequency contents of bridge vibration, which has adverse effects on the damage inspection accuracy. To improve the identification accuracy, the CEEMDAN technique is applied to the WC to obtain the CWC for thorough damage inspection.
Huang et al. [39] first developed the EMD method to examine the nonlinear and non-stationary signals in an adaptive time–frequency–amplitude space. With the EMD method, the signal can be decomposed into several intrinsic mode functions (IMFs) and a residue. Despite its wide applications, EMD experiences some problems, such as the presence of oscillations of very disparate amplitudes in a mode, or mode mixing. To overcome these problems, ensemble EMD (EEMD) has been proposed, which performs the EMD over an ensemble of the signal plus Gaussian white noise [40]. Based on EEMD, the CEEMDAN method has recently been proposed, in which a particular noise is added at each stage of the decomposition and a unique residue is computed to obtain each mode [41]. This helps to further reduce the modal aliasing and pseudo-modal problems as well as enhancing the anti-noise ability. The flowchart of CEEMDAN is illustrated in Figure 1. Given a set of measured data X(t), the process of the CEEMDAN algorithm decomposing each order’s IMF is described as follows:
(1) The Gaussian white noise is added to the signal X(t) to obtain a new signal , and the new signal is decomposed through EMD to obtain the first-order IMF and remainder (Equation (12)). The above process is repeated N times, and N first-order IMFs are obtained because the white noise added is different.
where refers to the EMD process; refers to the white noise; n is the number of times the white noise is added; is the first-order IMF; is the remaining margin; and j is the number of decompositions.
(2) The average of the resulting N first-order IMFs yields the first IMF decomposed by CEEMDAN:
(3) The residual of the original signal X(t) is calculated after removing the first modal component:
(4) The signal obtained in the previous step is treated as a new signal, which is processed by the first three steps to obtain the second-order IMF. Subsequently, the procedure is applied repeatedly to extract the third- and fourth-order IMF components (if they exist), until the residual signal is a monotonic function. Finally, assuming the number of extracted IMFs is K, the original signal X(t) can be expressed as the summation of all IMF components and the residual signal, as given by
3. Numerical Case
A demonstration case study is carried out to examine the effectiveness of the proposed drive-by damage inspection methodology.
3.1. VBI of Simply Supported Bridge Beam
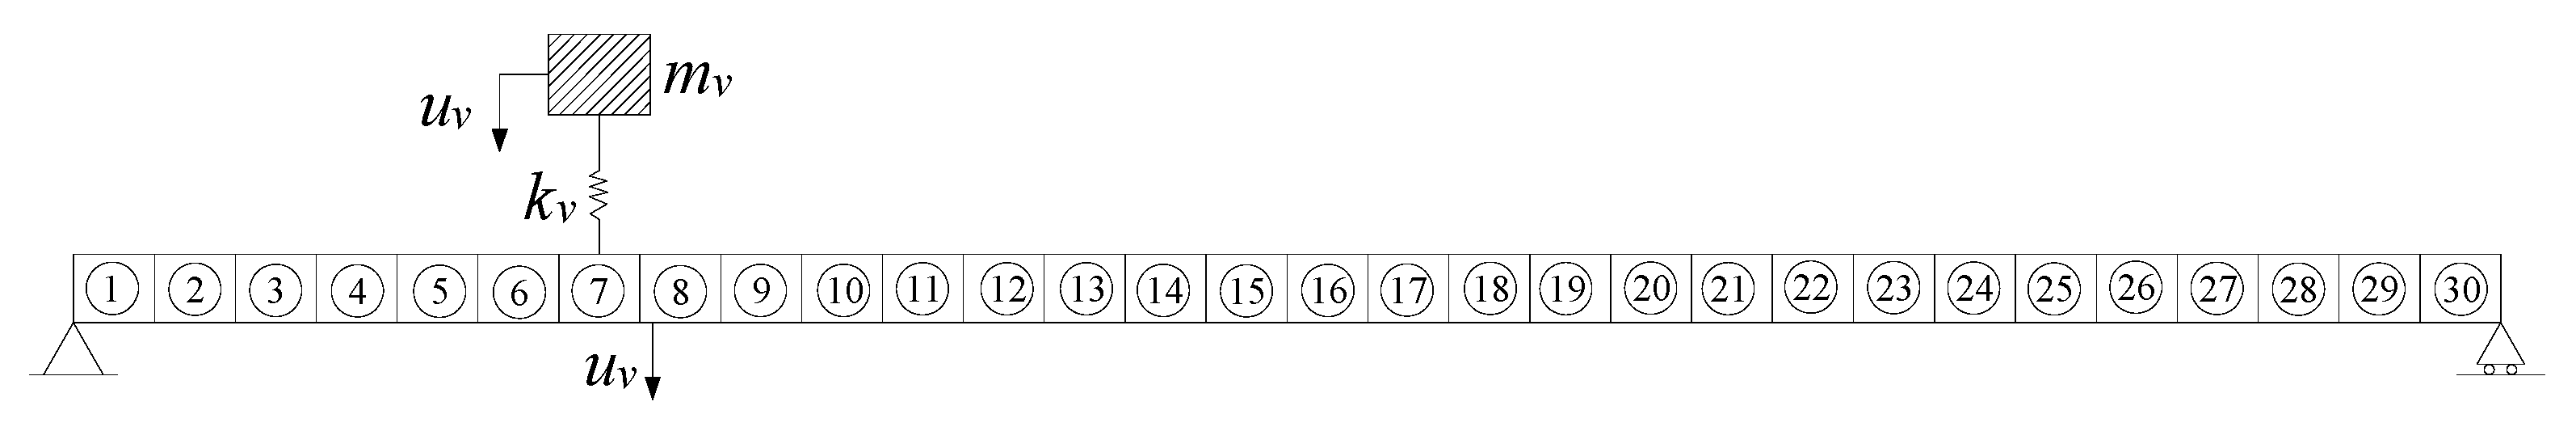
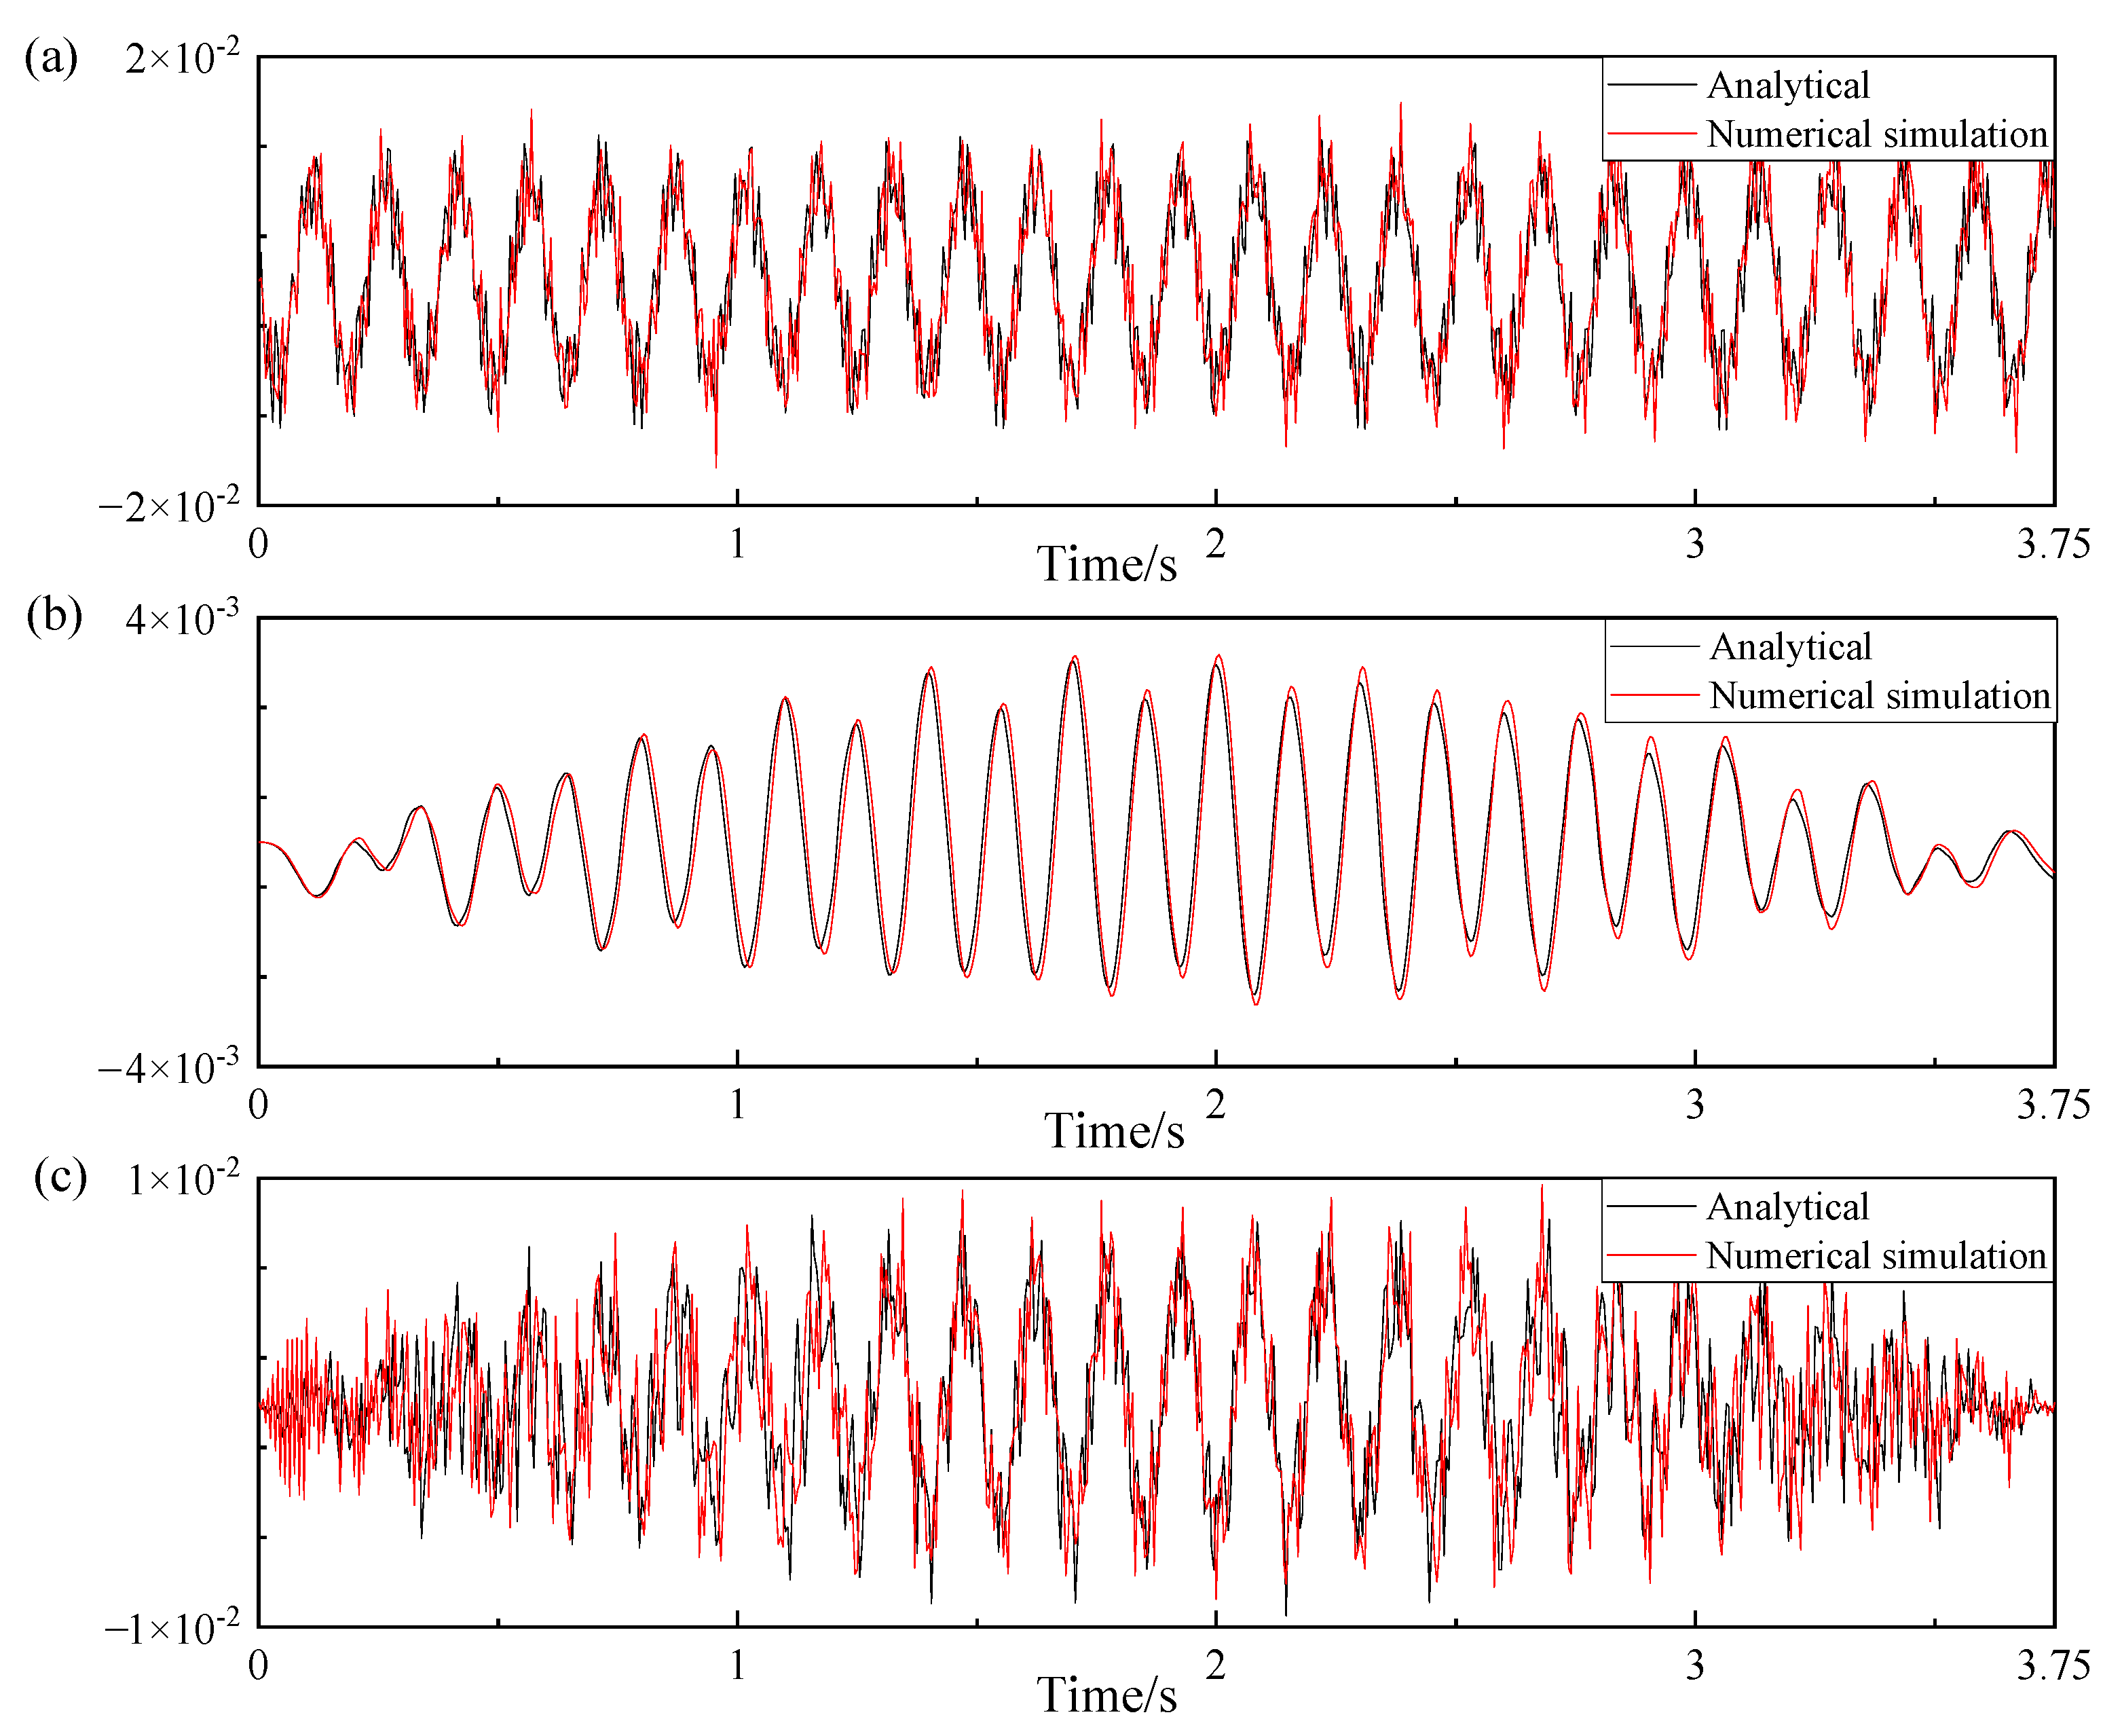
The demonstration case involves a single-degree-of-freedom (DOF) sprung mass moving along a simply supported bridge beam model, as shown in Figure 3. The total length of the bridge beam is 15 m, which is divided into 30 elements with an equal length of 0.5 m. The damage of the bridge girder is simulated by means of a reduction in the elastic modulus. The time step during the VBI analysis is set to 0.005 s. In addition, the speed of the vehicle is set to 4 m/s, and the key parameters of the vehicle–bridge system are shown in Table 1. The VBI is realized using a self-compiled program in the MATLAB software. For validation purposes, the simulated dynamic responses of the vehicle–bridge system are compared with the analytical solutions, as shown in Figure 4. It is clearly shown in Figure 4 that the vertical acceleration of the bridge mid-span, the vertical acceleration of the vehicle body, and the vertical acceleration of the contact point obtained from the numerical simulations are in good agreement with those of the analytical solutions.
In total, 14 cases are considered, as listed in Table 2. In cases 1~5, the damage is assumed to be located at seventh element with various degrees of severity, i.e., 0%, 5%, 10%, 20%, and 40%. The vehicle mass and vehicle speed remain unchanged in cases 1~5, i.e., mv = 1000 kg and V = 4 m/s. To examine the influence of the damage location on the feasibility of the proposed damage inspection methodology, the damage location is shifted from the seventh element to the second element of the bridge in cases 6~8, with a damage severity of 0%, 20%, and 40%. The vehicle mass and vehicle speed in cases 6~8 are the same as those in cases 1~5. To further investigate the influence of the vehicle speed, the vehicle speed is reduced from 4 m/s to 1 m/s in cases 9~11. The damage in cases 9~11 is located at the second element of the bridge with a damage severity of 0%, 20%, and 40%. It is noted that cases 1~11 only contain one damage location, while cases 12~13 assume two damage locations. To be specific, in case 12, elements No. 4 and No. 14 are damaged with a severity of 10% and 30%, while in case 13, elements No. 4 and No. 14 are damaged with a severity of 30% and 10%.
3.2. WC Extraction Based on CWT
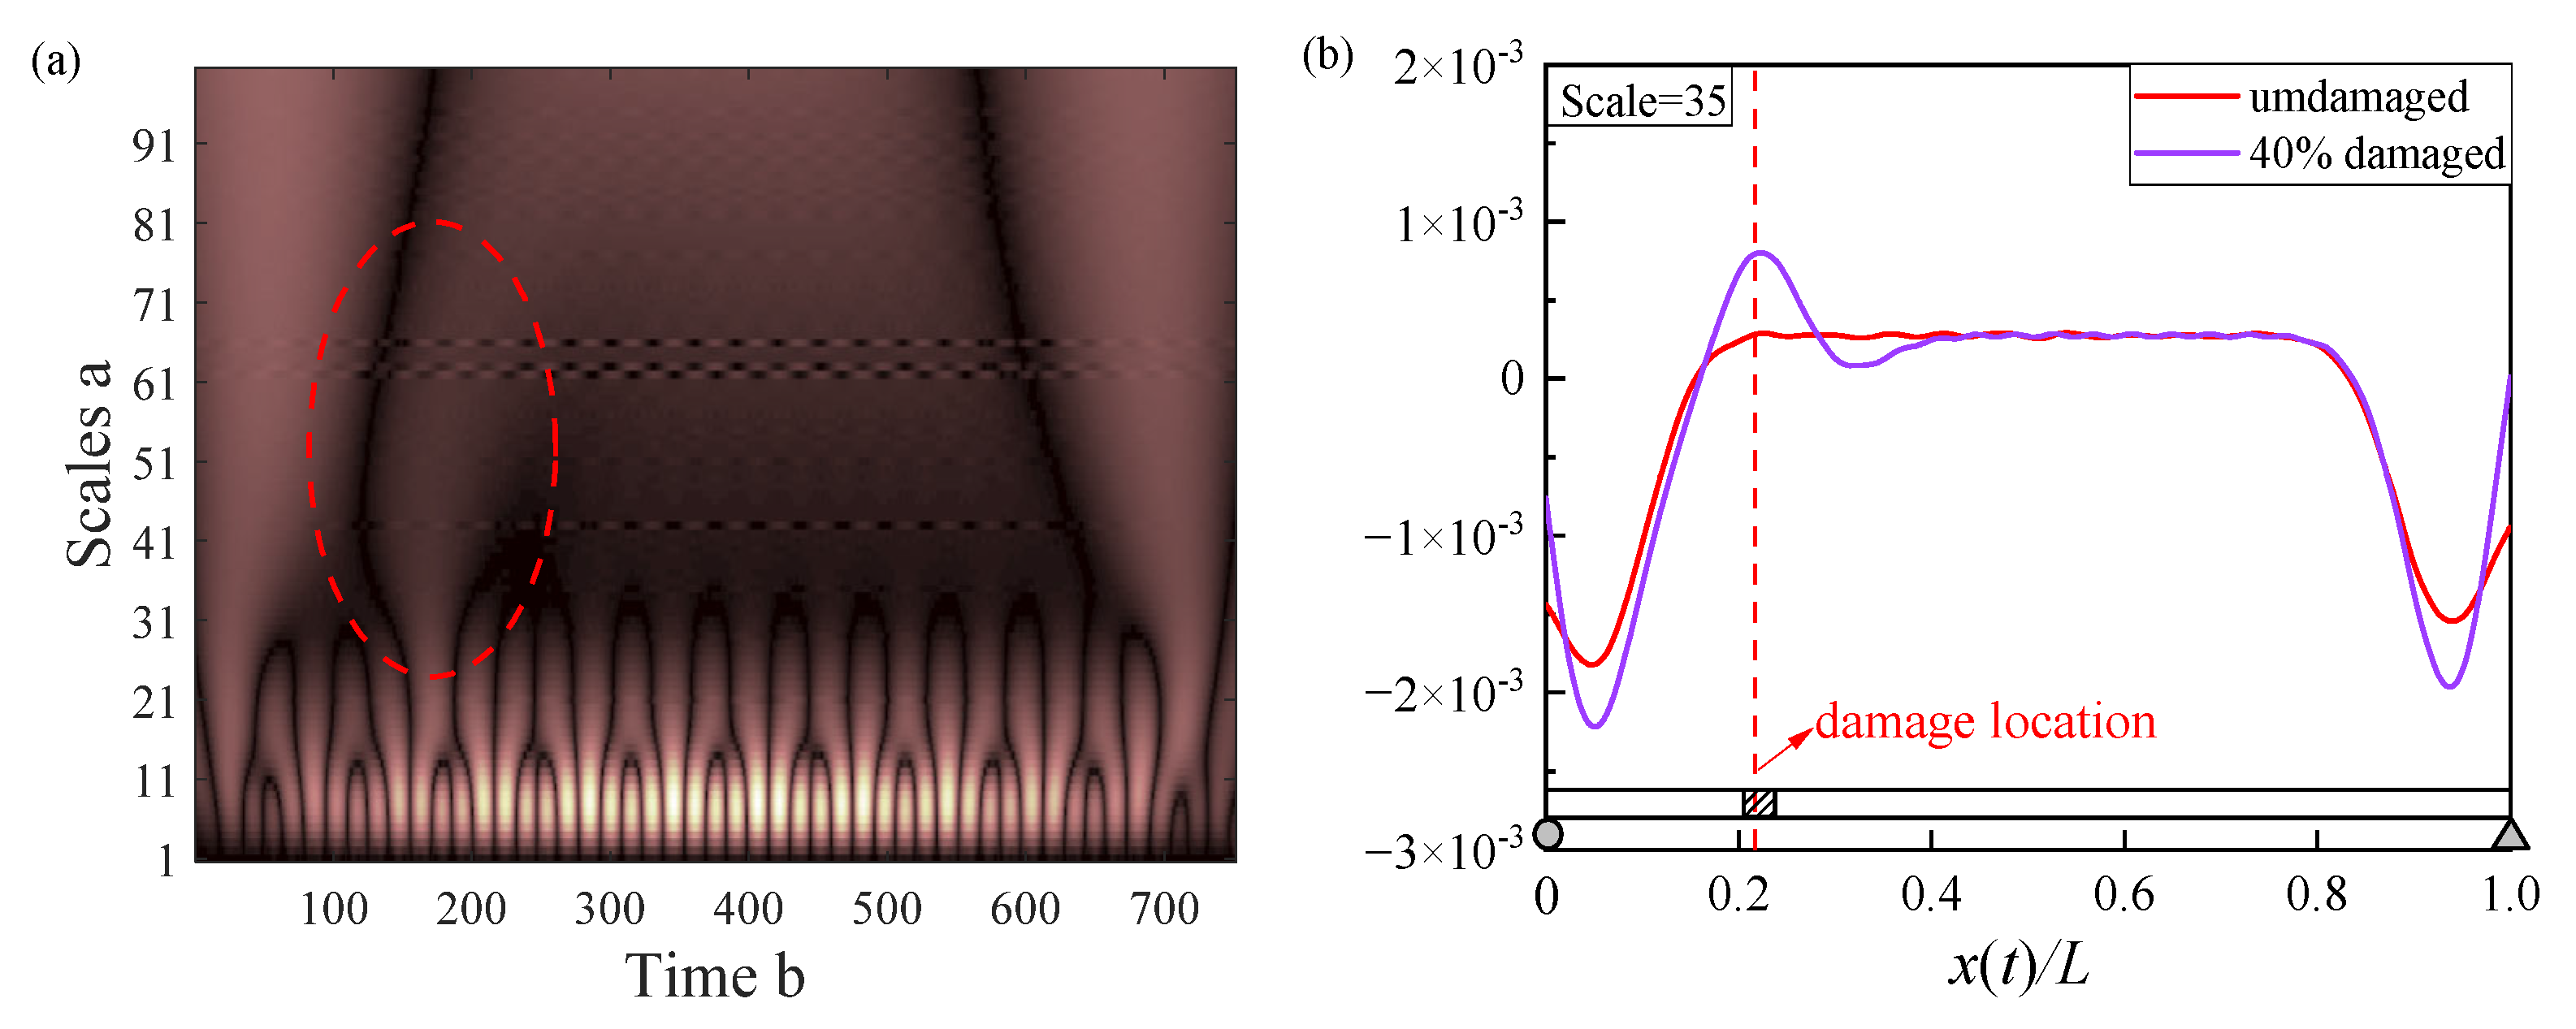
Previous studies have shown that abnormal changes in the WC under a certain scale factor can be used to identify the bridge damage effectively. Figure 5a shows the time–frequency diagram after applying the CWT to the vehicle acceleration under case 5. The ordinate is the scale factor (Scale) of the CWT, and the abscissa is the time shift factor (Shift) of the CWT, which can be understood as the relative position of the bridge. The color shade indicates the magnitude of the WC. It is observed that the color of the WC varies significantly at the position of 6.5/30 = 0.21 (the center of the damaged No.7 element), and the scale factor ranges from approximately 30 to 60. To clearly observe the variation in the WC, the WC under the scale factor of 35 in case 5 is displayed in Figure 5b. For comparison purposes, the WC in the undamaged case (case 1) is also plotted in Figure 5b. As shown in Figure 5b, there is an obvious peak of the WC at the center of the damaged No.7 element, which suggests that the significant variation in the WC under an effective scale factor can help to identify the damage location of the bridge. It is also worth mentioning that the wavelet basis function could affect the damage identification results. The commonly used wavelet basis functions include the Haar wavelet, Morlet wavelet, Mexican hat wavelet, and Daubechies wavelet. A preliminary analysis was conducted to examine the effectiveness of the type of wavelet basis function on the damage identification results, where the Mexico hat wavelet outperformed the other selected wavelet basis functions and was selected for the subsequent analysis.
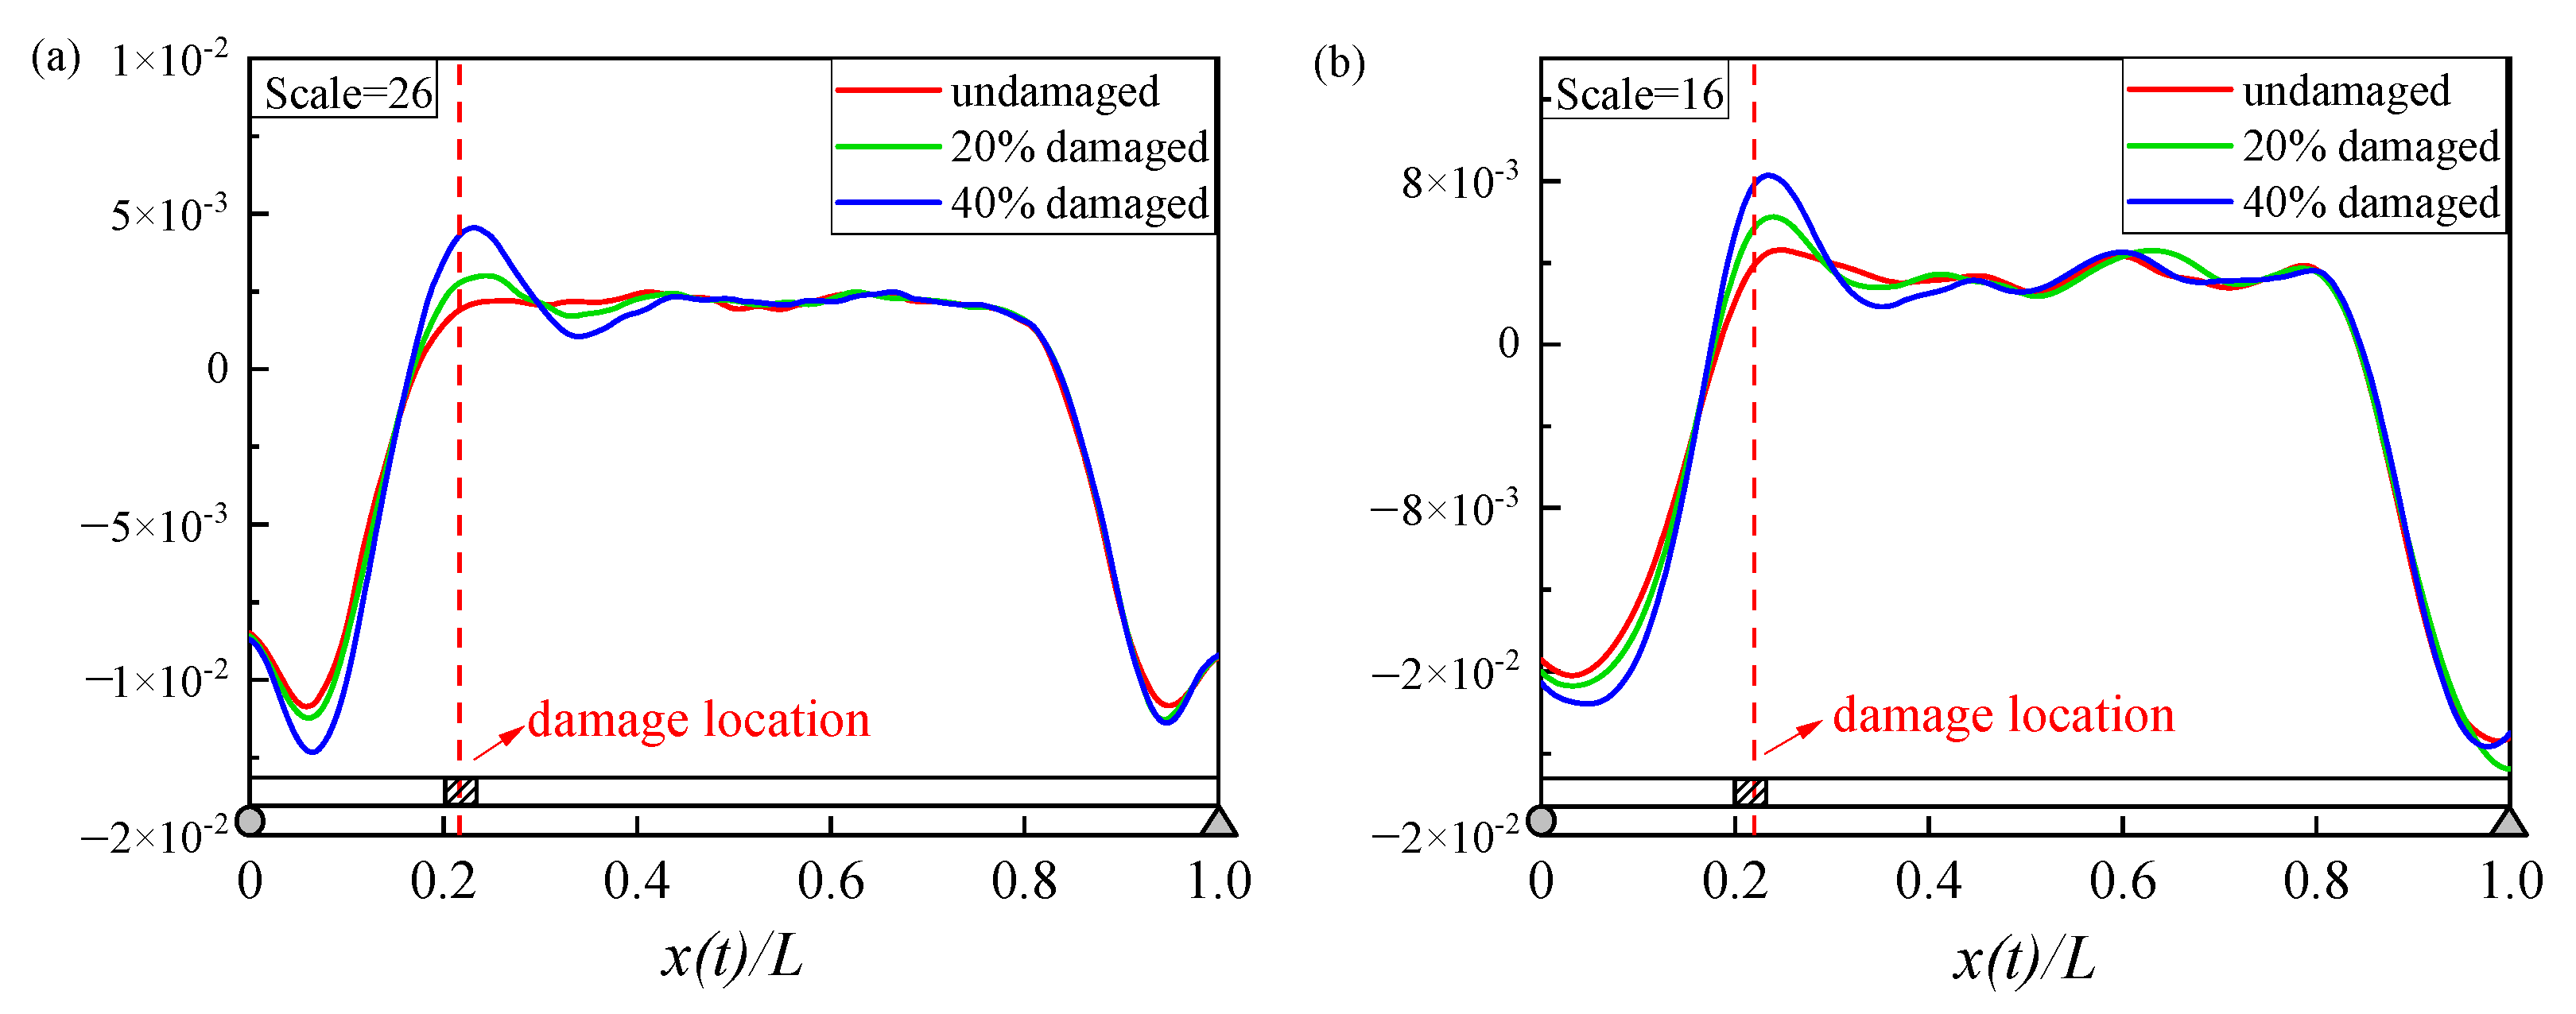
In addition to the WC of vehicle acceleration, the WC of the bridge mid-span acceleration and the contact-point acceleration in cases 2~5 is also extracted, as shown in Figure 6. It is observed from Figure 6a,b that although the trend of the WC shows a certain degree of increase at the damaged location, such an increase is not obvious, especially when the damage severity is less than 40%. This is because the overall trend of the WC is largely contaminated by its fluctuations, i.e., the high-frequency contents.
3.3. Extracting CWC Based on WC Using EEMD or CEEMDAN
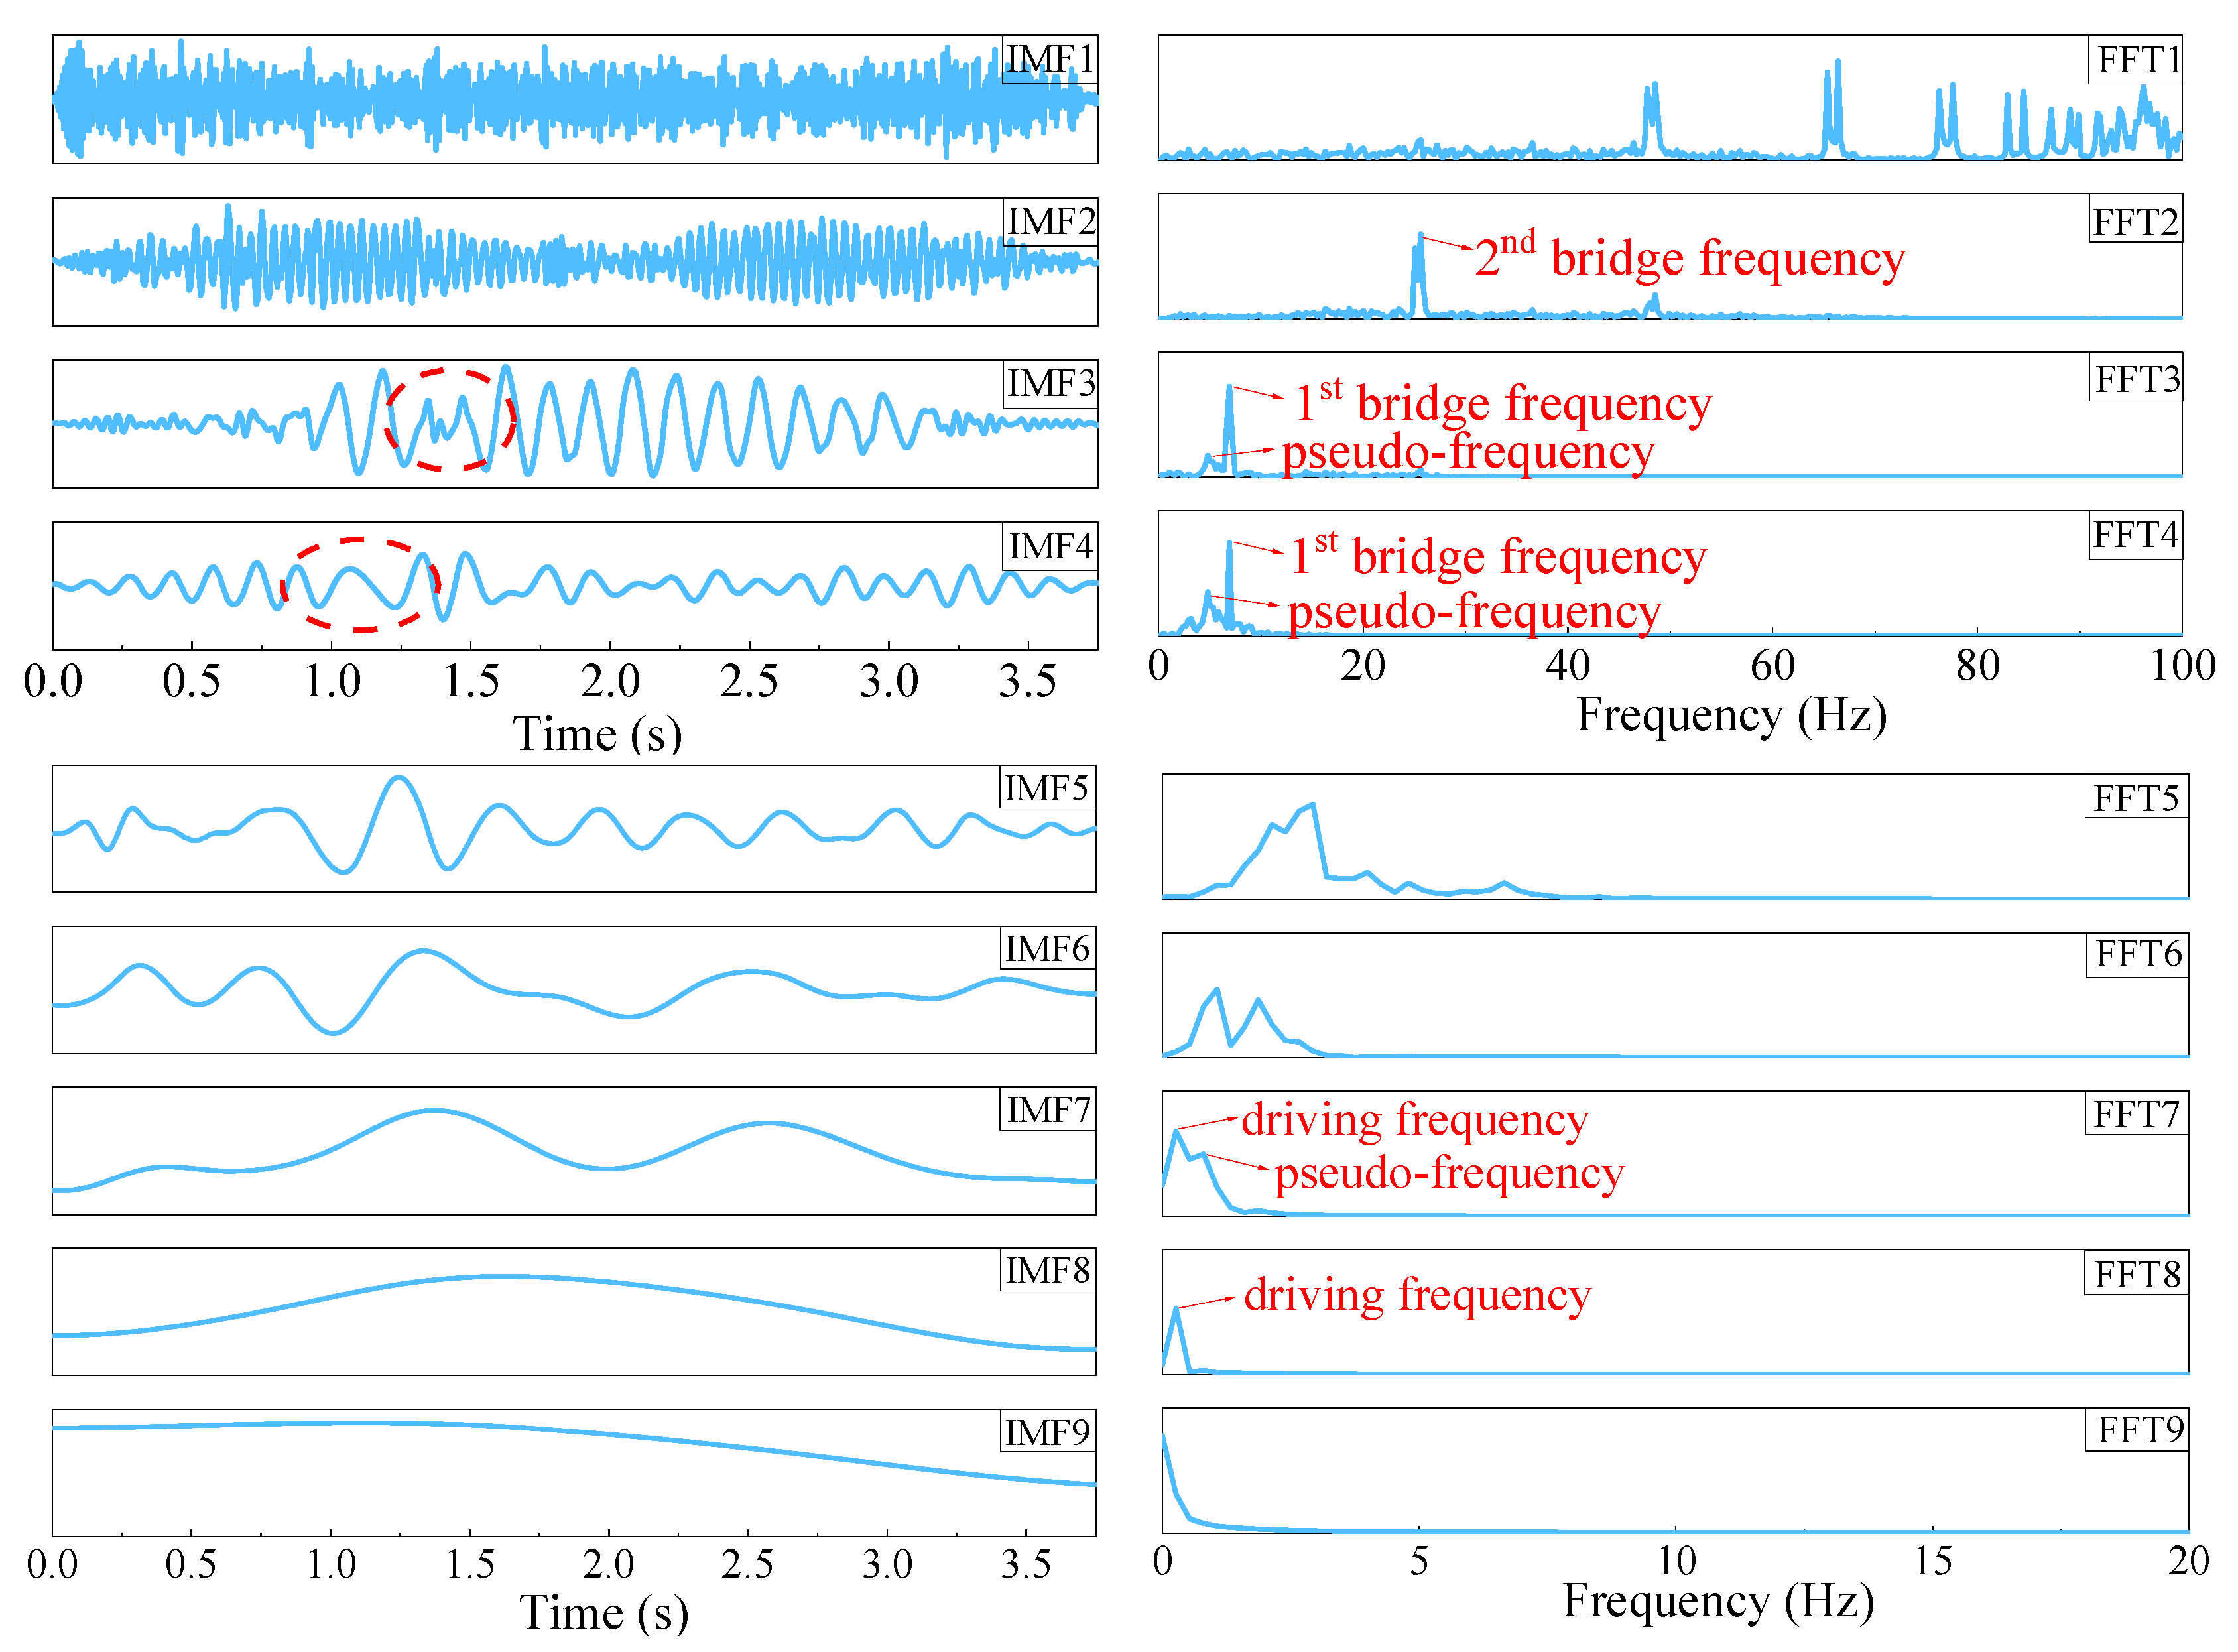
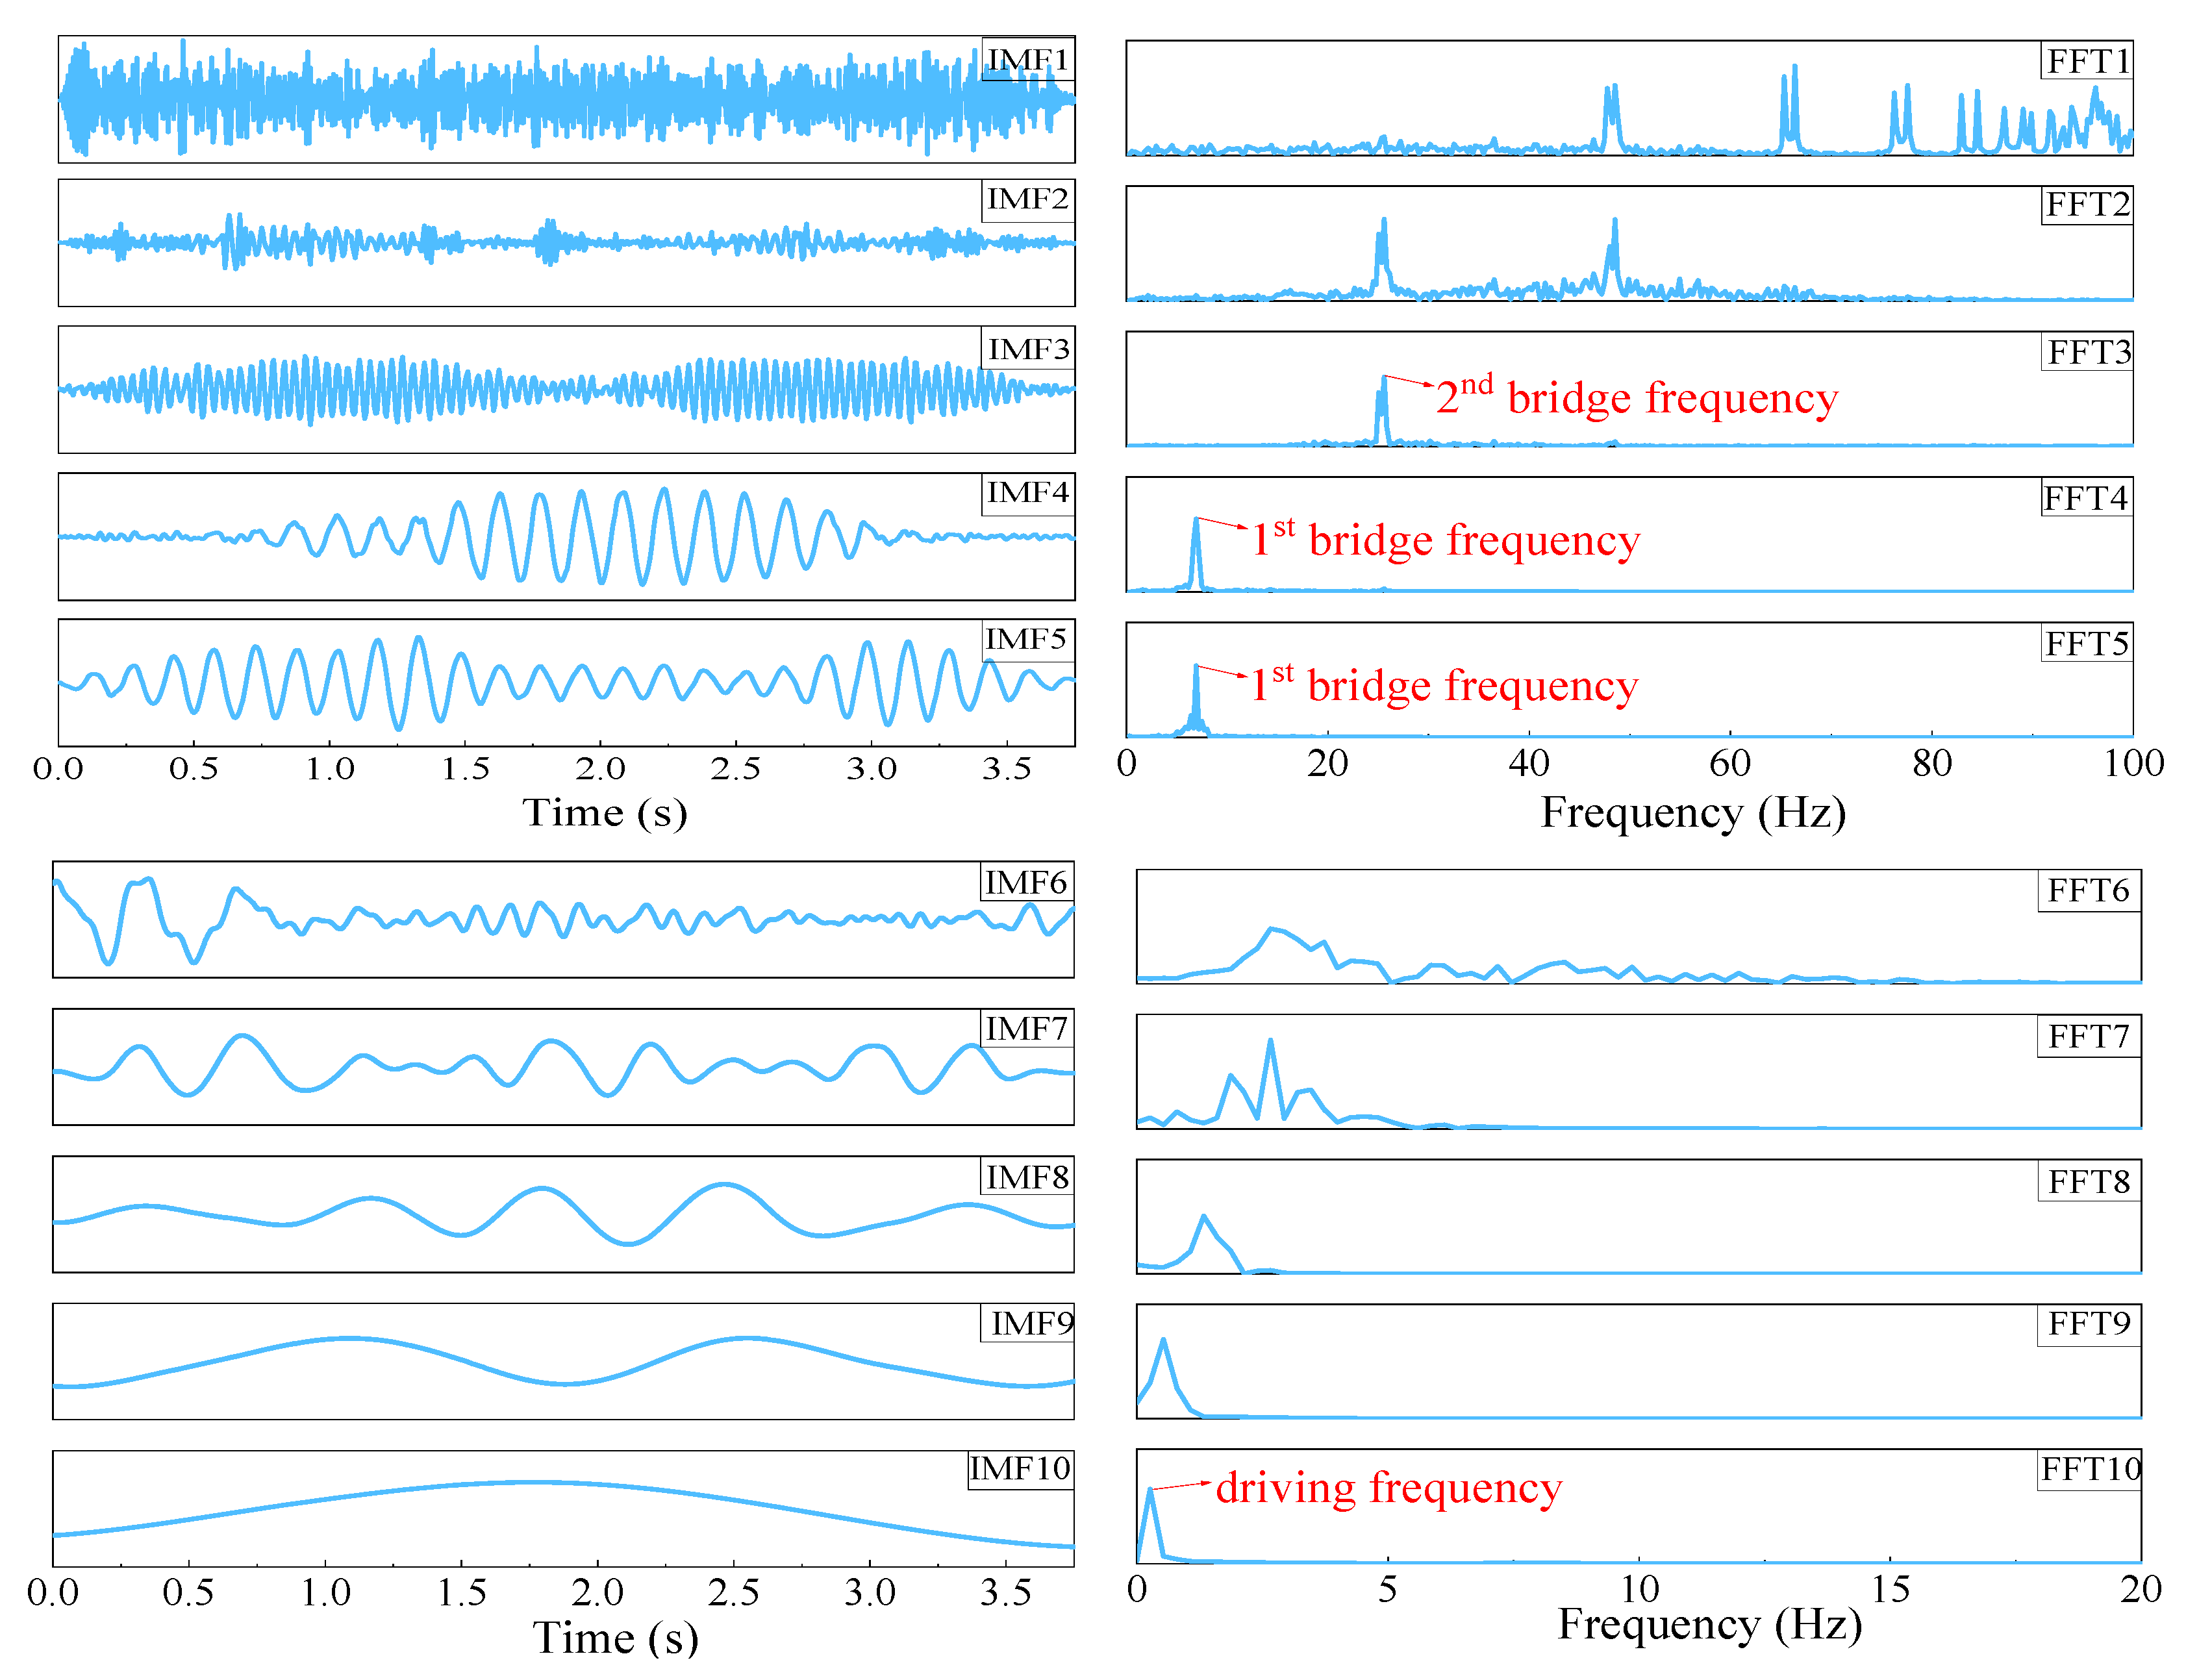
The previous discussion indicates that the extracted WC after applying the CWT to the acceleration response of the bridge mid-span and contact point has a poor damage inspection performance, due to the contamination of the high-frequency content of the WC. In order to improve the identification accuracy, it is natural to filter out the high-frequency contents of the WC to make the trend of the WC visible. In view of this, the extracted WC is further analyzed using two signal decomposition techniques, i.e., EEMD and CEEMADAN, in which the extracted WC is decomposed into a series of IMF components with different frequencies. Figure 7 and Figure 8 show the IMFs and the associated FFT spectra after processing the WC (case 5) with EEMD and CEEMDAN, respectively. It is observed that the IMFs help to separate the first few bridge natural frequencies or the vehicle driving frequency. In addition, obvious mode mixing can be observed in IMF3 and IMF4 extracted using the EEMD method, as shown in Figure 7. Furthermore, our analysis showed that the IMFs with a dominant frequency higher than the first vertical natural frequency (6.623 Hz) of the bridge have adverse effects on the bridge damage identification results, while the opposite result is found for the IMFs with a frequency lower than the first vertical natural frequency of the bridge. Therefore, only the IMFs with a dominant frequency lower than the first vertical natural frequency of the bridge are selected to construct the new damage index, which is termed as the CWC in the present study.
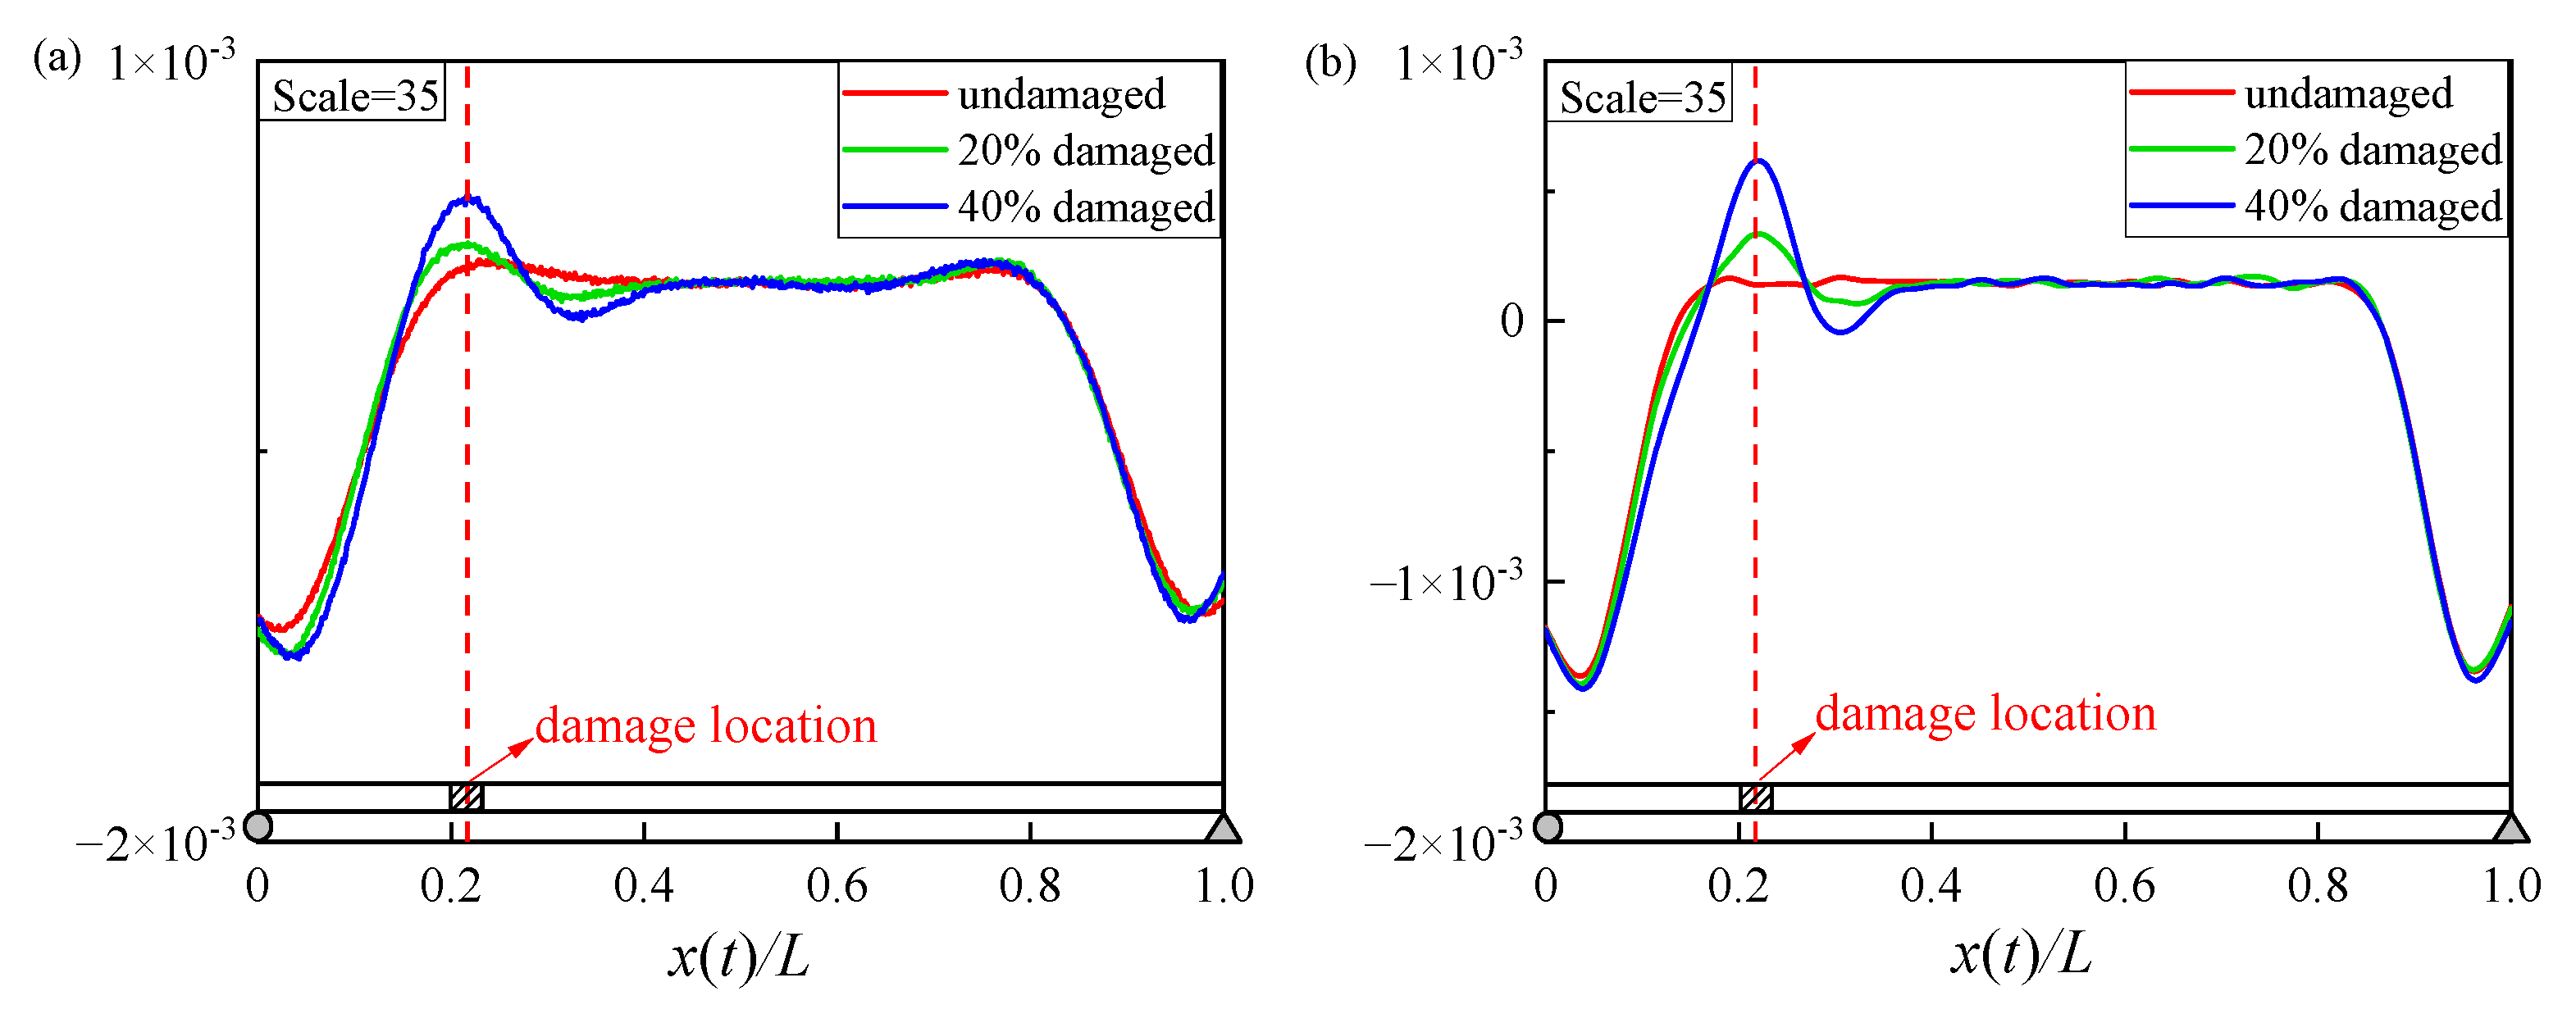
The CWC decomposed by EEMD and CEEMDAN is shown in Figure 9. It is observed in Figure 9 that the CWC extracted by both EEMD and CEEMDAN shows an abrupt increase at the damage location of the bridge girder, and such an abrupt increase is more obvious under severer damage conditions. To be specific, the peak of the CWC extracted by EEMD is 2.13 × 10⁻⁴, 2.87 × 10⁻⁴, and 4.72 × 10⁻⁴ under damage of 0%, 20%, and 40%, while the peak of the CWC extracted by CEEMDAN is 1.41 × 10⁻⁴, 3.35 × 10⁻⁴, and 6.08 × 10⁻⁴ under damage of 0%, 20%, and 40%. This indicates that the CWC can be used to detect the damage location and to quantify the damage severity of the bridge girder. In addition, it is found that the CWC extracted using the CEEMDAN method is smoother than that extracted using the EEMD method. Therefore, the CEEMAN method is adopted for the subsequent analysis.
3.4. CWC for Multi-Damage Case
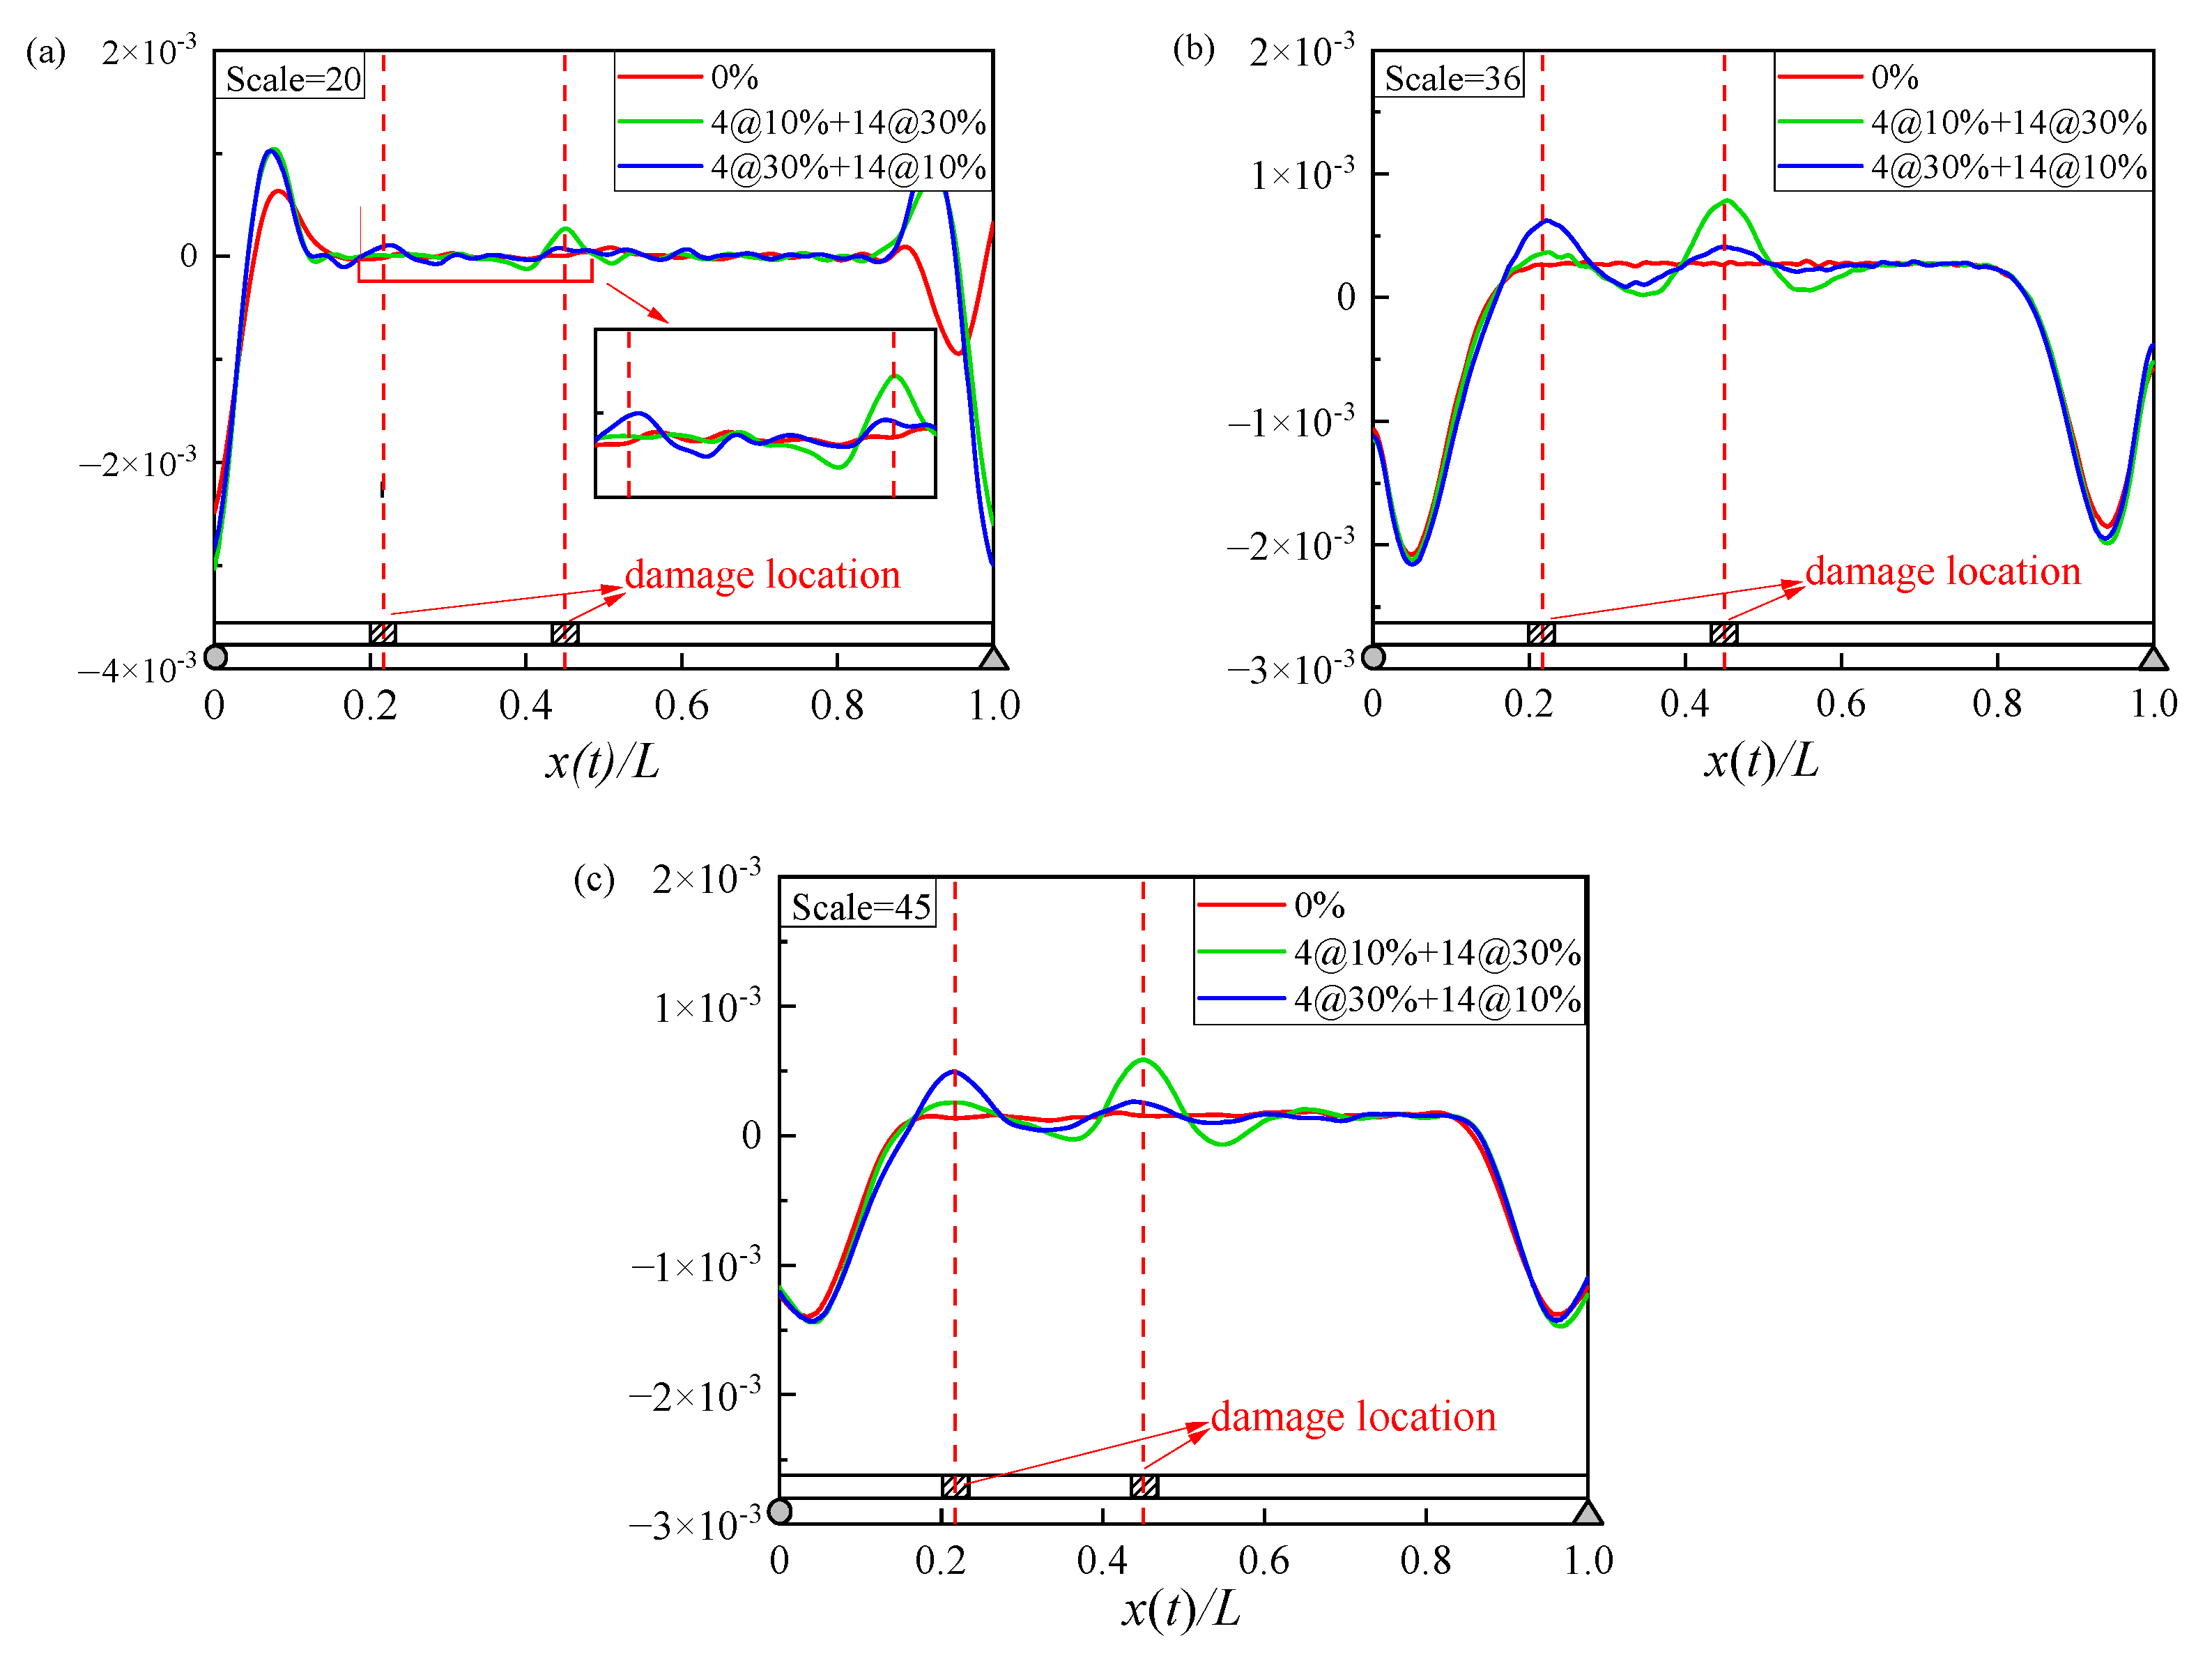
In this section, the performance of the proposed drive-by damage inspection methodology in a multi-damage case is further evaluated. Two damage scenarios of the bridge girder with two damage locations are investigated. In the first damage scenario (case 12), elements No. 4 and No. 14 are damaged with a severity of 10% and 30%, while in the second damage scenario (case 13), elements No. 4 and No. 14 are damaged with a severity of 30% and 10%. Figure 10 shows the CWC by analyzing the bridge mid-span acceleration, vehicle acceleration, and contact-point acceleration. As shown in Figure 10a, the CWC extracted from the bridge mid-span acceleration has a poor damage inspection performance. In contrast, as for the CWC extracted from the vehicle acceleration and contact-point acceleration, two noticeable peaks can be observed at the two damaged elements, as shown in Figure 10b,c. In addition, for damage scenario one, the peak at element No. 4 with a 10% damage severity is less than that at element No. 14 with a 30% damage severity, while the opposite result is found for damage scenario two. The above observations clearly suggest that the CWC extracted from the vehicle acceleration and contact-point acceleration is also effective for damage identification in multi-damage scenarios.
4. Parametric Analysis
In this section, a parametric study is carried out to explore the effects of several parameters on the performance of the proposed damage inspection methodology including the scale factor, vehicle speed, environmental noise, and boundary effect.
4.1. Effect of Scale Factor
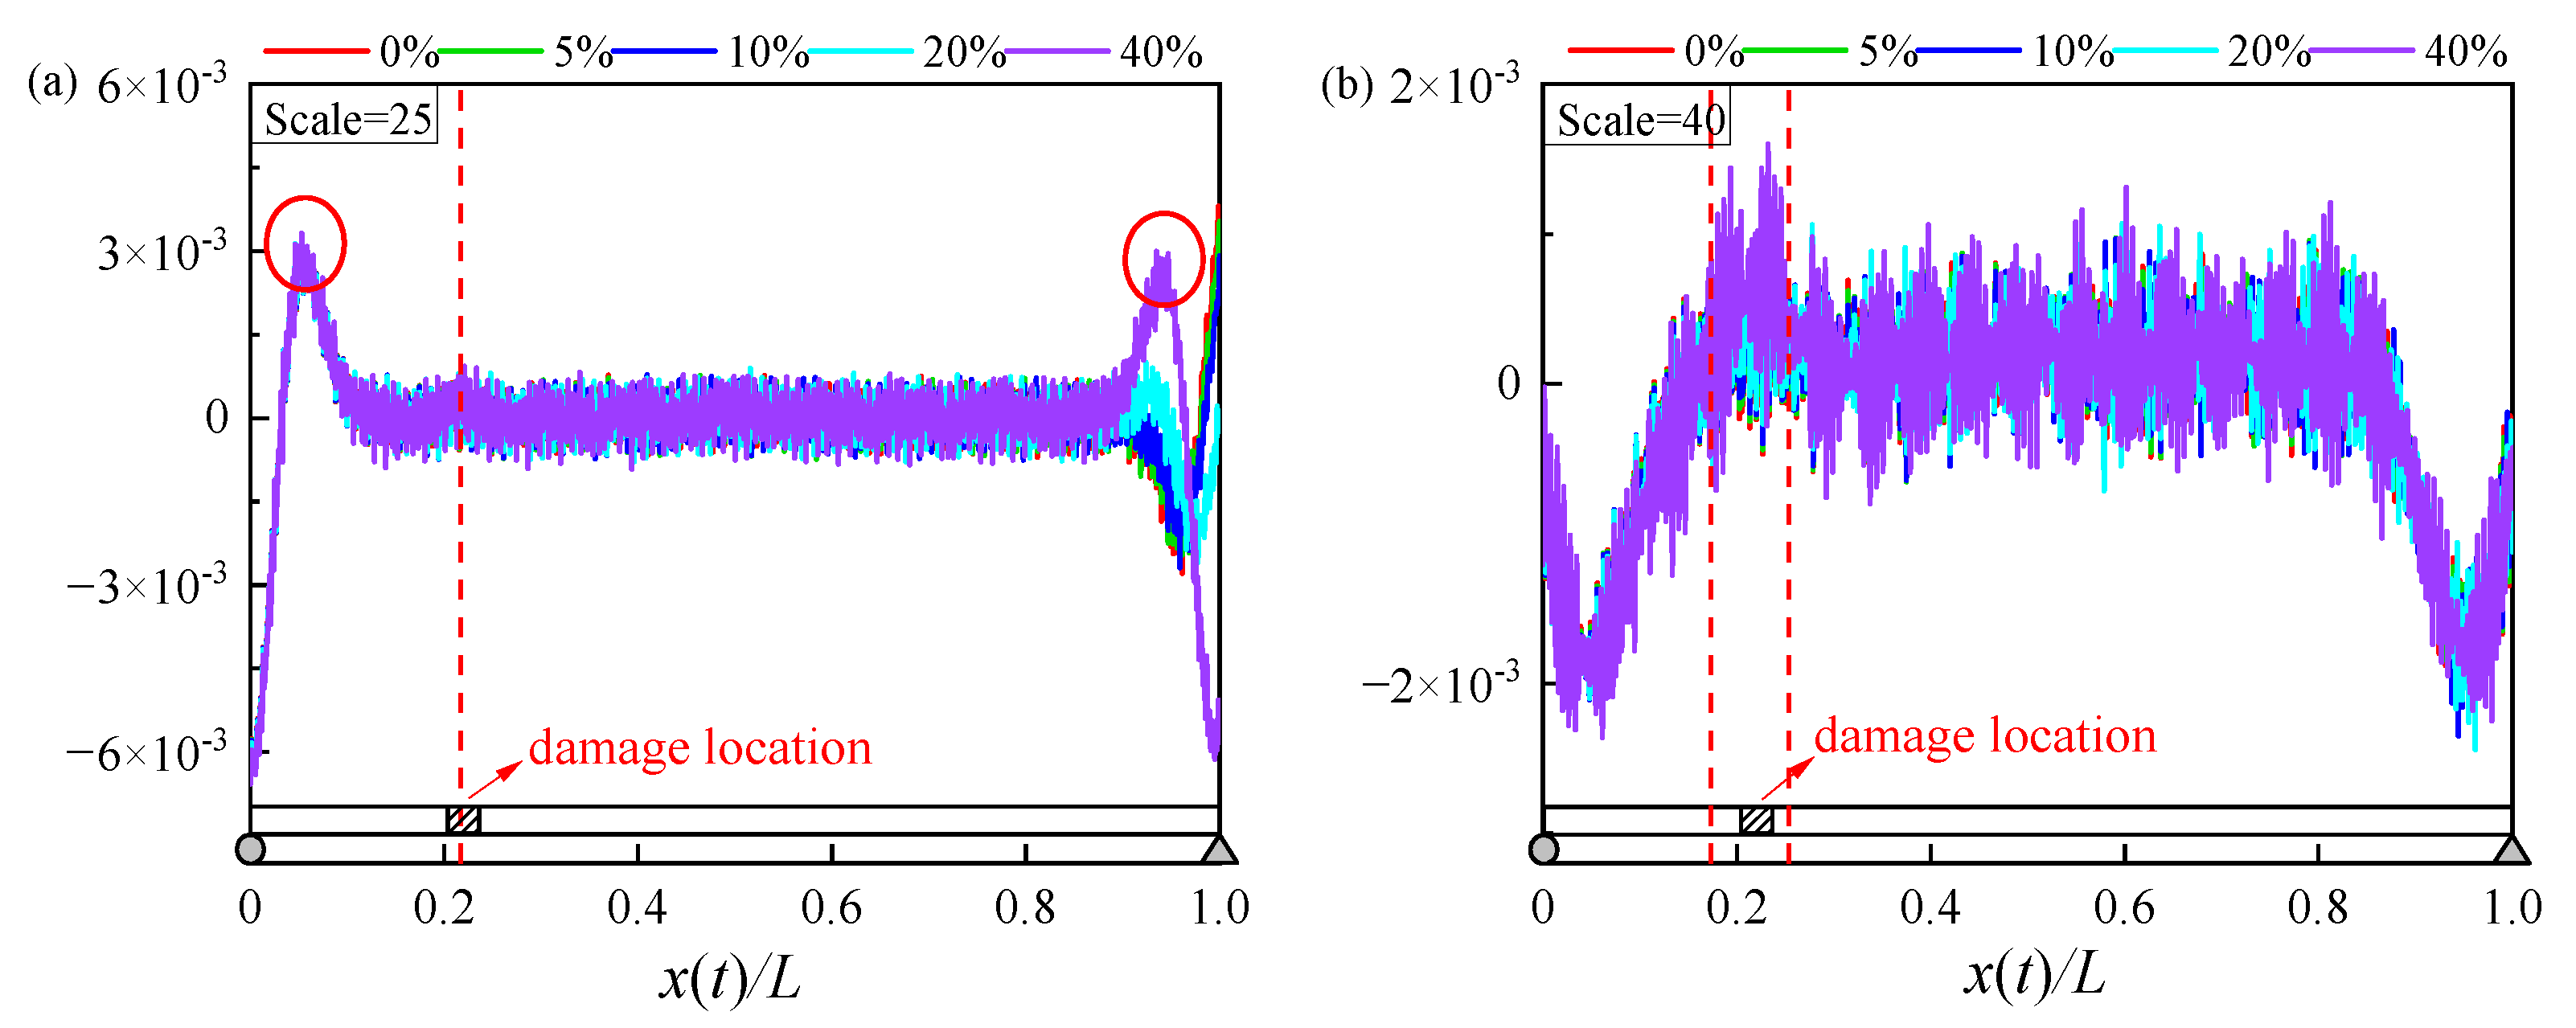
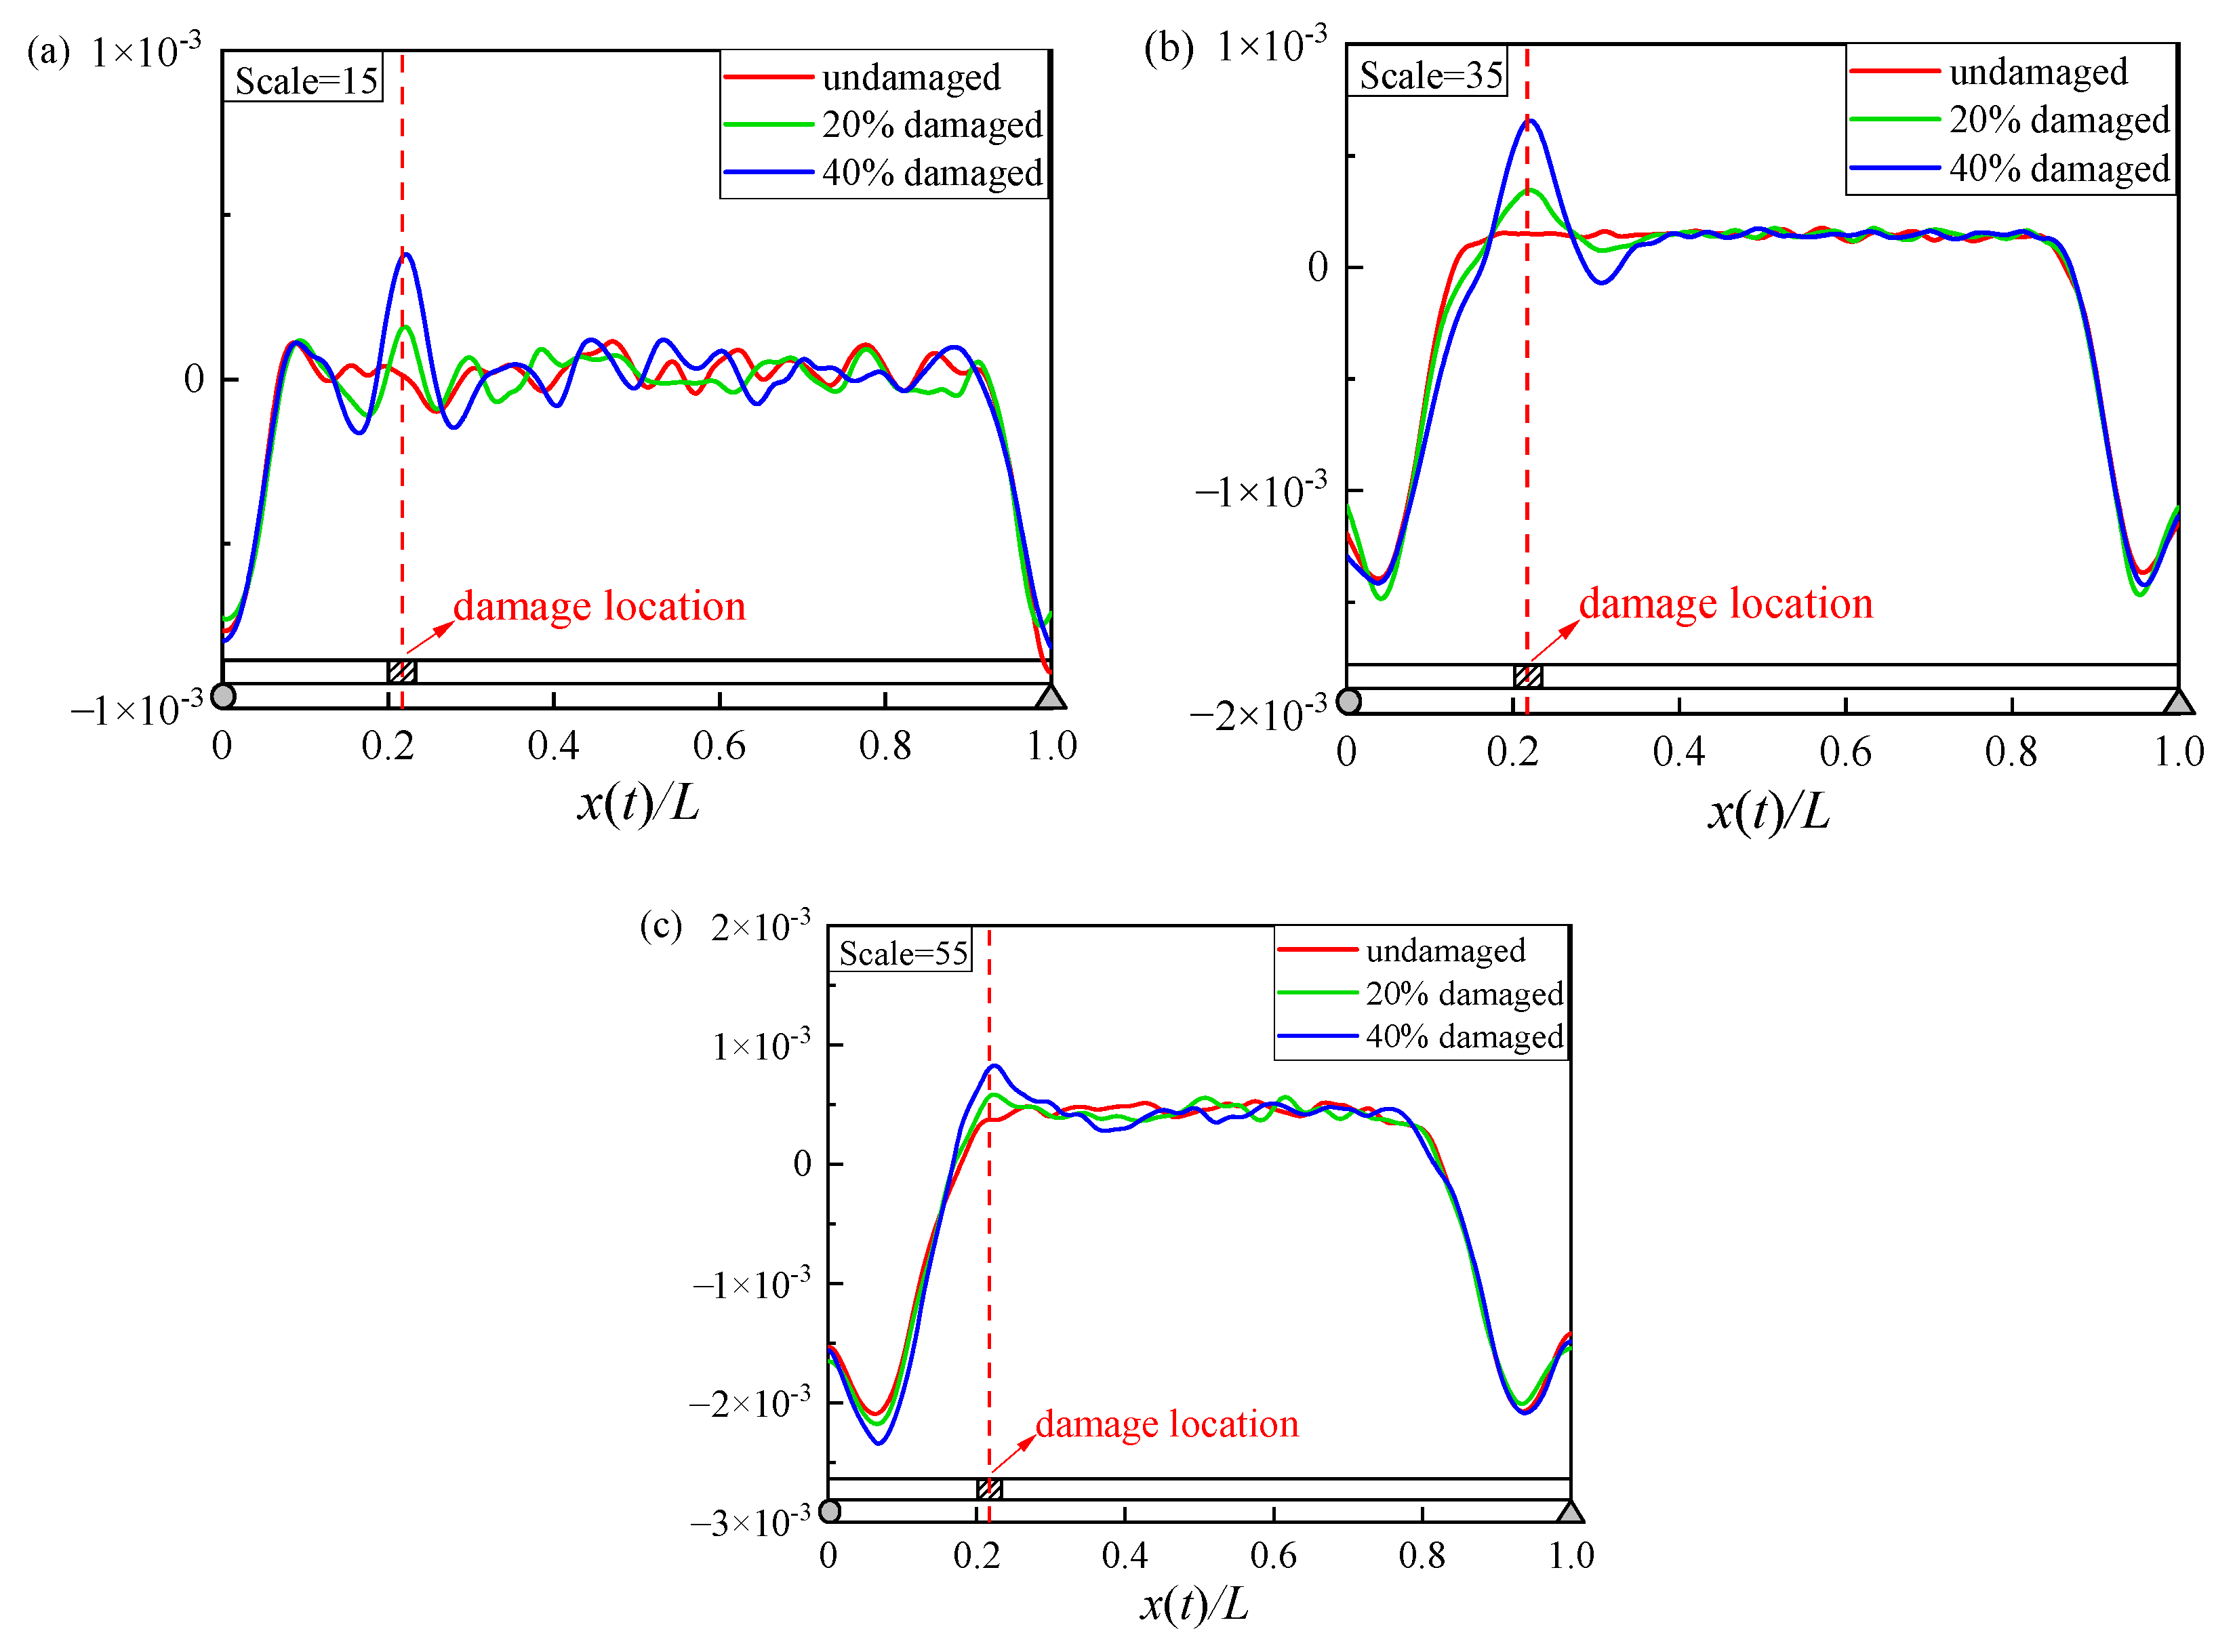
As discussed earlier, the scale of the CWT has a significant effect on the performance of the proposed drive-by damage inspection methodology. In practice, it is usually necessary to find a better scale factor through trial and error. Figure 11 shows the CWCs at scale factors of 15, 35, and 55, which are extracted from the contact-point accelerations in case 1, case 3, and case 5, respectively. It is observed that the CWC under a scale factor of 35 outperforms that under scale factors of 15 and 55.
4.2. Effect of Environmental Noise
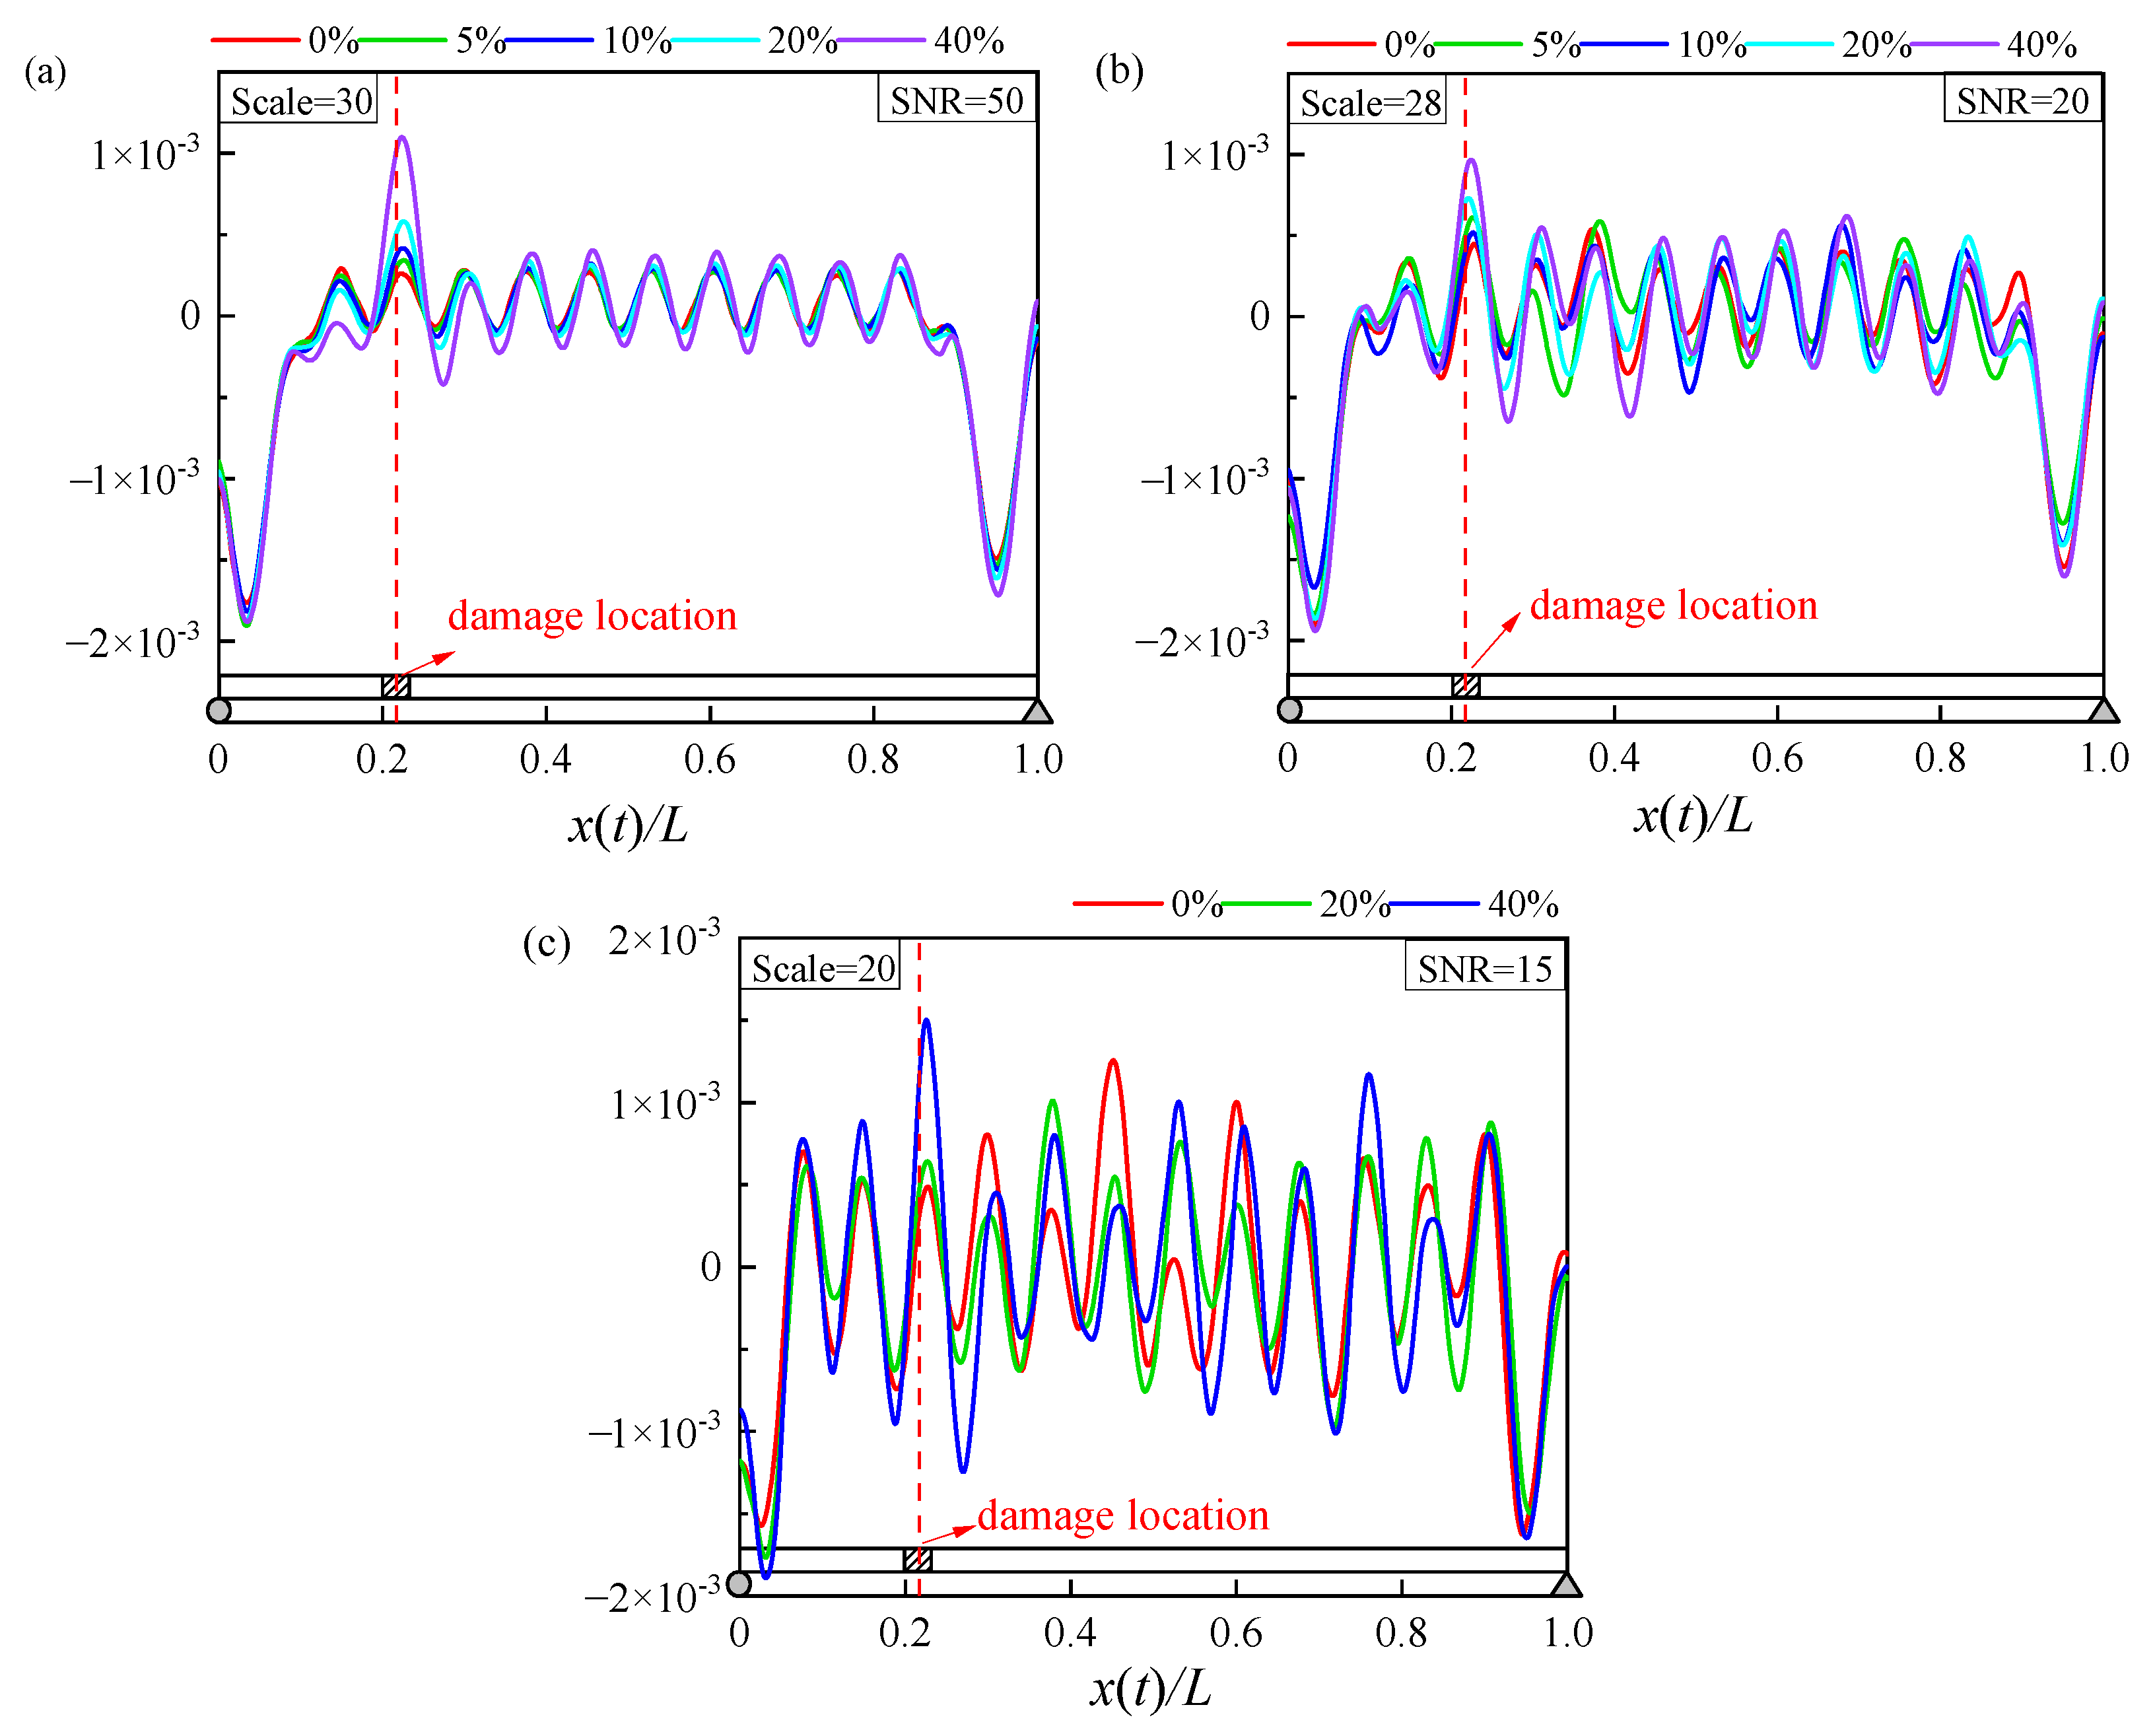
Vehicle signals are inevitably polluted by environmental noise during the acquisition process, resulting in signal distortion or some key information being missing. Therefore, in this section, the effect of noise on the performance of the proposed damage identification framework is investigated. During the analysis, Gaussian white noise with three different signal-to-noise ratios (SNR = 15, 20, and 50) is added to the vehicle acceleration response in cases 1~5. Figure 12 shows the CWC under SNR = 15, 20, and 50. It is observed that appreciable fluctuations are induced all along the bridge girder due to the Gaussian white noise. As such, the CWC can only identify the damage locations under a severity of 40%, below which it becomes quite difficult to successfully carry out damage identification.
4.3. Vehicle Speed
The previous studies indicate that the performance of the conventional damage inspection method under a low vehicle speed is better than that under a high vehicle speed. In this section, the performance of the proposed damage inspection methodology in cases 1, 4, and 5 under two vehicle speeds, i.e., 8 m/s and 12 m/s, is investigated. It is observed in Figure 13 that the CWC is able to identify the damage location under both vehicle speeds, indicating that the proposed damage inspection methodology has a good performance under a relatively high vehicle speed.
4.4. Boundary Effect
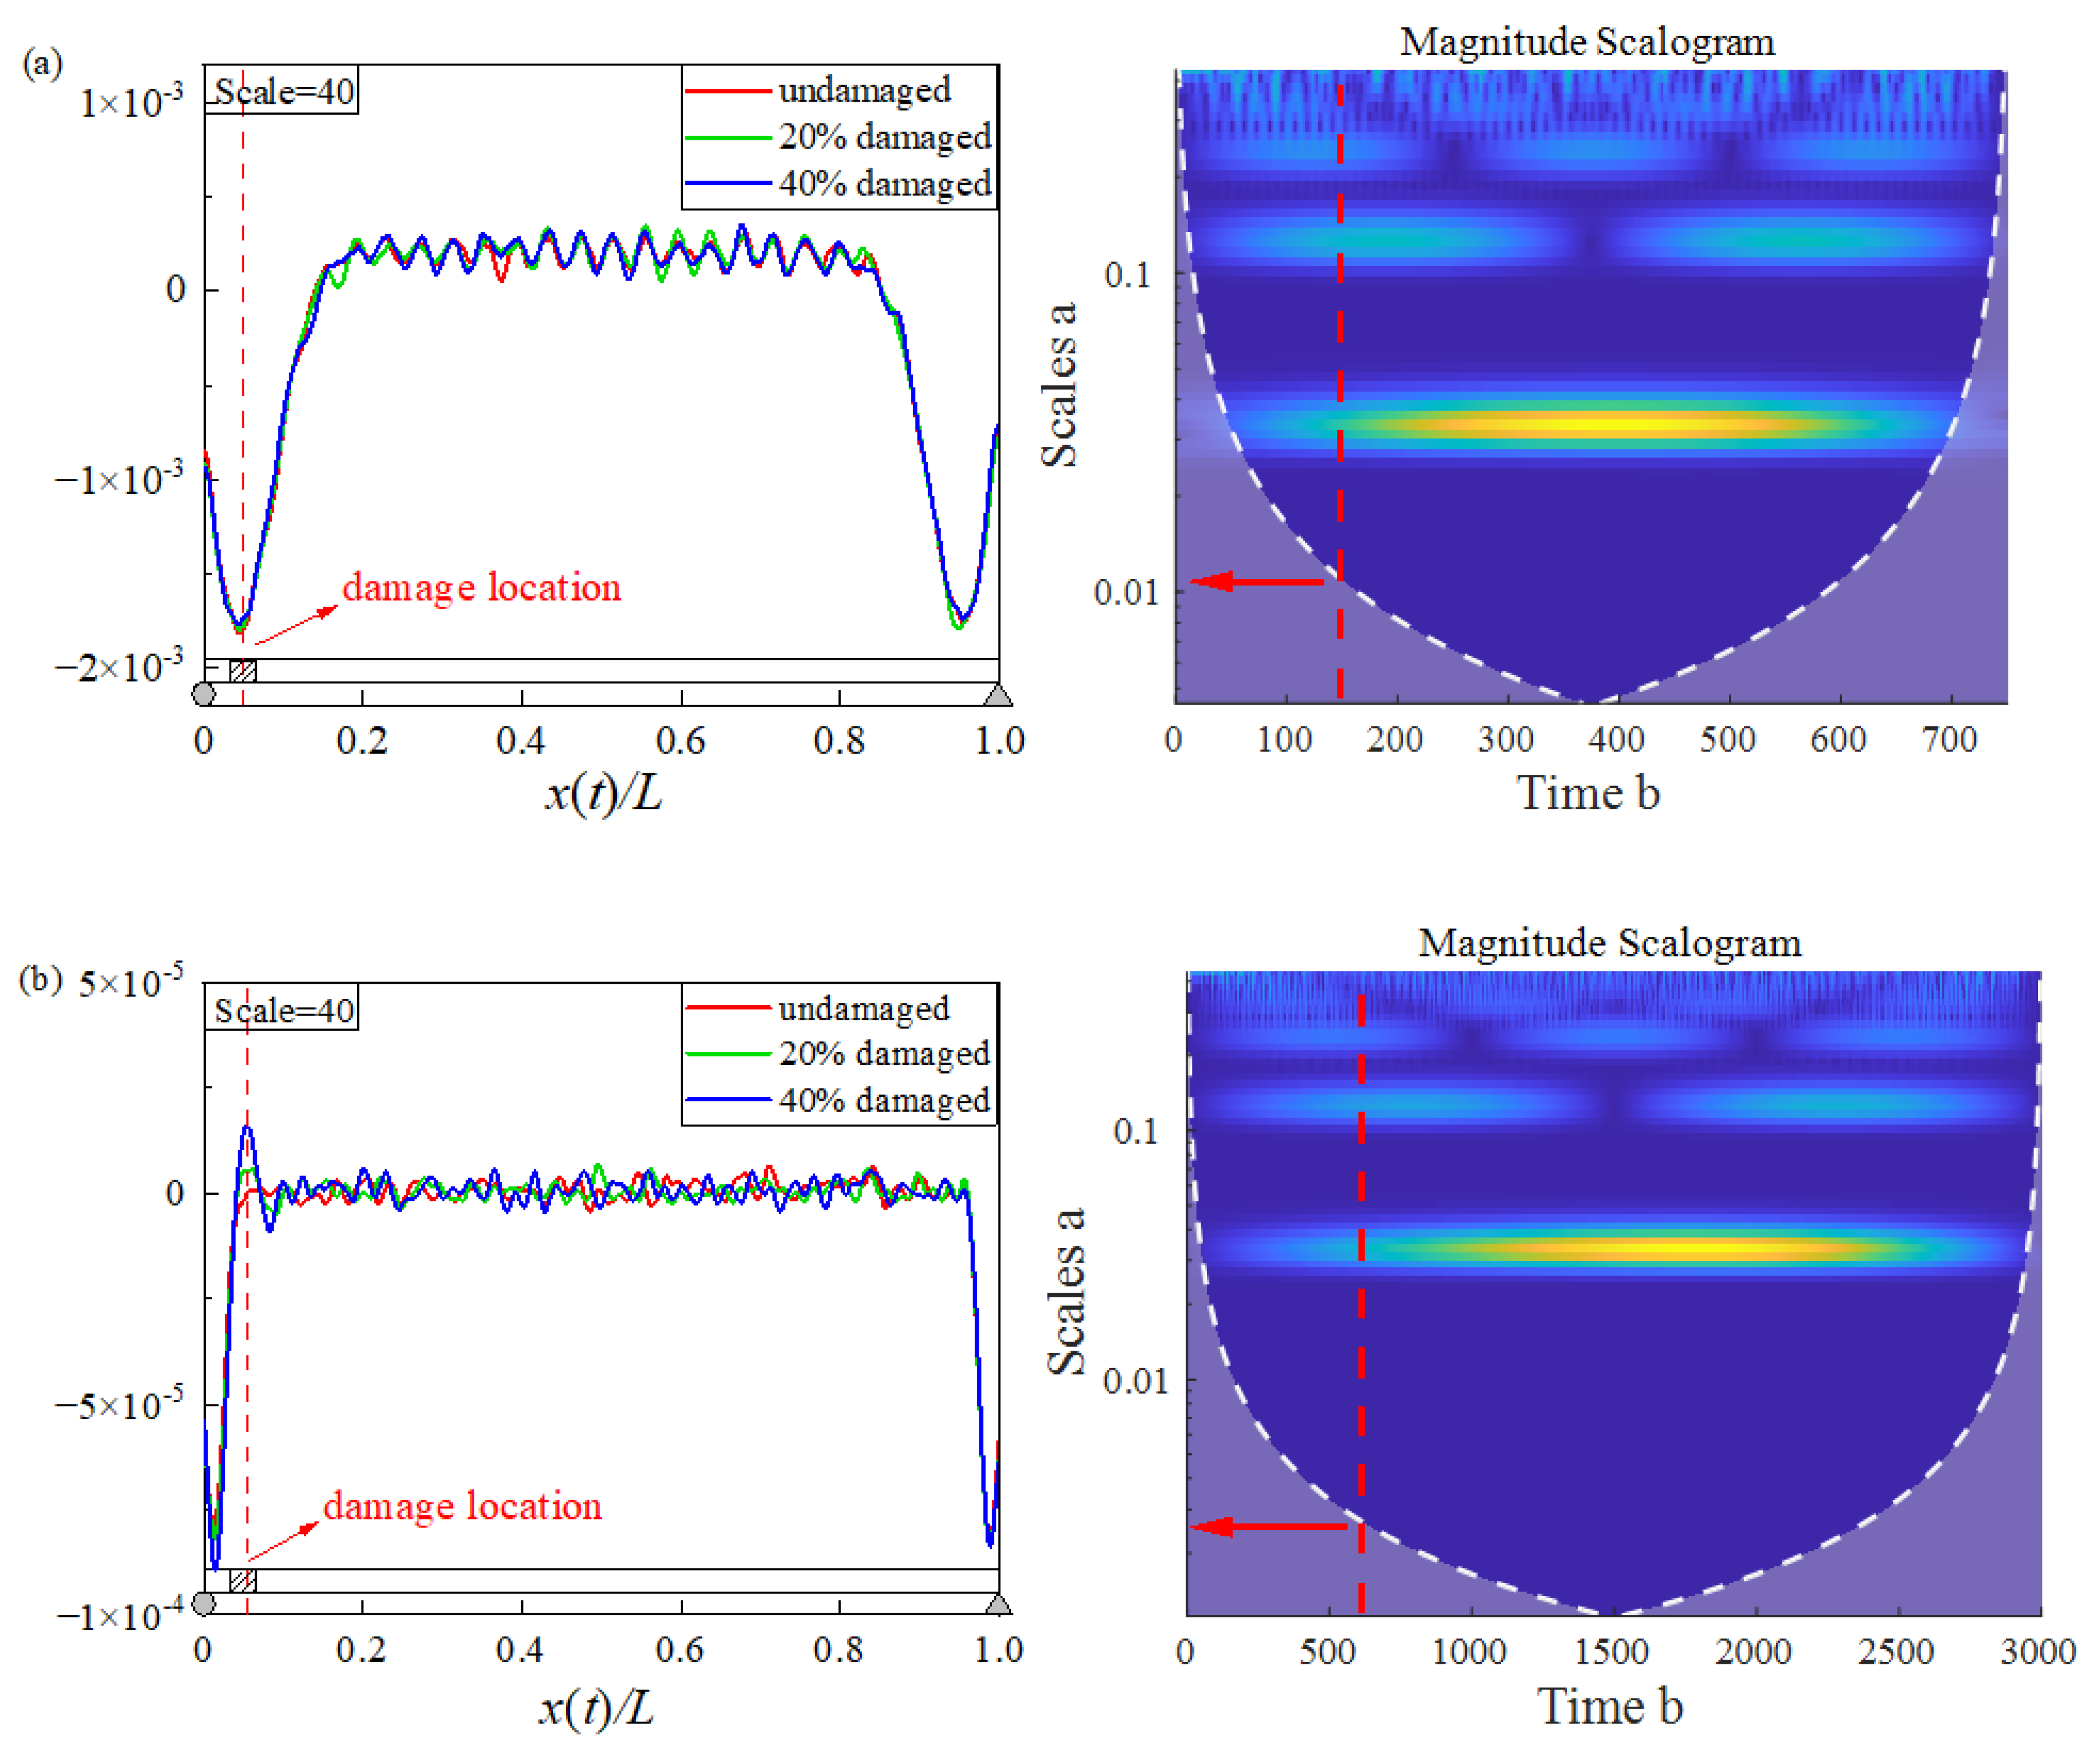
It is noted that in the process of the CWT, the WC is derived from the window function and wavelet convolution. When the window is located at the end of the signal, the signal is inevitably distorted because the signal is forced to zero at its end. This is referred to as the boundary effect of the CWT. In the time–frequency diagram, the quality of the signal becomes poor with the decrease in the frequency (scale a), as shown in Figure 14a. The boundary effect could inundate the damage information of the beam element near the bridge girder end. For example, when the vehicle speed is 4 m/s, it is impossible to extract the damage information of element 2, as shown in Figure 14a. The influence of the boundary effect is illustrated in the influence cone, in which the signal inside the influence cone is not affected by the boundary effect, while the signal outside the influence cone is significantly affected by the boundary effect. It is also noted that as the vehicle speed reduces from 4 m/s to 1 m/s, the influence cone becomes flatter and the influence of the boundary effect becomes less significant. As shown in Figure 14b, when the vehicle speed is 1 m/s, the second element can be successfully identified. Therefore, a low-speed test vehicle is expected to alleviate the adverse boundary effect. However, it remains impossible to identify the damage at the girder ends (i.e., 1st and 30th elements), even with a low-speed test vehicle, and more advanced algorithms may be considered in the future to resolve this limitation.
5. Concluding Remarks
The present study proposes a novel drive-by-based method, in which a new damage factor index, i.e., the CWC, is established for bridge damage identification in an efficient and accurate manner. The following conclusions were obtained:
- (1)
- Compared with the EEMD method, the CEEMAN algorithm can better eliminate the mode mixing and pseudo-frequency problems during the extraction of the CWC. The introduction of this method also makes the CWC curve smooth, convenient for damage inspection, with strong anti-noise performance. After adding white noise with a signal-to-noise ratio of 20, a bridge girder with a damage severity of 20% can be identified.
- (2)
- The selection of the scale factor is critical for bridge damage inspection based on the extracted CWC. The effective scale factor of the CWC extracted using the proposed method has a wide range, which improves the inspection efficiency.
- (3)
- A low vehicle speed is beneficial to alleviate the adverse effect of the boundary effect on the damage inspection of bridge girder ends.
It should be noted that, as with most existing studies on drive-by methods for bridge health inspection, the proposed method is numerically verified, demonstrating the potential for actual practice. However, there remain great challenges in achieving a satisfactory accuracy of bridge health inspection in real-world environments. In particular, the collected vibrational signals for damage identification are usually contaminated due to the interference of random traffic flow, environmental noises, etc. It is therefore recommended to carry out such a practical test when there is less adverse traffic excitation. Meanwhile, a specialized test vehicle with fewer internal noises (e.g., from motor vibration) is also beneficial to the performance of damage identification. To further improve the drive-by method, one may present further investigations on eliminating the common boundary effect through innovative algorithms and/or novel experimental designs.
Author Contributions
T.Z.: conceptualization, methodology, software, investigation, formal analysis, writing—original draft. J.Z.: conceptualization, funding acquisition, resources, supervision, writing—review and editing. Z.X.: conceptualization, methodology, formal analysis, writing—review and editing. K.Z.: resources, supervision. M.W.: resources, writing—review and editing. All authors have read and agreed to the published version of the manuscript.
Funding
This research were funded by the National Natural Science Foundation of China (Grant number 51908472), China Postdoctoral Science Foundation (Grant numbers 2019TQ0271 and 2019M663554), and Department of Science and Technology of Sichuan Province (2020YJ0080).
Institutional Review Board Statement
Not applicable.
Informed Consent Statement
Not applicable.
Data Availability Statement
All data, models, or codes that support the findings of this study are available upon reasonable request.
Conflicts of Interest
The authors declare no conflict of interest.
Abbreviations
| WT | wavelet transform |
| CWT | continuous wavelet transform |
| WC | wavelet coefficient |
| CWC | characteristic wavelet coefficient |
| EMD | empirical mode decomposition |
| EEMD | ensemble empirical mode decomposition |
| CEEMDAN | complete ensemble empirical mode decomposition with adaptive noise |
References
- Ren, W.X.; Zhao, T.; Harik, I.E. Experimental and analytical modal analysis of steel arch bridge. J. Struct. Eng. 2004, 130, 1022–1031. [Google Scholar] [CrossRef]
- Kim, C.W.; Chang, K.C.; Kitauchi, S.; Mcgetrick, P.J. A field experiment on a steel Gerber-truss bridge for damage detection utilizing vehicle-induced vibrations. Struct. Health Monit. 2016, 15, 421–429. [Google Scholar] [CrossRef]
- Fan, W.; Qiao, P. Vibration-based Damage Identification Methods: A Review and Comparative Study. Struct. Health Monit. 2011, 9, 83–111. [Google Scholar] [CrossRef]
- Amezquita-Sanchez, J.P.; Adeli, H. Signal Processing Techniques for Vibration-Based Health Monitoring of Smart Structures. Arch. Comput. Methods Eng. State Art Rev. 2016, 23, 1–15. [Google Scholar] [CrossRef]
- Yang, Y.B.; Wang, Z.L.; Shi, K.; Xu, H.; Wu, Y.T. State-of-the-Art of Vehicle-Based Methods for Detecting Various Properties of Highway Bridges and Railway Tracks. Int. J. Struct. Stab. Dyn. 2020, 20, 1850025. [Google Scholar] [CrossRef]
- Manzini, N.; Orcesi, A.; Thom, C.; Brossault, M.A.; Botton, S.; Ortiz, M.; Dumoulin, J. Machine Learning Models Applied to a GNSS Sensor Network for Automated Bridge Anomaly Detection. J. Struct. Eng. 2022, 148, 04022171. [Google Scholar] [CrossRef]
- Reagan, D.; Sabato, A.; Niezrecki, C. Feasibility of using digital image correlation for unmanned aerial vehicle structural health monitoring of bridges. Struct. Health Monit. 2018, 17, 1056–1072. [Google Scholar] [CrossRef]
- Yang, Y.B.; Lin, C.W.; Yau, J.D. Extracting bridge frequencies from the dynamic response of a passing vehicle. J. Sound Vib. 2004, 272, 471–493. [Google Scholar] [CrossRef]
- Lin, C.W.; Yang, Y.B. Use of a passing vehicle to scan the fundamental bridge frequencies: An experimental verification. Eng. Struct. 2005, 27, 1865–1878. [Google Scholar] [CrossRef]
- Yang, Y.B.; Chen, W.F. Extraction of Bridge Frequencies from a Moving Test Vehicle by Stochastic Subspace Identification. J. Bridge Eng. 2016, 21, 04015053. [Google Scholar] [CrossRef]
- Malekjafarian, A.; OBrien, E.J. On the use of a passing vehicle for the estimation of bridge mode shapes. J. Sound Vib. 2017, 397, 77–91. [Google Scholar] [CrossRef]
- González, A.; Obrien, E.J.; Mcgetrick, P.J. Identification of damping in a bridge using a moving instrumented vehicle. J. Sound Vib. 2012, 331, 4115–4131. [Google Scholar] [CrossRef]
- Keenahan, J.; Obrien, E.J.; Mcgetrick, P.J.; Gonzalez, A. The use of a dynamic truck-trailer drive-by system to monitor bridge damping. Struct. Health Monit. 2013, 13, 143–157. [Google Scholar] [CrossRef]
- OBrien, E.J.; Malekjafarian, A. A mode shape-based damage detection approach using laser measurement from a vehicle crossing a simply supported bridge. Struct. Control. Health Monit. 2016, 23, 1273–1286. [Google Scholar] [CrossRef]
- Oshima, Y.; Yamamoto, K.; Sugiura, K. Damage assessment of a bridge based on mode shapes estimated by responses of passing vehicles. Smart. Struct. Syst. 2014, 13, 731–753. [Google Scholar] [CrossRef]
- Robert, C.; Abdollah, M. Examining changes in bridge frequency due to damage using the contact-point response of a passing vehicle. J. Struct. Integr. Maint. 2021, 6, 148–158. [Google Scholar]
- Mei, Q.; Gul, M.; Boay, M. Indirect health monitoring of bridges using Mel-frequency cepstral coefficients and principal component analysis. Mech. Syst. Signal Proc. 2018, 119, 523–546. [Google Scholar] [CrossRef]
- Corbally, R.; Malekjafarian, A. A data-driven approach for drive-by damage detection in bridges considering the influence of temperature change. Eng. Struct. 2022, 253, 113783. [Google Scholar] [CrossRef]
- Sarwar, M.Z.; Cantero, D. Deep autoencoder architecture for bridge damage assessment using responses from several vehicles. Eng. Struct. 2021, 246, 113064. [Google Scholar] [CrossRef]
- Locke, W.; Sybrandt, J.; Redmond, L.; Safro, I.; Atamturktur, S. Using drive-by health monitoring to detect bridge damage considering environmental and operational effects. J. Sound Vib. 2020, 468, 115088. [Google Scholar] [CrossRef]
- Abdulkareem, M.; Bakhary, N.; Vafaei, M.; Noor, N.M.; Padil, K.H. Non-probabilistic wavelet method to consider uncertainties in structural damage detection. J. Sound Vib. 2018, 433, 77–98. [Google Scholar] [CrossRef]
- Abdulkareem, M.; Bakhary, N.; Vafaei, M.; Noor, N.M.; Mohamed, R.N. Application of two-dimensional wavelet transform to detect damage in steel plate structures. Measurement 2019, 146, 912–923. [Google Scholar] [CrossRef]
- Abdulkareem, M.; Bakhary, N.; Ganiyu, A.; Nathaniel, O.; Jassam, T.M.; Al-Mansob, R.A. Consideration of uncertainty in damage detection using interval analysis wavelet without baseline data. J. Struct. Integr. Maint. 2021, 6, 99–109. [Google Scholar] [CrossRef]
- Zhu, X.Q.; Law, S.S. Wavelet-based crack identification of bridge beam from operational deflection time history. Int. J. Solids Struct. 2006, 43, 2299–2317. [Google Scholar] [CrossRef]
- Hester, D.; González, A. A wavelet-based damage detection algorithm based on bridge acceleration response to a vehicle. Mech. Syst. Signal Proc. 2012, 28, 145–166. [Google Scholar] [CrossRef]
- Nguyen, K.V.; Hai, T.T. Multi-cracks detection of a beam-like structure based on the on-vehicle vibration signal and wavelet analysis. J. Sound Vib. 2010, 329, 4455–4465. [Google Scholar] [CrossRef]
- Khorram, A.; Bakhtiari-Nejad, F.; Rezaeian, M. Comparison studies between two wavelet based crack detection methods of a beam subjected to a moving load. Int. J. Eng. Sci. 2012, 51, 204–215. [Google Scholar] [CrossRef]
- Tan, C.; Elhattab, A.; Uddin, N. Wavelet-Entropy Approach for Detection of Bridge Damages Using Direct and Indirect Bridge Records. J. Infrastruct. Syst. 2020, 26, 04020037. [Google Scholar] [CrossRef]
- Yang, Y.B.; Chang, K.C. Extraction of bridge frequencies from the dynamic response of a passing vehicle enhanced by the EMD technique. J. Sound Vibr. 2009, 322, 718–739. [Google Scholar] [CrossRef]
- Obrien, E.J.; Malekjafarian, A.; González, A. Application of empirical mode decomposition to drive-by bridge damage detection. Eur. J. Mech. A-Solids 2017, 61, 151–163. [Google Scholar] [CrossRef]
- Zhu, L.; Malekjafarian, A. On the Use of Ensemble Empirical Mode Decomposition for the Identification of Bridge Frequency from the Responses Measured in a Passing Vehicle. Infrastructures 2019, 4, 32. [Google Scholar] [CrossRef] [Green Version]
- Yang, Y.B.; Xiong, F.; Wang, Z.L.; Xu, H. Extraction of Bridge Frequencies Inclusive of the Higher Modes by the ESMD Using the Contact-Point Response. Int. J. Struct. Stab. Dyn. 2020, 20, 718–723. [Google Scholar] [CrossRef]
- Li, J.; Zhu, X.; Guo, J. Bridge modal identification based on successive variational mode decomposition using a moving test vehicle. Adv. Struct. Eng. 2022, 25, 2284–2300. [Google Scholar] [CrossRef]
- Yang, Y.B.; Zhang, B.; Qian, Y.; Wu, Y. Further Revelation on Damage Detection by IAS Computed from the Contact-Point Response of a Moving Vehicle. Int. J. Struct. Stab. Dyn. 2018, 18, 1850137. [Google Scholar] [CrossRef]
- Yang, Y.B.; Zhang, B.; Qian, Y.; Wu, Y. Contact-Point Response for Modal Identification of Bridges by a Moving Test Vehicle. Int. J. Struct. Stab. Dyn. 2018, 18, 1850073. [Google Scholar] [CrossRef]
- Zhu, J.; Wu, M.X.; Zhang, W. Evaluation of Ride Comfort and Driving Safety for Moving Vehicles on Slender Coastal Bridges. J. Vib. Acoust.-Trans. ASME 2018, 140, 051012. [Google Scholar] [CrossRef]
- Zhu, J.; Zhang, W. Numerical Simulation of Wind and Wave Fields for Coastal Slender Bridges. J. Bridge Eng. 2016, 22, 04016125. [Google Scholar] [CrossRef]
- Xiong, Z.; Zhu, J.; Zheng, K.; Zhang, W.; Li, Y.; Wu, M. Framework of wind-traffic-bridge coupled analysis considering realistic traffic behavior and vehicle inertia force. J. Wind Eng. Ind. Aerodyn. 2020, 205, 104322. [Google Scholar] [CrossRef]
- Huang, N.E.; Shen, Z.; Long, S.R.; Wu, M.C.; Shih, H.H.; Zheng, Q.; Yen, N.-C.; Tung, C.C.; Liu, H.H. The Empirical Mode Decomposition and the Hilbert Spectrum for Nonlinear and Non-Stationary Time Series Analysis. Proc. R. Soc. A-Math. Phys. Eng. Sci. 1998, 454, 903–995. [Google Scholar] [CrossRef]
- Wu, Z.; Huang, N.E. Ensemble Empirical Mode Decomposition: A Noise-Assisted Data Analysis Method. Adv. Adapt. Data Anal. 2011, 1, 1–41. [Google Scholar] [CrossRef]
- Torres, M.E.; Colominas, M.A.; Schlotthauer, G.; Flandrin, P. A complete ensemble empirical mode decomposition with adaptive noise. In Proceedings of the 2011 IEEE International Conference on Acoustics, Speech and Signal Processing (ICASSP), Prague, Czech Republic, 22–27 May 2011; pp. 4144–4147. [Google Scholar]
Figure 1.
Flowchart of the proposed drive-by bridge damage inspection methodology.

Figure 2.
Lumped sprung mass moving on a simply supported beam.

Figure 3.
Single-DOF sprung mass moving along a simply supported bridge beam model.

Figure 4.
Comparison between the simulated dynamic response of the vehicle-bridge system and the analytical solutions: (a) bridge mid-span acceleration; (b) vehicle acceleration; (c) contact-point acceleration.
Figure 4.
Comparison between the simulated dynamic response of the vehicle-bridge system and the analytical solutions: (a) bridge mid-span acceleration; (b) vehicle acceleration; (c) contact-point acceleration.

Figure 5.
CWT of vehicle acceleration under case 5: (a) the time-frequency diagram; (b) wavelet coefficient graph with a scale factor of 35.
Figure 5.
CWT of vehicle acceleration under case 5: (a) the time-frequency diagram; (b) wavelet coefficient graph with a scale factor of 35.

Figure 6.
Wavelet coefficient diagram: (a) bridge mid-span acceleration; (b) contact-point acceleration.
Figure 6.
Wavelet coefficient diagram: (a) bridge mid-span acceleration; (b) contact-point acceleration.

Figure 7.
The IMF and FFT of the WC extracted by EEMD.

Figure 8.
The IMF and FFT of the WC extracted by CEEMDAN.

Figure 9.
CWC extracted using different methods: (a) EEMD; (b) CEEMDAN.

Figure 10.
Inspection of multi-damage case: (a) CWC extracted from bridge mid-span acceleration; (b) CWC extracted from vehicle acceleration; (c) CWC extracted from contact-point acceleration. Where @ indicates the degree of damage.
Figure 10.
Inspection of multi-damage case: (a) CWC extracted from bridge mid-span acceleration; (b) CWC extracted from vehicle acceleration; (c) CWC extracted from contact-point acceleration. Where @ indicates the degree of damage.

Figure 11.
CWC under different scale factors: (a) scale = 15; (b) scale = 35; (c) scale = 55.

Figure 12.
CWC extracted from signals with noise with different SNRs: (a) SNR = 50; (b) SNR = 20; (c) SNR = 15.
Figure 12.
CWC extracted from signals with noise with different SNRs: (a) SNR = 50; (b) SNR = 20; (c) SNR = 15.

Figure 13.
CWC at different speeds: (a) 8 m/s; (b) 12 m/s.

Figure 14.
CWC and influence cone at different speeds: (a) 4 m/s; (b) 1 m/s.


Table 1.
Essential parameters of the vehicle–bridge system.
| Parameter | Definition | Value |
|---|---|---|
| mv | Vehicle mass | 1000 kg |
| Cv | Vehicle rigidity | 500 kN/m |
| mb | Mass per meter of bridge | 4000 kg |
| L | Length of bridge | 15 m |
| Ib | Inertia moment of bridge section | 0.12 m4 |
| wv | Vehicle frequency | 3.56 Hz |
| wd | Driving frequency | 0.266 Hz |
| wb1 | First-order frequency of bridge | 6.623 Hz |
| wb2 | Second-order frequency of bridge | 26.492 Hz |
Table 2.
Case setting for VBI analysis.
| Number | Vehicle Mass (kg) | Vehicle Speed (m/s) | Damage Location (No. of Element) | Degree of Damage |
|---|---|---|---|---|
| 1 | 1000 | 4 | 7 | 0% |
| 2 | 1000 | 4 | 7 | 5% |
| 3 | 1000 | 4 | 7 | 10% |
| 4 | 1000 | 4 | 7 | 20% |
| 5 | 1000 | 4 | 7 | 40% |
| 6 | 1000 | 4 | 2 | 0% |
| 7 | 1000 | 4 | 2 | 20% |
| 8 | 1000 | 4 | 2 | 40% |
| 9 | 1000 | 1 | 2 | 0% |
| 10 | 1000 | 1 | 2 | 20% |
| 11 | 1000 | 1 | 2 | 40% |
| 12 | 1000 | 4 | 4, 14 | 10%, 30% |
| 13 | 1000 | 4 | 4, 14 | 30%, 10% |
Disclaimer/Publisher’s Note: The statements, opinions and data contained in all publications are solely those of the individual author(s) and contributor(s) and not of MDPI and/or the editor(s). MDPI and/or the editor(s) disclaim responsibility for any injury to people or property resulting from any ideas, methods, instructions or products referred to in the content. |
© 2023 by the authors. Licensee MDPI, Basel, Switzerland. This article is an open access article distributed under the terms and conditions of the Creative Commons Attribution (CC BY) license (https://creativecommons.org/licenses/by/4.0/).
Share and Cite
MDPI and ACS Style
Zhang, T.; Zhu, J.; Xiong, Z.; Zheng, K.; Wu, M. A New Drive-by Method for Bridge Damage Inspection Based on Characteristic Wavelet Coefficient. Buildings 2023, 13, 397. https://doi.org/10.3390/buildings13020397
AMA Style
Zhang T, Zhu J, Xiong Z, Zheng K, Wu M. A New Drive-by Method for Bridge Damage Inspection Based on Characteristic Wavelet Coefficient. Buildings. 2023; 13(2):397. https://doi.org/10.3390/buildings13020397
Chicago/Turabian StyleZhang, Tingpeng, Jin Zhu, Ziluo Xiong, Kaifeng Zheng, and Mengxue Wu. 2023. "A New Drive-by Method for Bridge Damage Inspection Based on Characteristic Wavelet Coefficient" Buildings 13, no. 2: 397. https://doi.org/10.3390/buildings13020397
Note that from the first issue of 2016, this journal uses article numbers instead of page numbers. See further details here.