
Shade and Thermal Comfort in Courtyards: Experimental versus Simulation Results
by
 , , and
Victoria Patricia López-Cabeza
 ,
,
Eduardo Diz-Mellado
 ,
,
Carlos Alberto Rivera-Gómez
 and
and
Carmen Galán-Marín
*
Departamento de Construcciones Arquitectónicas 1, Escuela Técnica Superior de Arquitectura, Universidad de Sevilla, Avda Reina Mercedes 2, 41012 Seville, Spain
*
Author to whom correspondence should be addressed.
Buildings 2022, 12(11), 1961; https://doi.org/10.3390/buildings12111961
Submission received: 19 October 2022
/
Revised: 7 November 2022
/
Accepted: 9 November 2022
/
Published: 11 November 2022
(This article belongs to the Special Issue Architectural Design Based on the Influence of Indoor and Outdoor Environments)
Abstract
:Outdoor comfort is gaining attention in the design of our cities to face the current context of rising temperatures. Although simulation is required to inform the early design stage of projects considering outdoor space and strategies to improve their thermal performance, different tool options must be compared through monitoring to determine the accuracy of their modeling. This study analyses the thermal comfort benefits of the installation of a shading device in a courtyard in the Mediterranean climate. In the study, two simulation workflows were analyzed, one using ENVI-met software and the other using the Ladybug Tools, to evaluate their performance. Air temperature monitoring data were used to validate and calibrate the simulations. Then, both were used to compute the Universal Thermal Climate Index (UTCI) to evaluate comfort. The results show that the simulation reproduced an air temperature reduction when the shading was installed, but this was not as high as the monitoring results (up to 13.7 °C). In the UTCI, in contrast, the two simulation workflows provided contradictory results. These differences were explained by analyzing the different parameters affecting comfort and the mean radiant temperature, and the air temperature was found to be the parameter most affecting the UTCI in this context. Thus, future research should focus on improving the accuracy of the simulations of these two parameters.
1. Introduction
Outdoor space microclimate simulation is an increasingly critical issue in the current situation of climate change and public health, given that simulation can provide information and criteria about the design of our cities [1]. Outdoor comfort control can help to reduce global urban energy consumption and, at the same time, act as an indicator of how well we are mitigating the urban heat island effect [2]. Improving outdoor comfort through design by creating cool microclimates is a way to reduce the temperatures in our cities. Therefore, outdoor comfort is an important parameter that should be taken into greater account in design. One attractive option that may be used to improve thermal comfort in cities is the installation of textile shading devices in street canyons to protect them from direct solar radiation. Previous research performed in the city of Cordoba found that this strategy is effective regarding the orientation of the street [3].
The courtyard is an element that has been implemented in the traditional architecture of many cultures not only as an outdoor space that provides light and ventilation to the building but also as a space to live in [4]. Nowadays, courtyards are considered a passive strategy in terms of the energy efficiency of buildings [5,6], given that the microclimate generated within a courtyard controls the outdoor temperature, a performance that reduces the energy demands of buildings by lowering the energy losses through surfaces in contact with the courtyard space and, consequently, reducing the consumption of the conditioning systems [7]. In this study, we focus on the benefits of the courtyard as an outdoor space that can be inhabited in light of its potential to provide improved thermal comfort compared to outside spaces, especially in hot and dry climates such as the Mediterranean.
The self-shading effect generated by courtyards’ geometry creates their particular microclimate [8]. The performance of the courtyard depends on many factors, such as its geometry [9,10], orientation [11], and location [12], the albedo of the surfaces [13], presence of vegetation or water [14], and elements that provide shade [15]. Understanding the influence of each of these factors is important in enabling the design of the most efficient courtyard. Although much research has been carried out to gather empirical knowledge of how different factors affect the performance of courtyards, the use of simulation software is required in order to accurately predict their performance in the design process. The ability to predict the microclimate of courtyards or other outdoor spaces affecting buildings will greatly reduce uncertainties about energy simulations of the outdoor environment and comfort [16,17]. Specifically, the use of computational fluid dynamic (CFD) tools is required to account for the thermodynamic effect that occurs in this kind of space.
In addition to the use of simulation software to predict physical variables, the quantification of the performance of an outdoor space requires the use of human-centered measurements, given that our objective is mainly the improvement of the comfort of people in those spaces. Several thermal comfort indexes have been developed for application in the outdoor environment, although only four, the Physiological Equivalent Temperature (PET) [18], the Standard Equivalent Temperature (SET*) [19], the Predicted Mean Vote (PMV) [20], and the Universal Thermal Climate Index (UTCI) [21], are widely used in outdoor comfort studies [22]. PMV and SET* are indoor indexes that were adapted to outdoor environments, while PET and UTCI were directly created for outdoor environments. Among these two, PET has been widely adapted to different climates, considering different ranges of thermal comfort [23,24]. UTCI, in contrast, was specifically developed to be universal, meaning that the comfort range can be applied to different climates. Thus, the results are comparable [25]. Therefore, UTCI was selected in this study to measure outdoor thermal comfort, as many other studies have previously used this index to measure comfort in courtyards [26,27,28].
Among the different strategies analyzed to improve the performance of courtyards, the increase in shading elements (vegetation or devices) has been the most effective. Previous studies have evaluated the shading benefits of outdoor or semi-outdoor spaces using experimental studies. Ying Liu et al. [29] evaluated outdoor thermal comfort considering the shade benefit of trees and concluded that it was the most efficient way to cool down according to the surveys. The effectiveness of textile shading devices in the streets of Cordoba was evaluated using thermography, achieving a ground surface temperature reduction of 16 °C [3]. The inclusion of permanent or removable shading devices in a courtyard has been successful in controlling radiation flux [30]. The specific use of shading devices in a courtyard was experimentally measured in the Mediterranean climate in a case study which achieved an up to 6 °C higher reduction in air temperature when the shading device was installed compared to when it was not installed [31]. In contrast, another study observed a relative increase in the air temperature of 1K between a bare and a shaded courtyard in a hot dry climate [32].
Despite the number of experimental studies analyzing the effect of shading on outdoor thermal performance, simulation is required if the effect of the shading is to be evaluated in the design stage of a project. There are a very limited number of studies using simulation for the specific analysis of shading in courtyards. Berkovic et al. [33] analyzed different strategies aiming to improve comfort in a courtyard using the software ENVI-met and found that shading provided by trees and galleries was the most effective means of improving thermal comfort on hot days. The same software was used by another two studies [34,35] to analyze the influence of sun-sail shading and tree shading on school courtyards in Egypt, suggesting design strategies to improve thermal comfort. In contrast to Berkovic et al.’s analysis [33], they included a validation of the simulation tool before applying it. This is essential for ensuring the accuracy of the simulations. An increasing number of studies contrasting monitored and simulation data in ENVI-met validated their results, although some studies concluded that, in the specific case of courtyards, the software can lead to important inaccuracies [36]. ENVI-met [37] is one of the most widely used tools to simulate urban outdoor microclimates and thermal comfort, and its accuracy should be evaluated before its use in thermal performance analysis [38].
There are other issues regarding ENVI-met’s use in the early design stage of projects, including the great amount of time and computational power required for the simulations. Recently, some other simulation tools that have also been applied to urban analysis and thermal comfort have gained attention, such as CitySim, Rayman, or the Ladybug Tools [39]. The Ladybug Tools have been used to simulate courtyards, with some accuracy and performative advantages compared to ENVI-met [40]. However, their suitability for simulating the effectiveness of shading devices in courtyards still requires validation.
This study aims to analyze the thermal comfort improvement yielded by the strategy of shading devices in courtyards using simulations previously validated by means of monitoring results. With this goal, two gaps found in the literature are addressed: first, the limited number of studies analyzing the strategy of shading devices in courtyards in a hot climate, and second, the validation and performative evaluation of two tools, ENVI-met and the Ladybug Tools. The former is widely used but not particularly appropriate for the early design process, and the latter is an emerging tool that is gaining increasing attention and still requires validation studies. The focus of the study is to identify suitable tools to be used in the early design stage of courtyard microclimates to optimize user thermal comfort. To achieve these goals, a case study of the city of Cordoba was monitored and simulated, and the UTCI comfort parameter was predicted to compare the performances of the courtyard with and without a shading device installed.
This paper is structured as follows: The materials and methods section presents the case study, the monitoring campaign, the simulation tools, and the performance parameters analyzed. Then, the results section presents the experimental campaign results, the validation of the workflows, and the simulation results of UTCI for both tools. In the discussion section, the results are further analyzed and discussed, finally ending with the conclusion section.
2. Materials and Methods
2.1. Case Study
The case study selected for this study is a residential house with a small courtyard located in the city center of Cordoba (4°46′23” W, 37°52′58” N, elevation 106 m a.s.l). The climate of the area is classified as type Csa according to the Koppen classification [41], where “C” stands for a temperate climate (monthly mean minimum temperature between −3 °C and 18 °C), “s” stands for dry summers (less than 40 mm of rainfall), and “a” means hot temperatures in the summer (monthly mean maximum temperature above 22 °C). The courtyard of the house was geometrically characterized using the aspect ratio (AR), defined as the relationship between the height and the width of the courtyard, following Equation (1):
AR = Height/Width,
The courtyard is 4.5 × 4.5 m wide and 6.5 m high, which computes an aspect ratio (AR) of 1.4. The courtyard’s walls are coated with white cement mortar and have a window ratio of 20% approximately. On the roof, around the courtyard, there is a railing that allows the installation of a canvas mesh to provide shade when needed, while still allowing air to flow in and outside the courtyard, reducing the overheating effects (Figure 1). The canvas installed during part of the monitoring campaign is a black polyethylene fabric with a 60–70% UV filter of a 70 g/m2 density.
2.2. Monitoring
The monitoring campaign took place in the summer of 2017 from 26 July to 22 August. That year was one of the hottest ever recorded in the south of Spain, according to the Spanish Agency of Meteorology (AEMET) [42]. For half of the monitoring period, the courtyard was protected by the previously described shading device. The monitoring methodology followed the same procedure as that of the previous studies already published [43,44]. The air temperature, relative humidity, and wind speed and direction outside the courtyard were recorded using a meteorological station model, PCE-FWS 20, placed on the roof of the house and separated from the roof pavement to avoid the influence of radiative heat from the pavement material on the weather station. Inside the courtyard, the air temperature and relative humidity were recorded at human height, 1.5 m high above the ground, using the data loggers model TESTO 174 H. The two parameters were selected due to their influences on human thermal comfort. The devices were hung on the south façade of the courtyard to avoid direct solar radiation that could cause overheating and were separated from the wall by a 10 cm space. Table 1 shows the technical data of the instruments.
Two days with similar highest temperatures, around 44 °C, one when the shading device was installed (4 August) and another without the device (18 August), were selected for simulation in order to provide comparable data.
2.3. Simulation
Two simulation workflows were compared in this study to analyze their accuracy and suitability for implementation in the early design stage of a project. Based on previous studies [38,45], the dry bulb temperature selected as the monitored parameter to calibrate and validate the results inside the courtyard. Afterward, the simulation tools were used to provide the UTCI index and measure the benefits of the passive strategy of installing a shading device in the courtyard. The two workflows are summarized in Figure 2 and described as follows:
2.3.1. ENVI-Met Simulation Workflow
This CFD tool is the most frequently used to simulate urban microclimates according to literature, given that it takes into account the interrelations between most of the different factors that intervene, such as the soil, air, vegetation, water, and buildings. It provides a large amount of data and requires a long simulation time and high computational power. The ENVI-met v4.4 version was used in this study. ENVI-met uses the finite difference method to solve the partial differential equations of the CFD model, the turbulence kinetic energy (TKE). The geometry model had 121 × 112 × 30 cells and a cell size of 0.5 m. It included the building with the courtyard and its surroundings. The cell size was selected as the smallest possible in this software to achieve the best accuracy. The boundary conditions for the simulation were the hourly air temperature, relative humidity, and the mean wind speed and direction measured in the monitoring campaign on the roof of the building. The building materials and soil properties used in the simulation are described in Table 2. The material properties included in the software were kept as the same. A total of 48 h were simulated in order to discard the first 24 h, given that the numerical method of ENVI-met requires an initialization period to provide reliable data.
2.3.2. Ladybug Simulation Workflow
The Ladybug Tools for Grasshopper enable the connection between different types of validated simulation software, such as EnergyPlus, OpenFOAM, Radiance, or Daysim, and the graphical interface of the modeling tool Rhinoceros [46]. Each of the tools, namely Honeybee, Ladybug, and Butterfly, were separately used to calculate one or more of the factors that intervene in outdoor thermal comfort, and the results were combined to obtain the UTCI index. Honeybee, linked with EnergyPlus, was used to perform the energy simulation that provided the surface temperature data as inputs for the Butterfly tool, which, linked with OpenFOAM, was used to perform the CFD courtyard microclimate simulation. The monitored outdoor temperature, relative humidity, and wind speed were the inputs for the simulations, as previously conducted in the ENVI-met simulation.
This kind of workflow has previously been validated by other researchers when applied to urban microclimates [47,48]. In this case, it was used to simulate courtyards, which are slightly different, given that wind is not as important as the convection effect produced by the temperature differences on the surfaces. This is why we used the methodology previously published in [40], where the heat transfer solver in Butterfly was chosen in order to simulate temperature changes in the courtyard.
The model construction for the CFD analysis in Butterfly followed the general recommendations for CFD simulations [49]. The mesh was automatically generated by the software and had approximately 2.3e6 cells with varied dimensions, refined for up to four levels of the building. A sensitivity analysis was performed to determine this level of refinement. The boundary conditions for the wind in the inlet of the model followed a logarithmic wind profile, as typically used in urban simulations. The buoyantBoussinesqSimpleFoam solver, a steady-state solver used for incompressible fluids which also uses the Boussinesq approximation, was used in the software.
The air temperature results for the courtyard from both workflows were compared to the monitoring data to validate the simulations. Afterward, the results of the air temperature, relative humidity, mean radiant temperature, and wind speed in the courtyard were used for the UTCI calculation. The process was carried out in the case study based on the two selected days, with and without the shading device installed, in order to measure the effectiveness of the shading strategy.
2.3.3. Performance Parameters
To validate the simulations, the air temperature outputs in the courtyards were compared with the monitored data. Given the lack of standards available to validate the performance of outdoor microclimate simulations, the validation of the simulation workflows was achieved by contrasting the statistical error parameters with previous research. The statistical parameters were the coefficient of determination (R2) and the root mean square error (RMSE).
The performance of the shading device was analyzed using two parameters:
- The thermal delta (TD) was defined as the difference between the outdoor temperature and the temperature inside the courtyard. This value was calculated at different hours.
- The thermal comfort was quantified using the selected UTCI index. To compute this index, the simulated air temperature, relative humidity, wind speed and mean radiant temperature in the courtyards were extracted and used in the UTCI computation for each software at different times. This value was represented in a map of the courtyard, given that spatial variability that was expected to appear between the shaded and unshaded areas.
3. Results
3.1. Monitoring Results
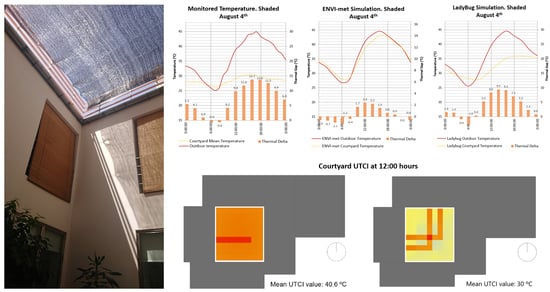
The monitored outdoor air temperatures and courtyard air temperatures are displayed in Figure 3 for the two selected days. The outdoor temperature (dark red line) showed a very similar trend on both days, reaching a 45 °C maximum peak temperature and a 25 °C minimum in the early morning. The temperature inside the courtyard (light yellow dashed line) showed differences between the two days. While the minimum temperature was around 26 °C on both days, the maximum temperature reached 37 °C when the courtyard was not shaded, while the use of the shading device limited the maximum temperature to less than 31 °C. The bars at different hours represent the thermal delta (TD) that was produced by the courtyard, reflecting delta the difference between the outdoor and courtyard temperatures at a specific time. It reached 7.4 °C without the shading device at 18:00 h, a significant reduction in the outdoor temperature. However, it reached 13.7 °C at 16:00 h, when the shading device was installed, which was a significant improvement. Finally, we also noticed the negative TD in the early morning, meaning that, in both cases, the courtyard produced a slight overheating effect.
Figure 4 shows the monitored relative humidity and wind speed outdoors, data which were introduced as boundary conditions in the simulations. The wind speed was low on both days, as is common in this dense area. The relative humidity on the non-shaded day stayed between 10 and 60% during the whole day. On the shaded day, the limits of the relative humidity were 10 to 30%. These values are characteristic of the hot and dry summers in this Mediterranean area.
3.2. Air Temperature Simulation Results
The results from ENVI-met are shown in Figure 5 through the same kind of graph as that used for the monitoring results of the air temperature. This software was not able to accurately reproduce the TD that occurred in the courtyard. When the shading device was not installed, the maximum temperature inside the courtyard reached 42 °C, and the TD was only 2.0 °C at 16:00 h. Once the shading device was installed, the maximum TD increased to only 2.4 °C at noon. The TD at 16:00 h, when shaded, was only 1.5 °C. The overheating effect during the night was accurately reproduced, being around 1 °C warmer in the courtyard than outdoors, keeping the courtyard temperature above 27 °C at all times.
The results of the Ladybug Tools workflow are shown in Figure 6. The courtyard temperature reached around 36 °C. The TD reproduced was closer to the monitoring results, especially when the courtyard was not shaded, reaching an 8.2 °C difference between the outdoor and the courtyard temperatures at 16:00 h. However, when the shading device was installed, the TD reached 9.3°C at the same hour, being only 1.1 °C higher than the non-shaded temperature and not 6.6 °C, as the monitoring showed. Analyzing all the hours, the shading effect produced benefits at all times by increasing the TD, except for the overheating effect at 6:00 h, which was slightly higher when the courtyard was shaded. The Ladybug simulation produced a stronger overheating effect during the night than the monitored results.
3.3. Validation of the Simulations
In order to numerically compare the results of the two workflows with the monitoring results, the statistical parameters calculated were the coefficient of determination (R2) and the root mean square error (RMSE). To be reliable, a model should provide an R2 close to 1 and an RMSE close to 0 [50]. These values were calculated for the air temperature simulation of the courtyard at a 1.5 m height. Table 3 shows the results. The coefficient of determination was higher for the ENVI-met simulation in both the shaded and the non-shaded configurations. However, the RMSE was lower in the case of the Ladybug Tools simulation results. These values were in the range of those of other validated simulations of outdoor environments [36,48], except for the ENVI-met simulation of the shaded day, which produced a high RMSE error.
If we compare the TD results, the Ladybug Tools simulation workflow was always closer to the monitored data than the ENVI-met results. In Figure 7, the TDs at different hours of the day for all the simulations and monitoring are displayed. It can be seen that the simulation results closest to the monitoring data (blue bars) were the Ladybug simulation (green bars), except for the early morning hours.
3.4. UTCI Calculation Results
The results of the air temperatures, mean radiant temperatures, relative humidity, and wind speed of each workflow were used to compute the UTCI. The UTCI calculator used was the same for both workflows, the component included in the Ladybug plugin for Grasshopper, in order to compare the effects on the results of the physical parameters using each software and not those of the UTCI model used. This component uses the original Fortran code adapted to the Grasshopper language to compute the UTCI [51,52]. It is also adapted to compute the UTCI using the ground wind speed instead of that monitored at 10 m.
Figure 8 shows a map of the courtyard representing the results of the UTCI at four different hours from ENVI-met, with the non-shaded courtyard on the left and the shaded one on the right. The values were obtained at 1.5 m above the ground of the courtyard at the user level. The mean value for the courtyard is also given at each hour. The UTCI mean values ranged from 27.9 °C to 44 °C when the courtyard was not shaded and from 28.7 °C to 45 °C when it was shaded. Similarly, Figure 9 shows the same outputs of the Ladybug tools workflow. In this case, the UTCI values ranged from 28.3 °C to 34.5 °C when not shaded and from 25.9 °C to 34.1 °C when shaded. The effect of the shading device was more noticeable at noon in both workflows, when the shaded area of the courtyard provided an important reduction in the UTCI compared to the non-shaded courtyard. At 8:00 and 20:00 h, ENVI-met workflow showed lower UTCI values on the non-shaded day compared to the shaded day. In contrast, the Ladybug workflow showed higher values at these hours when not shaded. This contradiction is examined in the discussion section.
Comparing the mean values between the two workflows (Table 4), they show a UTCI value at noon that was 8.3 °C lower in the case of the Ladybug simulation than that of the ENVI-met simulation when not shaded and 10.6 °C lower when shaded. At 16:00 h, these differences were 9.5 °C without shading and 10.9 °C when shaded. These results show a difference large enough to emphasize the importance of having accurate data in order to calculate accurate UTCI values.
4. Discussion
4.1. Concerning the Differences in the UTCI Values between the Workflows
The UTCI results shown cannot be explained exclusively by the air temperature results of the simulations. The higher value at 16:00 h provided by the ENVI-met simulation when shaded compared to the value when not shaded is one example. Figure 10 shows the mean radiant temperature and relative humidity simulated by each workflow on the two days in the middle of the courtyard at 1.5 m. These are two of the other factors that were used in the UTCI calculation, the last one being the wind speed, shown in Table 5. The relative humidity and wind speed were similar between the two workflows on both days. The most important differences appeared in the mean radiant temperature results. At 16:00 h, despite the courtyard being shaded, the mean radiant temperature achieved a higher value than that on the non-shaded day using the ENVI-met workflow. This can explain the 1 °C higher UTCI on the shaded day provided by ENVI-met at 16:00 h.
However, what is most interesting about these graphs is the difference between the workflows concerning the mean radiant temperature results. The ENVI-met results provided much higher values during the daylight hours than the Ladybug Tools, while at night, the mean radiant temperature provided by ENVI-met was lower. The effect of direct solar radiation was also noticeable in the peak that appeared on the non-shaded day. While Ladybug Tools reached a mean radiant temperature of 56 °C at noon, ENVI-met reached 72 °C. This significant difference can explain the differences in the UTCI values, being larger than the air temperature difference between the workflows. At night, the Ladybug Tools results never dropped below 26 °C, while ENVI-met reached 19 °C. Such differences in the mean radiant temperature provided by the two workflows have previously been reported by other researchers. Naboni et al. [53] simulated the mean radiant temperature of outdoor spaces in a case study in the summer with ENVI-met and Ladybug Tools, and the ENVI-met results were always higher than those of Ladybug Tools. They explained these results given the tools’ different calculation assumptions and capabilities, which they explained in detail in [54]. Gal and Kantor [55] found that ENVI-met overestimated the mean radiant temperature in shaded areas and underestimated the nighttime temperatures. This suggests that, in our case study, the values provided by Ladybug Tools may be more accurate, given that they were higher during the night and lower during the day in the courtyard. Considering that the air temperature and relative humidity did not show important differences, and that air temperature and mean radiant temperature yielded by Ladybug Tools were closer to the monitored data, the UTCI index provided by Ladybug Tools was considered closer to reality in this case study.
4.2. Concerning the Shading Benefits
Although the results for the shading device were not as good as we expected based on the monitoring results, the UTCI distribution in the courtyard shown in Figure 8 and Figure 9 at noon indicates that when the sun is high and reaches deep into the courtyard, the effect of the shading device is substantial in the areas where the sun is blocked.
Despite the differences between the two workflows, the thermal benefit of the installation of a shading device in the case study courtyard was reproduced, although with different levels of success. The mean hourly thermal gap (this is the sum of the thermal gaps at different hours divided by the number of hours), shown in Table 6, increased on the shaded days for both workflows, although the monitoring results provided the highest mean thermal gap. This means that both workflows can reproduce the effects of shading benefits on the air temperature, but both underestimate the potential of the strategy. Still, Ladybug Tools was able to provide closer results to the monitoring data. The temperature differences provided by the workflows are in agreement with the limited simulated effects of shading described in [34,56], where only a 0.59 °C maximum difference was reproduced between the shaded and unshaded courtyard. In contrast, Mahmoud et al. achieved higher temperature differences using ENVI-met to simulate shading devices in a courtyard. However, the case study they analyzed had an aspect ratio much lower than the one used in our study, and geometry can impact the results.
In terms of thermal comfort, the overestimation of the mean radiant temperature provided by ENVI-met can alter the benefit of the shading, as seen in the UTCI results at 16:00 h. This should be further investigated before considering ENVI-met as a suitable tool for predicting the thermal performance of shaded courtyards.
4.3. Concerning the Usability of the Software
In practice, ENVI-met simulations required a longer time to provide accurate data than Ladybug Tools. In the early design of projects, this can be a disadvantage, given that rapid changes in projects require rapid analysis and data in order to make decisions. ENVI-met was not conceived for the purpose of early design. On the other hand, each simulation provides a great amount of data in regard to not only the environmental parameters but also the building and comfort parameters. The Ladybug Tools were conceived for early design. Their link to Rhinoceros, a software tool widely used by designers, is proof of that. This makes the tool’s use in the early design stage easier, and the results that it provides to help to inform this stage are delivered faster. In addition, the better accuracy found in this study leads us to recommend this workflow. However, it has one main issue, which is the lack of consideration of the evapotranspiration effects of vegetation and water, which could be necessary in some case studies.
4.4. Limitation and Future Research
The results obtained in this research are limited to one case study of an enclosed courtyard in the hot and dry Mediterranean climate. In addition, this study only considered two days, one with the shading device and the other without the shading device. Although days with similar outdoor temperatures were chosen, the small differences between the two days may have affected the results. However, this kind of uncertainty is unavoidable in outdoor experimental analysis, where no identical conditions can be achieved. Further research considering the uncertainties regarding the measuring instruments [57] used to validate the workflows will provide more data, enabling us to clearly state that the differences in the results are due to the simulation and not the differences in the boundary conditions.
Further studies should also analyze the structural uncertainty originating from the mean radiant temperature of the simulation, given that important differences were found and they affect the comfort results greatly. In addition, it was found that the accuracy of the simulation of shaded courtyards can be greatly improved. Further research should focus on methods that can be used to achieve a higher accuracy by optimizing these workflows or using other software.
5. Conclusions
This study evaluated the accuracy of the results and the suitability of two existing outdoor microclimate simulation tools for early design when analyzing the effects of a shading device installed in a courtyard in a hot and arid climate. The results showed that the Ladybug Tools simulation workflow provided more accurate results of the dry-bulb temperature, and considering the other thermal comfort parameters, the UTCI values provided were also more accurate. For this reason, the use of this software to improve the design of this kind of space is recommended. This workflow has more possibilities for improvement, given that is an open-source set of plugins that are continuously being optimized by the research community.
The simulations revealed that the effect of the shading device on the UTCI was higher during the morning hours when the sun reached deep into the courtyard. However, the UTCI values for the shading device did not show results as good as we expected based on the monitoring results. From the simulations, which showed important differences in the simulation of the mean radiant temperature, in addition to air temperature differences, it can be stated that further research on the accuracy of mean radiant temperature calculations must be carried out.
Future research should also try to improve the accuracy of the simulation results when the shading device is installed in order to better quantify the benefits of this strategy. It would also be interesting to investigate the use of the workflows to analyze other passive strategies, such as the installation of water or vegetation in the courtyard, as well as different geometries, locations, and orientations.
Author Contributions
Conception, design, and execution of experiments, V.P.L.-C. and E.D.-M.; methodology, C.A.R.-G. and C.G.-M.; formal analysis, V.P.L.-C., writing, V.P.L.-C.; reviewing and editing, E.D.-M.; C.A.R.-G., and C.G.-M.; visualization, V.P.L.-C. All authors have read and agreed to the published version of the manuscript.
Funding
This research was funded by the projects RTI2018-093521-B-C33 and PID2021-124539OB-I00, funded by MCIN/AEI/10.13039/501100011033 and by “FEDER Una forma de hacer Europa” and the Ministerio de Educación, Cultura y Deportes via a pre-doctoral contract granted to V.P. L-C. (FPU17/05036) and E. D-M (FPU18/04783).
Acknowledgments
The authors gratefully acknowledge the AEMET (State Meteorological Agency) for the data supplied.
Conflicts of Interest
The authors declare no conflict of interest. The funders had no role in the design of the study; in the collection, analyses, or interpretation of data; in the writing of the manuscript; or in the decision to publish the results.
References
- Natanian, J.; Kastner, P.; Dogan, T.; Auer, T. From energy performative to livable Mediterranean cities: An annual outdoor thermal comfort and energy balance cross-climatic typological study. Energy Build. 2020, 224, 110283. [Google Scholar] [CrossRef]
- Huang, T.; Li, J.; Xie, Y.; Niu, J.; Mak, C.M. Simultaneous environmental parameter monitoring and human subject survey regarding outdoor thermal comfort and its modelling. Build. Environ. 2017, 125, 502–514. [Google Scholar] [CrossRef]
- Garcia-Nevado, E.; Beckers, B.; Coch, H. Assessing the Cooling Effect of Urban Textile Shading Devices Through Time-Lapse Thermography. Sustain. Cities Soc. 2020, 63, 102458. [Google Scholar] [CrossRef]
- Taleghani, M.; Tenpierik, M.; van den Dobbelsteen, A. Environmental impact of courtyards—A review and comparison of residential courtyard buildings design in different climates. J. Green Build. 2012, 7, 113–136. [Google Scholar] [CrossRef]
- Guo, P.; Ding, C.; Guo, Z.; Liu, T.; Lyu, T. Coupling CFD Simulation and Field Experiments in Summer to Prove Feng Shui Optimizes Courtyard Wind Environments: A Case Study of Prince Kung’s Mansion in Beijing. Buildings 2022, 12, 629. [Google Scholar] [CrossRef]
- Lopez-Cabeza, V.P.; Agarwal, A. Sustainable strategies for improving passive survivability of the traditional Pol House in Ahmedabad, India. Build. Environ. 2022, 207, 108503. [Google Scholar] [CrossRef]
- Tabesh, T.; Sertyesilisik, B. An investigation into energy performance with the integrated usage of a courtyard and atrium. Buildings 2016, 6, 21. [Google Scholar] [CrossRef] [Green Version]
- Toe, D.H.C.; Kubota, T. Comparative assessment of vernacular passive cooling techniques for improving indoor thermal comfort of modern terraced houses in hot–humid climate of Malaysia. Sol. Energy 2015, 114, 229–258. [Google Scholar] [CrossRef]
- Muhaisen, A.S.; Gadi, B.M. Shading performance of polygonal courtyard forms. Build. Environ. 2006, 41, 1050–1059. [Google Scholar] [CrossRef]
- Akbari, H.; Cherati, S.M.; Monazam, N.H.; Noguchi, M. Effect of courtyards’ geometrical parameters on climate adaptability and shading performance in hot-arid climate of Yazd (Iran). Sustain. Energy Technol. Assess. 2021, 48, 101594. [Google Scholar] [CrossRef]
- Oktay, D. Design with the climate in housing environments: An analysis in Northern Cyprus. Build. Environ. 2002, 37, 1003–1012. [Google Scholar] [CrossRef]
- Muhaisen, A.S. Shading simulation of the courtyard form in different climatic regions. Build. Environ. 2006, 41, 1731–1741. [Google Scholar] [CrossRef]
- Lopez-Cabeza, V.P.; Alzate-Gaviria, S.; Diz-Mellado, E.; Rivera-Gomez, C.; Galan-Marin, C. Albedo influence on the microclimate and thermal comfort of courtyards under Mediterranean hot summer climate conditions. Sustain. Cities Soc. 2022, 81, 103872. [Google Scholar] [CrossRef]
- Lai, D.; Lian, Z.; Liu, W.; Guo, C.; Liu, W.; Liu, K.; Chen, Q. A comprehensive review of thermal comfort studies in urban open spaces. Sci. Total Environ. 2020, 742, 140092. [Google Scholar] [CrossRef] [PubMed]
- Zamani, Z.; Heidari, S.; Hanachi, P. Reviewing the thermal and microclimatic function of courtyards. Renew. Sustain. Energy Rev. 2018, 93, 580–595. [Google Scholar] [CrossRef]
- Sun, Y.; Heo, Y.; Tan, M.; Xie, H.; Jeff Wu, C.F.; Augenbroe, G. Uncertainty quantification of microclimate variables in building energy models. J. Build. Perform. Simul. 2014, 7, 17–32. [Google Scholar] [CrossRef]
- Chen, J.; Augenbroe, G.; Wang, Q.; Song, X. Uncertainty analysis of thermal comfort in a prototypical naturally ventilated office building and its implications compared to deterministic simulation. Energy Build. 2017, 146, 283–294. [Google Scholar] [CrossRef]
- Höppe, P. The physiological equivalent temperature—A universal index for the biometeorological assessment of the thermal environment. Int. J. Biometeorol. 1999, 43, 71–75. [Google Scholar] [CrossRef]
- ASHRAE. American Society of Heating, Refrigerating and Air-Conditioning Engineers. ASHRAE-55 - Thermal Environmental Conditions for Human Occupancy; ASHRAE: Atlanta, GA, USA, 2017. [Google Scholar]
- Fanger, P.O. Thermal Comfort. Analysis and Applications in Environmental Engineering; Danish Technical Press: Copenhagen, Denmark, 1970. [Google Scholar]
- Jendritzky, G.; Havenith, G.; Weihs, P.; Batchvarova, E.; DeDear, R. The Universal Thermal Climate Index UTCI Goal and State of COST Action 730. In Proceedings of the International Scientific Conference, Poľana nad Detvou, Detva, Slovakia, 17–20 September 2007; ISBN 978-80-228-17-60-8. [Google Scholar]
- Kumar, P.; Sharma, A. Study on importance, procedure, and scope of outdoor thermal comfort—A review. Sustain. Cities Soc. 2020, 61, 102297. [Google Scholar] [CrossRef]
- Potchter, O.; Cohen, P.; Lin, T.P.; Matzarakis, A. Outdoor human thermal perception in various climates: A comprehensive review of approaches, methods and quantification. Sci. Total Environ. 2018, 631–632, 390–406. [Google Scholar] [CrossRef]
- Wei, D.; Lian, Z.; Liu, B. A Field Study of Outdoor Human Thermal Perception in Three Seasons in Shanghai, China. Buildings 2022, 12, 1453. [Google Scholar] [CrossRef]
- Jendritzky, G.; de Dear, R.; Havenith, G. UTCI-Why another thermal index? Int. J. Biometeorol. 2012, 56, 421–428. [Google Scholar] [CrossRef] [PubMed] [Green Version]
- Peng, Z.; Debnath, R.; Bardhan, R.; Steemers, K. Machine learning-based evaluation of dynamic thermal-tempering performance and thermal diversity for 107 Cambridge courtyards. Sustain. Cities Soc. 2023, 88, 104275. [Google Scholar] [CrossRef]
- Alkhoudiri, A.; Navarro, I.; Fort, J.M.; Alumran, S. Parametric comparative analysis of outdoor thermal comfort in a desert climate: A case study of single-family houses in Riyadh. Urban Clim. 2022, 46, 101300. [Google Scholar] [CrossRef]
- Ibrahim, Y.; Kershaw, T.; Shepherd, P.; Elkady, H. Multi-objective optimisation of urban courtyard blocks in hot arid zones. Sol. Energy 2022, 240, 104–120. [Google Scholar] [CrossRef]
- Liu, Y.; Yang, L.; Hou, L.; Li, S.; Yang, J.; Wang, Q. A porous building approach for modelling flow and heat transfer around and inside an isolated building on night ventilation and thermal mass. Energy 2017, 141, 1914–1927. [Google Scholar] [CrossRef]
- Cantón, M.A.; Ganem, C.; Barea, G.; Llano, J.F. Courtyards as a passive strategy in semi dry areas. Assessment of summer energy and thermal conditions in a refurbished school building. Renew. Energy 2014, 69, 437–446. [Google Scholar] [CrossRef]
- Galán-Marín, C.; López-Cabeza, V.P.; Rivera-Gómez, C.; Rojas-Fernández, J.M. On the Influence of Shade in Improving Thermal Comfort in Courtyards. Proceedings 2018, 2, 1390. [Google Scholar] [CrossRef] [Green Version]
- Shashua-Bar, L.; Pearlmutter, D.; Erell, E. The cooling efficiency of urban landscape strategies in a hot dry climate. Landsc. Urban Plan. 2009, 92, 179–186. [Google Scholar] [CrossRef]
- Berkovic, S.; Yezioro, A.; Bitan, A. Study of thermal comfort in courtyards in a hot arid climate. Sol. Energy 2012, 86, 1173–1186. [Google Scholar] [CrossRef]
- Elgheznawy, D.; Eltarabily, S. The impact of sun sail-shading strategy on the thermal comfort in school courtyards. Build. Environ. 2021, 202, 108046. [Google Scholar] [CrossRef]
- Mahmoud, R.M.A.; Abdallah, A.S.H. Assessment of outdoor shading strategies to improve outdoor thermal comfort in school courtyards in hot and arid climates. Sustain. Cities Soc. 2022, 86, 104147. [Google Scholar] [CrossRef]
- López-Cabeza, V.P.; Galán-Marín, C.; Rivera-Gómez, C.; Roa-Fernández, J. Courtyard microclimate ENVI-met outputs deviation from the experimental data. Build. Environ. 2018, 144, 129–141. [Google Scholar] [CrossRef]
- Complete Guide—ENVI-met. Available online: https://www.envi-met.com/learning-support/unfolded-the-complete-guide/ (accessed on 21 July 2021).
- Tsoka, S.; Tsikaloudaki, A.; Theodosiou, T. Analyzing the ENVI-met microclimate model’s performance and assessing cool materials and urban vegetation applications—A review. Sustain. Cities Soc. 2018, 43, 55–76. [Google Scholar] [CrossRef]
- Mauree, D.; Naboni, E.; Coccolo, S.; Perera, A.T.D.; Nik, V.M.; Scartezzini, J.-L. A review of assessment methods for the urban environment and its energy sustainability to guarantee climate adaptation of future cities. Renew. Sustain. Energy Rev. 2019, 112, 733–746. [Google Scholar] [CrossRef]
- López-Cabeza, V.P.; Diz-Mellado, E.; Rivera-Gómez, C.; Galán-Marín, C.; Samuelson, H.W. Thermal comfort modelling and empirical validation of predicted air temperature in hot-summer Mediterranean courtyards. J. Build. Perform. Simul. 2022, 15, 39–61. [Google Scholar] [CrossRef]
- Kottek, M.; Grieser, J.; Beck, C.; Rudolf, B.; Rubel, F. World map of the Köppen-Geiger climate classification updated. Meteorol. Zeitschrift 2006, 15, 259–263. [Google Scholar] [CrossRef]
- Agencia Estatal de Meteorología—AEMET—Spanish Government. El verano de 2017, muy cálido y húmedo. Available online: https://aemetblog.es/2017/09/20/el-verano-de-2017-muy-calido-y-humedo/ (accessed on 18 October 2022).
- Rojas-Fernández, J.; Galán-Marín, C.; Roa-Fernández, J.; Rivera-Gómez, C. Correlations between GIS-based urban building densification analysis and climate guidelines for Mediterranean courtyards. Sustain. 2017, 9, 2255. [Google Scholar] [CrossRef] [Green Version]
- Lee, H.; Oertel, A.; Mayer, H. Enhanced human heat exposure in summer in a Central European courtyard subsequently roofed with transparent ETFE foil cushions. Urban Clim. 2022, 44, 101210. [Google Scholar] [CrossRef]
- Forouzandeh, A. Numerical modeling validation for the microclimate thermal condition of semi-closed courtyard spaces between buildings. Sustain. Cities Soc. 2018, 36, 327–345. [Google Scholar] [CrossRef]
- Sadeghipour Roudsari, M.; Pak, M.; Smith, A. Ladybug: A Parametric Environmental Plugin for Grasshopper to Help Designers Create an Environmentally-Conscious Design. In Proceedings of the 13th Conference of International building Performance Simulation Association, Chambéry, France, 26–28 August 2013; pp. 3129–3135. Available online: http://www.ibpsa.org/proceedings/bs2013/p_2499.pdf (accessed on 18 October 2022).
- Mackey, C.; Galanos, T.; Norford, L.; Roudsari, M.S. Wind, Sun, Surface Temperature, and Heat Island : Critical Variables for High-Resolution Outdoor Thermal Comfort. In Proceedings of the 15th IBPSA Conference, San Francisco, CA, USA, 7–9 August 2017; pp. 985–993. [Google Scholar]
- Elwy, I.; Ibrahim, Y.; Fahmy, M.; Mahdy, M. Outdoor microclimatic validation for hybrid simulation workflow in hot arid climates against ENVI-met and field measurements. Energy Procedia 2018, 153, 29–34. [Google Scholar] [CrossRef]
- Franke, J.; Hirsch, C.; Jensen, G.; Krüs, H.; Miles, S.; Schatzmann, M.; Westbury, P.; Wisse, J.; Wright, N. Recommendations on the use of CFD in wind engineering. In Proceedings of the International Conference on Urban Wind Engineering and Building Aerodynamics, Sint-Genesius-Rode, Belgium, 5–7 May 2004. [Google Scholar]
- Willmott, C.J. Some Comments on the Evaluation of Model Performance. Bull. Am. Meteorol. Soc. 1982, 63, 1309–1313. [Google Scholar] [CrossRef]
- Outdoor Comfort Calculator—Ladybug—Component for Grasshopper|Grasshopper Docs. Available online: https://grasshopperdocs.com/components/ladybug/outdoorComfortCalculator.html (accessed on 3 June 2020).
- UTCI–Universal Thermal Climate Index. Available online: http://www.utci.org/ (accessed on 3 June 2020).
- Naboni, E.; Meloni, M.; Coccolo, S.; Kaempf, J.; Scartezzini, J.L. An overview of simulation tools for predicting the mean radiant temperature in an outdoor space. Energy Procedia 2017, 122, 1111–1116. [Google Scholar] [CrossRef]
- Naboni, E.; Meloni, M.; Mackey, C.; Kaempf, J. The Simulation of Mean Radiant Temperature in Outdoor Conditions: A review of Software Tools Capabilities. In Proceedings of the Building Simulation Conference Proceedings, Rome, Italy, 2–4 September 2019. [Google Scholar] [CrossRef]
- Gál, C.V.; Kántor, N. Modeling mean radiant temperature in outdoor spaces, A comparative numerical simulation and validation study. Urban Clim. 2020, 32, 100571. [Google Scholar] [CrossRef]
- Abdallah, A.S.H.; Hussein, S.W.; Nayel, M. The impact of outdoor shading strategies on student thermal comfort in open spaces between education building. Sustain. Cities Soc. 2020, 58, 102124. [Google Scholar] [CrossRef]
- Broday, E.E.; Ruivo, C.R.; Gameiro da Silva, M. The use of Monte Carlo method to assess the uncertainty of thermal comfort indices PMV and PPD: Benefits of using a measuring set with an operative temperature probe. J. Build. Eng. 2021, 35, 101961. [Google Scholar] [CrossRef]
Figure 1.
Image of the analyzed courtyard with the shading device displayed.

Figure 2.
Flowchart showing how different inputs and outputs relate to the simulation tools and validation. Db T = dry bulb temperature. RH = relative humidity.
Figure 2.
Flowchart showing how different inputs and outputs relate to the simulation tools and validation. Db T = dry bulb temperature. RH = relative humidity.

Figure 3.
Monitored outdoor and courtyard air temperature on the selected days.

Figure 4.
Monitored outdoor relative humidity and wind speed on the selected days.

Figure 5.
ENVI-met-simulated outdoor and courtyard air temperatures on the selected days.

Figure 6.
Ladybug-simulated outdoor and courtyard air temperatures on the selected days.

Figure 7.
Simulated and monitored thermal delta (TD) at different hours for the different configurations analyzed.
Figure 7.
Simulated and monitored thermal delta (TD) at different hours for the different configurations analyzed.

Figure 8.
UTCI values at a 1.5 m height in the courtyard at different hours based on the ENVI-met simulation workflow. Left: without shading. Right: shaded.
Figure 8.
UTCI values at a 1.5 m height in the courtyard at different hours based on the ENVI-met simulation workflow. Left: without shading. Right: shaded.

Figure 9.
UTCI values at a 1.5 m height in the courtyard at different hours based on the Ladybug simulation workflow. Left: without shading. Right: shaded.
Figure 9.
UTCI values at a 1.5 m height in the courtyard at different hours based on the Ladybug simulation workflow. Left: without shading. Right: shaded.

Figure 10.
Mean radiant temperature and relative humidity results of each workflow in the middle of the courtyard at 1.5 m above the ground on the two simulated days.
Figure 10.
Mean radiant temperature and relative humidity results of each workflow in the middle of the courtyard at 1.5 m above the ground on the two simulated days.


Table 1.
Technical data of the measurement instruments.
| Situation | Sensor | Variable | Accuracy | Range | Resolution |
|---|---|---|---|---|---|
| Courtyard | TESTO 174H | Dry bulb Temp. | ±0.5 °C | −20 to +70 °C | 0.1 °C |
| RH | ±0.1% | 0–100% | 2% | ||
| Outdoor | PCE-FWS 20 | Dry bulb Temp. | ±1 °C | −40 to +65°C | 0.1°C |
| RH | ±5% | 12–99% | 1% | ||
| Wind | ±1 m/s | 0–180 km/h | - |
Table 2.
Input variables for the ENVI-met simulation.
| Variable | Input |
|---|---|
| Model geometry | 121 × 112 × 30 (0.5 m cell size) |
| Air temperature/relative humidity Wind speed and direction at 10 m Specific humidity at 2500 m Roughness length | Monitored data. (Figure 3) 0.83 m/s-135° 4.5 g/kg 0.1 m |
| Walls/roof materials | Mortar/tiled |
| Initial conditions for soils Materials: concrete and soil. | Upper layer: 293K Middle layer: 289K Deep layer: 285K |
| Simulation starting day (DD.MM.YYYY) Simulation starting time (HH:MM:SS) Total simulation time (hours) Save model state (min) | 2017/08/03 (shaded)/2017/08/18 (not shaded) 00:00:00 48 h 30 min |
Table 3.
Quantitative evaluation of the simulation’s performance for the courtyard temperature output.
Table 3.
Quantitative evaluation of the simulation’s performance for the courtyard temperature output.
| No Shaded | Shaded | |||
|---|---|---|---|---|
| R2 | RMSE (°C) | R2 | RMSE (°C) | |
| ENVI-met simulation | 0.93 | 3.31 | 0.95 | 8.31 |
| Ladybug Tools simulation | 0.73 | 1.90 | 0.64 | 4.26 |
Table 4.
Simulated mean UTCI values at 1.5 m in the courtyard at different hours of the day.
| ENVI-Met Simulation | Ladybug Tools Simulation | |||
|---|---|---|---|---|
| Time (h) | Not Shaded | Shaded | Not shaded | Shaded |
| 8:00 | 27.9 | 28.7 | 28.3 | 25.9 |
| 12:00 | 40.9 | 40.6 | 32.6 | 30.0 |
| 16:00 | 44.0 | 45.0 | 34.5 | 34.1 |
| 20:00 | 35.7 | 37.5 | 34.2 | 34.1 |
Table 5.
Wind speed (m/s) results of each workflow in the middle of the courtyard at 1.5 m above the ground on the two simulated days.
Table 5.
Wind speed (m/s) results of each workflow in the middle of the courtyard at 1.5 m above the ground on the two simulated days.
| 8:00 h | 12:00 h | 16:00 h | 20:00 h | |
|---|---|---|---|---|
| ENVI-met (19 August) | 0.06 | 0.05 | 0.05 | 0.04 |
| Ladybug Tools (19 August) | 0.3 | 0.03 | 0.01 | 0.01 |
| ENVI-met (4 August) | 0.07 | 0.05 | 0.05 | 0.05 |
| Ladybug Tools (4 August) | 0.25 | 0.03 | 0.03 | 0.01 |
Table 6.
Mean thermal gap per hour for the monitoring and simulation results.
| Monitoring | ENVI-Met | Ladybug Tools | |
|---|---|---|---|
| 19 August (non-shaded) | 2.7 | 0.2 | 2.0 |
| 4 August (shaded) | 7.1 | 0.4 | 3.9 |
Publisher’s Note: MDPI stays neutral with regard to jurisdictional claims in published maps and institutional affiliations. |
© 2022 by the authors. Licensee MDPI, Basel, Switzerland. This article is an open access article distributed under the terms and conditions of the Creative Commons Attribution (CC BY) license (https://creativecommons.org/licenses/by/4.0/).
Share and Cite
MDPI and ACS Style
López-Cabeza, V.P.; Diz-Mellado, E.; Rivera-Gómez, C.A.; Galán-Marín, C. Shade and Thermal Comfort in Courtyards: Experimental versus Simulation Results. Buildings 2022, 12, 1961. https://doi.org/10.3390/buildings12111961
AMA Style
López-Cabeza VP, Diz-Mellado E, Rivera-Gómez CA, Galán-Marín C. Shade and Thermal Comfort in Courtyards: Experimental versus Simulation Results. Buildings. 2022; 12(11):1961. https://doi.org/10.3390/buildings12111961
Chicago/Turabian StyleLópez-Cabeza, Victoria Patricia, Eduardo Diz-Mellado, Carlos Alberto Rivera-Gómez, and Carmen Galán-Marín. 2022. "Shade and Thermal Comfort in Courtyards: Experimental versus Simulation Results" Buildings 12, no. 11: 1961. https://doi.org/10.3390/buildings12111961
Note that from the first issue of 2016, this journal uses article numbers instead of page numbers. See further details here.