Article

A Comprehensive Study on the Effect of Regular and Staggered Openings on the Seismic Performance of Shear Walls

1
Department of Civil Engineering, Southeast University, Nanjing 211189, China
2
Department of Civil Engineering, Zakir Husain Engineering College, Aligarh Muslim University, Aligarh 202002, India
3
Department of Civil Engineering, College of Engineering, University of Duhok, Duhok 42001, Kurdistan Region, Iraq
4
Peter the Great St. Petersburg Polytechnic University, 195251 St. Petersburg, Russia
5
Faculty of Science and Engineering, School of Civil and Mechanical Engineering, Curtin University, Bentley, WA 6102, Australia
*
Authors to whom correspondence should be addressed.
Buildings 2022, 12(9), 1293; https://doi.org/10.3390/buildings12091293
Submission received: 20 July 2022 / Revised: 15 August 2022 / Accepted: 17 August 2022 / Published: 23 August 2022
(This article belongs to the Special Issue Advanced Sustainable Materials in Buildings)

Abstract

:
Shear walls have high strength and stiffness, which could be used at the same time to resist large horizontal loads and weight loads, making them pretty beneficial in several structural engineering applications. The shear walls could be included with openings, such as doors and windows, for relevant functional requirements. In the current study, a building of G + 13 stories with RC shear walls with and without openings has been investigated using ETABS Software. The seismic analysis is carried out for the determination of parameters like shear forces, drift, base shear, and story displacement for numerous models. The regular and staggered openings of the shear wall have been considered variables in the models. The dynamic analysis is carried out with the help of ETABS software. It has been observed that shear walls without openings models perform better than other models, and this is in agreement with the previous studies published in this area. This investigation also shows that the seismic behaviour of the shear wall with regular openings provides a close result to the shear wall with staggered openings. At the roof, the displacement of the model with regular openings was 38.99 mm and approximately 39.163 mm for the model with staggered openings. However, the model without a shear wall experienced a displacement of about 56 mm at the roof. Generally, it can be concluded that the openings have a substantial effect on the seismic behaviour of the shear wall, and that should be taken into consideration during the construction design. However, the type of opening (regular or staggered) has a slight effect on the behaviour of shear walls.

1. Introduction

Reinforced concrete (RC) buildings considerably resist horizontal and vertical loading. Wind and seismic loads are the most common loads that shear walls are designed to carry [1]. The shear walls are the best and simplest method to sustain these lateral forces as they provide the required strength against seismic forces [2,3,4]. Shear walls are the components in the external form of a box that provide lateral support to the building. The shear wall provides strength and stiffness to the building in the lateral direction [5,6,7,8]. Since shear walls carry massive lateral forces, the overturn effects on them are significantly important and must be considered in the structural design. Shear walls in buildings are preferred to be symmetrical in order to mitigate the negative effects of twists [9,10,11]. They might be placed symmetrically along with one or both directions in the plan. Shear walls are more effective when provided on the exterior perimeter of the building; therefore, this layout will increase the resistance of the structure against twisting [12]. The shear walls behaviour depends upon the material used, wall length, wall thickness, wall position, and building frame. RC shear walls are used in the design of multi-story buildings located in seismically vulnerable areas because of their rigidity, bearing capacity, and high ductility [13,14,15]. Obviously, an opening in a shear wall positioned along with in-plane loading is more critical than an opening in a shear wall located along without-of-plane loading because there is a considerable change in displacement noticed after having an opening in a shear wall positioned along with in-plane loading [16].
Shear walls are considered an essential element in the construction of buildings because of their capacity to resist lateral loads such as earthquakes and wind loads. Therefore, research studies have been carried out to understand the structural behaviour of shear walls under different load cases and conditions. Zhang and Wang [17] investigated the seismic performance of prefabricated reinforced masonry shear walls with vertical joint connections, while Dang-Vu et al. [18] studied the seismic fragility assessment of columns in a piloti-type building retrofitted with additional shear walls. Coccia et al. [19] reported the behaviour of masonry walls retrofitted with vertical FRP rebars, and their study showed that the conventional seismic retrofitting techniques on masonry walls influence the seismic performance of the element, which is typically modified in an out-of-plane bending behaviour. Further, the study of Jeon et al. [20] investigated the seismic fragility of ordinary reinforced concrete shear walls with coupling beams, and their study showed that high-rise ordinary reinforced concrete shear walls designed using seven pairs of ground motion components and a shear force amplification factor ≥ 1.2 were adequate to satisfy the criteria on collapse probability and the collapse margin ratio prescribed in FEMA P695.
Reinforced concrete structures with L-shaped walls provide numerous benefits for architects that permit them to design architectures with larger open areas and a lot of versatility [21,22,23]. However, a lot of experimental tests and numerical models should be done for L-shaped shear walls to ensure compliance with the safety provisions obligatory by the various code standards. What is more, given the necessities of deformability and resistance, L-shaped concrete shear walls are used in multi-story buildings because they possess a high capability of resisting lateral loads and may expend an excellent amount of seismic energy if they are properly designed [24,25,26,27]. Openings in shear walls may be required because of municipality or remodeling considerations, similar to elevators, windows, doors, and the placement of staircases [28]. Providing openings in the shear walls decreases the total structural capacity and integrity of the wall, in addition to stress condensation around the openings [27].
The main aim of this study is as follows: to understand the behaviour of staggered and regular openings and to analyze the effectiveness of staggered openings to seismic load when different loads are used.

2. Model Description

A 14-story RC structure with shear wall elements and the 14 stories were selected in the model to minimize the analysis time in the software, and the behaviour of shear walls with the openings was the aim of this study and not the effect of the building’s length, shape “L” of RC shear wall without opening, with a vertical and staggered opening in Seismic Zone V, has been considered in this study. Table 1, Table 2 and Table 3 illustrate the model data, applied loads on the structure, and seismic input data. The plan and geometry of the models are shown in Figure 1, Figure 2, Figure 3 and Figure 4. Compared to the area of the wall in that story, the shear wall has a 5% opening.
Response spectrum function and time history function (El Centro 1940) have been used in this study for seismic analysis. A response spectrum is a plot of the maximum response amplitude (displacement, velocity or acceleration) versus time period of many linear single degree of freedom oscillators to a give component of ground motion as shown in Figure 5. The resulting plot can be used to choose the response of any linear SDOF oscillator, given its natural time period of oscillation. One such use is in evaluating the peak response of structures to ground motions. The first data listed from an earthquake record are usually the peak ground acceleration (PGA), which expresses the tip of the maximum spike of the acceleration ground motion.
ETABS Software handles the initial conditions of a time function differently for linear and nonlinear time-history load cases. Linear cases always start from zero, thus the corresponding time function must also start from zero and nonlinear cases may either start from zero or may continue from a previous case. When starting from zero, the time function is simply defined to start with a zero value. When analysis continues from a previous case, it is supposed that the time function also continues relative to its starting value. A long record may be broken into multiple sequential analyses which use a single function with arrival times. This prevents the need to create multiple modified functions. The time history function used in this study is shown in Figure 6.
This study was conducted on a regular plan structure with shear walls containing vertical and staggered openings. The buildings are modelled with a floor area of 690 m2 (30 m × 23 m) with 7 bays along a 30 m span and 5 bays along a 23 m span.

3. Modeling and Analysis

Four models have been considered in this study. The first model contains a building without shear walls (Figure 1); the second model characterizes a building with shear walls without openings (Figure 2); the third model includes shear walls with vertical openings (Figure 3). However, the fourth model includes shear walls with staggered openings (Figure 4).

4. Results & Discussion

4.1. Story Displacement

Table 4 and Table 5 and Figure 7 and Figure 8 demonstrate the maximum displacement in the case of equivalent static analysis (ESA) (EX&EY). On the top floor, the results show that the building without shear walls produced about 53.089 mm when compared to the building with shear walls produced 37.212 mm, i.e., a 30% reduction in the X-direction. It is observed that the story displacement of the vertical opening at the roof is approximately 38.032 mm and 38.173 mm for staggered openings, respectively.
Similarly, in the Y-direction, on the top floor, the results show that the building without shear walls produced 56 mm, while the building with shear walls produced 38.125 mm, a 32% difference. The displacement story of the vertical opening at the roof was also discovered to be 38.99 mm for staggered openings and 39.136 mm for unstaggered openings. The story displacement in the case of response spectrum analysis (RSA) is shown in Table 6 and Table 7 and Figure 9 and Figure 10. Results show that the building without shear walls produced about 42.006 mm while the building with shear walls produced 28.938 mm, i.e., a 31% decline in the X-direction and a 33% decline in the Y-direction. The displacement story of the vertical opening at the roof is 29.283 mm for staggered openings in the X-direction and 29.434 mm for vertical and staggered openings in the Y-direction, respectively. Table 8 and Table 9 and Figure 11 and Figure 12 demonstrate the story displacement in the case of time history analysis (THA). The results appear to show that the building without shear walls produced 45.727 mm, while the building with shear walls produced about 34.72 mm, i.e., a 24% reduction. In the X-direction, the displacement story of the vertical opening at the roof is 28.74 mm for staggered openings and 28.7 mm for unstaggered openings, 32.809 mm and 32.34 mm for vertical and staggered openings in the Y-direction, respectively.
The results show that buildings without shear walls have higher story displacement in comparison with other models. The shear wall with staggered openings experiences a higher displacement than vertical openings and shear walls without openings. A shear wall without openings reveals improved performance compared to shear walls with vertical and staggered openings. The same findings have been found in the published literature by Marius [29]. Overall, it can be concluded that the presences of shear walls in the buildings significantly improve the seismic response of the buildings regardless of the openings in that shear wall.

4.2. Story Drift

Table 10 and Table 11 and Figure 13 and Figure 14 demonstrate the story drifts carried out by using ESA (EX&EY). The results show that the maximum drift that could be found on the fourth floor due to the buildings lack of shear walls is 4.895 mm in X-direction and 5.121 mm in Y-direction. It is also observed that the maximum drift story of the building with shear walls seen on the eighth floor is 3.274 mm, 3.323 mm, and 3.344 mm for the building’s vertical and staggered openings in the X-direction, and 3.358 mm for shear walls without openings and 3.405 mm and 3.425 mm as results of shear walls with a vertical and staggered opening in the Y-direction.
Table 12 and Table 13 and Figure 15 and Figure 16 demonstrate the story drifts in the case of response spectrum analysis (RSA) in the (X&Y) direction. The results show that the maximum drift seen on the third floor due to the building without shear walls is 4.476 mm in X-direction and 4.6 mm in Y-direction. It is consequently observed that the maximum drift story of the building with shear walls seen on the eighth floor is 2.544 mm, 2.566 mm, and 2.585 mm for the building’s vertical and staggered opening, respectively, in X-direction. However, shear walls without openings have a 2.573 mm thickness, while shear walls with vertical and staggered openings in the Y-direction have 2.614 mm and 2.63 mm thicknesses, respectively.
Table 14 and Table 15 and Figure 17 and Figure 18 determine the story drifts in the case of time history analysis (THA) in the (X&Y) direction. The results show that the maximum drift found on the third floor is due to the building’s lack of shear walls, 5.689 mm in X-direction and 5.379 mm in Y-direction. Likewise, it was observed that the maximum drift story of the building with shear walls seen on the eighth floor was 3.075 mm, 2.397 mm, and 2.381 mm for the building’s vertical and staggered opening in X-direction, respectively; 2.919 mm for shear walls with no openings, and 2.783 mm and 2.741 mm for shear walls with vertical and staggered Y-direction openings.
The results show that the story drift increases from the second story and onwards. It gradually grew and has a tendency to fall back to the top story. The model with a vertical opening and staggered opening shear wall indicates more drift value compared to the shear wall without an opening. The building without shear walls shows a high drift value. The same findings have been found in the published literature by Marius [29].

4.3. Story Forces

In the case of the response spectrum, the values of story forces on the first floor are 3558.8 kN for modal without shear walls, 6295.9 kN for building with shear walls, and 5906.5 kN, 5871.6 kN for vertical opening, and staggered opening, respectively (as shown in Figure 19 and Figure 20). As can be seen, the reduction percentage of story force value on the first floor is about 16.3% in buildings without shear walls when compared to buildings with shear walls. Figure 21 and Figure 22 demonstrate the story forces in the case of time history analysis; the story forces on the first floor due to building without shear walls are 4491.0 kN when compared to building with shear walls, 7087.7 kN, and 5381.2 kN, 5333.9 kN for shear walls staggered and vertical openings in the case of time history, respectively. Additionally, it is noticed that the difference in story forces in the time history analysis (THA) as compared to the response spectrum analysis (RSA) results are insignificant for the same cases. Overall, it can be said that the displacement and story drift of the building significantly affected by the height of the structural element, story or building. Therefore, the shear walls openings have a slight effect on these mechanical properties as compared to the story forces. However, the distribution of the lateral forces (story forces) on the building are significantly influenced by the weight of the building. Consequently, the openings on the shear wall reduced the weight and stiffness of the building and then increased the lateral forces. Moreover, compared to other methods of analysis, time history analysis shows that the story forces are higher for all models. That might be attributed to the higher lateral forces applied on the building which generated by earthquake (El Centro).
The findings of this study agree with the results of the study by Mosoarca [12].

4.4. Time Period

As shown in Figure 23 the time period of the structure increases with an increase in mass. The time period decreases when the shear wall is provided and is a minimum for shear walls on the outer edges of the structure. A building with shear walls indicates that the time period reduces compared to a building without shear walls. Besides, a building with shear walls with a vertical opening, as in Figure 23, shows that the time period declines compared to a staggered opening.
Finally, more or less similar behaviour of using finite element modelling in solving structures and materials problems has been conducted by several researchers, which provided by literature reports [30,31,32,33,34,35,36,37].

5. Conclusions

From the analytical study on the effect of openings on the seismic behaviour of shear walls, the following conclusions could be drawn:
  • Based on the ESA method of the models, it can be seen that the model with a shear wall showed improved performance in terms of displacement reduction. Additionally, a building with a shear wall without an opening shows better performance based on displacement reduction.
  • According to the response spectrum analysis, it is observed that the percentage reduction of story force value on the first floor is about 43% in buildings without shear walls when compared to buildings with shear walls and about 28% in buildings with shear walls when compared to shear walls with opening, equally for time history analysis.
  • From time-history analysis, it is concluded that the building with a shear wall showed good quality performance in terms of displacement reduction. Similarly, a building with a shear wall without an opening shows superior performance based on displacement reduction.
  • The results show that using shear walls cuts down on story drift and movement in the X and Y directions by a lot.
  • The maximum story drift in most of the cases produced is found on the seventh floor.
  • In all three analyses (equivalent static analysis, response spectrum, and time history analysis), the results concluded that shear walls without openings show less displacement as compared to the other models.
  • Similarly, it has been found that shear walls without openings show less drift as compared to other models. Thus, in turn, it emphasizes the vital impact of using these models.
  • Compared to other methods of analysis, time history analysis shows that the seismic story forces are higher for all models.

Author Contributions

Conceptualization, A.S., A.H., H.M.N., S.Q., M.M.S.S., and N.S.M.; methodology, A.S, A.H., H.M.N., M.M.S.S., and N.S.M.; software, A.S. and A.H.; validation, H.M.N., S.Q., M.M.S.S., N.S.M.; formal analysis, A.S. and A.H.; investigation, A.S., A.H., H.M.N., S.Q. M.M.S.S., and N.S.M.; resources, A.S., A.H., H.M.N., M.M.S.S., and N.S.M.; data curation, A.S., A.H., H.M.N., M.M.S.S., S.Q., and N.S.M.; writing—original draft preparation, A.S.; writing—review and editing, A.S., A.H., H.M.N., M.M.S.S., and N.S.M.; visualization, A.S. and A.H.; supervision, A.S., A.H., and H.M.N.; project administration, M.M.S.S.; funding acquisition, M.M.S.S. All authors have read and agreed to the published version of the manuscript.
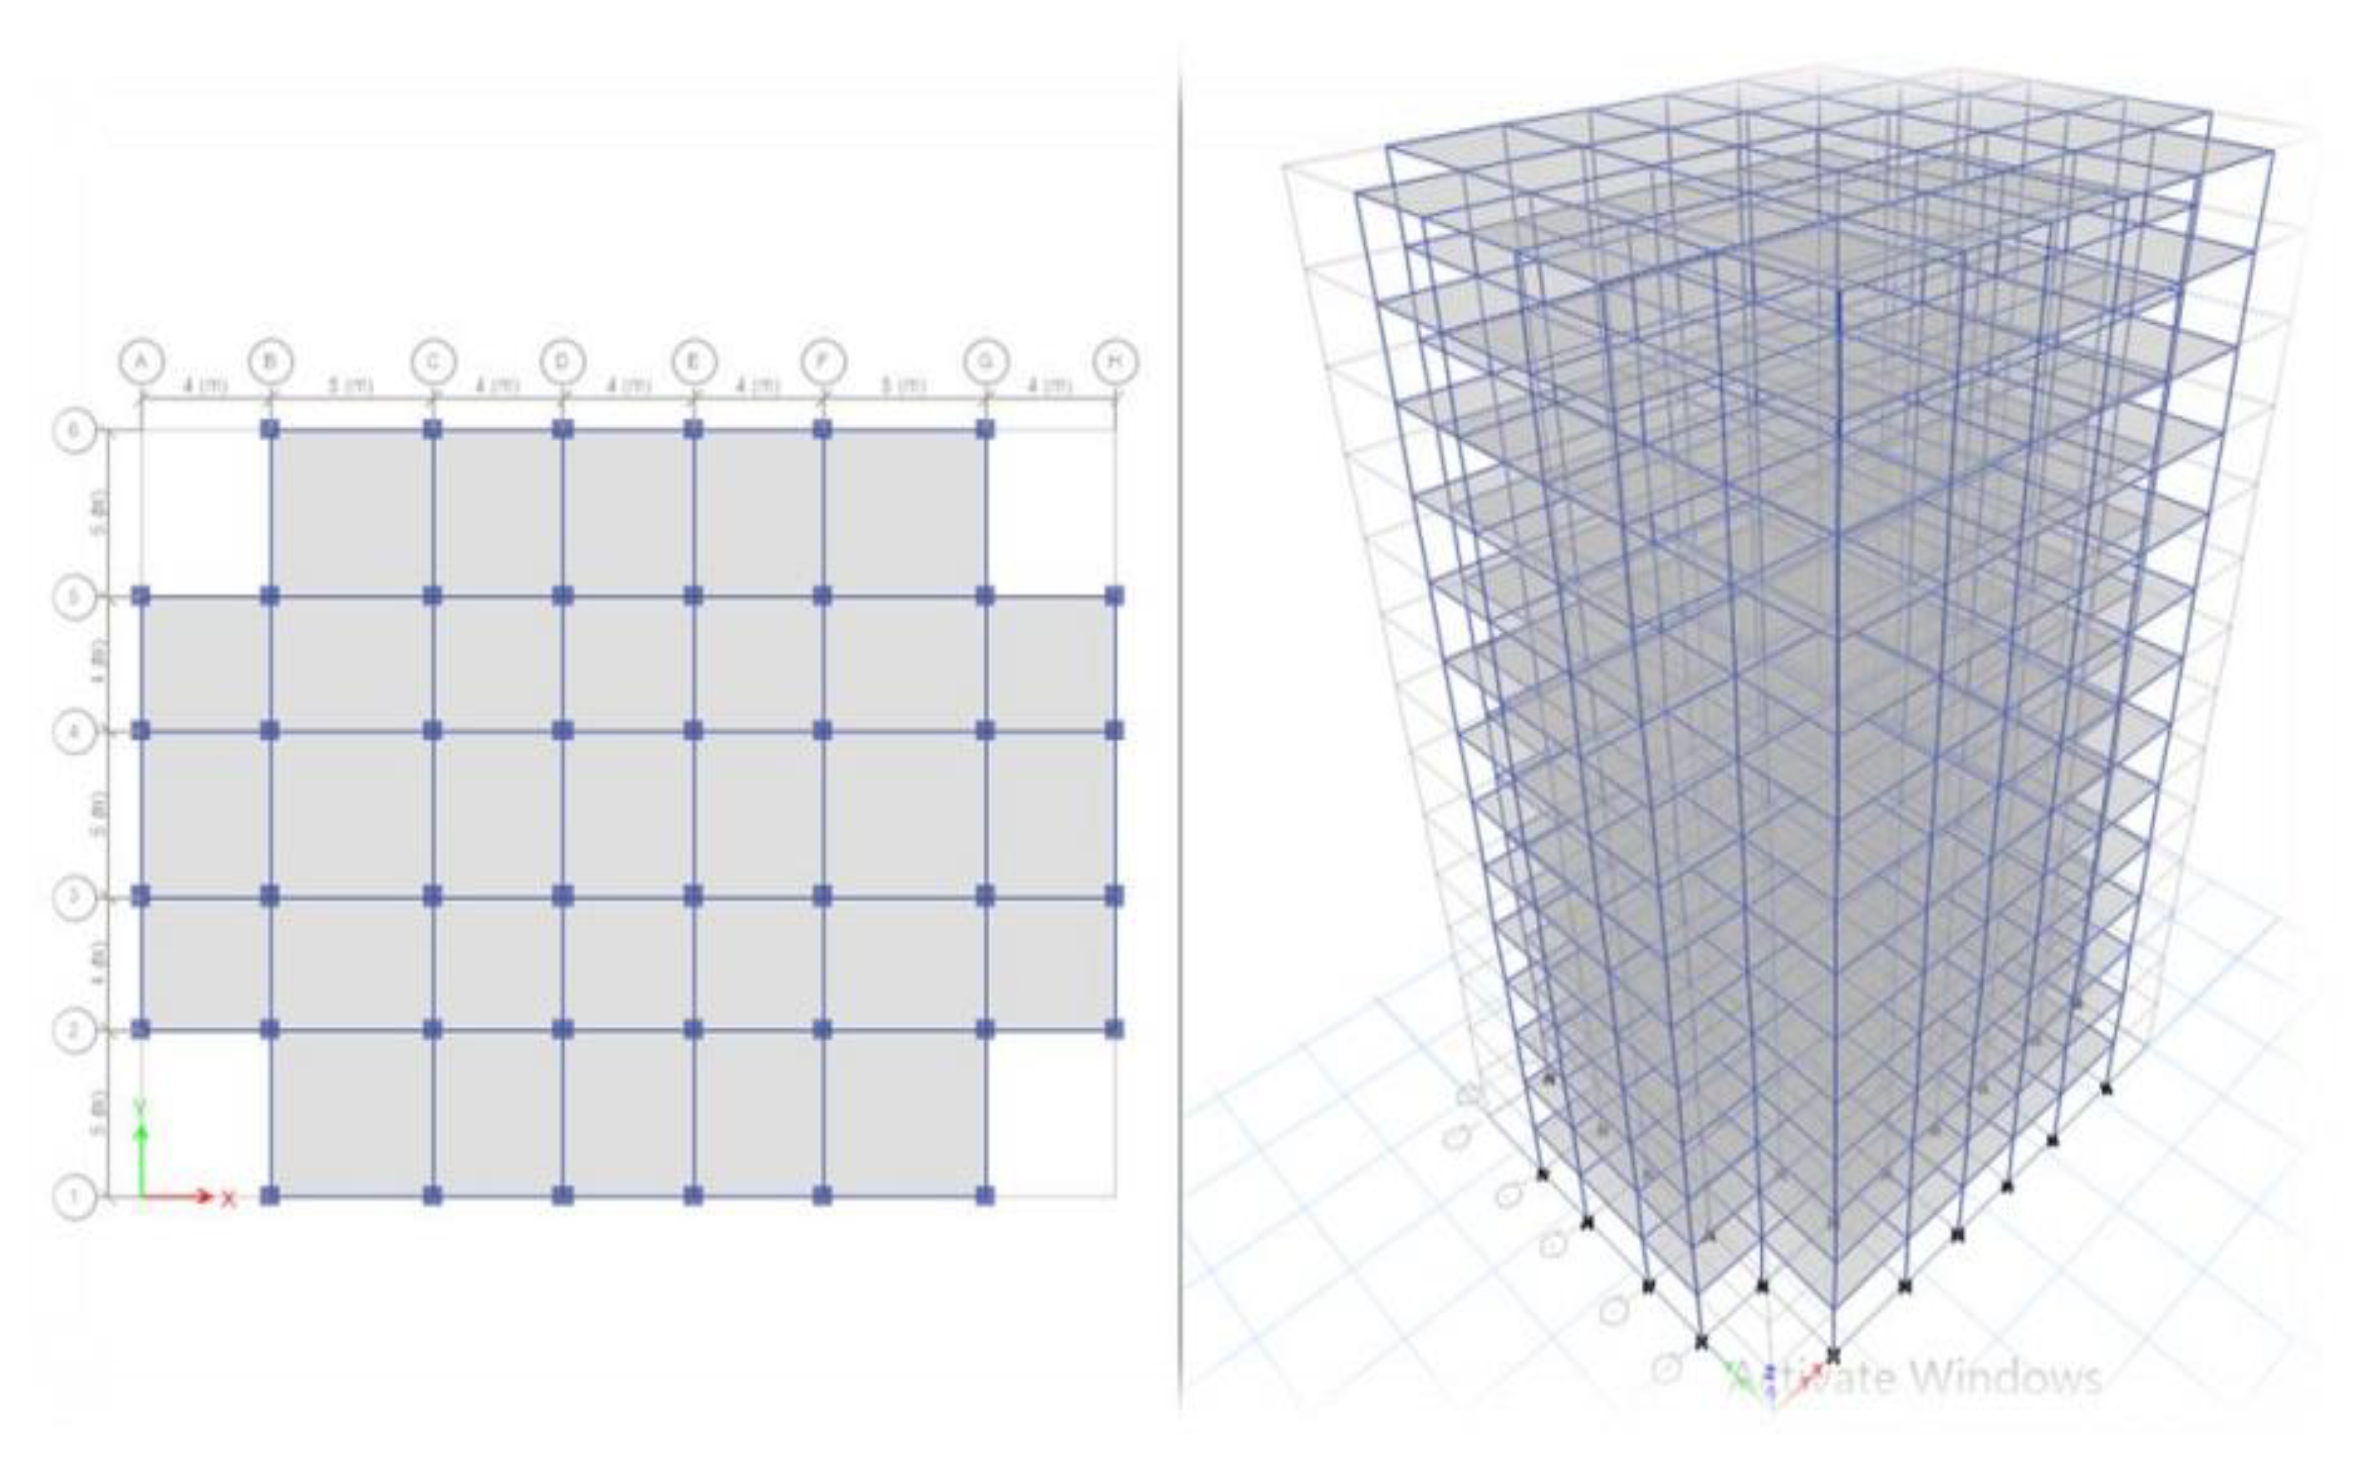
Funding

The research is partially funded by the Ministry of Science and Higher Education of the Russian Federation under the strategic academic leadership program ‘Priority 2030’ (Agreement 075-15-2021-1333 dated 30 September 2021).

Institutional Review Board Statement

Not applicable.

Informed Consent Statement

Not applicable.

Data Availability Statement

The data used to support the findings of this study are included in the article.

Acknowledgments

The authors extend their thanks to the Ministry of Science and Higher Education of the Russian Federation for funding this work.

Conflicts of Interest

The authors declare no conflict of interest.

References

  1. Lu, X.; Xie, L.; Guan, H.; Huang, Y.; Lu, X. A Shear Wall Element for Nonlinear Seismic Analysis of Super-Tall Buildings Using OpenSees. Finite Elem. Anal. Des. 2015, 98, 14–25. [Google Scholar] [CrossRef] [Green Version]
  2. Najm, H.M.; Ibrahim, A.M.; Sabri, M.M.; Hassan, A.; Morkhade, S.; Mashaan, N.S.; Eldirderi, M.M.A.; Khedher, K.M. Modelling of Cyclic Load Behaviour of Smart Composite Steel-Concrete Shear Wall Using Finite Element Analysis. Buildings 2022, 12, 850. [Google Scholar] [CrossRef]
  3. Pei, S.; Popovski, M.; van de Lindt, J.W. Seismic Design of a Multi-Story Cross Laminated Timber Building Based on Component Level Testing. In Proceedings of the World Conference on Timber Engineering, Auckland, New Zealand, 16–19 July 2012. [Google Scholar]
  4. Esmaili, O.; Epackachi, S.; Samadzad, M.; Mirghaderi, S.R. Study of Structural RC Shear Wall System in a 56-Story RC Tall Building. In Proceedings of the 14th World Conference on Earthquake Engineering, Beijing, China, 12–17 October 2008. [Google Scholar]
  5. Vigh, L.G.; Deierlein, G.G.; Miranda, E.; Liel, A.B.; Tipping, S. Seismic Performance Assessment of Steel Corrugated Shear Wall System Using Non-Linear Analysis. J. Constr. Steel Res. 2013, 85, 48–59. [Google Scholar] [CrossRef]
  6. Hassan, A.; Pal, S. Effect of Soil Condition on Seismic Response of Isolated Base Buildings. Int. J. Adv. Struct. Eng. 2018, 10, 249–261. [Google Scholar] [CrossRef] [Green Version]
  7. Hassan, A. Optimization of Base Isolation Parameters. LAMBERT Acad. Publ. 2017, 97, 1207–1222. [Google Scholar]
  8. Hassan, A.; Pal, S. Performance Analysis of Base Isolation & Fixed Base Buildings. ISSN (Online) Int. J. Eng. Res. Mech. Civ. Eng. (IJERMCE) 2017, 2, 152–157. [Google Scholar]
  9. Fintel, M. Performance of Buildings with Shear Walls in Earthquakes of the Last Thirty Years. PCI J. 2014, 40, 62–80. [Google Scholar] [CrossRef]
  10. Wallace, J.W.; Thomsen IV, J.H. Seismic Design of RC Structural Walls. Part II: Applications. J. Struct. Eng. 2002, 121, 88–101. [Google Scholar] [CrossRef]
  11. Wu, Y.T.; Kang, D.Y.; Yang, Y.B. Seismic Performance of Steel and Concrete Composite Shear Walls with Embedded Steel Truss for Use in High-Rise Buildings. Eng. Struct. 2016, 125, 39–53. [Google Scholar] [CrossRef] [Green Version]
  12. Mosoarca, M. Failure Analysis of RC Shear Walls with Staggered Openings under Seismic Loads. Eng. Fail. Anal. 2014, 41, 48–64. [Google Scholar] [CrossRef]
  13. Farzampour, A.; Laman, J.A. Behavior Prediction of Corrugated Steel Plate Shear Walls with Openings. J. Constr. Steel Res. 2015, 114, 258–268. [Google Scholar] [CrossRef]
  14. Taranath, B.S. Reinforced Concrete Design of Tall Buildings; CRC Press: Boca Raton, FL, USA, 2009. [Google Scholar]
  15. Galal, K.; El-Sokkarry, H. Recent Advancements in Retrofit of Rc Shear Walls. In Proceedings of the 14th World Conference on Earthquake Engineering, Beijing, China, 12–17 October 2008. [Google Scholar]
  16. Najm, H.M.; Ibrahim, A.M.; Sabri, M.M.S.; Hassan, A.; Morkhade, S.; Mashaan, N.S.; Eldirderi, M.M.A.; Khedher, K.M. Evaluation and Numerical Investigations of the Cyclic Behavior of Smart Composite Steel–Concrete Shear Wall: Comprehensive Study of Finite Element Model. Materials 2022, 15, 4496. [Google Scholar] [CrossRef] [PubMed]
  17. Zhang, Z.; Wang, F. Experimental Investigation into the Seismic Performance of Prefabricated Reinforced Masonry Shear Walls with Vertical Joint Connections. Appl. Sci. 2021, 11, 4421. [Google Scholar] [CrossRef]
  18. Dang-Vu, H.; Shin, J.; Lee, K. Seismic Fragility Assessment of Columns in a Piloti-Type Building Retrofitted with Additional Shear Walls. Sustainability 2020, 12, 6530. [Google Scholar] [CrossRef]
  19. Coccia, S.; di Carlo, F.; Imperatore, S. Masonry Walls Retrofitted with Vertical FRP Rebars. Buildings 2020, 10, 72. [Google Scholar] [CrossRef] [Green Version]
  20. Jeon, S.H.; Park, J.H. Seismic Fragility of Ordinary Reinforced Concrete Shear Walls with Coupling Beams Designed Using a Performance-Based Procedure. Appl. Sci. 2020, 10, 4075. [Google Scholar] [CrossRef]
  21. Zheng, S.-S.; Yang, W.; Yang, F.; Sun, L.-F.; Hou, P.-J. Seismic Fragility Analysis for RC Core Walls Structure Based on MIDA Method. Zhendong Yu Chongji/J. Vib. Shock 2015, 34, 117–123. [Google Scholar] [CrossRef]
  22. Coronelli, D.; Martinelli, L.; Mulas, M.G. Pushover Analysis of Shaking Table Tests on a RC Shear Wall. In Proceedings of the Proceedings of the 8th International Conference on Structural Dynamics, EURODYN 2011, Leuven, Belgium, 4–6 July 2011. [Google Scholar]
  23. Wang, Q.; Shi, Q.; Tian, H. Experimental Study on Shear Capacity of SRC Joints with Different Arrangement and Sizes of Cross-Shaped Steel in Column. Steel Compos. Struct. 2016, 21, 267–287. [Google Scholar] [CrossRef]
  24. Lehman, D.E.; Turgeon, J.A.; Birely, A.C.; Hart, C.R.; Marley, K.P.; Kuchma, D.A.; Lowes, L.N. Seismic Behavior of a Modern Concrete Coupled Wall. J. Struct. Eng. 2013, 139, 1371–1381. [Google Scholar] [CrossRef]
  25. Husain, M.; Eisa, A.S.; Hegazy, M.M. Strengthening of Reinforced Concrete Shear Walls with Openings Using Carbon Fiber-Reinforced Polymers. Int. J. Adv. Struct. Eng. 2019, 11, 129–150. [Google Scholar] [CrossRef] [Green Version]
  26. Dou, C.; Jiang, Z.Q.; Pi, Y.L.; Guo, Y.L. Elastic Shear Buckling of Sinusoidally Corrugated Steel Plate Shear Wall. Eng. Struct. 2016, 121, 136–146. [Google Scholar] [CrossRef]
  27. Berman, J.W.; Bruneau, M. Experimental Investigation of Light-Gauge Steel Plate Shear Walls. J. Struct. Eng. 2005, 131, 259–267. [Google Scholar] [CrossRef] [Green Version]
  28. El Ouni, M.H.; Laissy, M.Y.; Ismaeil, M.; Ben Kahla, N. Effect of Shear Walls on the Active Vibration Control of Buildings. Buildings 2018, 8, 164. [Google Scholar] [CrossRef] [Green Version]
  29. Marius, M. Seismic Behaviour of Reinforced Concrete Shear Walls with Regular and Staggered Openings after the Strong Earthquakes between 2009 and 2011. Eng. Fail. Anal. 2013, 34, 537–565. [Google Scholar] [CrossRef]
  30. Najem, H.M.; Ibrahim, A.M. The Effect of Infill Steel Plate Thickness on the Cycle Behavior of Steel Plate Shear Walls. Diyala J. Eng. Sci. 2018, 11, 1–6. [Google Scholar] [CrossRef]
  31. Najem, H.M.; Ibrahim, A.M. Influence of Concrete Strength on the Cycle Performance of Composite Steel Plate Shear Walls. Diyala J. Eng. Sci. 2018, 11, 1–7. [Google Scholar] [CrossRef]
  32. Fadhil, H.; Ibrahim, A.; Mahmood, M. Effect of Corrugation Angle and Direction on the Performance of Corrugated Steel Plate Shear Walls. Civ. Eng. J. 2018, 4, 2667–2679. [Google Scholar] [CrossRef]
  33. Ahmed, H.U.; Mohammed, A.S.; Faraj, R.H.; Qaidi, S.M.; Mohammed, A.A. Compressive strength of geopolymer concrete modified with nano-silica: Experimental and modeling investigations. Case Stud. Constr. Mater. 2022, 16, e01036. [Google Scholar] [CrossRef]
  34. Khan, M.; Cao, M.; Ali, M. Cracking behaviour and constitutive modelling of hybrid fibre reinforced concrete. J. Build. Eng. 2020, 30, 101272. [Google Scholar] [CrossRef]
  35. Parvez, I.; Shen, J.; Khan, M.; Cheng, C. Modeling and solution techniques used for hydro generation scheduling. Water 2019, 11, 1392. [Google Scholar] [CrossRef] [Green Version]
  36. Ahmed, H.U.; Mohammed, A.S.; Qaidi, S.M.; Faraj, R.H.; Hamah Sor, N.; Mohammed, A.A. Compressive strength of geopolymer concrete composites: A systematic comprehensive review, analysis and modeling. Eur. J. Environ. Civ. Eng. 2022, 26, 1–46. [Google Scholar] [CrossRef]
  37. Faraj, R.H.; Ahmed, H.U.; Rafiq, S.; Sor, N.H.; Ibrahim, D.F.; Qaidi, S.M. Performance of Self-Compacting Mortars Modified with Nanoparticles: A Systematic Review and Modeling. Clean. Mater. 2022, 4, 100086. [Google Scholar] [CrossRef]
Figure 1. The geometry of the structure and the 3D of the structure without shear walls.
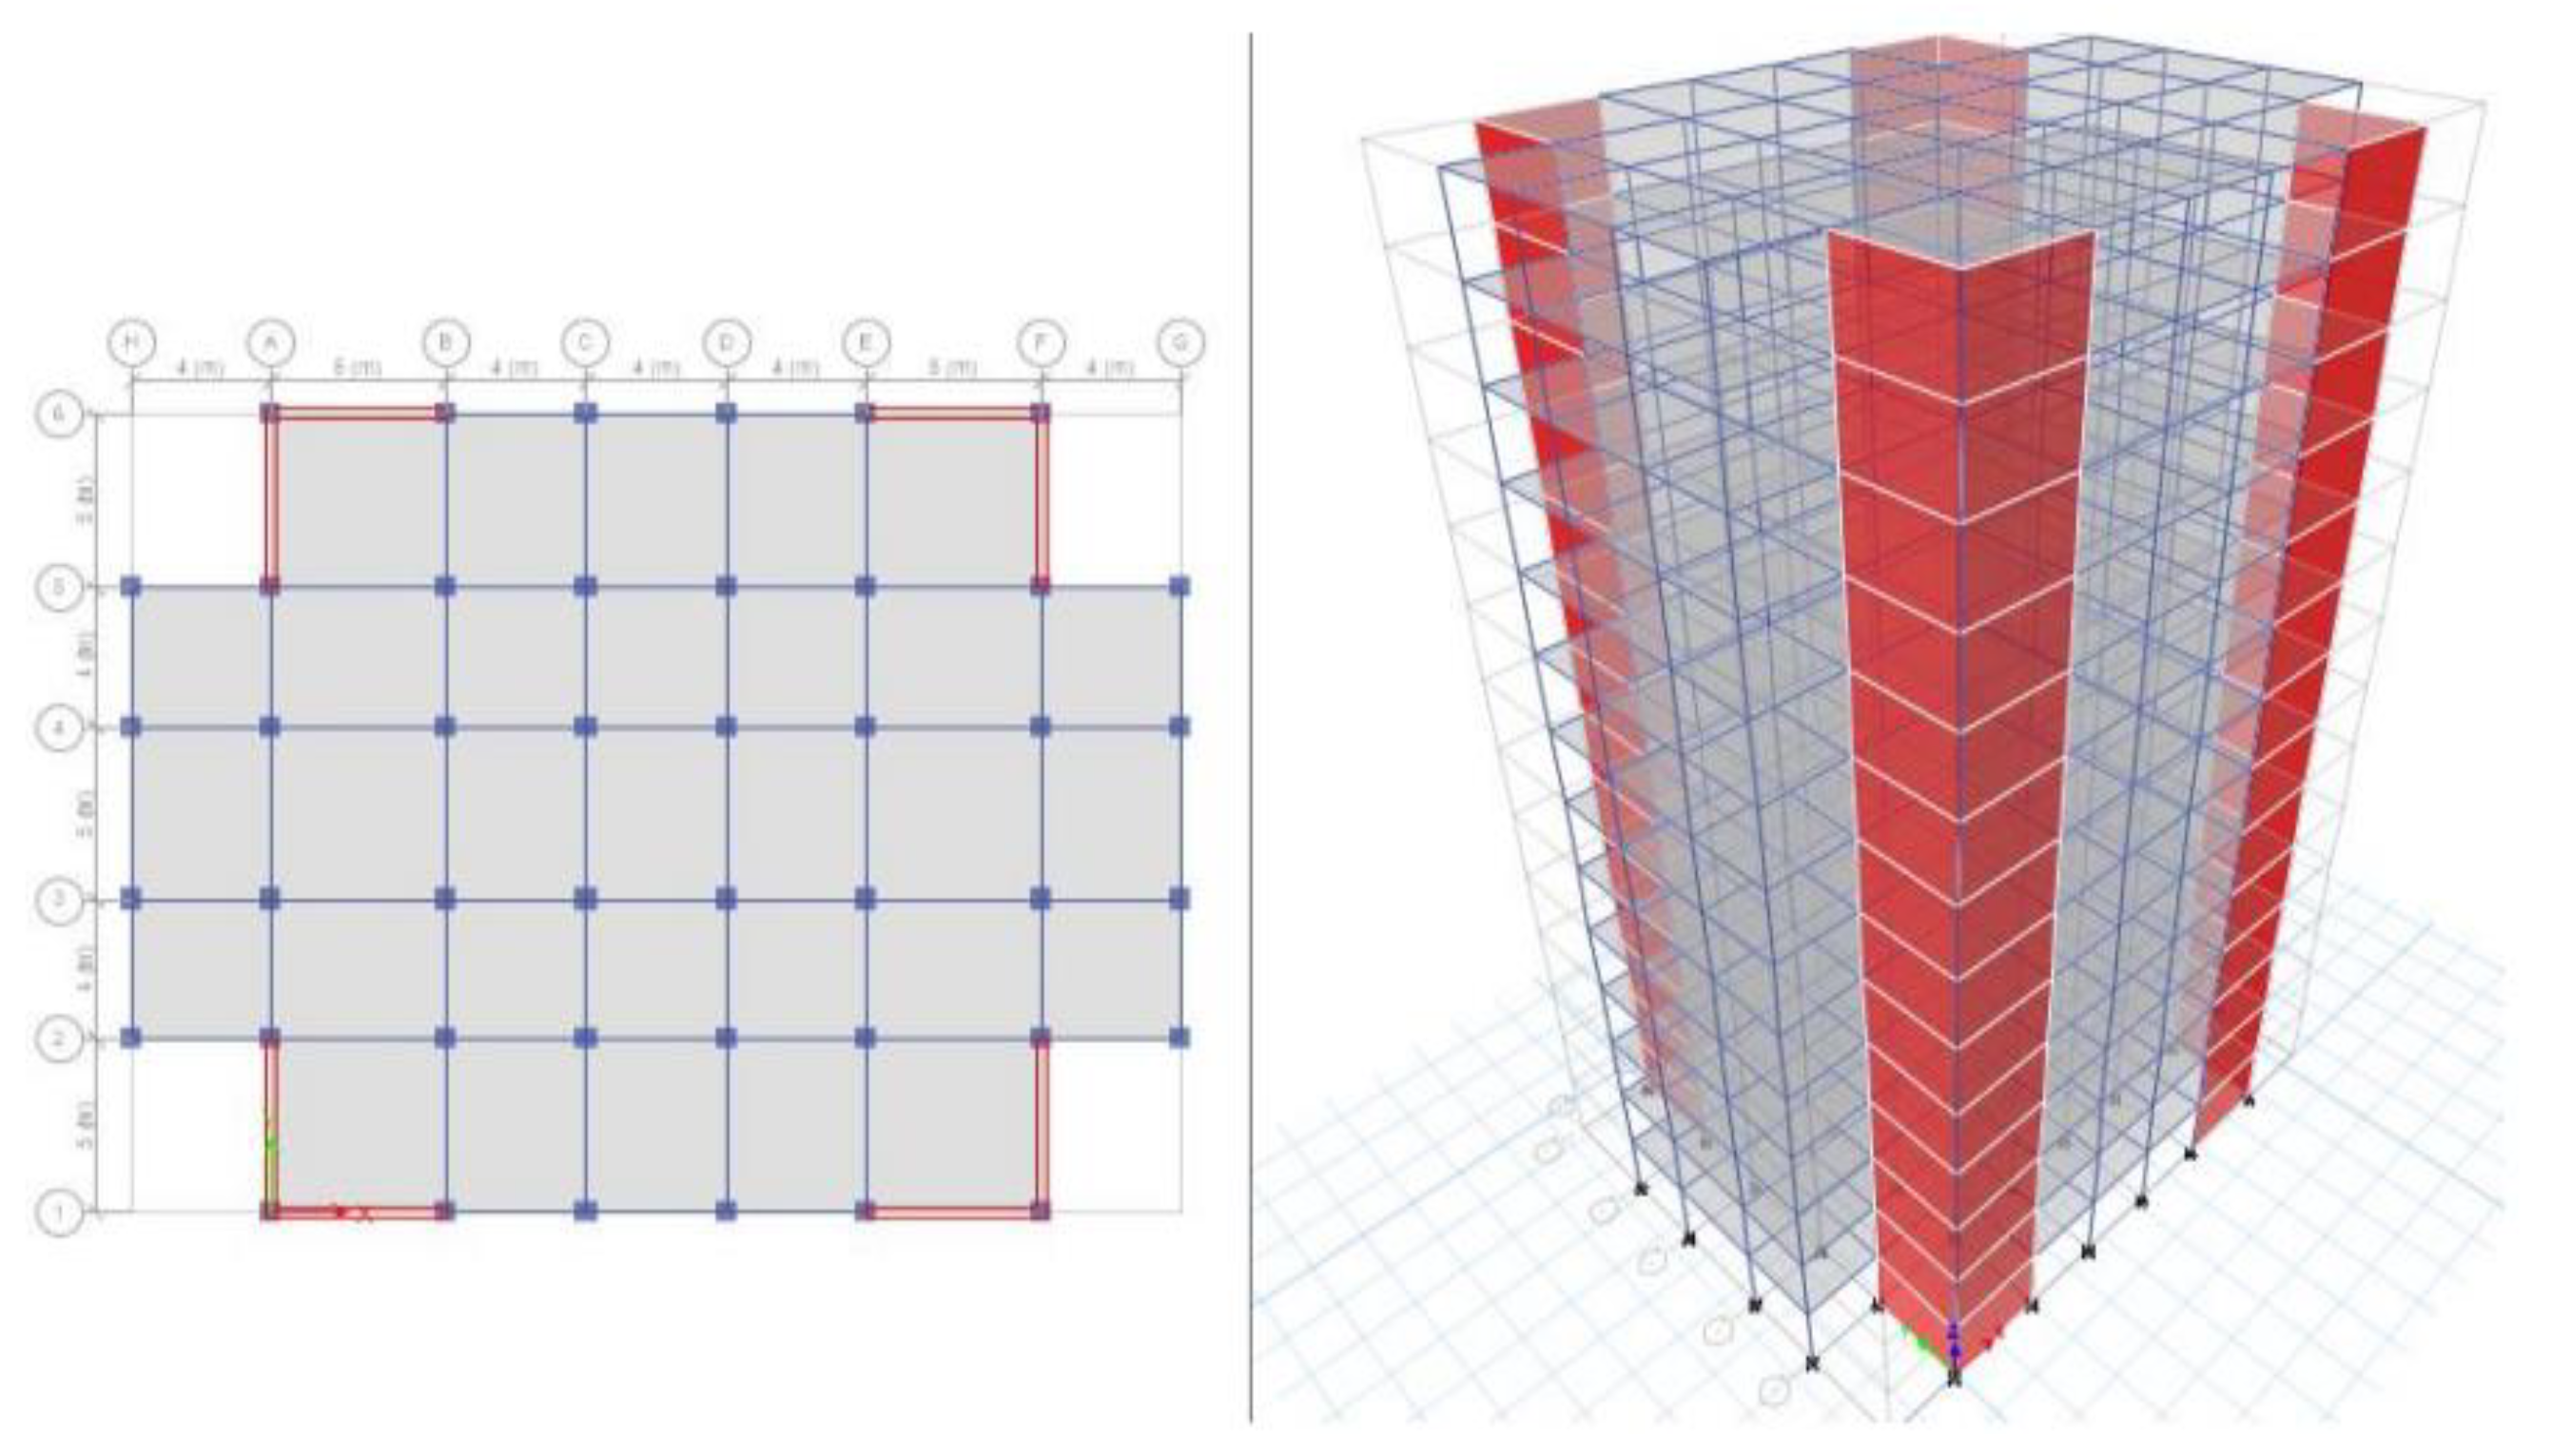
Buildings 12 01293 g001
Figure 2. The geometry of the structure and 3D structure shear wall without opening.
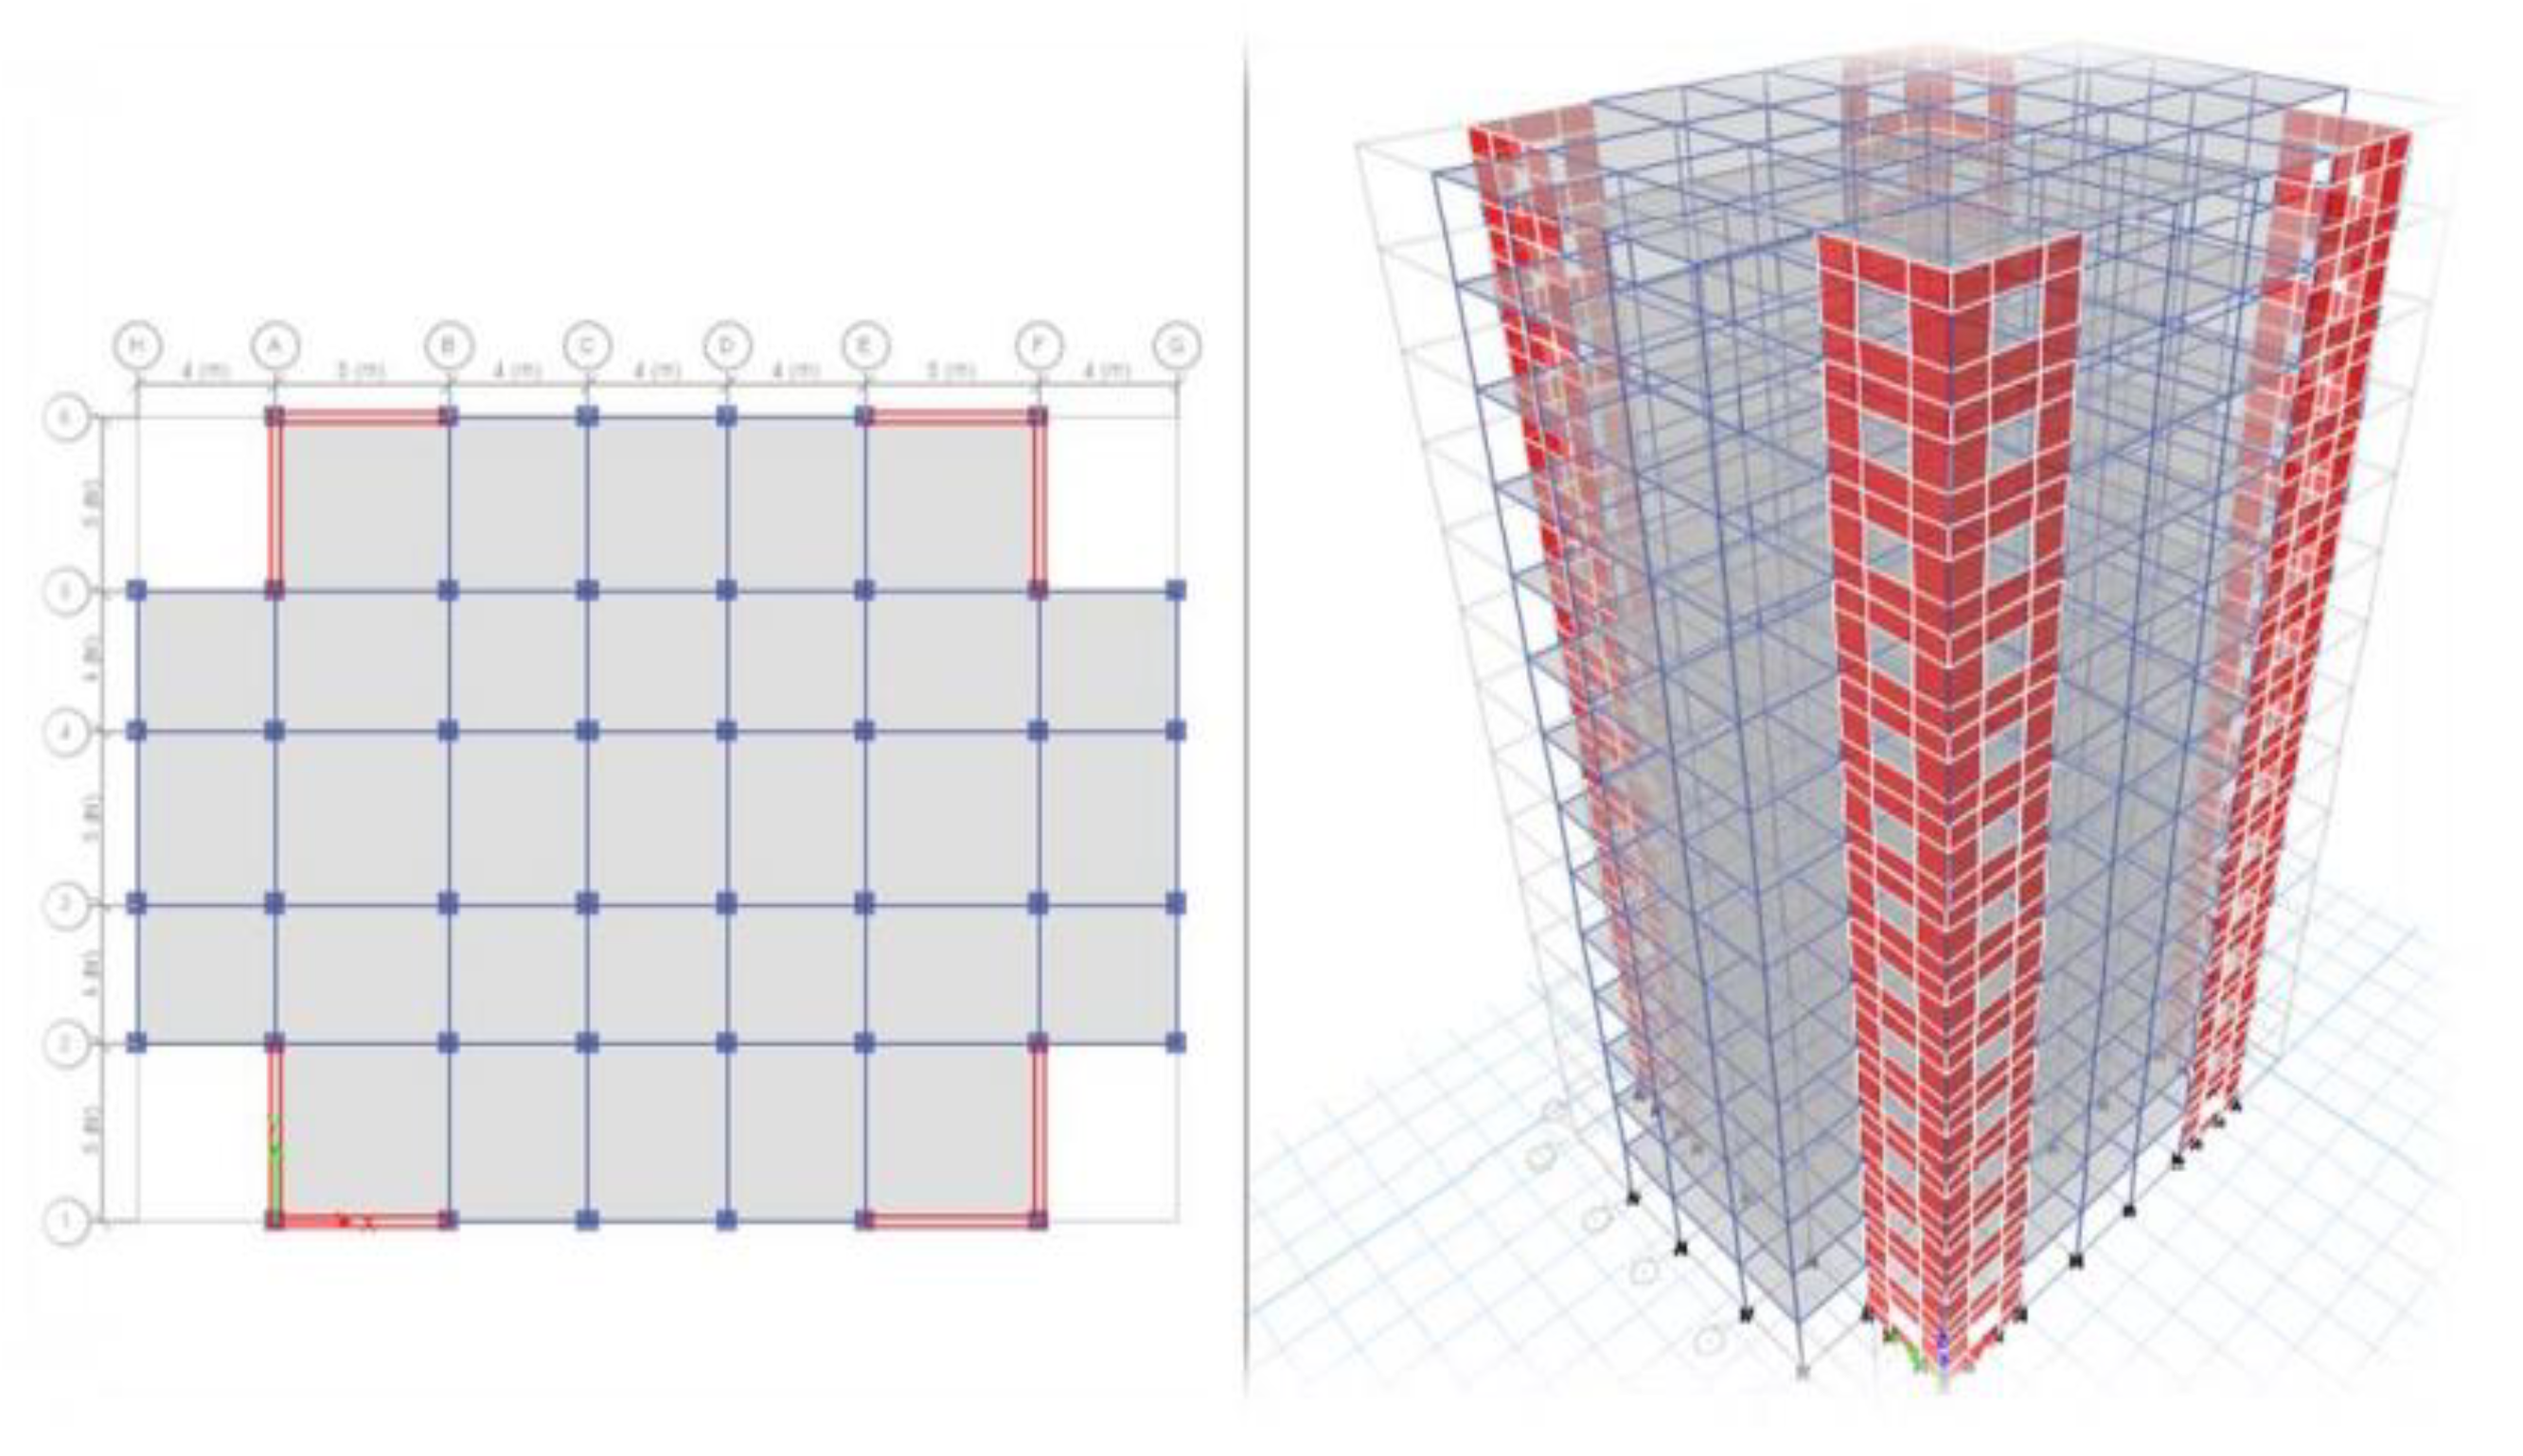
Buildings 12 01293 g002
Figure 3. The geometry of the structure and 3D structure shear walls with vertical openings.
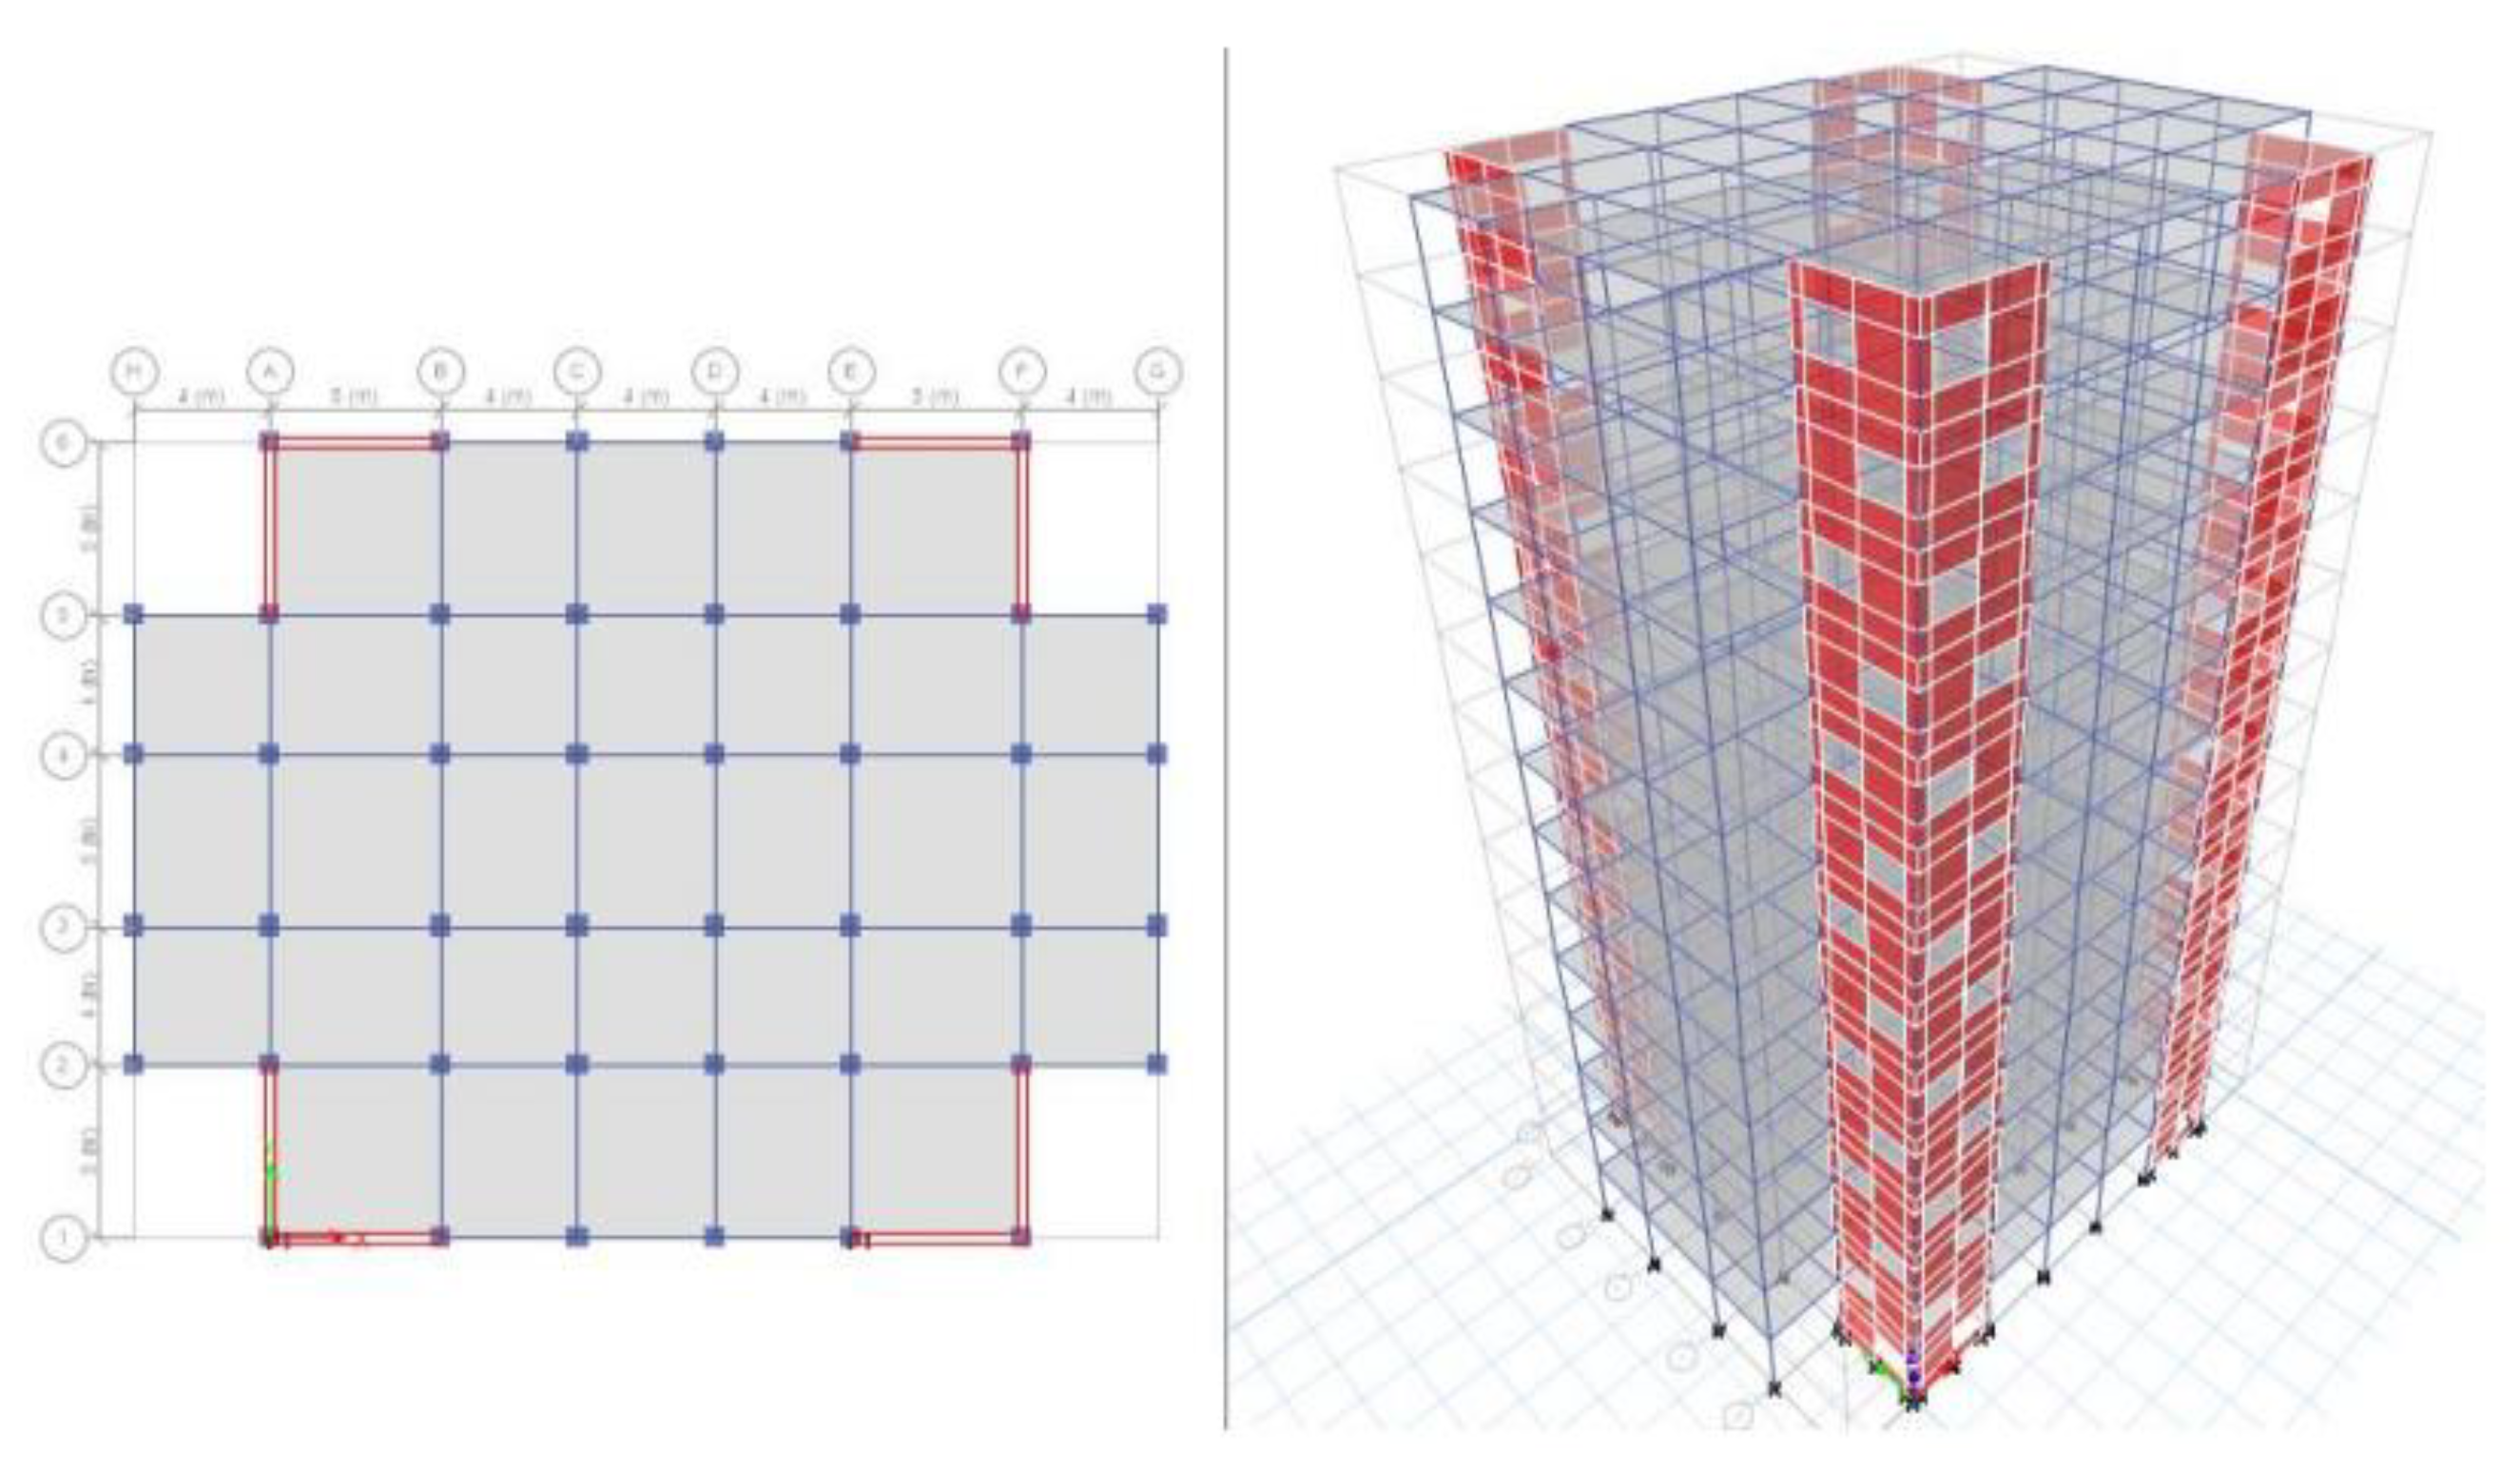
Buildings 12 01293 g003
Figure 4. The geometry of the structure and 3D structure shear walls with staggered openings.
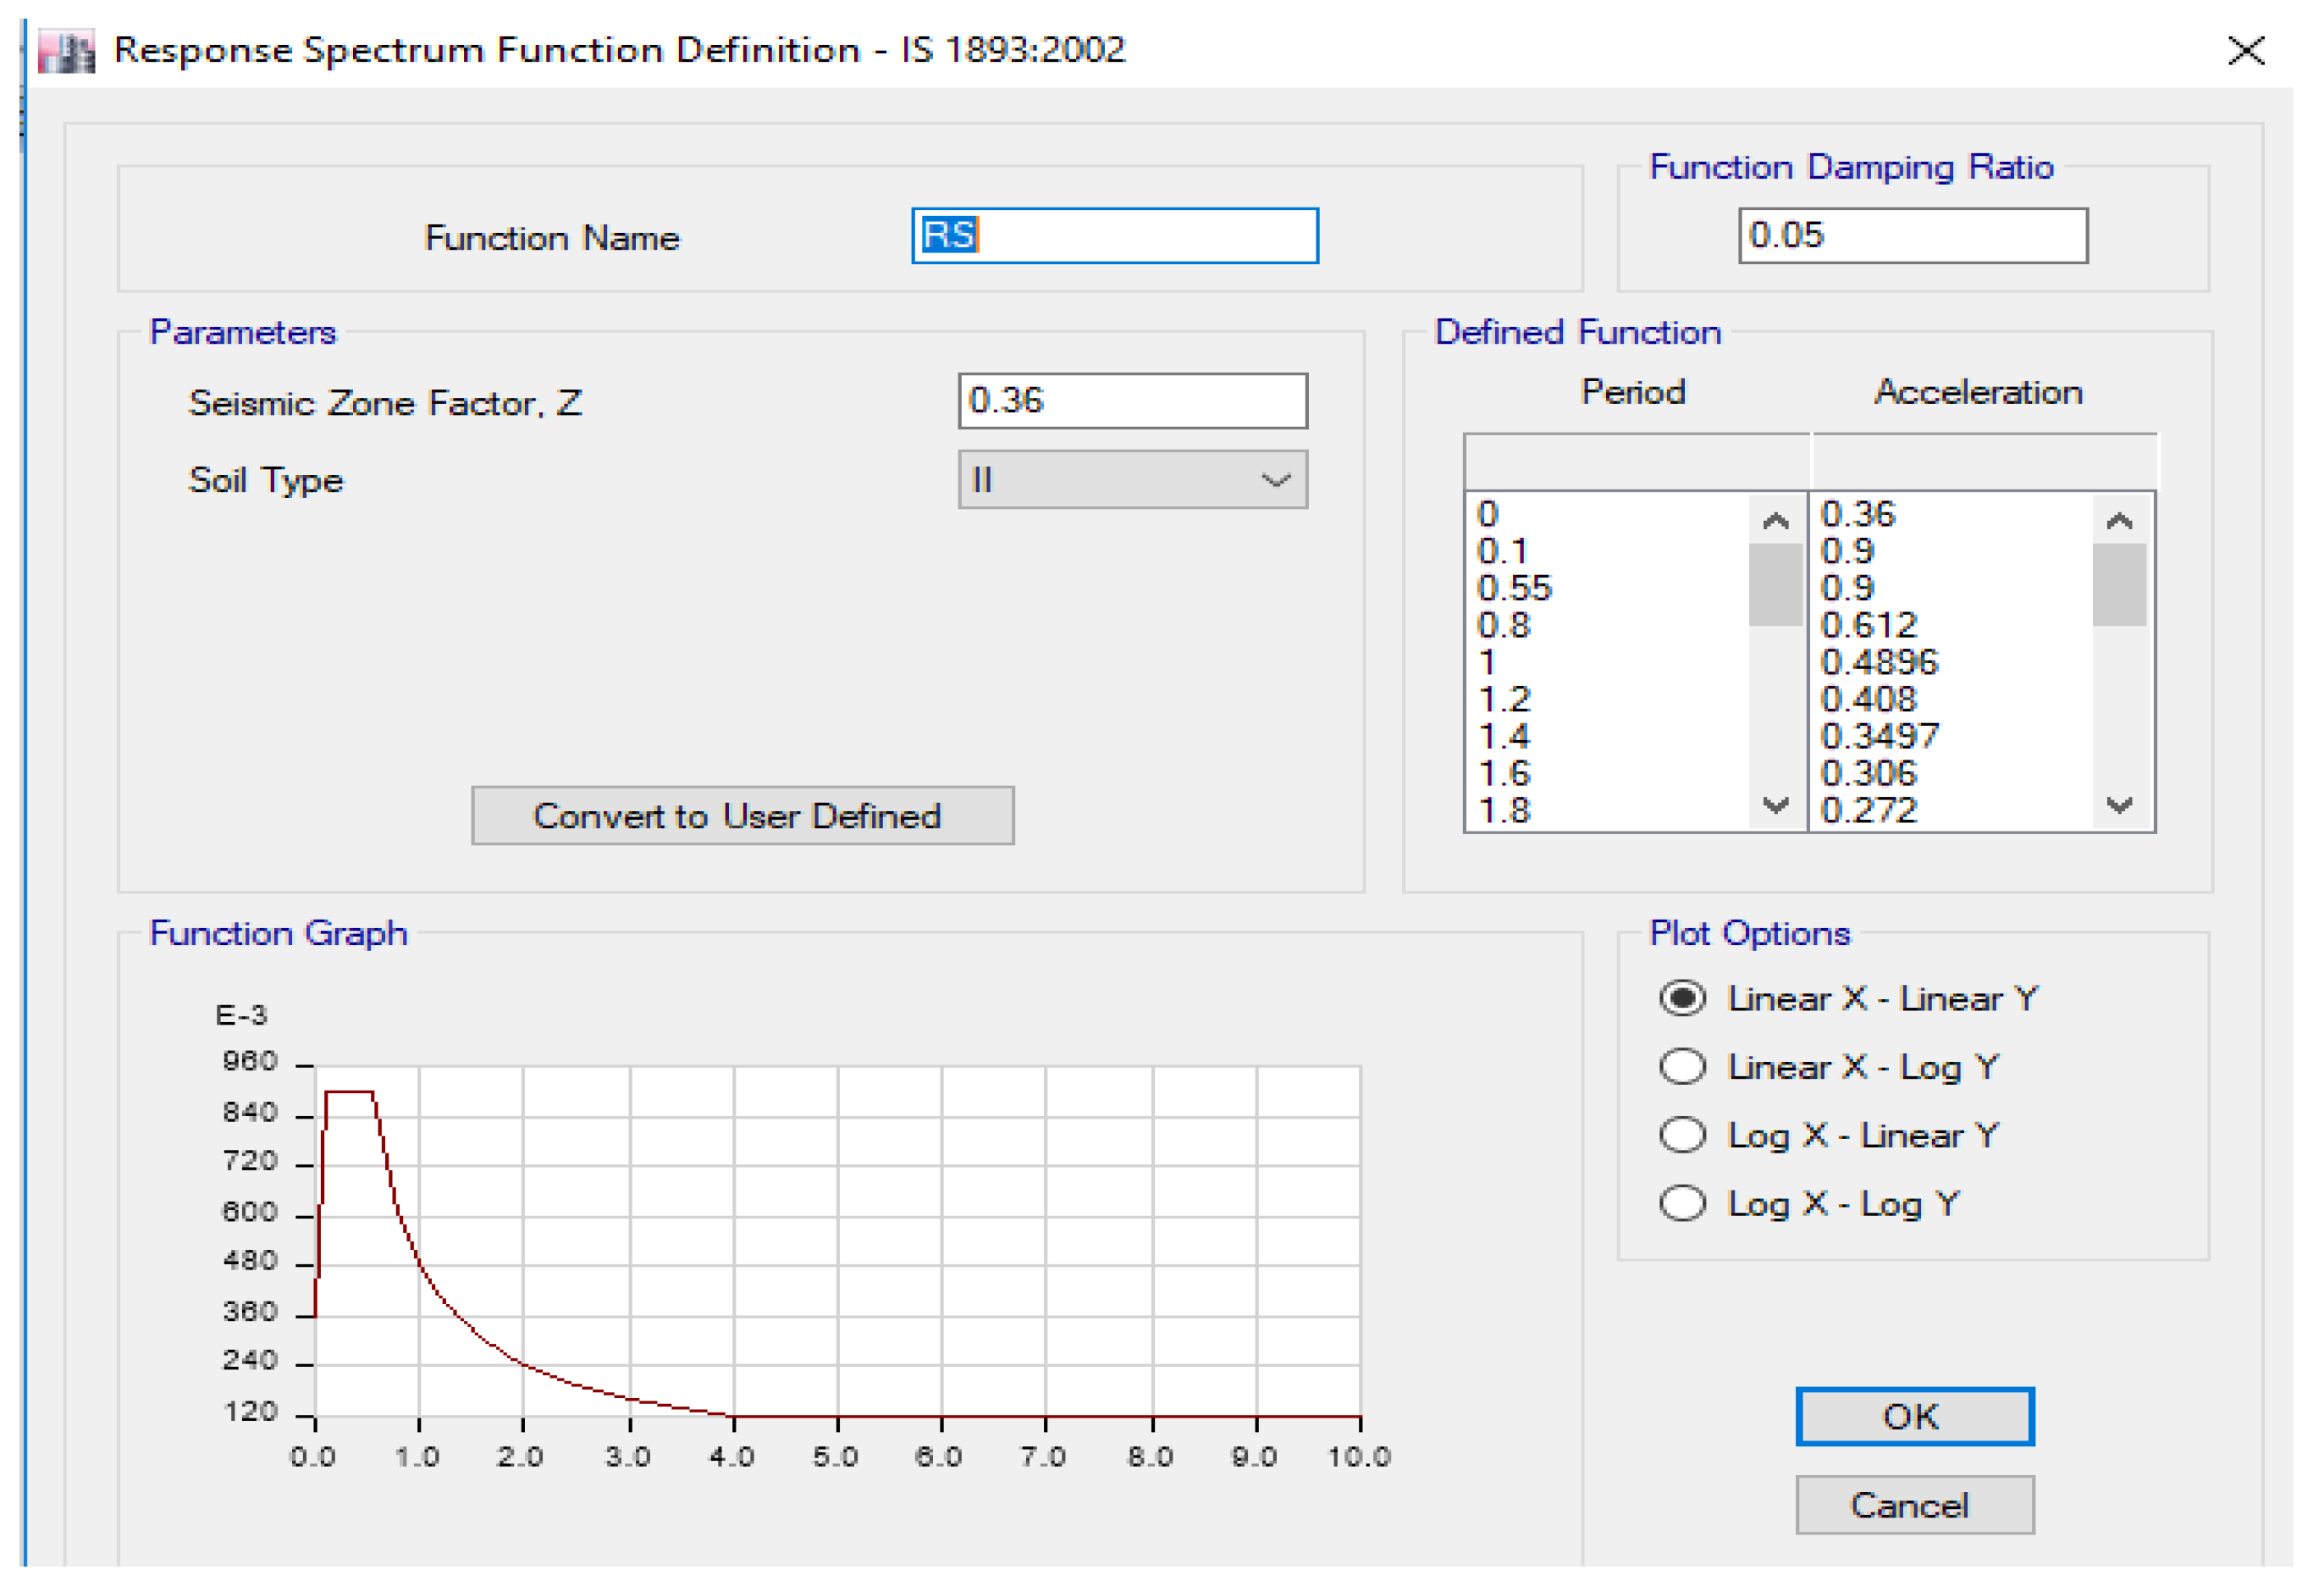
Buildings 12 01293 g004
Figure 5. Response spectrum function definition.
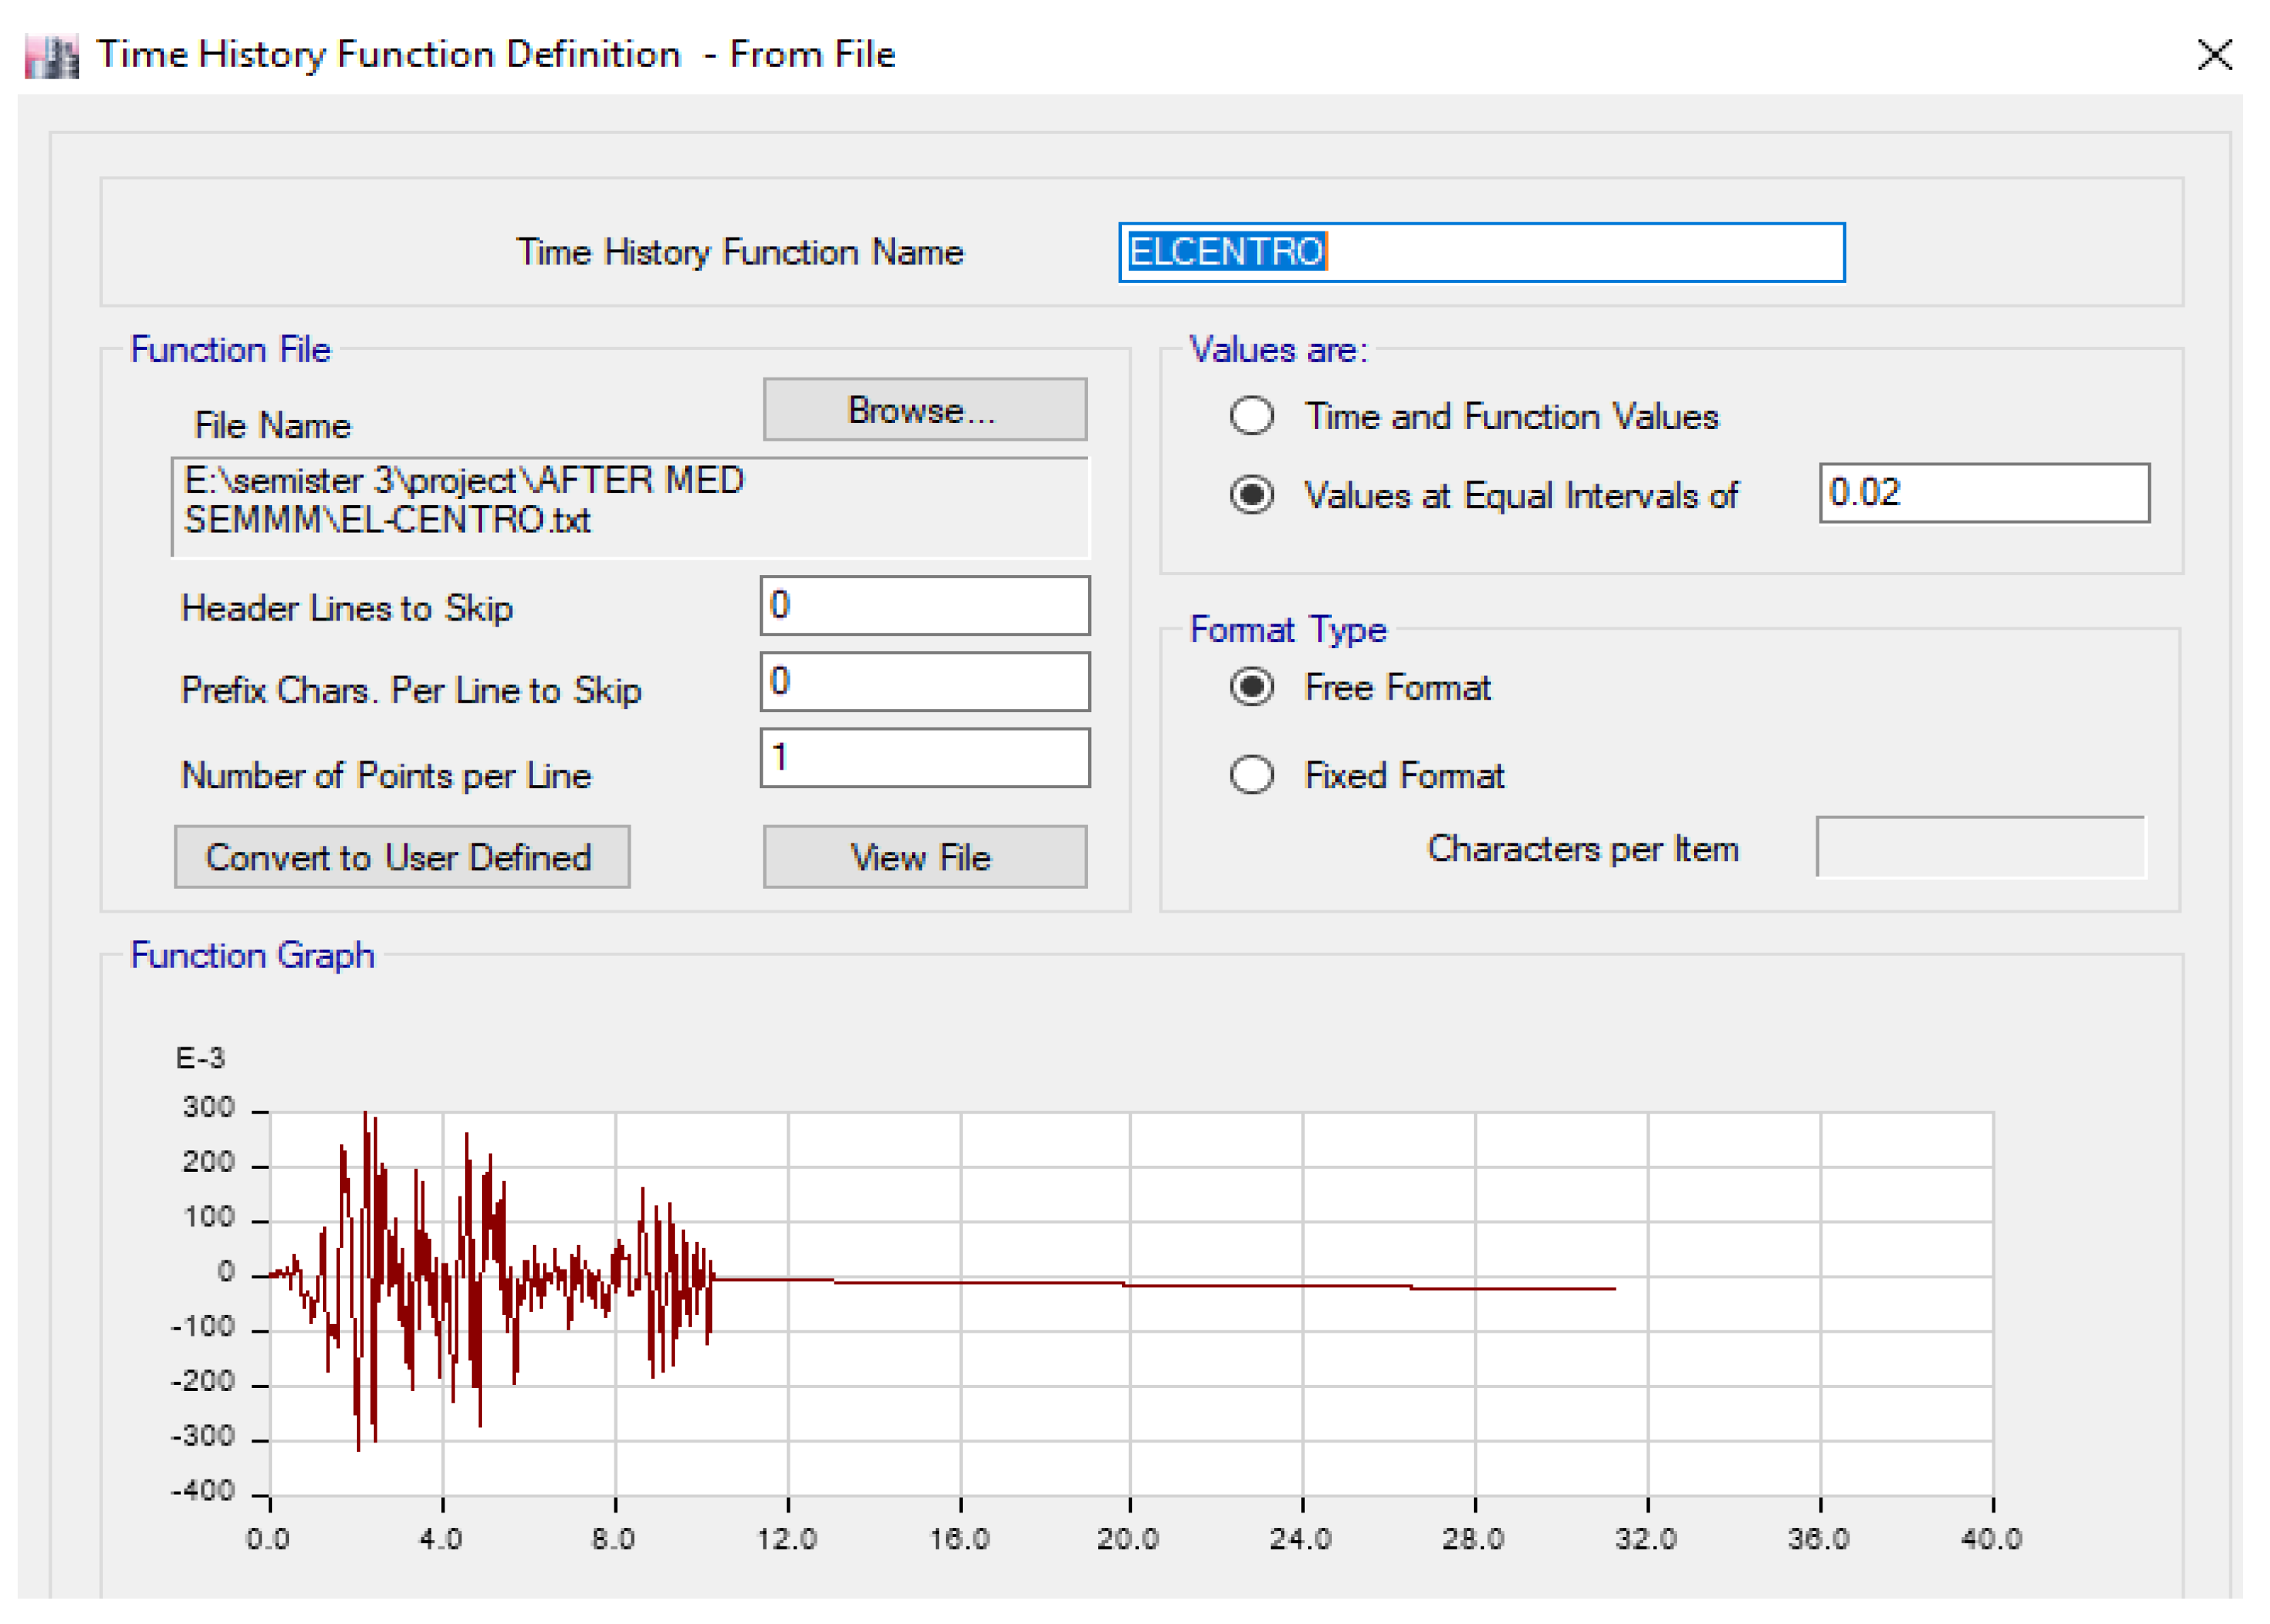
Buildings 12 01293 g005
Figure 6. Time history function definition.
Buildings 12 01293 g006
Figure 7. Story displacements, ESA in X-direction.
Buildings 12 01293 g007
Figure 8. Story displacements, ESA in the Y-direction.
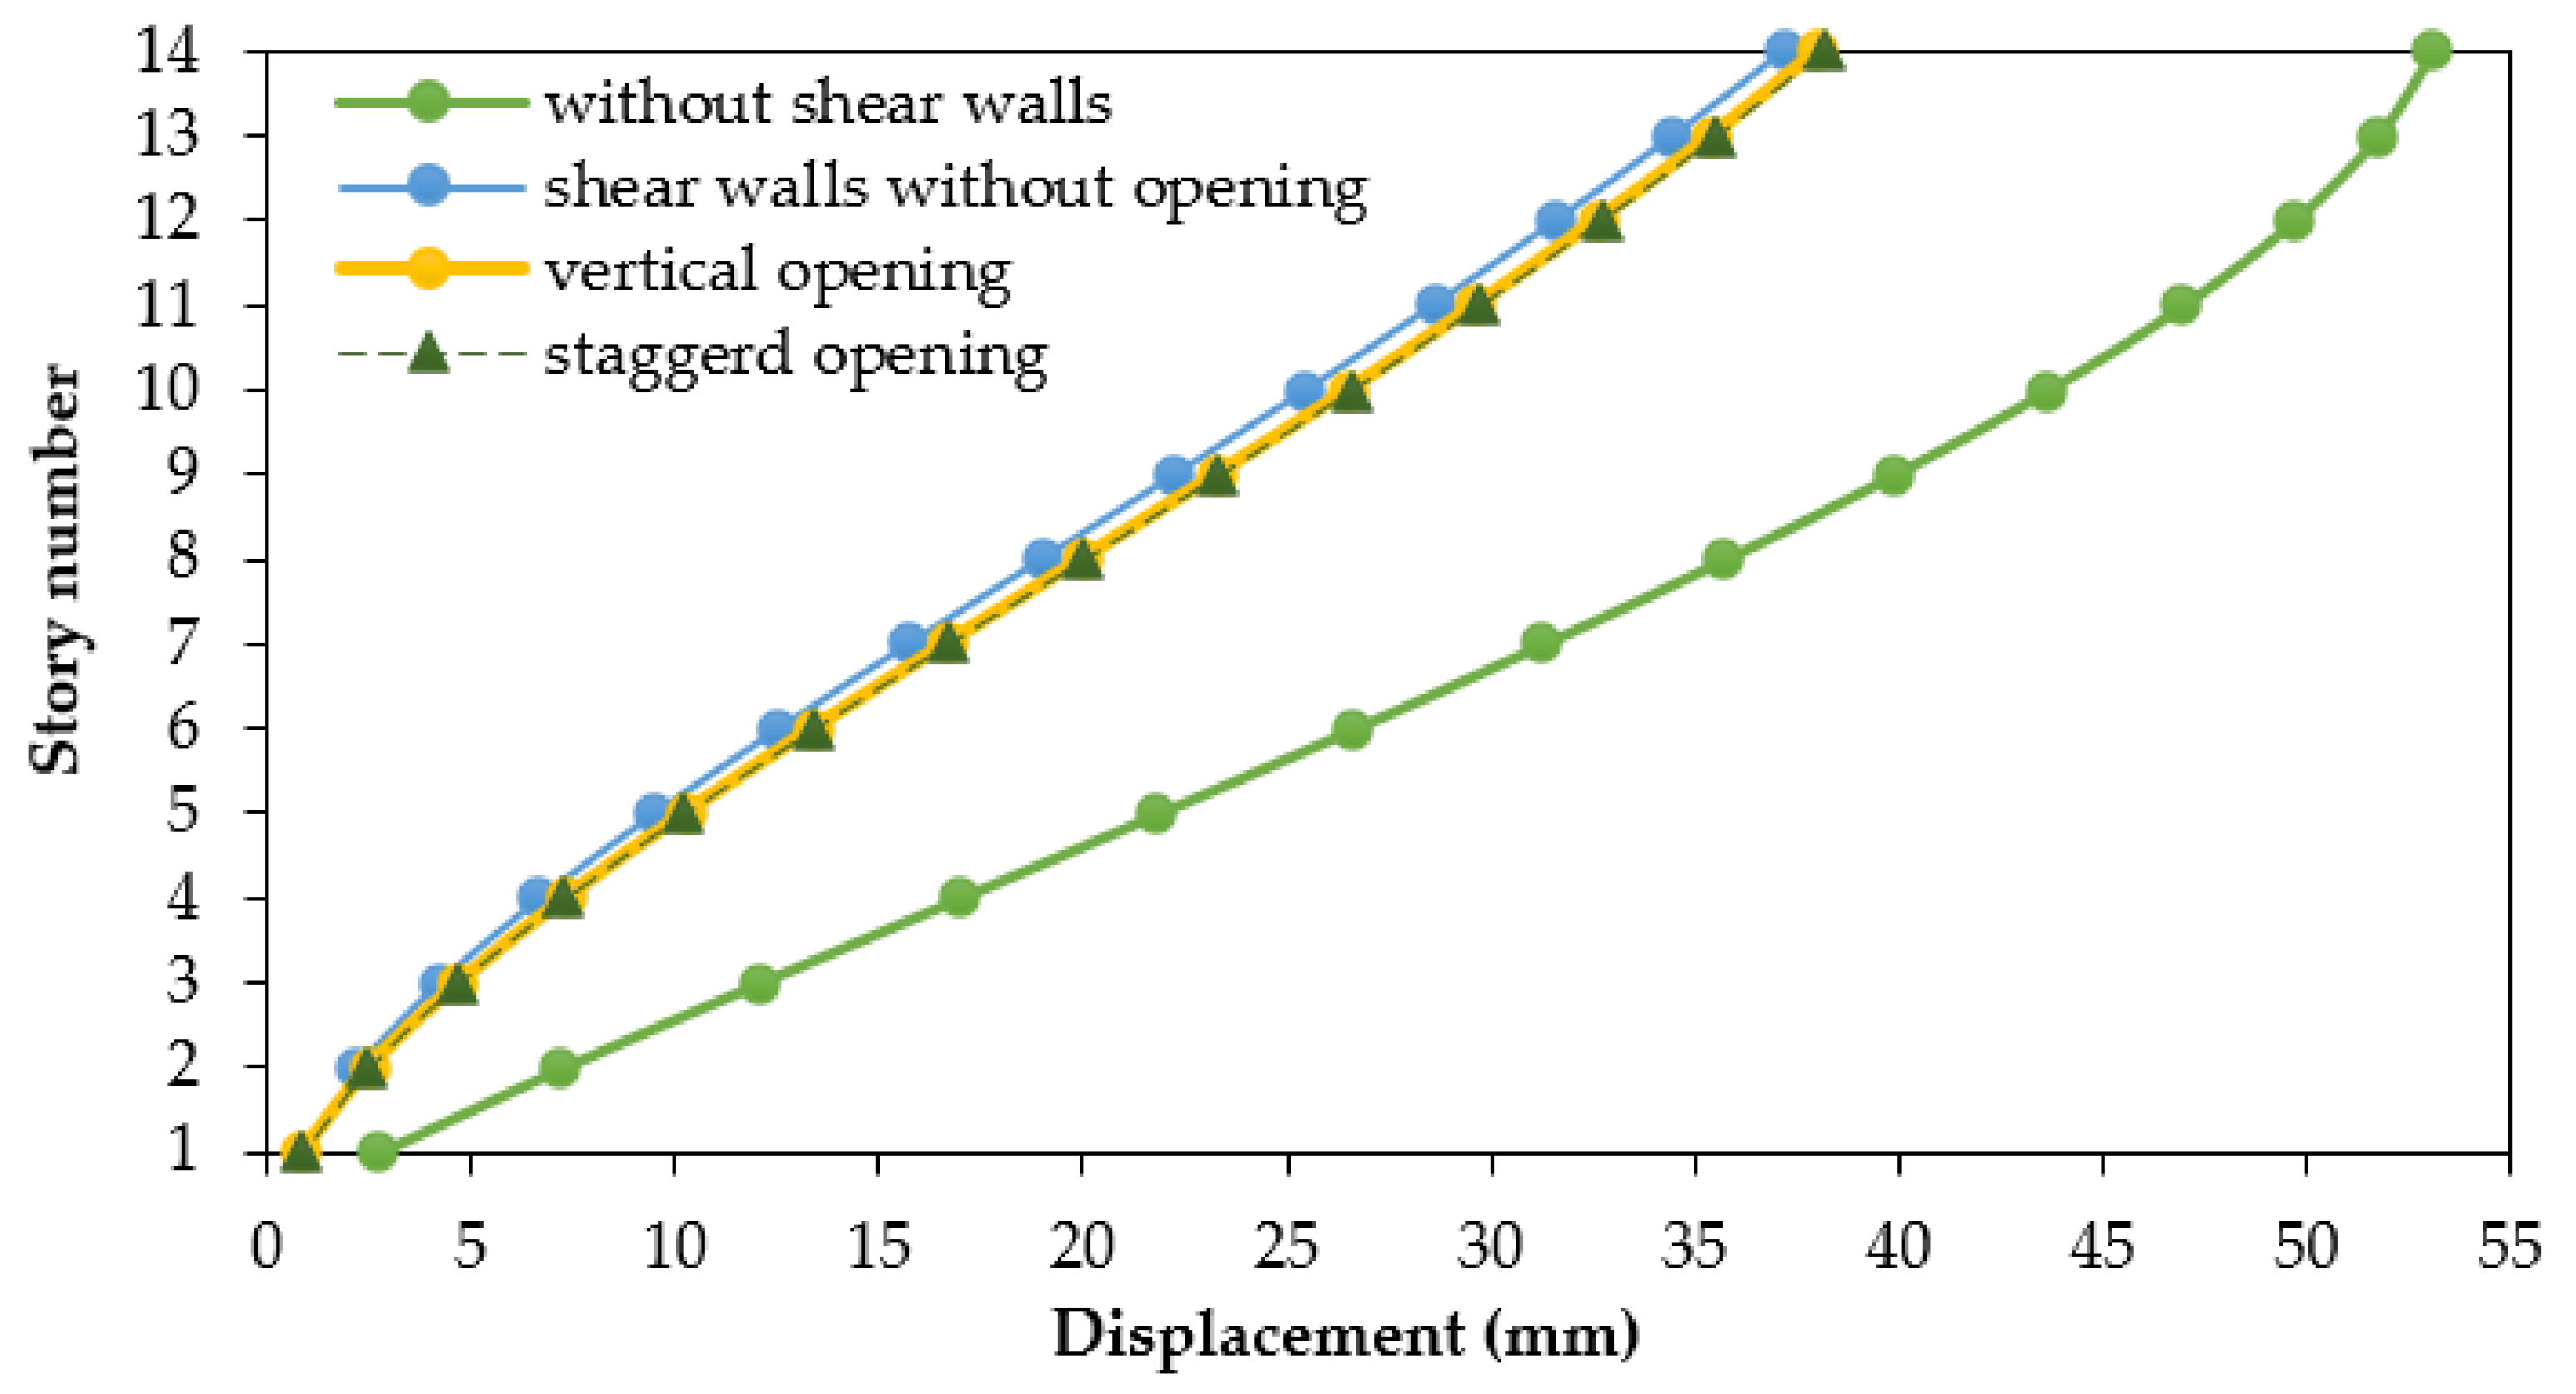
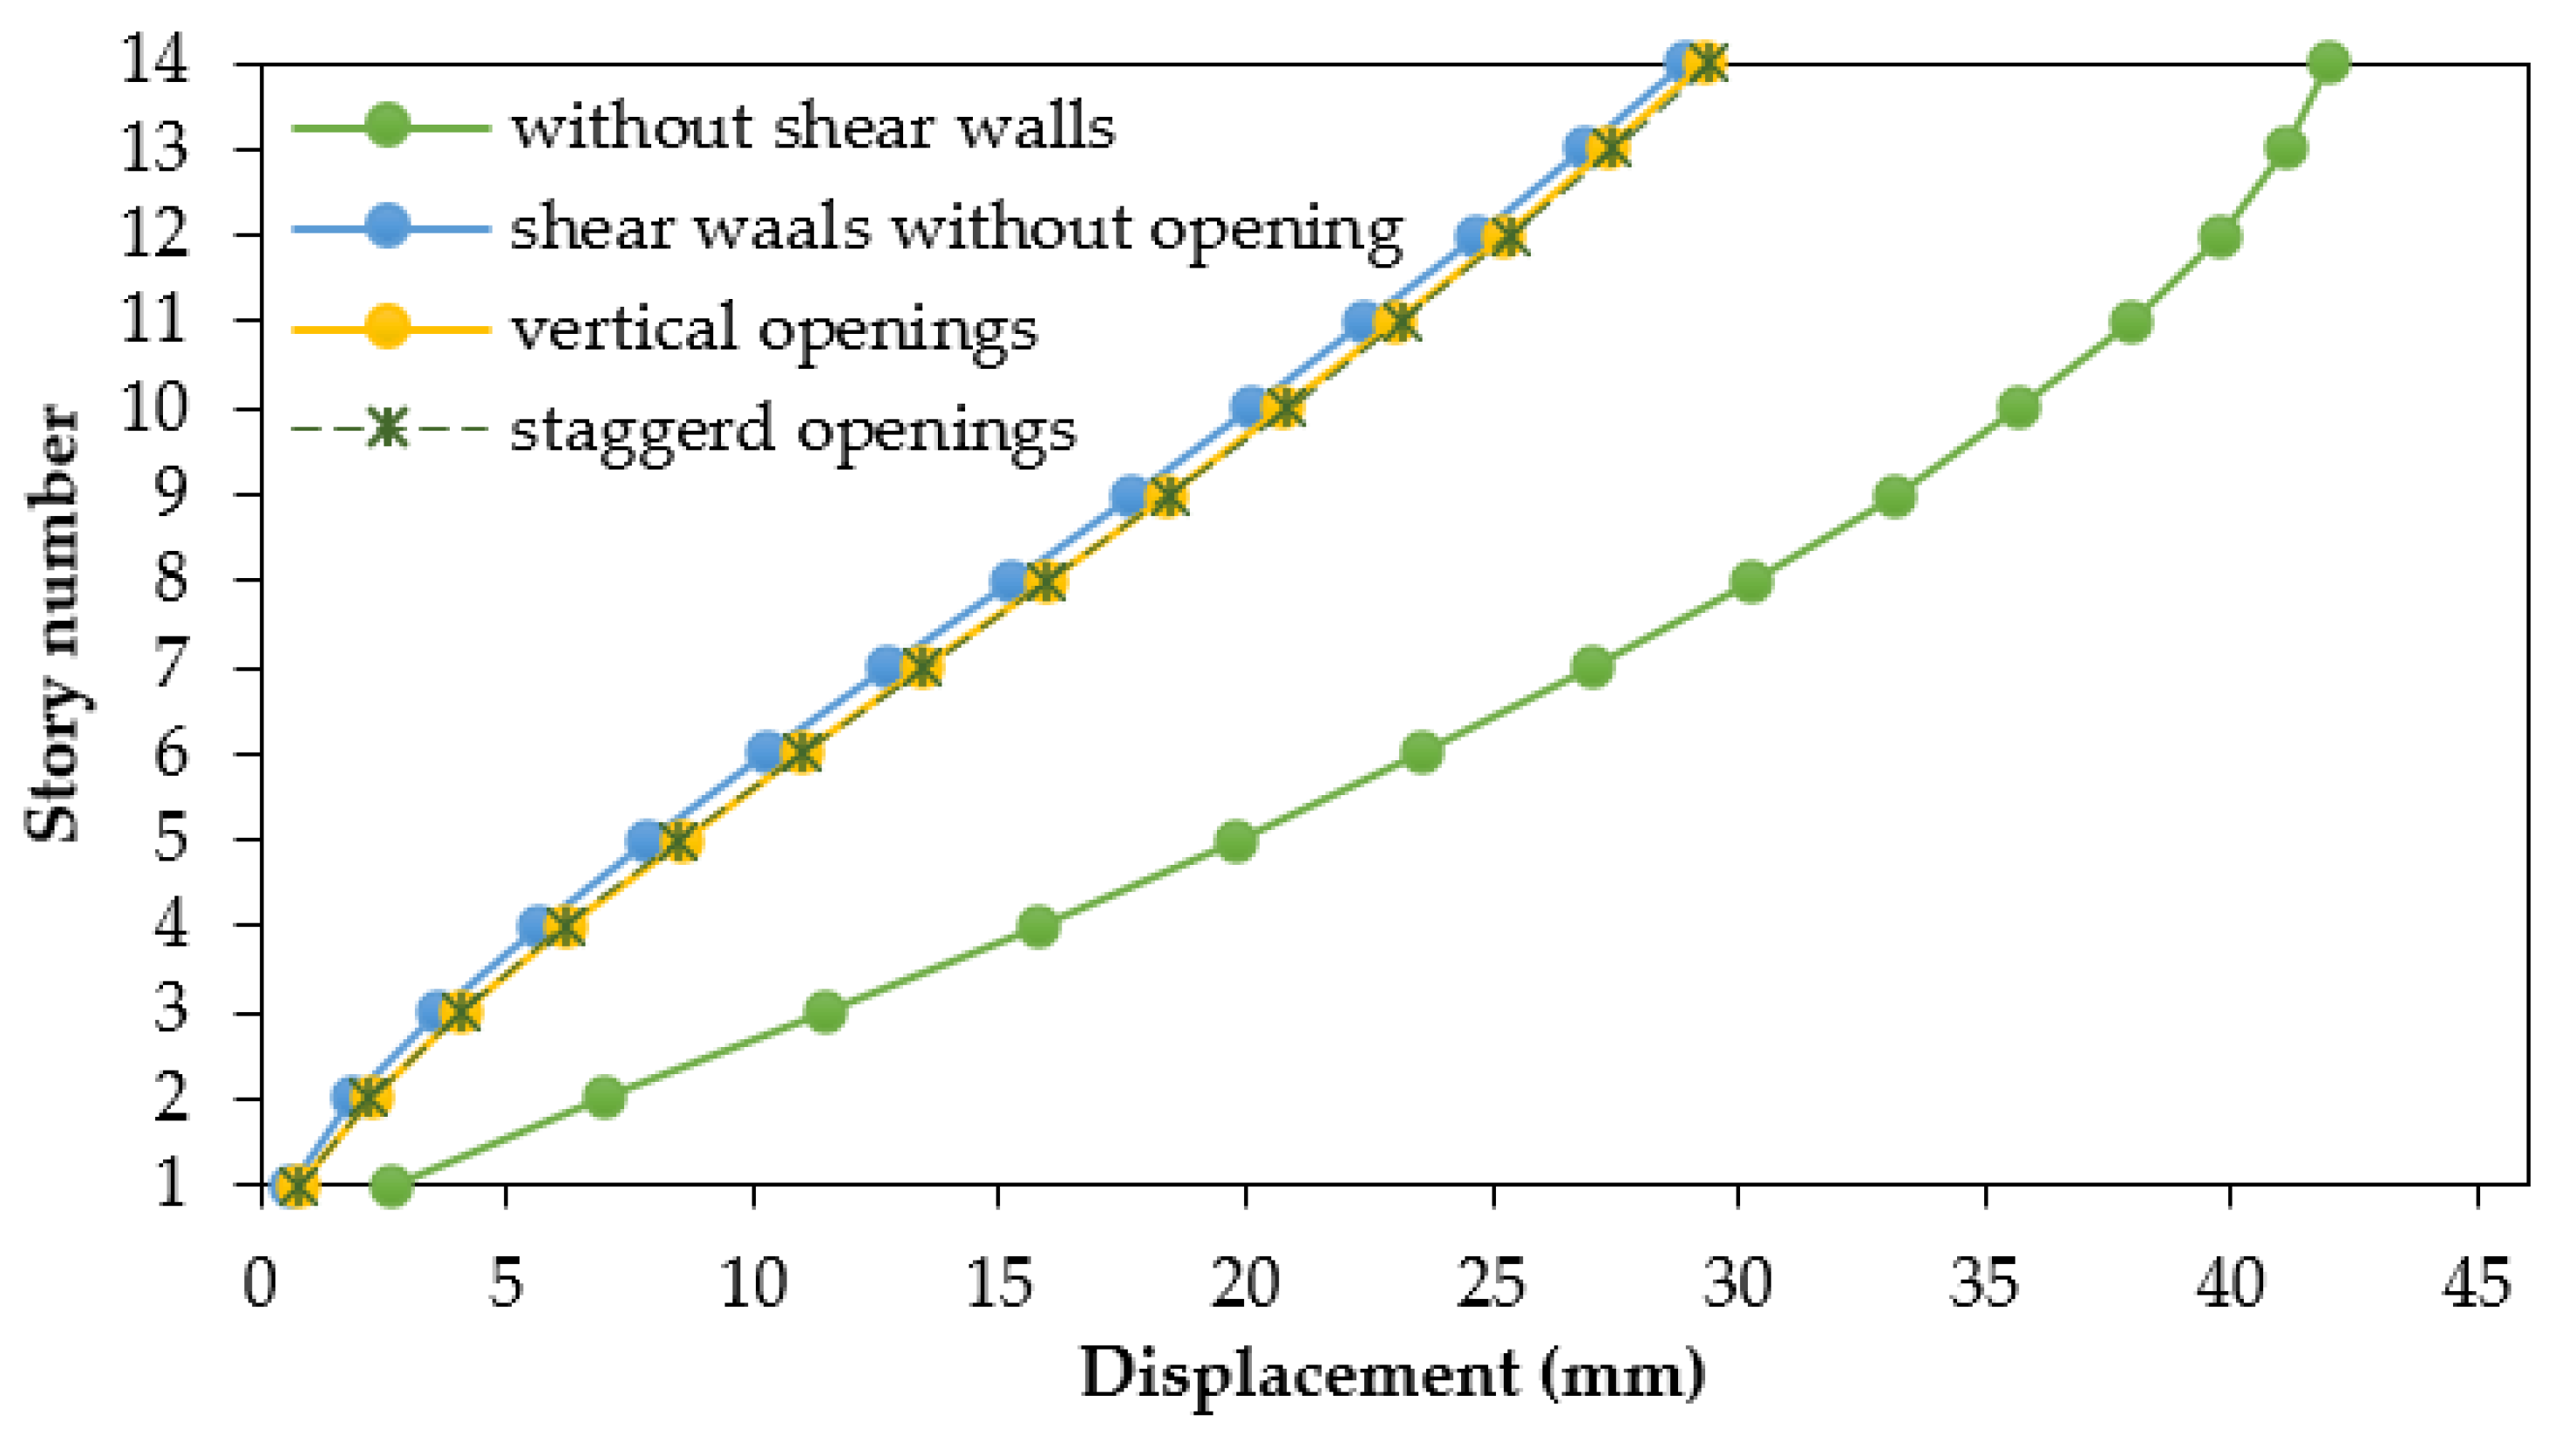
Buildings 12 01293 g008
Figure 9. Story displacement of the models, response spectrum analysis in the X-direction.
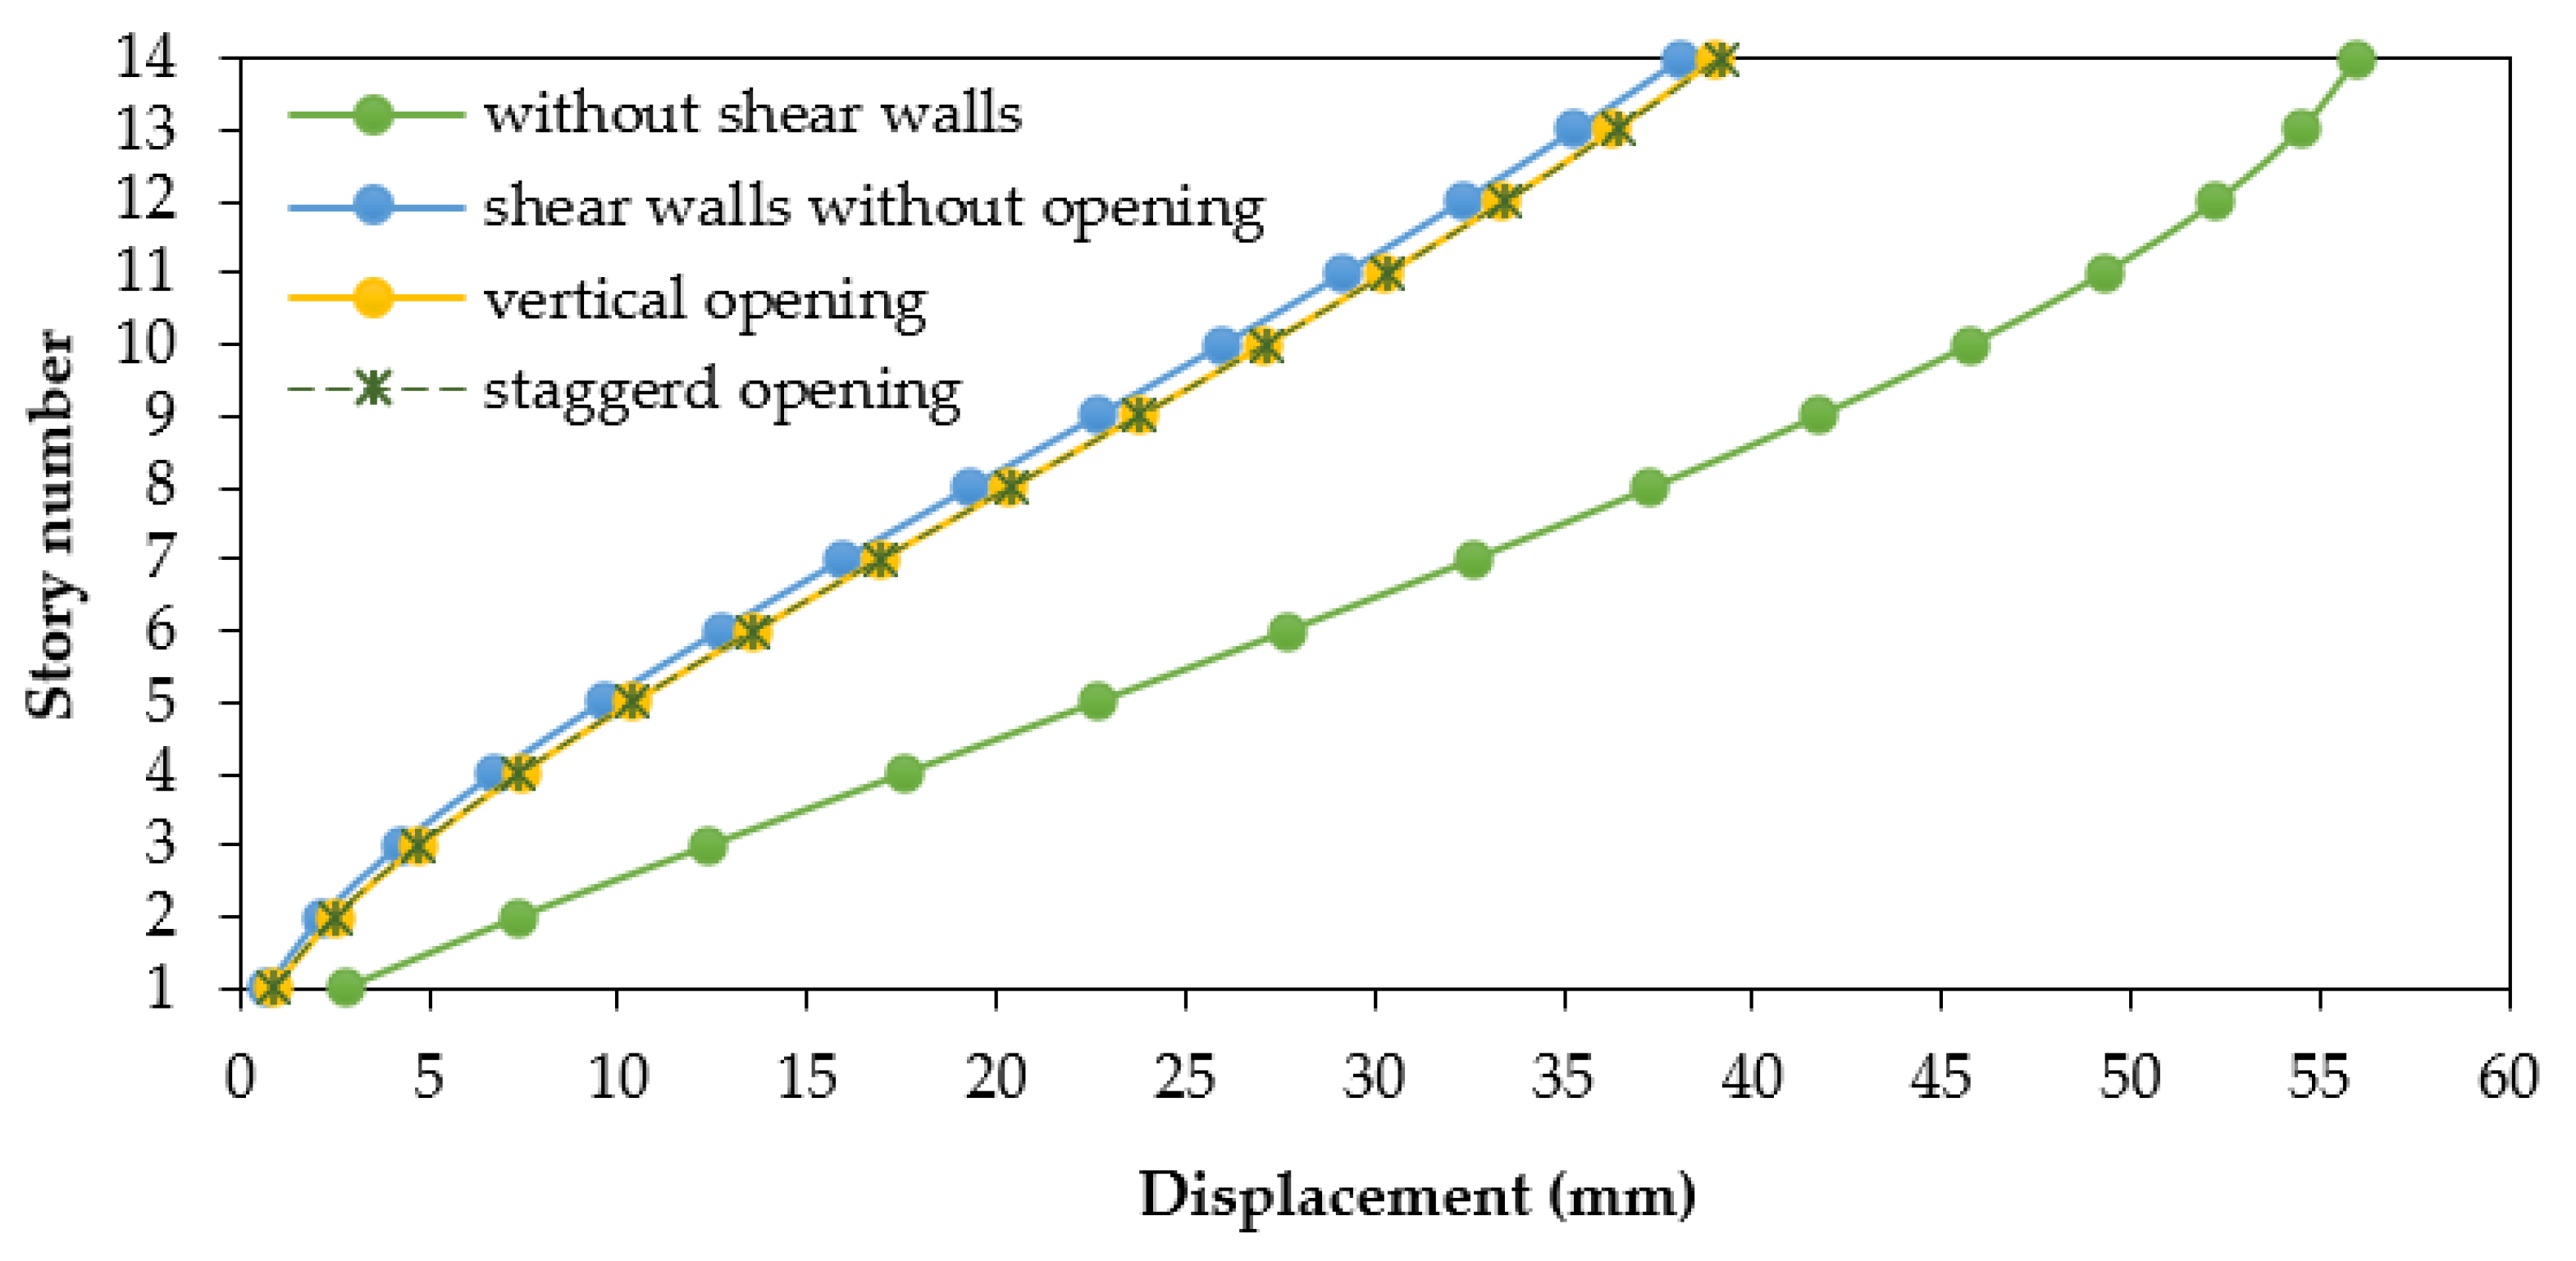
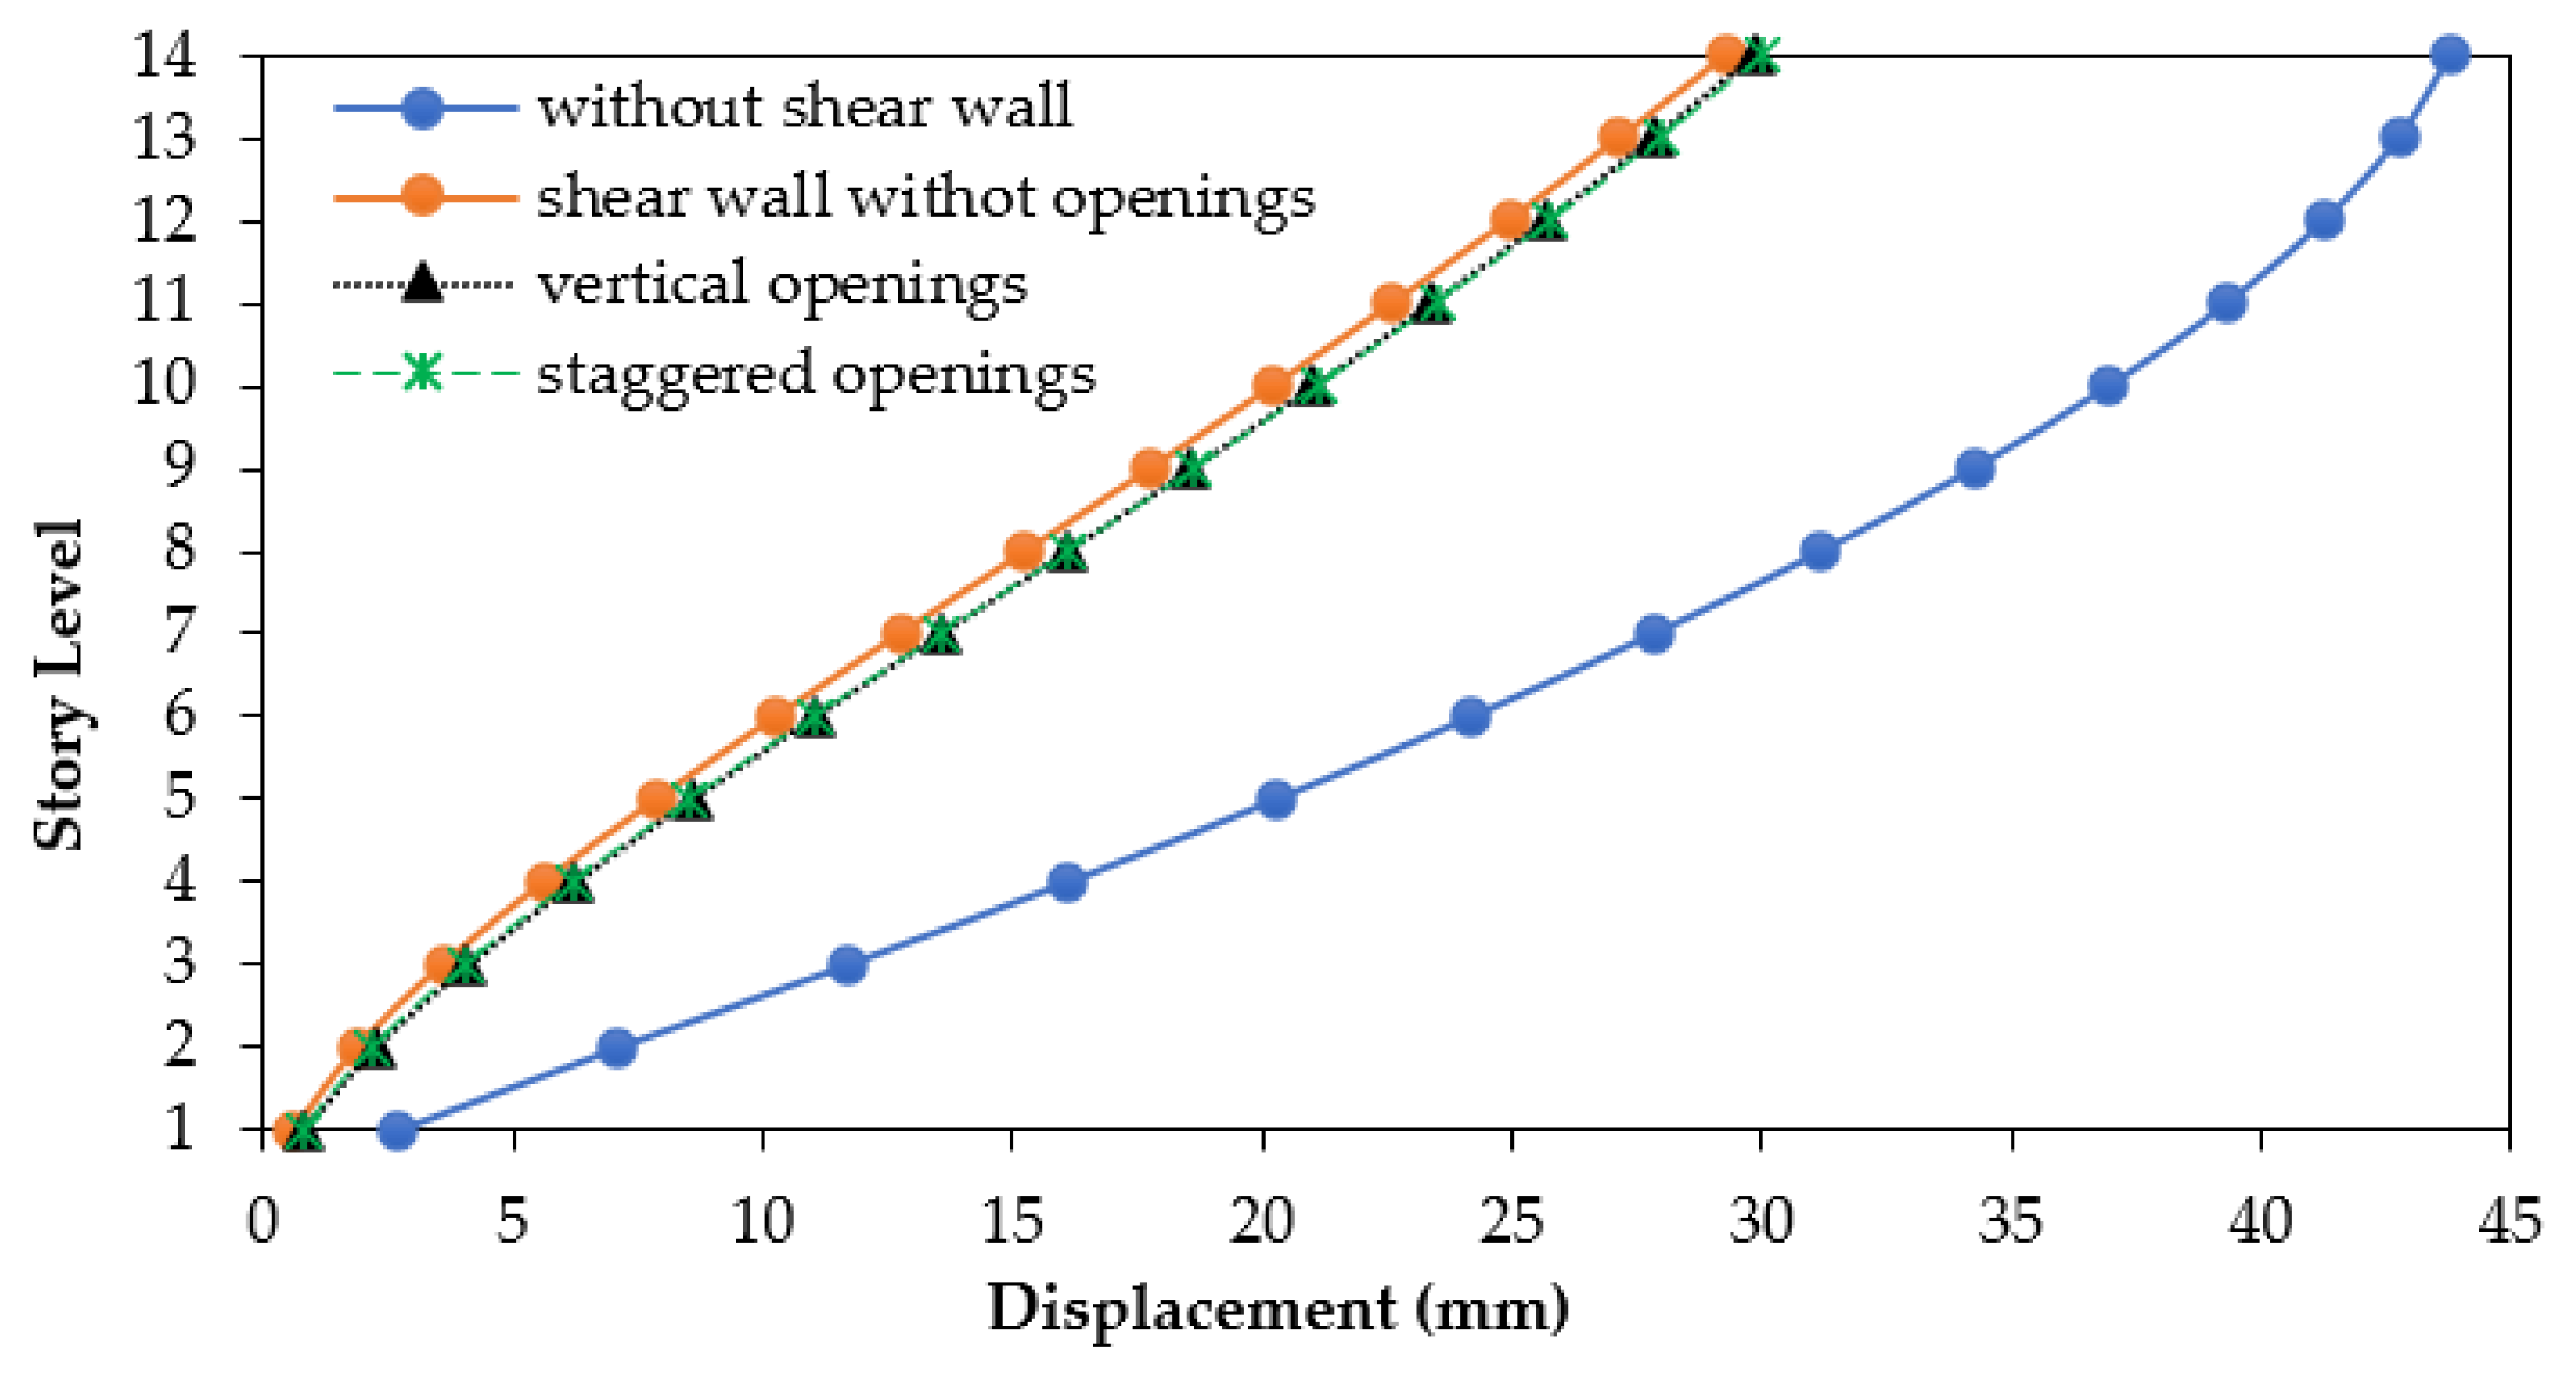
Buildings 12 01293 g009
Figure 10. Story displacement of the models, response spectrum analysis, Y-direction.
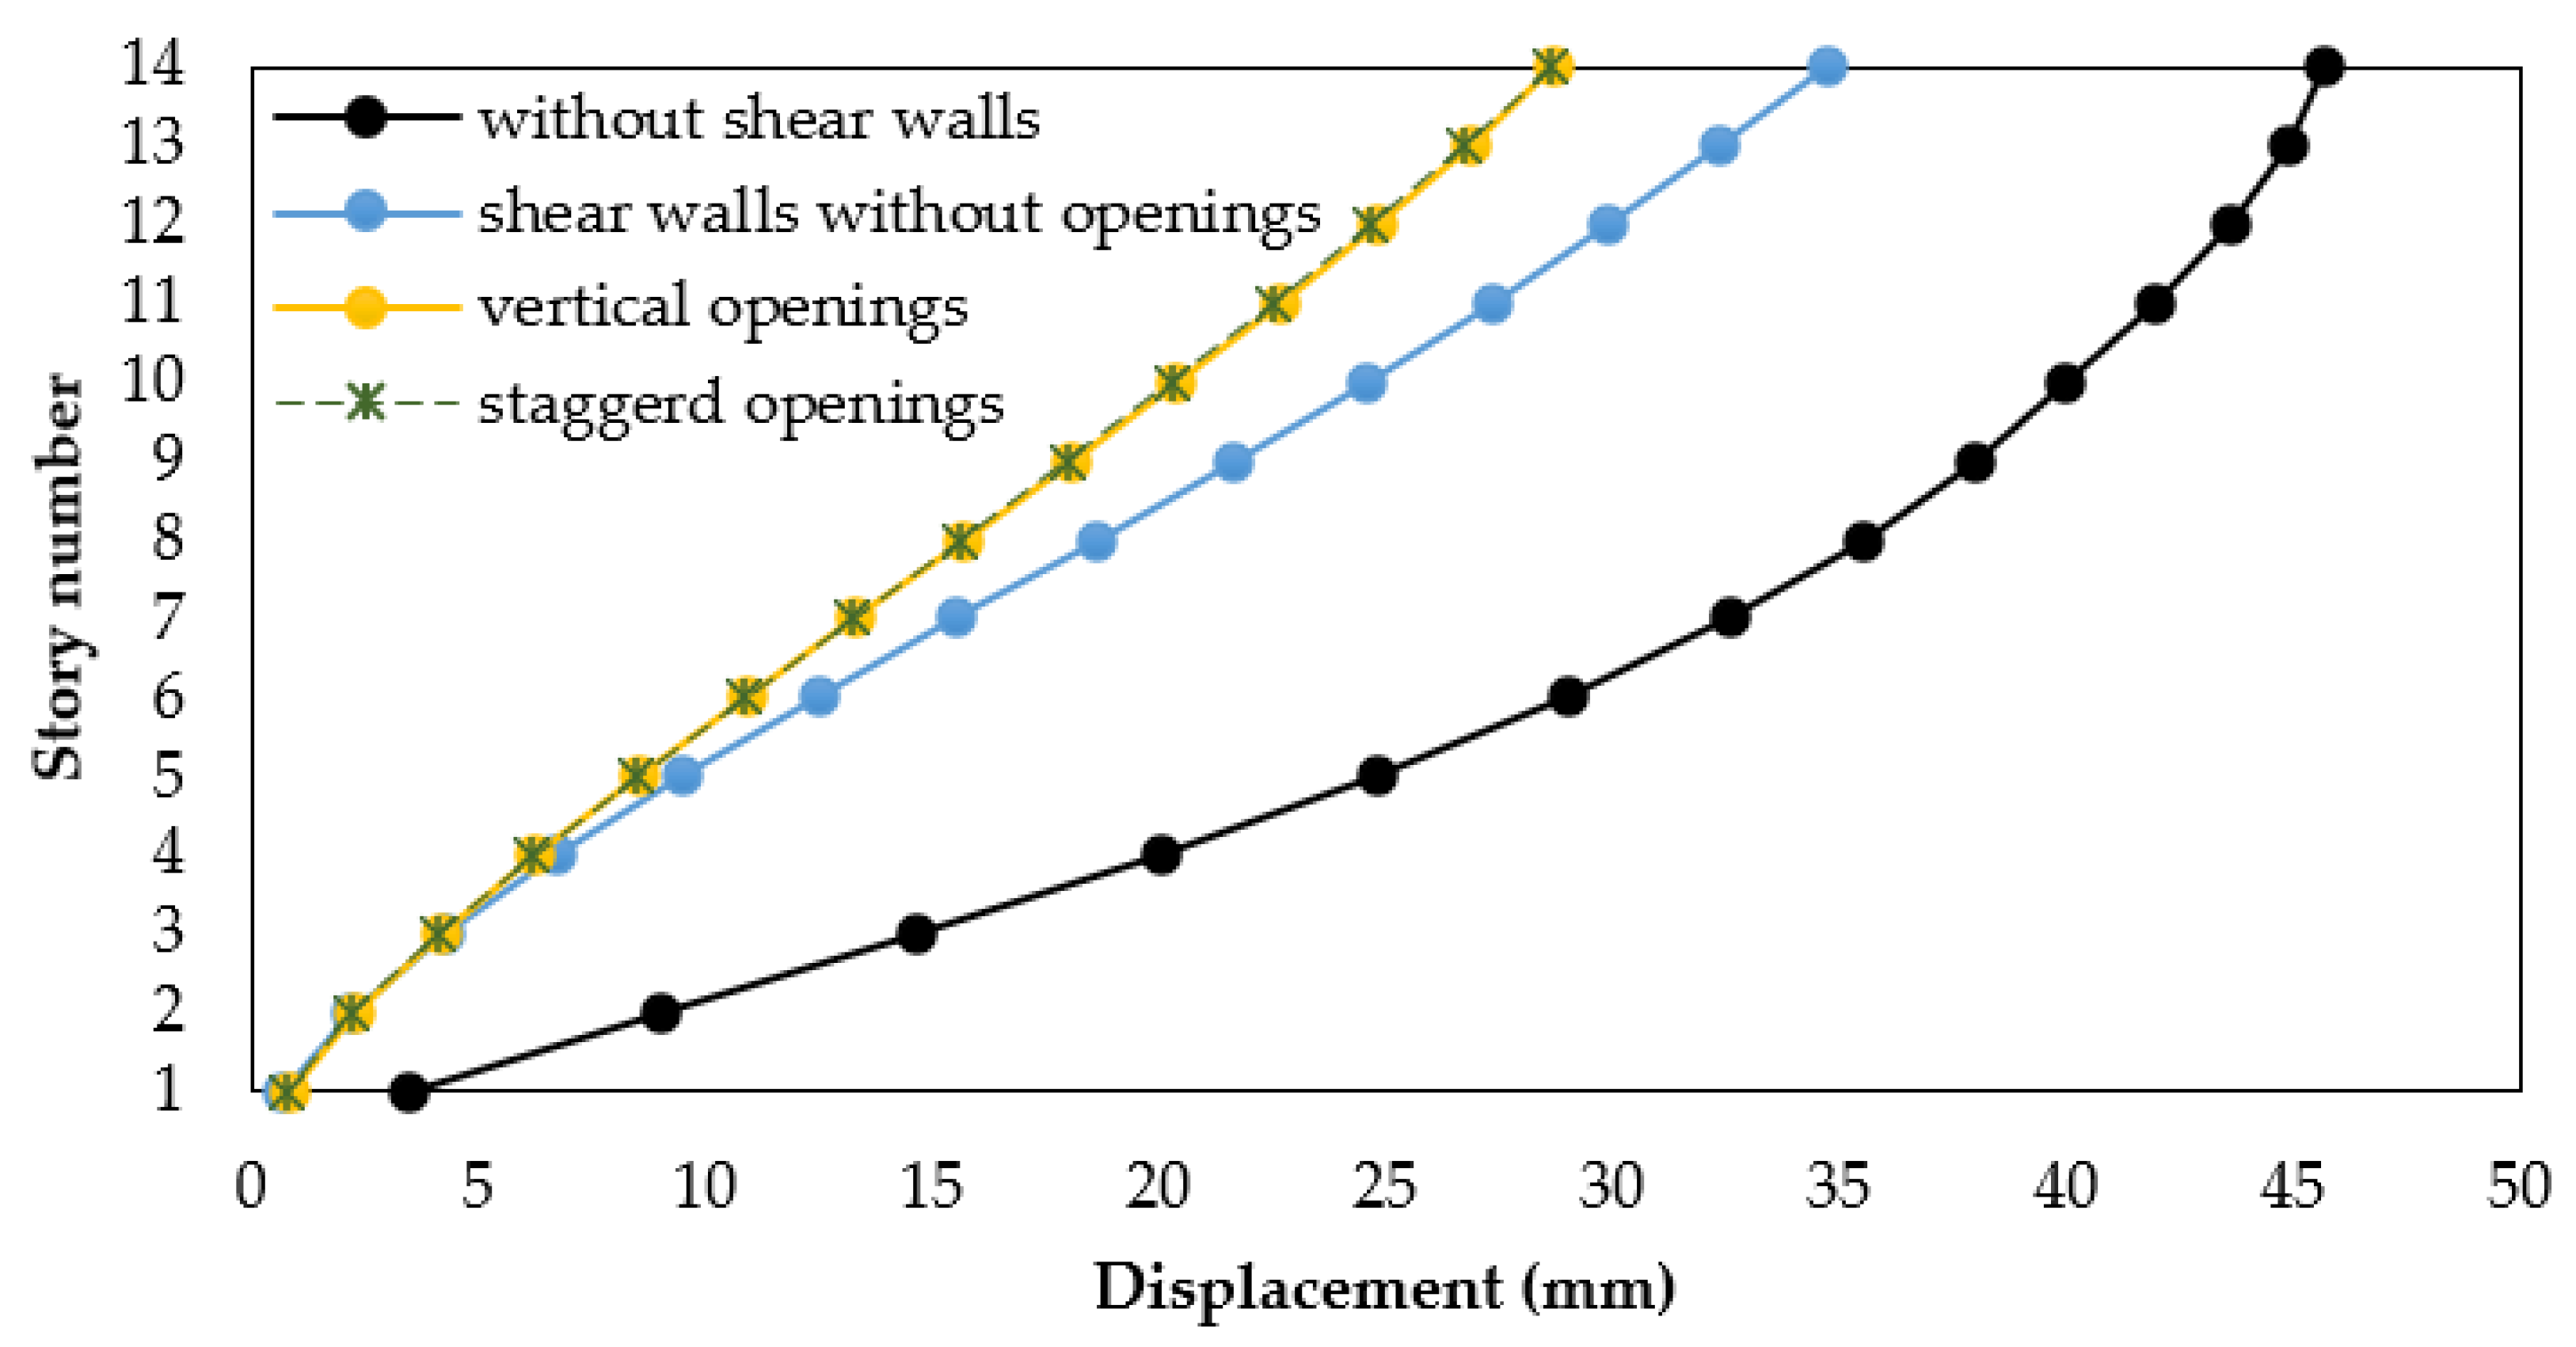
Buildings 12 01293 g010
Figure 11. Story displacement of the models, time history analysis, X-direction.
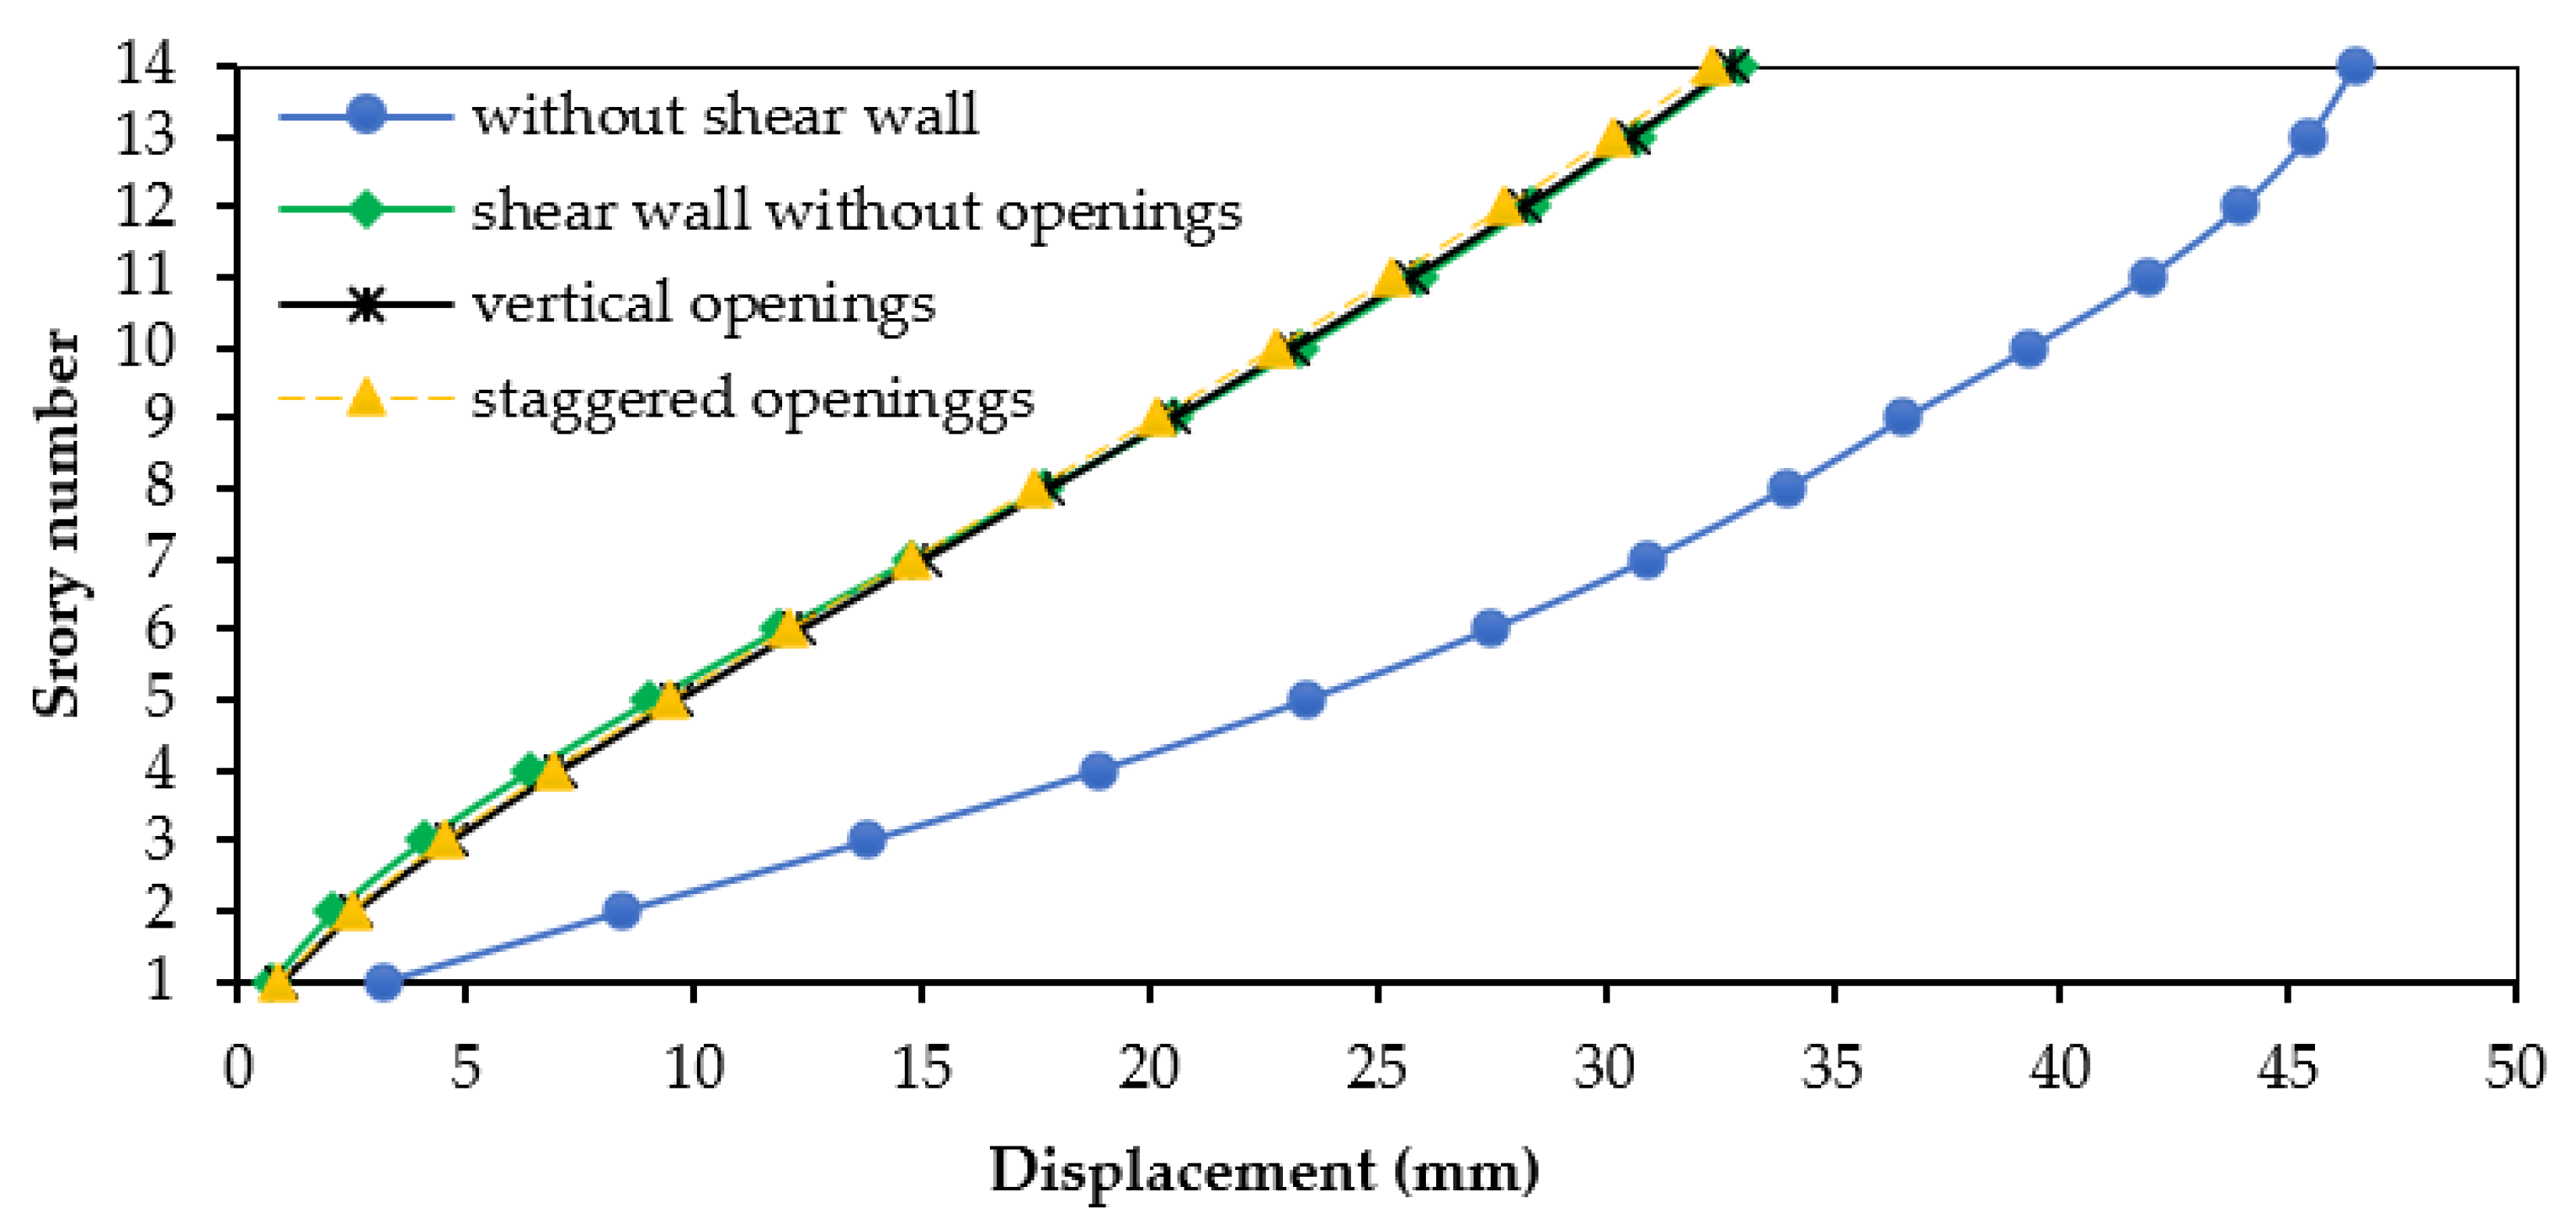
Buildings 12 01293 g011
Figure 12. Displacement of the models, time history analysis, Y-direction.
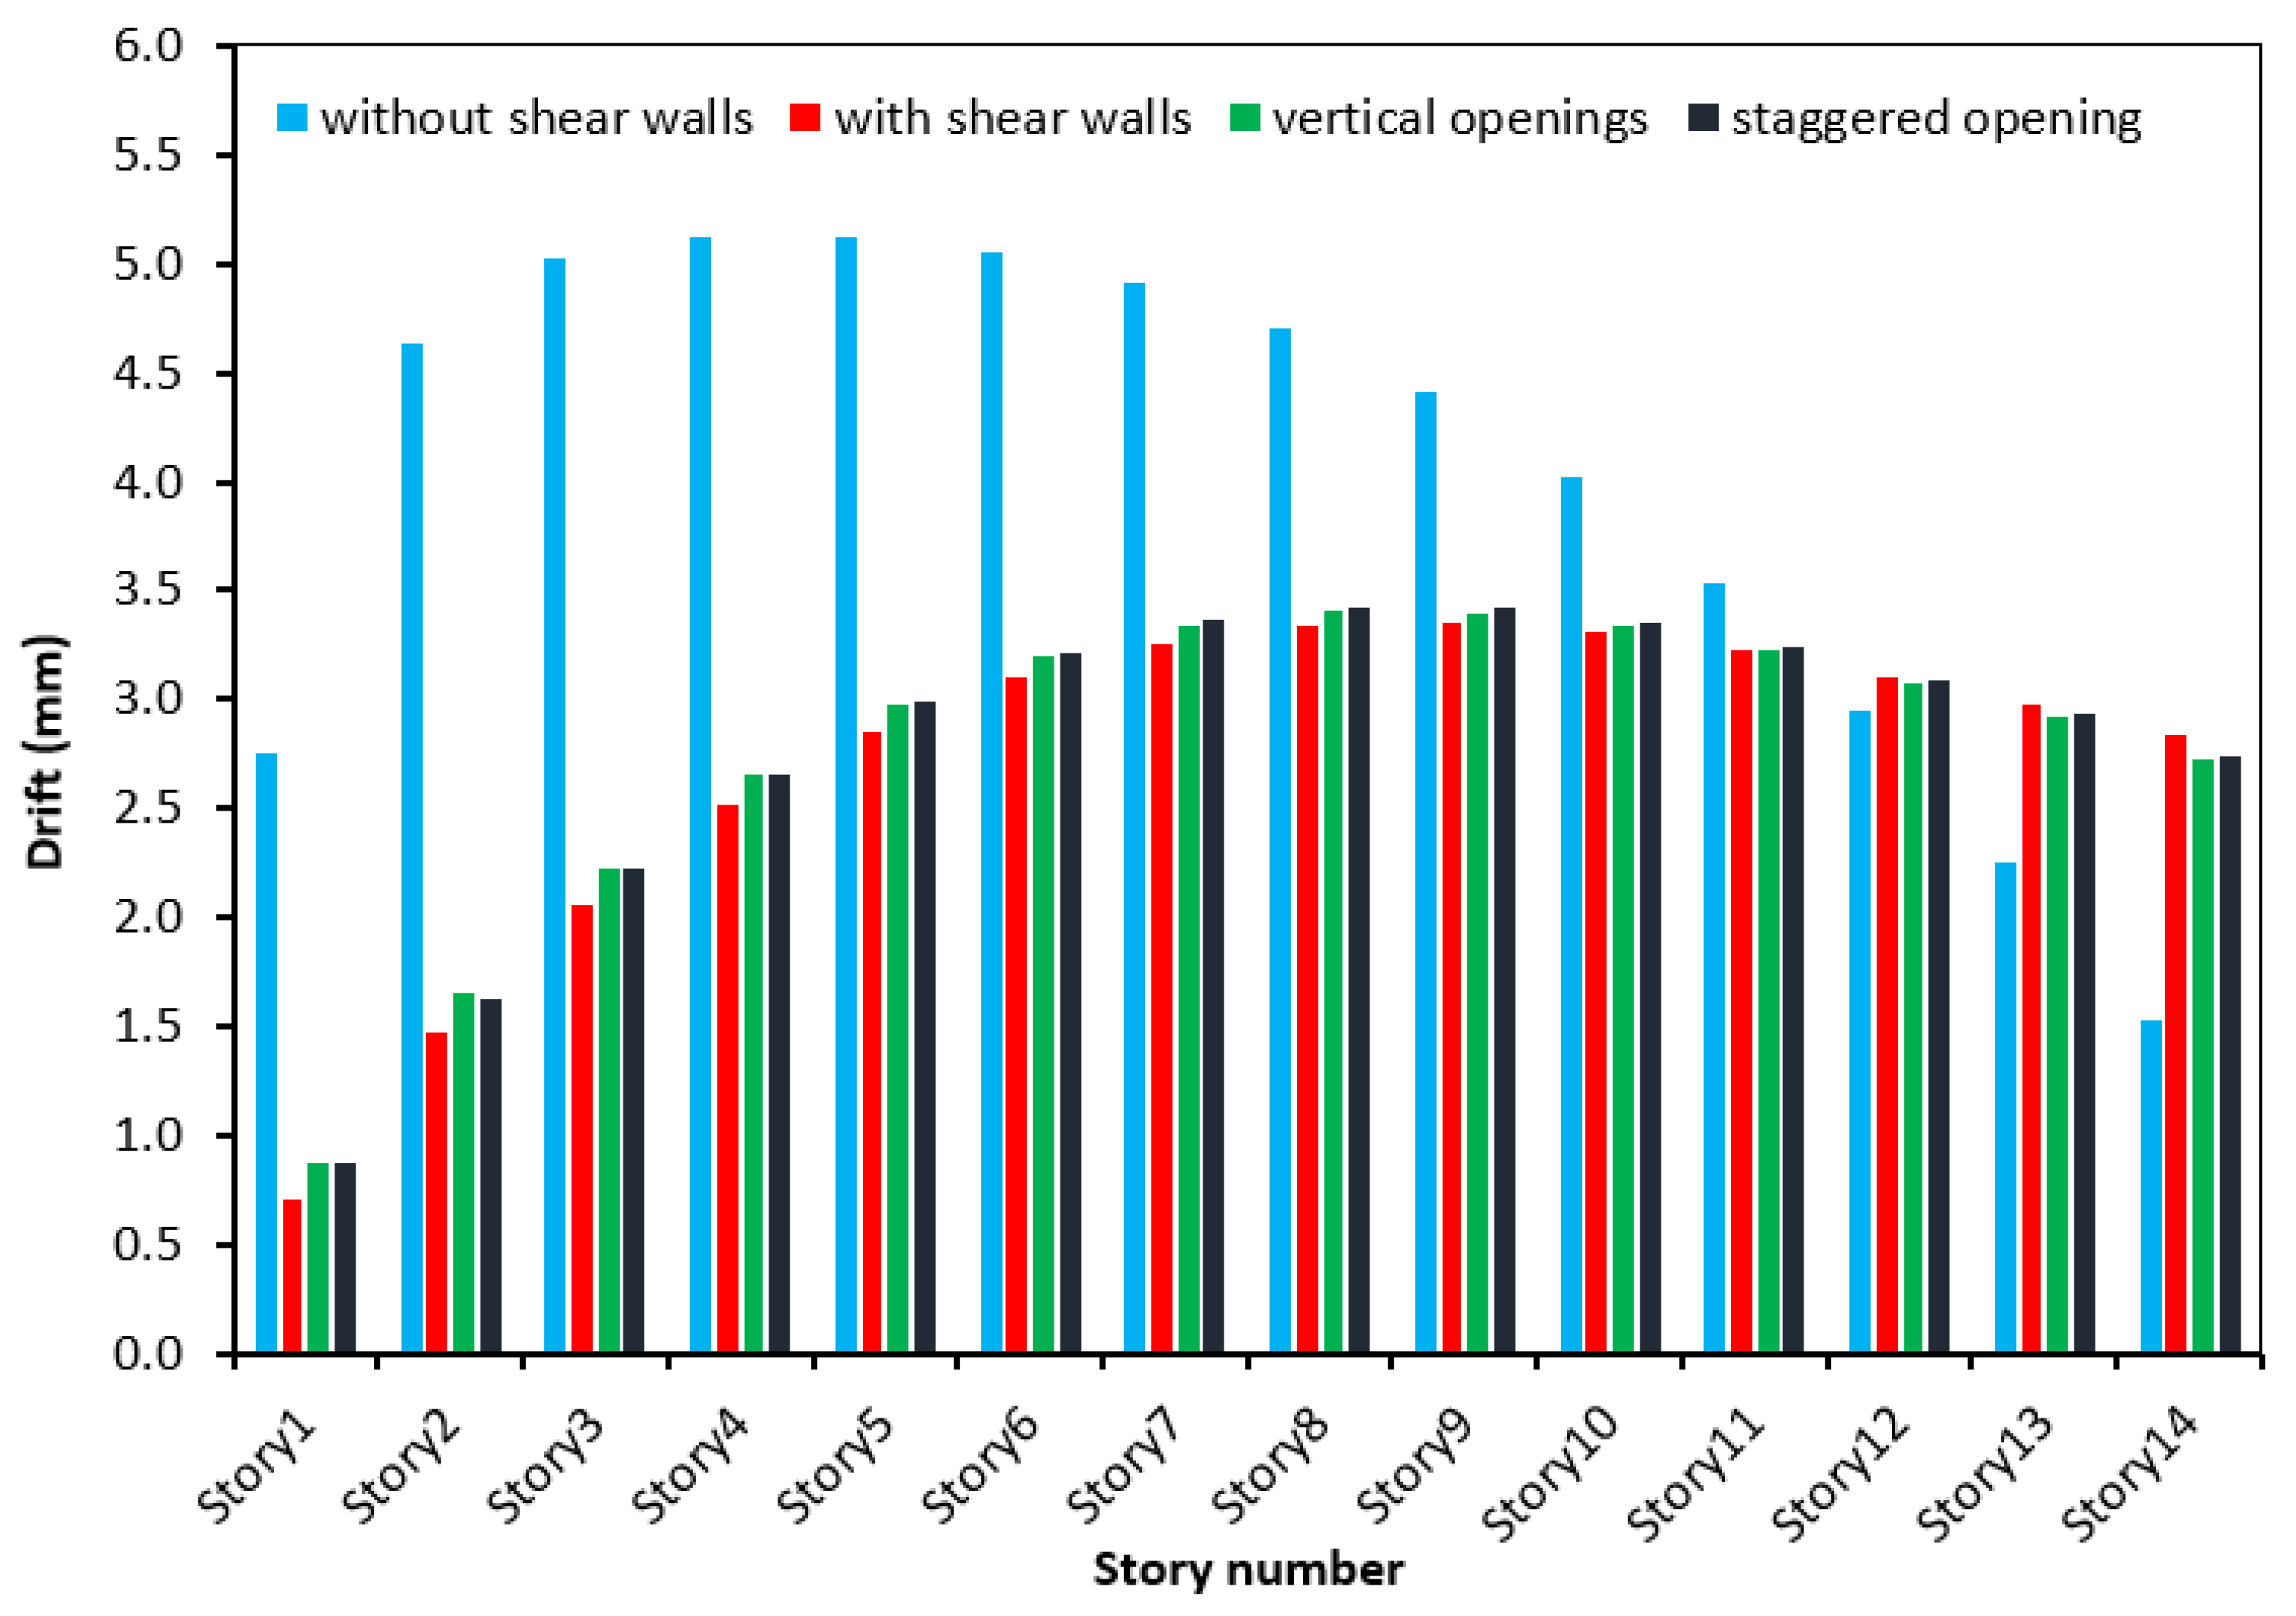
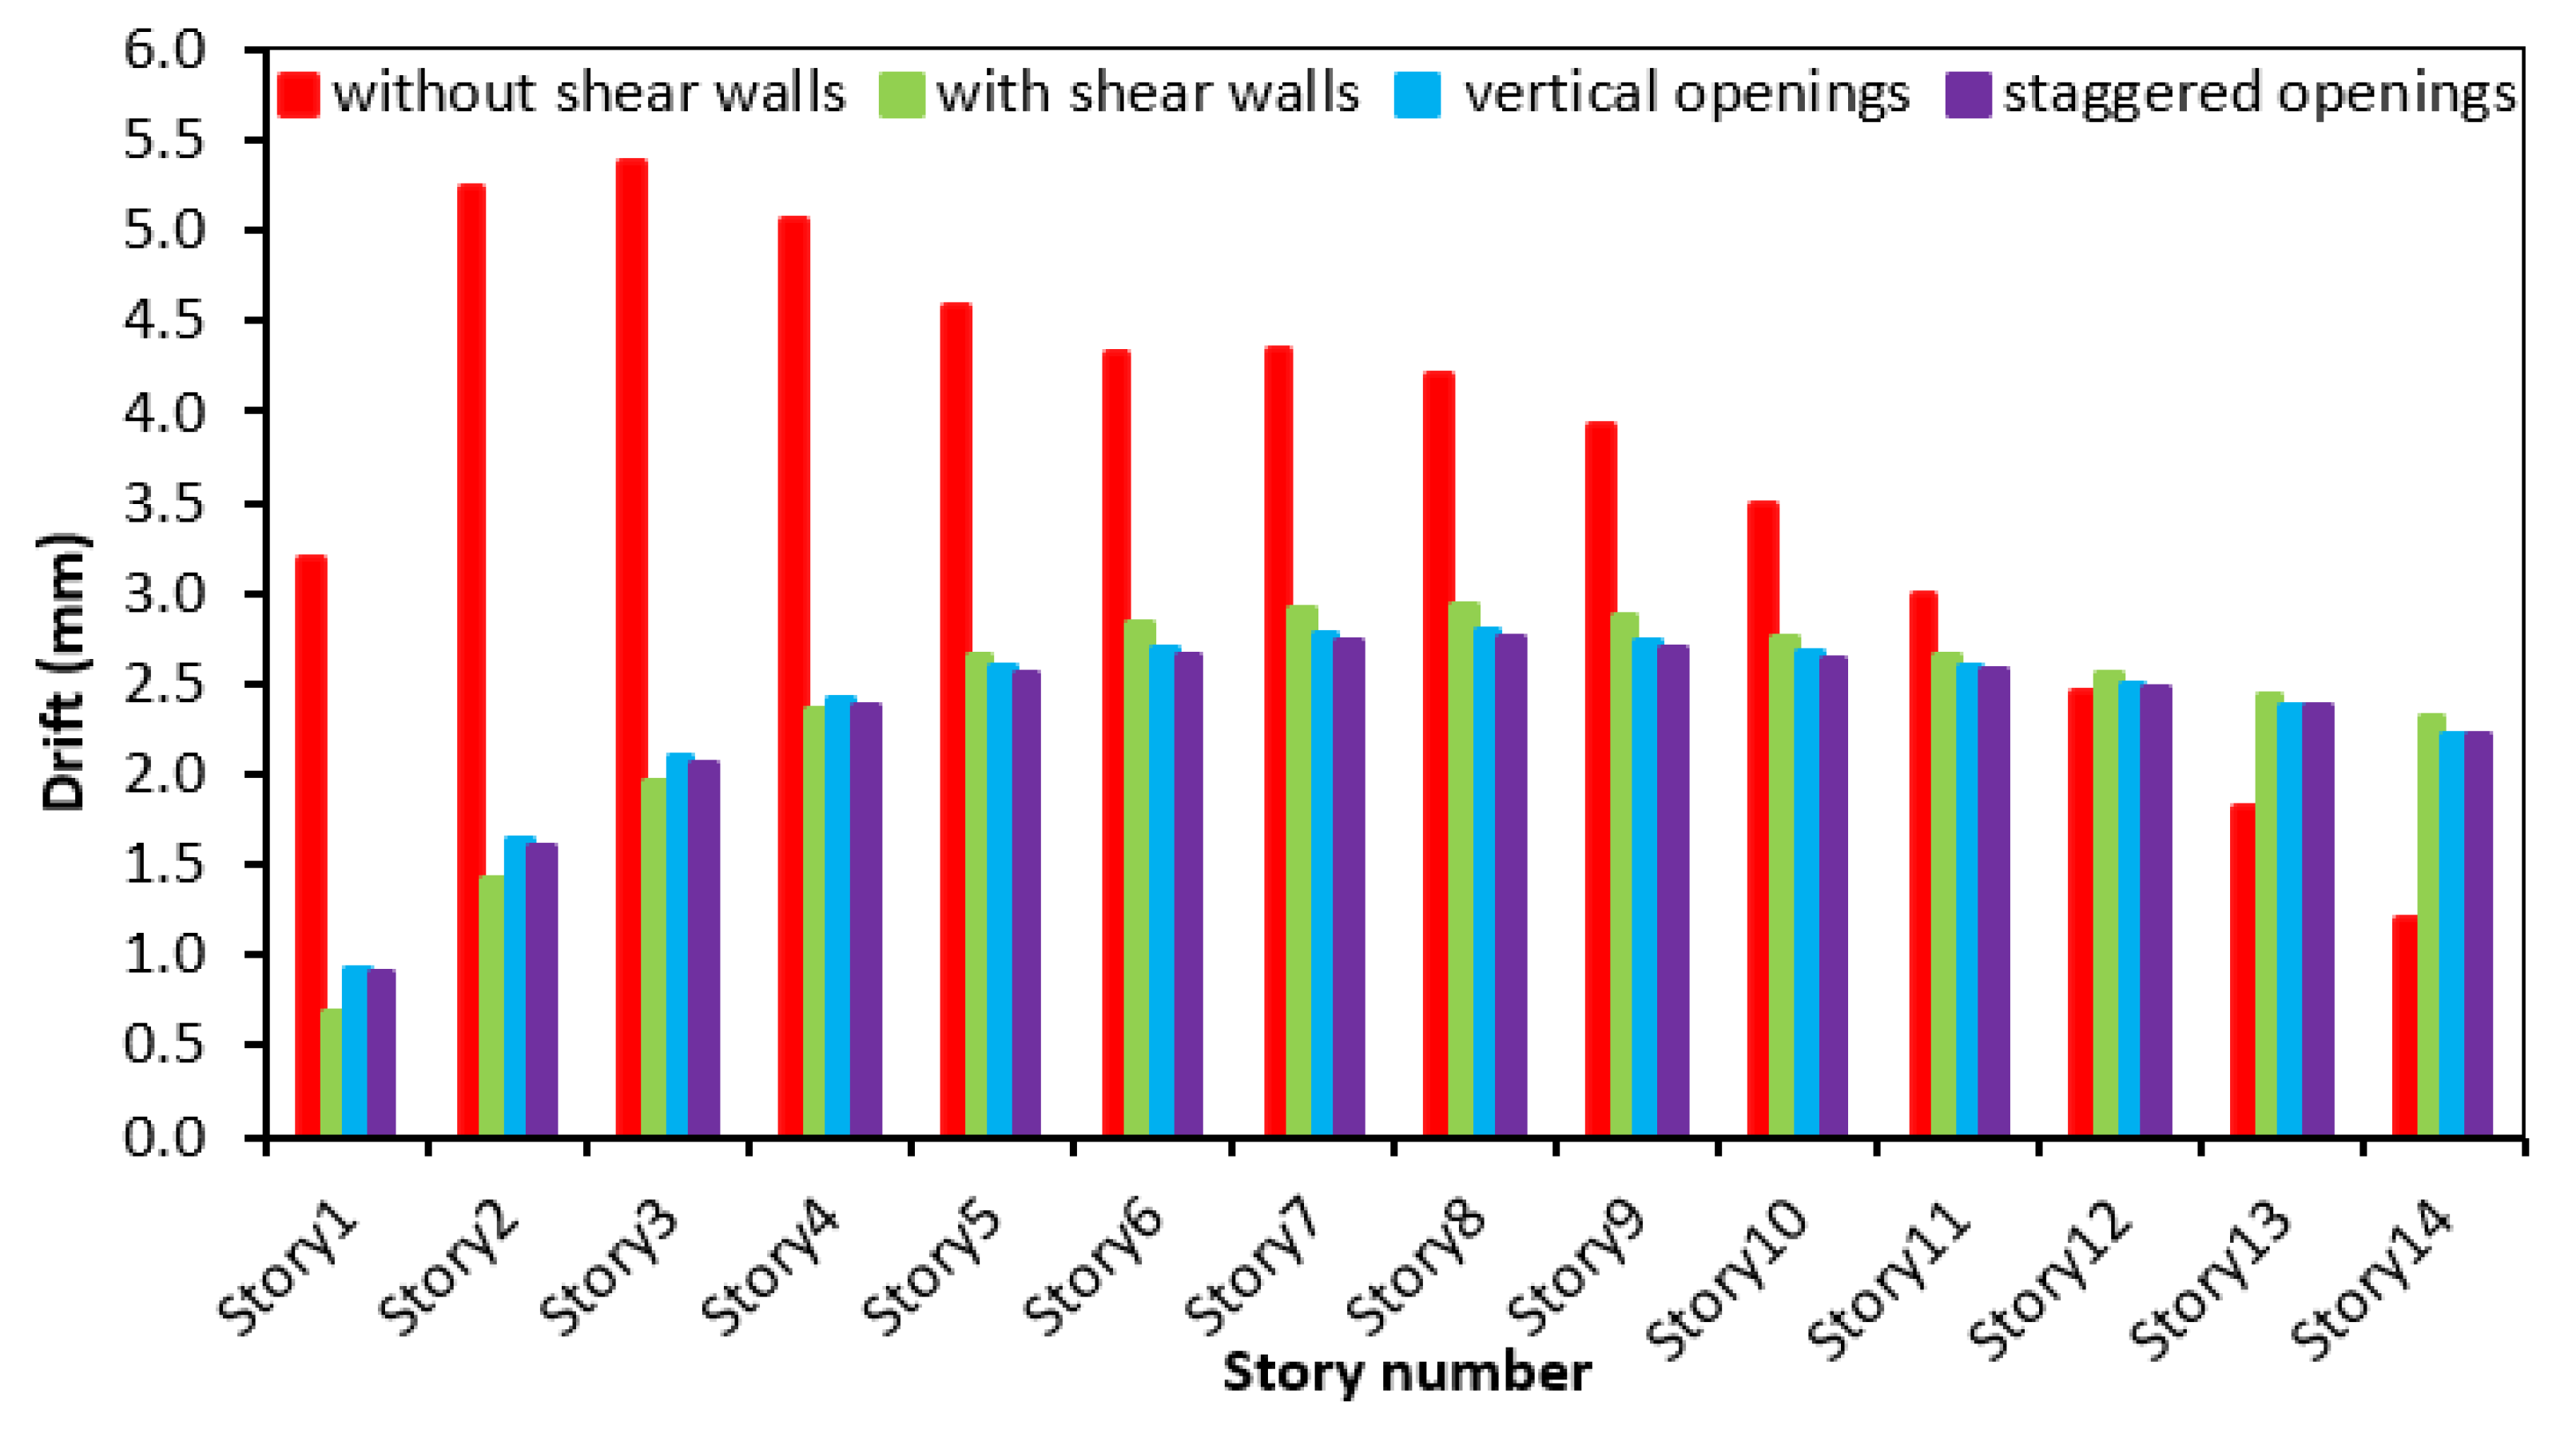
Buildings 12 01293 g012
Figure 13. Story drift of the models: static analysis and X-direction analysis.
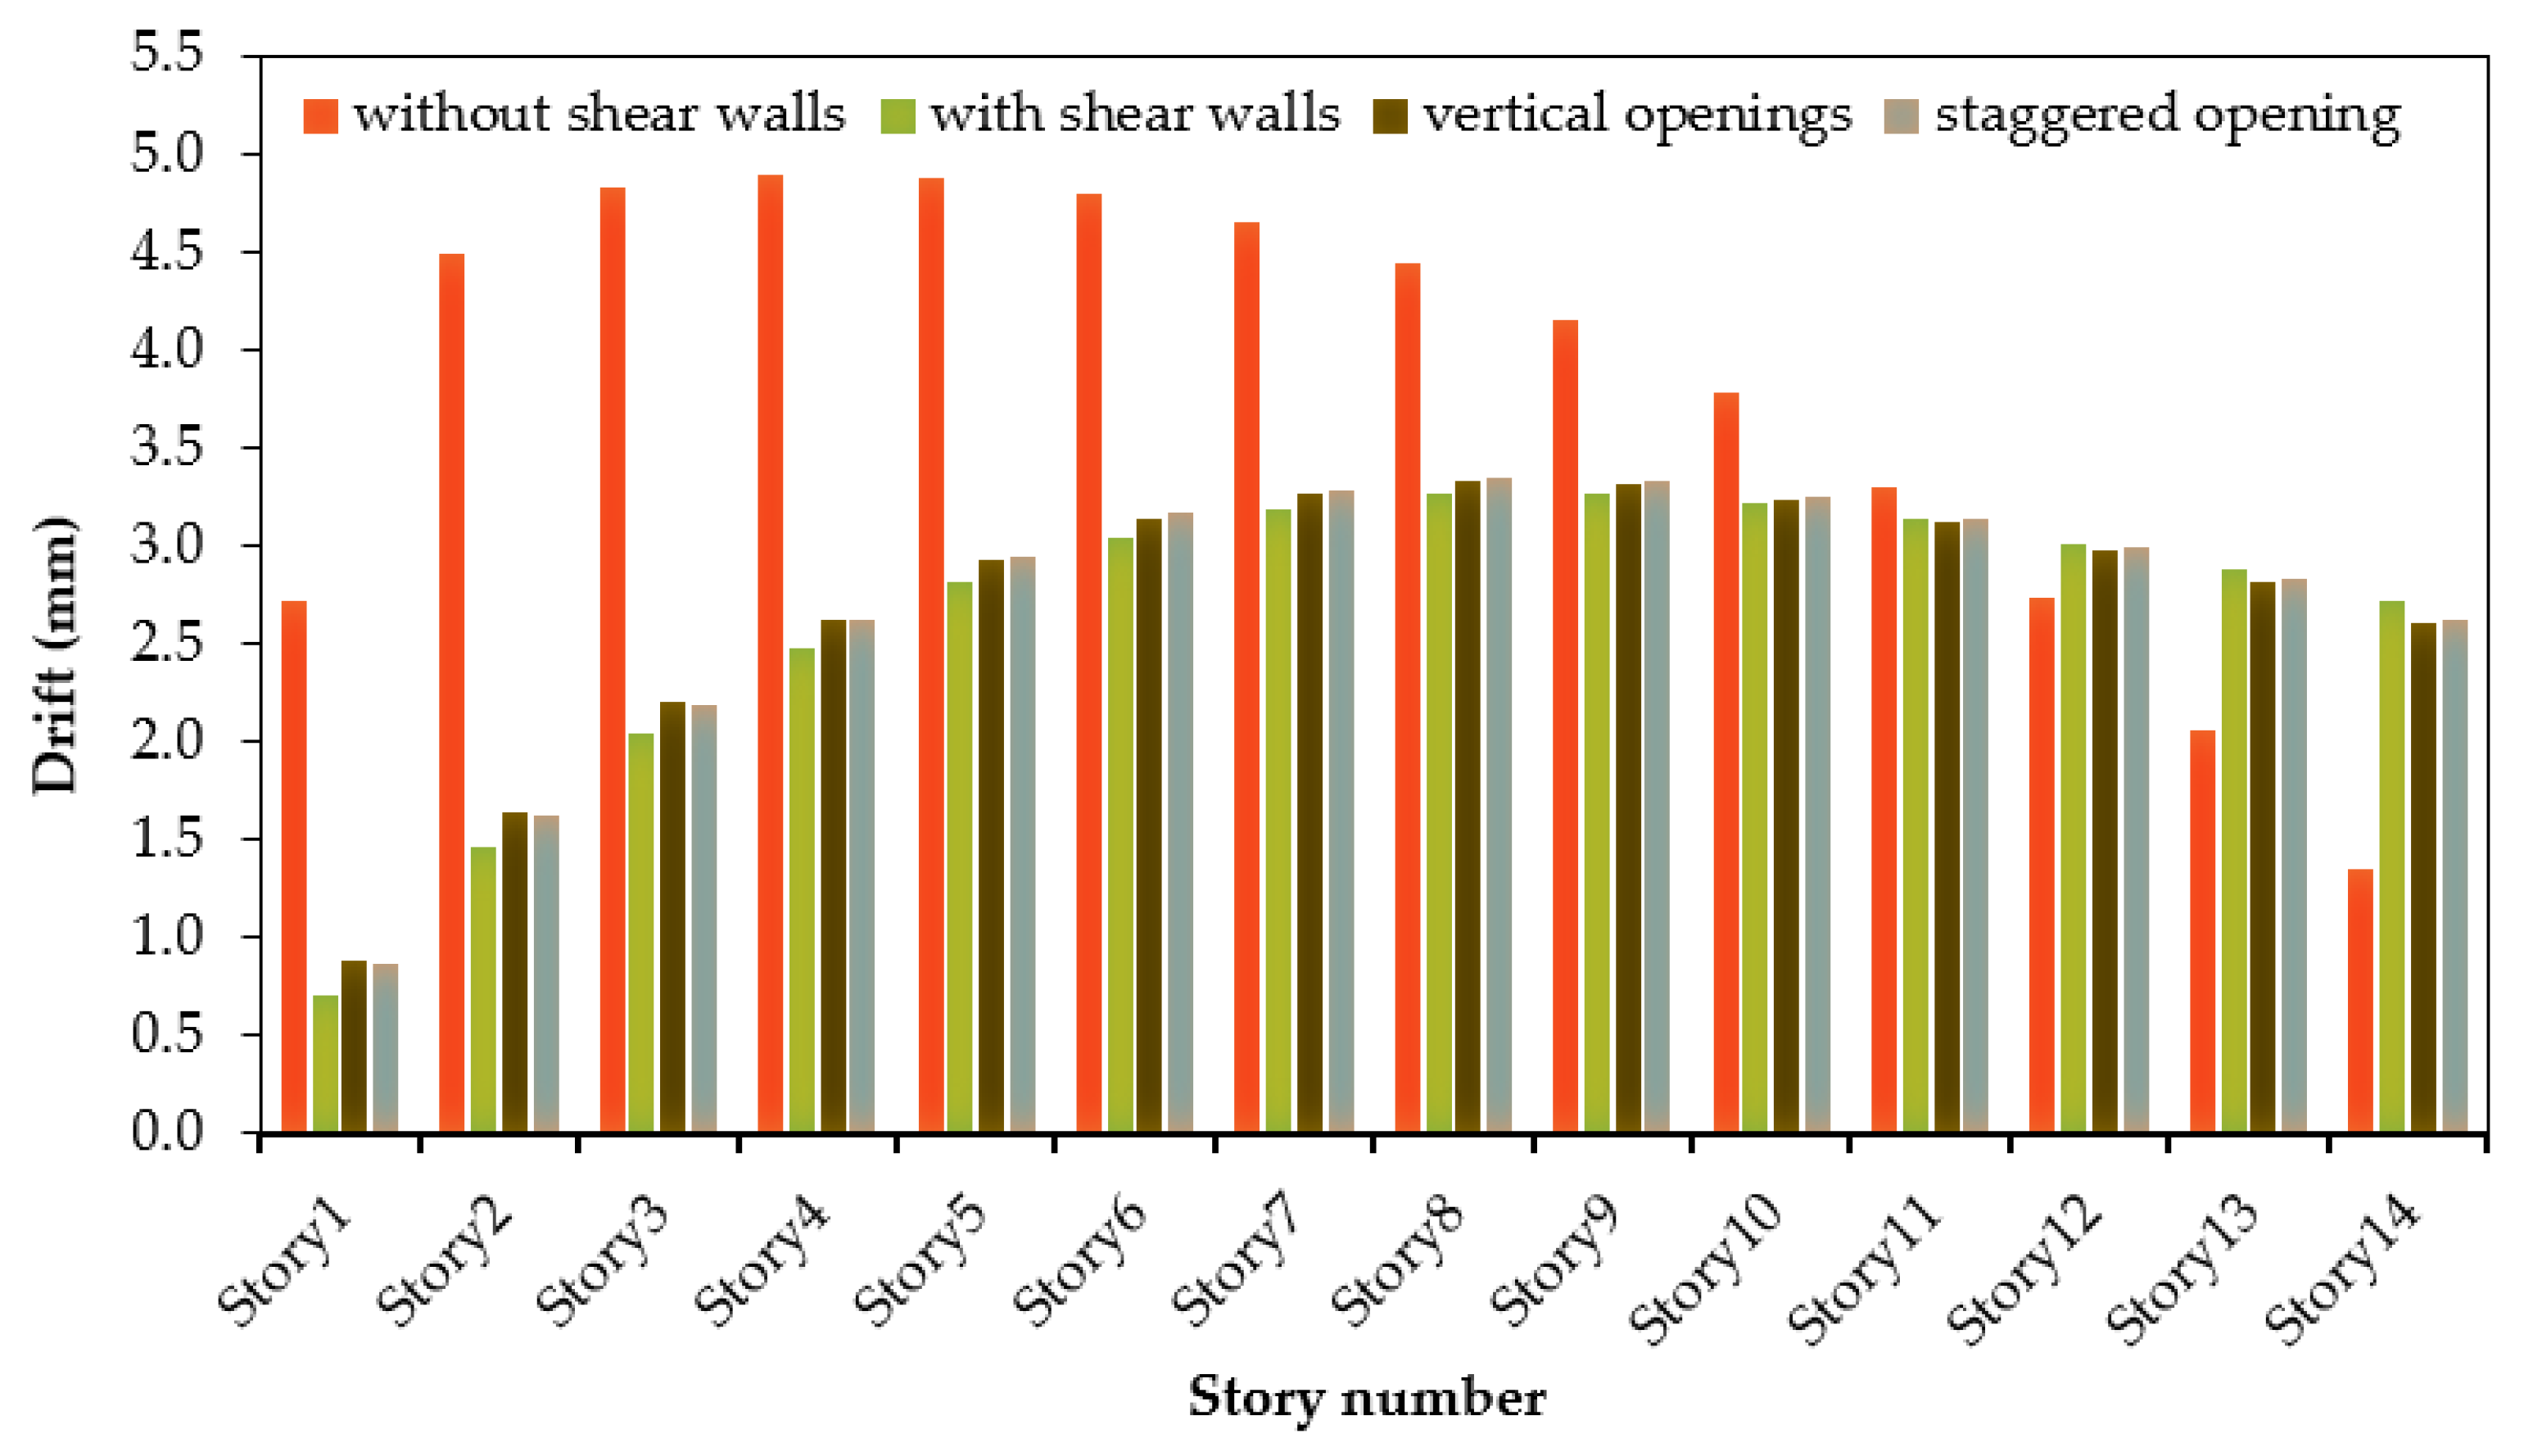
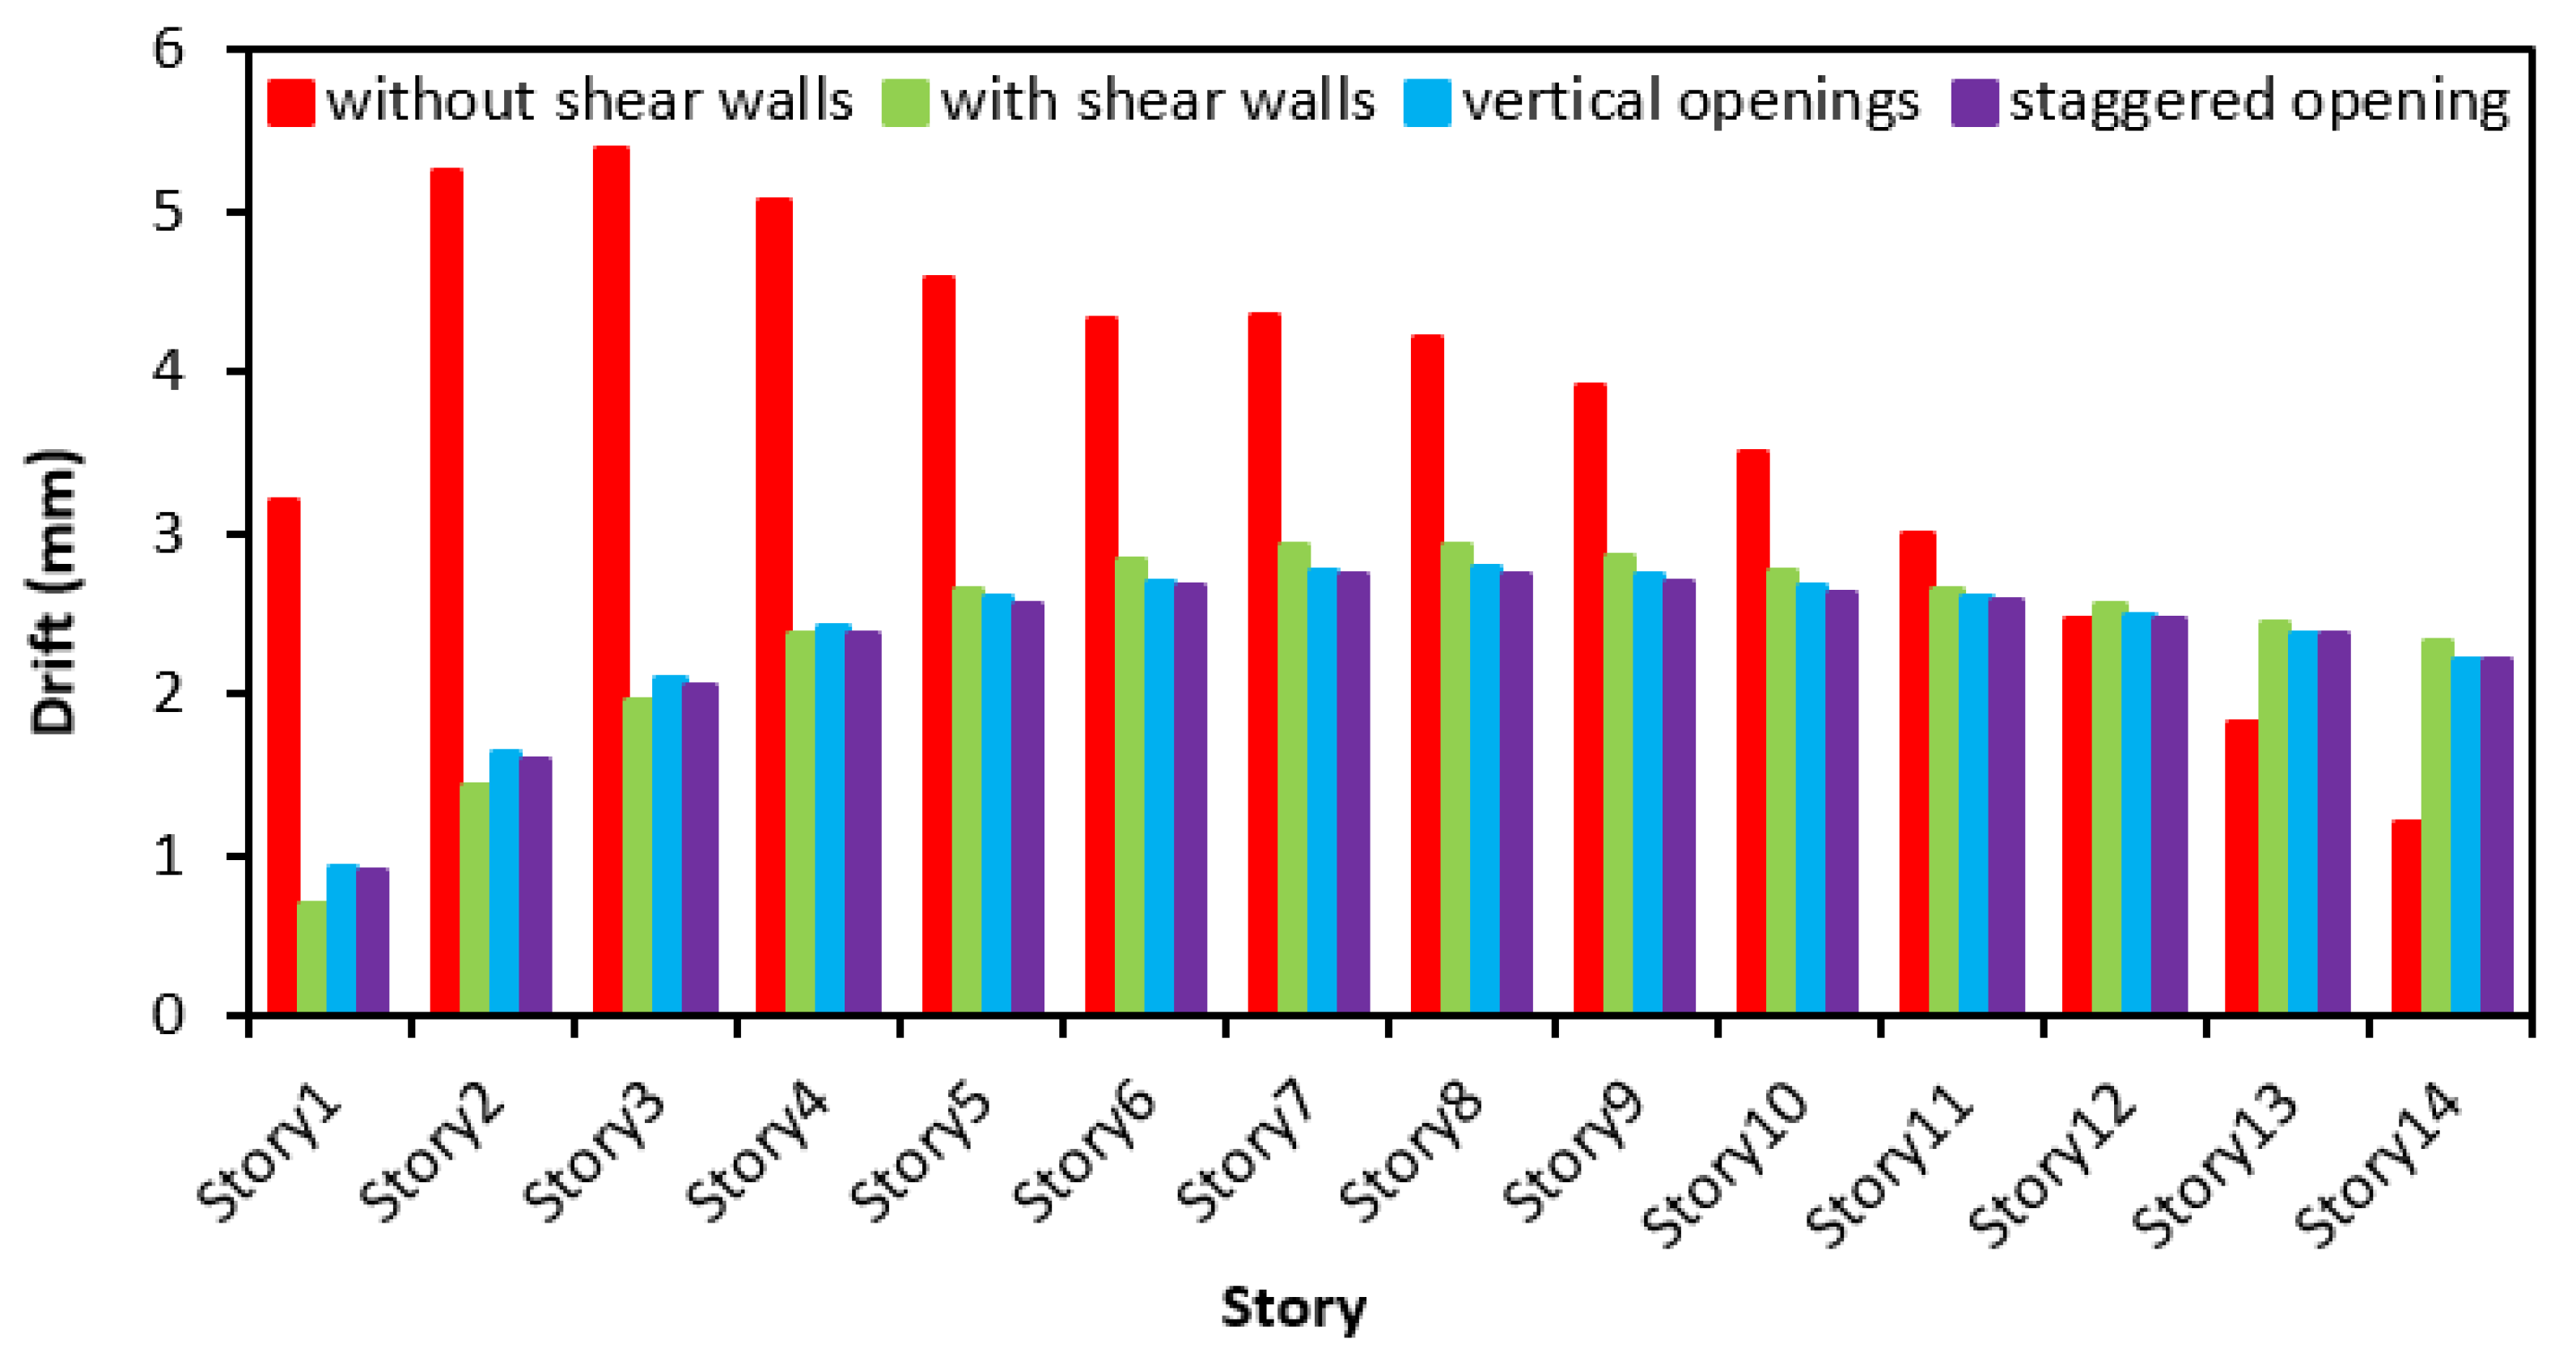
Buildings 12 01293 g013
Figure 14. Story drift of the models: static analysis and Y-direction (mm).
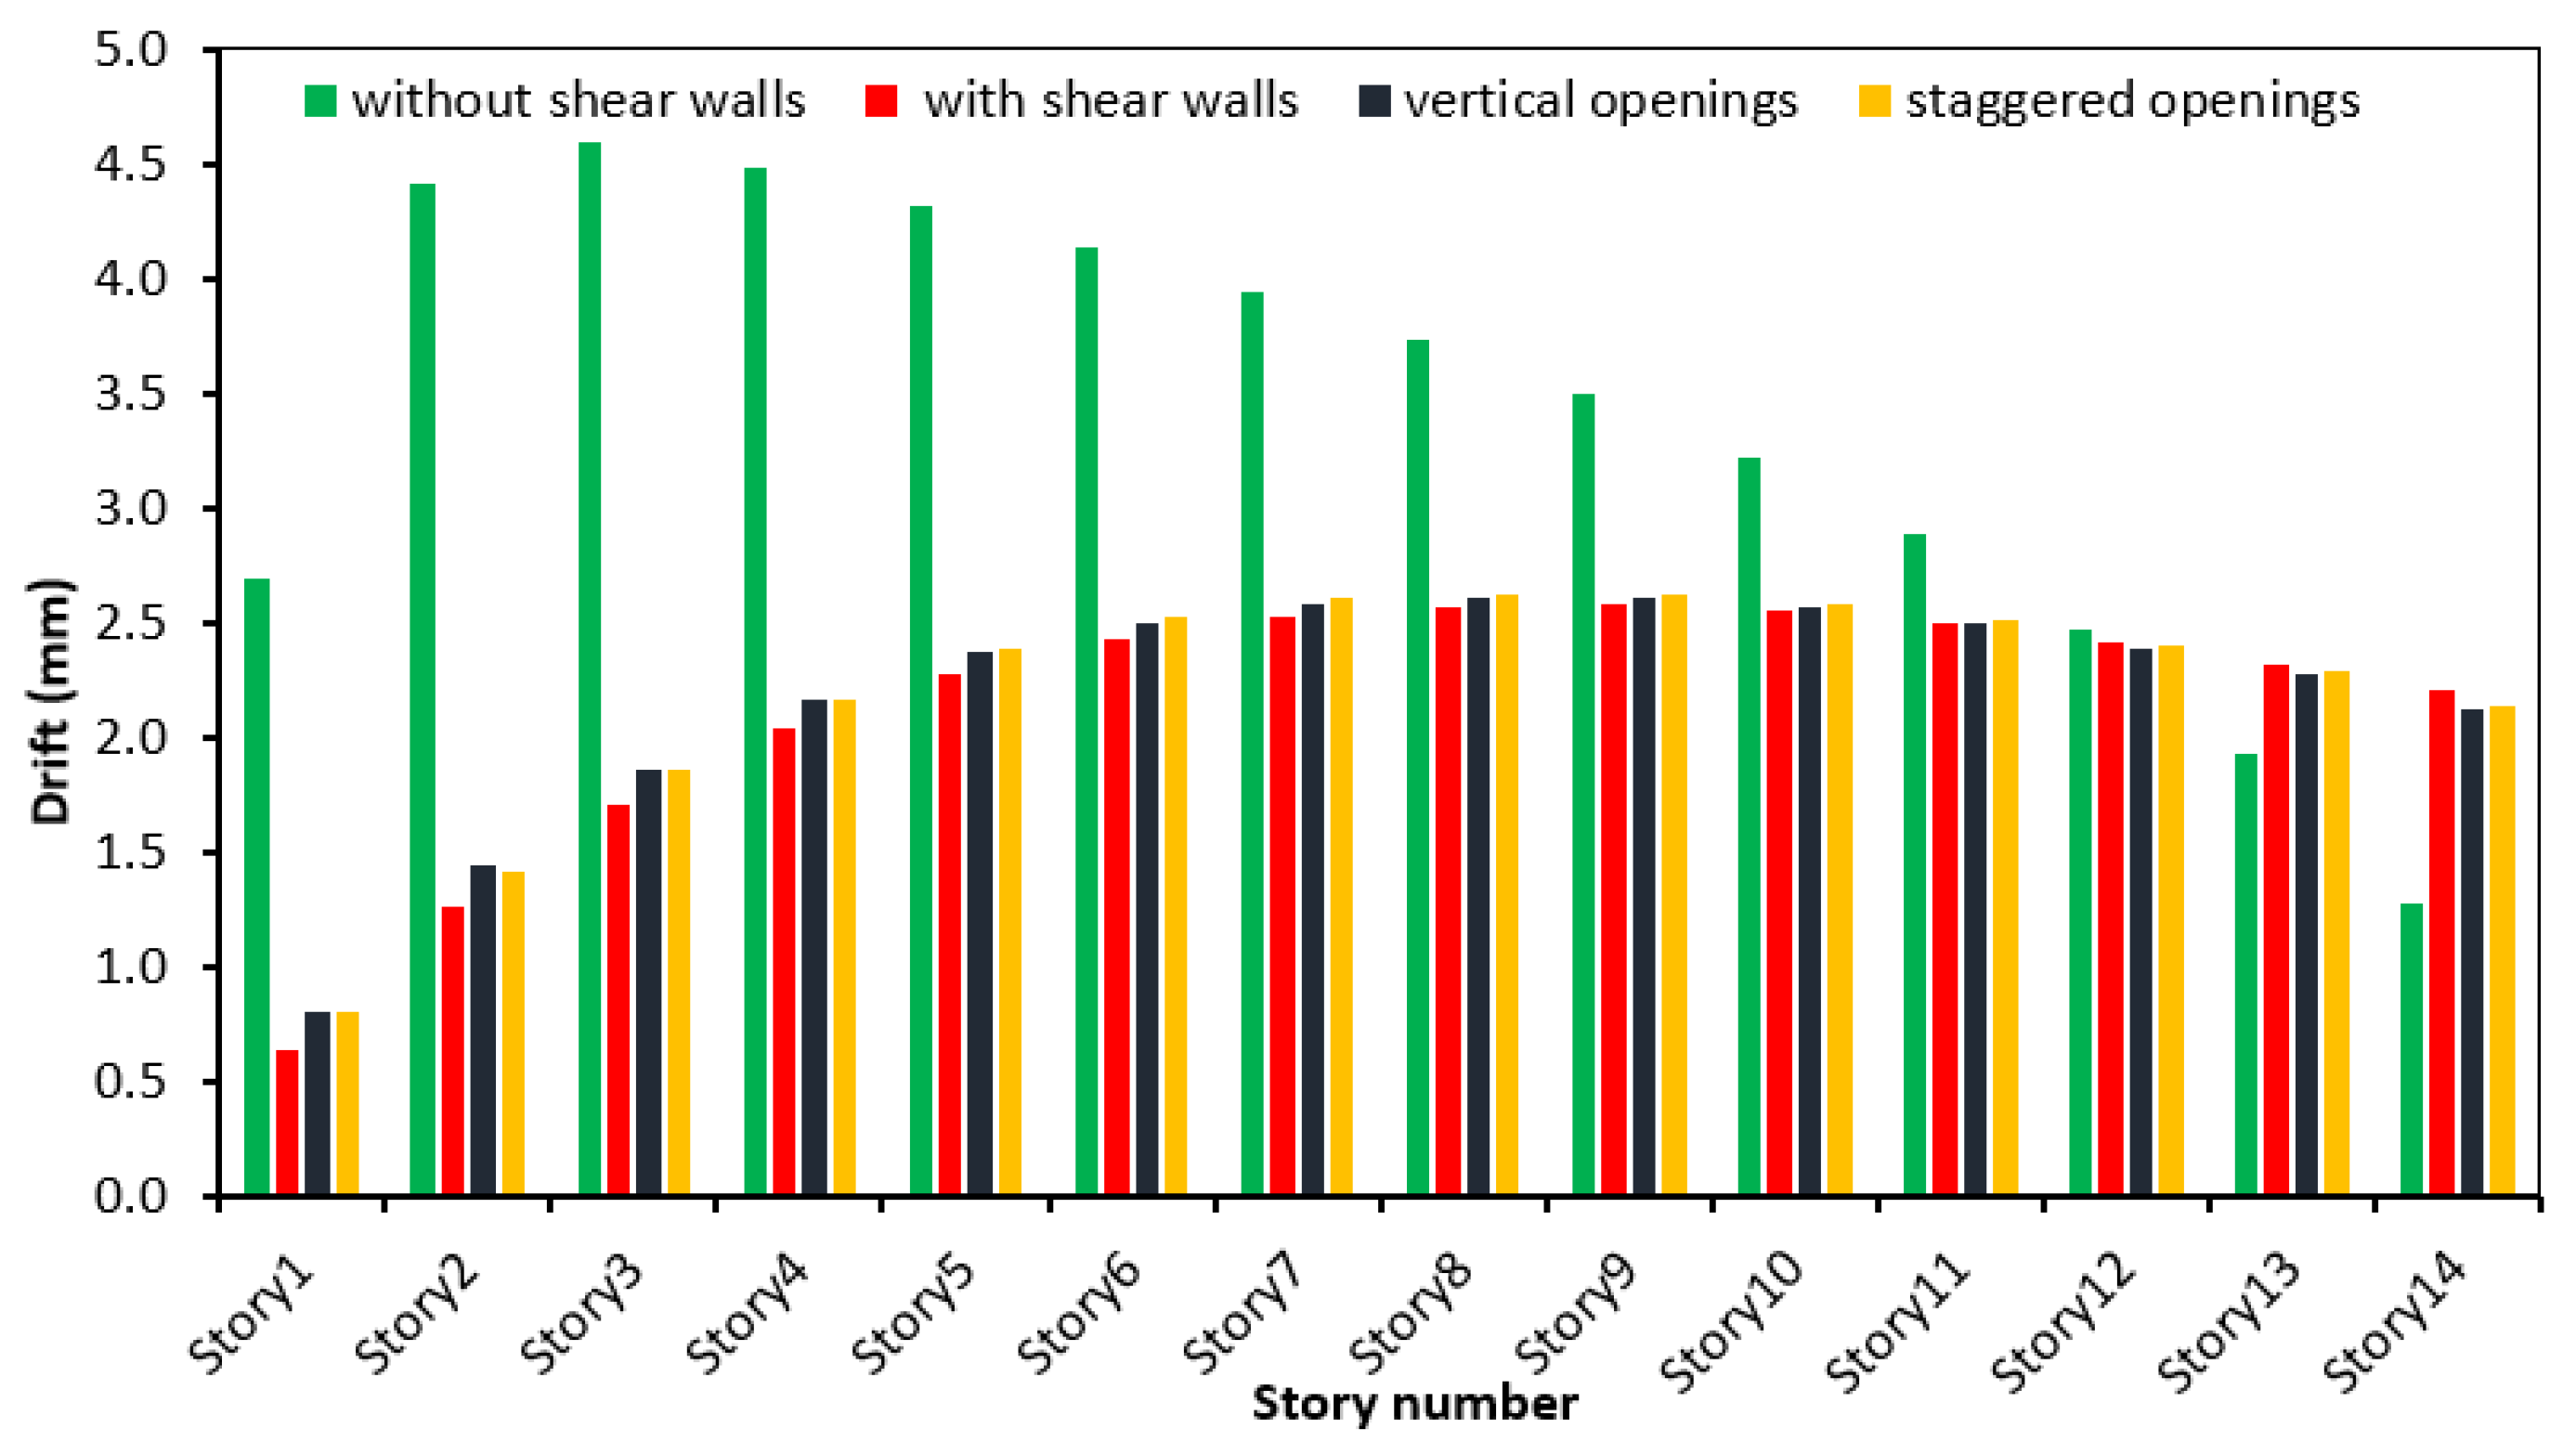
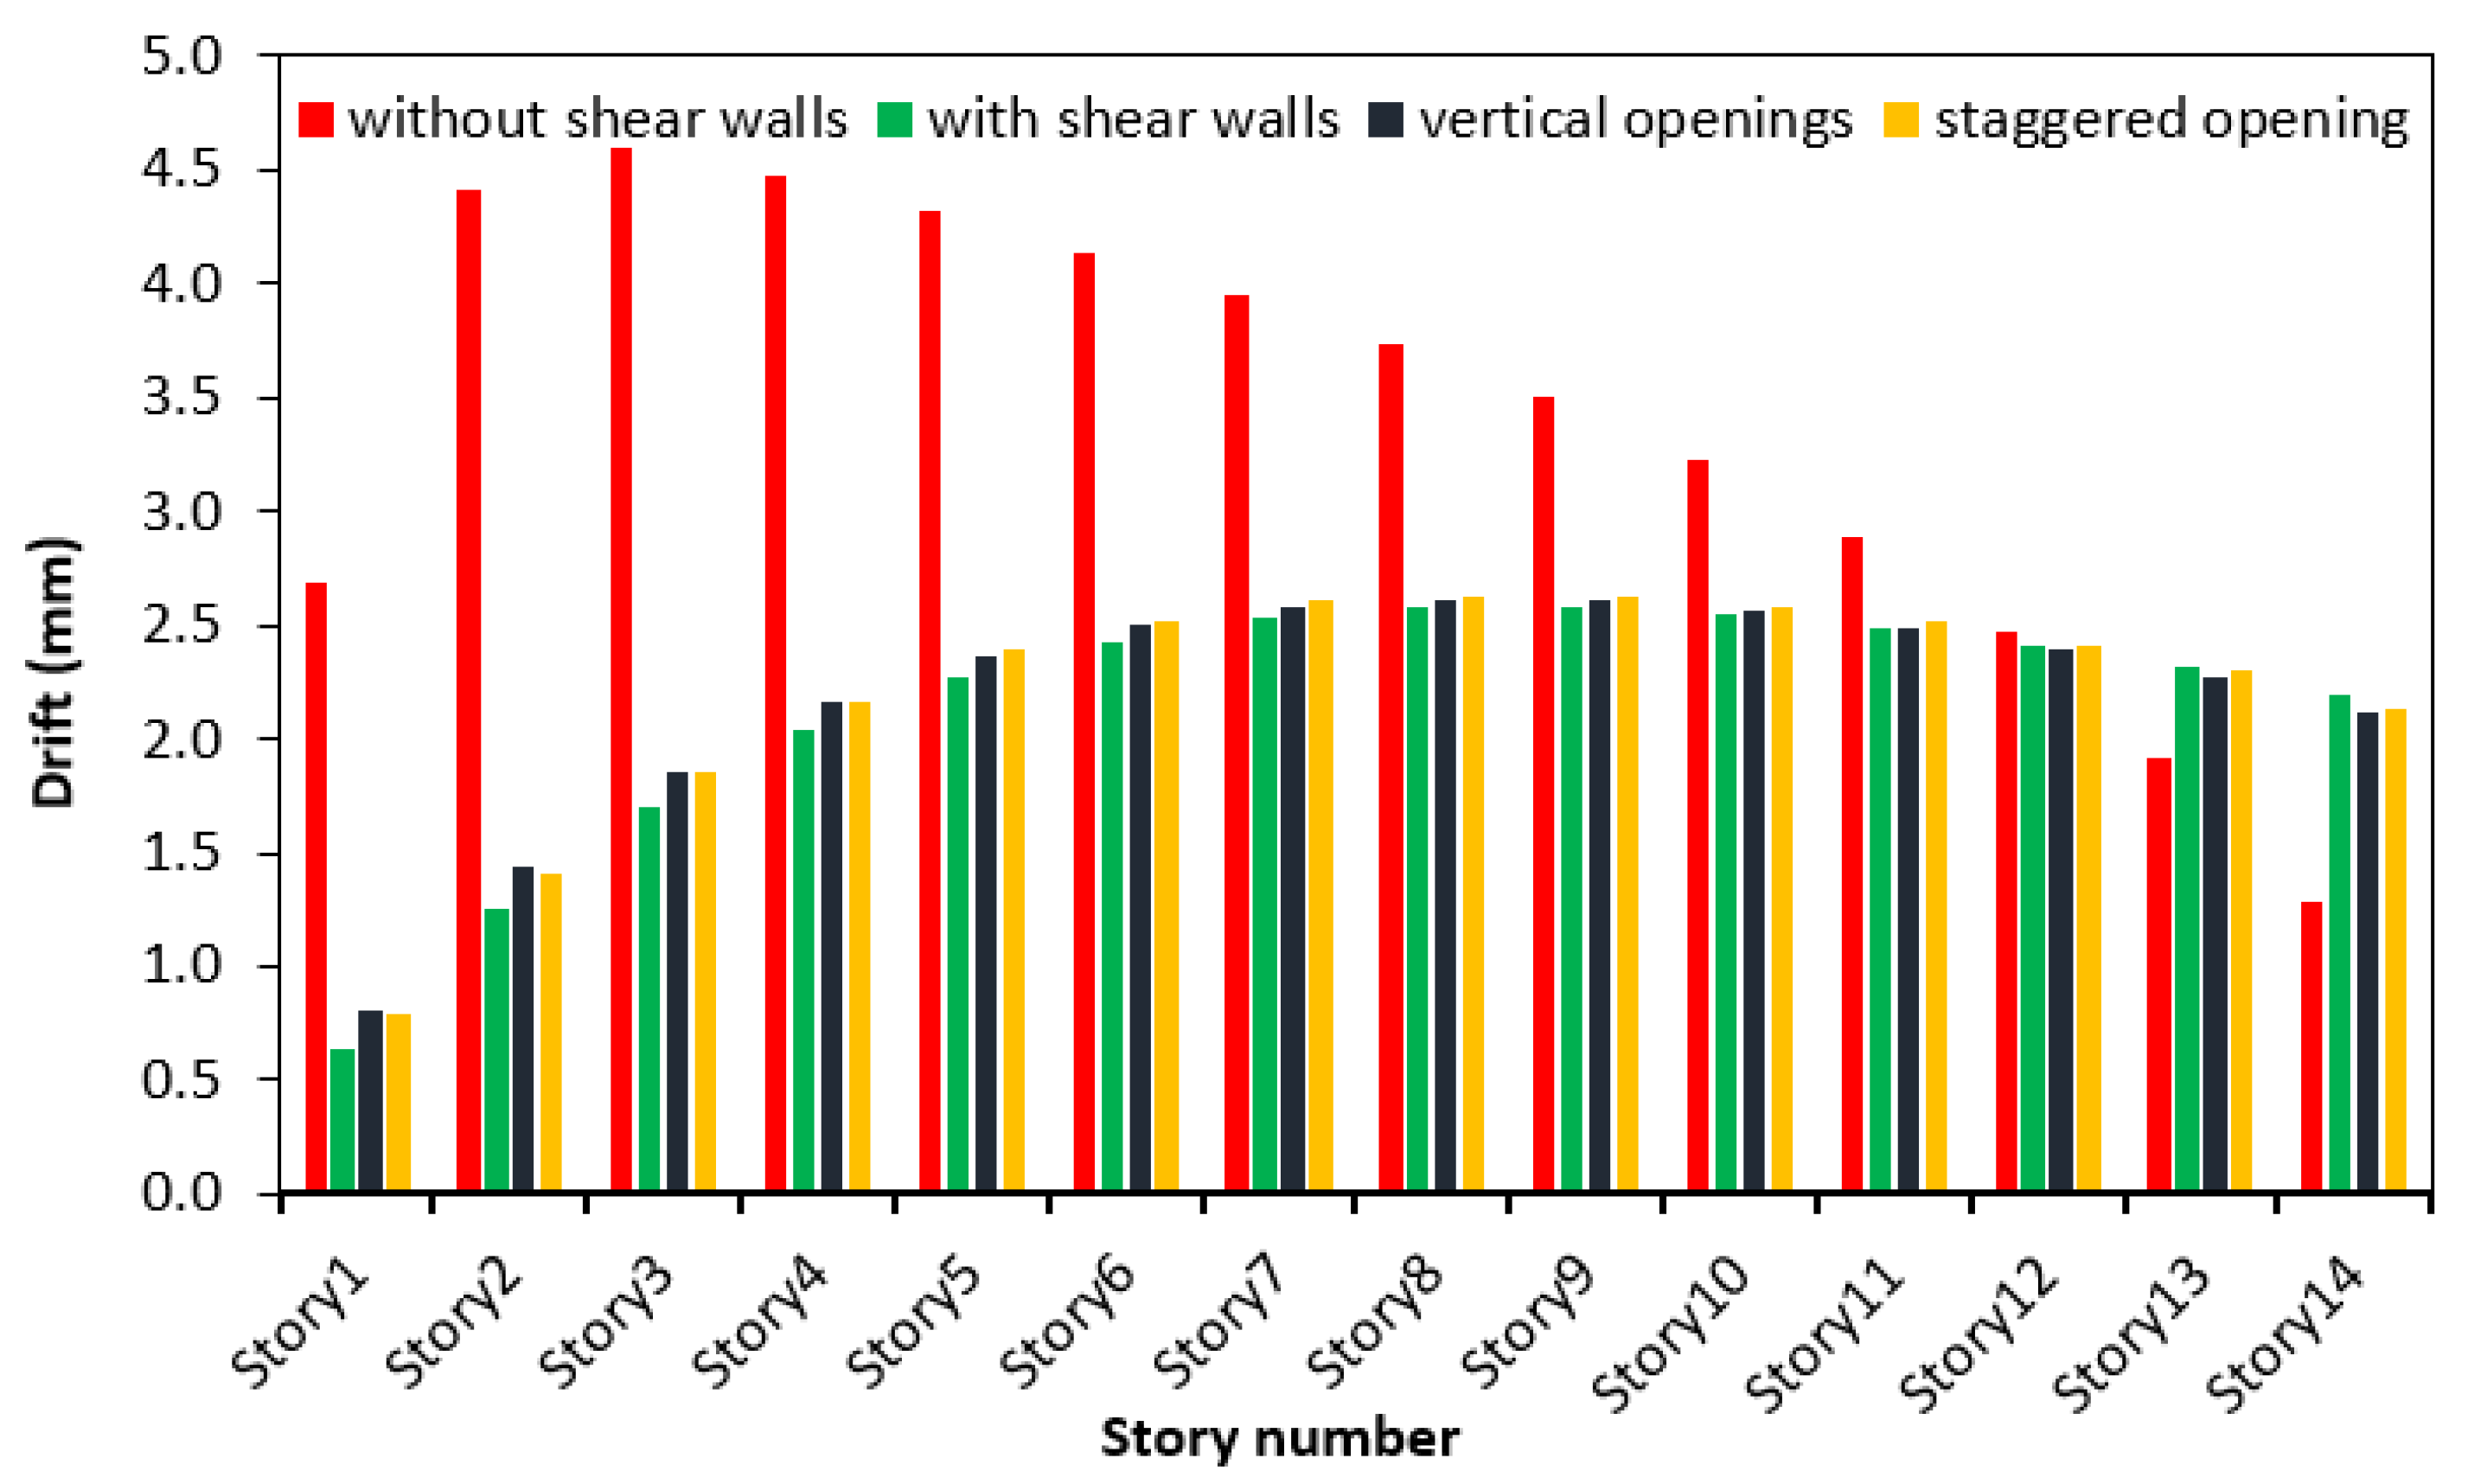
Buildings 12 01293 g014
Figure 15. Story drift of the models, response spectrum analysis and X-direction.
Buildings 12 01293 g015
Figure 16. Story drift, response spectrum analysis, and Y-direction.
Buildings 12 01293 g016
Figure 17. Story drift of the models, time history analysis, X-direction.
Buildings 12 01293 g017
Figure 18. Story drift of the models, time history analysis, Y-direction.
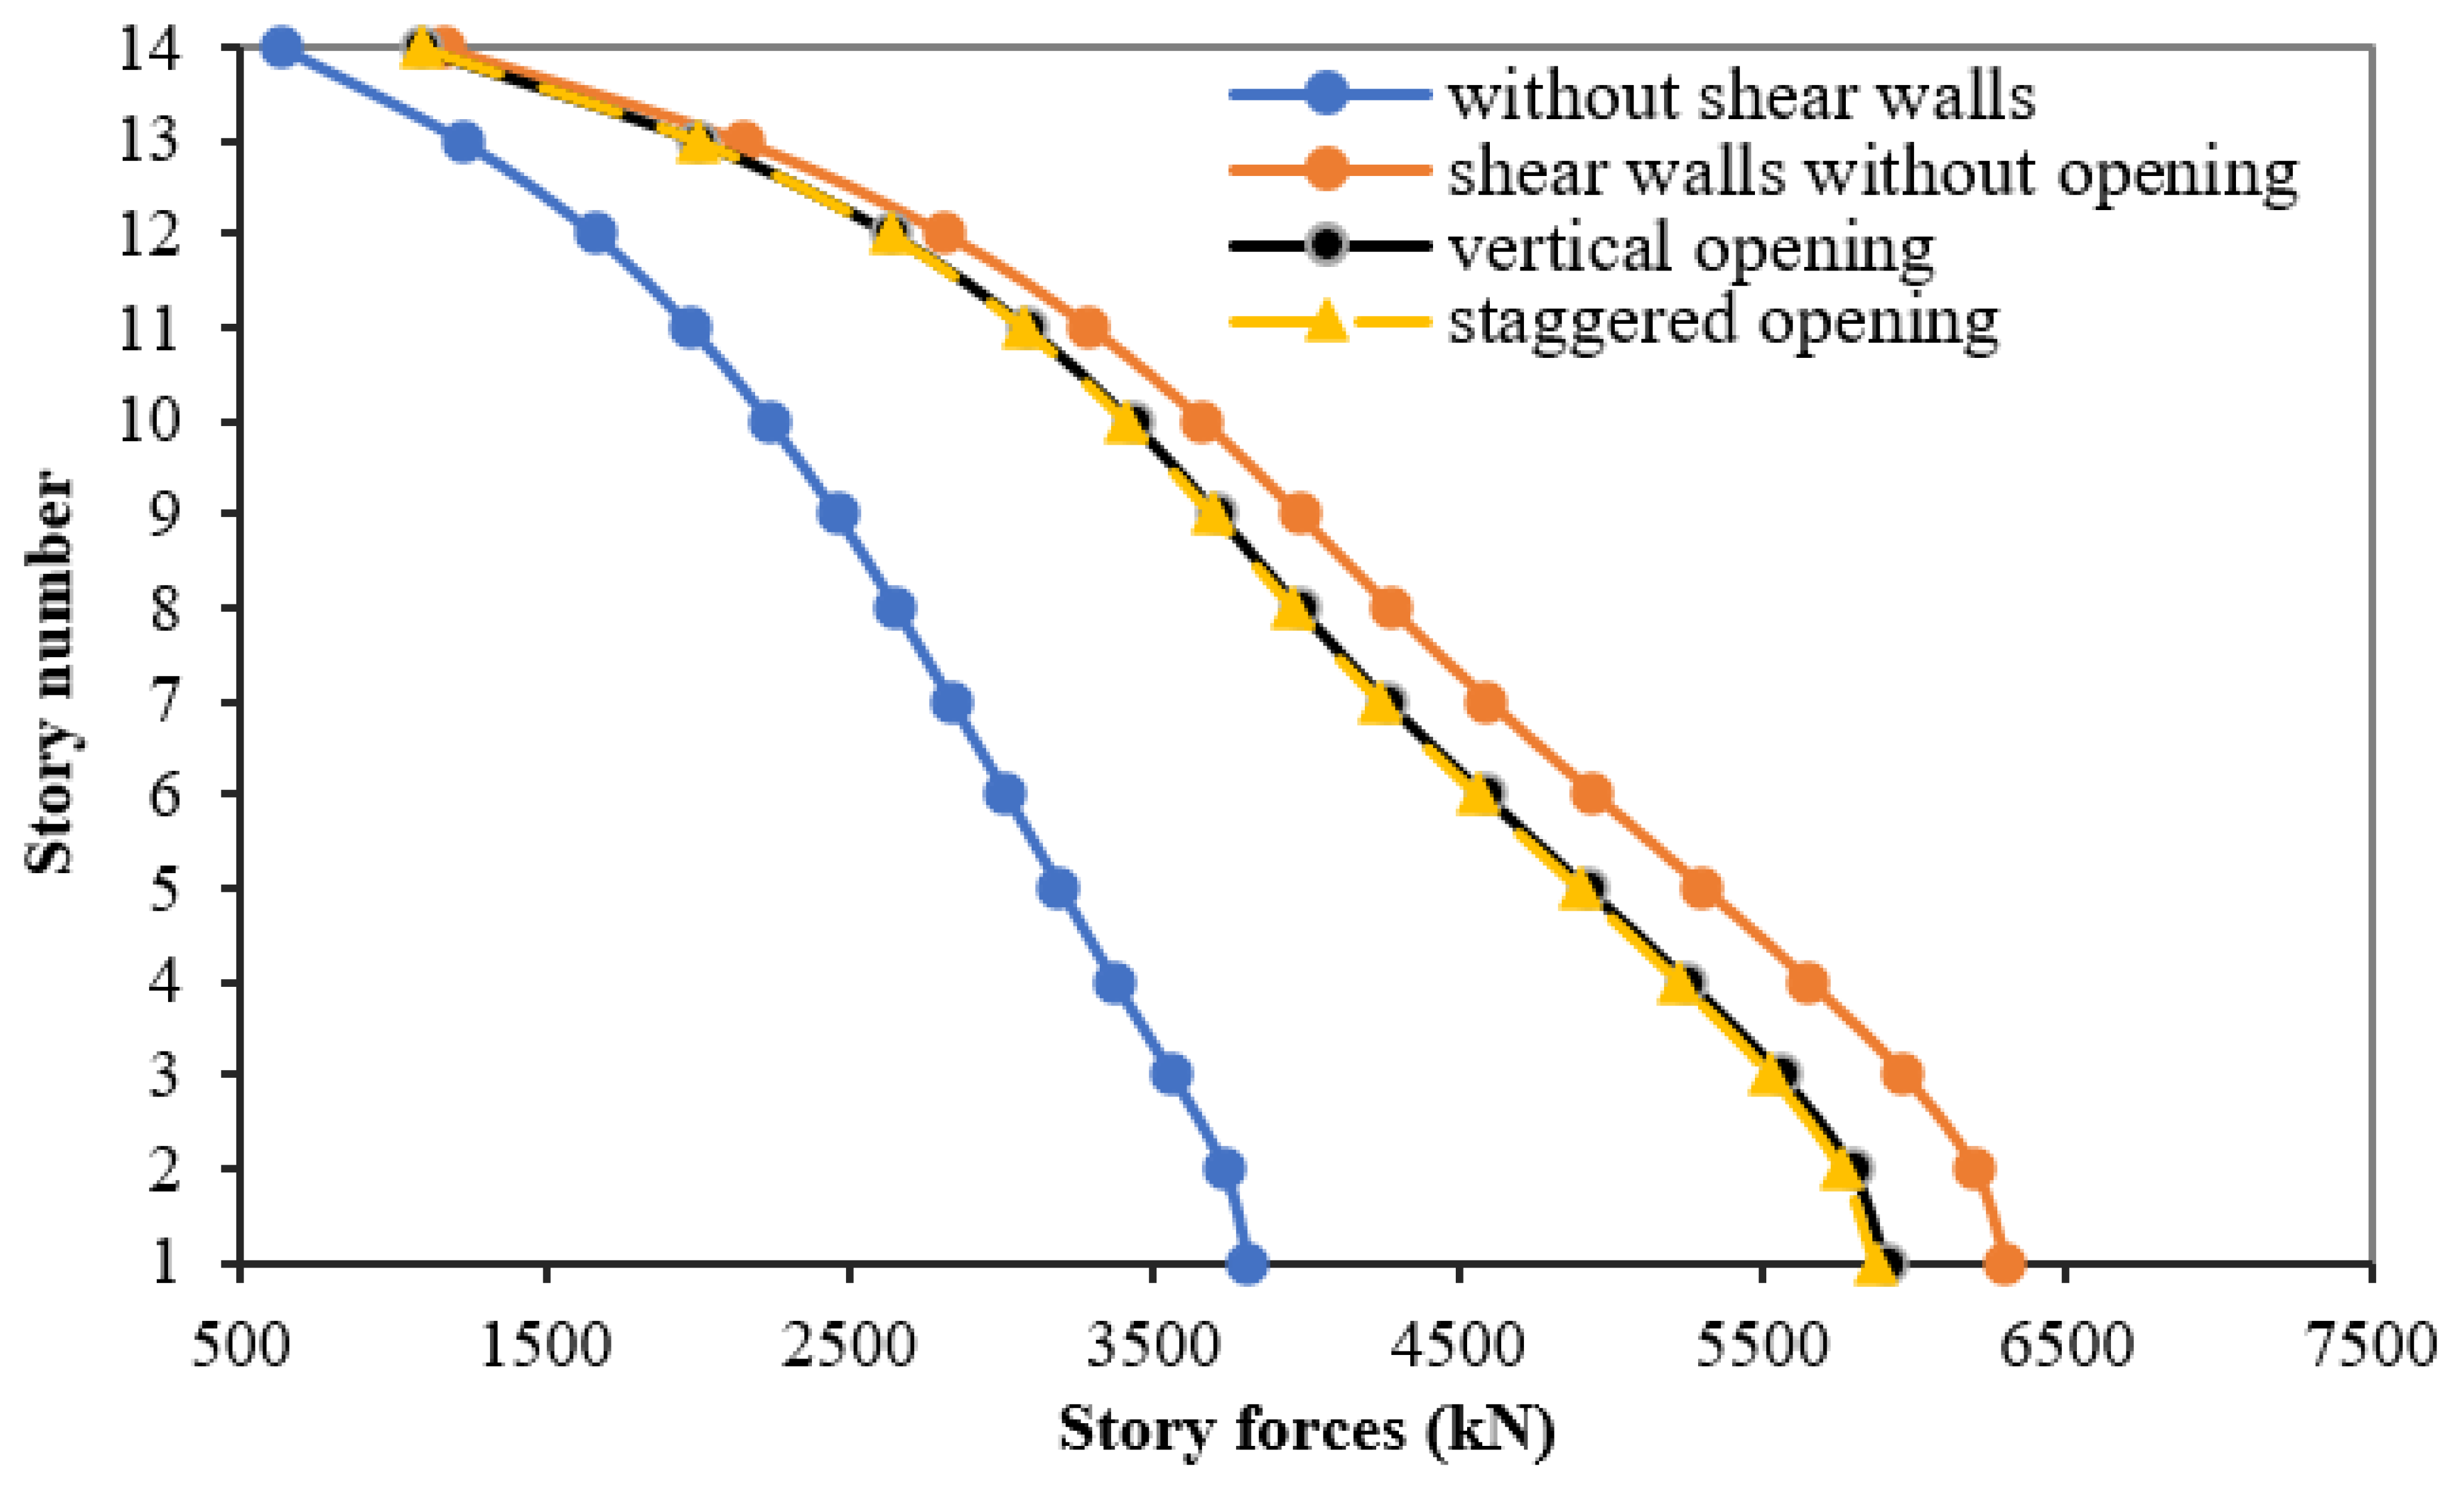
Buildings 12 01293 g018
Figure 19. Story forces of the models, response spectrum analysis, X-direction.
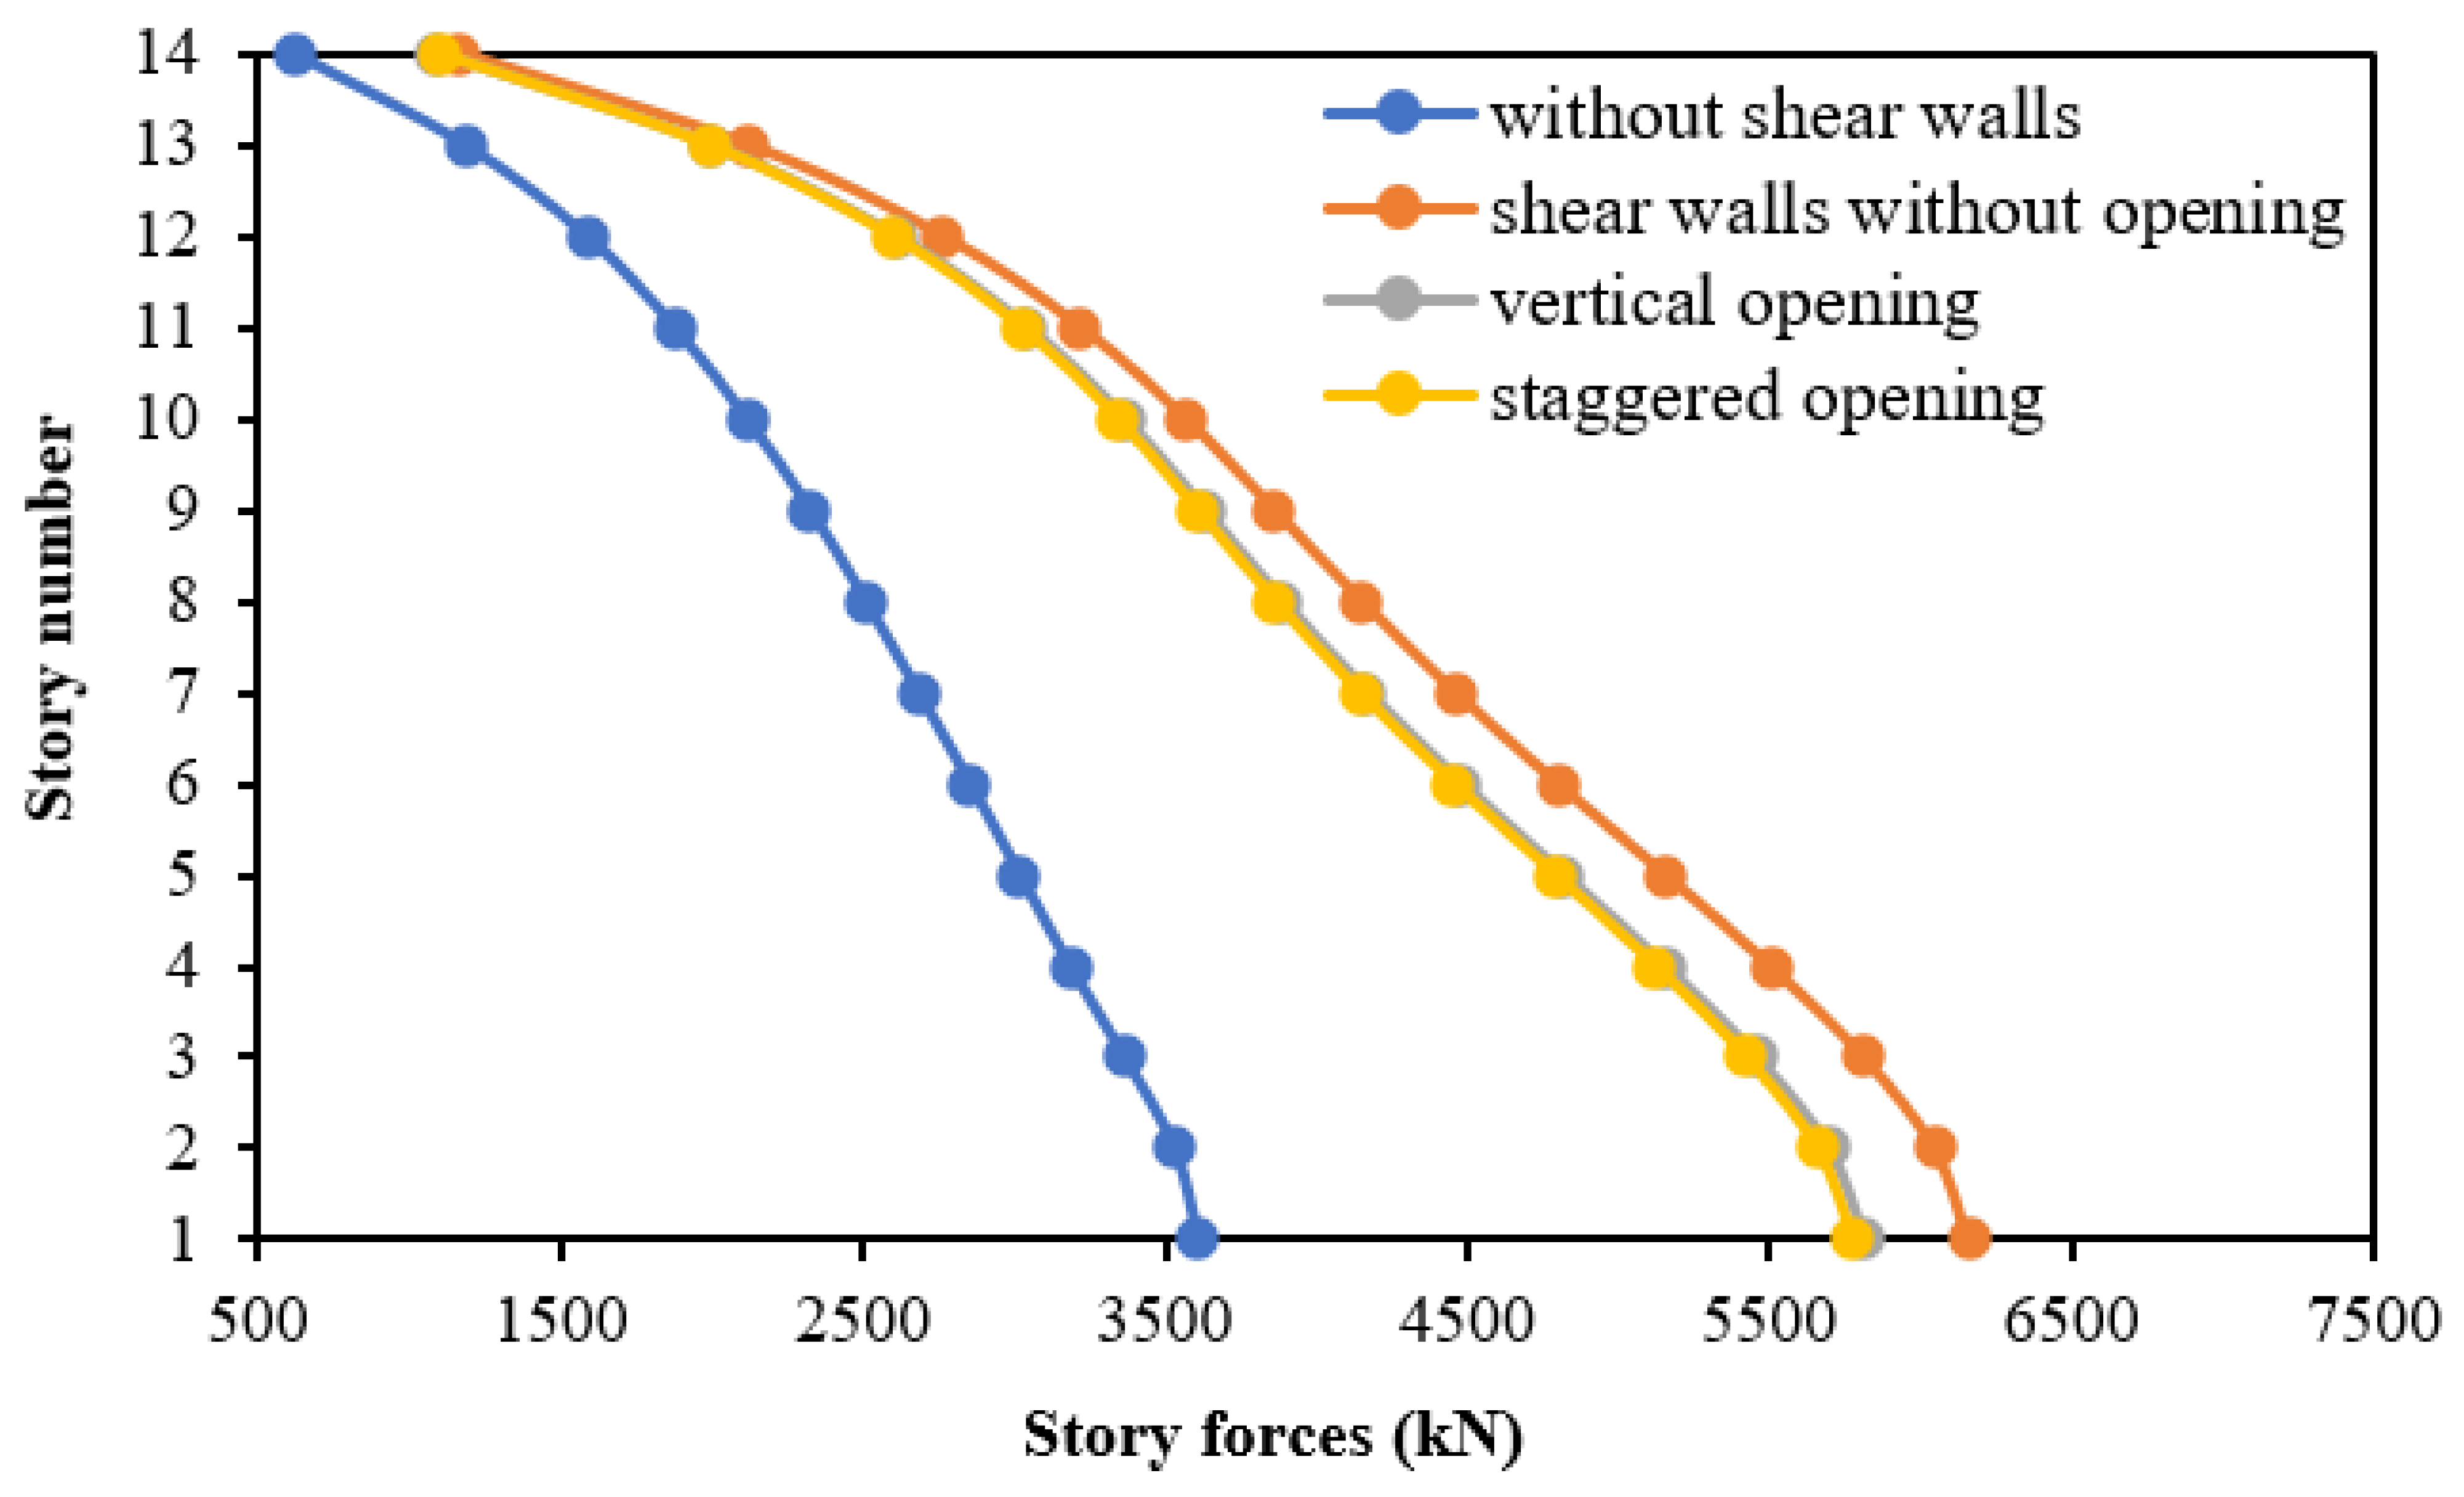
Buildings 12 01293 g019
Figure 20. Story forces of the models, response spectrum analysis, Y-direction.
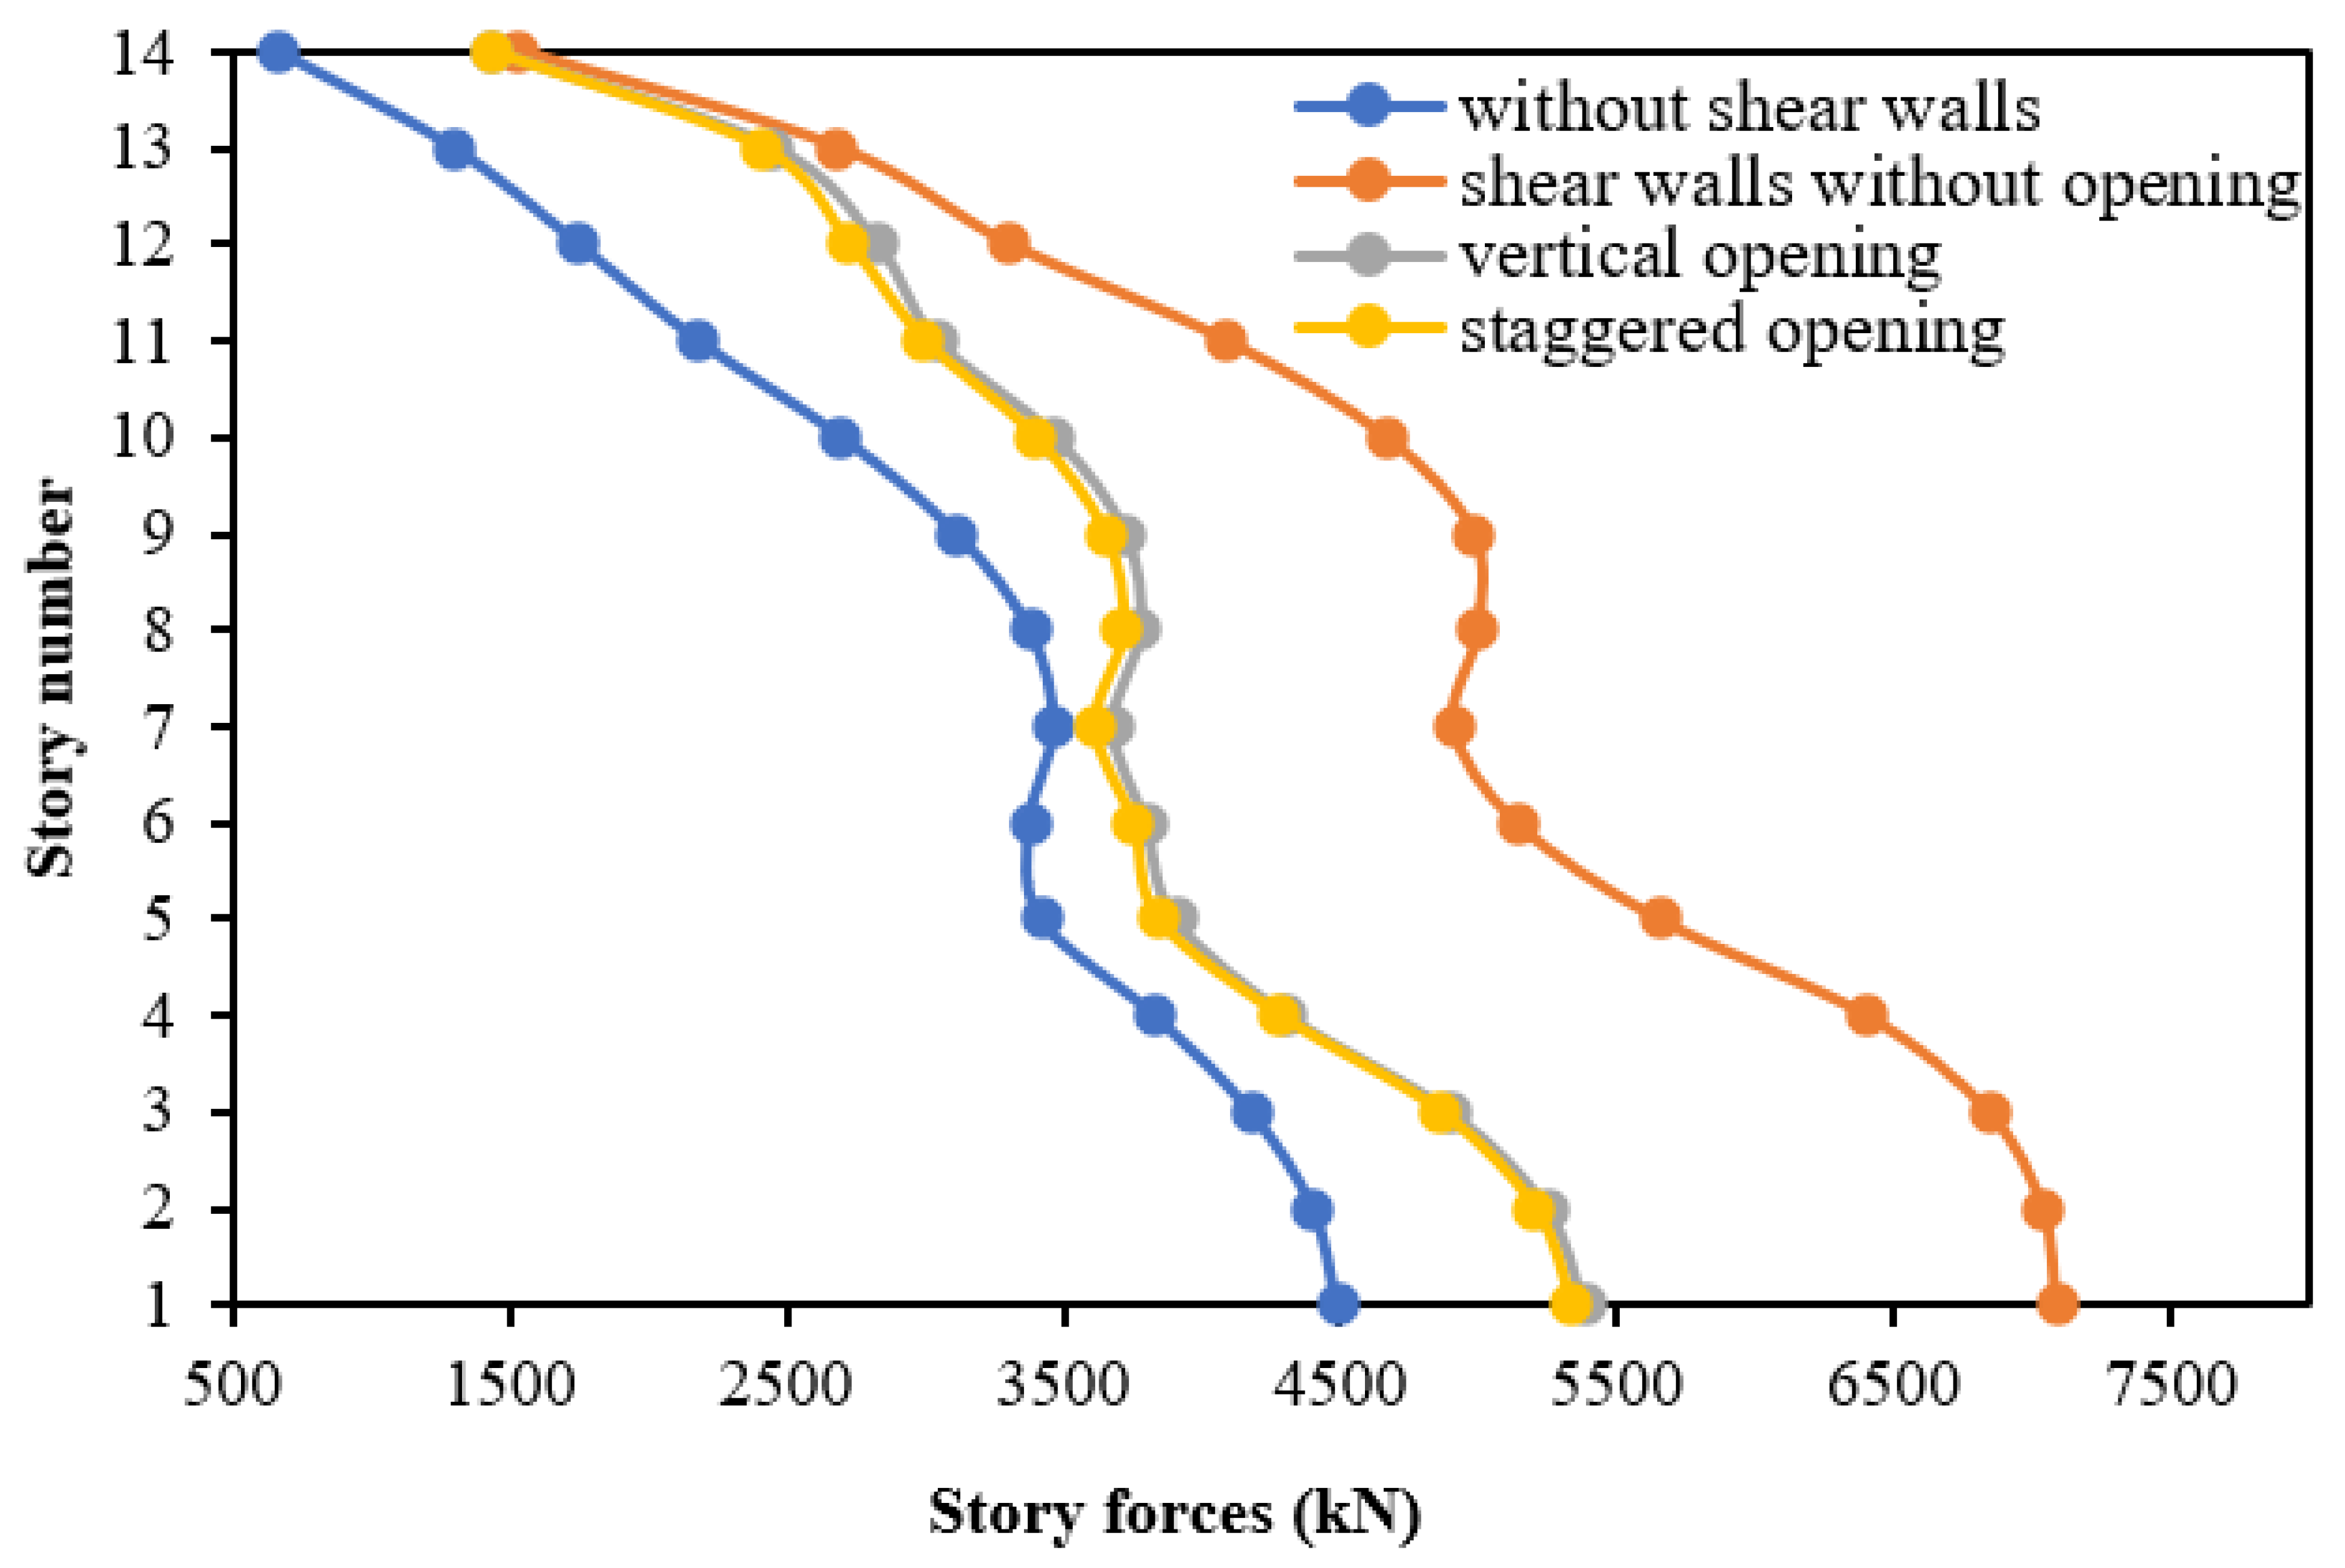
Buildings 12 01293 g020
Figure 21. Story forces of the models, time history analysis, X-direction.
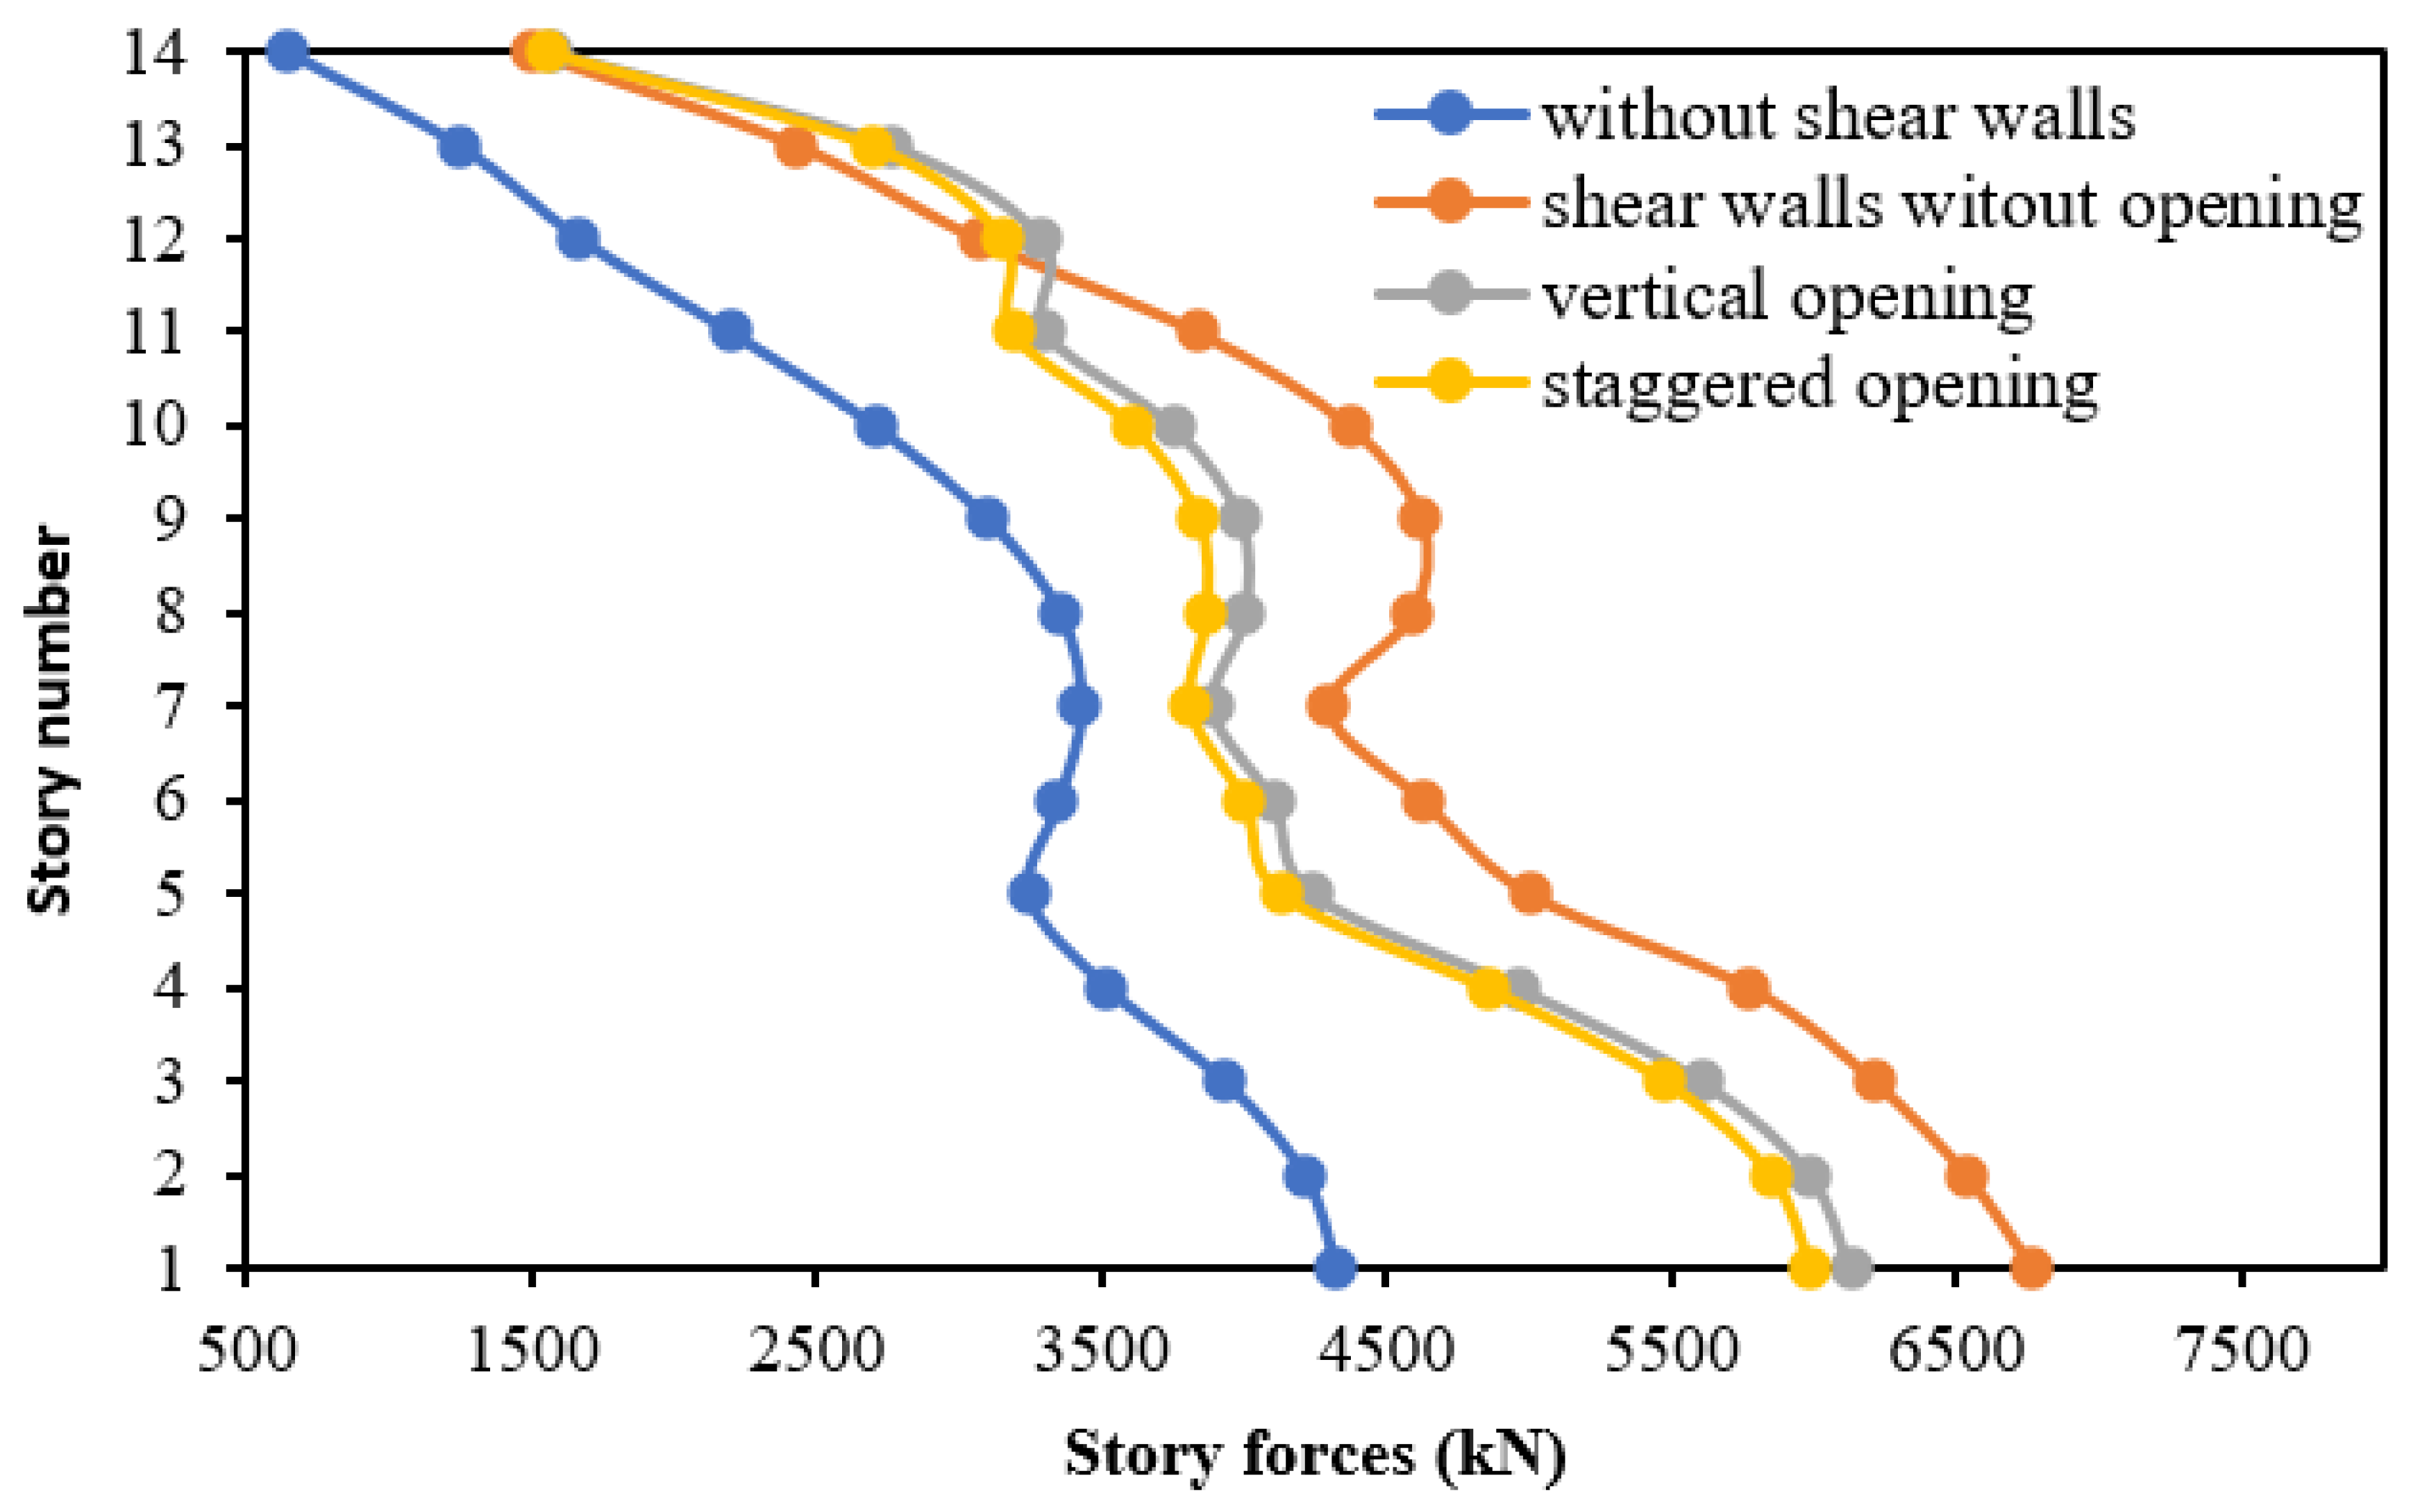
Buildings 12 01293 g021
Figure 22. Story forces of the models, time history analysis, Y-direction.
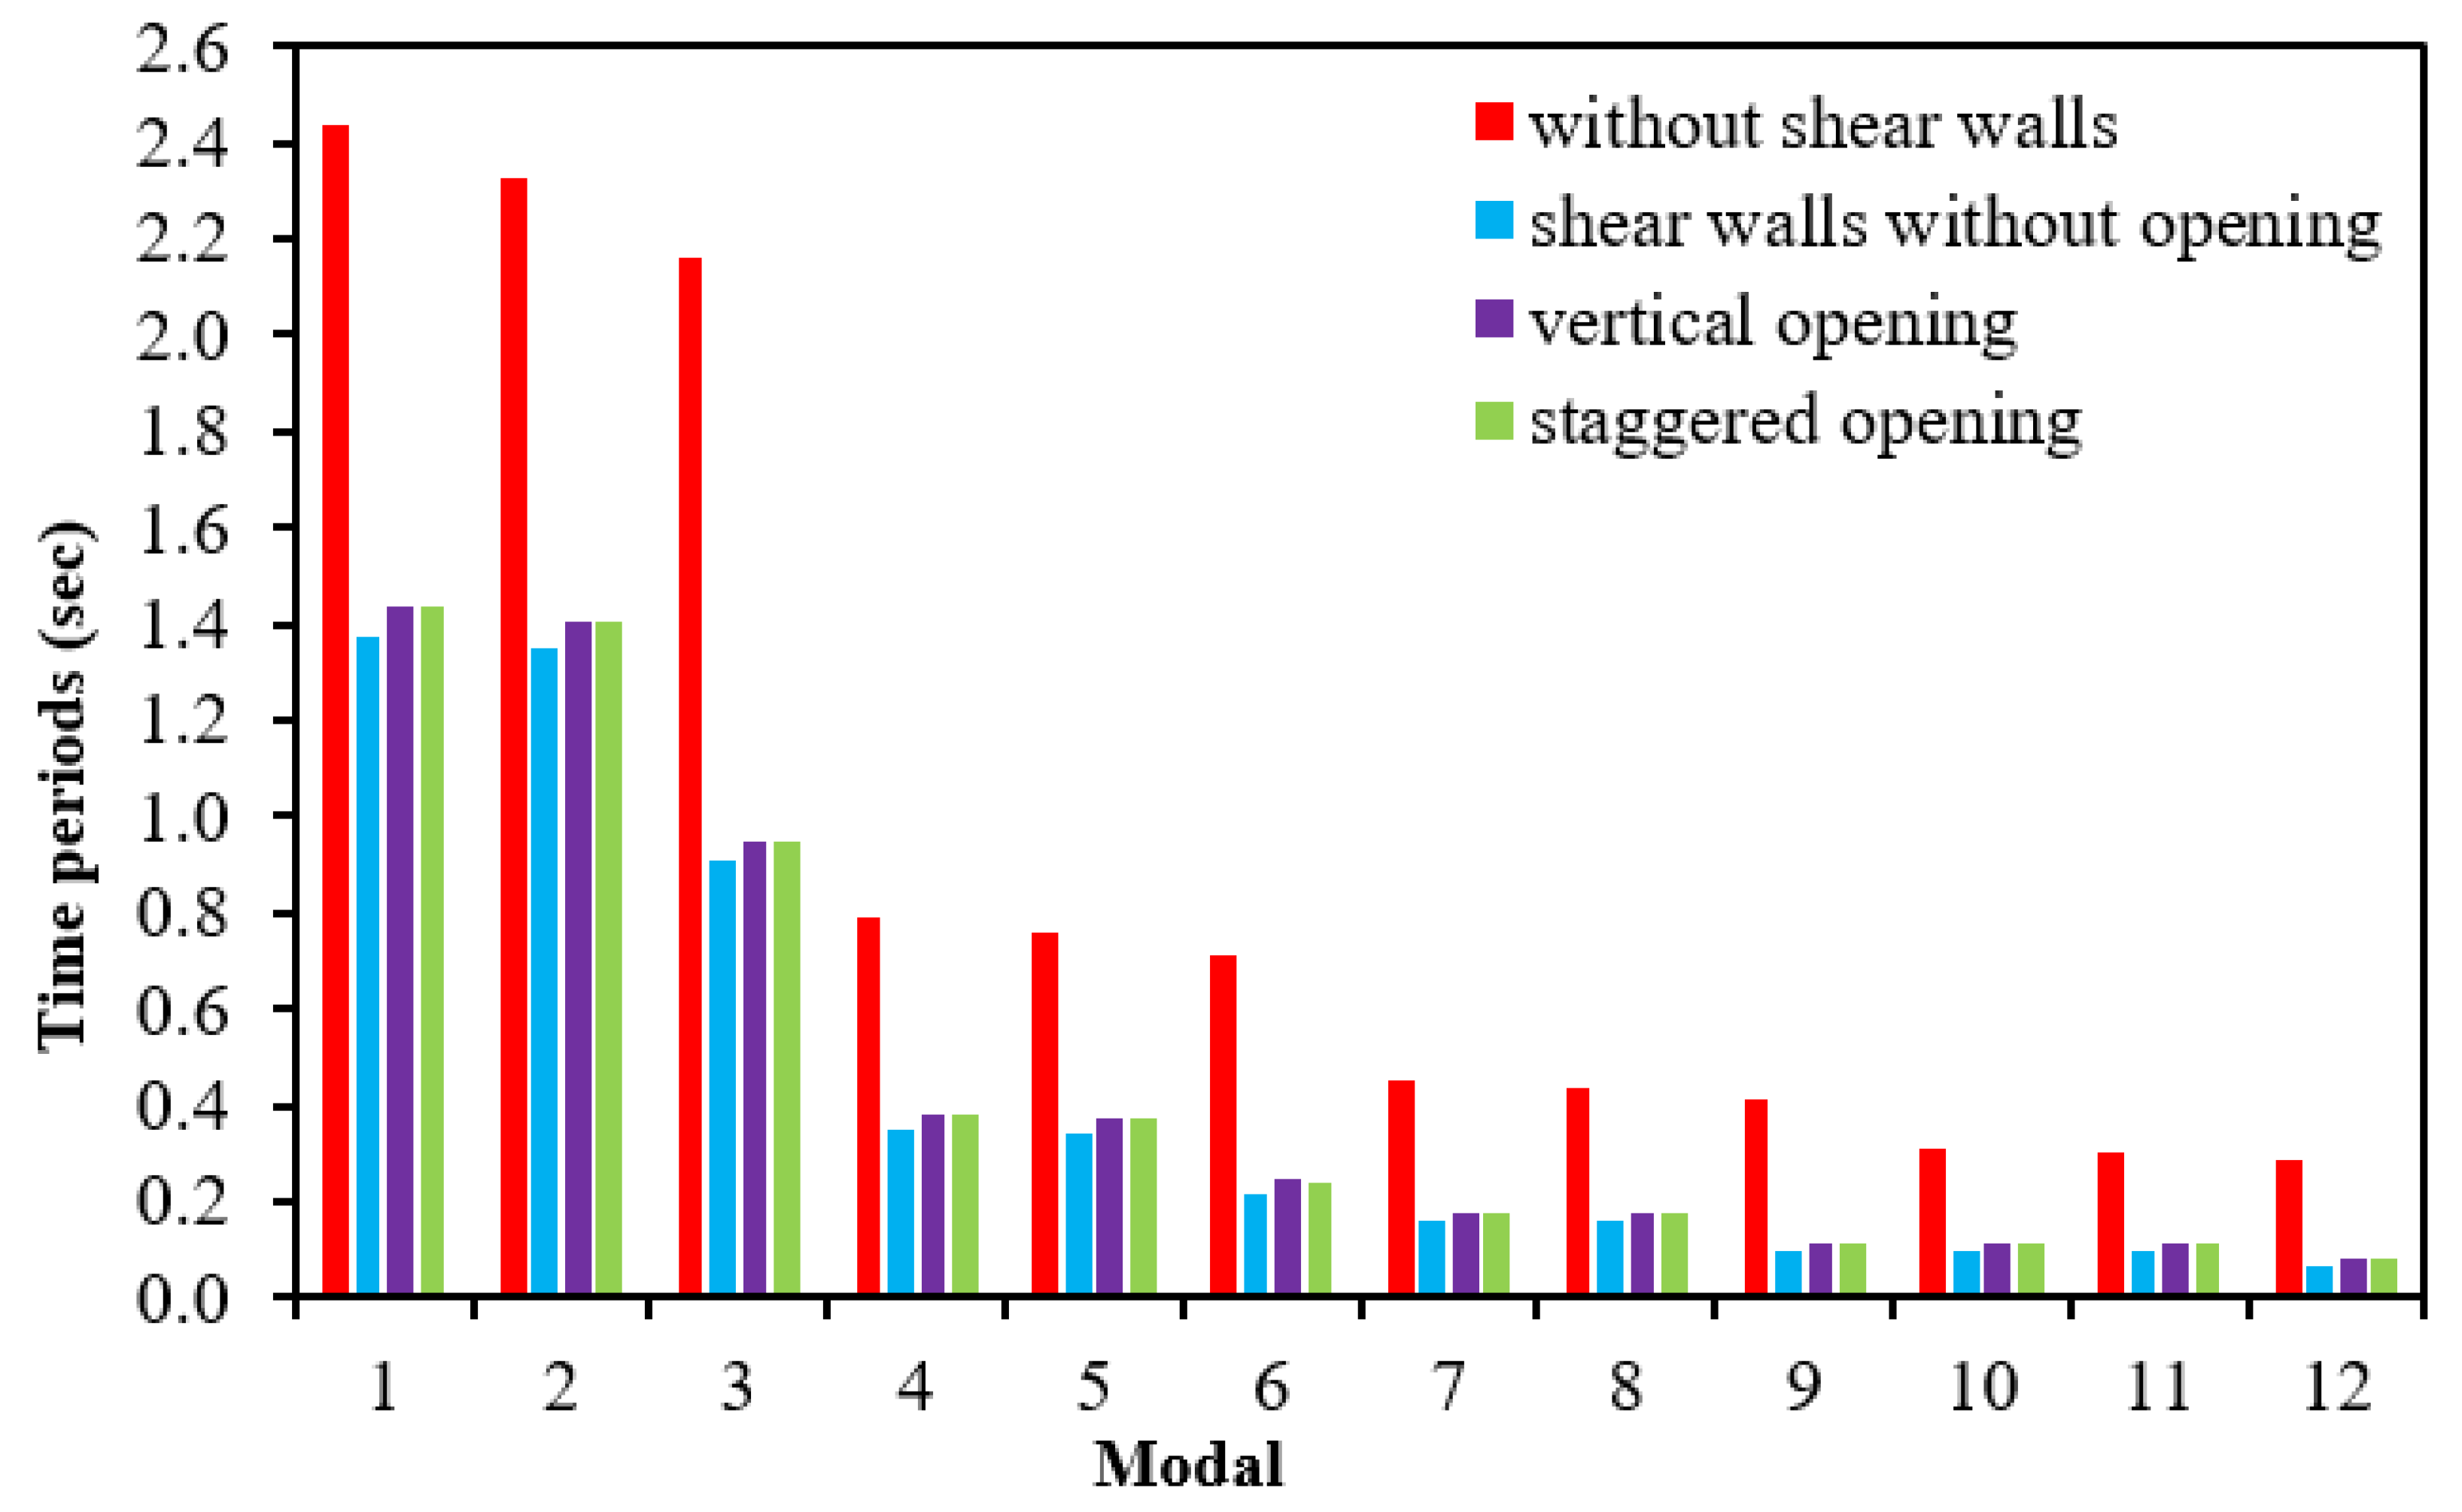
Buildings 12 01293 g022
Figure 23. The time period of the models.
Buildings 12 01293 g023
Table 1. Models data.
Number of Stories14
Column Size (600 × 600) mm
Beam Size (300 × 600) mm
Slab Depth 150 mm
Shear Wall Thickness 300 mm
Size of opening (2 × 1.5) m
Story Height3.5 m
SupportFixed
Concrete Grade M25
Steel Grade Fe 500
Table 2. Loads.
Table 2. Loads.
Unit Weight of Concrete25 kN/m3
Dead load3.75 kN/m2
Live load3 kN/m2
Beam Load11 kN/m
Table 3. Seismic data.
Seismic ZoneV
Zone factor (Z)0.36
Soil TypeMedium
Damping Ratio5%
Response Reduction factor (R)5
Importance factor (I)1
Table 4. Comparison of the story displacements, ESA and X-direction (mm).
Storywithout Shear WallsShear Walls without OpeningsVertical OpeningsStaggered Openings
Story 1453.08937.21238.03238.173
Story 1351.74234.48835.43635.552
Story 1249.68531.61432.62832.724
Story 1146.95428.60929.65829.739
Story 1043.64925.4826.53826.603
Story 939.8722.25923.323.348
Story 835.71518.98719.99120.022
Story 731.2715.72316.66816.679
Story 626.61412.53213.39813.392
Story 521.8179.48910.25810.232
Story 416.9416.6817.3327.294
Story 312.0464.2054.7174.672
Story 27.2162.1712.5232.488
Story 12.7250.7070.8760.865
Table 5. Comparison of the story displacements, ESA, and X-direction (mm).
Storywithout Shear WallsShear Walls without OpeningsVertical OpeningsStaggered Openings
Story 1456.00038.12538.9939.163
Story 1354.47535.29136.28136.423
Story 1252.22132.31133.36433.482
Story 1149.27529.20330.28730.389
Story 1045.73825.97727.06527.146
Story 941.71522.66323.73123.796
Story 837.30719.30720.33220.373
Story 732.60615.96516.92716.952
Story 627.69512.70513.58513.583
Story 522.6489.60410.38210.366
Story 417.5326.7497.4057.37
Story 312.4114.2374.7524.716
Story 27.3812.1812.5342.498
Story 12.7490.7070.8750.873
Table 6. Comparison of the story displacements, response spectrum, and X-direction (mm).
Storywithout Shear WallsShear Walls without OpeningsVertical OpeningsStaggered Openings
Story 1442.00628.93829.28329.434
Story 1341.10526.86927.33927.468
Story 1239.74524.69925.25125.361
Story 1137.93522.43923.05723.15
Story 1035.72420.09220.75920.836
Story 933.15217.67318.37318.433
Story 830.25215.20615.92415.964
Story 727.04712.72213.44113.459
Story 623.55510.26210.96110.959
Story 519.7887.8788.5338.509
Story 415.7585.6346.2166.178
Story 311.4823.614.0874.041
Story 27.0251.9052.2442.207
Story 12.6940.6410.8070.793
Table 7. Comparison of the story displacements, response spectrum, and Y-direction (mm).
Storywithout Shear WallsShear Walls without OpeningsVertical OpeningsStaggered Openings
Story 1443.76929.2929.84530.009
Story 1342.74327.15927.82227.96
Story 1241.25224.93125.65925.776
Story 1139.30522.61923.39323.493
Story 1036.95120.22421.02821.11
Story 934.2317.76418.58318.648
Story 831.17915.26216.0816.122
Story 727.82212.7513.55113.574
Story 624.17810.2711.03211.03
Story 520.2647.8728.5728.554
Story 416.0935.626.2326.194
Story 311.6813.5934.0884.049
Story 27.1011.8912.2382.2
Story 12.6880.6340.8010.796
Table 8. Comparison of the story displacements, time history, and X-direction (mm).
Storywithout Shear WallsShear Walls without OpeningsVertical OpeningsStaggered Openings
Story 1445.72734.7428.74928.662
Story 1344.90732.40226.85426.753
Story 1243.65929.93524.80524.699
Story 1141.94127.32922.65122.546
Story 1039.9824.5720.40520.303
Story 937.97921.66718.0918
Story 835.54618.65215.72715.644
Story 732.59415.57713.33713.266
Story 629.04412.51110.94210.87
Story 524.8559.548.5758.51
Story 420.0436.7596.2896.214
Story 314.6984.284.1594.096
Story 29.0092.2242.2922.23
Story 13.4540.7360.8240.807
Table 9. Comparison of the story displacements, time history, and Y-direction (mm).
Storywithout Shear WallsShear Walls without OpeningsVertical OpeningsStaggered Openings
Story 1446.47132.9132.80932.34
Story 1345.4530.69430.60830.14
Story 1243.93728.36328.2427.777
Story 1141.89125.90325.75525.312
Story 1039.32723.29823.16822.751
Story 936.56220.55420.50620.127
Story 833.95917.69717.79517.457
Story 730.94314.77815.05814.767
Story 627.44711.86512.32512.078
Story 523.4199.0399.6349.431
Story 418.8496.3977.0436.882
Story 313.7914.0434.6414.523
Story 28.4122.0952.5452.477
Story 13.1860.6860.9090.896
Table 10. Comparison of the measured story drift, static analysis, and X-direction (mm).
Storywithout Shear WallsShear Walls without OpeningsVertical OpeningsStaggered Openings
Story 141.3472.7252.612.621
Story 132.0572.8742.8082.828
Story 122.7313.0052.972.985
Story 113.3053.1293.123.136
Story 103.7783.2223.2383.255
Story 94.1553.2713.3093.326
Story 84.4453.2743.3233.344
Story 74.6563.1923.273.288
Story 64.7973.0433.1413.161
Story 54.8762.8082.9272.938
Story 44.8952.4762.6162.624
Story 34.832.0342.1952.185
Story 24.491.4631.6471.624
Story 12.7250.7070.8760.865
Table 11. Comparison of the story drift, static analysis, Y-direction (mm).
Storywithout Shear WallsShear Walls without OpeningsVertical OpeningsStaggered Openings
Story 141.5262.8342.7222.74
Story 132.2532.982.9172.941
Story 122.9463.1083.0763.094
Story 113.5383.2263.2223.242
Story 104.0233.3143.3343.352
Story 94.4083.3563.3993.423
Story 84.7013.3583.4053.425
Story 74.9113.263.3433.368
Story 65.0473.1013.2043.22
Story 55.1162.8552.9772.997
Story 45.1212.5122.6542.658
Story 35.1032.0572.222.218
Story 24.6321.4741.6591.631
Story 12.7490.7070.8750.873
Table 12. Comparison of the story drift, response spectrum, and X-direction (mm).
Storywithout Shear WallsShear Walls without OpeningsVertical OpeningsStaggered Openings
Story 141.1442.1382.0382.052
Story 131.7772.2562.1972.215
Story 122.3182.3552.3182.334
Story 112.7322.4432.4242.439
Story 103.0632.5082.5032.519
Story 93.3382.5432.5522.568
Story 83.5722.5442.5662.585
Story 73.7822.5042.5422.559
Story 63.9812.4142.4722.491
Story 54.1672.2632.3452.357
Story 44.3422.0352.1452.153
Story 34.4761.711.8521.841
Story 24.3331.2661.441.417
Story 12.6940.6410.8070.793
Table 13. Comparison of the story drift, response spectrum analysis, and Y-direction (mm).
Storywithout Shear WallsShear Walls without OpeningsVertical OpeningsStaggered Openings
Story 141.2782.2012.1182.136
Story 131.9232.3162.2732.295
Story 122.4712.412.3922.407
Story 112.8892.4932.4932.511
Story 103.2212.5512.5662.58
Story 93.4992.582.6082.628
Story 83.7342.5732.6142.63
Story 73.9452.5262.5822.605
Story 64.142.4292.5042.519
Story 54.3192.2712.3692.387
Story 44.4832.0372.1612.163
Story 34.61.7071.8591.857
Story 24.4161.261.441.411
Story 12.6880.6340.8010.796
Table 14. Comparison of the story drift, time history analysis, X-direction (mm).
Storywithout Shear WallsShear Walls without OpeningsVertical OpeningsStaggered Openings
Story 141.042.3381.9071.909
Story 131.6242.4672.0482.054
Story 122.2062.6062.1552.154
Story 112.7142.7592.2462.243
Story 103.1232.9032.3152.305
Story 93.5333.0152.3632.356
Story 83.8623.0752.3972.381
Story 74.0783.0662.3962.376
Story 64.2332.9722.3672.364
Story 54.8122.782.2872.296
Story 45.3452.4792.1312.124
Story 35.6892.0561.8691.866
Story 25.5551.4931.471.43
Story 13.4540.7360.8310.807
Table 15. Comparison of the story drift, time history analysis, Y-direction (mm).
Storywithout Shear WallsShear Walls without OpeningsVertical OpeningsStaggered Openings
Story 141.1972.3112.2132.201
Story 131.8172.4322.3682.363
Story 122.4462.5412.4852.466
Story 112.9942.642.5872.561
Story 103.4912.7452.6622.626
Story 93.9132.8562.7272.679
Story 84.2042.9192.7832.741
Story 74.3432.9142.7572.722
Story 64.3282.8262.6922.653
Story 54.572.6422.5912.549
Story 45.0582.3542.4042.368
Story 35.3791.9472.0982.046
Story 25.2261.411.6391.592
Story 13.1860.6860.9090.896
Publisher’s Note: MDPI stays neutral with regard to jurisdictional claims in published maps and institutional affiliations.

