
Experimental Studies for Shear and Multi-Impact Resistance Performance of Sand–Geofoam Material
by
 ,
,
Qi Ge
1, 
Wenhao Zuo
1,
Renkuan Liu
1,
Baoying Zhu
1,
Peng Zhao
2,
Li Wan
3,*,
Yifan Wang
1 and
Rong Zhao
1 1
MOE Key Laboratory of Deep Earth Science and Engineering, College of Architecture and Environment, Sichuan University, Chengdu 610065, China
2
State Key Laboratory of Geohazard Prevention and Geoenvironment Protection, Chengdu University of Technology, Chengdu 610059, China
3
College of Hydraulic and Hydropower Engineering, Sichuan University, Chengdu 610065, China
*
Author to whom correspondence should be addressed.
Buildings 2022, 12(5), 633; https://doi.org/10.3390/buildings12050633
Submission received: 2 April 2022
/
Revised: 22 April 2022
/
Accepted: 4 May 2022
/
Published: 10 May 2022
(This article belongs to the Section Building Structures)
Abstract
:In the case of earthquake and rockfall disasters, it is proposed to replace part of sand with geofoam material to form sand–EPS and sand–EPE composite cushions to improve the ability of structures to resist disasters. The shear performance of the sand–EPS beads mixture material with different moisture contents, the impact resistance of sand–EPS beads and sand–flocculent-EPE layered composite materials with different cushion thicknesses and different mass ratios were studied by direct shear tests and multi-impact tests. The results showed that with the increase in the moisture content, the shear strength of the sand–EPS beads decreased, the internal friction angle of sand–EPS decreased first and then increased, and the cohesion of sand–EPS increased first and then decreased. The sand–geofoam layered cushion had better buffering performance. Sand–EPE has better durability than Sand–EPS.
1. Introduction
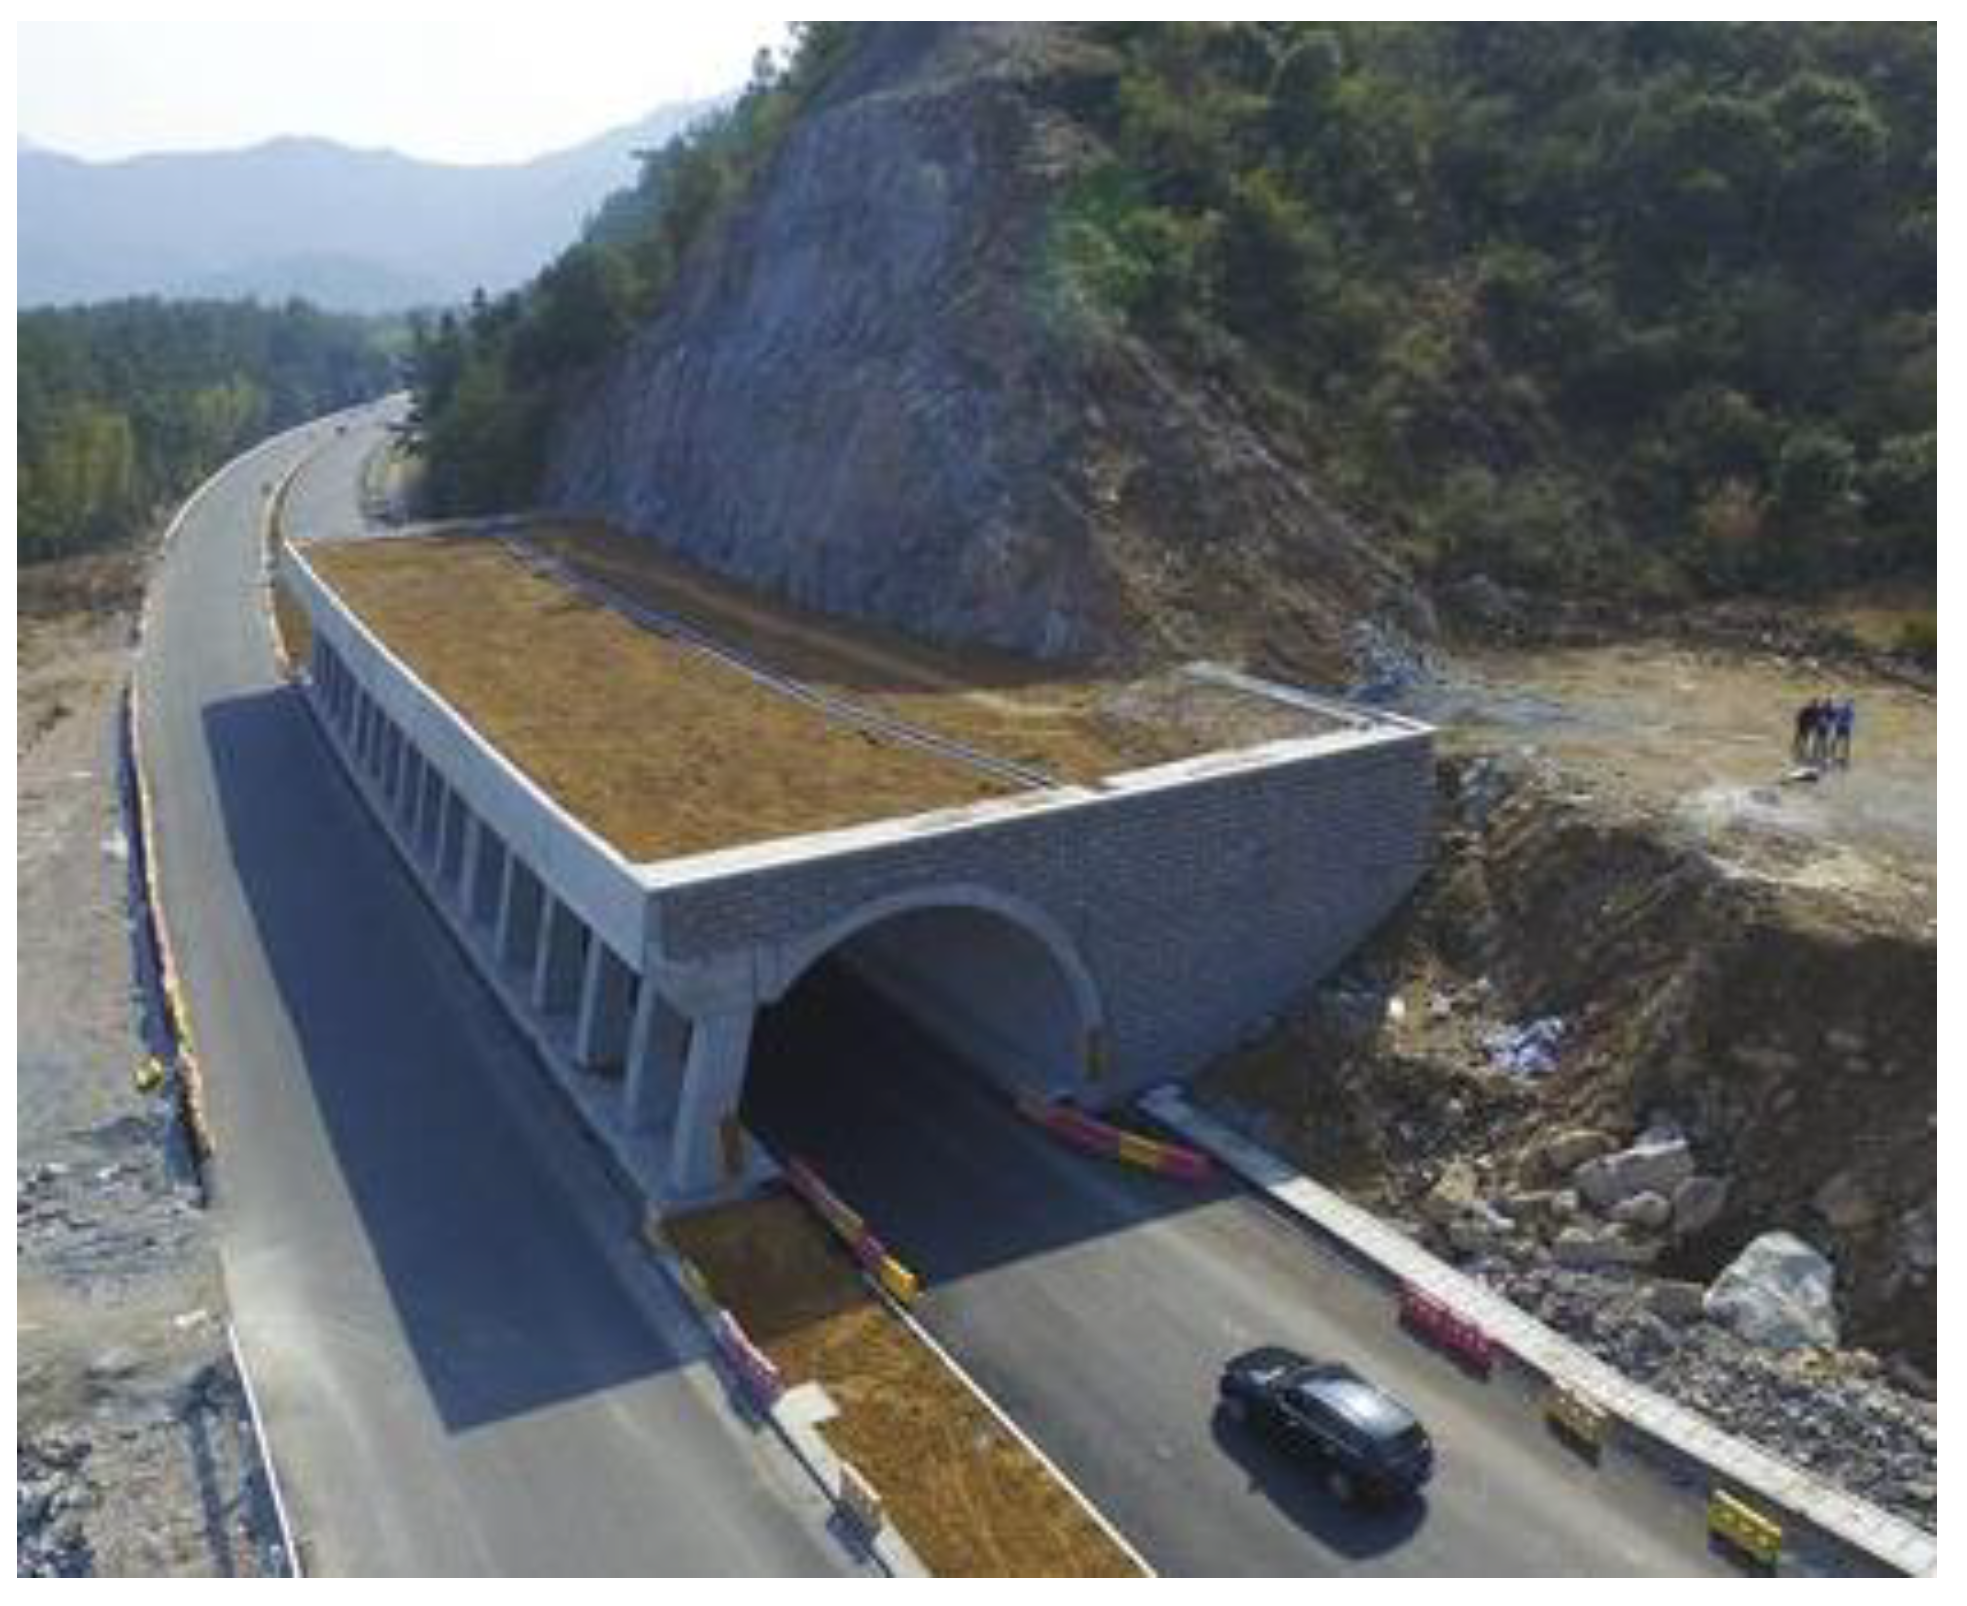
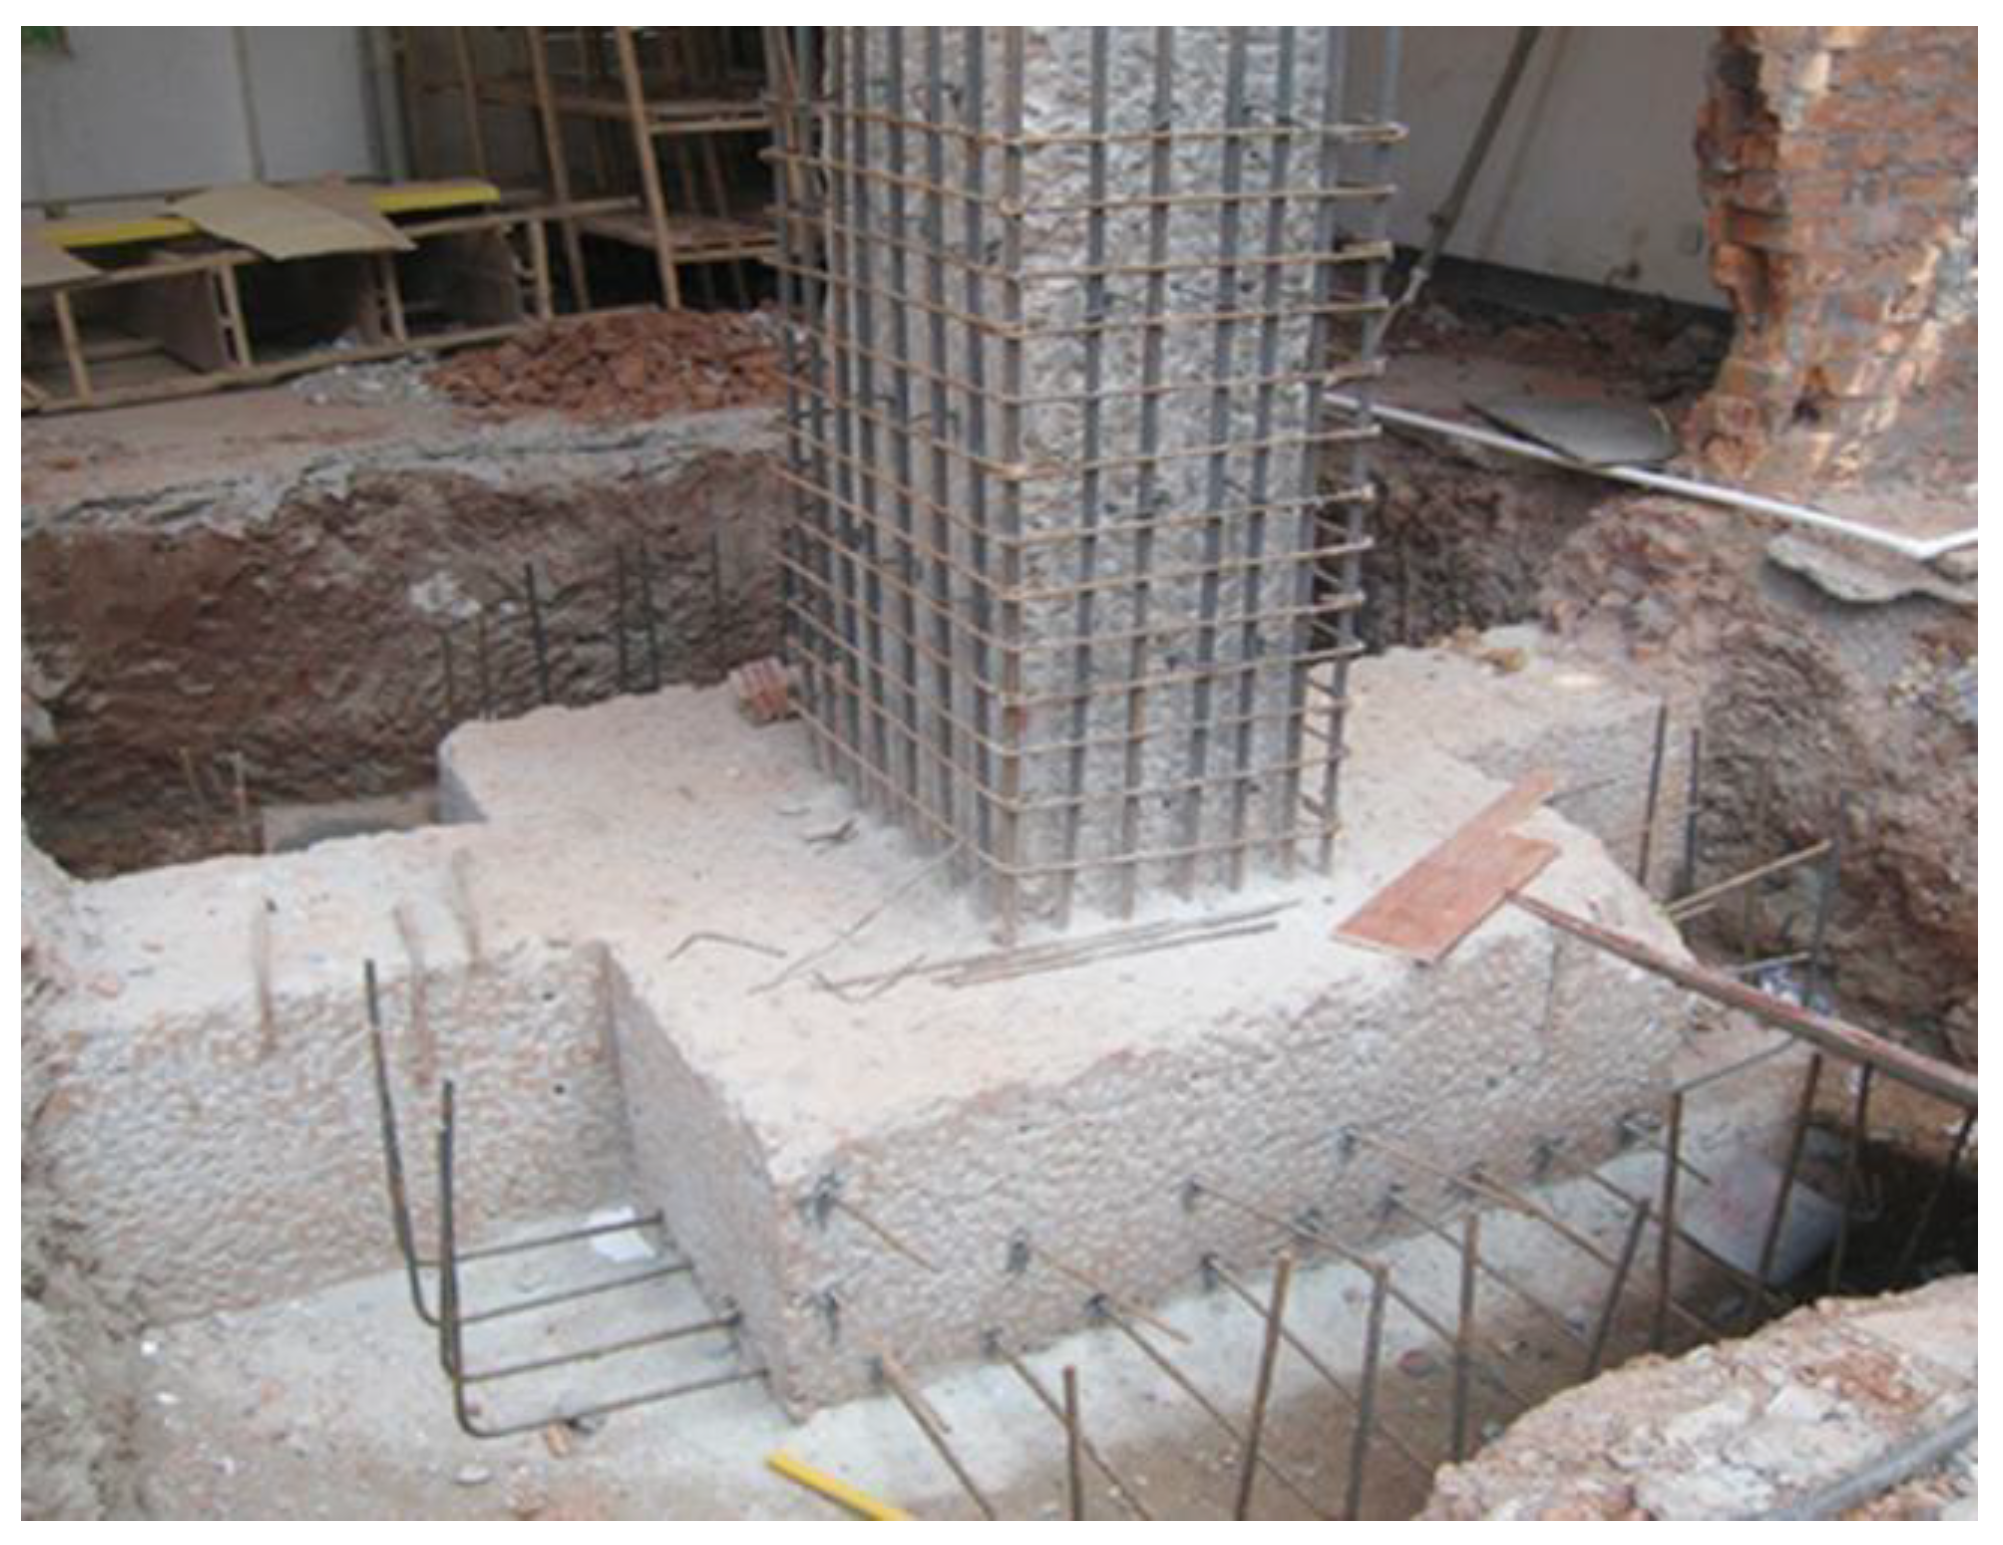
In recent years, frequent disasters have brought vast losses of life and property, such as earthquakes, floods, landslides, and rockfalls. Currently, rock-shed structures are used to prevent the impact damage caused by rockfalls and landslides in China. Rock-shed structures are frame structures with slabs and cushion materials on the top [1,2,3], as shown in Figure 1. The research showed that the damage of the rock-shed structures was mainly caused by earthquake and rainstorms after the Wenchuan earthquake. In both disasters, 80 percent of the damage was caused by rockfalls [4]. The cushion has a significant influence on the impact resistance of rock-shed structures [5,6], so it is necessary to study the impact resistance of cushion material. Sand–expanded-polystyrene (EPS) blocks and Sand–expandable-polyethylene (EPE) blocks have been used as cushion materials [2,3,4,7,8]. In addition, earthquakes have caused damage to houses, dams, slopes, bridges, and other engineering structures. Many improvement methods have been proposed to reduce earthquake damage and protect structures from ground vibration, among which seismic isolation and absorption is one of the methods to improve the seismic performance of foundations. However, its application has been limited because of the high cost and the requirements of many experiments and field experience [9]. An alternative approach is to use lightweight and compressible materials between the foundation and the structure [10,11,12], such as tyre aggregate, wood chips, and EPS geofoam as isolation materials [9,13,14,15,16], as shown in Figure 2. These materials not only reduce the cost and improve corresponding performance, but also protect the environment and provide environmental benefits by recycling these materials instead of storing them. EPS and EPE are used to prevent the impact of rockfalls to the rock shed and reduce seismic damage to structures, and it is necessary to study the basic mechanical properties and impact resistance of materials.
In the geotechnical application, EPS can generally be used in two different forms, that is, EPS beads mixed with soil and EPS blocks directly contacted with parent materials. Extensive studies have been conducted on the use of EPS blocks and sand. Bartlett et al. [17] conducted laboratory, full-scale tests and numerical modeling to study the performance of the EPS block on protecting buried pipelines and culverts; the results showed that it can be used as a lightweight slot-trench cover system in urban roadways to protect buried high-strength steel pipelines. Direct shear tests were used to study the interface strength parameters of the EPS geofoam block interacting with sand [18,19,20,21,22,23]. The results showed that the interface friction coefficient of the EPS-block–sand interface ranged from 0.55 to 0.7, depending on the thickness of the sand below the EPS geofoam [18]. The friction coefficient of the EPS–sand interface was similar to that of the sand material [19]. The EPS–sand interaction mechanism could be expressed in three stages: pure friction, friction adhesion, and pure adhesion, depending on the applied normal stress [20]. No significant change occurred in the interface friction coefficient under dry and wet conditions [21]. The measured interface strength of the EPS–sand material increased with the increase in the density of the EPS–sand material, and the interface friction angle increased uniformly [22]. In the study of Basti et al. [23], a large direct shear test was used to study the influence of variables such as relative sand density, EPS density, applied normal stress, half amplitude of cyclic shear strain, and cycle number on the interface response of sand–EPS geofoam. The results showed that the dynamic shear stress generally increased with the increase in the EPS density and the normal stress. In addition to the direct shear test, large field and indoor small impact tests were also used to study the impact resistance of sand–EPS blocks against the rockfall impact on rock shed [3,4]. Through the analysis and comparison of the test results, it was concluded that the impact resistance of the sand–EPS block was better than that of the sand [3]. The sand–EPE block was the best cushion to resist the rockfall impact and protect the rock-shed structure. The buffering performance of the sand–EPE block composite cushion was good under multi-impact tests in the laboratory [4]. However, the buffering performance of the sand–EPS block composite material deteriorated with the increase in the impact time. For the thicker geofoams, the buffering performance of the composites did not change much from the second impact to the fifth impact, especially for sand–EPE geofoam. Bhatti [8] studied the effect of the density and thickness on the energy dissipation of the cushion with EPS. The results showed that the addition of the EPS cushion significantly improved the energy dissipation capacity of the concrete structure. Ouyang et al. [7] used numerical methods to study the influence of EPS height on the impact force and deflection of the shed. A cushion consisting of geogrid reinforced soil and EPS effectively absorbed the energy generated by the rockfall. The number and strength of geogrids and the height of the EPS thickness had a significant effect on the reduction of the impact force and deflection.
Despite the EPS block having certain advantages [24], it has the disadvantages of the need of transporting to the site from the production site, inadaptation to the irregular volume because of the regular shape, and being unalterable to satisfy the requirement of the field soil due to the constant value of the characteristics of the EPS block [25]. To overcome the above disadvantages of EPS blocks, it is suggested to mix EPS beads and sand to make a light filling material [26,27,28,29]. A large number of static and dynamic studies were carried out on the use of EPS beads mixed with sand by an unconfined compression test [30,31], direct shear test [20,31,32], large cycle direct shear test [33,34], resonance column test [35,36], and triaxial compression test [27,36,37,38,39,40]. The results of unconfined compression tests showed that the unconfined compressive strength decreased with the increase in the EPS content [31]. The direct shear test results in the study of Ibrahim et al. [32] showed that the shear strength of the EPS-beads–sand mixture was superior to that of the comparison sand. Compared with other mixture materials, the EPS-beads–sand mixture with 40% EPS content had the best shear strength. Alaie and Chenari [33] and Chenari et al. [34] studied the monotonic, cyclic, and post-cyclic characteristics of the interface between the EPS–sand mixture and geogrid by using the large cycle direct shear test. The experimental results showed that the interface shear stiffness between the geogrid and EPS–sand mixture decreased with the increase in the EPS content, and the damping ratio increased significantly [33]. At the same EPS content, the interface damping increased by about two times regardless of the shear displacement amplitude. Under different normal stress levels, the hardening coefficient increased with the increase in the cycle number [34]. According to the resonance column test, under different confining pressures, Gmax decreased as the content of EPS beads in the EPS–sand mixture increased, which was mainly related to the low stiffness of the added EPS beads. The small strain shear modulus increased with the increase in effective confining pressure [36]. With the increase in the EPS content, the shear strength decreased, and the volumetric strain increased. The increase in the confining pressure enhanced the strength of the mixture. The optimal EPS content for a reasonable balance of unit weight, strength, and deformation was 0.5% by weight [27]. The initial elastic modulus decreased linearly with the increase in the EPS bead content. The results showed that the EPS bead inclusion did not increase the maximum deviational stress compared with the sand sample [30]. The elastic and viscous properties of SEM were similar to those of sand, and the peak friction angle and the residual friction angle were both smaller than those of the sand [38]. The damping and shear modulus of the sand–EPS mixture samples had a significant relationship with the mass percentage of EPS. When the confining pressure remained unchanged, the increase in EPS content led to the increase in the damping ratio to 100% or more. In contrast, for all confining pressure values, the shear modulus of the mixture decreased significantly with the increase in EPS content [39]. The specific weight, the shear strength, the internal friction angle, and the initial elastic modulus of the sand–EPS mixture were reduced when the EPS bead content increased, and the cohesion of the sample increased [40].
Based on the above literature analysis, scholars have studied the static and dynamic characteristics of the sand–EPS mixture in many research studies. However, no one has studied the impact resistance of the sand–EPS-beads cushion, and few authors have studied the effect of the moisture content on shear strength by the direct shear test. Therefore, more tests are required to study the effect of the moisture content on the shear strength of the sand–EPS-beads mixture. Only Zhao et al. [2,3,4] studied the impact resistance of the sand and EPE block cushion, but no one has studied the impact resistance of the sand–EPS beads and sand–flocculent-EPE layered composite materials.
For the lack of research on the effect of the moisture content on the shear strength of sand–EPS beads and the impact performance of sand–flocculent-EPE material, the direct shear tests and multi-impact tests were carried out. In this paper, the direct shear tests of the sand and sand–EPS mixture material were carried out to study effects of the moisture content on shear stress–shear displacement curve, shear strength, internal friction angle, and cohesion. The effect of the normal stress on shear strength was also investigated. Because the shear box in the direct shear test is small, it is difficult to mix sand and flocculent EPE for the direct shear test, so the direct shear test was only carried out the sand–EPS mixture material. The multi-impact tests of the sand, sand–EPS beads, and sand–flocculent EPE mixture materials were then conducted to investigate the effects of the impact height, the geofoam quantity, the geofoam placement height, and the geofoam type on the multi-impact resistance of the sand–geofoam composite material. When sand is mixed with EPS beads and flocculent EPE for the impact test, most EPS and EPE are extruded after one impact, so the effect of the mixed material cannot be achieved. Therefore, in the impact test, the mixing of sand with EPS and EPE was carried out in layered placement.
2. Experimental Program
2.1. Direct Shear Tests
A series of direct shear tests were conducted to study the shear performance of the sand and EPS beads mixture material. The properties of the materials and the test procedure are briefly described below.
2.1.1. Material Properties
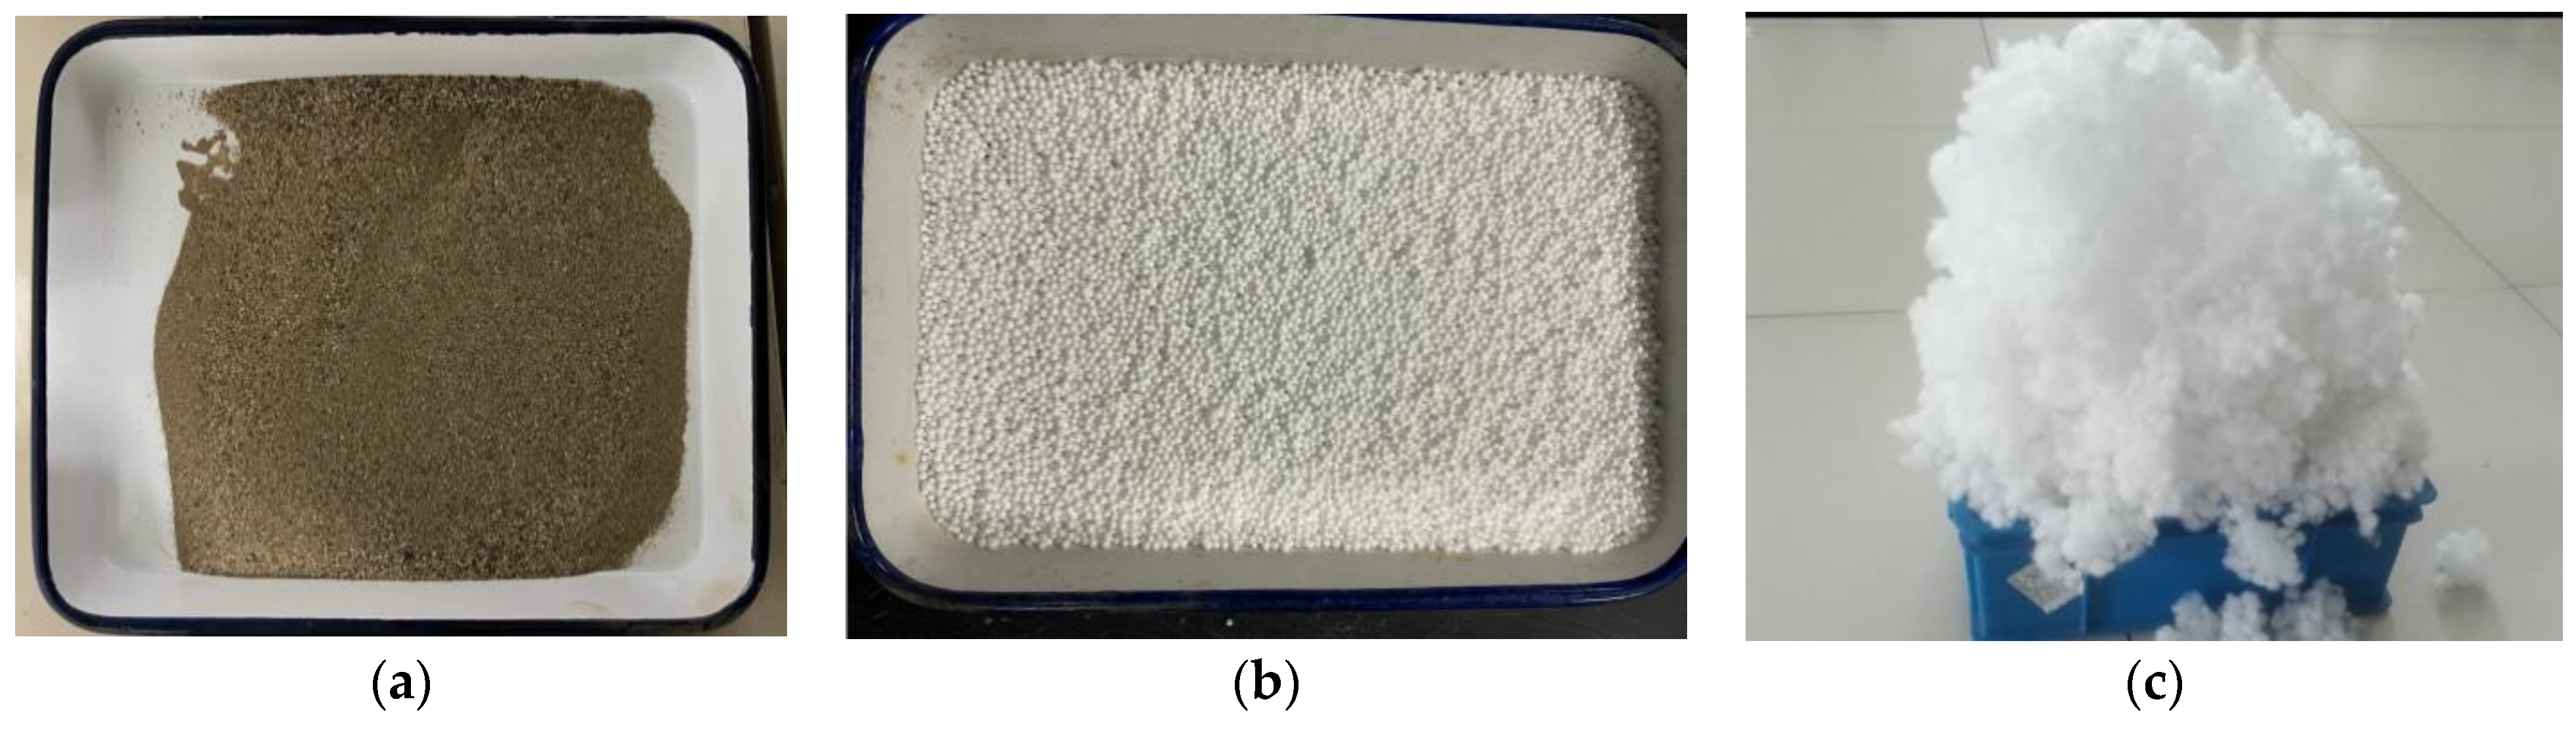
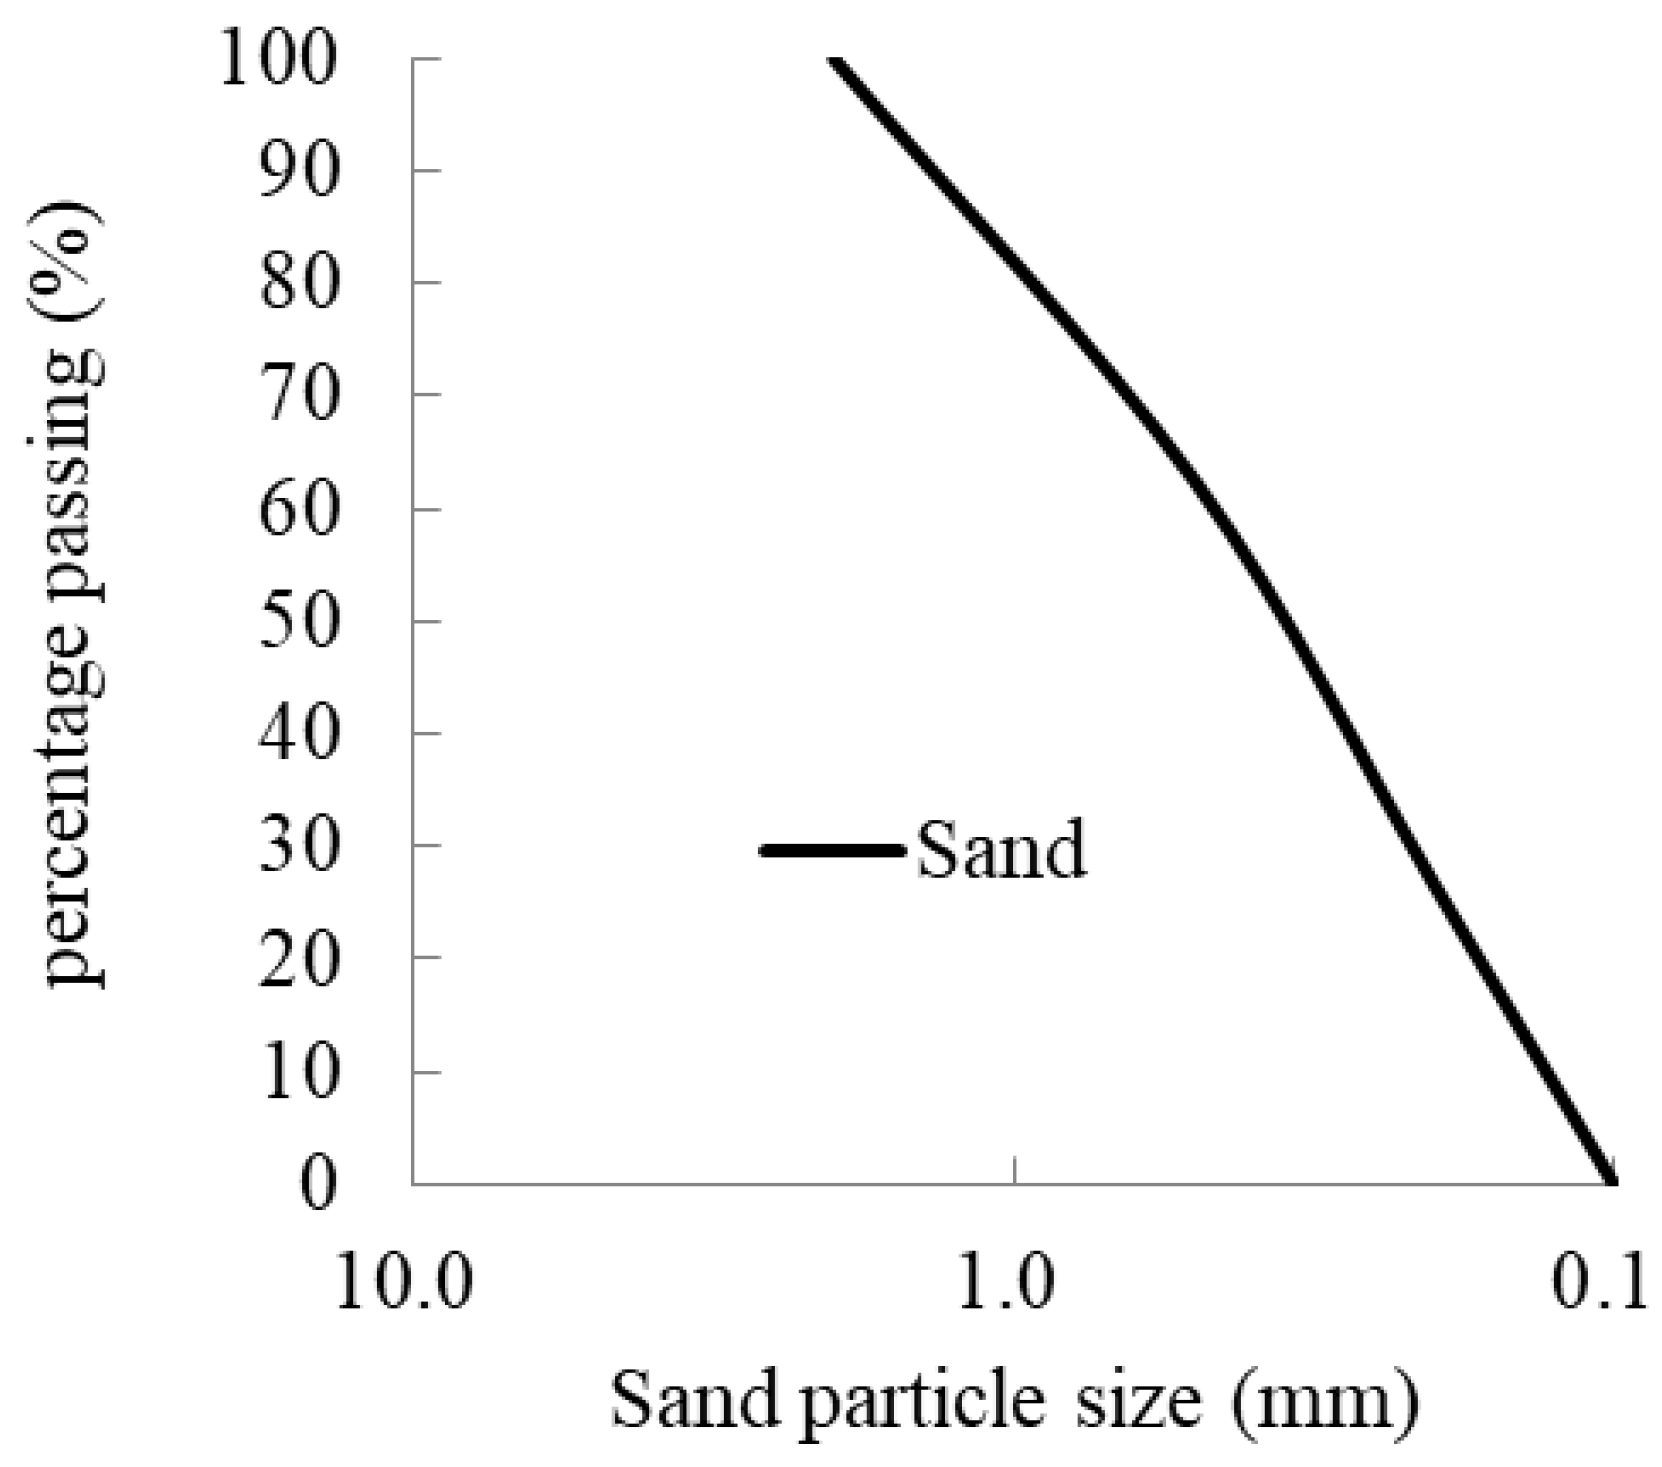
The materials were river sand and EPS beads for construction, as shown in Figure 3. The maximum and minimum values of the dry unit weight were 16.26 kN/m3 and 14.21 kN/m3, respectively. The specific gravity of the sand was 2.63. The particle size distribution curve of the sand is as shown in Figure 4. EPS was a spherical bead geofoam with a particle size of 3–5 mm, as shown in Figure 3b. The materials included pure sand and the sand–EPS-beads mixture.
2.1.2. Direct Shear Test Method
The strain-controlled direct shear apparatus was used to determine the shear strength of pure sand and sand–EPS mixture samples. According to the consolidated drainage (CD) triaxial test results, Deng and Xiao [27] recommended that a good combination of added EPS beads weight and shear strength of sand–EPS beads was achieved when the optimal dosage of EPS beads was 0.5%. Therefore, in this paper, the mass percentage of added EPS beads was 5%. A total of 36 tests were conducted based on GB/T 50123-2019 [41]. The shear box was a cylinder with a diameter of 60 mm and a height of 30 mm. Each sample was carried out with four different normal stresses of 100 kPa, 200 kPa, 300 kPa, and 400 kPa. The 0%, 5%, and 10% moisture contents were used as experimental variables. The effects of the moisture content and the normal stress on the shear properties of pure sand and the sand–EPS mixture were investigated. The materials were dried before being put into the shear box. The weight of the materials was measured. The mixed materials were then configured according to the weight ratio and the moisture content calculated in advance. Finally, they were evenly stirred and put into the shear box. The loading rate of the horizontal displacement was the recommended shearing rate of 0.9 mm/min. When the shear stress reached stability or had significant regression, it indicated that the sample had shear damage, and the test was terminated. The values of the dynamometer and the shear displacement were recorded simultaneously with each turn of the handwheel. All the tests were conducted with four samples.
2.2. Laboratory Multi-Impact Tests
Laboratory tests for layered sand–geofoam composite cushions under multi-impact loading were performed to study and compare the impact resistance of sand–EPS and sand–EPE cushions. The EPE material was flocculent, shown in Figure 3c. The detailed conditions, procedures, and instruments are described as follows.
2.2.1. Test Instruments
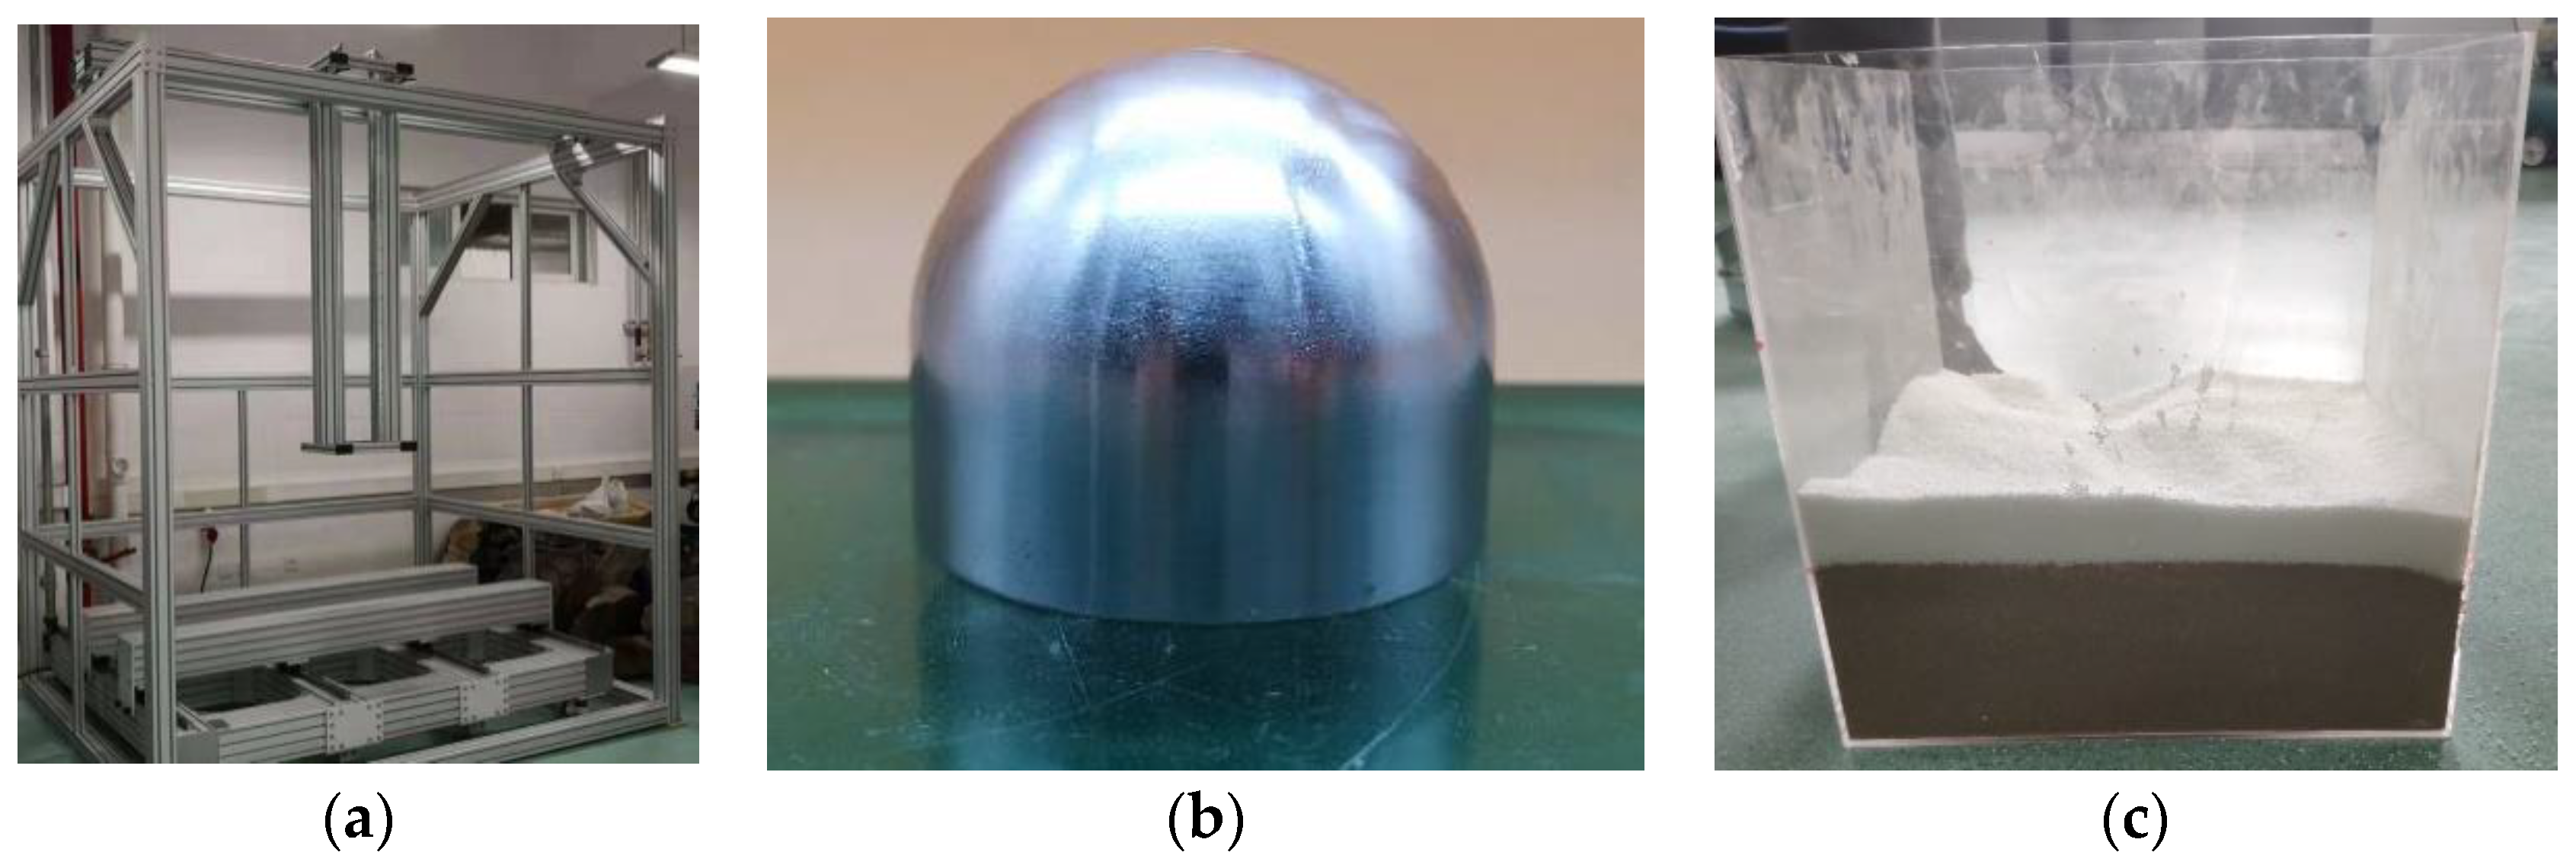
A test device designed by authors was used to perform the impact testing, as shown in Figure 5a. The impact test device consists of a fixed metal frame, a sucker electromagnet, a data acquisition instrument, a falling hammer, and an acceleration sensor. The maximum falling height of the falling hammer is 2 m. The falling hammer with a mass of 1.041 kg is steel with a radius of the front hemisphere of 32.3 mm, as shown in Figure 5b. The sand–geofoam composite materials were placed in a box with a dimension of 300 mm × 300 mm × 300 mm made of acrylic, as shown in Figure 5c. The box was inhibited in the lateral direction. The acceleration sensor was placed on the impact surface to measure the impact force of the falling hammer.
2.2.2. Test Method
EPS is a type of particle, and the composite cushion was placed by the ratio of the thicknesses of EPS and sand. To compare the resistance property of geofoam, a conventional sand cushion testing was also designed. The sand–EPS composite cushion testing consisted of two schemes: (1) The cushion material was pure sand, and the cushion thicknesses were 100 mm, 150 mm, and 200 mm, respectively. The impact height was 1 m. (2) The ratio of the EPS content was changed by controlling the thickness of EPS added into the composite cushion. Firstly, the 30 mm, 60 mm, and 90 mm sands were placed at the bottom of the acrylic box, respectively, and the EPS of 90 mm, 60 mm, 30 mm were then placed on the top of the sand. Finally, the sand with 30 mm was placed on the top of the EPS. (3) The total thickness of the composite cushion was 150 mm, and the thickness of the geofoam was 30 mm. The placement height of the EPS was varied. As the same with (2), there were three layers. In the first group, the bottom layer was the 90 mm sand, the middle layer was the 30 mm EPS, and the top layer was the 30 mm sand, which is the condition number 10 shown in Table 1. The thicknesses of the three layers in the second and third groups were 60 mm, 30 mm, 60 mm, and 30 mm, 30 mm, 90 mm, respectively, which are the condition numbers 14 and 13, respectively, as shown in Table 1. The impact test of the sand–EPE composite cushion still considered the previous three schemes. The difference is as follows. Because EPE is a flocculent pearl cotton, it is not easy to control the proportion through the thickness, so the quality was used to control the proportion of the material. The corresponding weights of 30 mm, 60 mm, and 90 mm EPS were 68 g, 136 g, and 204 g, respectively. For the same scheme, the mass of EPE added was the same as that of the corresponding EPS. Therefore, in the impact test of the sand–EPE composite cushion, the corresponding added masses were 68 g, 136 g, and 204 g, respectively. The impact number in each testing was five. The multi-impact test conditions are shown in Table 1 and Table 2. In Table 1, ‘Sand: geofoam: sand’ represents the thicknesses of sand, geofoam and sand from the bottom to the top.
3. Results and Discussion
3.1. Results in Direct Shear Tests
3.1.1. Effect of the Moisture Content on Shear-Stress–Shear Displacement Curve
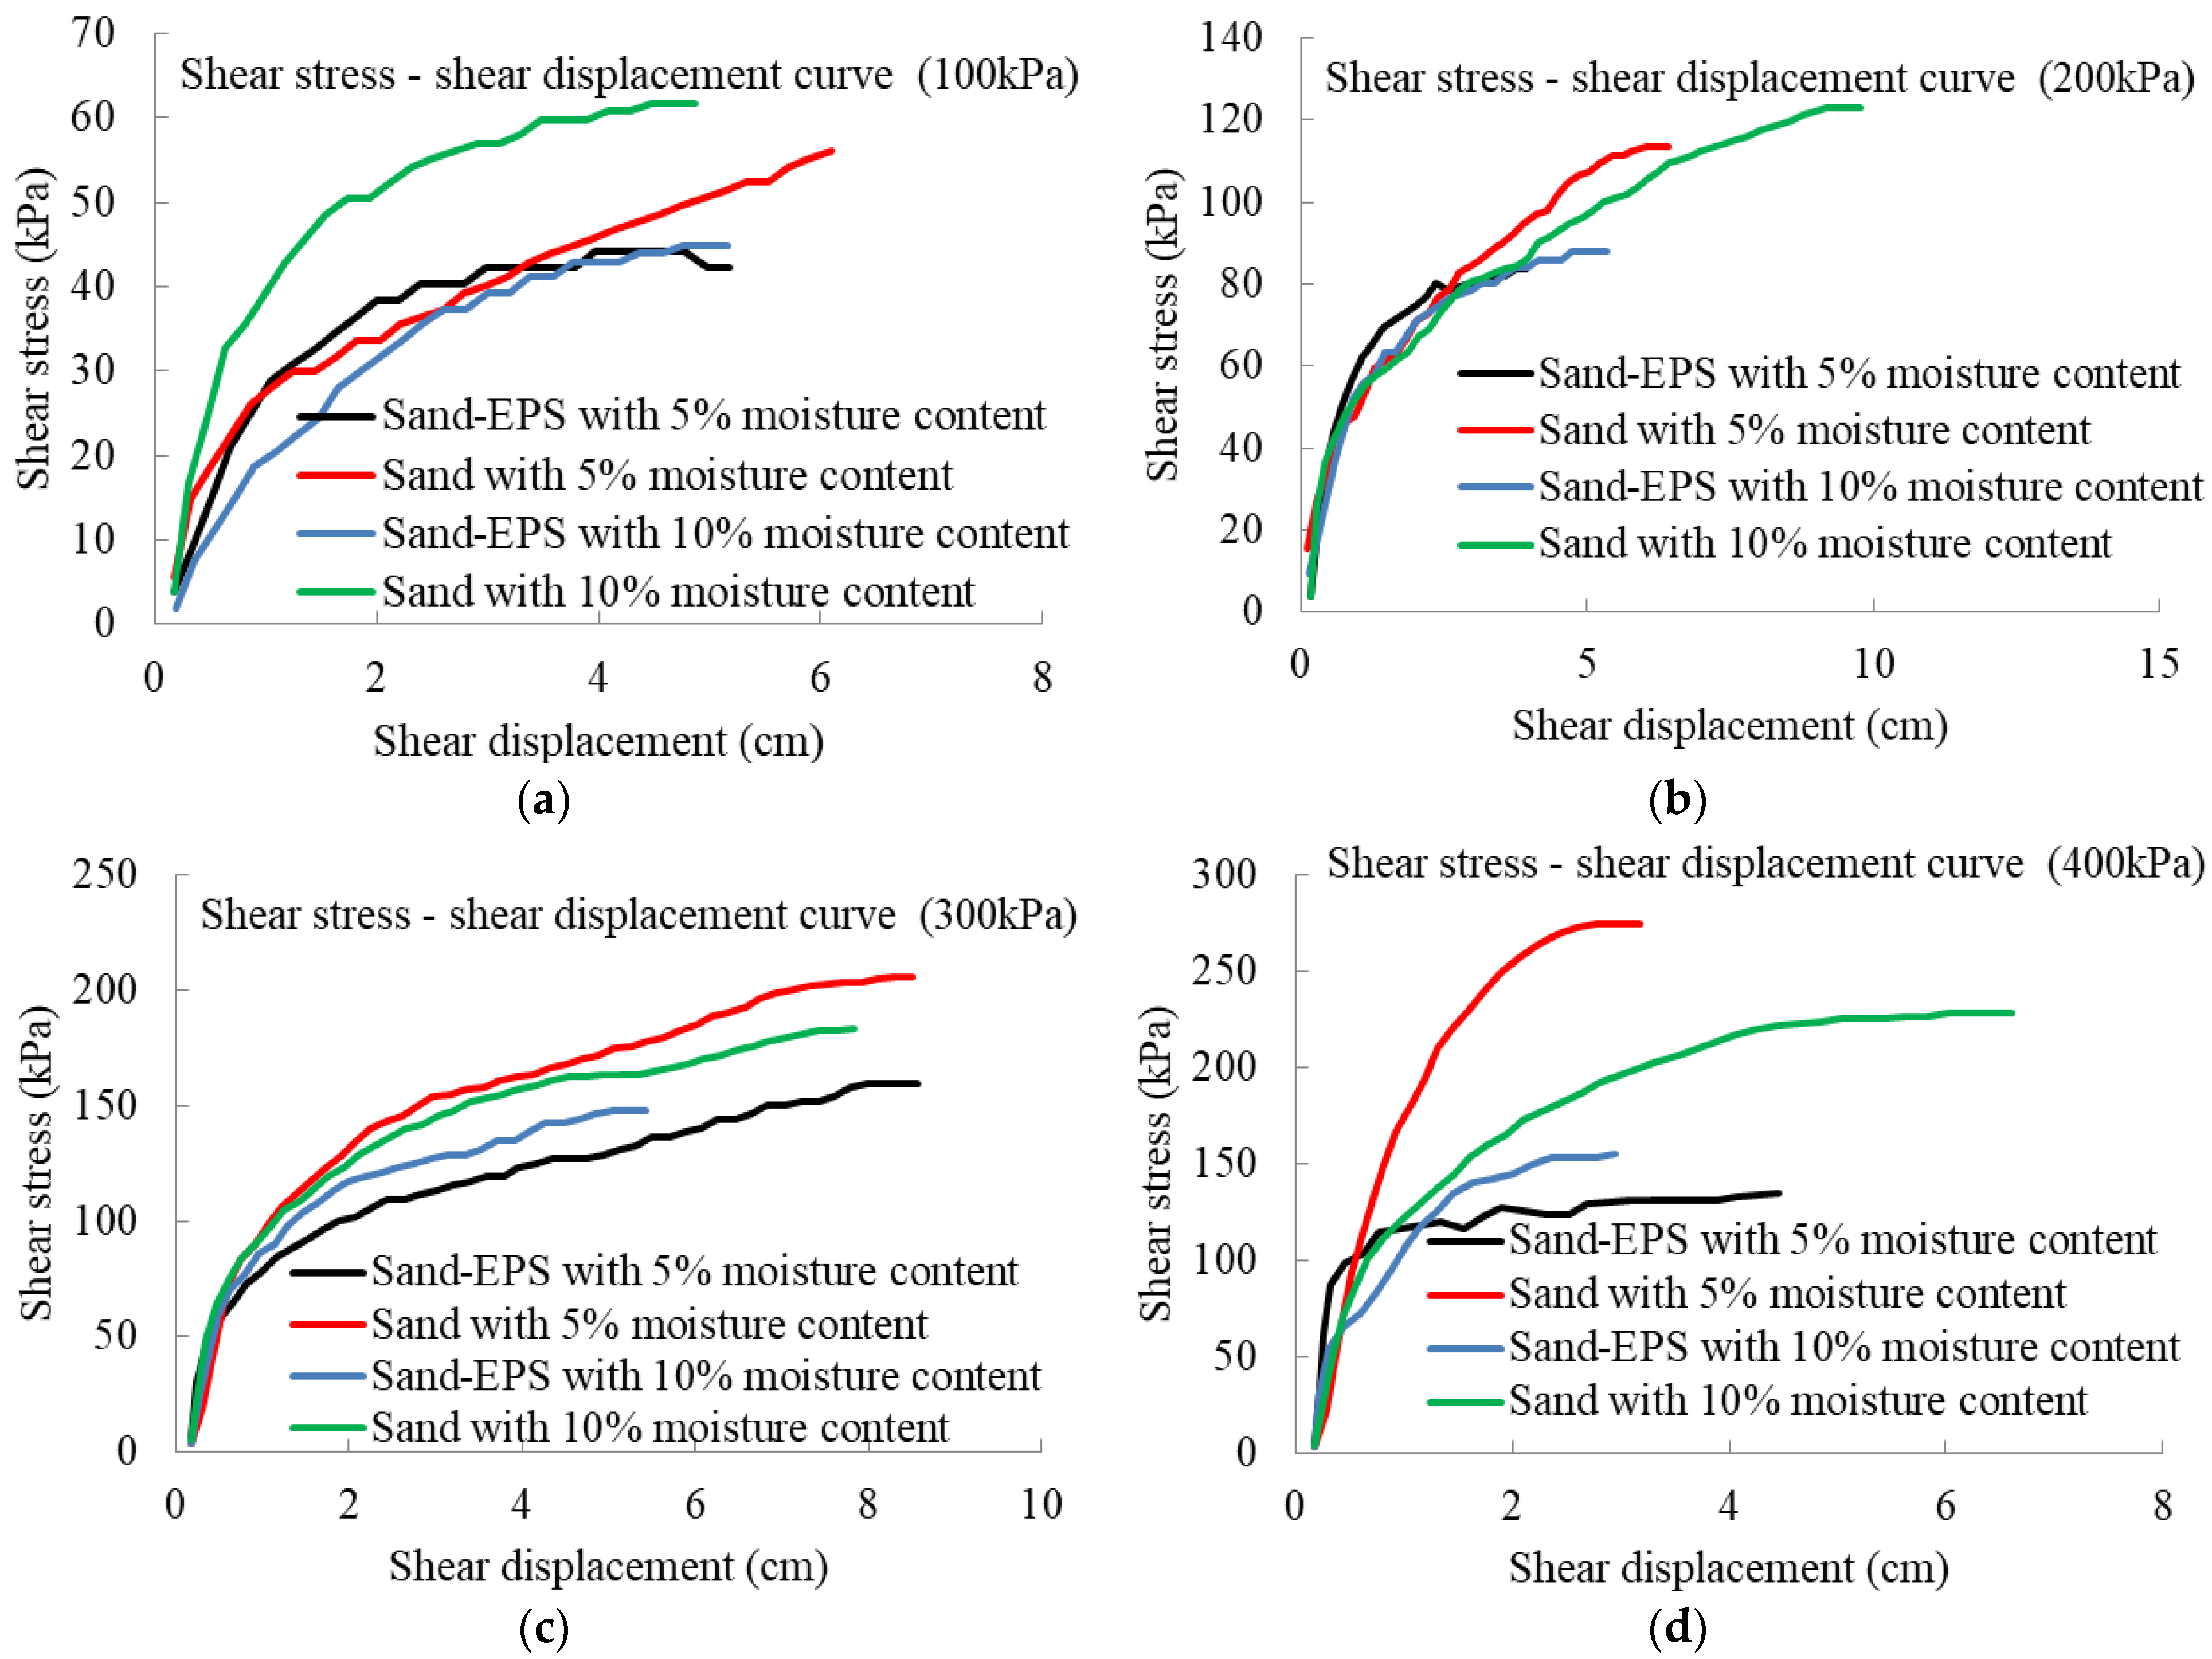
Shear-stress–shear displacement curves for sand and sand–EPS mixture materials with different moisture contents are shown in Figure 6. In general, the shear stress of the sand decreased with the increase in the moisture content. When the moisture content was 5%, the shear stresses reached stable values at the shear displacements of 6.10 cm, 5.42 cm, 7.32 cm, and 2.58 cm under the normal stresses of 100 kPa, 200 kPa, 300 kPa, and 400 kPa, respectively. For the moisture content of 10%, the corresponding shear displacements were 2.90 cm, 8.58 cm, 7.82 cm, and 6.01 cm, respectively, when the shear stresses reached stable values. For the sand–EPS mixture material, the shear stress of sand–EPS with 5% moisture content was larger than that of sand–EPS with 10% moisture content under the small normal stresses of 100 kPa and 200 kPa, while the opposite law was observed at large normal stresses of 300 kPa and 400 kPa. When the moisture content was 5%, the shear stresses reached stable values at the shear displacements of 2.98 cm, 3.35 cm, 7.78 cm, and 2.69 cm under the normal stress of 100 kPa, 200 kPa, 300 kPa, and 400 kPa, respectively, and 3.77 cm, 4.73 cm, 5.03 cm and 2.36 cm for the moisture content of 10%, respectively, when the shear stresses reached stable values. For sand–EPS, with the increase in the moisture content, when the shear stress reached a stable value, the corresponding shear displacement was larger under the small normal stress, but it was the opposite under the large normal stress. For the sand, it had the opposite law with sand–EPS. The reason may be that EPS has small water absorption. Under the small normal stress, the increased water was mainly in the sand, which reduced the friction between sand and EPS. Therefore, with the increase in the moisture content, the shear displacement increased when the shear stress reached a stable value. However, under the high normal stress, the high stress increased the contact between sand and EPS, and the influence of the moisture content on the friction between sand and EPS did not play such a significant role. When the shear stress reached the stable value, the shear displacement of sand–EPS with 5% moisture content was smaller than that of the sand with the same moisture content at the small normal stress, and it was the opposite at the large normal stress. However, when the moisture content was 10%, it had the opposite law.
For the same moisture content, the slopes of the shear stress and shear displacement curves of sand–EPS beads were smaller than those of the sand, indicating that the shear stiffness of the sand–EPS beads was smaller than that of the sand. With the increase in the moisture content, the shear stiffness of the sand–EPS beads decreased in the small shear displacement, while the shear stiffness of sand–EPS beads increased in the large shear displacement. The shear stiffness of sand was the opposite.
3.1.2. Effect of the Moisture Content and Normal Stress on Shear Strength
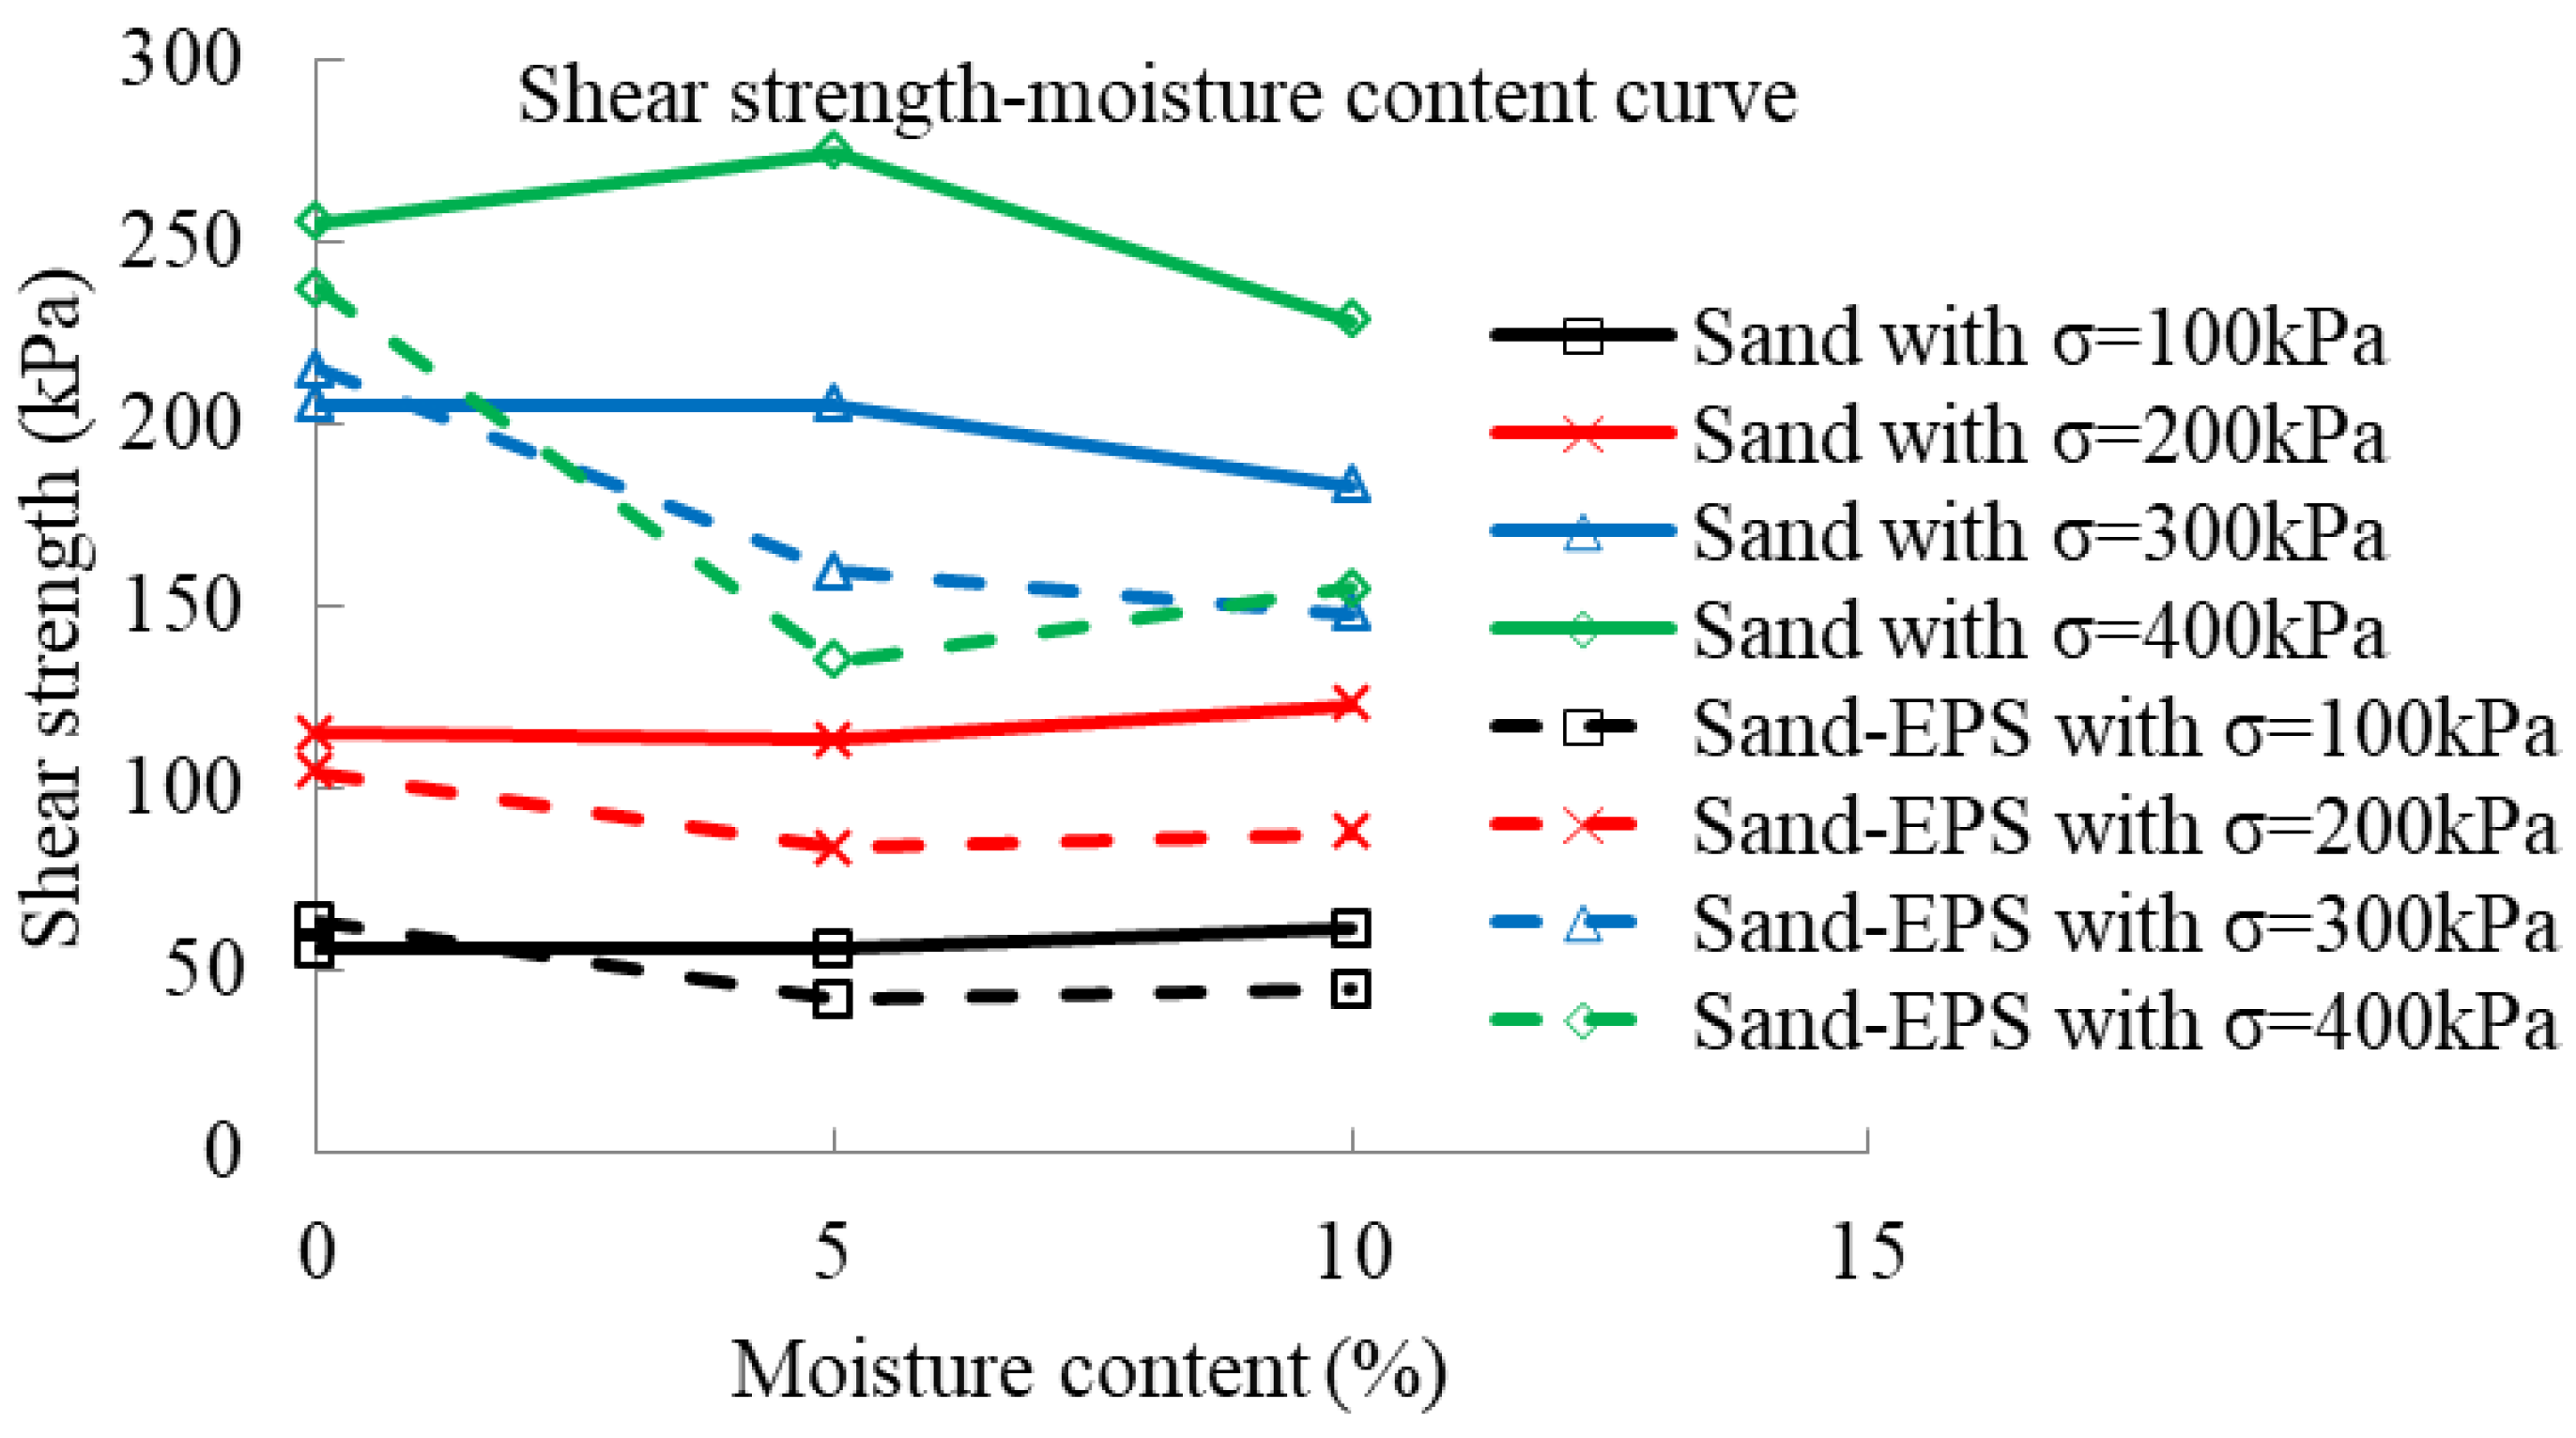
Shear-strength–moisture content curves under different normal stresses are shown in Figure 7. On the whole, the shear strength of the sand was greater than that of sand–EPS mixture material. Under the small normal stress, the shear strength of the sand–EPS mixture material decreased with the increase in the moisture content. Under the normal stresses of 100 kPa and 200 kPa, the shear strength decreased by 29.2% and 16.1%, respectively, when the moisture content was 10%. The shear strength tended to a constant value when the moisture content was 10%. Under the large normal stress, the shear strength first decreased, and then increased with the increase in the moisture content, but it generally decreased. Under the normal stresses of 300 kPa and 400 kPa, the shear strength decreased by 31.3% and 34.7%, respectively, when the moisture content was 10%. With the increase in the moisture content, the shear strength of the sand increased under the small normal stress. Under the normal stresses of 100 kPa and 200 kPa, the increase percentages were 10% and 6.7%, respectively. The shear strength of the sand first increased, and then decreased under the normal stresses of 300 kPa and 400 kPa. The decreased percentages were 10.9% and 10.5%, respectively. At 5% moisture content, the shear strength increased by 10% and 6.7% under the normal stresses of 100 kPa and 200 kPa, respectively. The shear strength of the sand with 5% moisture content decreased by 10.9% and 16.8% under the normal stresses of 300 kPa and 400 kPa, respectively, compared with the sand with 10% moisture content.
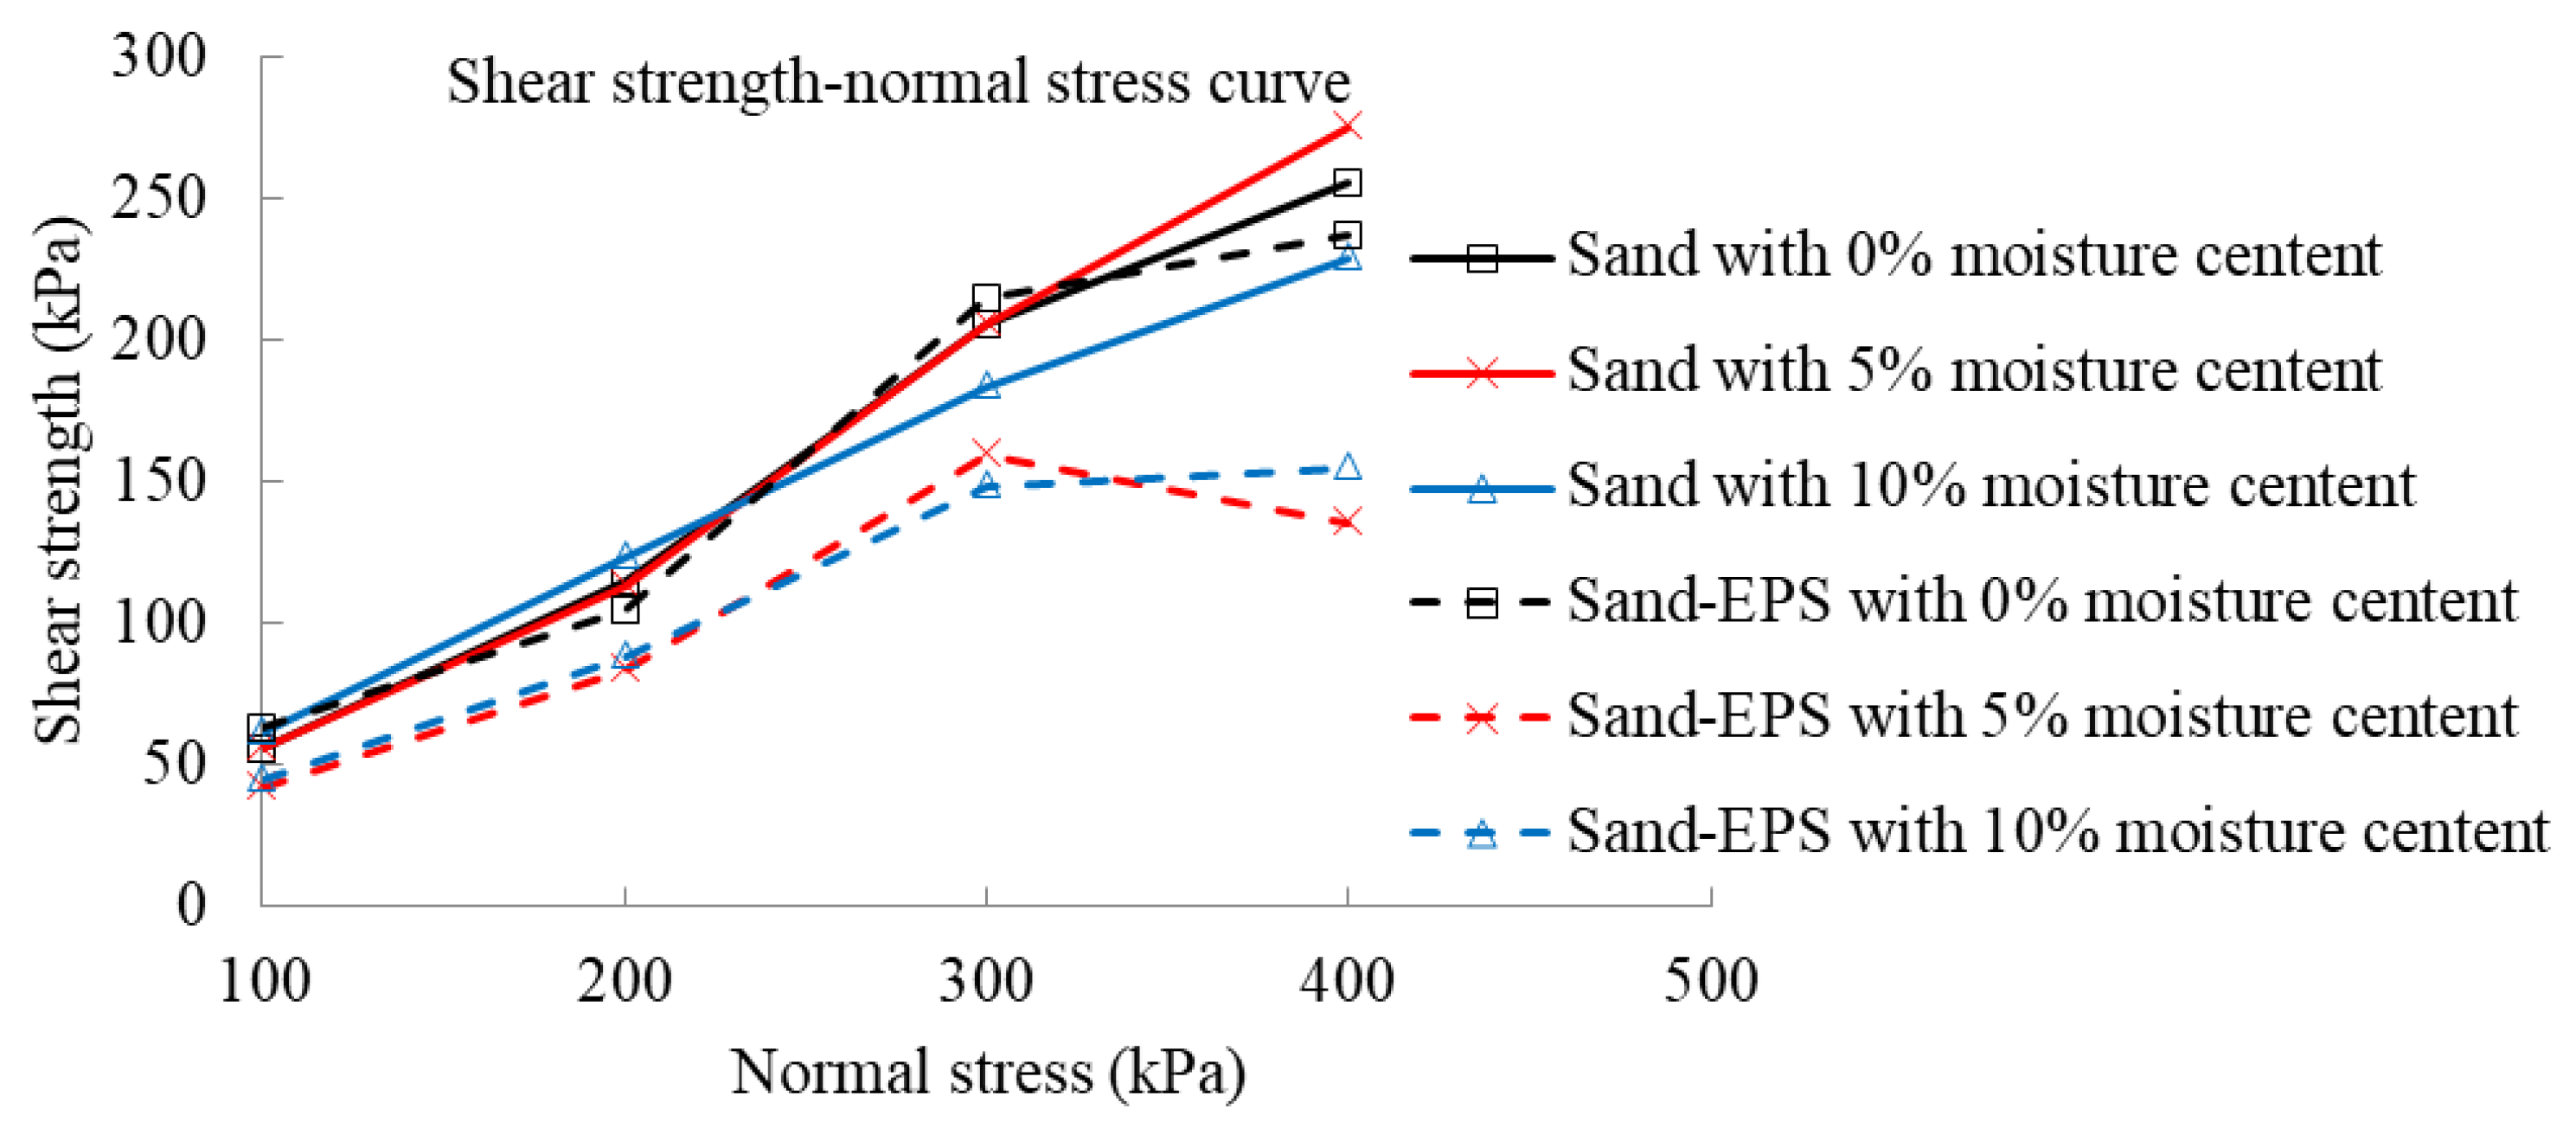
Shear-strength–normal stress for different moisture content is shown in Figure 8. With the increase of the normal stress, the shear strength of sand–EPS increased gradually. When the normal stresses were less than 300 kPa, the slopes of the curves increased with the increase in the normal stress, indicating that the shear strength increased. However, at the normal stress of 400 kPa, the slopes decreased dramatically. The reason may be that with the increase in the normal stress, the contact area between sand and EPS was enlarged, and the increase in friction increased the shear strength. However, when the normal stress was relatively large, because the stiffness of sand is much larger than that of EPS, sand was partially or wholly embedded in the geofoam, and the increase in the shear strength decreased. Sand with the water contents of 5% and 10% increased in the normal stress below 300 kPa with basically the same amplitude. When the normal stress was less than 300 kPa, the increase ranges of the shear strength of Sand-EPS with the moisture contents of 5% and 10% were basically similar. When the moisture content of the sand was less than 5%, the increase range of the shear strength increased gradually, while when the moisture content was 10%, the increase range was linear.
3.1.3. Effect of the Moisture Content on Internal Friction Angle and Cohesion
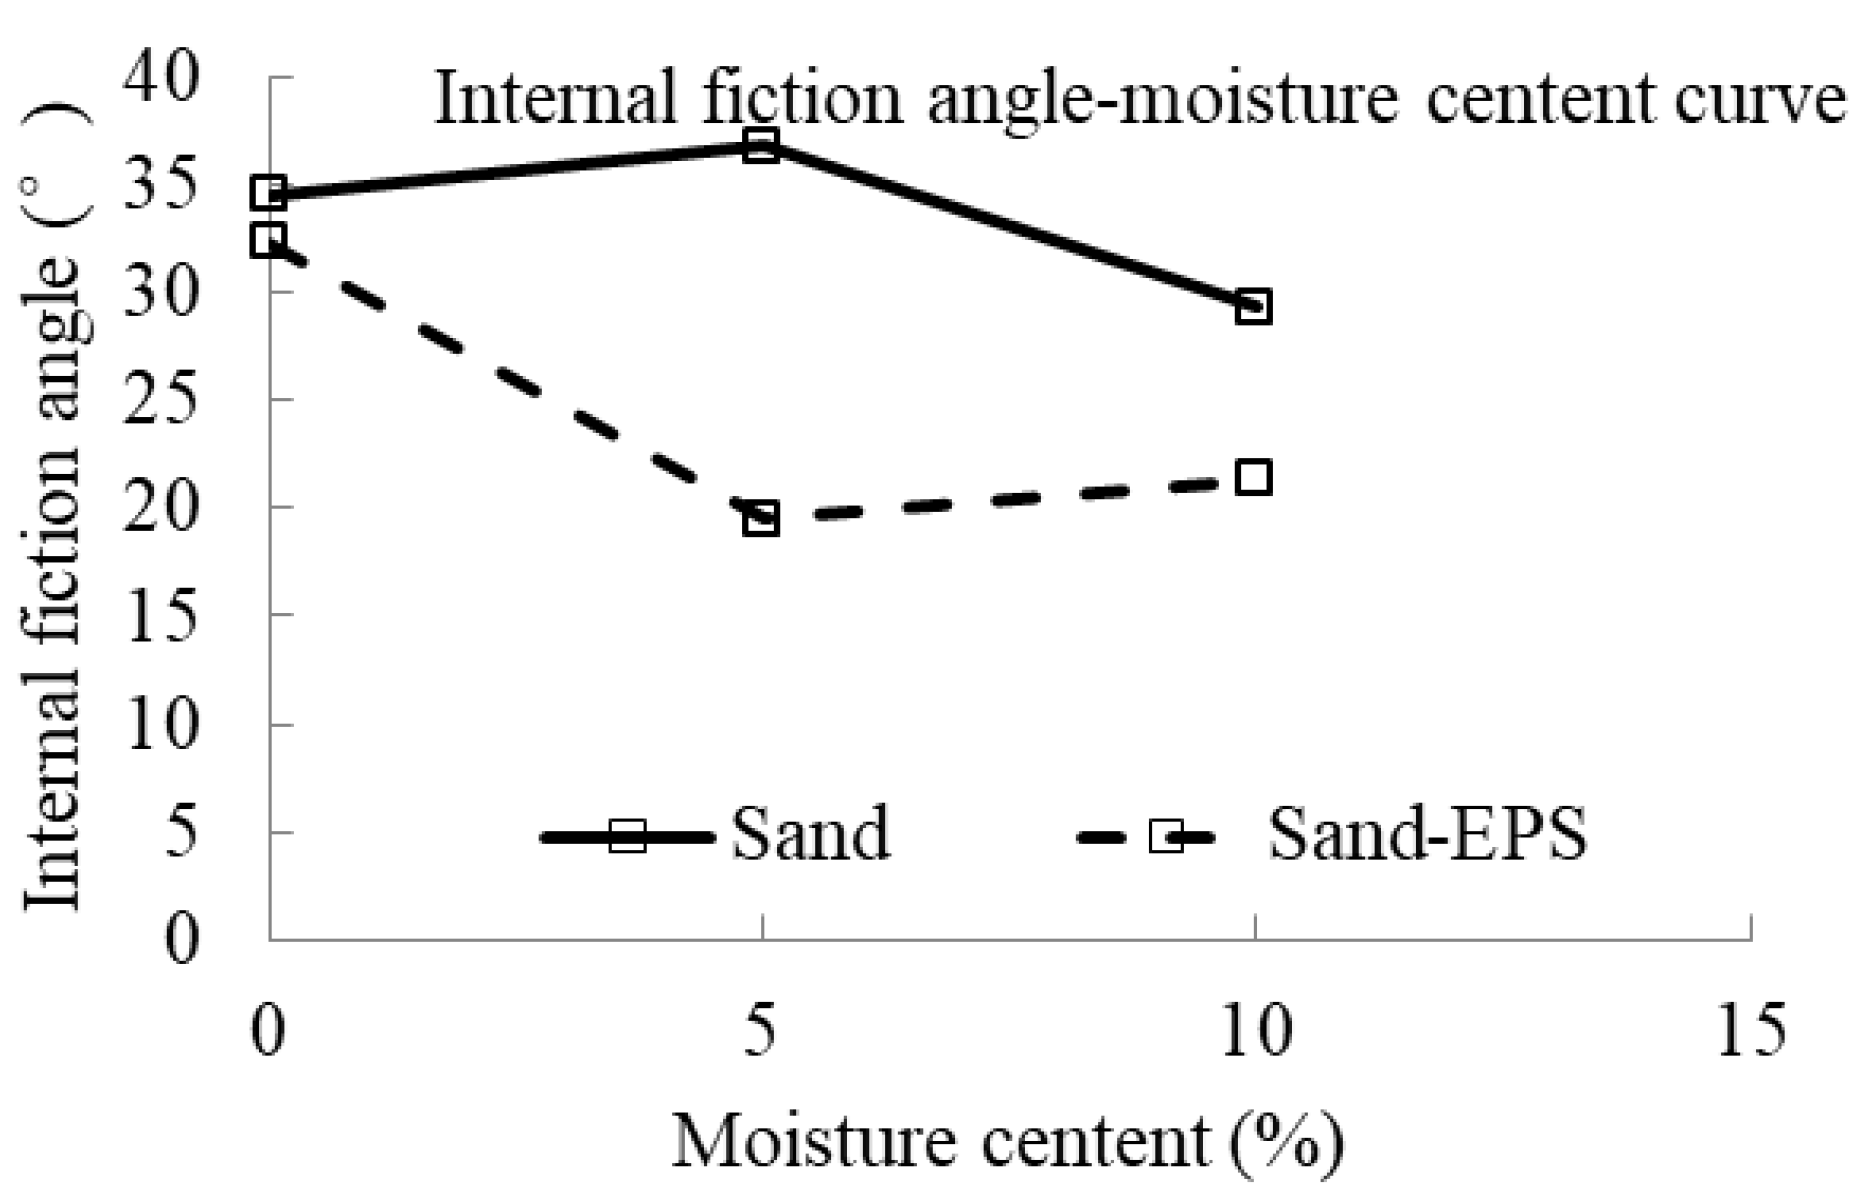
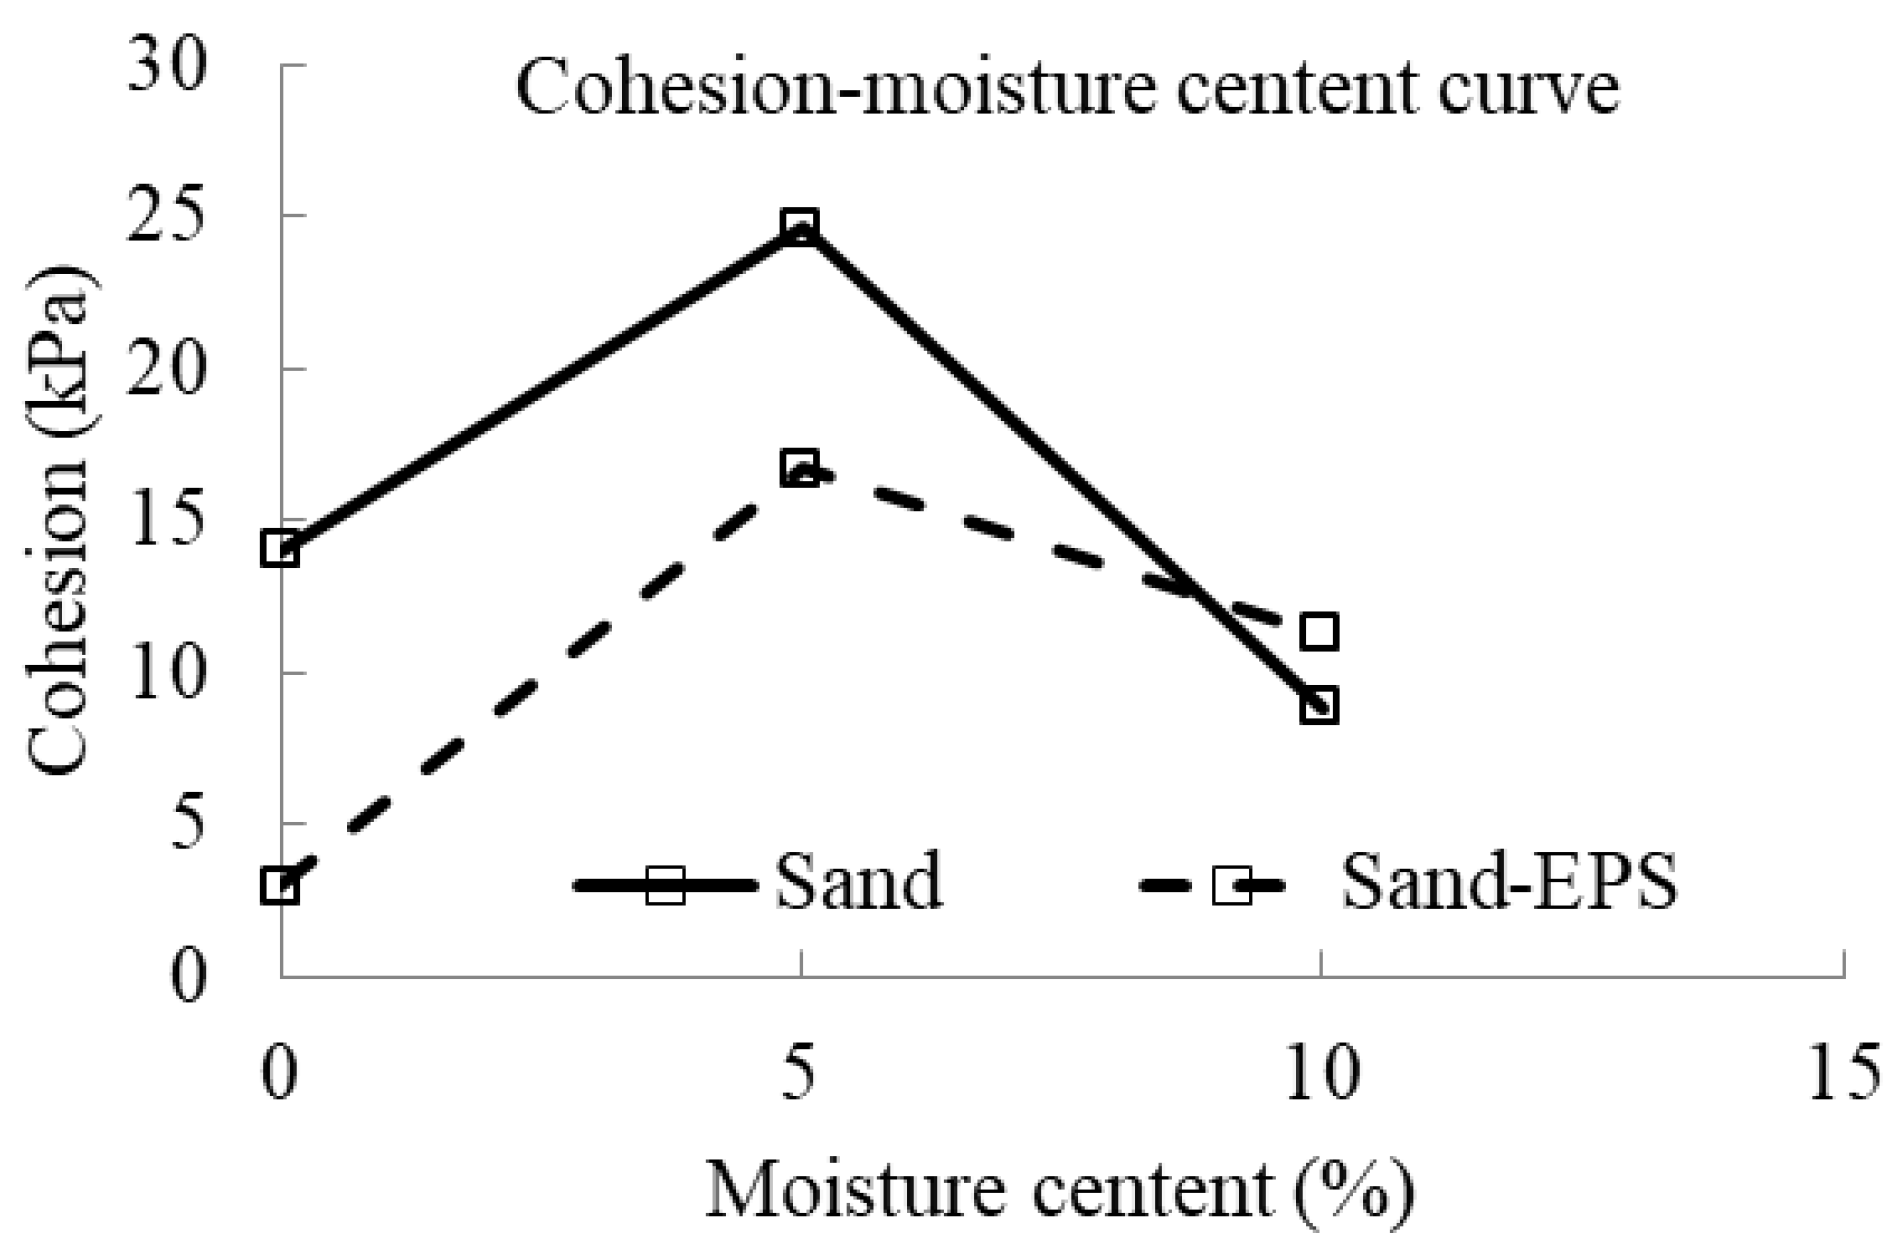
The internal-friction-angle–moisture cohesion–moisture curves are listed in Figure 9 and Figure 10. After adding EPS into sand, the internal friction angle of sand–EPS was smaller than that of the sand. The reason may be that the angular sand particles were replaced by spherical smooth EPS beads, and the internal friction angle decreased. With the increase in the moisture content, the internal friction angle of sand–EPS decreased first and then increased, and the percentages of the decrease and increase were 39.7% and 9.5%, respectively. With the increase in the moisture content, the variation law of the internal friction angle of the sand was just the opposite, and the percentages of the increase and decrease were 6.5% and 20.4%, respectively. When the moisture contents were 0% and 5%, the cohesion of sand–EPS was smaller than that of sand, decreasing by 78.9% and 32.0%, respectively. However, when the moisture content was 10%, the cohesion of sand–EPS was greater than that of the sand. The reason may be as follows. Affected by the moisture content, the cohesion was generally reduced. The study of Deng and Xiao [28] pointed out that the stiffness of sand grains is much higher than EPS beads. Sand particles will be partially or wholly embedded into EPS beads after compression, which forms a bond effect. The greater the embedment, the stronger the bond effect, which will increase the cohesion of sand–EPS. Therefore, when the moisture content is high, the sand will be mostly or wholly embedded into EPS beads after the sand is pressed. Therefore, when the moisture content was 10%, the cohesion of sand–EPS was larger than that of the sand, with an increase of 27.7%. With the increase in the moisture content, the cohesion of sand–EPS and the sand first increased and then decreased. The increase and decrease percentages of sand–EPS were 466.2% and 32.5%, respectively, and the corresponding increase and decrease percentages of the sand were 75.8% and 64.0%, respectively. By comparing the shear strengths of the same material with 0% and 10% moisture content, the shear strength of sand–EPS increased by 282.2%, while the shear strength of the sand decreased by 36.8%.
3.2. Results in Multi-Impact Tests
To study the multi-impact resistance performance of sand-geofoam composite cushion, 21 conditions of multi-impact tests were carried out. Firstly, the influence of the impact height for different sand cushion thicknesses was studied to determine the selection of the impact height in subsequent tests. Secondly, the sand thickness of the top layer and the total thickness of the cushion were invariable. The thickness of EPS and the quality of EPE were changed to study the influence of the geofoam on the impact resistance. The total thickness of the cushion was then invariable, and the geofoam thickness or mass of the middle layer was also invariable. By varying the thickness of the bottom sand and the placement height of the geofoam, the influence of the placement position of the geofoam on the impact resistance of the sand-geofoam cushion was studied. Finally, the impact resistances of sand–EPE and sand–EPS cushions were compared. The impact resistance of the cushion was analyzed by the maximum impact acceleration.
3.2.1. Effect of the Impact Height on the Multi-Impact Resistance for Different Sand Cushion Thickness
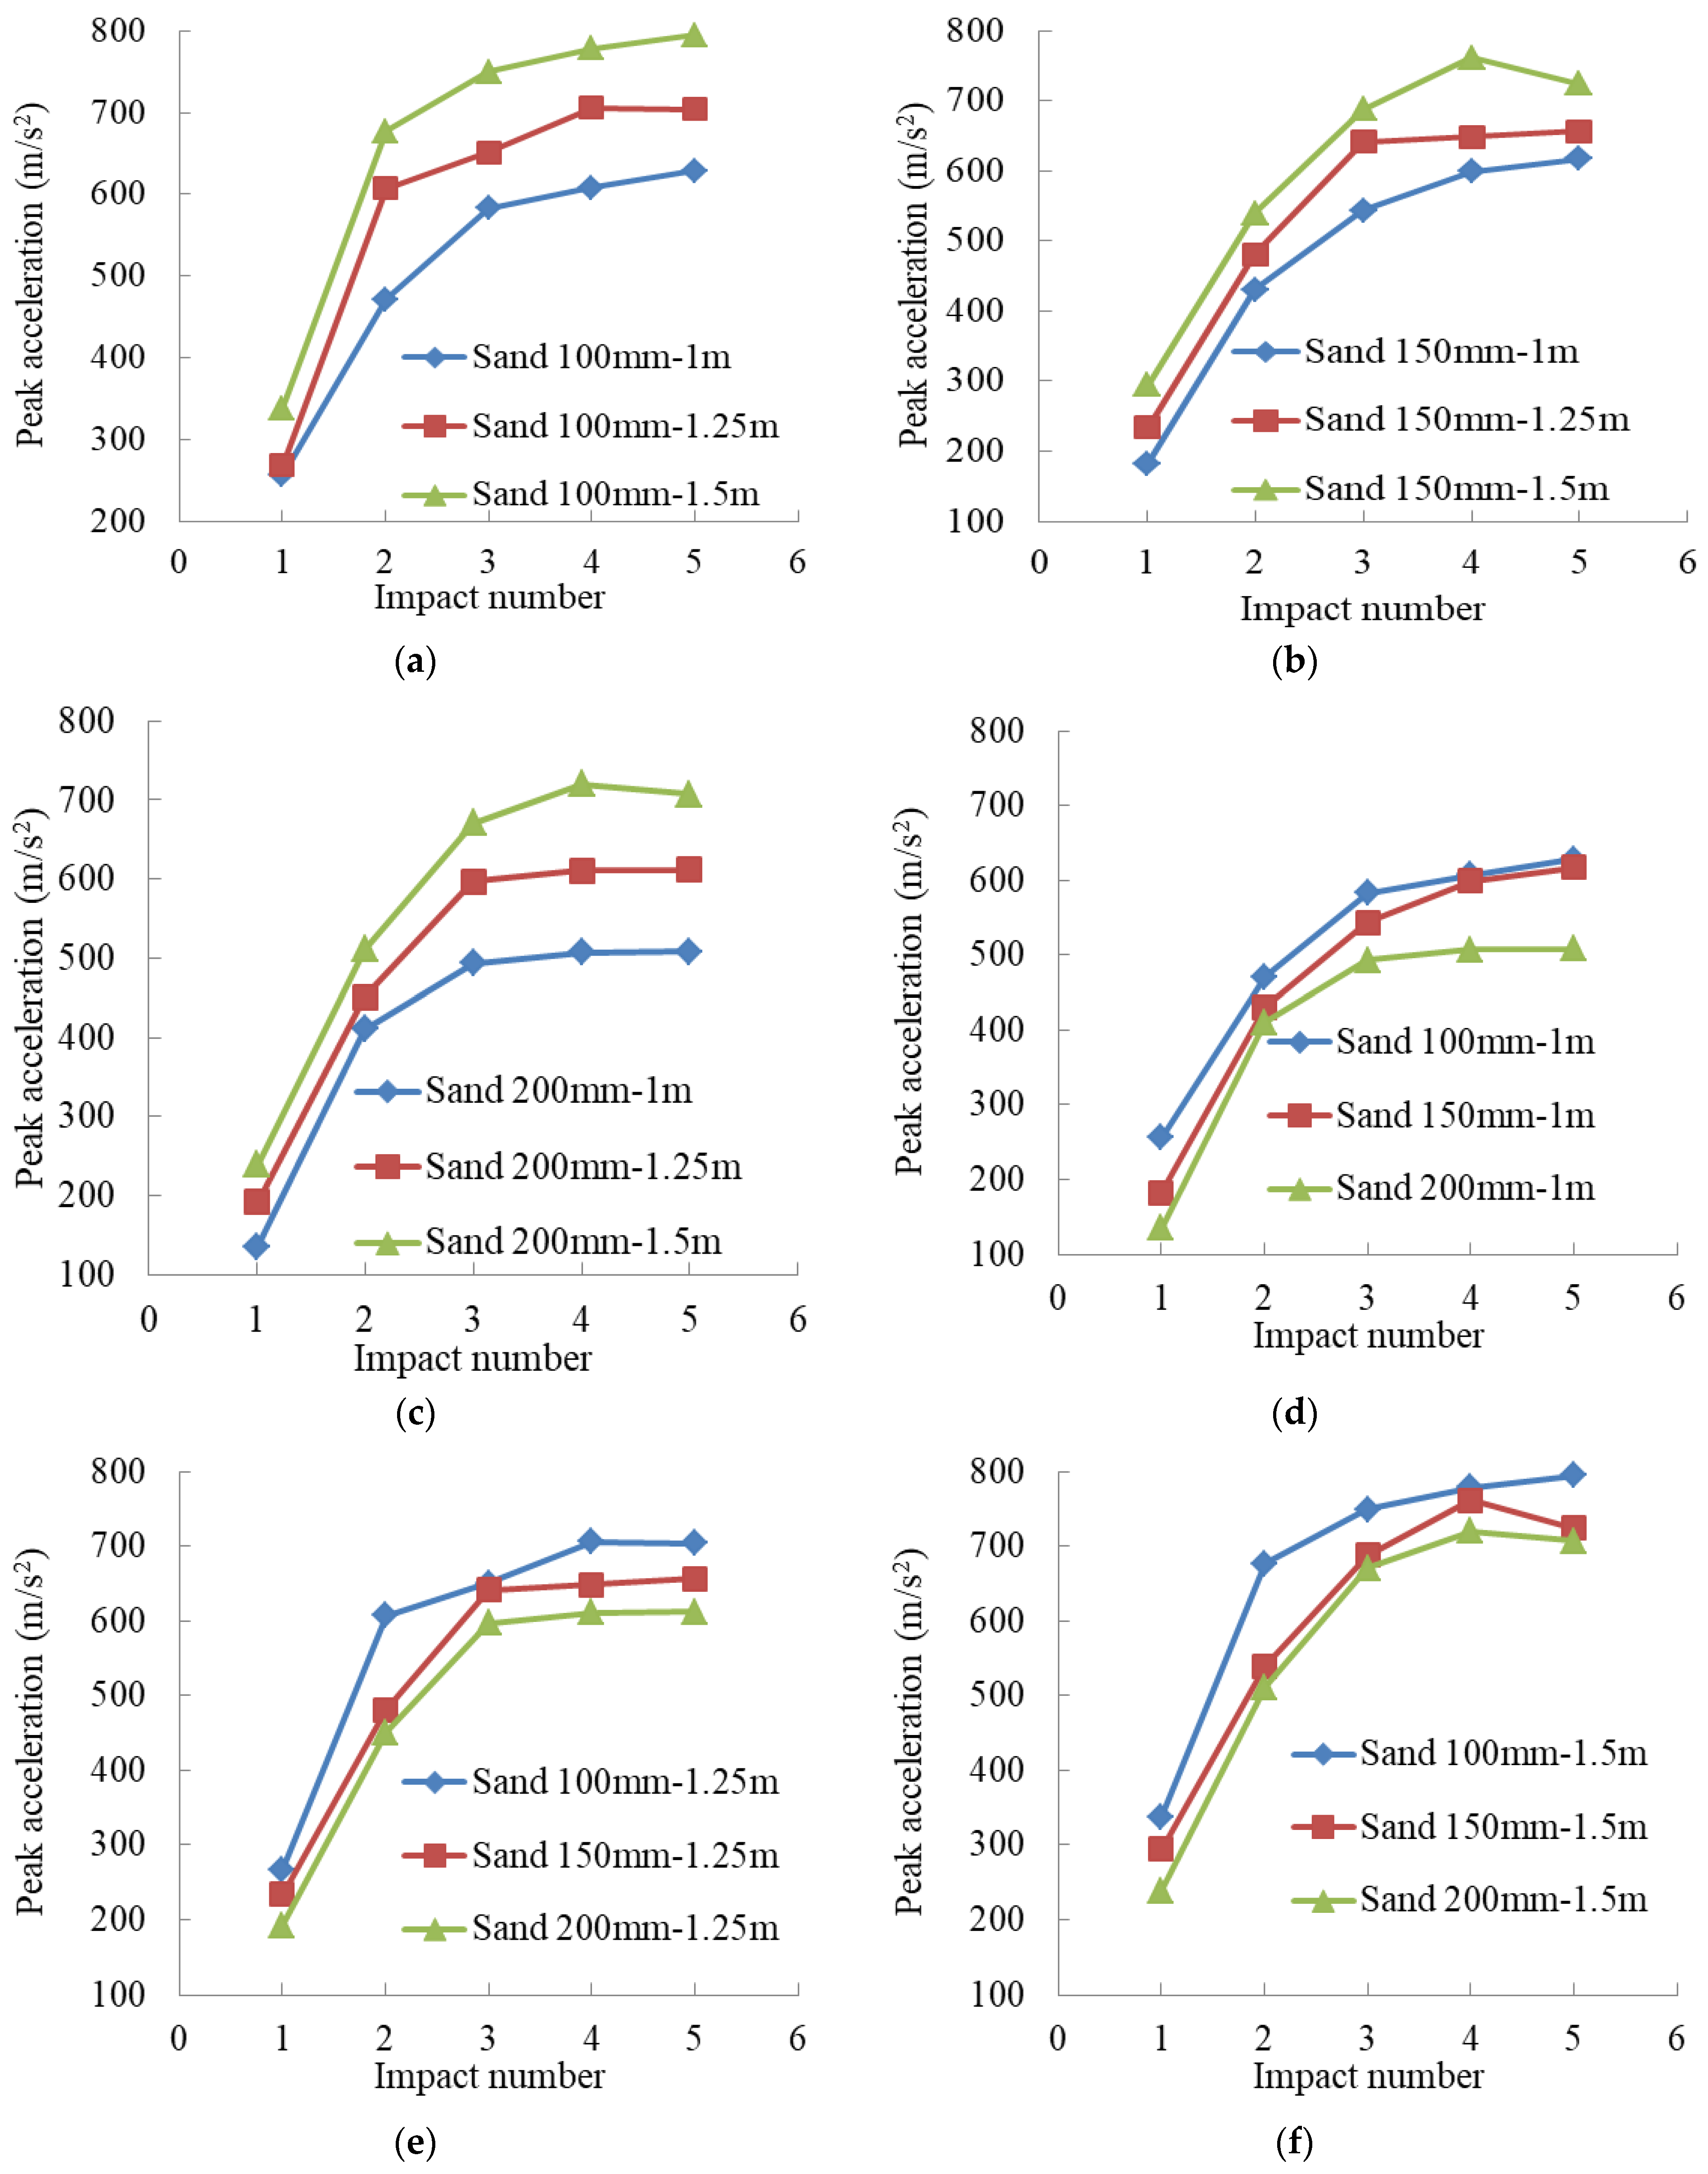
The variation curves of the peak acceleration with the impact number under different impact heights for the sand cushion with different thicknesses are shown in Figure 11. In general, the peak acceleration of the first impact was the smallest. For the 100 mm thick sand cushion, the peak accelerations under the first impact were 255.77 m/s2, 267.55 m/s2 and 337.764 m/s2 under the impact heights of 1 m, 1.25 m and 1.5 m, respectively, and for the 150 mm and 200 mm thick sand cushions, the peak accelerations under the first impact were 182.58 m/s2, 233.54 m/s2, 294.33 m/s2 and 135.23 m/s2, 192.07 m/s2, 239.06 m/s2, respectively. The difference percentage of the peak acceleration under each impact relative to that at the previous impact is shown in Table 3. With the increase in the impact number, the peak acceleration increased gradually. The difference percentage between the second impact and the first impact was the largest, with the smallest difference percentage of 83.2% and the largest difference percentage of 203.4%. The maximum difference percentage between the third and second time was only 33.4%. As the impact number increased, the difference percentage became smaller and smaller. When the impact number was 5, the peak acceleration tended to be stable with little variation with the maximum difference percentage of −4.9% and the minimum difference percentage of 0.2%. The main reason is that after the first impact, the compactness of the sand cushion increased because of the impact, the buffering performance decreased, and the peak acceleration increased under the second impact. As the impact number increased, the compactness of the sand cushion became larger and larger. When the impact number reached five times, the compactness of the sand cushion reached the maximum value, so the peak acceleration changed little and gradually tended to a stable value. Under the same impact height, the peak acceleration decreased with the increase in the cushion thickness. When the impact height was 1.5 m, the peak accelerations of the 150 mm thick sand cushion and the 200 mm thick sand cushion were close, as shown in Figure 11d–f. Therefore, in the subsequent impact tests, the cushion thickness was 150 mm, and the impact height was 1.5 m.
3.2.2. Effect of the Geofoam Quantity on the Multi-Impact Resistance of Sand–Geofoam Composite Cushion
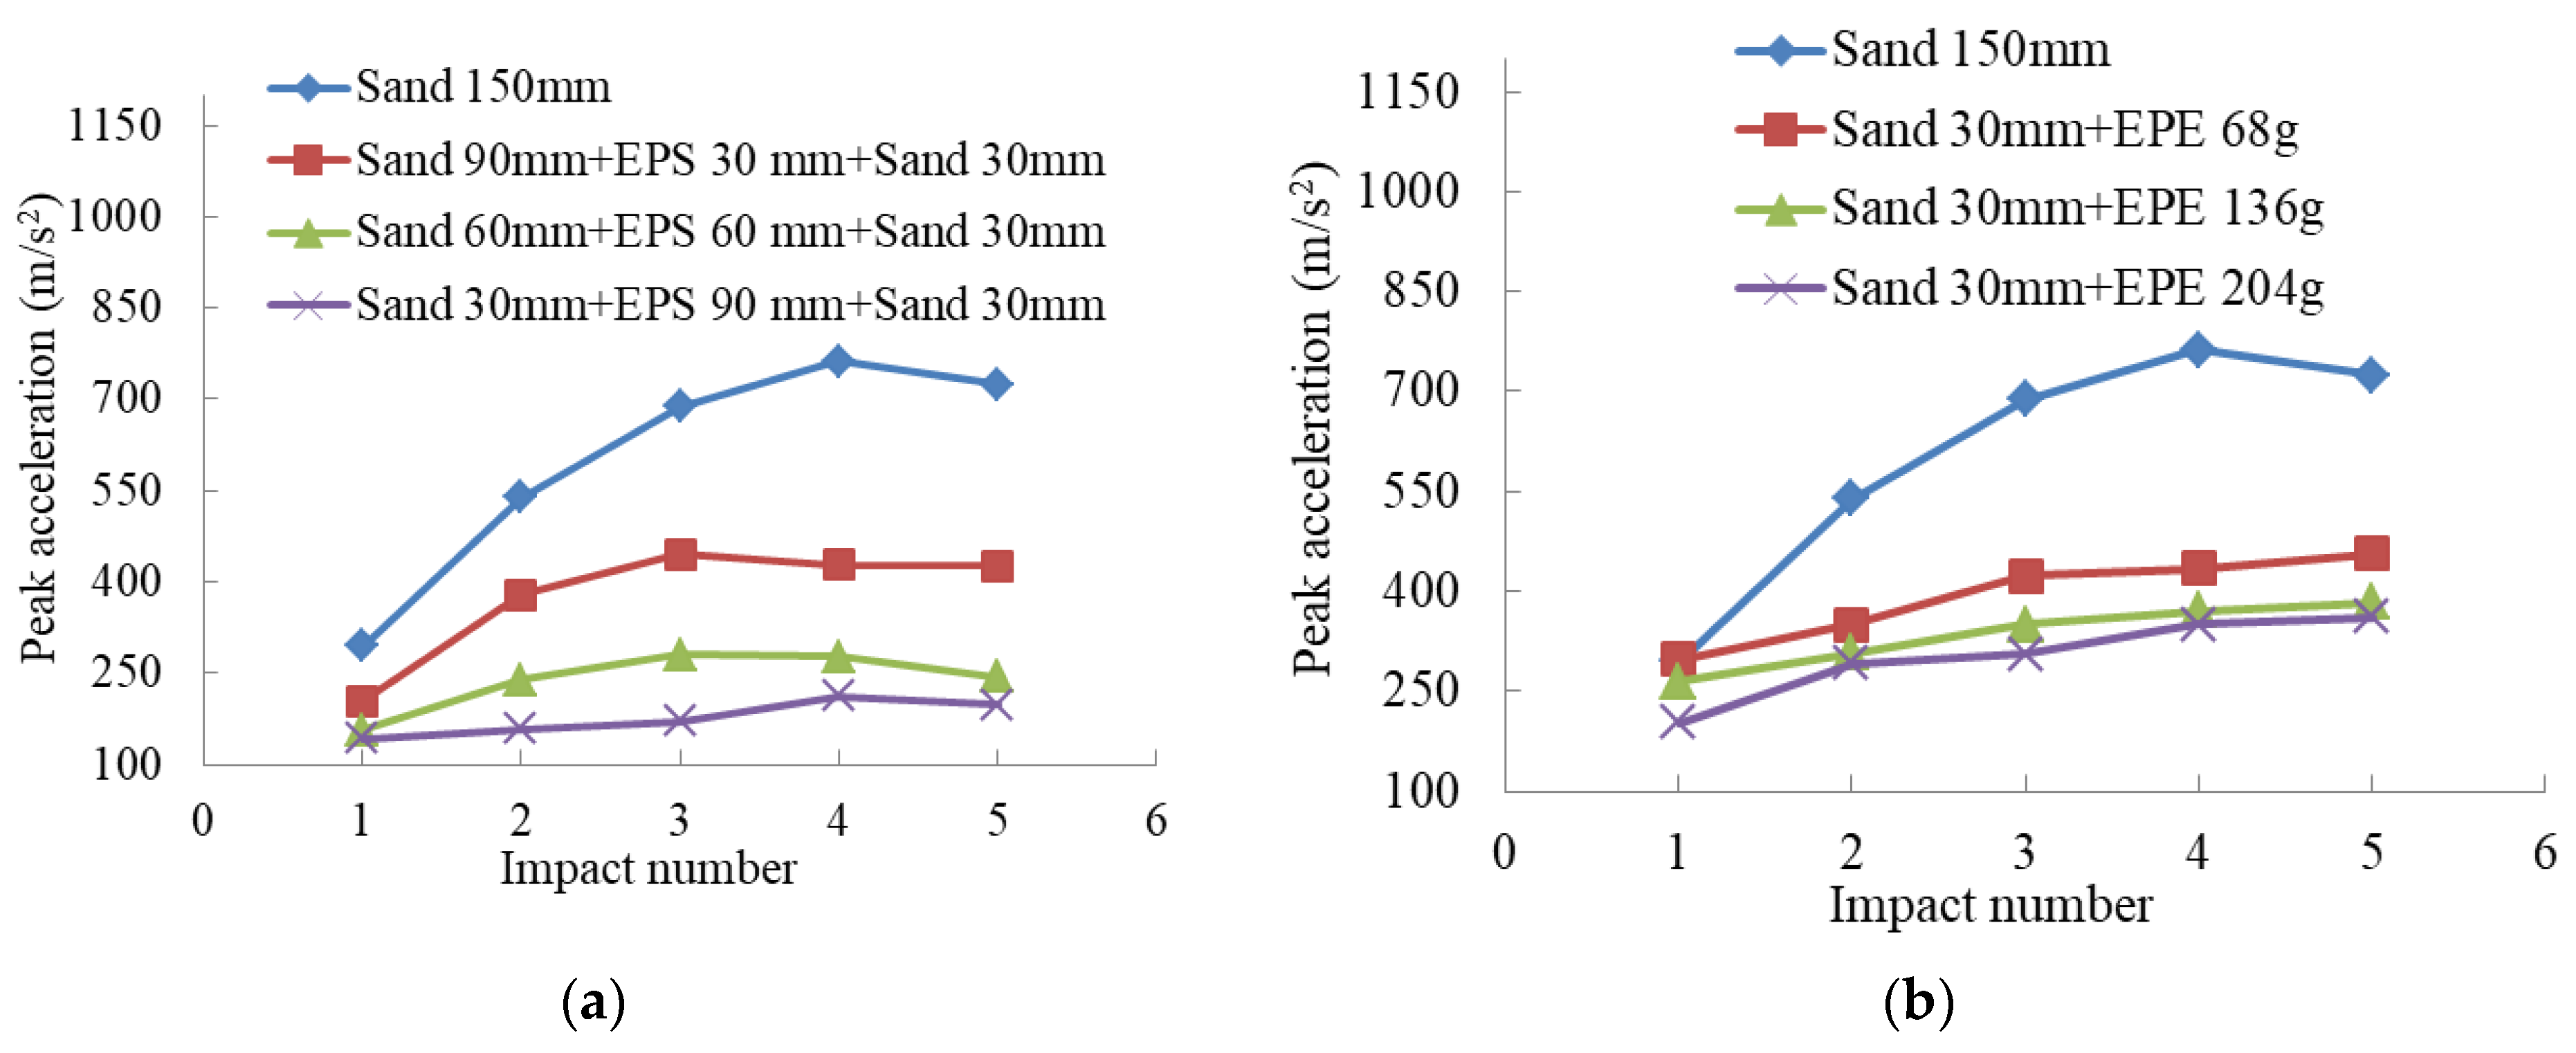
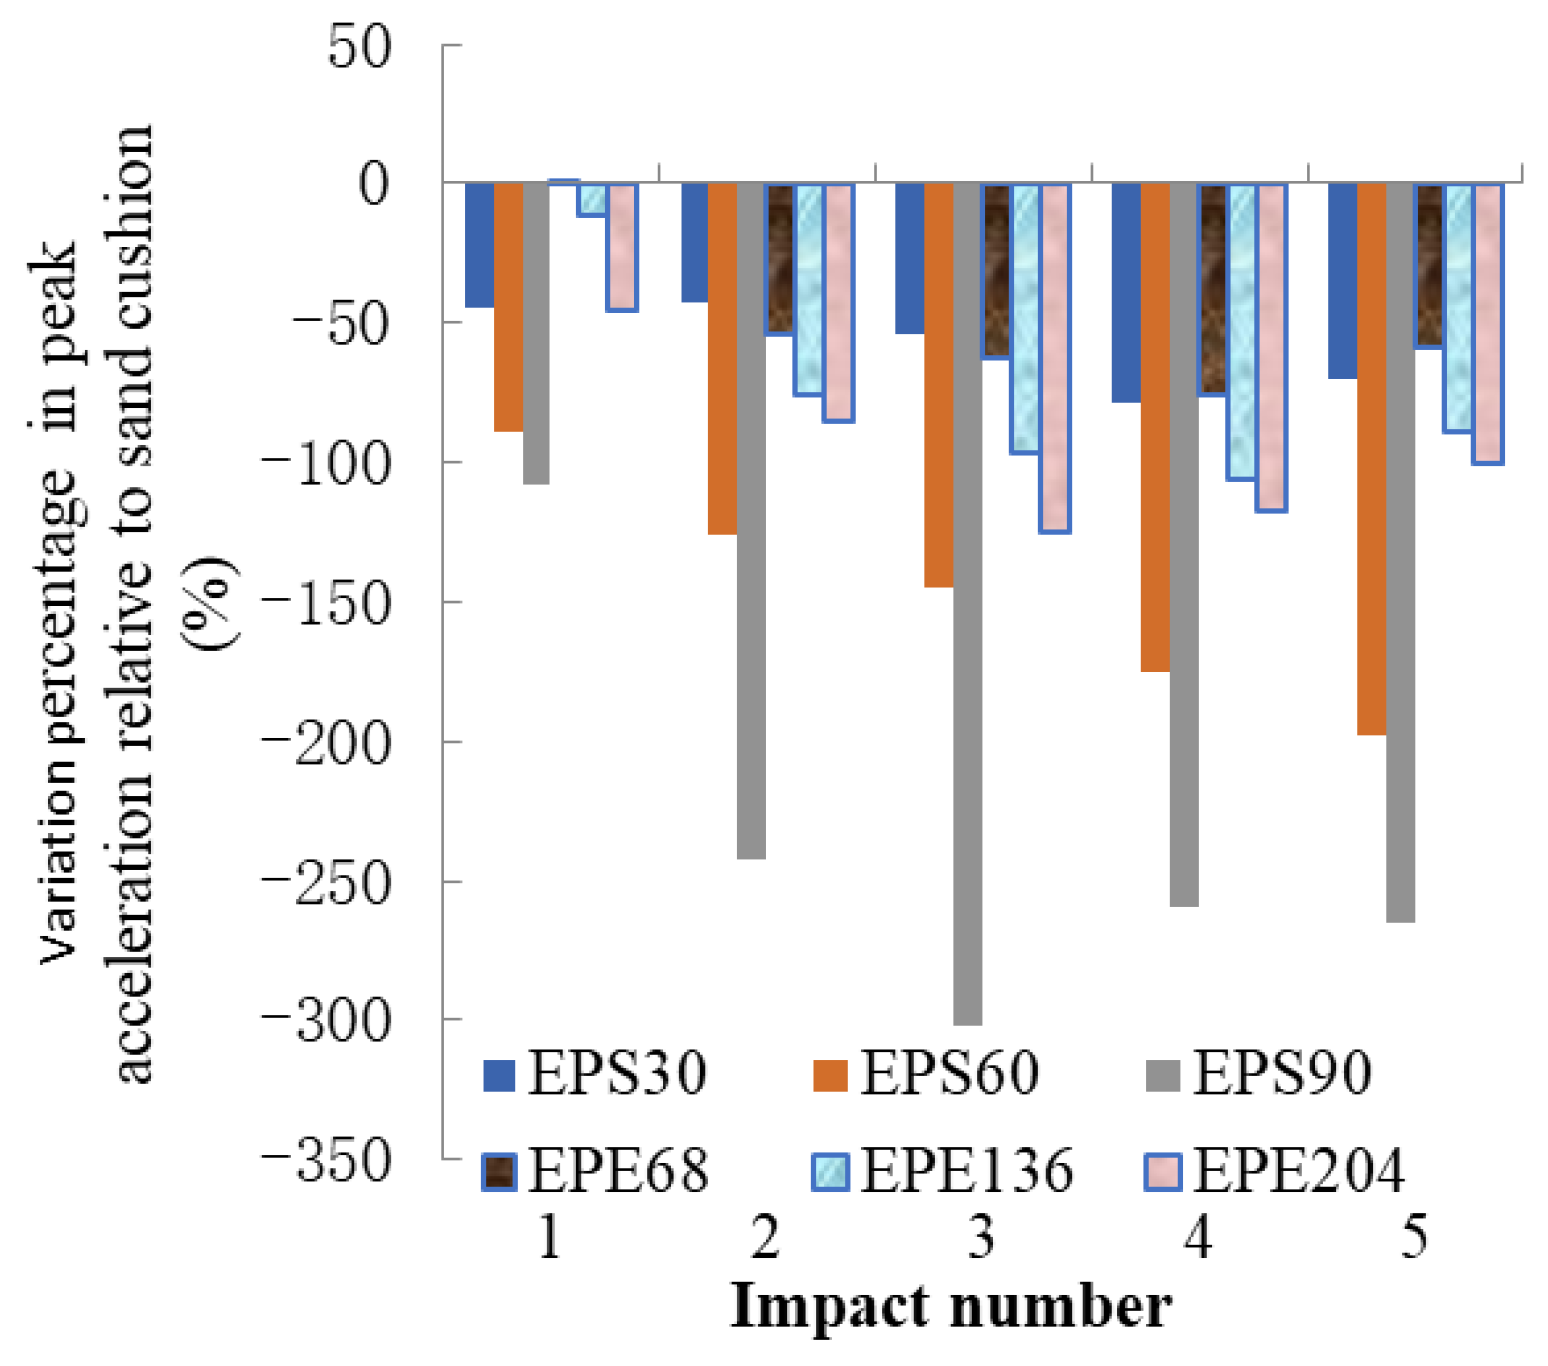
The peak acceleration curves for the sand–EPS and sand–EPE composite cushions with different geofoam quantities under the 1.5 m impact height are drawn as shown in Figure 12. The peak accelerations in the sand–EPS and the sand–EPE composite cushions were much smaller than those in the pure sand cushion. The maximum peak accelerations in the sand, the sand–EPS, and the sand–EPE cushions were 762.1 m/s2, 445 m/s2, and 455.4 m/s2, respectively. The composite cushion had much better buffer performance. The maximum percentage reductions of the peak accelerations of the sand–EPS and the sand–EPE composite cushions relative to the pure sand cushion were 302.4% and 125.3%, respectively, as shown in Figure 13. The peak acceleration reduction percentage of the sand–EPS cushion relative to that of the pure sand cushion had a wide variation range from 42.4% to 302.4%. When the thickness of the bottom layer of the sand was 90 mm, the reduction percentage of the peak acceleration was the largest. However, the difference in reduction percentage for the sand–EPE composite cushion was smaller, from −11.2% to 125.3%, and the reason was mainly that the thickness of the bottom layer of the sand in the sand–EPS composite cushion was inconsistent (Figure 12a), and the peak acceleration was related to the position of the geofoam cushion, which is discussed in the following section.
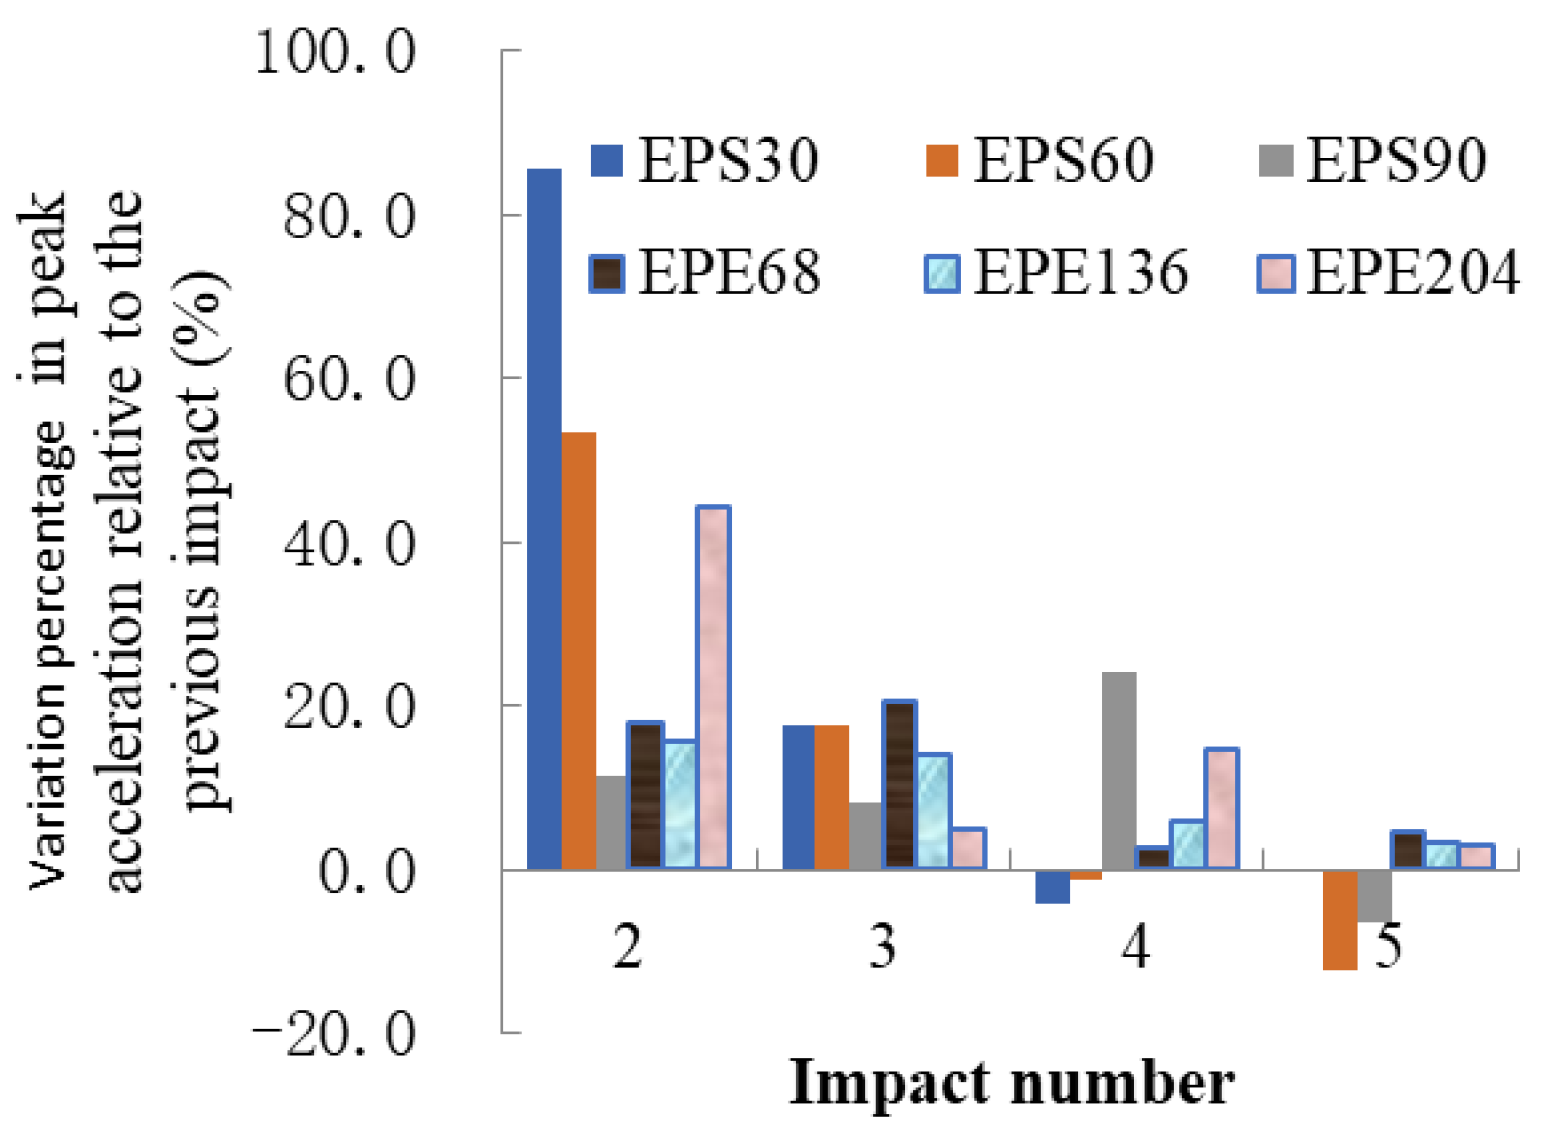
With the increase in the impact number, the peak acceleration was similar to that of the pure sand cushion, as shown in Figure 12 and Figure 14. The peak acceleration gradually increased and tended to a constant value after the impact number reached five times. With the increase in geofoam thickness or weight, the peak acceleration decreased, and the cushion had better buffer performance. However, the percentage increase in the peak acceleration in the sand–geofoam composite cushion was less than that in the pure sand cushion. In general, in a composite cushion, the sand–EPE composite cushion had a smaller increase percentage of the peak acceleration under each impact relative to the previous impact than the sand–EPS composite cushion. The results showed that the sand–geofoam composite cushion had better durability than the pure sand cushion under multiple impact loading, and the sand–EPE had better durability than the sand–EPS.
3.2.3. Effect of the Geofoam Placement Height and the Geofoam Type on the Multi-Impact Resistance of Sand–Geofoam Composite Cushion
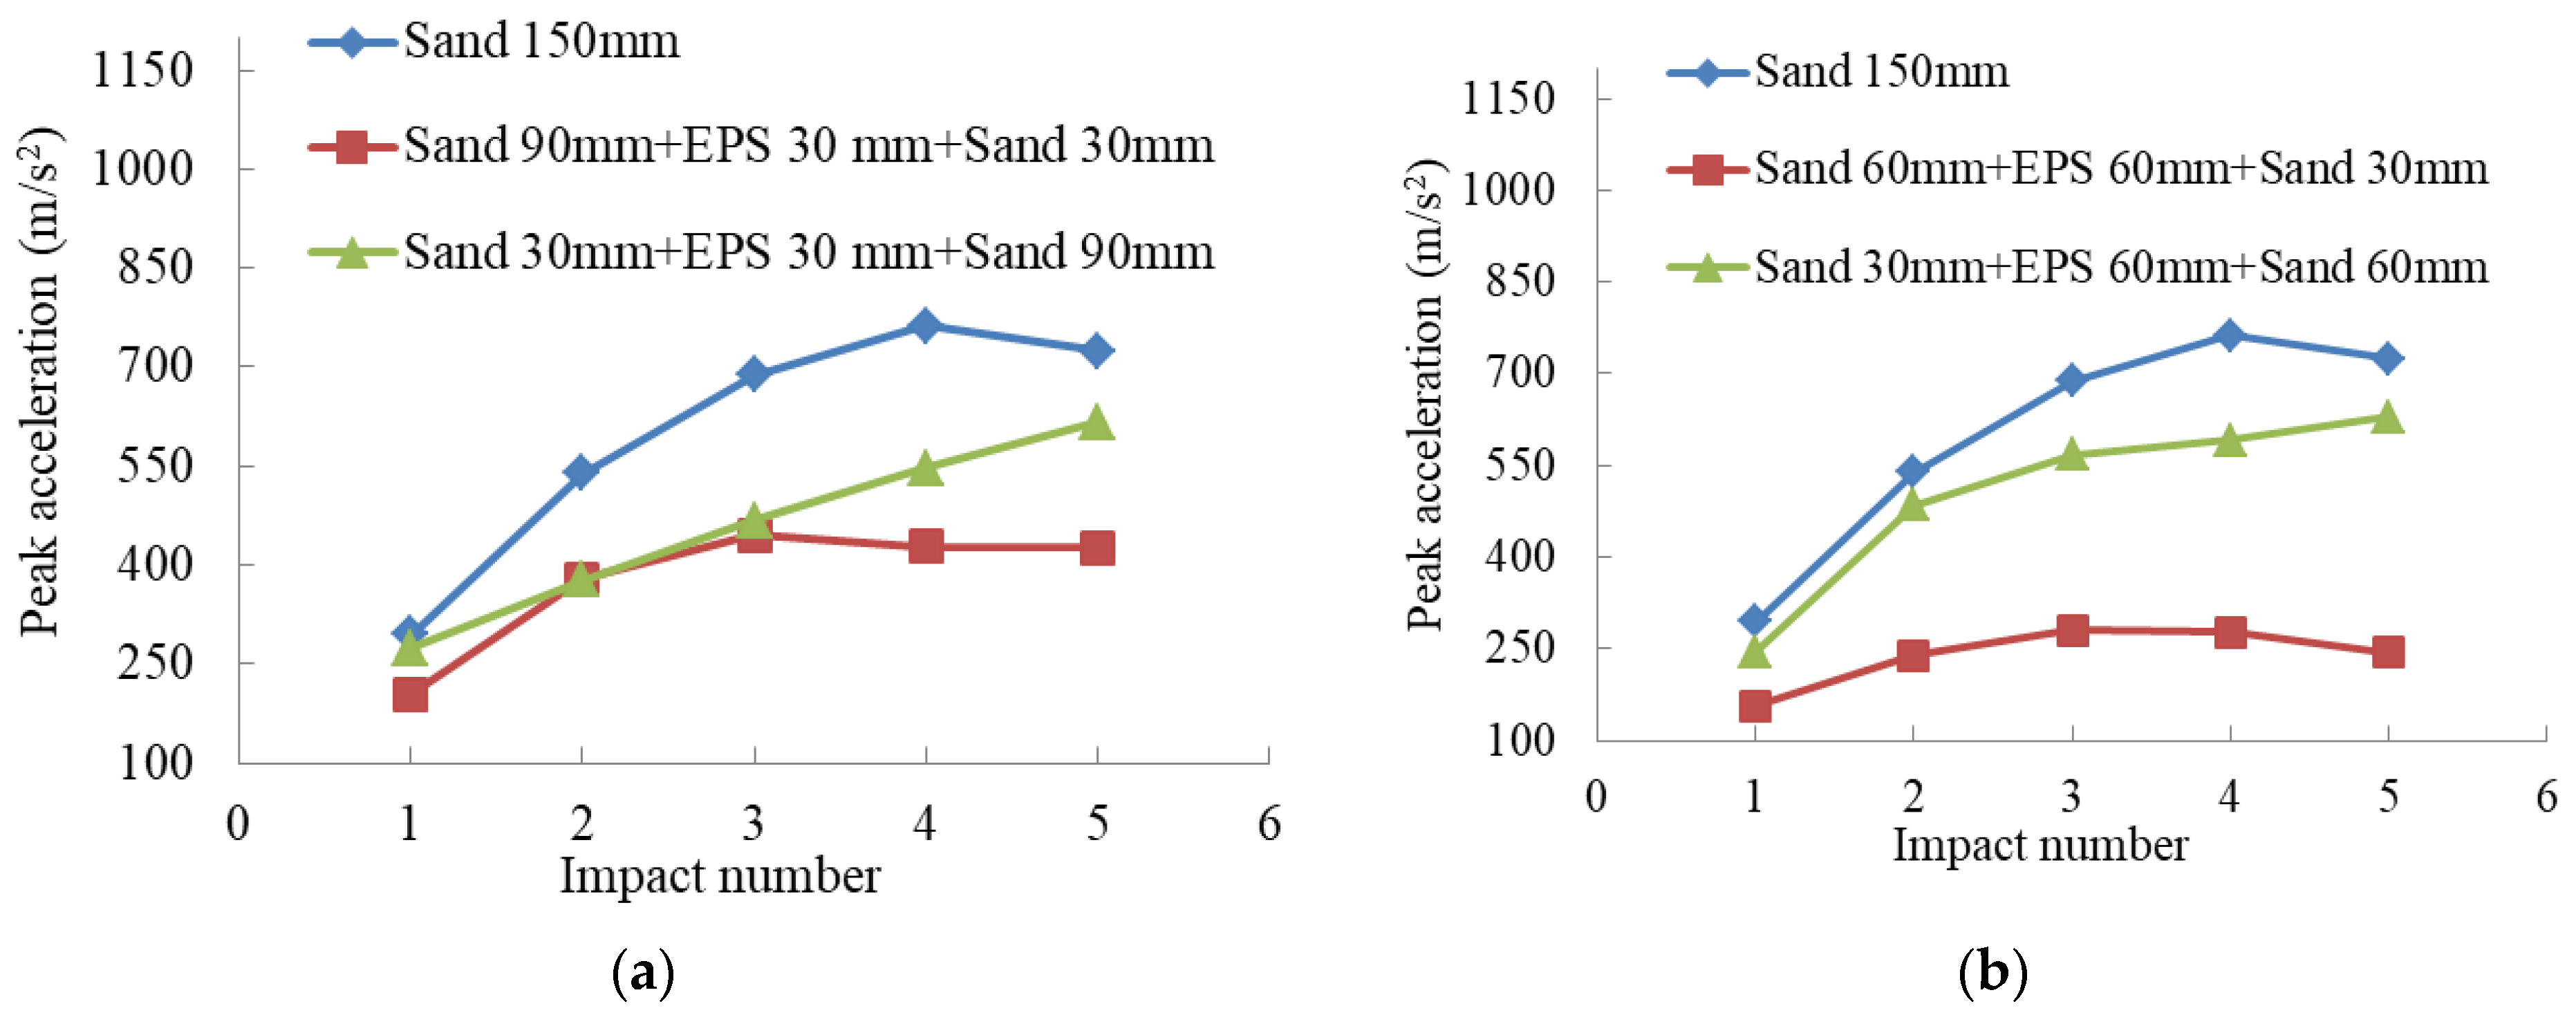
The geofoam thickness remained unchanged, and the geofoam position was changed by varying the thickness of the bottom sand. The variation curve of the acceleration with the impact number is shown in Figure 15. As the geofoam cushion was closer to the top, the peak acceleration was smaller, and the buffer performance of the cushion was better.
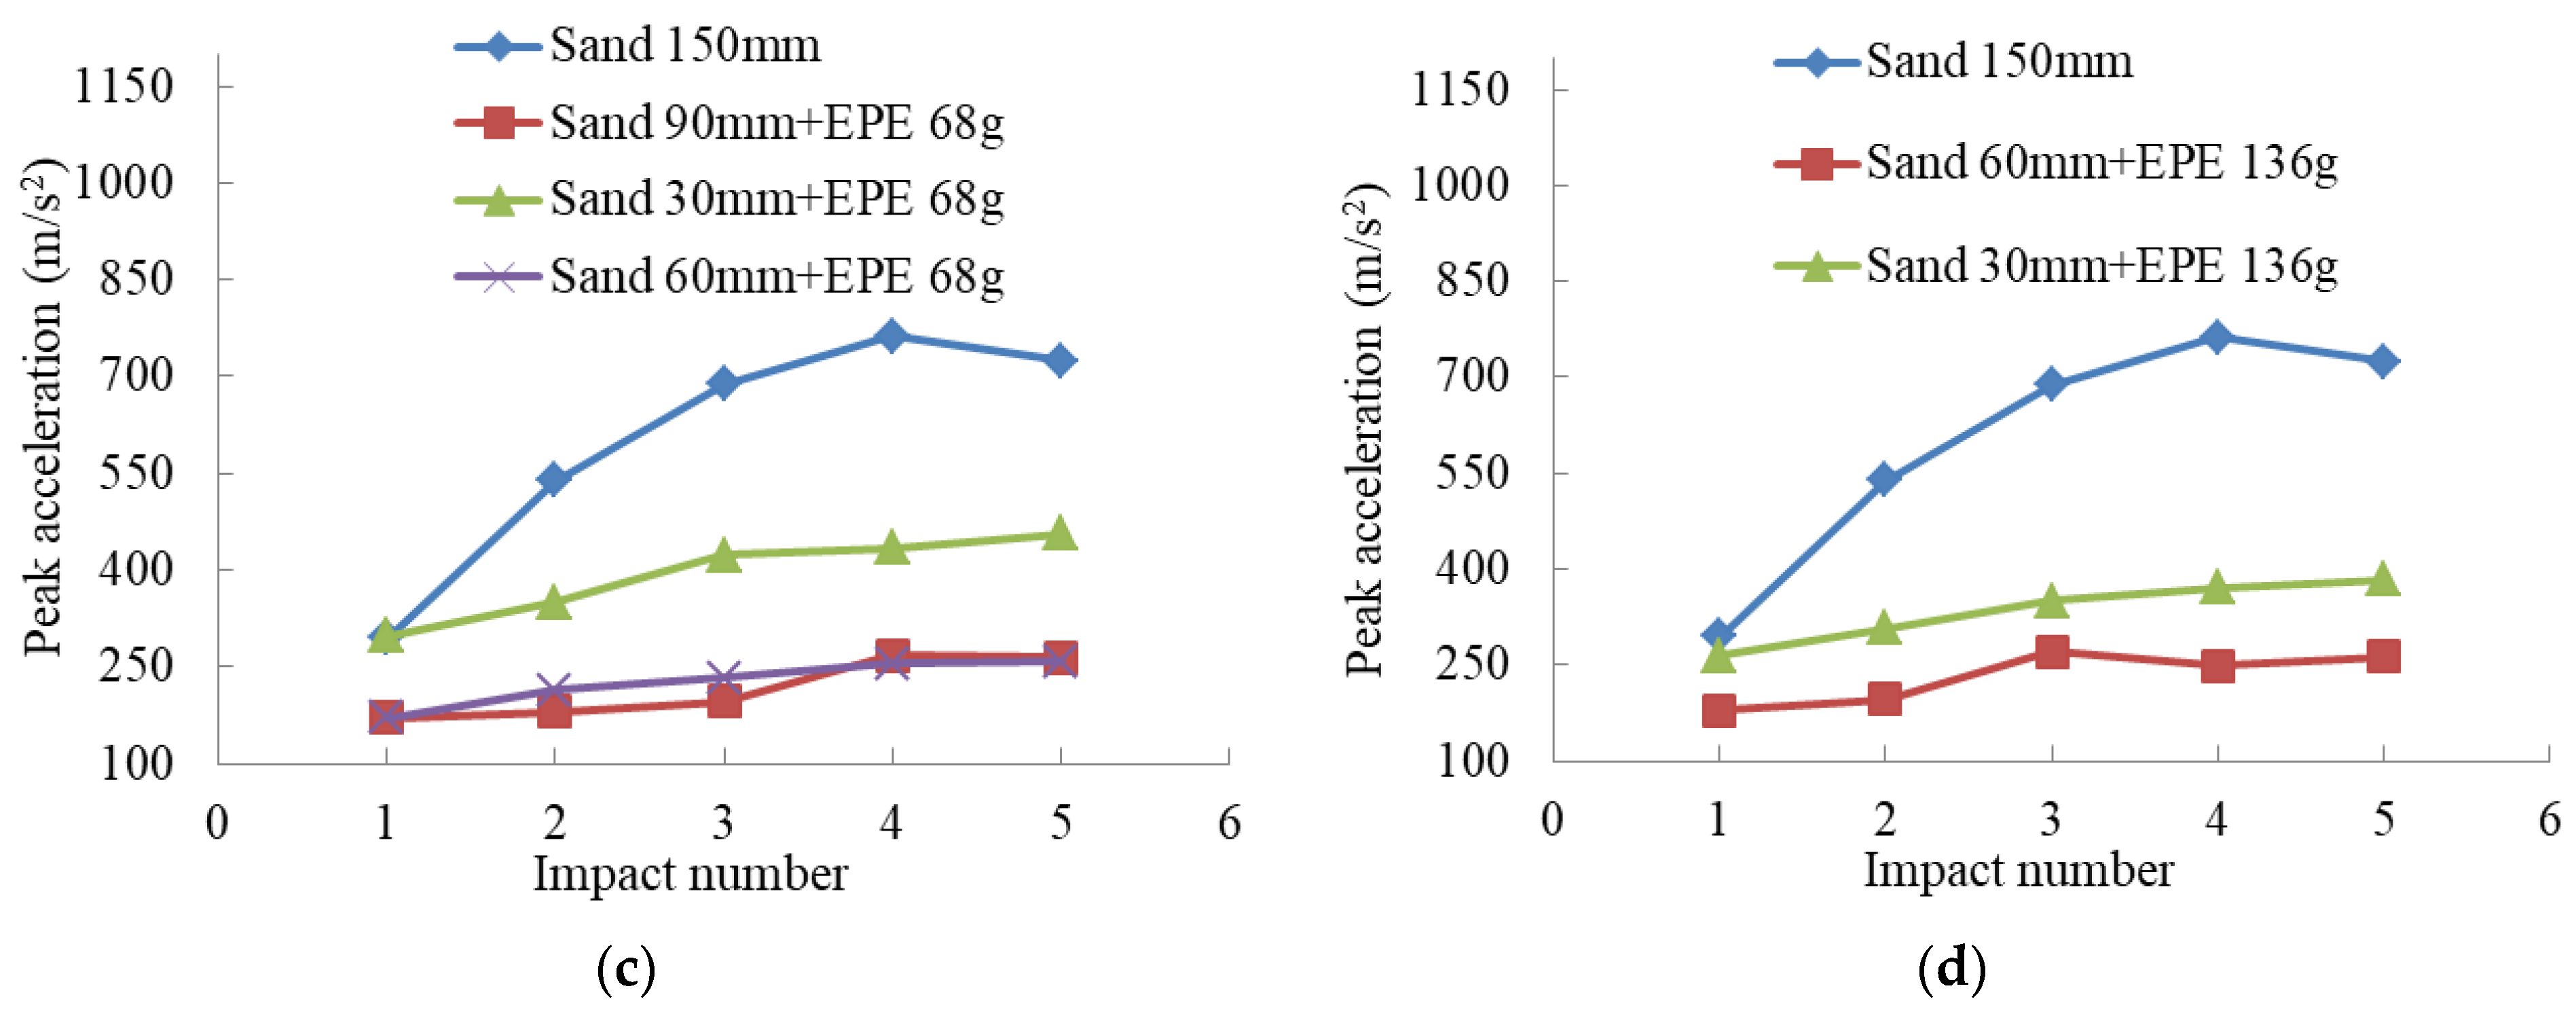
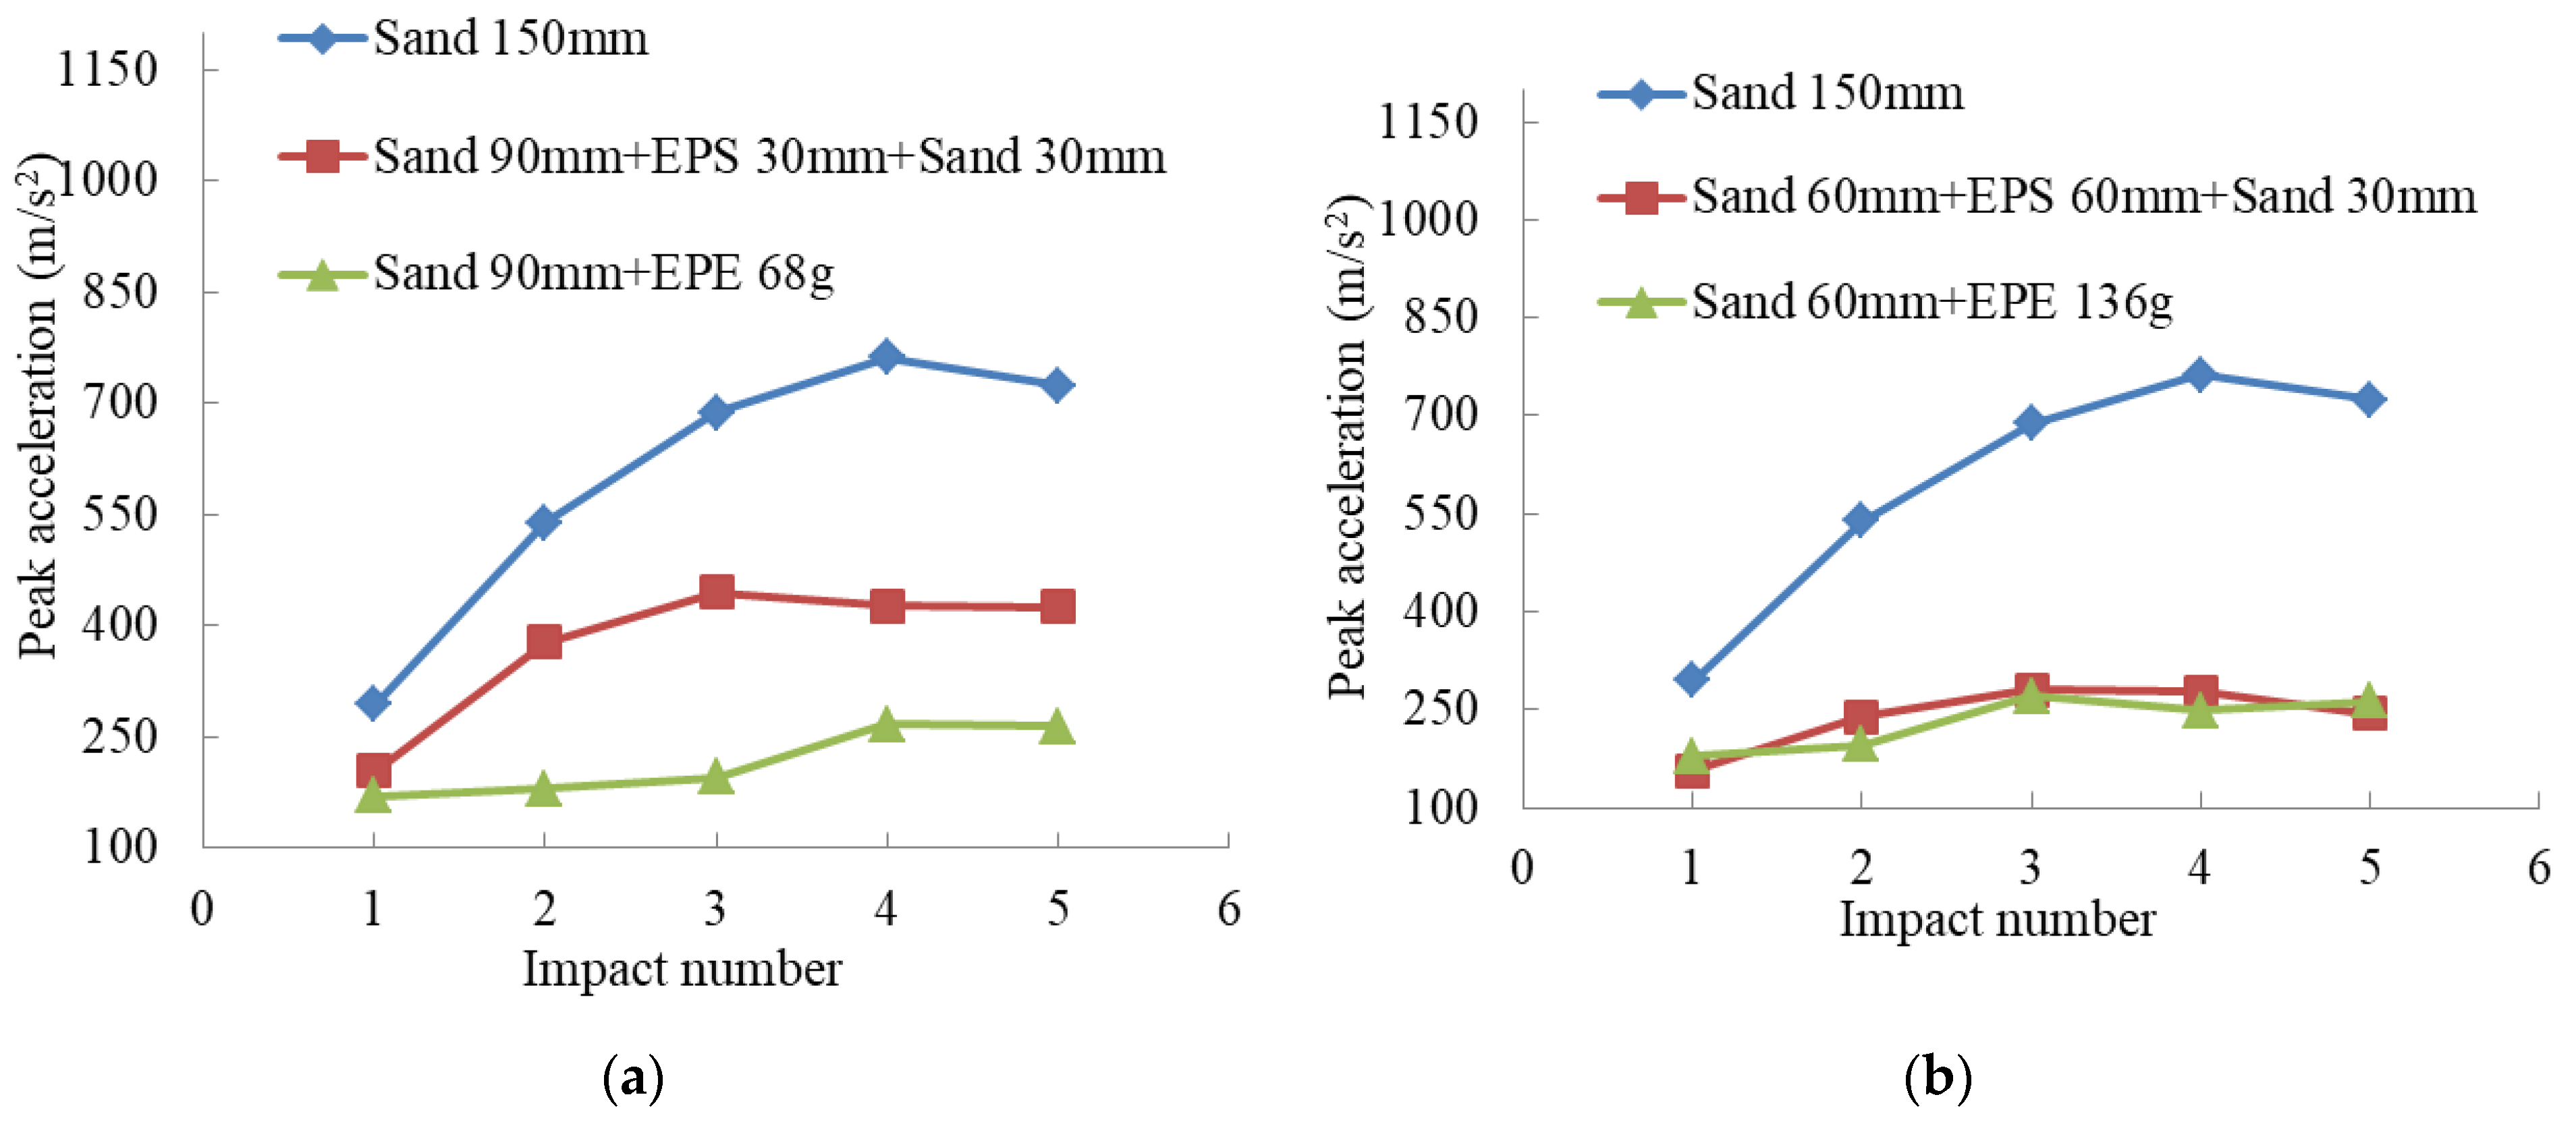
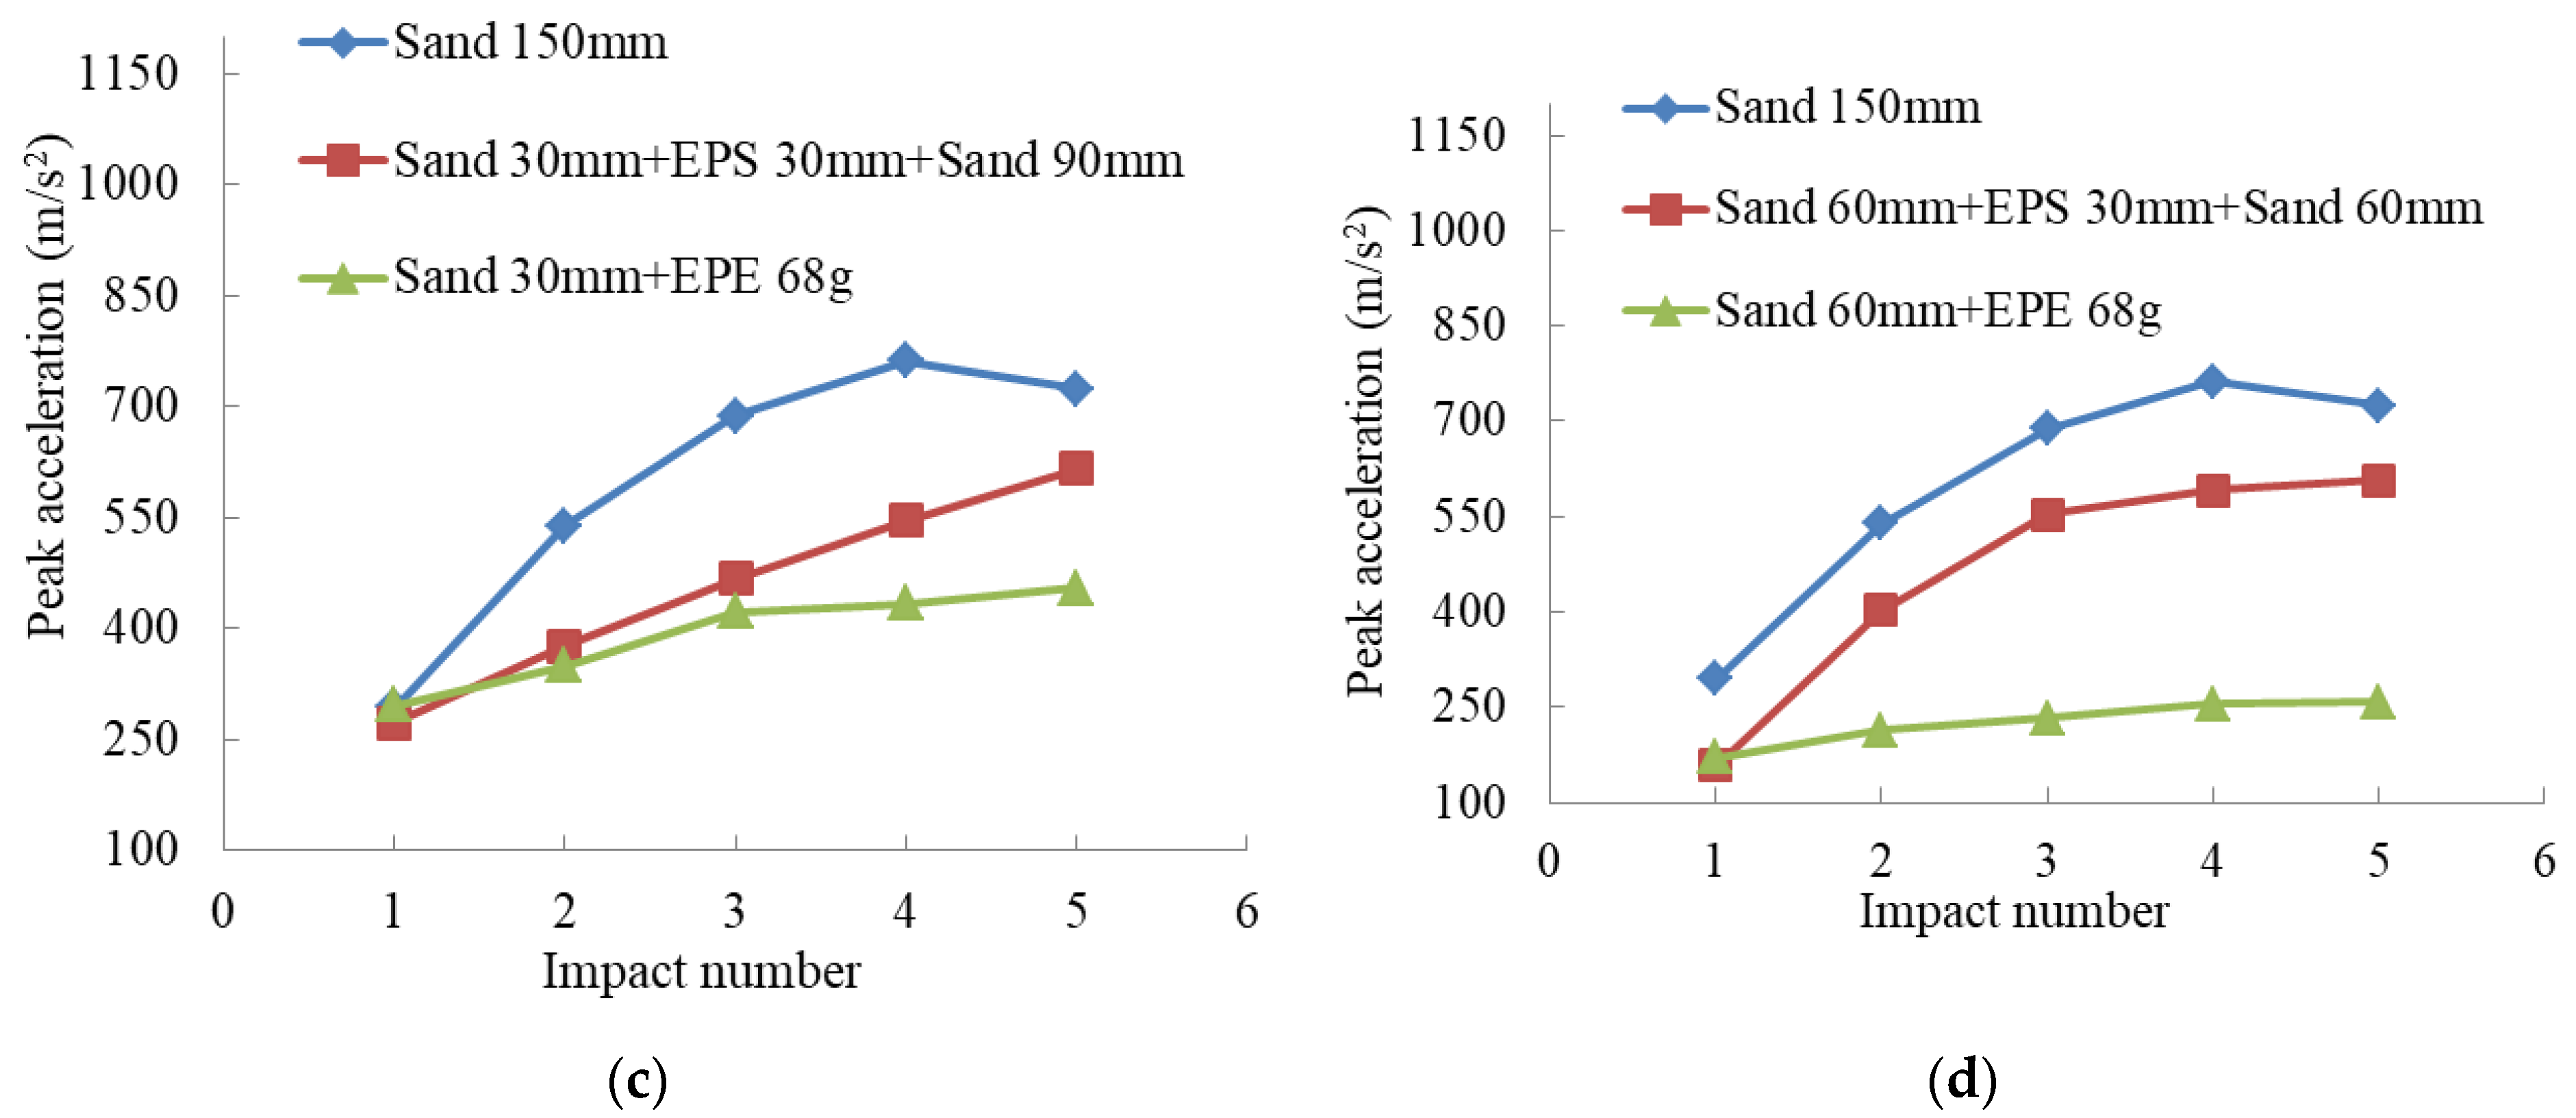
The variation curve of the peak acceleration with the impact number is drawn for EPS and EPE with the same geofoam quality, and the buffer performance of different geofoam types is studied, as shown in Figure 16. Under the same condition, the peak acceleration of the sand–EPE composite cushion was smaller than that of the sand–EPS composite cushion. The maximum difference percentage reached 137.7%. Compared with the peak acceleration under the previous impact, the peak acceleration increase value in the sand–EPE cushion was smaller than that in the sand–EPS cushion, and the curve was relatively flat, indicating that the sand–EPE had better durability under multiple impact loads.
4. Conclusions and Discussions
This paper focused on the shear performance of sand–EPS beads and the buffer performance of sand–EPS beads and sand–EPE layered composite materials to resist impact load. Direct shear tests and multi-impact tests were carried out to study the performance of geofoam used for seismic isolation and impact load resistance. According to the test results, the following conclusions are drawn.
(1) The effect of the moisture content on the shear performance of sand–geofoam has not been studied. In this paper, the shear performance of sand–geofoam with different moisture content was studied. The test results showed that the shear strength of sand–EPS beads had different rules under different normal stresses. In the case of small normal stress, the shear strength of sand–EPS beads decreased with the increase in the moisture content. Under the larger normal stress, the shear strength decreased first and then increased with the increase in the moisture content, but generally showed a decreasing trend. The shear strength and internal friction angle of the sand were greater than those of the sand–EPS mixture. The internal friction angle of sand–EPS decreased first and then increased with the increase in the moisture content. When the moisture contents were 0% and 5%, the cohesion of sand–EPS was less than that of the sand. When the moisture content was 10%, the cohesion of sand–EPS was greater than that of the sand. With the increase in the moisture content, the cohesion of sand–EPS and the sand increased first and then decreased.
(2) Direct shear test results showed that the shear strength and shear stiffness of sand–EPS beads were lower than those of the sand. With the increase in the moisture content, the shear stiffness of sand–EPS beads decreased. However, under small normal stress, the shear strength decreased with the increase in the moisture content, while under large normal stress, the shear strength increased with the increase in the moisture content. When used as base isolation materials, materials with degraded shear stiffness tend to slow down the acceleration transferred to the superstructure [9], so sand–EPS can be used for seismic event isolation. However, as a seismic base isolation material, it is necessary to have enough stiffness and strength to ensure the stability and serviceability of the isolation layer and prevent the damage of the isolation layer. Therefore, the proper normal stress and moisture content are selected by balancing shear strength and stiffness to construct the sand–EPS composite material to achieve the effect of seismic isolation. The results presented in this study are considered limited by material and test conditions. Therefore, changing the moisture content, normal stress testing conditions, EPS particle size, EPS particle density, sand particle size, and sand particle size can affect the mechanical properties of sand–EPS beads. More studies are needed to form sand–EPS beads mixed material for seismic isolation.
(3) Sand–geofoam layered composite cushion had better buffering performance. Under multi-impact loads, the durability of the sand–geofoam composite cushion was better than that of the sand cushion, and the durability of sand–EPE was better than that of sand–EPS, which is consistent with the results studied by Zhao et al. [4]. The closer the geofoam cushion was to the top, the better the performance of the cushion. As the geofoam layer thickness or weight increased, the cushioning performance was better.
Author Contributions
Conceptualization, Q.G. and P.Z.; methodology, Q.G.; software, W.Z.; validation, Y.W., R.Z. and R.L.; formal analysis, Q.G. and B.Z.; investigation, L.W.; resources, Q.G. and L.W.; data curation, Q.G.; writing—original draft preparation, Q.G.; writing—review and editing, Q.G.; visualization, Q.G.; supervision, Q.G.; project administration, L.W.; funding acquisition, Q.G. All authors have read and agreed to the published version of the manuscript.
Funding
This research was funded by [National Natural Science Foundation of China] grant number [51508357] And The APC was funded by [Qi Ge].
Institutional Review Board Statement
Not applicable.
Informed Consent Statement
Informed consent was obtained from all subjects involved in the study.
Acknowledgments
The authors gratefully acknowledge the financial support of the Subproject of the National Natural Science Foundation of China (Grant No. 51508357). The authors are also grateful to the laboratory technicians for their assistance in making the specimens.
Conflicts of Interest
The authors declare no conflict of interest.
References
- Delhomme, F.; Mommessin, M.; Mougin, J.; Perrotin, P. Behavior of a structurally dissipating rock-shed: Experimental analysis and study of punching effects. Int. J. Solids Struct. 2005, 42, 4204–4219. [Google Scholar] [CrossRef]
- Zhao, P.; Xie, L.Z.; He, B.; Zhang, Y. Experimental study of rock-sheds constructed with PE fibers and composite cushion against rockfall impacts. Eng. Struct. 2018, 177, 175–189. [Google Scholar] [CrossRef]
- Zhao, P.; Xie, L.; Li, L.; Liu, Q.; Yuan, S. Large-scale rockfall impact experiments on a RC rock-shed with a newly proposed cushion layer composed of sand and EPE. Eng. Struct. 2018, 175, 386–398. [Google Scholar] [CrossRef]
- Zhao, P.; Yuan, S.; Li, L.; Ge, Q.; Liu, J.; Du, L. Experimental study on the multi-impact resistance of a composite cushion composed of sand and geofoam. Geotext. Geomembr. 2020, 49, 45–56. [Google Scholar] [CrossRef]
- Kawahara, S.; Muro, T. Effects of dry density and thickness of sandy soil on impact response due to rockfall. J. Terramechanics 2006, 43, 329–340. [Google Scholar] [CrossRef]
- Pei, X.J.; Liu, Y.; Wang, D.P. Study on the energy dissipation of sandy soil cushions on the rock-shed under rockfall impact load. J. Sichuan Univ. 2016, 48, 15–22. [Google Scholar]
- Ouyang, C.; Liu, Y.; Wang, D.; He, S. Dynamic Analysis of Rockfall Impacts on Geogrid Reinforced Soil and EPS Absorption Cushions. KSCE J. Civ. Eng. 2018, 23, 37–45. [Google Scholar] [CrossRef]
- Bhatti, A.Q. Computational Modeling of Energy Dissipation Characteristics of Expanded Polystyrene (EPS) Cushion of Reinforce Concrete (RC) Bridge Girder Under Rockfall Impact. Int. J. Civ. Eng. 2018, 16, 1635–1642. [Google Scholar] [CrossRef]
- Tsang, H.H.; Lo, S.; Xu, X.; Neaz Sheikh, M. Seismic isolation for low-to-medium-rise buildings using granulated rubber-soil mixtures: Numerical study. Earthq. Eng. Struct. Dyn. 2012, 41, 2009–2024. [Google Scholar] [CrossRef]
- Hazarika, H.; Okuzono, S.; Matsuo, Y. Seismic stability enhancement of rigid nonyielding structures. In Proceedings of the 13th (2003) International Offshore and Polar Engineering Conference, Honolulu, HI, USA, 25–30 May 2003; pp. 1244–1249. [Google Scholar]
- Sreya, M.V.; Jayalekshmi, B.R.; Venkataramana, K. Seismic Response of Buildings Resting on Raft Foundation with EPS Geofoam Buffer. In Soil Dynamics, Select Proceedings of 7th ICRAGEE 2020, Lecture Notes in Civil Engineering 119 (LNCE 119); Springer: Berlin/Heidelberg, Germany, 2021; pp. 417–425. [Google Scholar]
- Maleska, T.; Nowacka, J.; Beben, D. Application of EPS Geofoam to a Soil–Steel Bridge to Reduce Seismic Excitations. Geosciences 2019, 9, 448. [Google Scholar] [CrossRef] [Green Version]
- Turer, A.; Özden, B. Seismic base isolation using low-cost Scrap Tire Pads (STP). Mater. Struct. 2007, 41, 891–908. [Google Scholar] [CrossRef]
- Rekha, S.; Kumar, P.R. Properties and application of EPS beads as a lightweight fill material for embankment construction. Int. J. Innov. Res. Sci. Eng. Technol. 2014, 3, 428–438. [Google Scholar]
- Brunet, S.; de la Llera, J.C.; Kausel, E. Non-linear modeling of seismic isolation systems made of recycled tire-rubber. Soil Dyn. Earthq. Eng. 2016, 85, 134–145. [Google Scholar] [CrossRef]
- Ding, Y.; Zhang, J.; Chen, X.; Wang, X.; Jia, Y. Experimental investigation on static and dynamic characteristics of granulated rubber-sand mixtures as a new railway subgrade filler. Constr. Build. Mater. 2020, 273, 121955. [Google Scholar] [CrossRef]
- Bartlett, S.F.; Lingwall, B.N.; Vaslestad, J. Methods of protecting buried pipelines and culverts in transportation infrastructure using EPS geofoam. Geotext. Geomembranes 2015, 43, 450–461. [Google Scholar] [CrossRef]
- Miki, G. Ten year history of EPS method in Japan and its future challenges. In Proceeding of the International Symposium on EPS Construction Method, Tokyo, Japan, 29–30 October 1996; pp. 394–411. [Google Scholar]
- Negussey, D. Properties and Applications of Geofoam, Society of the Plastics Industry; Foamed Polystyrene Alliance, Inc.: Washington, DC, USA, 1997. [Google Scholar]
- Xenaki, V.; Athanasopoulos, G. Experimental Investigation of the Interaction Mechanism at the EPS Geofoam-Sand Interface by Direct Shear Testing. Geosynth. Int. 2001, 8, 471–499. [Google Scholar] [CrossRef] [Green Version]
- AbdelSalam, S.S.; Azzam, S.A. Reduction of lateral pressures on retaining walls using geofoam inclusion. Geosynth. Int. 2016, 23, 395–407. [Google Scholar] [CrossRef]
- Khan, M.I.; Meguid, M.A. Experimental Investigation of the Shear Behavior of EPS Geofoam. Int. J. Geosynth. Ground Eng. 2018, 4, 12. [Google Scholar] [CrossRef]
- Basti, T.H.; Chenari, R.J.; Payan, M.; Senetakis, K. Monotonic, cyclic and post-cyclic shearing behavior of sand-EPS geofoam interface. Geosynth. Int. 2021, 28, 259–278. [Google Scholar] [CrossRef]
- Lin, L.-K.; Chen, L.-H.; Chen, R.H.L. Evaluation of Geofoam as a Geotechnical Construction Material. J. Mater. Civ. Eng. 2010, 22, 160–170. [Google Scholar] [CrossRef]
- Liu, H.; Deng, A.; Chu, J. Effect of different mixing ratios of polystyrene pre-puff beads and cement on the mechanical behavior of lightweight fill. Geotext. Geomembr. 2006, 24, 331–338. [Google Scholar] [CrossRef]
- Tsuchida, T.; Porbaha, A.; Yamane, N. Development of a Geomaterial from Dredged Bay Mud. J. Mater. Civ. Eng. 2001, 13, 152–160. [Google Scholar] [CrossRef]
- Deng, A.; Xiao, Y. Measuring and Modeling Proportion-Dependent Stress-Strain Behavior of EPS-SandMixture. Int. J. Géoméch. 2010, 10, 214–222. [Google Scholar] [CrossRef] [Green Version]
- Miao, L.; Wang, F.; Han, J.; Lv, W.; Li, J. Properties and Applications of Cement-Treated Sand-Expanded Polystyrene Bead Lightweight Fill. J. Mater. Civ. Eng. 2013, 25, 86–93. [Google Scholar] [CrossRef]
- Edinçliler, A.; Özer, A. Effects of EPS bead inclusions on stress–strain behaviour of sand. Geosynth. Int. 2014, 21, 89–102. [Google Scholar] [CrossRef]
- Wang, F.; Miao, L. A proposed lightweight fill for embankments using cement-treated Yangzi River sand and expanded polystyrene (EPS) beads. Bull. Eng. Geol. Environ. 2009, 68, 517–524. [Google Scholar] [CrossRef]
- Shirazi, A.N.; Haydarian, H.; Nasehi, S.A. Shear and Compression Behaviors of Sandy and Clayey Soils Mixed with Different Sizes of Expanded Polystyrene Beads. Geotech. Geol. Eng. 2018, 36, 3823–3830. [Google Scholar] [CrossRef]
- Ibrahim, A.; Ahmad, F.; Hassan, Z.A.; Ali, F. Strength of expanded polystyrene (EPS)-sand as lightweight material in geotechnical engineering. J. Fundam. Appl. Sci. 2018, 9, 566. [Google Scholar] [CrossRef] [Green Version]
- Alaie, R.; Chenari, R.J. Cyclic and Post-Cyclic Shear Behaviour of Interface between Geogrid and EPS Beads-Sand Backfill. KSCE J. Civ. Eng. 2018, 22, 3340–3357. [Google Scholar] [CrossRef]
- Chenari, R.J.; Khonachah, R.E.; Hosseinpour, I.; Khajeh, A. An Experimental Study for the Cyclic Interface Properties of the EPS–sand Mixtures Reinforced with Geogrid. Int. J. Civ. Eng. 2019, 18, 151–159. [Google Scholar] [CrossRef]
- Rocco, N.T. Characterization of Expanded Polystyrene (EPS) and Cohesive Soil Mixtures. Ph.D. Thesis, Missouri University of Science and Technology, Rolla, MO, USA, 2012. [Google Scholar]
- El-Sherbiny, R.M.; Ramadan, S.H.; El-Khouly, M.A. Dynamic properties of sand-EPS bead mixtures. Geosynth. Int. 2018, 25, 456–470. [Google Scholar] [CrossRef]
- Gao, Y.; Wang, S.; Chen, C. A united deformation-strength framework for Lightweight Sand–EPS Beads Soil (LSES) under cyclic loading. Soil Dyn. Earthq. Eng. 2011, 31, 1144–1153. [Google Scholar] [CrossRef]
- Thaothip, A.; Kongkitkul, W. Strength and deformation characteristics of eps bead-mixed sand. Int. J. Geomate 2017, 13, 8–15. [Google Scholar] [CrossRef]
- Alaie, R.; Chenari, R.J. Dynamic properties of EPS-sand mixtures using cyclic triaxial and bender element tests. Geosynth. Int. 2019, 26, 563–579. [Google Scholar] [CrossRef]
- Yaghoobzadeh, S.; Azizkandi, A.S.; Salehzadeh, H.; Hasanaklou, S.H. Effect of EPS Beads on the Behavior of Sand–EPS and Slope Stability Using Triaxial and Centrifuge Tests. Int. J. Civ. Eng. 2021, 19, 1269–1282. [Google Scholar] [CrossRef]
- GB/T 50123-2019; Standard for Geotechnical Testing Method. Ministry of Housing and Urban-Rural Development of the People’s of China: Beijing, China, 2019.
Figure 1.
Rock-shed structure applied in actual engineering.

Figure 2.
EPS applied in an actual structure.

Figure 3.
Sand, EPS beads, and flocculent EPE materials. (a) Sand; (b) EPS beads; (c) flocculent EPE.
Figure 3.
Sand, EPS beads, and flocculent EPE materials. (a) Sand; (b) EPS beads; (c) flocculent EPE.

Figure 4.
Particle size distribution curve.

Figure 5.
Test instruments. (a) Impact test device; (b) the falling hammer; (c) the acrylic box.

Figure 6.
Shear-stress–shear displacement curve for sand and sand–EPS with different moisture contents. (a) Curves under the normal stress of 100 kPa; (b) curves under the normal stress of 200 kPa; (c) curves under the normal stress of 300 kPa; (d) curves under the normal stress of 400 kPa.
Figure 6.
Shear-stress–shear displacement curve for sand and sand–EPS with different moisture contents. (a) Curves under the normal stress of 100 kPa; (b) curves under the normal stress of 200 kPa; (c) curves under the normal stress of 300 kPa; (d) curves under the normal stress of 400 kPa.

Figure 7.
Shear-strength–moisture content curves under different normal stresses.

Figure 8.
Shear-strength–normal stress curves for different moisture content.

Figure 9.
Internal-friction-angle–moisture curve.

Figure 10.
Cohesion–moisture curve.

Figure 11.
Relation curve between peak acceleration and impact number of different pure sand cushion. (a) Sand cushion with 100 mm; (b) sand cushion with 150 mm; (c) sand cushion with 200 mm; (d) impact height with 1 m; (e) impact height with 1.25 m; (f) impact height with 1.5 m.
Figure 11.
Relation curve between peak acceleration and impact number of different pure sand cushion. (a) Sand cushion with 100 mm; (b) sand cushion with 150 mm; (c) sand cushion with 200 mm; (d) impact height with 1 m; (e) impact height with 1.25 m; (f) impact height with 1.5 m.

Figure 12.
Peak acceleration curves of the sand–EPS and sand–EPE composite cushions with different geofoam quantity. (a) Sand–EPS cushion; (b) sand–EPE cushion.
Figure 12.
Peak acceleration curves of the sand–EPS and sand–EPE composite cushions with different geofoam quantity. (a) Sand–EPS cushion; (b) sand–EPE cushion.

Figure 13.
Reduction percentage of the peak accelerations of composite cushions relative to the pure sand cushion.
Figure 13.
Reduction percentage of the peak accelerations of composite cushions relative to the pure sand cushion.

Figure 14.
Percentage variation in peak acceleration relative to the previous impact.

Figure 15.
Variation curve of the acceleration with the impact number for different placement height. (a) Sand–EPS with 30 mm EPS; (b) sand–EPS with 60 mm EPS; (c) sand–EPE with 68 g EPE; (d) sand–EPE with 136 g EPE.
Figure 15.
Variation curve of the acceleration with the impact number for different placement height. (a) Sand–EPS with 30 mm EPS; (b) sand–EPS with 60 mm EPS; (c) sand–EPE with 68 g EPE; (d) sand–EPE with 136 g EPE.


Figure 16.
Variation curves of the acceleration with the impact number for different geofoam types. (a) Sand–geofoam with 90 mm sand, 30 mm EPS, and 68 g EPE; (b) sand–EPS with 60 mm sand, 60 mm EPS, and 136 g EPE; (c) sand–geofoam with 30 mm sand, 30 mm EPS, and 68 g EPE; (d) sand–EPS with 60 mm sand, 30 mm EPS, and 68 g EPE.


Table 1.
Statistical table of multi-impact test conditions for sand cushion and sand–EPS cushion.
| Condition Number | Cushion Layer | Sand: Geofoam: Sand | Sand Thickness (mm) | Geofoam Thickness (mm) | Total Thickness (mm) | Impact Height (m) |
|---|---|---|---|---|---|---|
| 1 | Sand | - | 100 | 0 | 100 | 1 |
| 2 | 150 | 0 | 150 | |||
| 3 | 200 | 0 | 200 | |||
| 4 | 100 | 0 | 100 | 1.25 | ||
| 5 | 150 | 0 | 150 | |||
| 6 | 200 | 0 | 200 | |||
| 7 | 100 | 0 | 100 | 1.5 | ||
| 8 | 150 | 0 | 150 | |||
| 9 | 200 | 0 | 200 | |||
| 10 | Sand + EPS + Sand | 90:30:30 | 120 | 30 | 150 | 1.5 |
| 11 | 60:60:30 | 90 | 60 | |||
| 12 | 30:90:30 | 60 | 90 | |||
| 13 | 30:30:90 | 120 | 30 | |||
| 14 | 60:30:60 | 120 | 30 | |||
| 15 | 30:60:60 | 90 | 60 |
Table 2.
Statistical table of multi-impact test conditions for sand–EPE cushion.
| Condition Number | Cushion Layer | Geofoam: Quantity (g) | Sand Thickness of the Bottom Layer (mm) | Total Thickness (mm) | Impact Height (m) |
|---|---|---|---|---|---|
| 16 | Sand + EPE + Sand | 68 | 30 | 150 | 1.5 |
| 17 | 136 | 30 | |||
| 18 | 204 | 30 | |||
| 19 | 68 | 60 | |||
| 20 | 68 | 90 | |||
| 21 | 136 | 60 |
Table 3.
Difference percentage of the peak acceleration under each impact relative to that of the previous impact.
Table 3.
Difference percentage of the peak acceleration under each impact relative to that of the previous impact.
| Cushion Thickness (mm) | Difference Percentage for the Impact Height 1 m (%) | Difference Percentage for the Impact Height 1.25 m (%) | Difference Percentage for the Impact Height 1.5 m (%) | |||||||||
|---|---|---|---|---|---|---|---|---|---|---|---|---|
| 2 | 3 | 4 | 5 | 2 | 3 | 4 | 5 | 2 | 3 | 4 | 5 | |
| 100 | 84.3 | 23.7 | 4.2 | 3.5 | 127.0 | 7.2 | 8.5 | −0.3 | 100.5 | 10.7 | 3.9 | 2.1 |
| 150 | 136.1 | 26.0 | 10.3 | 3.1 | 105.9 | 33.4 | 1.0 | 1.3 | 83.2 | 27.5 | 10.8 | −4.9 |
| 200 | 203.4 | 20.2 | 2.9 | 0.2 | 134.8 | 32.4 | 2.3 | 0.2 | 113.7 | 31.3 | 7.3 | −1.8 |
Publisher’s Note: MDPI stays neutral with regard to jurisdictional claims in published maps and institutional affiliations. |
© 2022 by the authors. Licensee MDPI, Basel, Switzerland. This article is an open access article distributed under the terms and conditions of the Creative Commons Attribution (CC BY) license (https://creativecommons.org/licenses/by/4.0/).
Share and Cite
MDPI and ACS Style
Ge, Q.; Zuo, W.; Liu, R.; Zhu, B.; Zhao, P.; Wan, L.; Wang, Y.; Zhao, R. Experimental Studies for Shear and Multi-Impact Resistance Performance of Sand–Geofoam Material. Buildings 2022, 12, 633. https://doi.org/10.3390/buildings12050633
AMA Style
Ge Q, Zuo W, Liu R, Zhu B, Zhao P, Wan L, Wang Y, Zhao R. Experimental Studies for Shear and Multi-Impact Resistance Performance of Sand–Geofoam Material. Buildings. 2022; 12(5):633. https://doi.org/10.3390/buildings12050633
Chicago/Turabian StyleGe, Qi, Wenhao Zuo, Renkuan Liu, Baoying Zhu, Peng Zhao, Li Wan, Yifan Wang, and Rong Zhao. 2022. "Experimental Studies for Shear and Multi-Impact Resistance Performance of Sand–Geofoam Material" Buildings 12, no. 5: 633. https://doi.org/10.3390/buildings12050633
Note that from the first issue of 2016, this journal uses article numbers instead of page numbers. See further details here.