Article

Regional Sustainable Performance of Construction Industry in China from the Perspective of Input and Output: Considering Occupational Safety

1
Hubei Key Laboratory of Construction and Management in Hydropower Engineering, China Three Gorges University, Yichang 443002, China
2
College of Hydraulic & Environmental Engineering, China Three Gorges University, Yichang 443002, China
*
Author to whom correspondence should be addressed.
Buildings 2022, 12(5), 618; https://doi.org/10.3390/buildings12050618
Submission received: 30 March 2022 / Revised: 20 April 2022 / Accepted: 5 May 2022 / Published: 7 May 2022
(This article belongs to the Collection Buildings, Infrastructure and SDGs 2030)

Abstract

:
Improving the poor sustainability of the construction industry requires long-term actions, especially in developing countries such as China. Regional sustainability assessment plays an indispensable role, contributing to a better understanding of the state of development in various regions. However, few studies have focused on the overall sustainability of regional construction industries, and occupational safety is generally ignored. To fill these gaps, an input-output system is established to evaluate regional sustainable performance of the construction industry (SPCI), which is made to include occupational safety by introducing the number of fatalities as an undesirable output. An evaluation model is constructed by combining window analysis with a super-slack-based measure data envelopment analysis (windows-super-SBM DEA). The SPCI in China’s 30 provinces from 2010 to 2017 is dynamically evaluated, and regional differences are further analyzed, with eight regions being defined. The results indicate that (1) the overall SPCI in China has fluctuated smoothly around a slight downward trend. By comparison, the integration of occupational safety refreshes the relative performance of most provinces; (2) dividing China into eight regions presents more detailed information because of those regions’ smaller coverage areas, and more attention should be given to the northeast, northwest, Middle Yellow River region and east coast because of the decrease in the SPCI; and (3) vigorously developing of the construction industry does not necessarily result in a large number of byproducts if the relevant policy is sufficiently strong. The findings of this study are conducive to rationally allocating resources and formulating targeted policies.

1. Introduction

The construction industry is known to be a major contributor to the socioeconomic development of countries. It plays a crucial role in improving infrastructure, increasing employment and boosting economic growth [1]. Along with these contributions, however, its considerable number of byproducts such as greenhouse gases and solid waste poses serious threats to human development [2]. Hence, the concept of sustainability in the construction industry has been proposed [3], aiming to offer substantial and maintainable benefits [4]. Especially in developing countries such as China, painful repercussions are particularly significant because of the multiplier effects from the labor-intensive nature of the construction industry and from its style of extensive management, as well as from the urgent demand for rapid urbanization and industrialization. Statistically, nearly 60% of global CO2 emissions from the construction industry can be attributed to developing countries, with China being the largest contributor [2]. To improve the poor sustainability of the construction industry, the Chinese government has implemented a series of strategies [5]. However, given its vast territory, China has constantly faced the problem of imbalanced regional development. Different regions usually operate under different conditions; thus, policy should be formulated and adjusted according to the actual local situations for better results. Therefore, it is imperative to investigate the sustainable performance of the construction industry (SPCI) in different regions, so as to help policymakers better understand the state of each region and develop more targeted countermeasures.
Sustainability is defined as the coordinated development of the economy, the environment and society [6]. The previous scholars mainly selected evaluation indicators from three aspects, the economy, society and environment, and then established a sustainability evaluation index system [7,8,9]. However, the sustainability indicators of different industries are different. More specific indicators should be further defined according to the characteristics of different sectors. Therefore, the sustainability evaluation indicators of the construction industry need to be reselected. The construction industry is not only a large consumer of resources, producer of waste and emitter of carbon, but is also responsible for 30–40% of all fatalities worldwide [10]. This massive number of casualties leads to very large economic losses and labor-force reductions, as well as immeasurable human suffering, and severely affects the sustainability of the construction industry [11]. If the construction industry in a region often has casualties, no matter how well it performs in other aspects, this region cannot be regarded as having a high level of sustainable development. People’s lives and health must be in the first place of sustainable development. The development of the construction industry should not be at the expense of health and safety. In addition, some scholars have proved the relationship between occupational health and SPCI. For example, Karakhan and Gambatese [12] surveyed 2641 industry professionals. Jilcha and Kitaw [13] interviewed 18 manufacturing industries in Ethiopia. The results show that the majority of interviewees either agreed or strongly agreed that occupational safety is an integral aspect of sustainable development. Previous research regarding the SPCI has mainly focused on its environmental aspects, including regional resource consumption, energy utilization and carbon emissions. However, occupational safety is rarely considered in the evaluation index system of SPCI. Without the key indicator of occupational safety, arguments that regions with frequent construction accidents deserve the reputation of having highly sustainable construction industries are unpersuasive. The evaluation results of SPCI provide correct policy guidance for governments all over the country with difficulty.
In addition, a reasonable regional division should classify provinces with similar development levels into the same region according to certain rules. However, most previous studies have tended to divide China into three regions, namely, the eastern region, the central region and the western region. This classification method was proposed in 1986, but the regional pattern in China has changed after years of development. This method is too rough and it conceals regional problems. Therefore, a more appropriate regional division needs to be proposed. In this study, China is divided into eight regions based on similarities in economic development, the structure of resource endowments, the natural geographic environment, etc. [14]. This new division can enable investigators to better identify differences in progress and in potential improvements across regions and provide more information about regional differences that are due to the regions’ smaller coverage areas.
In fact, construction activity is essentially an input-output process [15]. The goal of construction activity can be thought of as utilizing the fewest inputs in exchange for a greater number of desirable outputs and fewer undesirable outputs. This study attempts to understand regional SPCI from an input-output perspective. There is a consensus in previous studies on the indicators used to assess the sustainability of construction projects [7,8,16,17]. These indicators include capital, energy, land, labor and material as inputs, value and profit as desirable outputs, and solid waste and carbon emissions as undesirable outputs. The desirable and undesirable outputs of construction activity are generated simultaneously. For example, Kang, et al. [18] investigated regional occupational safety in China and established an input-output system that used the number of fatalities as an undesirable output. The advantages of evaluating sustainability from the perspective of input-output include the following: (1) the input-output perspective is more in line with the nature of the construction industry; (2) the use of this perspective makes it easier to understand the level of sustainable development in the construction industry and allows investigators to directly identify which factors promote or inhibit sustainability; and (3) the selection of assessment indicators is based on specific, obvious processes used in the construction industry. If an evaluation index system is established from the perspectives of the economy, the environment or society, as in previous research, that specific evaluation index is likely to be unable to reach an agreement, especially the national evaluation. Because the concerns of each region are inconsistent and the indicators selected for each region may be different, from the perspective of input-output the sustainability assessment indicators of each region are fixed. We establish an evaluation indicator system from an input-output perspective to comprehensively assess regional SPCI, with occupational safety included as a consideration. As an application, the SPCI in China’s 30 provinces from 2010 to 2017 is estimated and China is divided into eight regions for further analysis.
The rest of this study is organized as follows. The following section provides a review of the limitations of previous research, as well as of the tools used for comprehensive assessments. Section 3 introduces the evaluation indicator system used in the current study and details on the research methods used. The results and discussion are presented in Section 4 and Section 5, respectively. Finally, the conclusions are given in Section 6.

2. Literature Review

2.1. Sustainability and Occupational Safety

Sustainability has been studied across a range of scales, spanning from the micro level to the macro level. In recent years, scholars have proposed different comprehensive frameworks with specific indicators for these two levels [7,8]. Studies at the micro level mainly focus on companies or firms [19,20]. Previous studies have emphasized conducting sustainability assessments throughout the whole life cycle of a project to construct resource-conserving and environmentally friendly buildings [16]. Similarly, sustainability evaluations at the macro level are of great importance for national and industrial policy making. Yan, Zhao, Lin and Li [17] evaluated the regional sustainability of China’s construction industry from an integrated perspective of environmental protection and resource conservation. Xu, Wang and Tao [9] comprehensively investigated the regional sustainability of the whole construction industry. However, these studies ignored an important factor affecting sustainability: occupational safety. Occupational safety is considered to be a key issue in project-level sustainability assessments for construction [12,21]. For instance, Jilcha and Kitaw [13] theoretically investigated the relationship between sustainability and occupational safety, and Molamohamadi and Ismail [22] further established the link between the two factors. Mapar et al. [23] and Nawaz et al. [24] argued that if occupational safety was included in sustainability assessments, the accuracy of project-level sustainability assessments would be improved. Hinze et al. [25] thoroughly integrated occupational safety and health into sustainability assessments for projects and explained why occupational safety and health must be integrated into sustainability. Karakhan and Gambatese [12] integrated occupational safety and health into sustainable design to prevent potential construction hazards at their source. Mohandes and Zhang [26] developed a holistic occupational health and safety risk assessment model (HOHSRAM) and used the HOHSRAM to evaluate the sustainable sustainability of construction projects. Kim et al. [27] ranked the causes of tower crane accidents and utilized those rankings in the sustainable management of construction sites.
In previous studies, scholars have tended to measure the occupational safety performance of a project in terms of the life cycle of the project and its stakeholders. However, no one has integrated the occupational safety of the whole industry into sustainability assessments. Unlike project-level occupational safety, regional-level occupational safety cannot be evaluated on the basis of preparatory measures. The macro-level countermeasures used to ensure occupational safety are difficult to measure quantitatively, which may be the main reason why they are ignored.

2.2. Assessment Methods

Data envelopment analysis (DEA), a projection pursuit model, the entropy method, principle factor analysis, etc. can be employed to construct comprehensive assessment models. The DEA method has been recognized as a robust tool for measuring the relative performance of a decision-making unit (DMU) with multiple inputs and multiple outputs [28]. The use of DMU does not require a consideration of the internal structure of inputs and outputs and eliminates unrealistic weight selections without predetermining any weight restrictions [29]. Various models based on the DEA method have been developed for different scenarios. The radial model is the most typical model, in which the inputs and outputs are adjusted proportionally [30]. The non-radial model was developed to enable inputs and outputs to be adjusted nonproportionally [31]. The slack-based measure (SBM) model introduces slacks of inputs and outputs to construct efficiency indicators [32]. The super-SBM model is utilized to further rank the efficiency indicators [33]. With the super-SBM model, undesirable outputs can be easily measured. Due to its advantages, the super-SBM model is widely used for performance evaluation in various subjects, especially those in which undesirable outputs exist [34,35]. Charnes et al. [36] first proposed the super-SBM model to analyze cross-sectional data covering one year. However, data covering continuous years cannot be analyzed by this method. In other words, the performance of DMUs in different years calculated through the super-SBM is less comparable. To tackle this disadvantage, the windows analysis technique is introduced in this paper, the basic idea of which is to regard each DMU in each period under analysis as if it were a different DMU [37]. The windows analysis has been recognized as an effective tool for evaluating the performance of DMUs over a certain time period by combining different DEA models, as was done in the studies by Chung et al. [38], Sueyoshi et al. [39] and Wang et al. [40]. The windows analysis technique enables the performance of a DMU in one period to be contrasted with that of the same DMU in other periods, as well as with the performance of other DMUs [41]. Moreover, given that three problems, i.e., considering undesirable outputs, dealing with panel data and distinguishing DMUs with relatively large input-output systems, are encountered in this study, window analysis and super-SBM (windows-super-SBM model) are combined to assess the SPCI.

3. Data Sources and Methods

3.1. Indicators and Data

Identifying the elements of an input-output system is the foundation for conducting a reliable evaluation. In addition to common inputs (capital, energy and labor), the construction process requires the interaction of workers and objects; thus, machinery and materials are also regarded as inputs. The outputs are determined according to the goals of sustainable development and mainly include boosting socioeconomic development and reducing environmental pollution, both of which are outputs that have been considered in previous studies, as well as guaranteeing occupational safety, which is considered in this study. The input-output system covers a total of five dimensions: economy, environment, society, resource utilization and occupational safety. A detailed description of the selected indicators follows:
Capital input: As the driving force behind industrial development, capital input is usually measured by the capital stock. However, the measurement method used (such as the perpetual inventory method) may involve the capital utilization rate or the fixed assets depreciation rate, each of which is unavailable for the construction industry given the relatively complex capital composition in each region. In view of this, total fixed assets in the construction industry (with 2010 as the base year) are chosen to represent capital input [42].
Labor input: Since the construction industry is labor intensive, total hours worked by laborers is the best indicator to measure labor input. However, due to the data unavailability of this indicator, the total number of employees in the construction industry is selected as a substitute [43].
Energy input: Energy consumption is calculated based on the consumption of coal, coke, crude oil, gasoline, kerosene, diesel oil, fuel oil, natural gas and electricity. The conversion coefficient of standard coal is obtained from the general principles for calculating comprehensive energy consumption published by the National Development and Reform Commission of China [44].
Machinery input: Advanced machinery and equipment can greatly increase productivity on the one hand and can also reduce construction risks and environmental impacts on the other hand [45,46]. Therefore, according to the study of Chen et al. [47], the total power of the machinery and equipment owned by construction enterprises was selected to measure machinery input.
Material input: According to the China Statistical Yearbook on the Construction Industry, the materials consumed in the construction process mainly include steel, wood, concrete, glass and aluminum.
Desirable outputs: The construction industry produces a wide range of desirable products, which can be roughly divided into two types: physical output and economic output. The latter is generally used, and the total output value is the most representative indicator of economic output. In addition, unlike the total value of output, total pretax profits reflect the direct benefits that the construction industry has brought to the development of construction enterprises [9]. Furthermore, according to Huo et al. [48], there is a difference between physical output and economic output, as the former is not affected by price variations across different provinces. Therefore, three desirable outputs are selected: the total output value, the total pretax profit and the floor space of buildings.
Undesirable outputs: There are two types of undesirable outputs. One is undesirable environmental outputs. The main environmental impact of the construction industry is its large amount of carbon emissions. Carbon emissions are mainly calculated based on the consumption of primary energy, including coal, coke, crude oil, gasoline, kerosene, diesel, fuel oil and natural gas, as well as the consumption of construction materials [49]. The other type of undesirable output is related to occupational safety. The indicators of project-level occupational safety such as safety-production investment, the number of safety managers and the number of daily safety inspections are difficult to measure at the macro level. When the number of deaths is used as a measure, regional occupational safety can be characterized easily. In addition, previous studies have proven that the most direct reflection of occupational safety is the number of casualties [18,50]. However, since data on injuries are not available, the number of fatalities in the construction industry is used as a proxy for occupational safety.
An input-output system that includes 10 inputs, 3 desirable outputs and 3 undesirable outputs is established, as shown in Table 1. Due to data availability restrictions, the 30 provinces of China are selected as the study area (Table A1 in Appendix A). These 30 provinces are divided into eight regions as shown in Figure 1. Hong Kong (HK), Macao (MC), Taiwan (TW) and Tibet are excluded. The data are collected from the Ministry of Housing and Urban-Rural Development of the People’s Republic of China (MOHURD) (2011–2018), the China Statistical Yearbook (2011–2018), the China Statistical Yearbook on the Construction Industry (2011–2018) and the China Statistical Yearbook on Energy (2011–2018) (https://data.cnki.net/yearbook/Single/N2021120002) (accessed on 1 January 2020). The official data used in this paper covers all construction projects in various regions of China, including projects under construction and completed projects. In addition, all types of projects in the construction industry are also included, such as water conservancy engineering, housing projects, municipal projects, etc.

3.2. The Windows-Super-SBM Model

To dynamically evaluate the SPCI, windows analysis and super-SBM model are combined. First, the windows size K is defined. Assuming that there are n provinces under evaluation, each province has data from period 1 to M. Period 1 to K forms the first window and period 2 to K + 1 forms the second window and so on. A total of W windows ultimately exist and there are N = n × K DMUs in each window. Notably, it is implicitly assumed that there are no technical changes within the same window [51]. Hence, a narrow window size of K = 3 is fixed, which accords with the original work of Charnes, Clark, Cooper and Golany [37]. In this study, six time windows are defined: 2010–2012 (W1), 2011–2013 (W2), 2012–2014 (W3), 2013–2015 (W4), 2014–2016 (W5) and 2015–2017 (W6). Each window contains N = 90 provinces, and each province has m = 9 inputs, s 1 = 3 desirable outputs and s 2 = 2 undesirable outputs. The relationship linking the number of DMUs, inputs and outputs satisfies the following guiding principles [52]:
N max { m × ( s 1 + s 2 ) ,   3 × ( m + s 1 + s 2 ) }
The SPCI in the provinces in each window is first calculated through an SBM model that includes undesirable outputs, which is defined as follows [33]:
ρ = min 1 1 m i = 1 m s i x i 0 b 1 + 1 s 1 + s 2 ( r 1 = 1 s 1 s r 1 g y r 1 0 g + r 2 = 1 s 2 s r 2 b y r 2 0 b )   s . t . j = 1 , 0 N λ j x j + s = x 0     j = 1 , 0 N λ j y j s g = y 0 g     j = 1 , 0 N λ j y j + s b = y 0 b     λ , s , s g , s b 0
where ρ is score for the SPCI; x i 0 , y r 1 0 and y r 2 0 are the i-th input, the r1-th desirable output and the r2-th undesirable output, respectively, of the province under evaluation; s = ( s , s g , s b ) denotes the slack in inputs, desirable outputs and undesirable outputs, respectively; and λ is the intensity vector.
The range of ρ obtained from model (2) is (0 1]. If ρ = 1 and s = s g = s b = 0 , the province is SBM-efficient. Then, the super-SBM model is used to further discriminate them [53]:
ρ = min 1 + 1 m i = 1 m s i x i 0 b 1 1 s 1 + s 2 ( r 1 = 1 s 1 s r 1 g y r 1 0 g + r 2 = 1 s 2 s r 2 b y r 2 0 b )   s . t . j = 1 , 0 N λ j x j s x 0     j = 1 , 0 N λ j y j + s g y 0 g     j = 1 , 0 N λ j y j s b y 0 b     1 1 s 1 + s 2 ( r 1 = 1 s 1 s r 1 g y ¯ r 1 0 g + r 2 = 1 s 2 s r 2 b y ¯ r 2 0 b ) > 0     λ , s , s g , s b 0
The above fractional function can be transformed into a linear programming function by introducing a variable t [54], as follows:
ρ = min t + 1 m i = 1 m S i x i 0 b   s . t . j = 1 , 0 N μ j x j S x 0     j = 1 , 0 N μ j y j + S g y 0 g     j = 1 , 0 N μ j y j S b y 0 b     t 1 s 1 + s 2 ( r 1 = 1 s 1 s r 1 g y ¯ r 1 0 g + r 2 = 1 s 2 s r 2 b y ¯ r 2 0 b ) = 1     μ , S , S g , S b 0
where S = ( S , S g , S b ) and μ are the transformed slack variables and transformed intensity vector corresponding to s = ( s , s g , s b ) and λ in model (3).
Based on the above description, each province has one score for the SPCI in 2010 and 2017, two scores in 2011 and 2016, and three scores from 2012 to 2015. Then, we average the score(s) for the SPCI in each province for the same year as the final result [40].

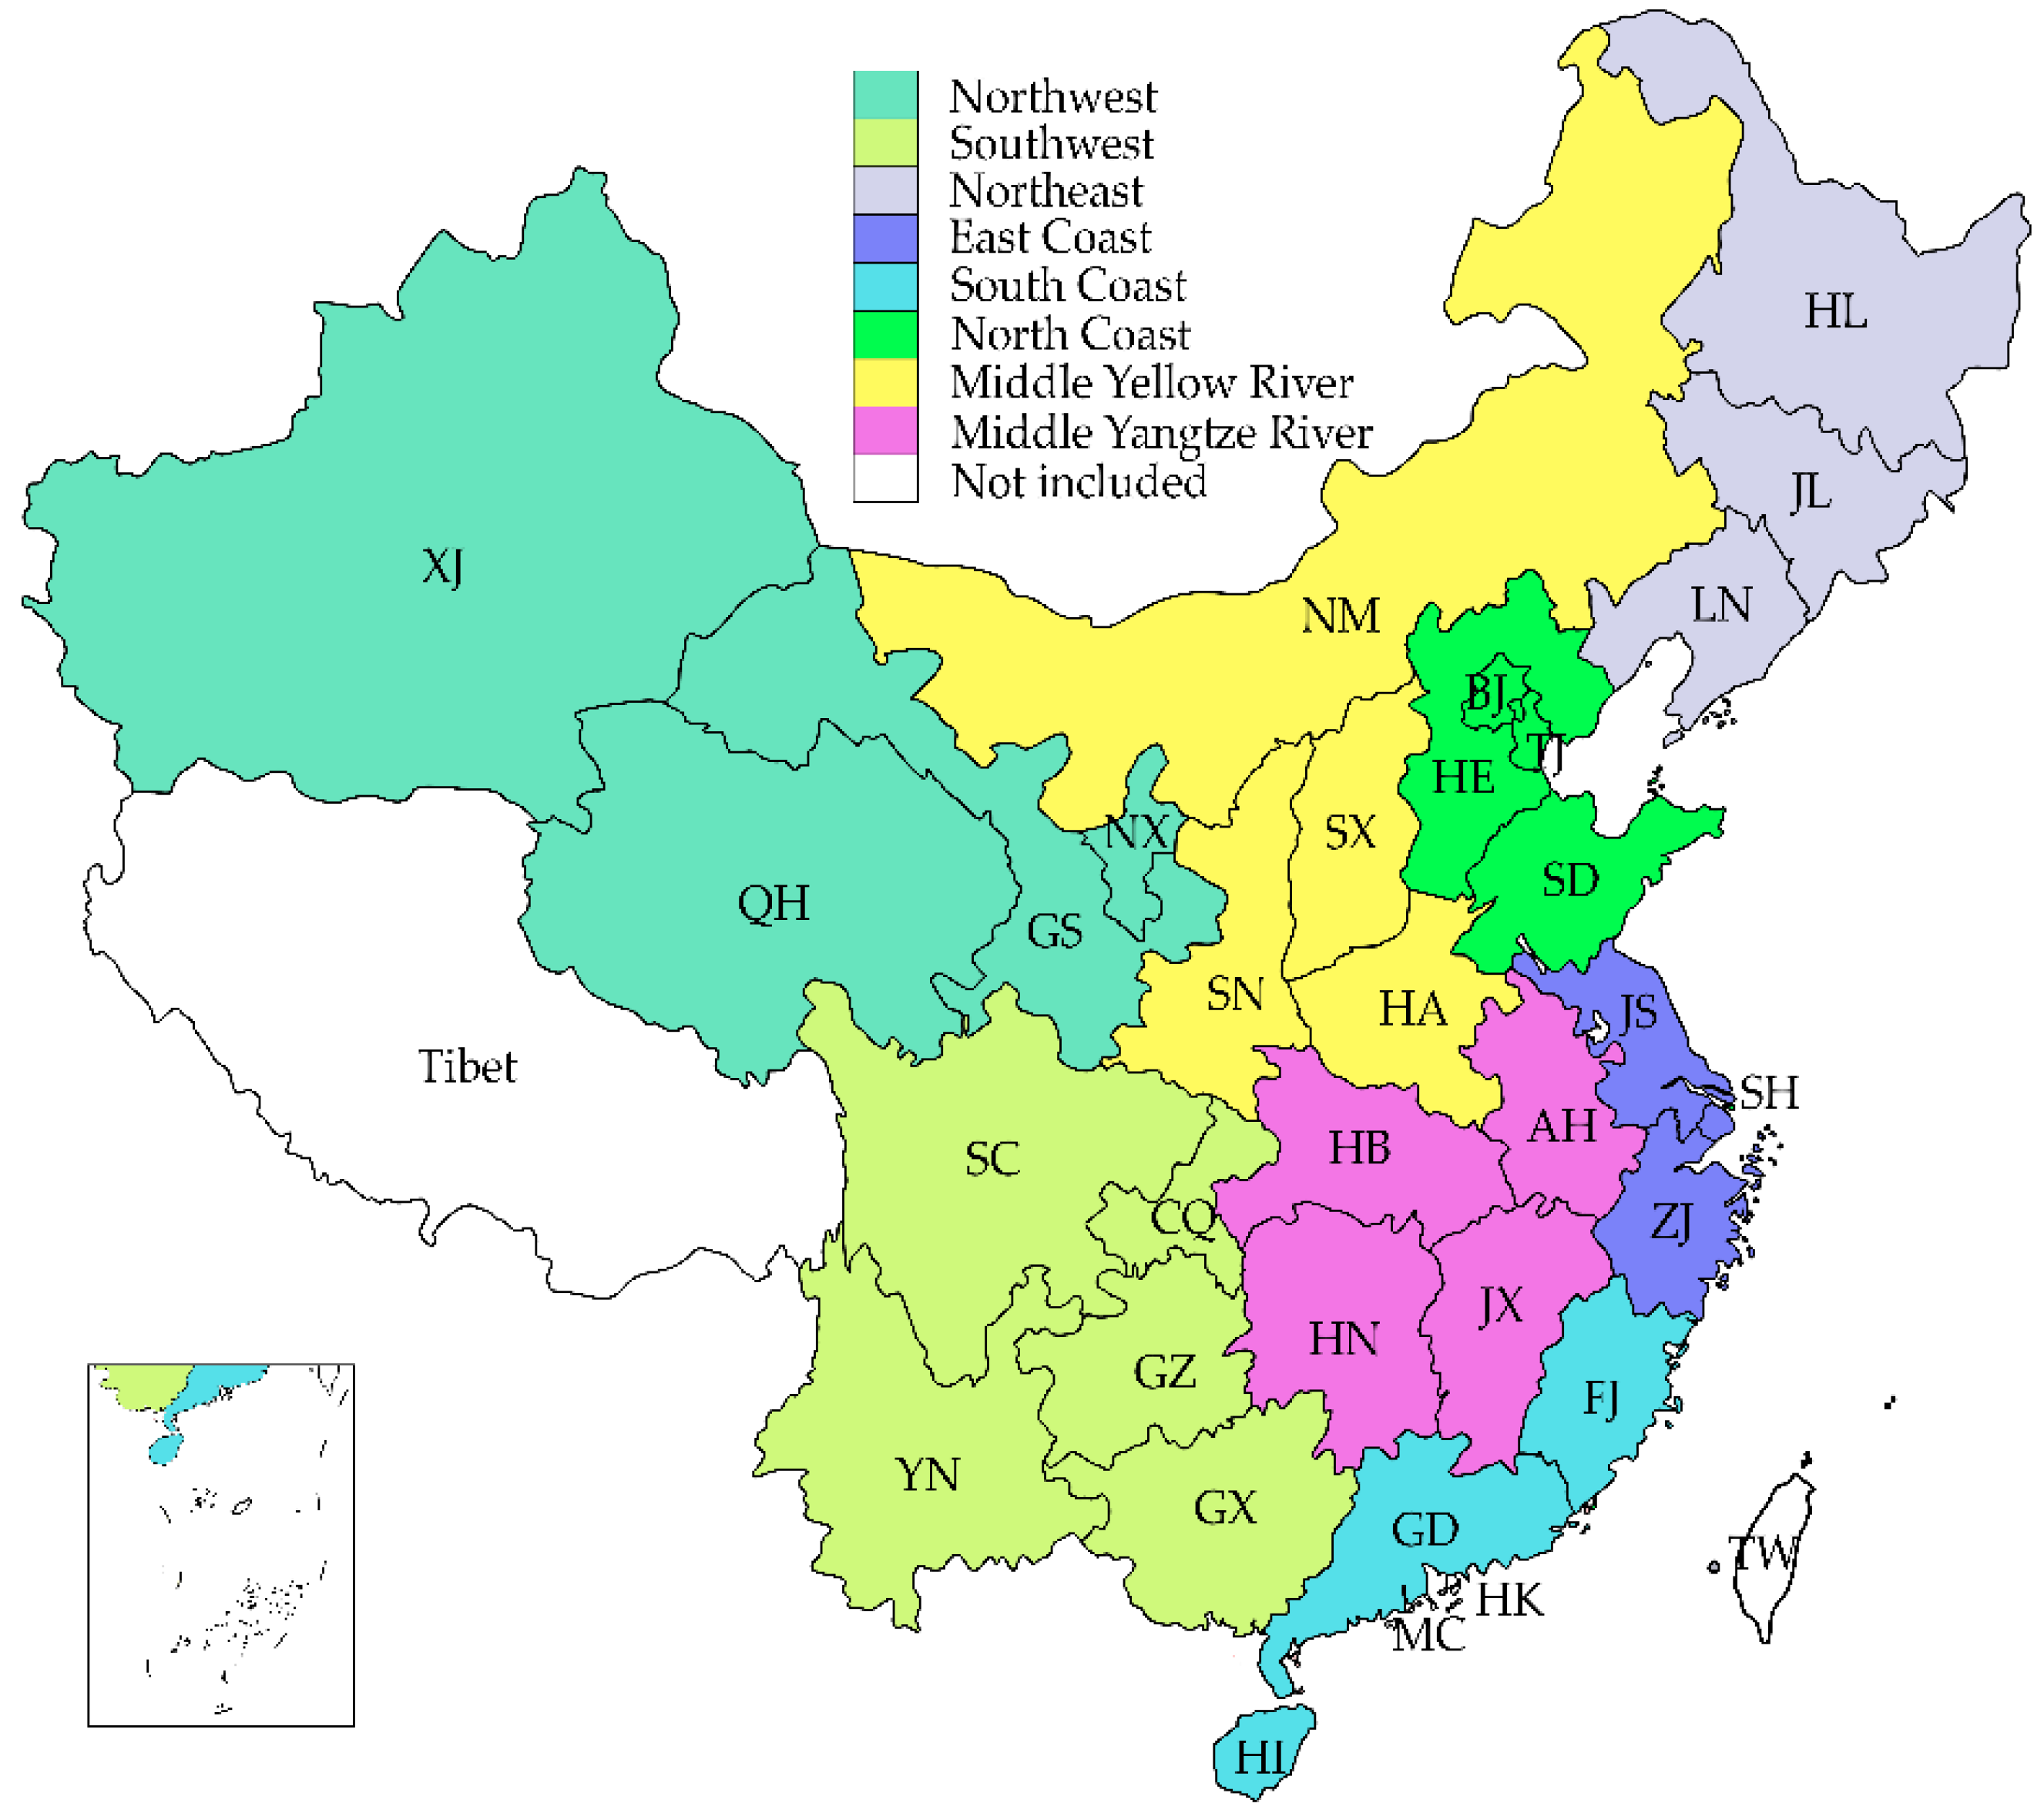
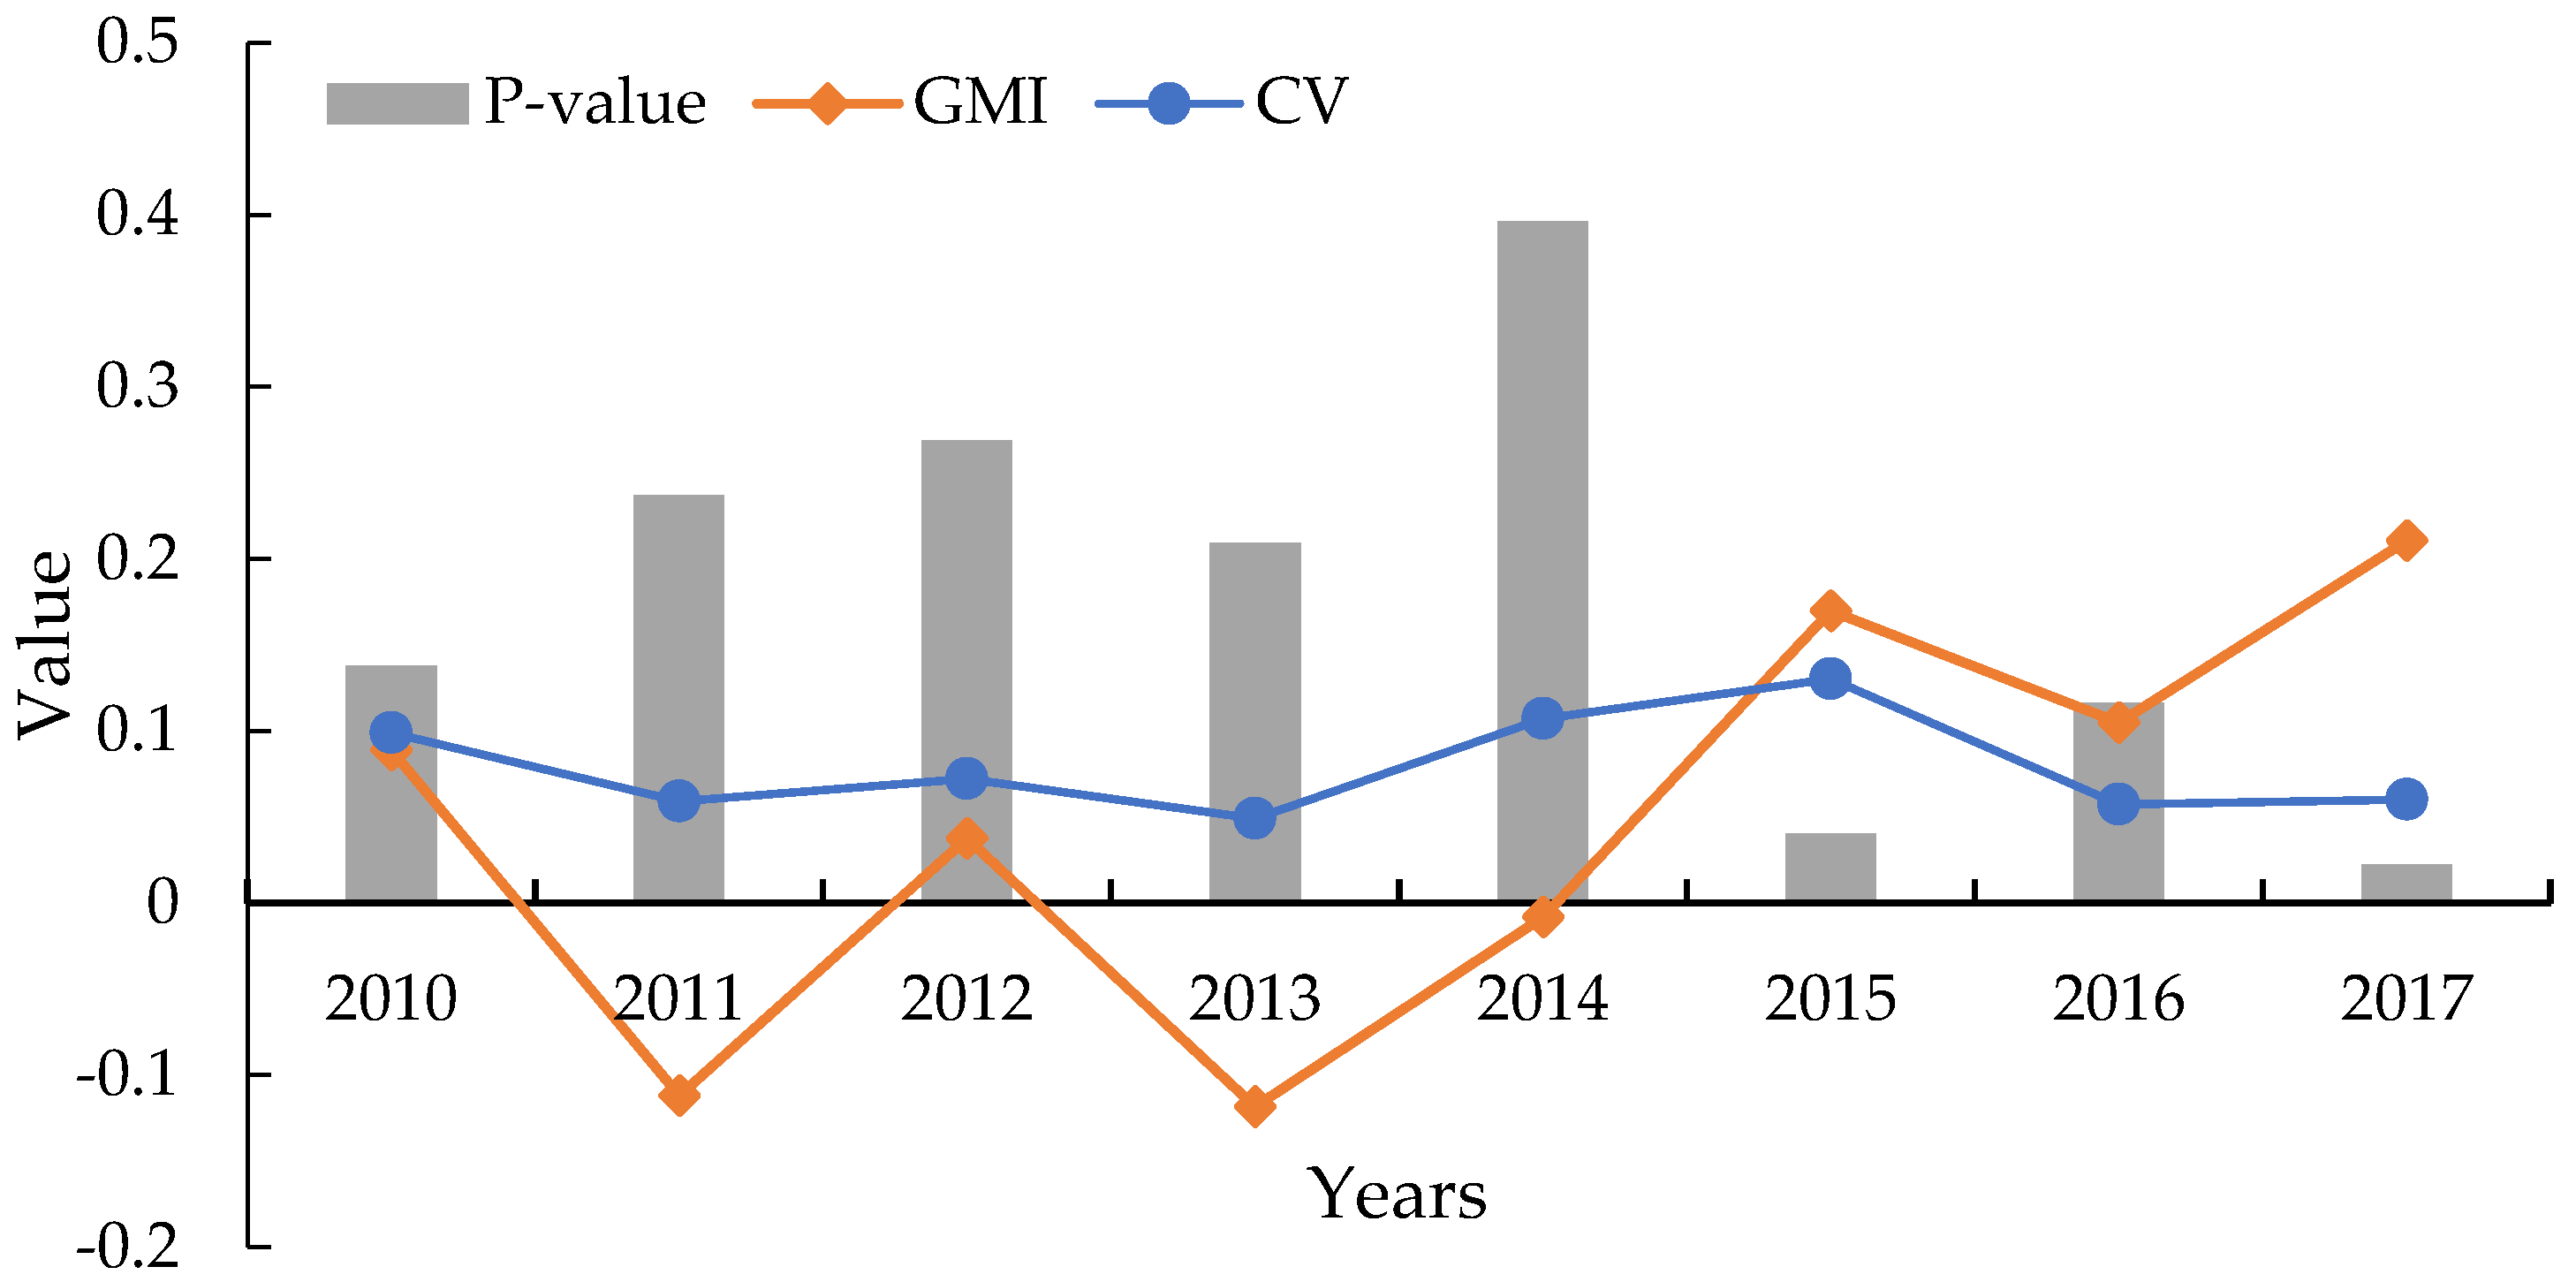
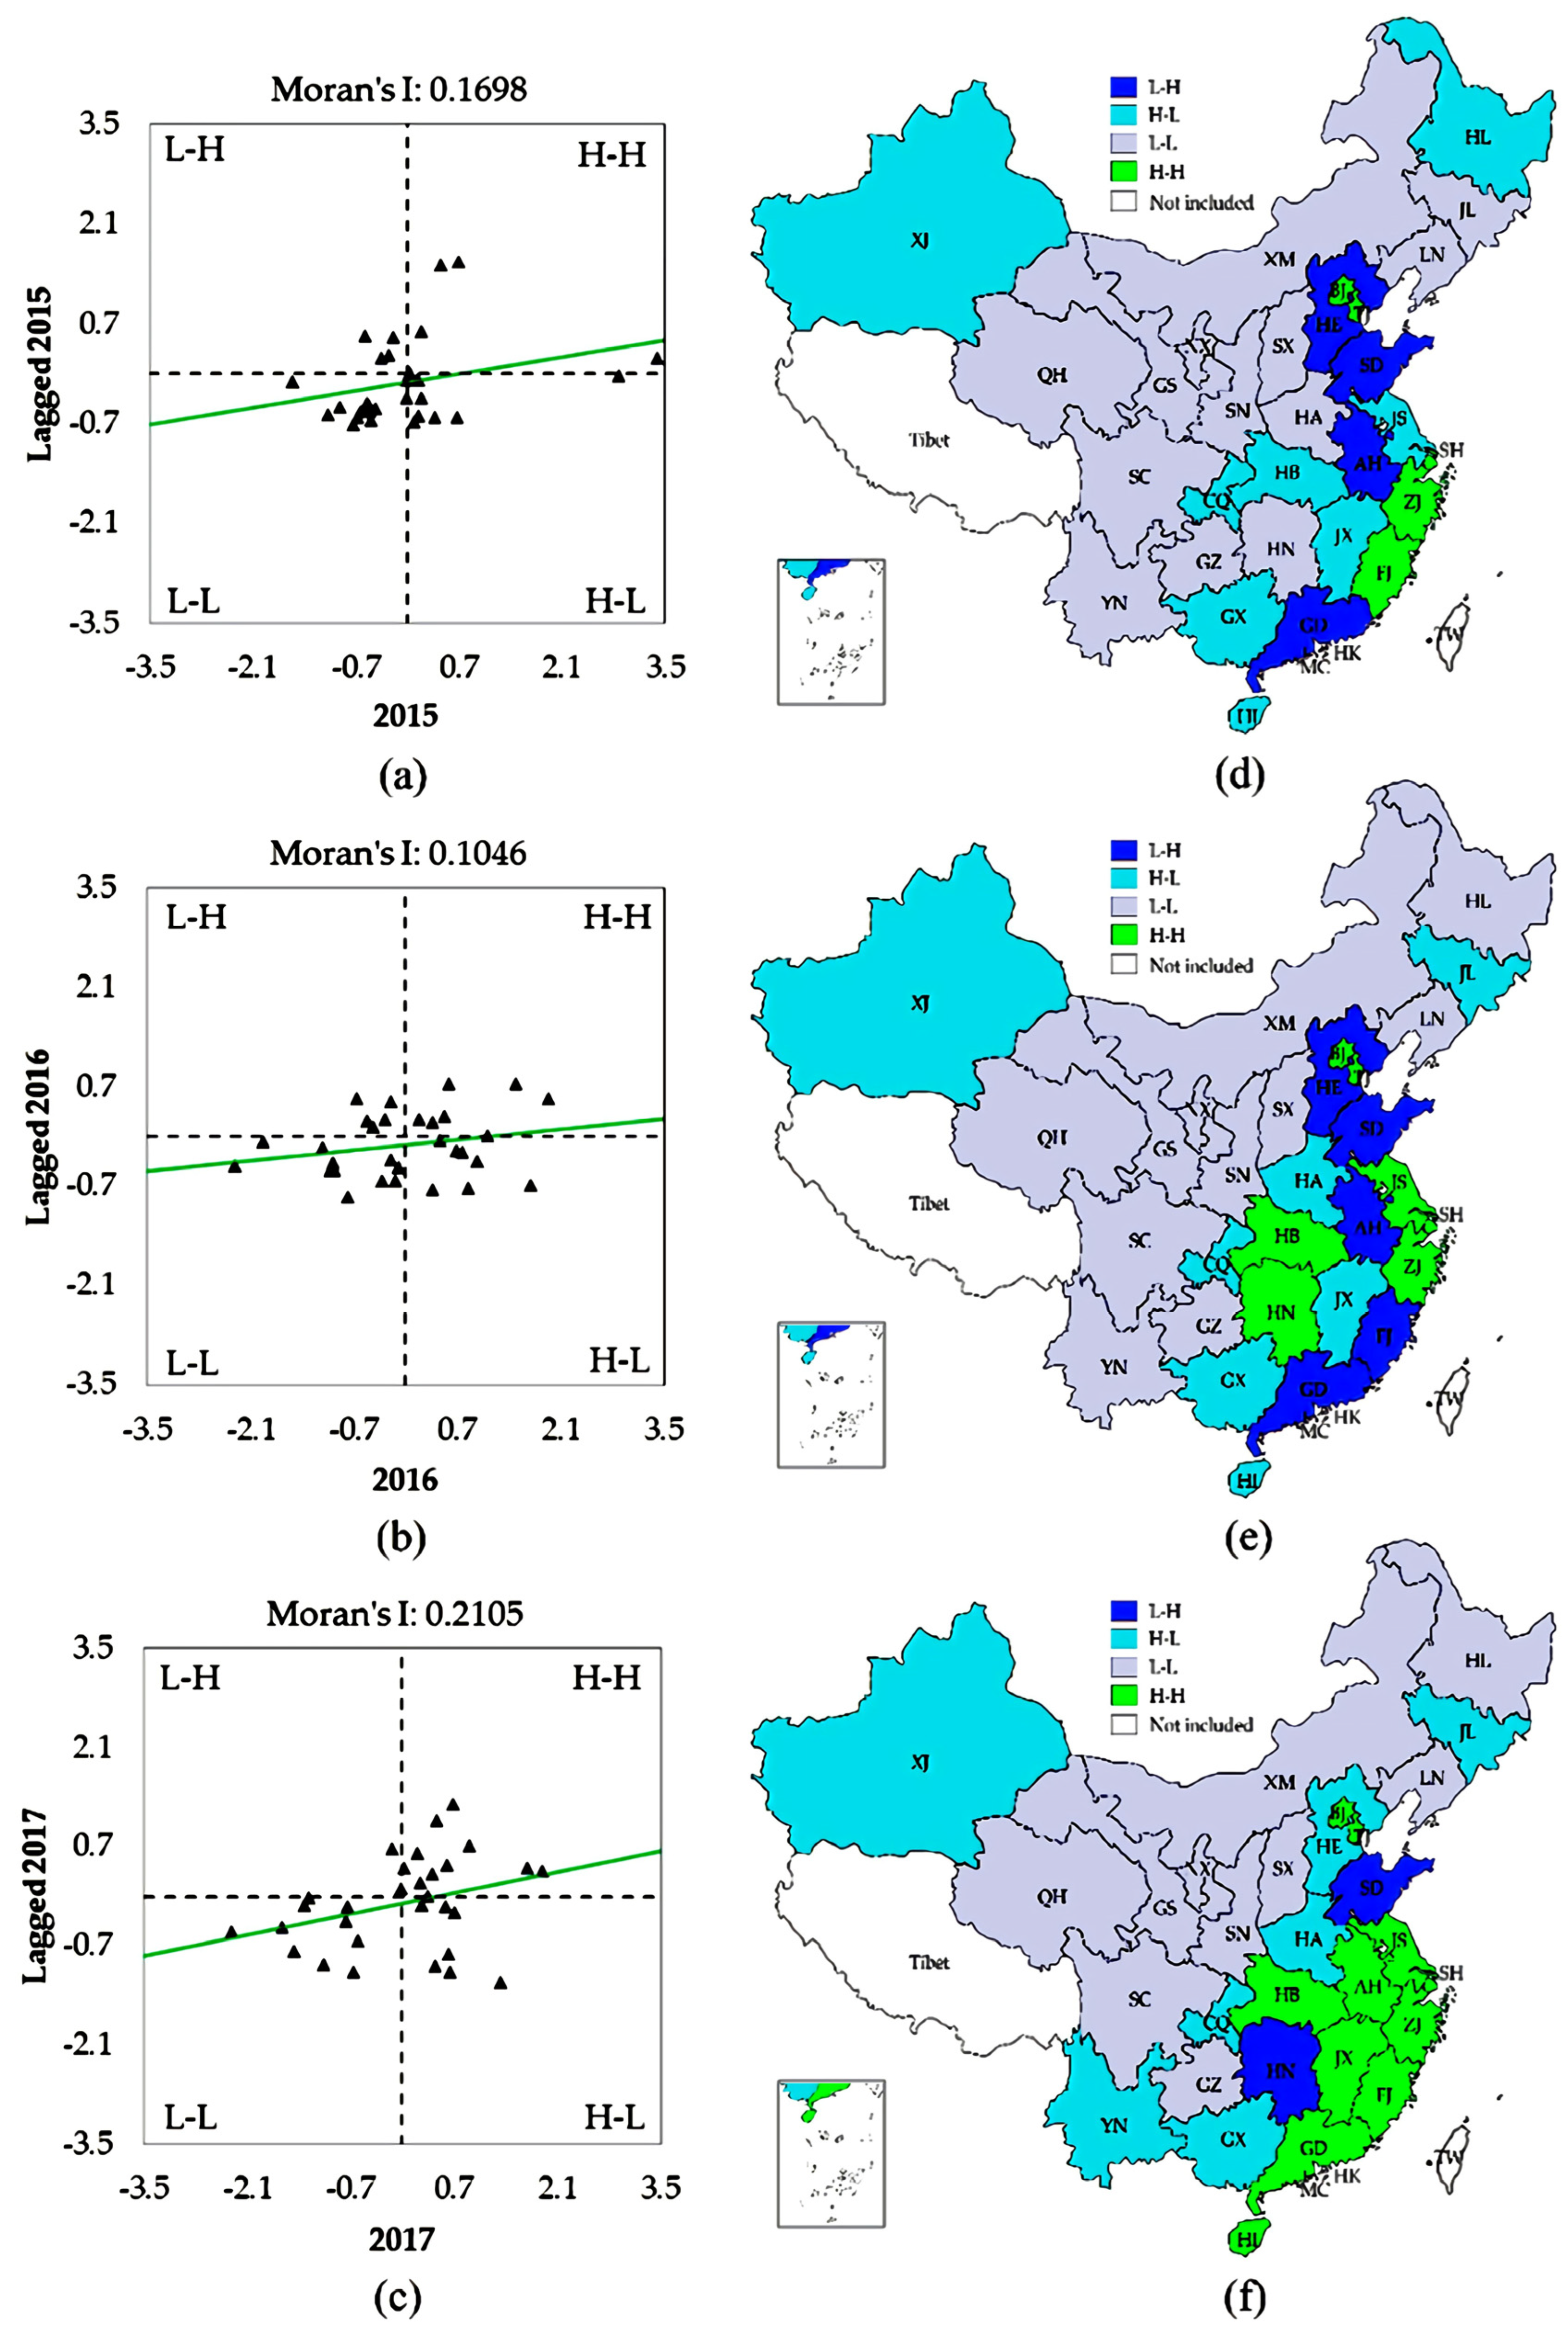
3.3. Spatial Analysis Model

The coefficient of variation (CV) is commonly adopted to measure regional disparities [55]. The larger the CV is, the larger the regional disparity. According to its definition, the CV is calculated by the following equation:
C V T = 1 ρ ¯ T [ 1 n × j = 1 n ( ρ j T ρ ¯ T ) 2 ]
where C V T is the CV in year T; ρ ¯ T refers to the average score for SPCI; and ρ j T is the score for the SPCI of in province j.
However, the CV cannot capture spatial effects. Such effects, if ignored, may lead to biased or misleading conclusions [34]. Therefore, together with the CV, the global Moran’s I (GMI), a popular measure of spatial dependency and heterogeneity, is also calculated for use in a supplementary spatial analysis. The GMI is defined as follows [56]:
G M I T = n e = 1 n j = 1 n ψ e , j e = 1 n j = 1 n ψ e , j ( ρ e T ρ ¯ T ) ( ρ j T ρ ¯ T ) j = 1 n ( ρ j T ρ ¯ T ) 2
where G M I T is the GMI in year T; ψ e , j is the spatial weight matrix between provinces e and j; and ρ e T and ρ j T are the scores for the SPCI in provinces e and j, respectively.
The GMI can measure overall spatial autocorrelation and ranges from −1 to 1. Values above 0 indicate positive spatial autocorrelation, indicating that provinces with high scores for the SPCI or low scores for the SPCI tend to cluster together; values below 0 indicate the opposite [57]. Moreover, significance can be determined using the standardized statistic Z(I):
Z ( I ) = I E ( I ) V a r ( I )
E ( I ) = 1 / ( n 1 )
where Var(I) is the variance of I at the 0.05 significance level. Z(I) < −1.96 or Z(I) > 1.96 indicates that the negative or positive spatial autocorrelation is strong, and −1.96 < Z(I) < 1.96 indicates that the spatial autocorrelation is weak.
Furthermore, the local Moran’s I (LMI) can be used to examine the degree of spatial autocorrelation in each specific location. The type of agglomeration the province exhibits can be determined with a Moran scatterplot, which is derived from the LMI. Quadrants I and III represent high-high agglomeration mode (H-H) and low-low agglomeration mode (L-L), respectively, indicating that the score for the SPCI in the target province is similar to the scores in the surrounding locations; quadrants II and IV represent low-high agglomeration mode (L-H) and high-low agglomeration mode (H-L), respectively, indicating that the score for the SPCI in the target province is different from scores in the target province’s neighborhood [58].

4. Results

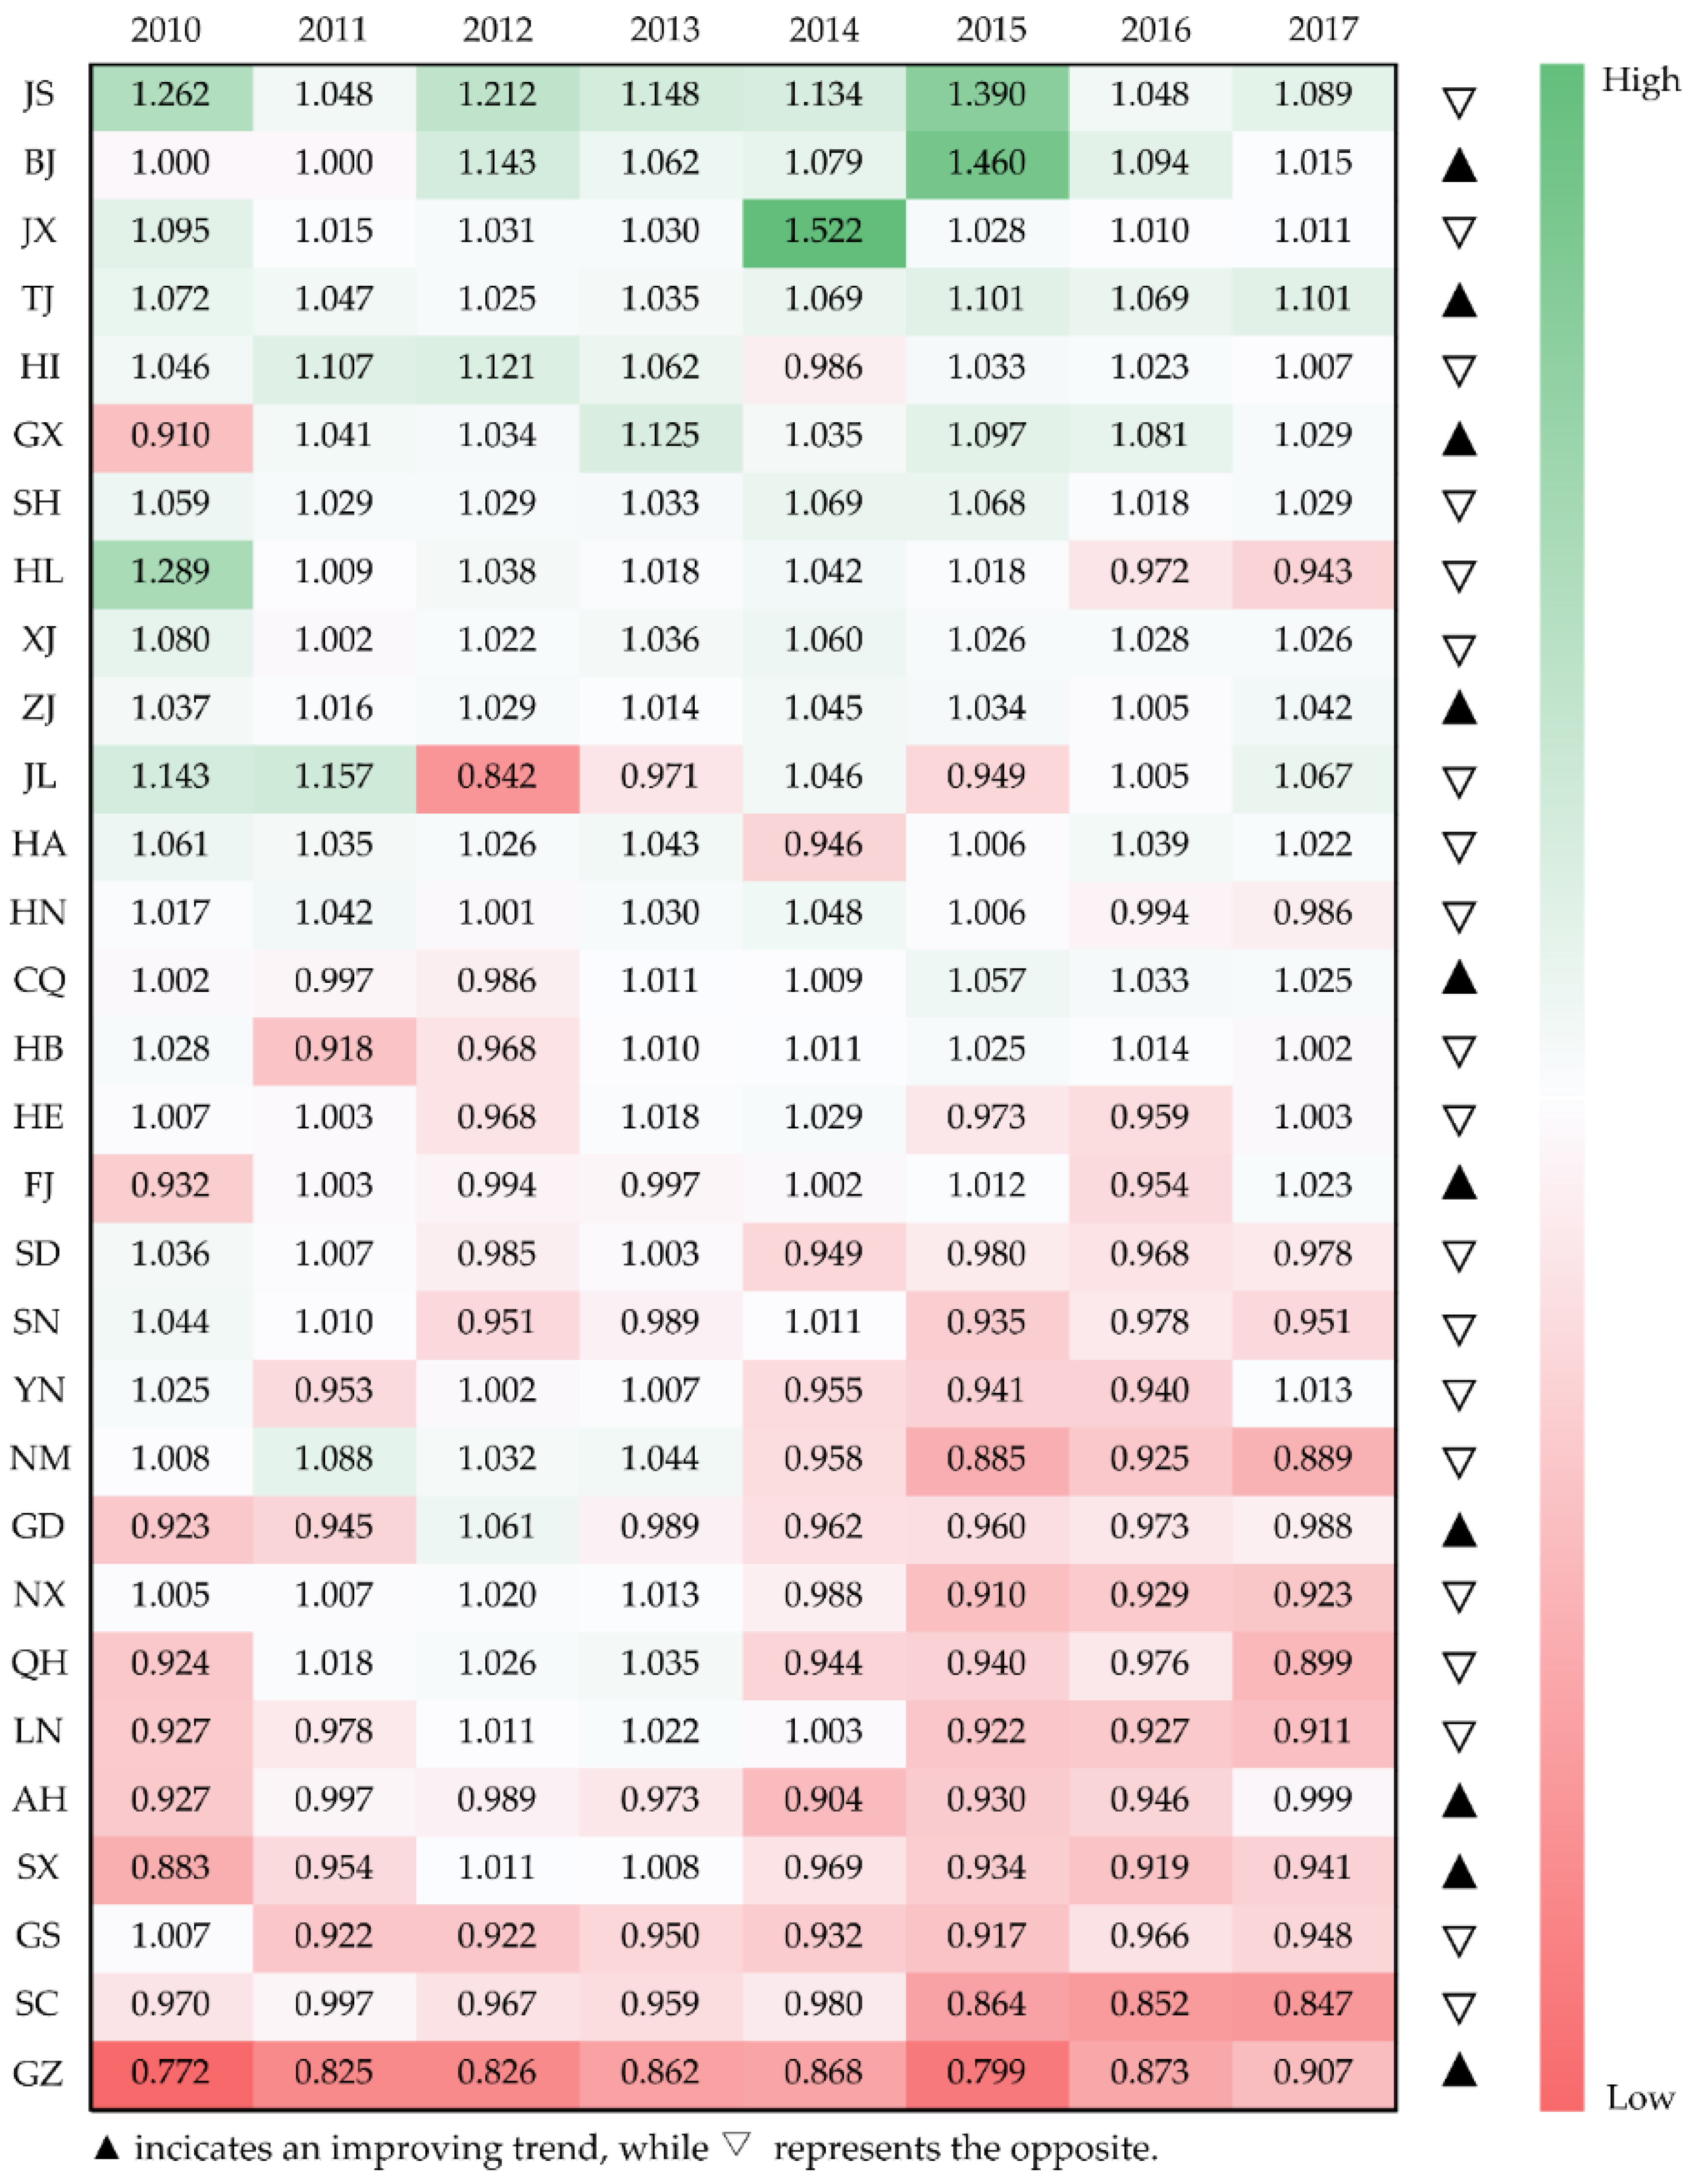
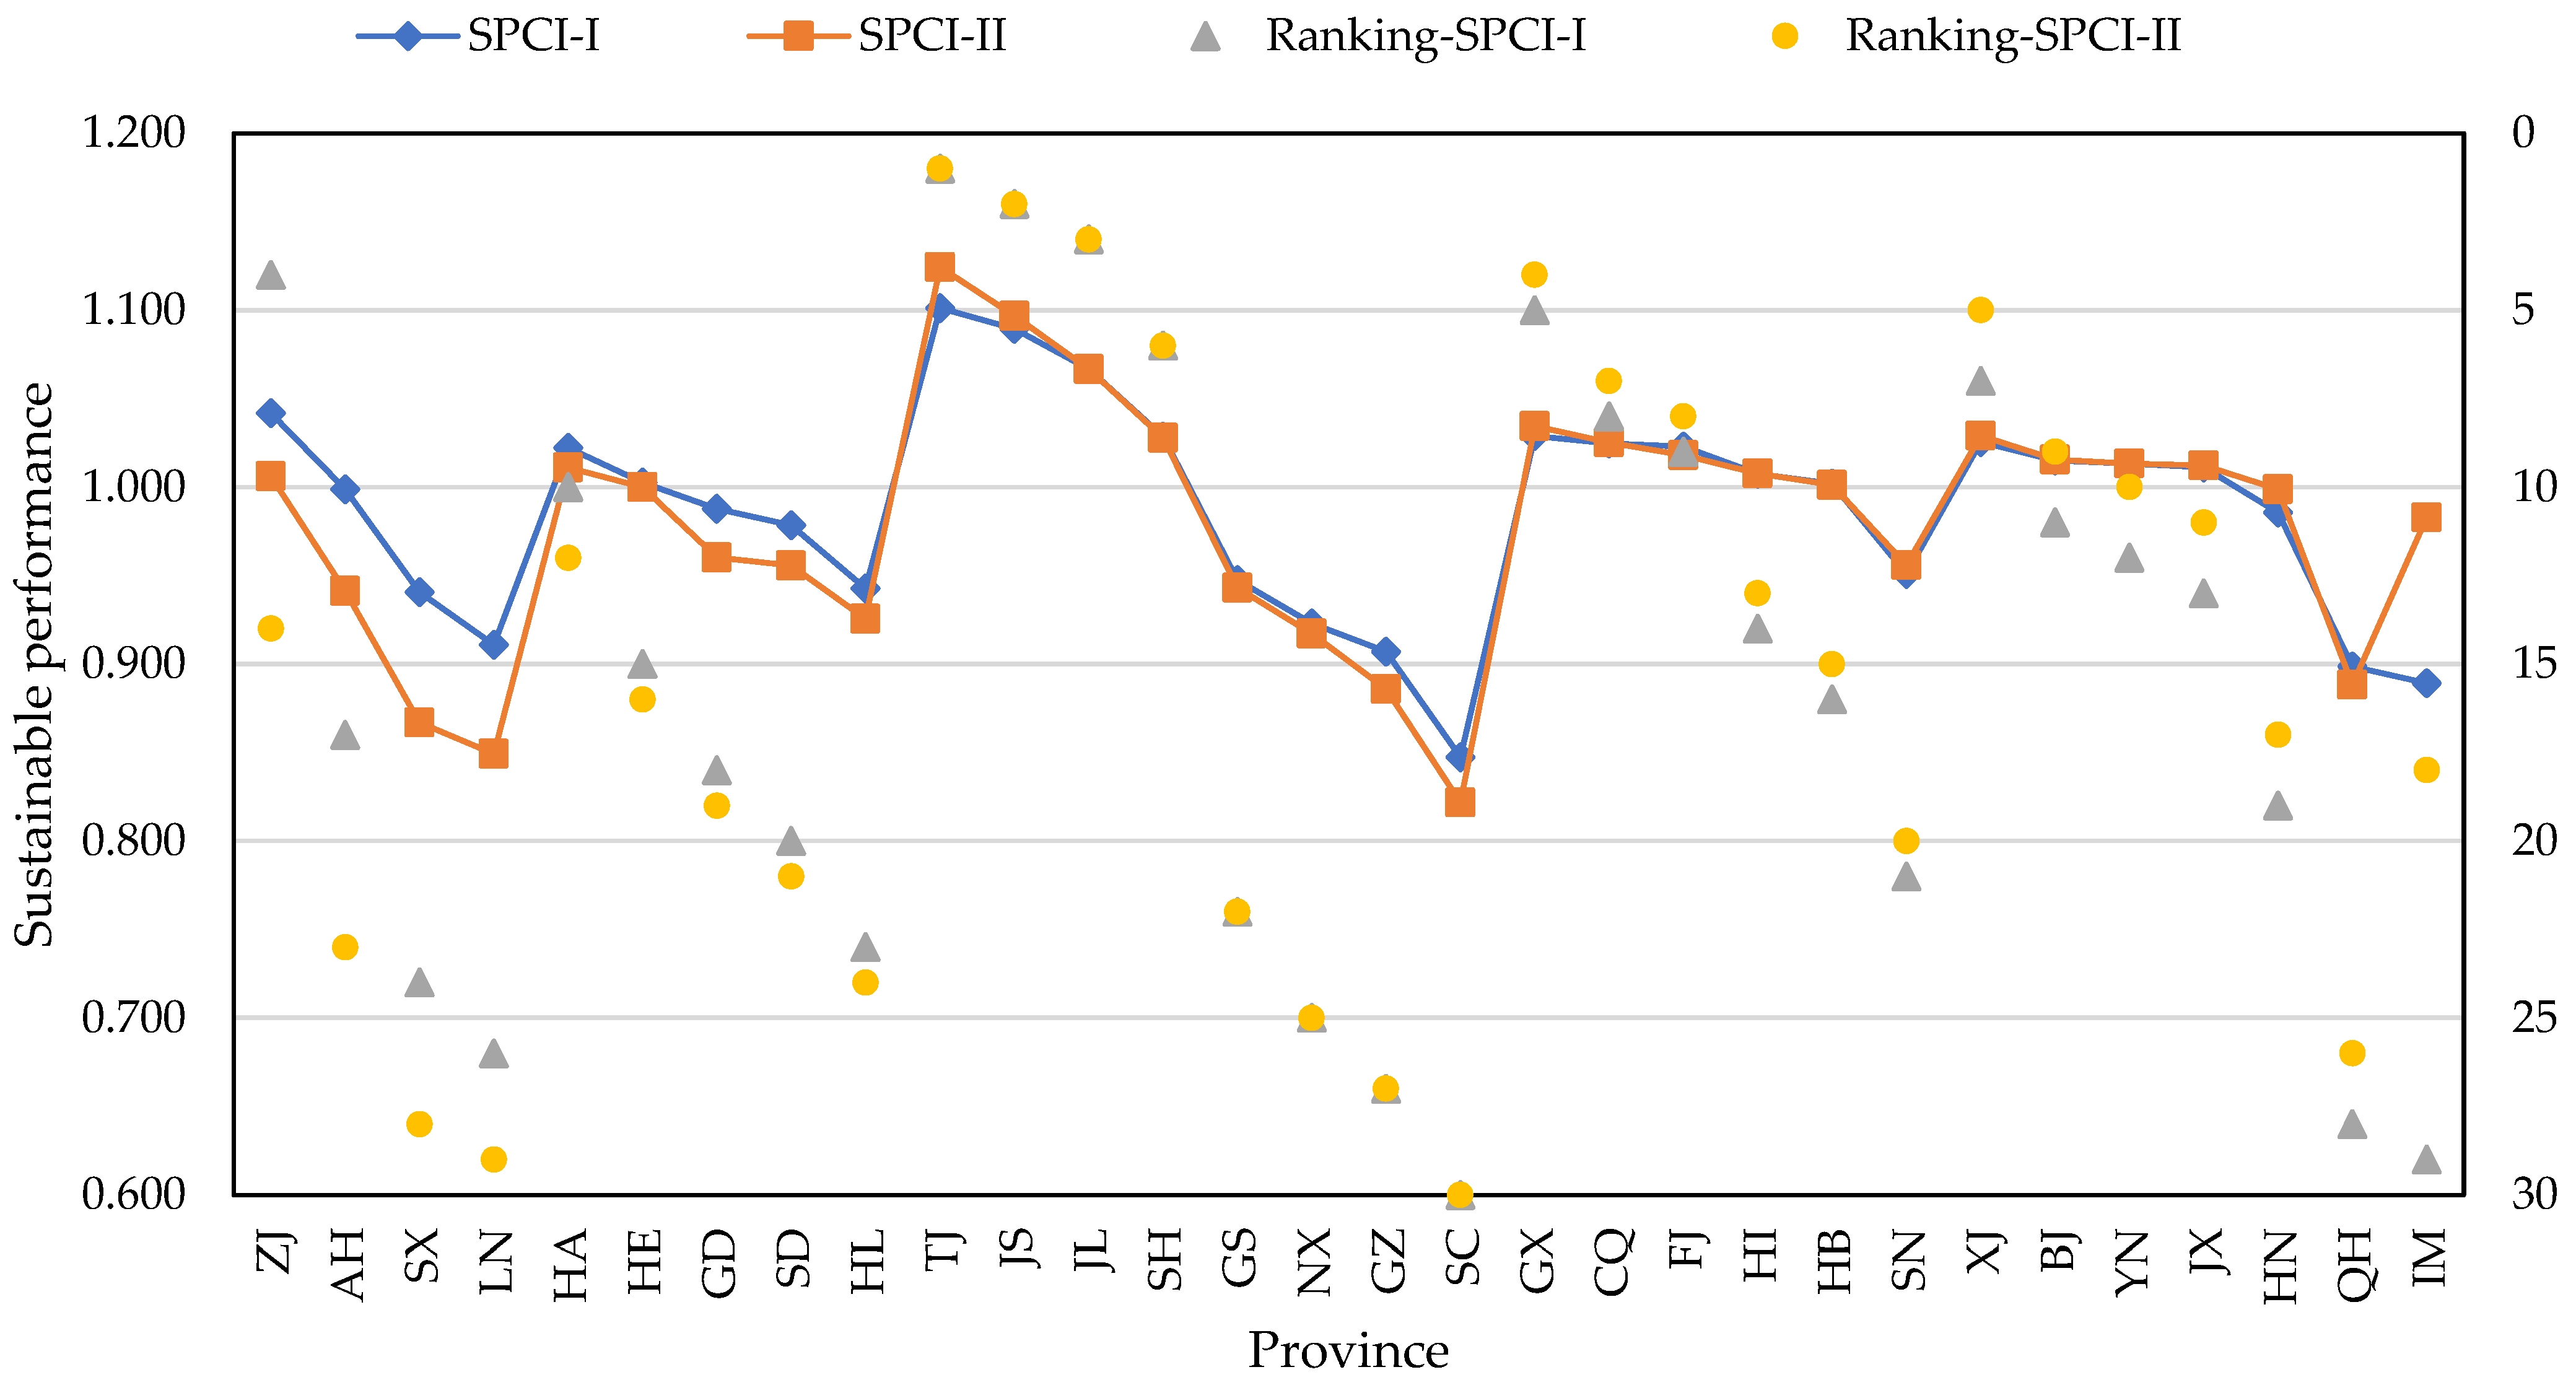
4.1. Analysis of SPCI

The SPCI in the 30 provinces is calculated by using the windows-super-SBM model. Table 2 shows the calculation process, with Beijing (BJ) as an example. In the last row, the SPCI in BJ shows a slight improvement from 2010 to 2017, peaking in 2015. The calculation processes for the other 29 provinces are similar, and the results are displayed in Figure 2. The 30 provinces are ranked based on the average of the SPCI in each province over the study period, and the SPCI in each province in different years is reflected in a red-white-green color chart. The results show that the SPCI changes differently across provinces, with the SPCI in some provinces, such as BJ, fluctuating upward and that in some other provinces fluctuating downward. Jiangsu (JS), BJ and Jiangxi (JX) are in the top three in terms of their scores for the SPCI. The highest scores for the SPCI in JS and BJ appear in 2015, and the highest score in JX appears in 2014. In general, the scores for the SPCI in most of the provinces are declining.
Figure 3 depicts the trend in the change in the eight regions’ scores for the SPCI. The scores for the SPCI in each region are the arithmetic mean of the scores of provinces in each region. The north coast and the Middle Yangtze River region can be characterized as having stable high scores for the SPCI. This is mainly because construction scale indicators (floor space of construction, total output value and total pretax profit) of the Middle Yangtze River region are high and the local investment is large. Therefore, to maintain the stability or growth of SPCI, local governments need to obtain more desirable outputs under the condition of ensuring a certain input level. The south coast and southwest show similar patterns of improvement with overall low scores for the SPCI. The assessment results for the east coast, northwest, northeast and Middle Yellow River region are not optimistic because of their decreasing trends in the scores for the SPCI. The reason for the decline of SPCI is that there is no significant increase in desirable outputs under a certain increase in input level. In a word, the changes of SPCI show that the scale of the construction industry is closely related to SPCI and the growth of the scale of the construction industry has a positive stimulating effect on SPCI.
Figure 4 depicts the spatial evolution of the scores for the SPCI. Two stages can be observed. (1) From 2010 to 2014, there was no significant change in the CV. Meanwhile, the spatial autocorrelation was erratic and insignificant. (2) From 2015 to 2017, the CV followed a decreasing trend, which indicates that regional inequality is weakened. Moreover, all values for the GMI were positive and passed the 0.05 significance test for 2015 and 2017, meaning that the provinces surrounded by provinces with better/poorer SPCI tend to experience better/poorer SPCI. The peak of CV in 2015 indicates that the unbalanced development of SPCI among provinces has reached its peak. This is mainly because the SPCI of JS and BJ increased significantly in 2015, resulting in a sharp increase in the gap between the rich and the poor. The substantial increase in SPCI of JS and BJ is mainly due to the significant decline in the number of fatalities in 2015.
The Moran scatterplots of the scores for the SPCI in the 30 provinces in 2015, 2016 and 2017 are shown in Figure 5. The four quadrants in a Moran scatterplot are used to identify the relationship between an area and its expected neighbors. Thus, these figures in Figure 5 depict the local spatial autocorrelation. The provinces in the first quadrant (H-H) not only have high SPCI values, but also their neighboring provinces have high SPCI values. The provinces in the second quadrant (L-H) have low SPCI values, but their neighboring provinces have high SPCI values. The provinces in the third quadrant (L-L) have high SPCI values, but their neighboring provinces’ SPCI values are low. The provinces in the fourth quadrant (H-L) have high SPCI values, but are surrounded by provinces with low SPCI values. The number of provinces in the H-H category was only 4 in 2015 and increased to 11 in 2018, together with a trend toward fewer provinces being distributed in the L-H or H-L categories. This trend suggests a decrease in the disparity in SPCI between provinces and their neighbors. In conjunction with the Moran scatterplots, the local spatial category maps are shown in Figure 5. The H-H category appears predominantly in the east, while the L-L category generally appears in the west. Additionally, the SPCI can be seen to improve from east to west, especially in southern China. This phenomenon shows that the SPCI of each province has obvious clustering characteristics and the provinces with high SPCI values are often concentrated in the eastern region. In contrast, the provinces with low SPCI values are concentrated in the western region.

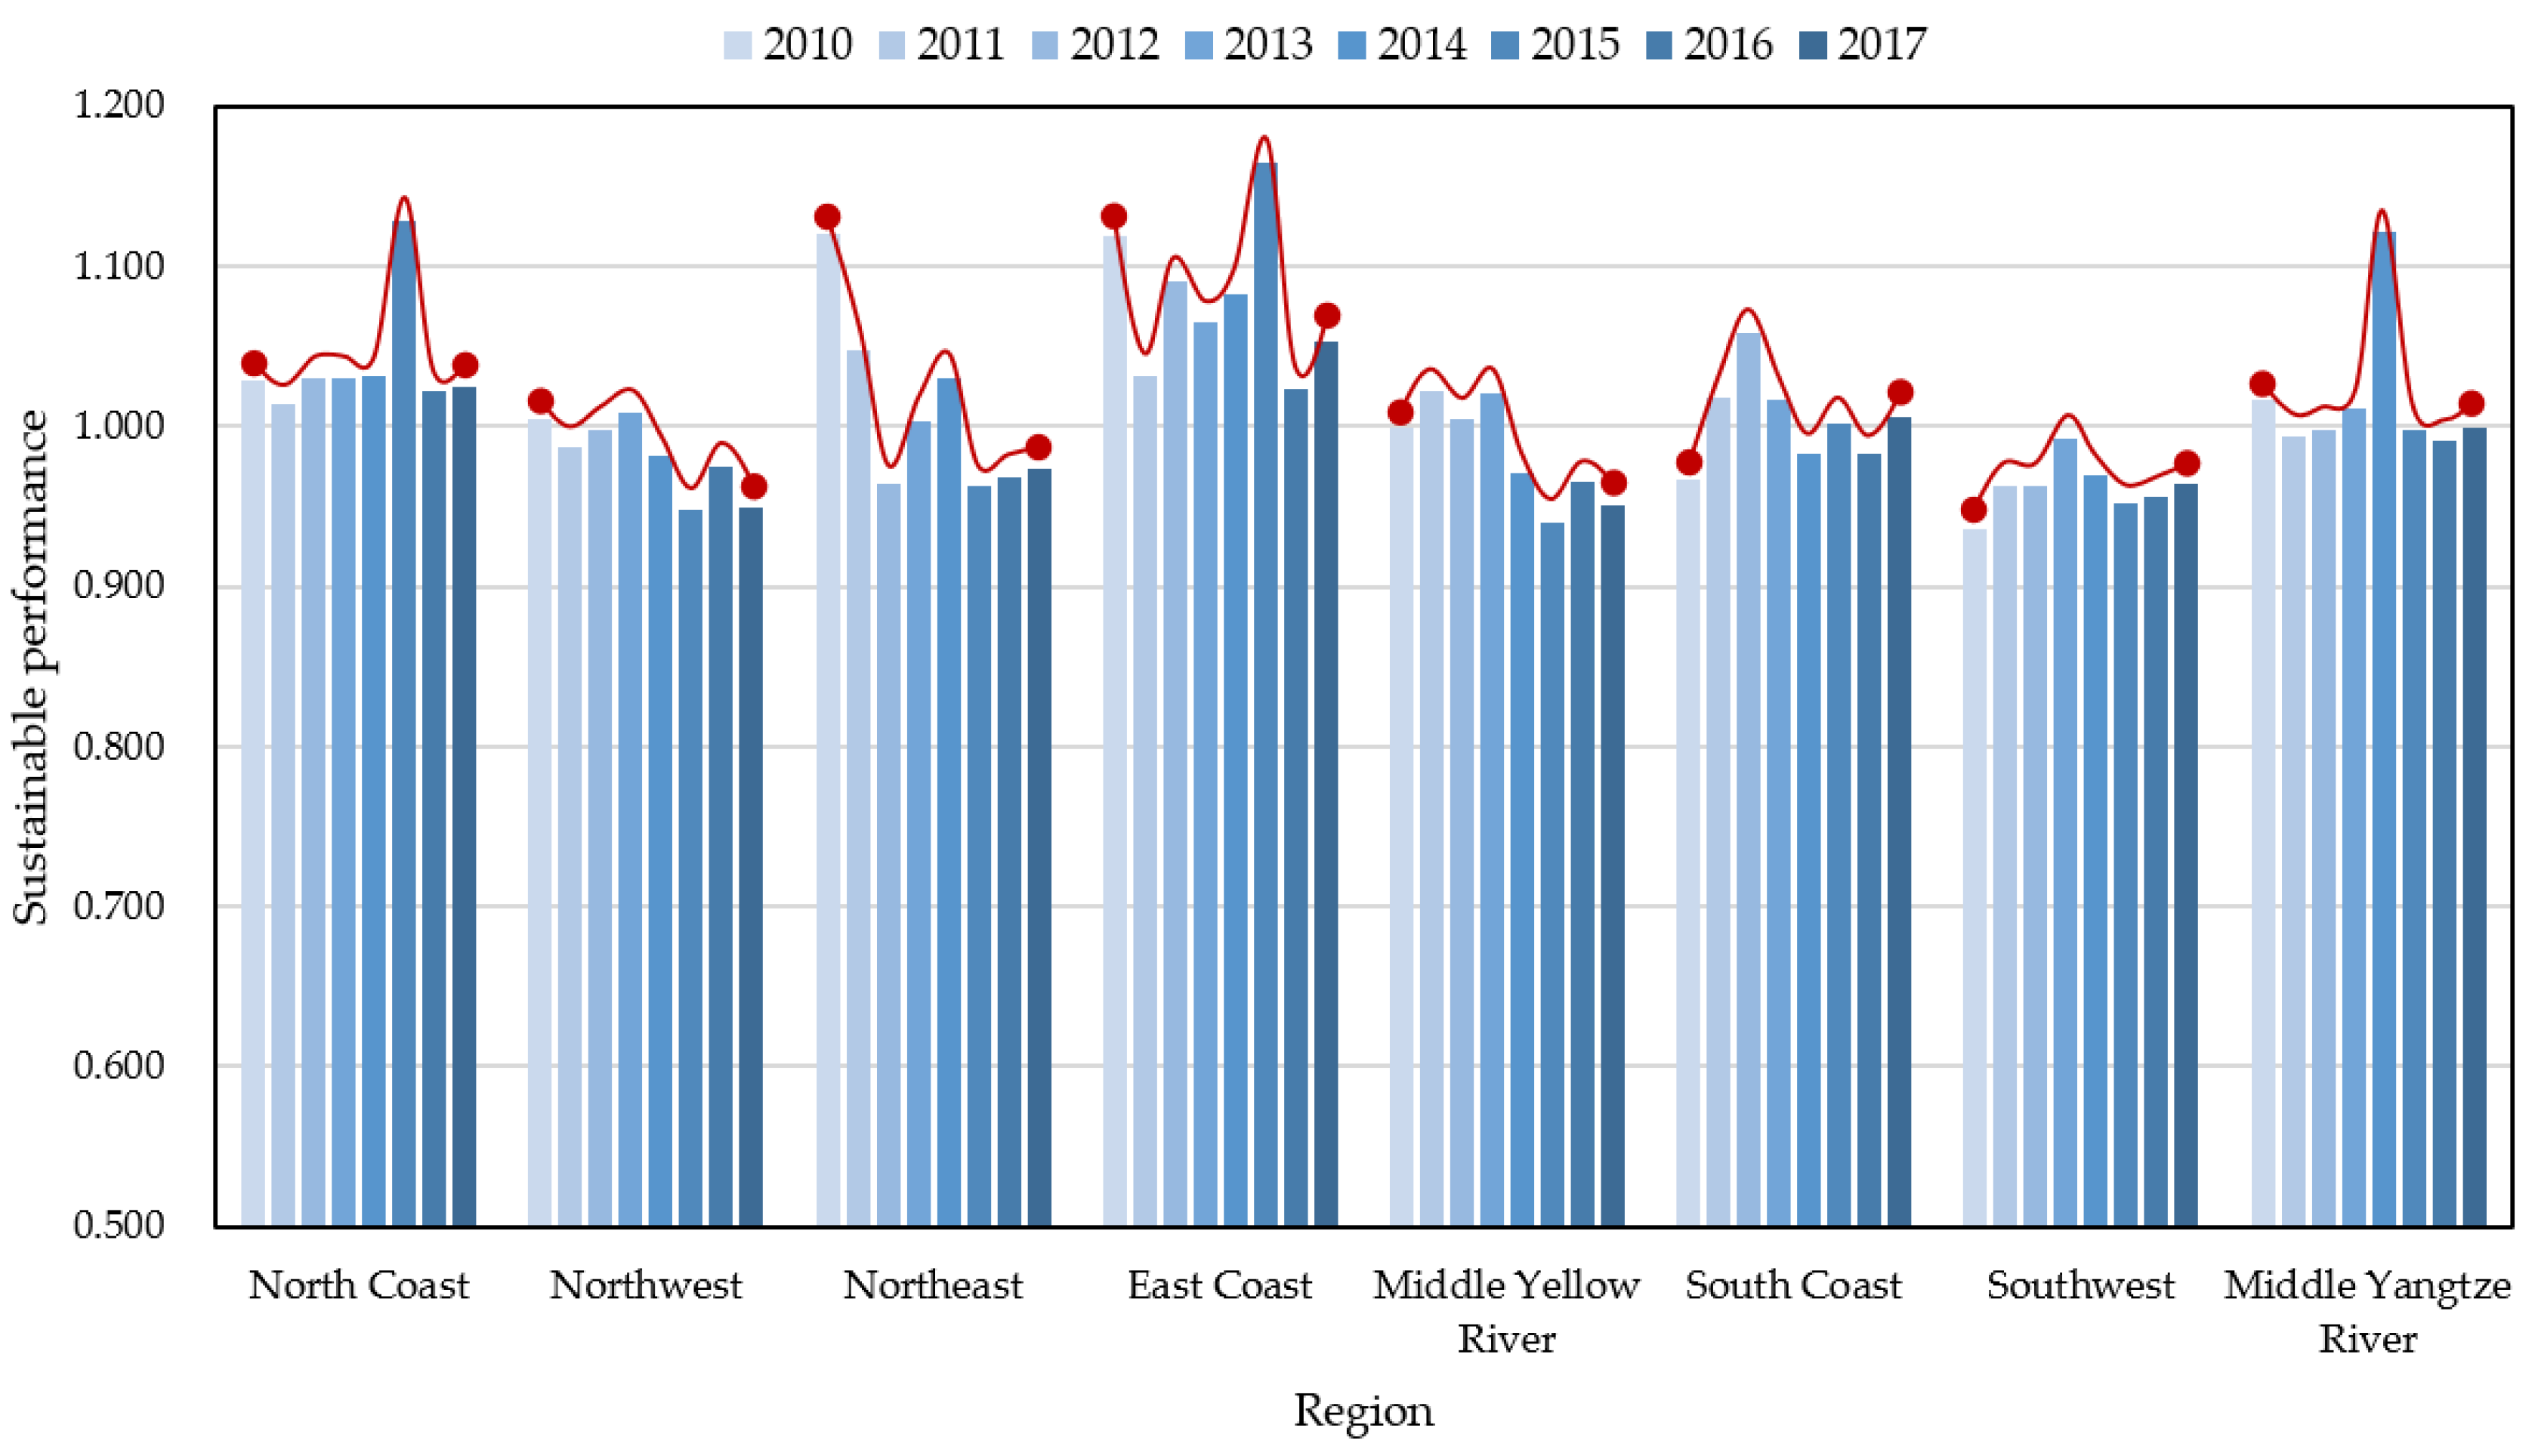
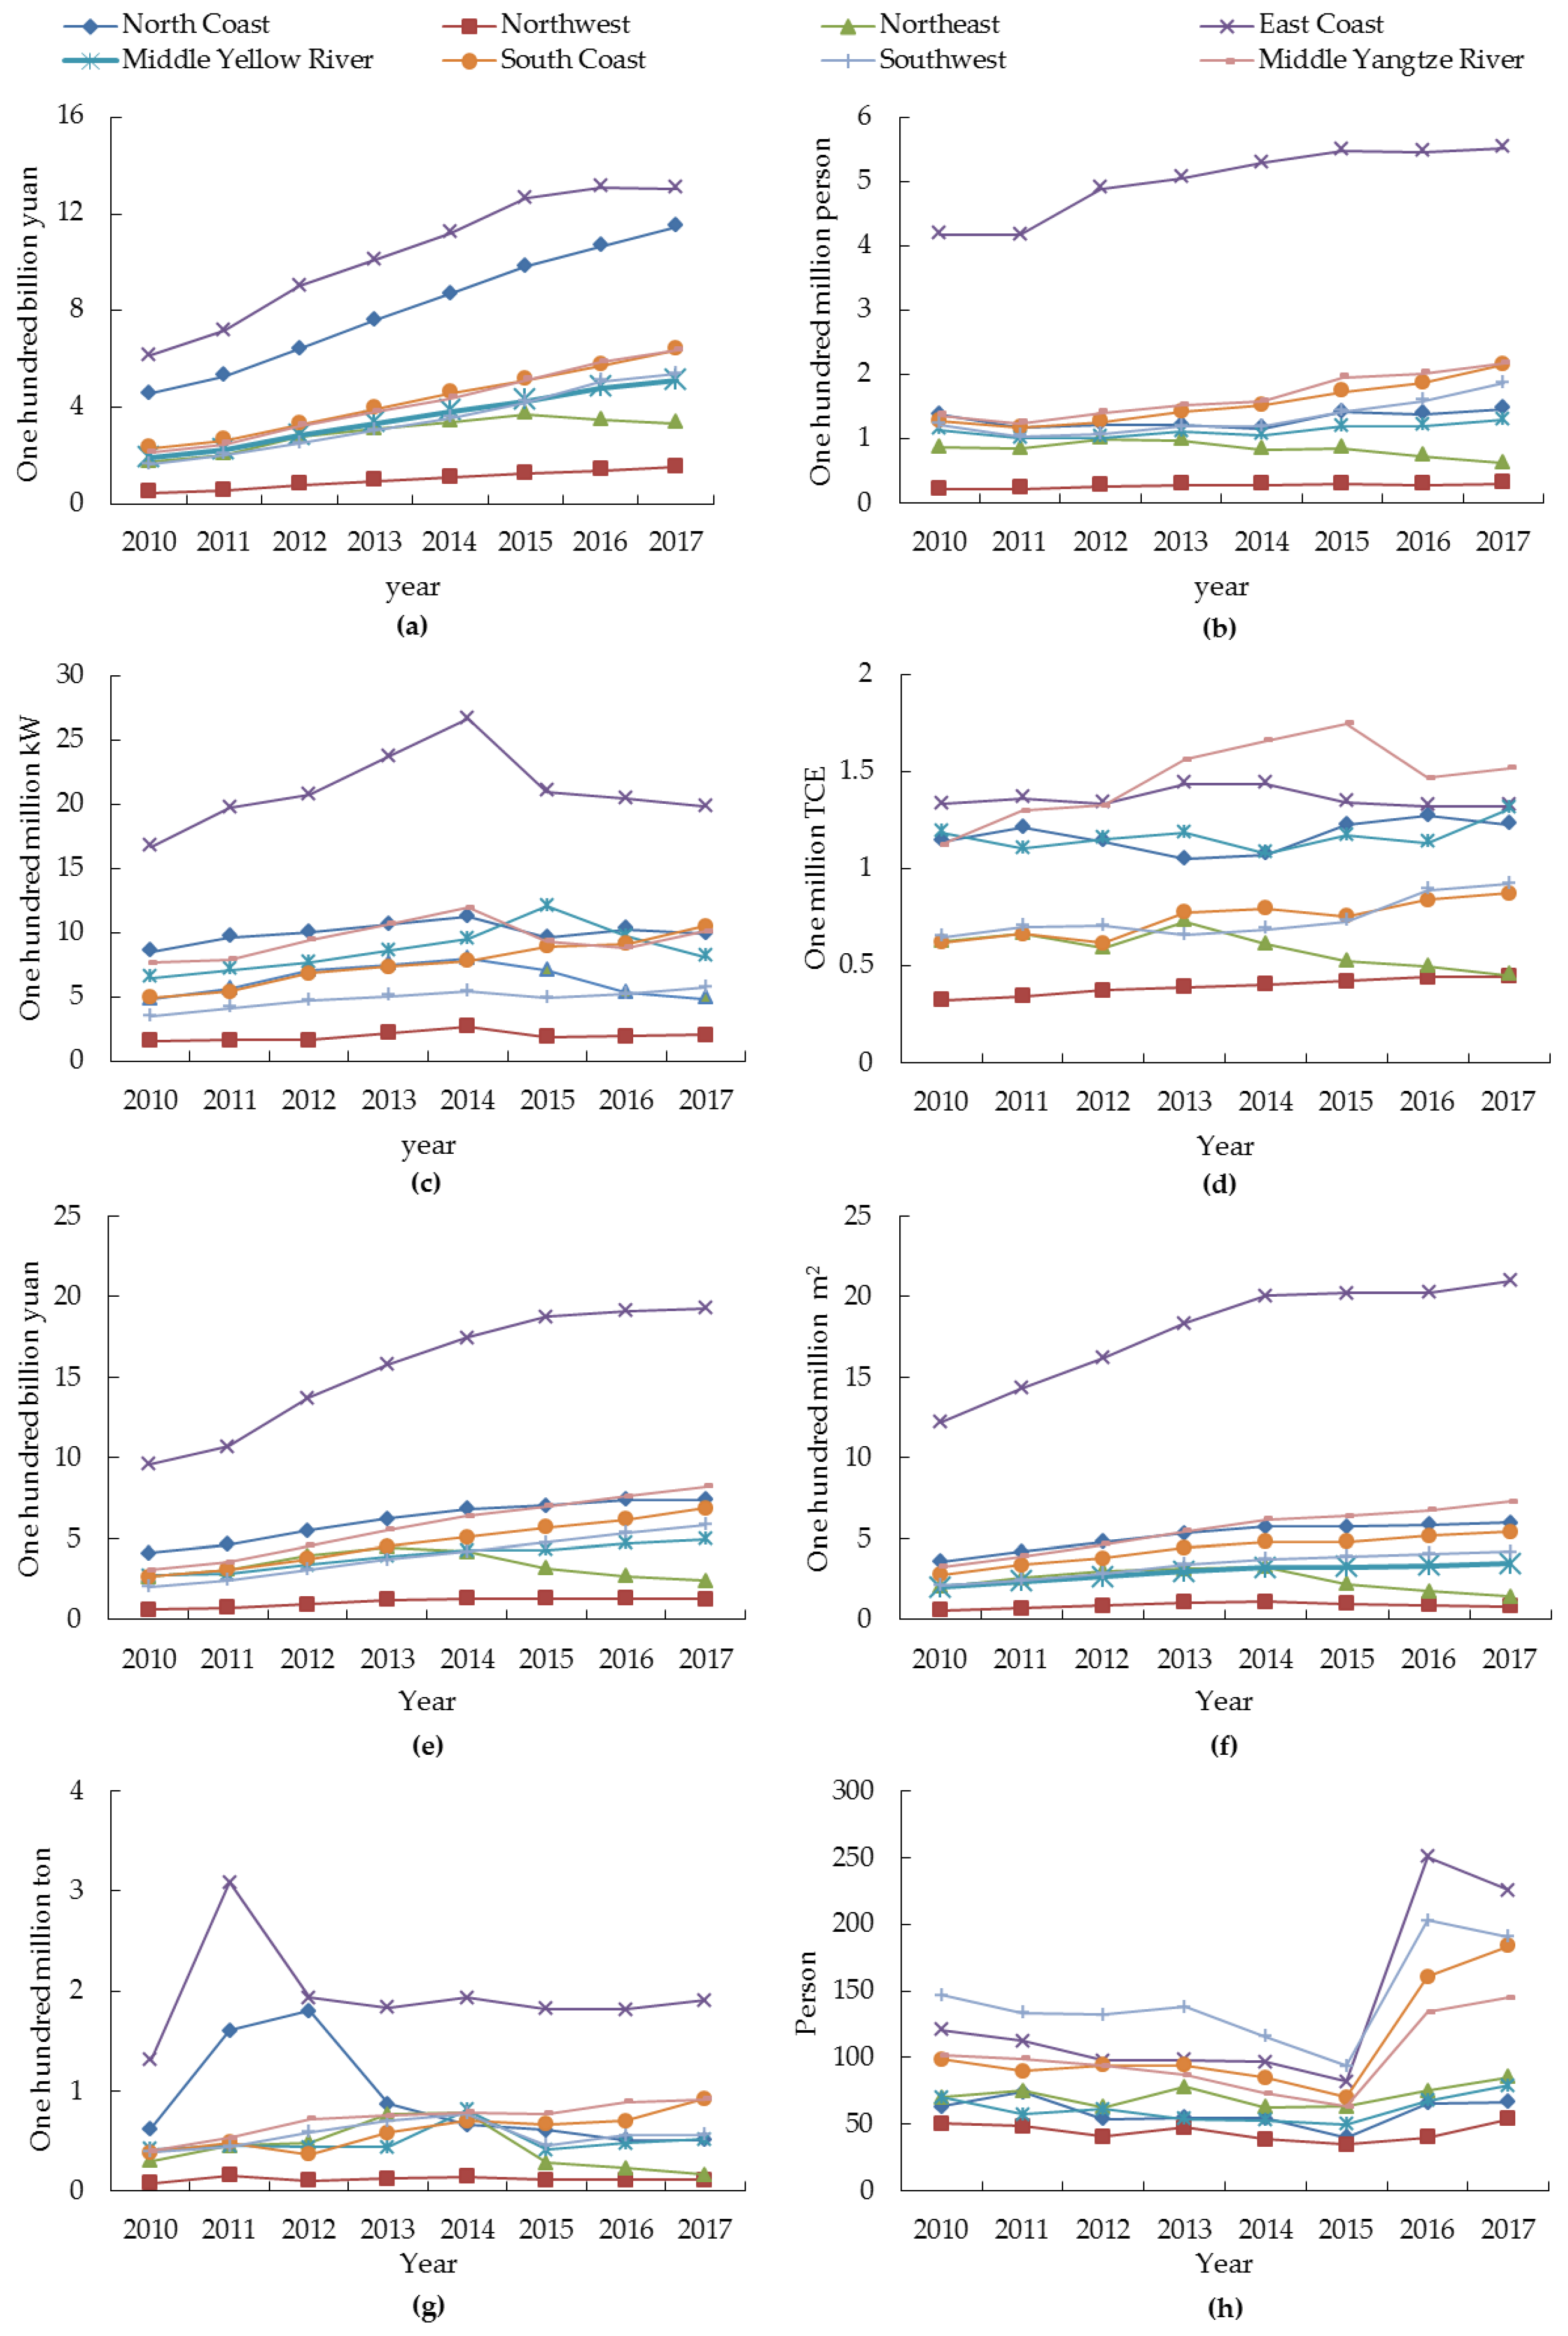
4.2. Output and Input in the Eight Regions

This study evaluates the SPCI in 30 provinces in mainland China and divides those provinces into eight regions. Figure 6 shows the changes in the average input and output of the eight regions (the inputs include TFA, NE, TPM and EC, and the outputs include TOV, FSC, CE and NF). Basically, the investment level in China’s construction industry increased year by year. Correspondingly, the desirable outputs increased steadily and rapidly. This is mainly because China has been undergoing rapid development. In addition, regions with higher input levels generally have higher levels of undesirable output.
We can make the following observations. (1) The scale of the construction industry in the eastern coastal region is the largest, in terms of both its inputs and outputs, while that of the northwestern region is the lowest. (2) The inputs and outputs in 2015–2017 stagnated somewhat. (3) Inputs and outputs in northeastern China declined. (4) The input of energy in the eastern coastal area and in northeastern China trended downward and the use of energy in the middle reaches of the Yangtze River is very high. (5) The development of the construction industry has led to an increase in the number of deaths, which is closely related to the construction industry’s labor-intensive nature and its extensive management style. High-level development can curb this phenomenon, as has occurred in the eastern and northern coastal areas. (6) Carbon emissions peaked in 2010–2012 and then remained relatively stable.

4.3. Occupational Safety Analysis

As mentioned above, occupational safety is included in regional sustainability assessments. To further illustrate this point, taking 2017 as an example, the values of SPCI in the 30 provinces calculated without considering occupational safety (SPCI-II) are compared with the results that do consider occupational safety (SPCI-I). The provinces are ranked according to the change in their relative performance, as shown in Figure 7. The integration of occupational safety improves the relative performance of most provinces, resulting in different conclusions when occupational safety is not included. This further illustrates the necessity of considering occupational safety. Including this key factor can contribute to an accurately understanding and analysis of regional differences.
As shown in Figure 7, nine provinces rose the ranking, while the rankings of eight provinces remained unchanged. The remaining 13 provinces fell in the ranking. Of those that experienced a change in ranking, Zhejiang (ZJ) and Inner Mongolia (IM) experienced the largest changes. The change in the ranking shows that the state of occupational safety in the provinces with higher rankings is excellent, and the geographical distribution of such provinces concentrated in the eastern region, consistent with the conclusion of Shao et al. [59]. The state of occupational safety of ZJ has always been the best in China and the worst is IM. Such significant variation in rankings exposes China’s imbalanced development. This phenomenon may be related to how some provinces make and implement policy. It has been argued that China’s relevant policies are relatively isolated and lack a unifying framework [60]. Administrative decentralization has confused the local governmental policy making and implementation. Therefore, a well-developed policy system that balances the various dimensions of sustainable development is urgently needed in the future.

5. Discussion

(1) First, SPCIs of eight regions are discussed and regional differences were revealed. The provinces with high values of the SPCI were mainly located in the eastern area. A similar conclusion is drawn by Xu, Wang and Tao [9]. This is because China’s eastern area is known to be the most developed, and advantages such as better ownership structures [61] and advanced technical applications [62] enable the provinces in that region to more easily achieve high-level sustainable development.
Among the eight regions, the northeast is the most noteworthy since its SPCI experienced the worst decline. As a heavy-industry base in China, the economic development of the northeast mainly depends on industry. However, the development of heavy industry has been greatly restricted by stricter environmental requirements [63]. As a result, recent years have seen the development of the northeast gradually lagging behind, resulting in a chain of negative reactions such as the outflow of population and talent [64]. This inevitably affects the development of the construction industry. Optimizing the industrial structure is regarded as the crucial solution [65].
Although there are gaps in SPCI among regions, regional inequality has weakened, especially between adjacent provinces. This result is inseparable from the implementation of a series of national strategies to promote coordinated regional development. For example, in 2014, 11 southern provinces including FJ, JX, HN, GD, GX, HI, SC, GZ and YN jointly signed the Joint Declaration on Deepening Cooperation in Pan-Pearl River Delta (2015–2025), in which the cooperation in infrastructure construction and environmental protection were determined [66]. As many provinces are at different levels of development, with diverse socio-economic makeups, there is a goodness-of-fit for them to co-operate for their mutual advantage. In the future, the successful experience obtained is worth popularizing in northern China.
(2) Then, we found that the evaluation results will be inaccurate if occupational safety is not considered in the SPCI evaluation. For instance, Xu, Wang and Tao [9] found that sustainability in the western area was at its highest in 2014, but the ranking of SPCI will change when considering occupational safety, which is contrary to our results. Occupational safety negatively affects the SPCI since the state of occupational safety in the western region is generally poor, a finding also supported by Shao, Hu and Liu [59].
Moreover, we found that although the number of deaths representing occupational safety is an undesirable out-put, there is no contradiction between the improvement of occupational safety and the development of SPCI. It is generally believed that there are more deaths in areas with frequent construction activity, but this study concludes the opposite. The eastern and northern coasts are doing well in the terms of the SPCI. The east coast, with its high level of economic development, took the lead in desirable outputs and has a low level of undesirable outputs. The regions with high SPCI have great advantages in attracting safety-production resources and technological innovation, so as to continuously improve the level of construction safety production. The regions with high SPCI may benefit from the vigorous promotion of new construction technologies, such as BIM, prefabricated buildings, etc. The promotion of new technology promotes the vigorous development of the construction industry and the construction risk is greatly reduced [67,68].
(3) Similarly, there is no contradiction between environmental issues and SPCI. Previous studies have shown that areas with high levels of economic development often have higher levels of carbon emissions [69]. In this study, the east coast took the lead in terms of desirable outputs, while its potential for reducing carbon emissions is very large. An exception was observed, the north coast, which has a high level of economic development, performed better in controlling its undesirable outputs, which indicates that economic development may not further degrade the eco-environment if sufficient policy and technical support is directed to a particular area. Rapid economic development does not necessarily lead to a large amount of carbon emissions.

6. Conclusions

The poor state of occupational safety in the construction industry must be improved to achieve sustainability. To address this issue, this study established an input-output system involving occupational safety to reflect the regional SPCI. A dynamic comprehensive evaluation model was constructed accordingly, which had strong explanatory power, as shown through an application of the model to China’s 30 provinces from 2010 to 2017. Then, the differences among eight regions were investigated. The need to consider occupational safety was further illustrated since such a consideration can improve the relative performance of most provinces. In contrast to previous research, this study makes several theoretical and practical contributions. First, this study comprehensively identifies the regional SPCI from an input-output perspective, which is rare in previous research. Second, this study enriches the existing knowledge by integrating occupational safety into the assessment of the regional SPCI. Third, China was divided into eight regions instead of the three traditional regions, resulting in more detailed and accurate findings.
These important results show that (1) provinces in eastern rather than western China tend to have high values for the SPCI; (2) the regional inequality in the SPCI in China has weakened. The eight regions studied exhibit different trends, as well as different strengths and weaknesses. (3) The region with high-quality development does not mean poor occupational safety (number of fatalities) and high carbon emissions. On the contrary, high-level development can curb poor occupational safety levels and high carbon emissions, as has occurred in the eastern and northern coastal areas. These findings contribute to the formulation of macro policies.
This study demonstrated that regional coordination plays a crucial role in narrowing regional disparities, a finding that has not been found in previous research. Between different regions, to improve the status of SPCI, some policies could be explored. For example, (1) national and provincial governments should actively explore and establish inter-provincial cooperation mechanisms on work safety. Specific measures include the exchange of successful experiences in policy formulation and the implementation of cross-provincial construction safety production law enforcement. The cooperation between Fujian (FJ), Jiangxi (JX), Hunan (HN), Guangdong (GD), Guangxi (GX), Hainan (HI), Sichuan (SC), Guizhou (GZ) and Yunnan (YN) is a very successful example. (2) To improve the unbalanced development between SPCI and occupational safety, differentiated management policies can be implemented. Advanced technologies and talents for construction safety production could be introduced to help low-level SPCI areas. For provinces with unstable SPCI, stricter safety production inspections should be implemented to supervise their construction safety production work.
In the future, various methods should be applied to calculate the values of the SPCI to deepen our understanding of regional differences by deeply exploring the distinctions among the results. Other further research work would be to analyze the impact degree of each indicator weight on SPCI and then obtain more specific policies from the perspective of each indicator.

Author Contributions

Methodology, L.T.; project administration, X.Z.; software, L.T.; supervision, Y.C.; visualization, L.J.; writing—original draft, L.T.; writing—review and editing, Y.C. All authors have read and agreed to the published version of the manuscript.

Funding

This study is sponsored by the National Natural Science Foundation of China (Grant No. 51878385), Open Foundation of the Hubei Key Laboratory of Construction and Management in Hydropower Engineering (Grant No. 2020KSD06) and the Yichang natural science research project (A22-3-017). The authors would like to thank the anonymous reviewers for their invaluable and constructive comments.

Institutional Review Board Statement

Not applicable.

Informed Consent Statement

Not applicable.

Data Availability Statement

Data are contained within the article.

Conflicts of Interest

The authors declare no conflict of interest.

Appendix A

Table A1. The corresponding abbreviations of provinces in this study.
ProvinceAbbreviationProvinceAbbreviationProvinceAbbreviation
AnhuiAHHeilongjiangHLShandongSD
BeijingBJHubeiHBShanxiSX
FujianFJHunanHNShaanxiSN
GansuGSJilinJLShanghaiSH
GuangdongGDJiangsuJSSichuanSC
GuangxiGXJiangxiJXTianjinTJ
GuizhouGZLiaoningLNXinjiangXJ
HainanHIInner MongoliaIMYunnanYN
HebeiHENingxiaNXZhejiangZJ
HenanHAQinghaiQHChongqingCQ

References

  1. Isa, R.B.; Jimoh, R.A.; Achuenu, E. An overview of the contribution of construction sector to sustainable development in Nigeria. Net J. Bus. Manag. 2013, 1, 1–6. [Google Scholar]
  2. Huang, L.; Krigsvoll, G.; Johansen, F.; Liu, Y.; Zhang, X. Carbon emission of global construction sector. Renew. Sustain. Energy Rev. 2018, 81, 1906–1916. [Google Scholar] [CrossRef] [Green Version]
  3. Sev, A. How can the construction industry contribute to sustainable development? A conceptual framework. Sustain. Dev. 2009, 17, 161–173. [Google Scholar] [CrossRef]
  4. Lélé, S.M. Sustainable development: A critical review. World Dev. 1991, 19, 607–621. [Google Scholar] [CrossRef]
  5. Wang, M.M.; Li, L.L.; Hou, C.X.; Guo, X.T.; Fu, H.L. Building and health: Mapping the knowledge development of sick building syndrome. Buildings 2022, 12, 287. [Google Scholar] [CrossRef]
  6. Purvis, B.; Mao, Y.; Robinson, D. Three pillars of sustainability: In search of conceptual origins. Sustain. Sci. 2019, 14, 681–695. [Google Scholar] [CrossRef] [Green Version]
  7. Shi, Y.; Ge, X.; Yuan, X.; Wang, Q.; Kellett, J.; Li, F.; Ba, K. An integrated indicator system and evaluation model for regional sustainable development. Sustainability 2019, 11, 2183. [Google Scholar] [CrossRef] [Green Version]
  8. Azapagic, A.; Perdan, S. Indicators of sustainable development for industry: A general framework. Process Saf. Environ. Prot. 2000, 78, 243–261. [Google Scholar] [CrossRef]
  9. Xu, X.; Wang, Y.; Tao, L. Comprehensive evaluation of sustainable development of regional construction industry in China. J. Clean. Prod. 2019, 211, 1078–1087. [Google Scholar] [CrossRef]
  10. Sunindijo, R.Y.; Zou, P.X. Political skill for developing construction safety climate. J. Constr. Eng. Manag. 2012, 138, 605–612. [Google Scholar] [CrossRef]
  11. Amponsah-Tawiah, K. Occupational health and safety and sustainable development in Ghana. Int. J. Bus. Adm. 2013, 4, 74–78. [Google Scholar] [CrossRef] [Green Version]
  12. Karakhan, A.A.; Gambatese, J.A. Integrating worker health and safety into sustainable design and construction: Designer and constructor perspectives. J. Constr. Eng. Manag. 2017, 143, 04017069. [Google Scholar] [CrossRef]
  13. Jilcha, K.; Kitaw, D. Industrial occupational safety and health innovation for sustainable development. Eng. Sci.Technol. Int. J. 2017, 20, 372–380. [Google Scholar] [CrossRef] [Green Version]
  14. Wang, Y.; Su, X.; Qi, L.; Shang, P.; Xu, Y. Feasibility of peaking carbon emissions of the power sector in China’s eight regions: Decomposition, decoupling, and prediction analysis. Environ. Sci. Pollut. Res. 2019, 26, 29212–29233. [Google Scholar] [CrossRef] [PubMed]
  15. Miernyk, W.H. The Elements of Input-Output Analysis. In Web Book of Regional Science; Jackson, R., Ed.; Regional Research Institute, West Virginia University: Morgantown, WV, USA, 2020. [Google Scholar]
  16. Ortiz, O.; Castells, F.; Sonnemann, G. Sustainability in the construction industry: A review of recent developments based on LCA. Constr. Build. Mater. 2009, 23, 28–39. [Google Scholar] [CrossRef]
  17. Yan, J.; Zhao, T.; Lin, T.; Li, Y. Investigating multi-regional cross-industrial linkage based on sustainability assessment and sensitivity analysis: A case of construction industry in China. J. Clean. Prod. 2017, 142, 2911–2924. [Google Scholar] [CrossRef]
  18. Kang, L.; Wu, C.; Liao, X.; Wang, B. Safety performance and technology heterogeneity in China’s provincial construction industry. Saf. Sci. 2020, 121, 83–92. [Google Scholar] [CrossRef]
  19. Kibert, C.J. Sustainable Construction: Green Building Design and Delivery; John Wiley & Sons: Hoboken, NJ, USA, 2016. [Google Scholar]
  20. Zuo, J.; Zhao, Z.-Y. Green building research—Current status and future agenda: A review. Renew. Sustain. Energy Rev. 2014, 30, 271–281. [Google Scholar] [CrossRef]
  21. Ugwu, O.O.; Haupt, T.C. Key performance indicators and assessment methods for infrastructure sustainability—A South African construction industry perspective. Build. Environ. 2007, 42, 665–680. [Google Scholar] [CrossRef]
  22. Molamohamadi, Z.; Ismail, N. The relationship between occupational safety, health, and environment, and sustainable development: A review and critique. Int. J. Innov. Manag. Technol. 2014, 5, 198–202. [Google Scholar] [CrossRef]
  23. Mapar, M.; Jafari, M.J.; Mansouri, N.; Arjmandi, R.; Azizinejad, R.; Ramos, T.B. Sustainability indicators for municipalities of megacities: Integrating health, safety and environmental performance. Ecol. Indic. 2017, 83, 271–291. [Google Scholar] [CrossRef]
  24. Nawaz, W.; Linke, P.; Koҫ, M. Safety and sustainability nexus: A review and appraisal. J. Clean. Prod. 2019, 216, 74–87. [Google Scholar] [CrossRef]
  25. Hinze, J.; Godfrey, R.; Sullivan, J. Integration of construction worker safety and health in assessment of sustainable construction. J. Constr. Eng. Manag. 2013, 139, 594–600. [Google Scholar] [CrossRef]
  26. Mohandes, S.R.; Zhang, X.Q. Developing a holistic occupational health and safety risk assessment model: An application to a case of sustainable construction project. J. Clean. Prod. 2021, 291, 125934. [Google Scholar] [CrossRef]
  27. Kim, J.Y.; Lee, D.S.; Kim, J.D.; Kim, G.H. Priority of accident cause based on tower crane type for the realization of sustainable management at Korean construction sites. Sustainability 2021, 13, 242. [Google Scholar] [CrossRef]
  28. Emrouznejad, A.; Yang, G.-L. A survey and analysis of the first 40 years of scholarly literature in DEA: 1978–2016. Socio-Econ. Plan. Sci. 2018, 61, 4–8. [Google Scholar] [CrossRef]
  29. Xue, X.; Wu, H.; Zhang, X.; Dai, J.; Su, C. Measuring energy consumption efficiency of the construction industry: The case of China. J. Clean. Prod. 2015, 107, 509–515. [Google Scholar] [CrossRef]
  30. Charnes, A.; Cooper, W.; Rhodes, E. Measuring the efficiency of decision making units. Eur. J. Oper. Res. 1978, 2, 429–444. [Google Scholar] [CrossRef]
  31. Wu, J.; Lv, L.; Sun, J.; Ji, X. A comprehensive analysis of China’s regional energy saving and emission reduction efficiency: From production and treatment perspectives. Energy Policy 2015, 84, 166–176. [Google Scholar] [CrossRef]
  32. Tone, K. A slacks-based measure of efficiency in data envelopment analysis. Eur. J. Oper. Res. 2001, 130, 498–509. [Google Scholar] [CrossRef] [Green Version]
  33. Tone, K. Dealing with Undesirable Outputs in DEA: A Slacks-Based Measure (SBM) Approach. In Proceedings of the North American Productivity Workshop 2004, Toronto, CA, Canada, 23–25 June 2004; pp. 44–45. [Google Scholar]
  34. Zhou, C.; Shi, C.; Wang, S.; Zhang, G. Estimation of eco-efficiency and its influencing factors in Guangdong province based on Super-SBM and panel regression models. Ecol. Indic. 2018, 86, 67–80. [Google Scholar] [CrossRef]
  35. Yang, T.; Chen, W.; Zhou, K.; Ren, M. Regional energy efficiency evaluation in China: A super efficiency slack-based measure model with undesirable outputs. J. Clean. Prod. 2018, 198, 859–866. [Google Scholar] [CrossRef]
  36. Charnes, A.; Cooper, W.; Lewin, A.; Seiford, L. Data Envelopment Analysis: Theory, Methodology, and Applications; Springer Science & Business Media: Berlin/Heidelberg, Germany, 2013. [Google Scholar]
  37. Charnes, A.; Clark, C.; Cooper, W.; Golany, B. A developmental study of data envelopment analysis in measuring the efficiency of maintenance units in the US air forces. Ann. Oper. Res. 1984, 2, 95–112. [Google Scholar] [CrossRef]
  38. Chung, S.; Lee, A.; Kang, H.; Lai, C. A DEA window analysis on the product family mix selection for a semiconductor fabricator. Expert Syst. Appl. 2008, 35, 379–388. [Google Scholar] [CrossRef]
  39. Sueyoshi, T.; Yuan, Y.; Li, A.; Wang, D. Social sustainability of provinces in China: A data envelopment analysis (DEA) window analysis under the concepts of natural and managerial disposability. Sustainability 2017, 9, 2078. [Google Scholar] [CrossRef] [Green Version]
  40. Wang, K.; Yu, S.; Zhang, W. China’s regional energy and environmental efficiency: A DEA window analysis based dynamic evaluation. Math. Comput. Model. 2013, 58, 1117–1127. [Google Scholar] [CrossRef]
  41. Al-Refaie, A.; Hammad, M.; Li, M. DEA window analysis and Malmquist index to assess energy efficiency and productivity in Jordanian industrial sector. Energy Effic. 2016, 9, 1299–1313. [Google Scholar] [CrossRef]
  42. Hu, X.; Liu, C. Measuring efficiency, effectiveness and overall performance in the Chinese construction industry. Eng. Constr. Archit. Manag. 2018, 25, 780–797. [Google Scholar] [CrossRef]
  43. Huo, T.; Ren, H.; Cai, W.; Feng, W.; Tang, M.; Zhou, N. The total-factor energy productivity growth of China’s construction industry: Evidence from the regional level. Nat. Hazards 2018, 92, 1593–1616. [Google Scholar] [CrossRef]
  44. Hu, X.; Li, A.; Chen, H.; Xin, D.; Zhang, G.; Zheng, B. General Principles for Calculation of the Comprehensive Energy Consumption. In National Standards of China Beijing GB/T 2589–2008; China Standards Press: Beijing, China, 2008. [Google Scholar]
  45. Chen, Y.; Chen, S.; Hu, C.R.; Jin, L.H.; Zheng, X.Z. Novel probabilistic cost estimation model integrating risk allocation and claim in hydropower project. J. Constr. Eng. Manag. 2020, 146, 04020092. [Google Scholar] [CrossRef]
  46. Chen, Y.; Zhu, L.P.; Hu, Z.G.; Chen, S.; Zheng, X.Z. Risk propagation in multilayer heterogeneous network of coupled system of large engineering project. J. Manag. Eng. 2022, 38, 04022003. [Google Scholar] [CrossRef]
  47. Chen, Y.; Liu, B.; Shen, Y.; Wang, X. The energy efficiency of China’s regional construction industry based on the three-stage DEA model and the DEA-DA model. KSCE J. Civ. Eng. 2016, 20, 34–47. [Google Scholar] [CrossRef]
  48. Huo, T.; Tang, M.; Cai, W.; Ren, H.; Liu, B.; Hu, X. Provincial total-factor energy efficiency considering floor space under construction: An empirical analysis of China’s construction industry. J. Clean. Prod. 2020, 244, 118749. [Google Scholar] [CrossRef]
  49. Li, W.; Sun, W.; Li, G.; Cui, P.; Wu, W.; Jin, B. Temporal and spatial heterogeneity of carbon intensity in China’s construction industry. Resour. Conserv. Recycl. 2017, 126, 162–173. [Google Scholar] [CrossRef]
  50. Shao, B.; Hu, Z.; Tong, L.; Zheng, X.; Liu, D. Comprehensive assessment model on accident situations of the construction industry in China: A macro-level perspective. J. Civ. Eng. Manag. 2020, 26, 14–28. [Google Scholar] [CrossRef]
  51. Asmild, M.; Paradi, J.; Aggarwall, V.; Schaffnit, C. Combining DEA window analysis with the malmquist index approach in a study of the Canadian banking industry. J. Product. Anal. 2004, 21, 67–89. [Google Scholar] [CrossRef]
  52. Cooper, W.W.; Seiford, L.M.; Tone, K. Data envelopment analysis: A comprehensive text with models, applications, references and DEA-solver software. J.-Oper. Res. Soc. 2001, 52, 1408–1409. [Google Scholar]
  53. Huang, J.; Yang, X.; Cheng, G.; Wang, S. A comprehensive eco-efficiency model and dynamics of regional eco-efficiency in China. J. Clean. Prod. 2014, 67, 228–238. [Google Scholar] [CrossRef]
  54. Yu, J.; Zhou, K.; Yang, S. Regional heterogeneity of China’s energy efficiency in “new normal”: A meta-frontier Super-SBM analysis. Energy Policy 2019, 134, 110941. [Google Scholar] [CrossRef]
  55. Abdi, H. Coefficient of variation. Encycl. Res. Des. 2010, 1, 169–171. [Google Scholar]
  56. Fu, W.; Jiang, P.; Zhou, G.; Zhao, K. Using Moran’s I and GIS to study the spatial pattern of forest litter carbon density in a subtropical region of southeastern China. Biogeosciences 2014, 11, 2401–2409. [Google Scholar] [CrossRef] [Green Version]
  57. Thompson, E.; Saveyn, P.; Declercq, M.; Meert, J.; Guida, V.; Eads, C.; Robles, E.; Britton, M. Characterisation of heterogeneity and spatial autocorrelation in phase separating mixtures using Moran’s I. J. Colloid Interface Sci. 2018, 513, 180–187. [Google Scholar] [CrossRef] [PubMed]
  58. Zhang, C.; Luo, L.; Xu, W.; Ledwith, V. Use of local Moran’s I and GIS to identify pollution hotspots of Pb in urban soils of Galway, Ireland. Sci. Total Environ. 2008, 398, 212–221. [Google Scholar] [CrossRef] [PubMed]
  59. Shao, B.; Hu, Z.; Liu, D. Using improved principal component analysis to explore construction accident situations from the multi-dimensional perspective: A Chinese study. Int. J. Environ. Res. Public Health 2019, 16, 3476. [Google Scholar] [CrossRef] [PubMed] [Green Version]
  60. Chang, R.-D.; Soebarto, V.; Zhao, Z.-Y.; Zillante, G. Facilitating the transition to sustainable construction: China’s policies. J. Clean. Prod. 2016, 131, 534–544. [Google Scholar] [CrossRef]
  61. Yang, W.; Li, L. Energy efficiency, ownership structure, and sustainable development: Evidence from China. Sustainability 2017, 9, 912. [Google Scholar] [CrossRef] [Green Version]
  62. Ma, L.; Le, Y.; Li, H.; Jin, R.; Piroozfar, P.; Liu, M. Regional comparisons of contemporary construction industry sustainable concepts in the Chinese context. Sustainability 2018, 10, 3831. [Google Scholar] [CrossRef] [Green Version]
  63. Zhang, K.-M.; Wen, Z.-G. Review and challenges of policies of environmental protection and sustainable development in China. J. Environ. Manag. 2008, 88, 1249–1261. [Google Scholar] [CrossRef]
  64. Zhou, Y.; Guo, Y.; Liu, Y. High-level talent flow and its influence on regional unbalanced development in China. Appl. Geogr. 2018, 91, 89–98. [Google Scholar] [CrossRef]
  65. Ma, X.; Liu, Y.; Wei, X.; Li, Y.; Zheng, M.; Li, Y.; Cheng, C.; Wu, Y.; Liu, Z.; Yu, Y. Measurement and decomposition of energy efficiency of Northeast China—Based on super efficiency DEA model and Malmquist index. Environ. Sci. Pollut. Res. 2017, 24, 19859–19873. [Google Scholar] [CrossRef]
  66. Li, G.; Kuang, Y.; Huang, N.; Chang, X. Emergy synthesis and regional sustainability assessment: Case study of pan-pearl river delta in China. Sustainability 2014, 6, 5203–5230. [Google Scholar] [CrossRef]
  67. Chen, S.; Xi, J.B.; Chen, Y.; Zhao, J.F. Association mining of near misses in hydropower engineering construction based on convolutional neural network text classification. Comput. Intell. Neurosci. 2022, 2022, 4851615. [Google Scholar] [CrossRef] [PubMed]
  68. Cheng, B.Q.; Fan, C.J.; Fu, H.L.; Huang, J.L.; Chen, H.H.; Luo, X.W. Measuring and computing cognitive statuses of construction workers based on electroencephalogram: A critical review. IEEE Trans. Comput. Soc. Syst. 2022. [Google Scholar] [CrossRef]
  69. Du, Q.; Zhou, J.; Pan, T.; Sun, Q.; Wu, M. Relationship of carbon emissions and economic growth in China’s construction industry. J. Clean. Prod. 2019, 220, 99–109. [Google Scholar] [CrossRef]
Figure 1. The eight regions in China.
Buildings 12 00618 g001
Figure 2. The scores for the SPCI in 30 provinces between 2010 and 2017.
Buildings 12 00618 g002
Figure 3. The scores for the SPCI in the eight regions from 2010 to 2017.
Buildings 12 00618 g003
Figure 4. The trend in the changes in overall sustainable performance and in the coefficient of variation.
Buildings 12 00618 g004
Figure 5. Moran scatterplots of the SPCI: (a) 2015, (b) 2016, (c) 2017; Local Moran’s I clusters of the SPCI: (d) 2015, (e) 2016, (f) 2017.
Buildings 12 00618 g005
Figure 6. Changes in the average input and output of the eight regions. Inputs: (a) TFA (b) NE (c) TPM (d) EC; desirable outputs: (e) TOV (f) FSC; undesirable outputs: (g) CE (h) NF.
Buildings 12 00618 g006
Figure 7. Comparison of the 2017 values of the SPCI in the 30 provinces.
Buildings 12 00618 g007
Table 1. Input-output system for assessing the regional sustainability of the construction industry.
CategoryIndicatorAbbreviationUnitDescriptionReferences
InputsTotal Fixed AssetsTFA108 yuanAnnual level of total fixed assets in the construction industry that can be utilized to generate economic benefitsHu and Liu [42]
Number of EmployeesNE104 personNumber of workers engaged in construction activitiesHuo et al. [43]
Total Power of MachineryTPM104 kWTotal power of the machinery and equipment owned by construction enterprisesChen et al. [47]
Construction LandCL108 m2Annual consumption of construction land
Energy ConsumptionEC104 TCETotal amount of energy consumed by the construction industry annuallyHu et al. [44]
Wood ConsumptionWC104 m3Total amount of construction material consumed annually
Concrete ConsumptionCC104 tons
Steel ConsumptionSC104 tons
Glass ConsumptionGC104 tons
Aluminum ConsumptionAC104 tons
Desirable outputsFloor Space of ConstructionFSC104 m2Total floor area under construction annuallyHuo et al. [48]
Total Output ValueTOV108 yuanTotal annual value of construction industry products
Total Pretax ProfitTPP108 yuanTotal annual profits of construction enterprises before paying taxesXu et al. [9]
Undesirable outputsNumber of FatalitiesNFPersonThe number of fatalities occurring in the construction industry annuallyKang et al. [18]
Solid WastesSW104 tonsTotal amount of solid waste generated by the construction industry
Carbon EmissionCE104 tonsTotal amount of carbon emissions generated annually by the consumption of coal, crude oil, etc., as well as of construction material Li et al. [49]
Note: TCE is the abbreviation for tons of coal equivalent.
Table 2. The calculation process for the SPCI in BJ.
Windows20102011201220132014201520162017
W11.0001.0001.214
W2 1.0001.1931.157
W3 1.0211.0211.173
W4 1.0071.0311.505
W5 1.0321.4361.129
W6 1.4401.0601.015
Average1.0001.0001.1431.0621.0791.4601.0941.015
Publisher’s Note: MDPI stays neutral with regard to jurisdictional claims in published maps and institutional affiliations.

