
Identifying Impact Factors of MEP Installation Productivity: An Empirical Study


1
School of Rail Transportation, Soochow University, 8 Jixue Rd., Suzhou 215137, China
2
China Railway First Group Co., Ltd. (CRFG), 1 North Yanta Rd., Xi’an 710000, China
*
Author to whom correspondence should be addressed.
Buildings 2022, 12(5), 565; https://doi.org/10.3390/buildings12050565
Submission received: 2 March 2022
/
Revised: 24 April 2022
/
Accepted: 26 April 2022
/
Published: 28 April 2022
(This article belongs to the Section Architectural Design, Urban Science, and Real Estate)
Abstract
:BIM-based coordination facilitates the discovery of potential pipeline design and construction conflicts. However, the impact of BIM on-field productivity of MEP (Mechanical, Electrical, and Plumbing) installation is unclear because of lacking identification of influencing factors. To fill this research gap, an extensive literature review and quantitative analysis are conducted to identify MEP installation productivity’s impact factors. The identified 24 impact factors are categorized into four primary categories: organizational, management, technical, and personnel. A questionnaire is then designed to measure the impact significance, and the feedback is analyzed through the analytic hierarchy process (AHP) method. This paper finds that: (1) organizational management and control at the macro-level impact productivity more than specific technology and operation during the MEP installation; (2) the key factors affecting productivity are project delivery method, contract mode, and quality control (rework). Accordingly, strategies and suggestions are put forward to encourage and implement productive BIM adoption.
1. Introduction
Productivity signifies the measurement of how well an individual entity uses its resources to produce outputs from inputs. Mechanical, electrical, and plumbing (MEP) installation productivity is constrained by concealment, multiple trades involvement, and confined working space [1], which cause time and space collision, and lead to rework and delay. It is difficult to improve productivity through traditional methods [2] due to low communication efficiency and difficulty between design and construction, long feedback loop path [3], and management negligence [4]. An efficient approach is needed to improve productivity.
Research shows that productivity performance can be improved by reducing requests for information (RFI), reasonably planning, and field automation by reducing changes and conflicts [2]. Furthermore, the application of virtualization technology, such as augmented reality (AR) [5], Building Information Modeling (BIM) [6], and 3D Laser Scanning [7], could facilitate digital information extracting and sharing during the construction process. Through the application and research of BIM in the last decade, BIM has shown great potential in reducing errors and improving the productivity of MEP installation [8], especially in: (1) presenting the space occupation of pipeline layout; (2) discovering space collision between mechanical components and structures; (3) detecting the distance between pipeline laying; (4) accessing feasibility options through adjustment and optimization of the layout.
A plethora of studies have been conducted to illustrate the value of BIM in MEP installation. For example, the use of BIM for MEP coordination indicates that field productivity could increase from 5 and 25% [9], and that it is 228% faster than using traditional 2D drawings [10]. Although BIM adoption brings extra workload, research shows that 85% of conflicts could be avoided [11], and 40% of the total hours can be saved by reducing waste and rework [12].
Several researchers have tried to quantify the productivity performance of using BIM during the MEP installation phase [10,13]. In large scale projects, total productivity can be increased by 75–240% with the BIM application [14]. In MEP projects, productivity increases by 13–38% in China. Given the substantial investment in the construction industry, returns of benefits from productivity improvement are considerable. However, the impact factors that affect productivity have not been systematically prioritized in previous study.
To bridge this research gap, our research aims to explore the mechanism of the factors affecting the productivity of MEP installation. To achieve this goal, 24 initial productivity impact factors were determined through literature review and a pilot study. Questionnaires answered by BIM practitioners were taken to determine the significance between the impact factors. Then, the analytic hierarchy process (AHP) method was used to analyze the factors scientifically. Based on the research findings, corresponding strategies were suggested to promote BIM in MEP projects.
2. Related Work
Labor productivity represents the actual output of each labor force in a unit time period [15]. It represents the value of the services and products accomplished by workers in a unit time period, that is, the output of workers converting natural resources into artificial capital [12]. BIM was initially introduced to the construction industry for improving quality and efficiency by reducing the waste and rework. Years of practice shows its positive impact on labor productivity [16].
In an attempt to explore the impact of BIM on productivity, previous study shows that BIM can improve the overall productivity of the project by speeding up the progress of the project, facilitating overall planning, controlling construction risk, and sharing data [17]. By improving the communication efficiency between different participants, the use of BIM can improve the information quality used for decision-making and reduce time and costs at each stage of the building life cycle [18]. From a quantitative point of view, study shows that the working time can be reduced by 38% through BIM use in steel connection systems [19]. The use of BIM could accelerate the progress of the project by 16% [3], and improve productivity in prefabrication by 166% [14].
The MEP system plays an important role in the project as the building service systems ensures the functionality of the facility [20]. Considering the complexity of modern buildings, the cost of the MEP system may account for about 40 to 60% of total project costs, while the rework rate for the MEP installation approaches 20% [21]. To address these issues, BIM has been mainly applied in collision detection, design optimization, construction simulation, prefabricated processing, and engineering quantity statistics [4,10,22]. BIM-based MEP coordination has been reported as the most beneficial implementation [23]. Previous research focused on demonstrating the benefits of BIM, but insufficient attention has been paid to key factors and methods for the improvement of productivity.
BIM is applied to derive automated conflict detection, management, analysis, and solutions in MEP engineering [24]. A last planner system [25] and Business Process Model and Notation (BPMN) [26] are then proposed to further assist BIM coordination to reduce rework and improve productivity in MEP engineering. In the construction phrase, filed work products could be collected by a 3D laser scanning tool and compared with BIM for geometric installation deviation analysis [27]. BIM utilization efficiency is also vital to project performance [28]. Previous studies focused on developing BIM application scenarios for productivity improvement. Little attention has been paid to exploring the impact factors that affect the functionality of BIM use for productivity purposes.
Due to a compressed layout space with multiple trades in MEP engineering, site productivity is affected by various factors to different degrees. The study of labor productivity impact factors has been conducted to identify and analyze critical factors for nearly 40 years. Most studies use double-layer systems to divide impact factors into major categories and subsets. Kazaz [29] divided the factors that affect the construction productivity into four categories–organization, ecology, physics, and social psychology–and further refined into 36 subfactors; Rojas [30] divided 18 basic factors into four main categories: management, personnel, industry environment, and external conditions; Enshassi [31] identified 10 categories and 45 potential factors. El-gohary [32] classified the factors into three categories–human/labor, industry, and management–and a structured questionnaire survey was carried out among 30 representative practitioners and experts. A review of literature shows that the main impact factors are summarized as environment, industry, organization, project, and management [14], which provides the basis for evaluation of productivity impact factors. In MEP engineering projects, there is a lack of research on the significance of impact factors for productivity improvement with BIM implementation. Further application strategies for productive BIM use could not be developed.
Compared with previous studies, this paper first identifies productivity impact factors through literature analysis and expert consultation. Then, the classification and significance of key factors is further explored through questionnaire. Finally, the key factors of the application process of BIM are analyzed, and suggestions are put forward to improve the productivity of MEP installation. Further application for productive BIM use could be developed based on this study.
3. Research Method
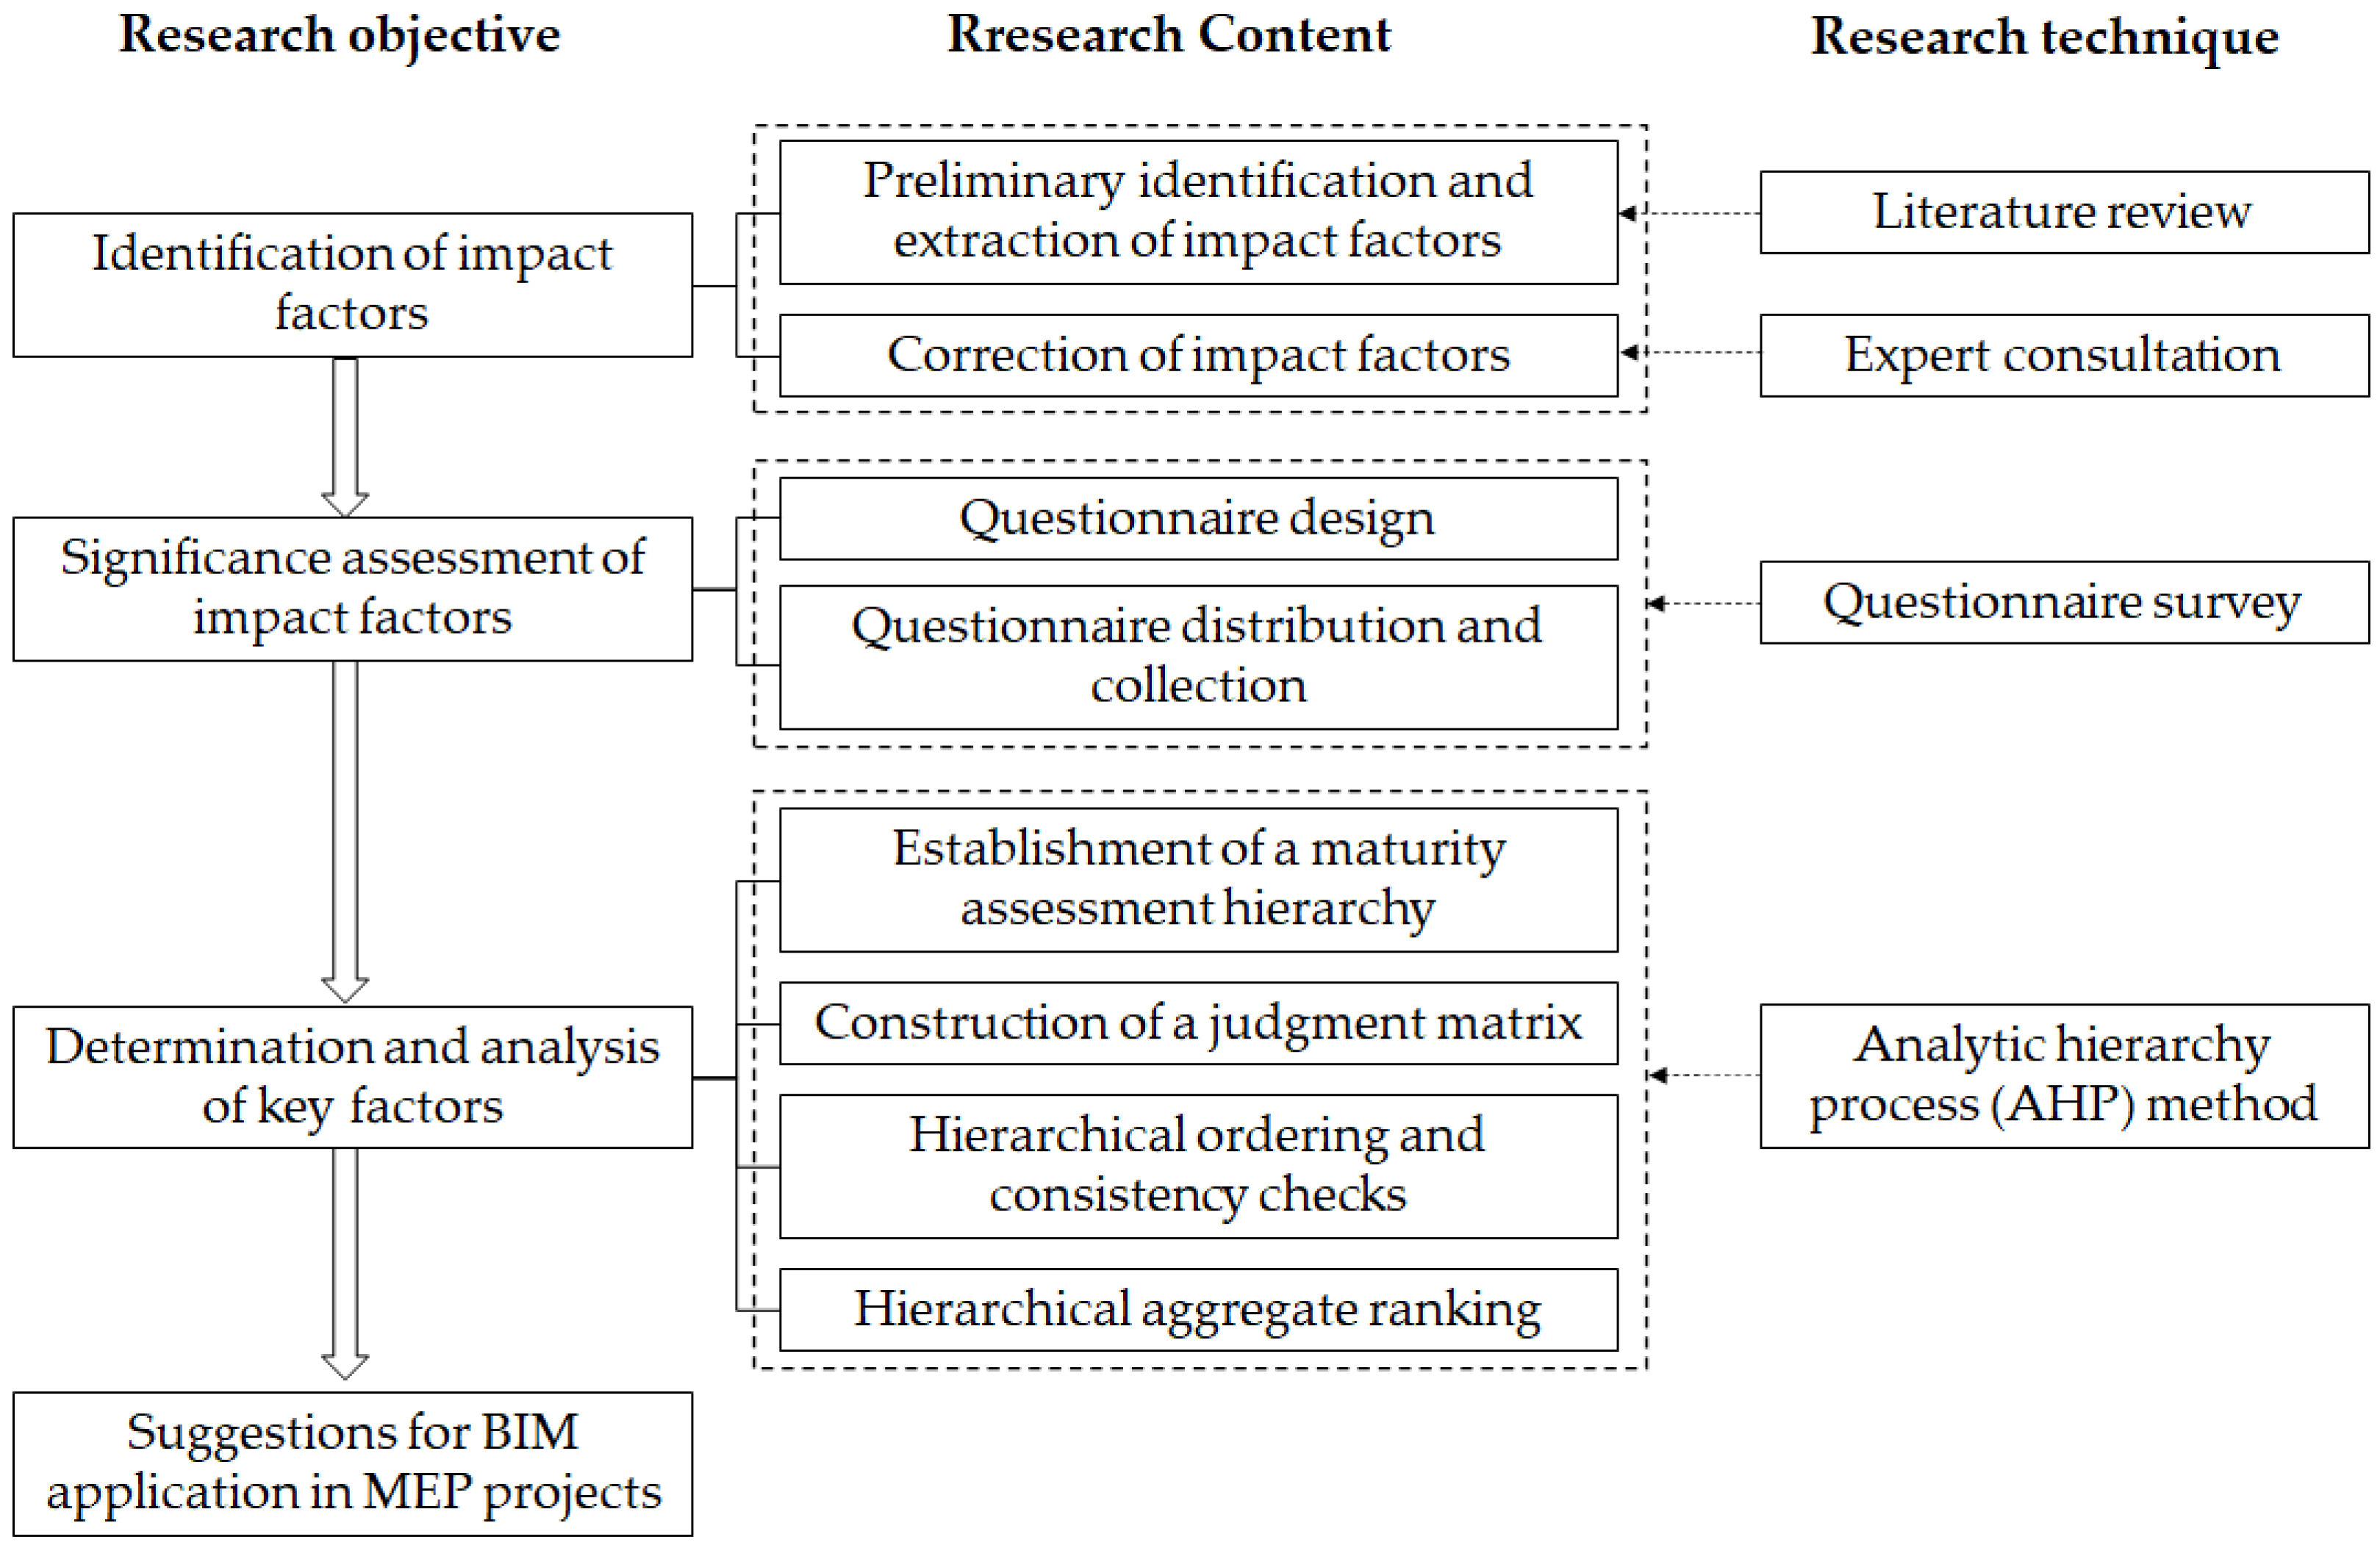
This section describes the research framework. First, it identifies the impact factors through literature analysis and expert consultation. Second, a questionnaire survey has been conducted to collect the experts’ evaluation on the importance of the impact factors, including questionnaire design, and questionnaire distribution and collection. Third, it explains the specific implementation process of the AHP method to hierarchically rank the impact factors. Figure 1 illustrates the research flow of this study.
3.1. Identification of Impact Factors
Considering the complexity of modern architecture, building systems must be well coordinated to avoid conflicts [25]. MEP systems of buildings are complex, including multi-specialized pipelines such as air supply pipes, exhaust pipes, water supply pipes, recycled water pipes, cable trays, and so on. Failure to check the spatial location of various components and troubleshoot potential conflicts before construction can result in extensive rework, delayed project delivery, and additional construction costs [9]. This study takes civil buildings as the research scope, and the MEP system as the research object to explore the impact of BIM on the productivity of MEP installation projects. In order to identify the factors influencing the labor productivity of MEP installation, this research summarizes the impact on labor productivity in MEP installation project through extensive literature analysis and engineering data analysis as follows [4,24,33,34]: (1) Changes caused by design conflicts; (2) Insufficient transportation and installation space for equipment; (3) Pipes and components occupy the construction space, resulting in lagging; (4) The construction task is arranged with the arrival of material, so the installation cannot be organized in order; (5) Size mismatch between some pipes, components, and equipment; (6) Temporary changes from the owner.
This paper initially identified 26 influencing factors referring to literatures in academic journals, documents such as the National Building Information Modeling Standard (NBIMS), and the information sources of other projects. The analysis of literature shows that the impact factors can be divided into five categories, including organizational, industry environment, project, management, and personnel [29,30,31,32], which provides a basis for the comprehensive evaluation of factors. However, for different project management requirements, the specific classification and weight of factors affecting labor productivity are quite different. Based on the literature analysis and the characteristics of MEP engineering with BIM application, the extracted factors were initially divided into four categories: organizational, management, technical, and personnel.
Due to the subjectivity and timeliness of literature analysis, the identified factors were first verified in a pilot study by experts before formal distribution. A total of 14 experts with experience in BIM and MEP installation projects were consulted, including 3 faculty members actively engaged in BIM research, 2 technicians from construction companies with 8 years’ experience, 4 designers with more than 8 years’ experience, 3 consulting engineers with more than 15 years’ experience, and 2 staff from real estate companies with more than 8 years of work experience. The experts selected almost cover all relevant units in the construction industry, and have rich experience of BIM.
Semi-structured interviews were taken in expert consultation. Additional questioning was allowed to further discuss the rationality of factor classification and concept [6]. The one-on-one interviews lasted on average half an hour for each expert, and all interviews were conducted online with audio recorded, with the consent of every interviewee. The interview content mainly includes: (1) From the 26 extracted factors, the interviewees were asked to identify the impact factors (given the choice of ‘Yes’ or ‘No’ for each factor) for BIM implementation in MEP engineering. If ‘No’, suggestions for modifications could be given. Impact factors approved by more than half of the interviewees were retained; (2) Discuss whether the classification of impact factors was appropriate; (3) Discuss whether any factors need to be combined for similar meanings or other reasons; (4) In addition to the listed factors, do any other factors have an impact on the application of BIM in MEP project. Any recommendations for merging or adding new factors would be considered. The results were summarized with text analysis to show the key factors with high frequency of appearance, and ‘BIM investment strategies’ and ‘BIM strategic objectives’, could be combined (mentioned by three interviewees). ‘Availability of materials and equipment’ could be removed (less than half of the interviewees agreed to retain).
After the first round of interviews, the experts were consulted further to determine the final impact factors and classification. According to the experts’ opinions, the 26 impact factors were further revised into 24 factors, and could be divided into four categories: organizational, management, technical, and personnel, as shown in Table 1, Table 2, Table 3 and Table 4.
3.2. Questionnaire Distribution and Collection
- (1)
- Research sample background
The main aim of the research was analyzing the use of BIM technology in construction project management and identifying its impact factor on productivity on MEP engineering. In order to prioritize the critical impact factors, the respondents selected in this study are BIM field experts who have engaged in BIM implementation in MEP engineering for more than five years, and have perceptions on the value of BIM, such as BIM practitioners [46], or individuals involved in BIM implementation [48]. To ensure the reliability of survey results, respondents must meet the following qualifications: (1) have an in-depth knowledge of BIM; (2) with MEP engineering experience; (3) understand the role of BIM in MEP construction process. Respondents will be screened by investigating their professional background in the questionnaire. Therefore, based on the entire process of BIM application in MEP engineering, opinions of all parties in the production cycle need to be obtained, including owners, designers, contractors, and BIM consultants. Meanwhile, researchers–with their neutral and comprehensive perspective–should also be taken into account. For each listed factor, respondents evaluated and set a value to reflect its degree of influence on project performance.
- (2)
- Questionnaire design
A structured questionnaire was designed in three sections to obtain expert opinions based on previous studies from Jin [49]: The first part collected the professional background of the respondents to ensure the validity of questionnaire, including their work years, work profession (i.e., owner, designer, contractors or subcontractors, etc.), BIM experience level (i.e., never used, entry level, intermediate, advanced, and expert), and the number of related projects one has participated in. The second part attempted to compare the factors (as shown in Table 1, Table 2, Table 3 and Table 4) at the same category level to determine the weight of each factor. Experts were asked to compare the 24 factors in four categories in two levels, and to determine ‘which factor do you think is more important’, and provide information on the importance index based on a scale of 1 to 9. The third part targeted at supplementing information that has not previously been extracted in the literature but is instead from respondents’ experiences; factors impeding BIM to promote productivity; the results of applying BIM they have participated in (positive or negative), etc.
- (3)
- Questionnaire collection
Data collection was conducted via questionnaire about productivity and use of BIM. The survey was conducted between September 2021 and October 2021 among owners, designers, contractors, academics, and BIM service providers. The questionnaire was distributed both online and offline to respondents: 180 questionnaires were distributed by e-mail and 54 were retrieved; 24 questionnaires were distributed by field survey and 19 were collected effectively. Therefore, a total of 204 questionnaires were sent out in this study, 73 questionnaires were collected, and 32 respondents completed the questionnaire carefully and also have a certain level of understanding of BIM and MEP engineering. The 32 questionnaires screened manually were tested using the two-tailed statistical test [50] based on a 5% level of significance, and the two-tailed tests showed no significant difference in the mean or proportion between field and online replies.
- (4)
- Data analysis method
The reliability and validity test of the questionnaire is the premise of data analysis. Reliability refers to the consistency of the results obtained when questionnaire is measured repeatedly. Validity refers to the correctness of the measurement. The data obtained from the questionnaire survey will be calculated by SPSS25.0 software. In this paper, the reliability of data is tested by measuring the Cronbach’s alpha coefficient [51], and the structural validity is judged by the KMO value and the Bartlett sphericity test [52].
3.3. Questionnaire Index Design
The collected questionnaire feedback was analyzed through a synthesis evaluation method. A hierarchical structure was developed, including two levels of impact factors. Relative weights of impact factors were determined by comparing factors in pairs from the same category. A judgment matrix was then formed to calculate the scale describing the importance of each factor along with consistency to ensure the reliability of the results.
- (1)
- Establishment of a maturity assessment hierarchy
To assess absolute weight, more detailed options should be made as the second level index for validity. Analytic hierarchy process (AHP) is a simple, flexible, and practical decision-making method for quantitative analysis of qualitative or fuzzy problems with clear hierarchy, which has a high degree of logic, simplicity, and applicability [53]. The AHP was originally proposed by Saaty for multi-criteria decision making [54]. The AHP is widely used to solve various problems due to its powerful prioritization ability, such as risk assessment [55], damage assessment [56], and comprehensive economic benefit evaluation [57]. Several researches also try to combine AHP with questionnaires to explore the development law in the industry, such as cost optimization research based on BIM and value engineering [58], industrial warehouse location research [59], dynamic security prewarning mechanism [60], etc. This study takes the AHP to evaluate the importance of factors affecting MEP installation productivity based on the results of the questionnaire. It is necessary to establish the hierarchical structure before determining the weight of each factor. The structure generally includes the target layer, criterion layer, index layer, and even sub-index layer. The hierarchical structure diagram with evaluation index is established based on AHP, as shown in Figure 2, in which the target layer contains the BIM impact factors on the labor productivity of MEP installation, and the criterion layer is composed of four categories: organizational factors, management factors, technical factors, and personnel factors. The index layer has 24 evaluation indicators.
- (2)
- Construction of a judgment matrix
The importance of each factor is compared qualitatively to construct the judgment matrix. In this study, a 1–9 scale method is used to establish the pairwise comparison judgment matrix within each level.
- (3)
- Hierarchical ordering and consistency checks
When the judgment matrix is constructed, the eigenvalue of the judgment matrix is obtained and recorded as , and then the maximum eigenvalue is selected, which recorded as . The eigenvector is calculated according to the corresponding characteristic equation: ; a normalization process of the eigenvector is called hierarchical ordering. Due to the complexity of the impact mechanism, when comparing the factors, the cognition of respondents is often one-sided and subjective, which leads to errors in the filling of the questionnaire and has an impact on its credibility. Therefore, after constructing the judgment matrix, the consistency test of the matrix should be carried out and obtained according to Equation (1).
The consistency ratio is calculated according to the equation , and values are shown in Table 5. The consistency test is carried out according to the : when , the judgment matrix passes the test; otherwise, the judgment matrix should be modified or discarded appropriately.
- (4)
- Hierarchical aggregate ranking
Based on the principle of stacking from high to low, hierarchical aggregate ranking sorts the relative weights of each lower layer factor of the matrix relative to the highest level. Suppose the weight ranking matrix of n factors in layer to the upper layer is , and the ranking matrix of factors in layer to the total target is , then the weight of the layer to the uppermost (overall objective) is .
4. Results Analysis
4.1. Reliability and Validity Test
In this study, a total of 204 questionnaires were distributed and 73 were returned: 180 questionnaires were distributed by e-mail and 54 were retrieved; 24 questionnaires were distributed by field survey and 19 were collected effectively. Experts consulted in the pilot study to determine impact factors did not participate in this questionnaire survey. The collected samples are comparatively small due to limited number of participants that have both experience in BIM and MEP engineering. The response rate was 35.8% and acceptable for analysis [61]. Among them, 32 valid questionnaires were obtained after excluding respondents who had not participated in BIM or MEP projects. According to the feedback of questionnaire, the response rate of the questionnaires distributed in the field (79.2%) was higher than that of the online questionnaires (30.0%). Due to COVID-19, most of the questionnaires in this study were distributed online, making the number of effective samples small, but still acceptable [62,63]. The respondents came from various institutions in the AEC industry, including 6.3% owners, 15.6% designers, 43.7% contractors, 31.3% scholars and researchers, and 3.1% consultants. Information about the respondents is shown in Table 6.
Cronbach’s alpha coefficient is used as the discriminant index of reliability. When Cronbach’s alpha is greater than 0.8, it means that the data meet the requirements; when the coefficient is greater than 0.9, it indicates that the data are highly reliable and consistent. The results show that the Cronbach’s alpha coefficient calculated in this study is 0.902, and the number of items is 24, indicating that the data is reliable. For the test of KMO value, if KMO ≥ 0.5, it means that the data meets the requirements. The analysis of structural validity shows that the KMO value is 0.711, and the significance probability in the Bartlett sphericity test is 0.000, indicating that the questionnaire is effective.
4.2. Analysis Based on AHP
The respondents had to meet two criteria before AHP analysis. First, the respondents should have an in-depth knowledge of BIM implementation in MEP installation. The 32 valid questionnaires were obtained according to the Section 4.1. Second, the data of questionnaires should pass the consistency check, which is the basic requirement in the AHP method [60]. A total of 20 questionnaire feedback that passed the consistency test was analyzed, and the weight of each factor represents the feature vector of the corresponding judgment matrix. The judgment matrix was constructed with the geometric mean value calculated based on scale value of each factor, as shown in Table 7. The judgment matrixes of the four category factors are shown in Table 8, Table 9, Table 10 and Table 11.
Elements in the judgment matrix has the following properties: (1) ; (2) , values less than 1 are not shown in the matrix; (3) .
According to the category-level judgment matrix, the consistency test was carried out and the weight of each factor was calculated, as shown in Table 12.
4.3. Category-Level Factors Analysis
As shown in Table 8, in category-level factors, the organizational factors (O) and management factors (M) are more significant compared with other factors. This is compliant with research that indicates organizational factors are key to achieving project goals and increasing productivity [25,64], as organizational factors determine contract mode, project delivery method, and team ability, etc. Major challenges for successful MEP coordination with BIM are related to management aspects, such as the lack of clarity about roles and responsibilities in coordination [24], and the difficulty to define and achieve sufficient levels of detail for each discipline [9]. It shows that management and organization factors that facilitate coordination based on BIM have the greater impact on productivity than technical aspects. The personnel factor (P) is relatively less critical as most BIM users receive basic BIM software training and do not show significant differences in the level of operation. The weights of category-level factors are shown in Figure 3.
4.4. Factor-Level Analysis
- (1)
- Organizational factors (O)
The organizational factors include project delivery method (O1), contract mode (O2), BIM team mode (O3), participants’ support (O4), team ability and cooperation (O5), BIM investment strategies and objectives (O6), unified codes and standards (O7), etc. In this category, delivery method and contract mode play important roles in formulating implementation plan [65] that affect productivity dynamics.
An integrated approach to project delivery has been identified as a holistic solution [4,24,34]. The project delivery method not only defines the roles and responsibilities of participants, but also determines the project implementation framework in terms of the sequence of activities such as design, procurement, and construction [66]. The IPD (Integrated Project Delivery) method has been proposed to encourage collaboration in BIM projects [67]. IPD mode requires the contractor’s early intervention in the design stage to reduce repetitive work and conflicts caused by poor information sharing from the beginning to the project delivery [24], and enables participants to implement BIM strategy and share obligations in a contract-driven manner.
Contract mode defines the responsibilities of each participant during BIM implementation. A reasonable contract mode can motivate the contractor to improve productivity through benefit distribution and risk sharing. The adoption mode of BIM should also be determined in the contract. While BIM-led coordination can reduce the time and cost more than BIM-assisted coordination in MEP projects [10], it may also pose unknown risks for immature BIM users.
- (2)
- Management factors (M)
The management factors consist of quality control (rework) (M1), design changes and management (M2), information request times (M3), completion on time (M4), risk control (M5), multi-party communication (M6), staff training (M7), and construction methods (M8). From the results, rework (M1) is considered to be the most important factor for labor productivity. Errors in management might lead to changes and rework, and the cost of rework in construction accounts for about 10% of total cost [68]. With the proper operation of BIM, clash detection can avoid the most frequent problems of the MEP system, reduce rework effectively, and realize the construction objectives.
- (3)
- Technical factors (T)
Technical factors affect the detail of the model and interoperability between trades in BIM collaboration, including: BIM modeling accuracy (T1), data exchange and information sharing (T2), BIM software functions (T3), data richness (T4), and technical requirements (T5). From a cost-benefit perspective, the level of BIM development and data richness are determined by the contract and are consistent with the BIM implementation plan to avoid insufficient and excessive modeling. High concentration of information on one participant may create communication failures and finally slow down the entire project. Data flow and integration between disciplines help MEP engineers have control over coordination.
- (4)
- Personnel factors (P)
Personnel factors are divided into four specific secondary factors: learning curve (P1), understanding of the project (P2), job assignment (P3), and modeling experience (P4). Learning curve shows the rate of acquiring skills or knowledge in a certain period. The acquisition of operation skills requires an amount of time and experience, which leads to a certain delay in BIM benefits realization. A temporary loss of productivity appears in this process while employees are adapting to new technologies. At the same time, organizational learning is restrained by the exponential speed of software development and the need to constantly retrain personnel to keep up with forefront technology, which is a repetitive process in a spiral rise.
- (5)
- Overall analysis
Secondary influencing factors are sorted according to their weights, and the results are shown in Figure 4. The project delivery method (O1) is the most important factor, followed by contract mode (O2) and rework (M1). Project delivery method is a comprehensive process of assigning contractual responsibility for design and construction. The contract mode clarifies the distribution of responsibilities among the participants. Rework reflects the resource utilization efficiency of the project. Other factors also show considerable proportion, such as BIM team mode (O3), BIM modeling accuracy (T1), data exchange and information sharing (T2), design changes and management (M2), etc.
5. Discussion
5.1. Research Findings
BIM has been reported to reduce waste in rework, optimize resource allocation, and thus improve productivity. BIM application in the MEP engineering field coordination is found to be the most beneficial in the short term construction period. Although the impact mechanism is unclear, impact factors could be identified through experts’ opinions.
The findings of this study have several practical and engineering implications. Through the feedback of questionnaire, organizational factors (0.3931) and management factors (0.3023) are more significant compared with technical factors (0.1910) and personnel factors (0.1136), at present. Although technical and personnel aspects are vital to deliver the functionality of BIM, it is the overall control of the organization rather than the individual skill or technology that plays a decisive role in improving productivity of MEP installation. From the perspective of the factor-level, project delivery method (O1, 0.0964), contract mode (O2, 0.0919), and quality control (rework) (M1, 0.0763) are the key factors. Other main factors include BIM team mode (O3, 0.0623), BIM modeling accuracy (T1, 0.0567), data exchange and information sharing (T2, 0.0555), design changes and management (M2, 0.0535), and so on. This reflects the importance of an adequate BIM implementation strategy to ensure effectiveness and to fulfill the benefit of BIM.
Through further analysis, some other factors will also affect productivity. Overall, 69.25% of the respondents considered that the productivity of MEP installation could be increased by 25–50% under BIM use. They argued that clash detection (89.23% respondents agreed), comprehensive pipeline optimization (93.85%), and construction simulation (76.92%) were the main ways to improve labor productivity during the installation process. In addition to the above impact factors, some respondents proposed that the prefabrication rate would also have an impact on site productivity. Due to the controllability of environment, the quality of prefabricating components can be controlled more strictly, and the cost will reduce accordingly.
The application of BIM is throughout the entire project cycle and involves different participants. According to the data of this questionnaire survey, 44.42% of the respondents agreed on that the best interests are with owner. With the gradual popularization of BIM, consultants provide the most professional BIM services, and play a key role in the coordination of all parties. At present, most of the designers rely on the BIM technical services provided by consultants to continuously update and optimize the design plan. At the same time, some models cannot effectively guide the construction during the MEP installation stage due to insufficient modeling depth and lack of details.
5.2. Contributions of Body Knowledge
This study makes three key contributions to research in this field. First, this paper systematically studies and chooses MEP coordination as the most productive and beneficial BIM application, and summarizes factors affecting labor productivity through literature analysis and questionnaire supplement. It shows that organizational management and control at the macro level have greater impact on productivity than specific technology and operation during the MEP installation. Second, compared with previous studies, this study not only proves the promoting effect of BIM on productivity, but also combines quantitative and qualitative analysis to develop an impact factors hierarchy structure. Project delivery method (O1, 0.0964), contract mode (O2, 0.0919), and quality control (rework) (M1, 0.0763) are the key factors among the impact factors. Appropriate project delivery method can have a positive effect on other factors, such as data exchange and information sharing (T2), design changes and management (M2), and so on. Third, suggestions are given based on the weight of factors at all levels, to help researchers and participants in MEP installation projects to explore the correct BIM application to promote productivity.
5.3. Recommendation
This paper puts forward the following suggestions based on comprehensive analysis.
First, given the importance of project delivery method (O1) and contract mode (O2) in MEP engineering, collaborative-based project delivery methods must be determined in the contract. In IPD mode, BIM is functioning as a collaborative platform for continuous information transmission [67,69]. Under this delivery mode, participants are required to work together in advance to avoid reworking. As the biggest beneficiary, the owner should clarify the requirements and guidelines for adopting BIM when signing the contract, so as to improve the application depth of BIM by all parties. In addition to providing relevant models and services, BIM consultants should also specify the publicity of BIM and train for other participants to improve the overall level of BIM. Meanwhile, the owner needs to play a leading role to facilitate multi-party collaboration and communication.
Second, BIM workflow should be established to illustrate BIM team work mode (O3), modeling accuracy (T1), data exchange and information sharing method (T2), and design changes and management mode (M2). Although clash detection can promote conflict identification and visualization, the process of analyzing and resolving MEP conflicts is still time-consuming [4] and may not resolve all MEP conflict problems before construction [33]. By improving the quality of work plans and clarifying team responsibilities, participants would be able to commit to accomplishing work in a more reliable way [21]. Therefore, an effective BIM workflow should be developed to clarify task scope and responsibility assignments.
6. Conclusions, Limitation, and Future Work
BIM has shown great potential to reduce errors and improve the productivity of MEP installation, and the implementation of BIM in MEP engineering can maximize its value. However, due to the improper operation and influence of various factors, BIM may not be able to tap into its potential, and could even cause more resource waste. Considering the gap between research and practical application, stakeholders could be reluctant to adopt BIM for its failure to obtain desired results. To figure out the impact of BIM on MEP installation productivity, it is significant to determine the critical impact factors from a comprehensive perspective. This paper combines the AHP method with a questionnaire survey and quantitatively compares the weight between factors. Based on literature analysis and expert consultation, 24 impact factors have been determined and divided into four categories. Experts who have engaged in BIM implementation in MEP engineering for more than five years were selected as respondents to collect data. Under the premise of ensuring the validity of data through a consistency test, the main factors and key factors are obtained by ranking the impact factors at each level. The discussion concluded by proposing countermeasures and suggestions for BIM users for productivity improvement.
This study has its limitations. The sample of this study needs to be expanded; distribution of the questionnaire was mainly in the Shanghai and Jiangsu provinces, and there was a lack of case studies of project performance and productivity under the consideration of main impact factors. Additionally, the interrelationship between the factors has not been deeply excavated, which needs to be further studied. The research on Chinese BIM in MEP installation can be extended from BIM active areas to other underdeveloped areas in the future to allow regional comparison of productivity across the country.
Author Contributions
Conceptualization, Q.W., L.C. and P.S.; methodology, Q.W., L.C. and S.X.; investigation, Q.W.; software, Q.W.; formal analysis, Q.W.; validation, L.C.; writing—original draft preparation, Q.W.; writing—review and editing, L.C., W.W. and S.X.; supervision, P.S. and W.W.; project administration, W.W. All authors have read and agreed to the published version of the manuscript.
Funding
This research received no external funding.
Institutional Review Board Statement
Not applicable.
Informed Consent Statement
Informed consent was obtained from all subjects involved in the study.
Data Availability Statement
The data are available from the corresponding author upon reasonable request.
Conflicts of Interest
The authors declare no conflict of interest. The funders had no role in the design of the study; in the collection, analyses, or interpretation of data; in the writing of the manuscript, or in the decision to publish the results.
References
- Chalhoub, J.; Ayer, S.; McCord, K. Augmented reality to enable users to identify deviations for model reconciliation. Buildings 2021, 11, 77. [Google Scholar] [CrossRef]
- Chelson, D.E. The Effects of Building Information Modeling on Construction Site Productivity. Ph.D. Thesis, University of Maryland, Maryland, MD, USA, 2010. [Google Scholar]
- Parvan, K. Estimating the Impact of Building Information Modeling Utilization on Building Project Performance. Ph.D. Thesis, University of Maryland, Maryland, MD, USA, 2012. [Google Scholar]
- Wang, L.; Leite, F. Formalized knowledge representation for spatial conflict coordination of mechanical, electrical and plumbing (MEP) systems in new building projects. Autom. Constr. 2016, 64, 20–26. [Google Scholar] [CrossRef]
- Garbetta, J.; Hartleya, T.; Heesomb, D. A multi-user collaborative BIM-AR system to support design and construction. Autom. Constr. 2021, 122, 103487. [Google Scholar] [CrossRef]
- Ullah, K.; Witt, E.; Lill, I. The BIM-Based Building Permit Process: Factors Affecting Adoption. Buildings 2022, 12, 45. [Google Scholar] [CrossRef]
- Xu, Y.; Shen, X.; Lim, S. CorDet: Corner-Aware 3D Object Detection Networks for Automated Scan-to-BIM. J. Comput. Civ. Eng. 2021, 35, 04021002. [Google Scholar] [CrossRef]
- Hauer, S.; Murschetz, J.; Bres, D.D.A.; Sporr, A.; Di, M.S.; Monsberger, U.D.D.M. metaTGA: A chance for BIM in the field of MEP. Bauphysik 2020, 42, 345–351. [Google Scholar] [CrossRef]
- Khanzode, A.; Fischer, M.; Reed, D. Benefits and lessons learned of implementing building virtual design and construction (VDC) technologies for coordination of mechanical, electrical, and plumbing (MEP) systems on a large healthcare project. Electron. J. Inf. Technol. Constr. 2008, 13, 324–342. [Google Scholar]
- Park, J.H.; Lee, G. Design coordination strategies in a 2D and BIM mixed-project environment: Social dynamics and productivity. Build. Res. Inf. 2017, 45, 631–648. [Google Scholar] [CrossRef]
- Hu, Z.-Z.; Zhang, J.-P.; Yu, F.-Q.; Tian, P.-L.; Xiang, X.-S. Construction and facility management of large MEP projects using a multi-Scale building information model. Adv. Eng. Softw. 2016, 100, 215–230. [Google Scholar] [CrossRef]
- Jang, S.; Lee, G. Process, productivity, and economic analyses of BIM–based multi-trade prefabrication—A case study. Autom. Constr. 2018, 89, 86–98. [Google Scholar] [CrossRef]
- Chen, L.; Shi, P.; Wu, Q. Impact of BIM on building pipeline installation labour productivity. J. Civ. Eng. Manag. 2019, 36, 90–97. [Google Scholar]
- Poirier, E.A.; Staub-French, S.; Forgues, D. Measuring the impact of BIM on labor productivity in a small specialty contracting enterprise through action-research. Autom. Constr. 2015, 58, 74–84. [Google Scholar] [CrossRef]
- Kassem, M.; Mahamedi, E.; Rogage, K.; Duffy, K.; Huntingdon, J. Measuring and benchmarking the productivity of excavators in infrastructure projects: A deep neural network approach. Autom. Constr. 2021, 124, 103532. [Google Scholar] [CrossRef]
- Lee, J.; Park, Y.-J.; Choi, C.-H.; Han, C.-H. BIM-assisted labor productivity measurement method for structural formwork. Autom. Constr. 2017, 84, 121–132. [Google Scholar] [CrossRef]
- What Is a BIM? National BIM Standard-United States (NBIMS-US): Washington, DC, USA. 2019. Available online: https://www.nibs.org/resources/standards (accessed on 2 March 2022).
- Smith, D.K.; Tardif, M. A Strategic Implementation Guide for Architects, Engineers, Constructors, and Real Estate Asset Managers; John Wiley & Sons: Hoboken, NJ, USA, 2009. [Google Scholar]
- Shan, Y.; Goodrum, P.; Haas, C.; Caldas, C. Assessing Productivity Improvement of Quick Connection Systems in the Steel Construction Industry Using Building Information Modeling (BIM). In Construction Research Congress 2012; American Society of Civil Engineers: Reston, VA, USA, 2012; pp. 1135–1144. [Google Scholar]
- Hu, Z.-Z.; Tian, P.-L.; Li, S.-W.; Zhang, J.-P. BIM-based integrated delivery technologies for intelligent MEP management in the operation and maintenance phase. Adv. Eng. Softw. 2018, 115, 1–16. [Google Scholar] [CrossRef]
- Khanzode, A.R. An Integrated Virtual Design and Construction and Lean (IVL) Method for Coordination of Mechanical, Electrical and Plumbing (MEP) Systems. Ph.D. Thesis, Stanford University, Stanford, CA, USA, 2011. [Google Scholar]
- Wang, J.; Wang, X.; Shou, W.; Chong, H.-Y.; Guo, J. Building information modeling-based integration of MEP layout designs and constructability. Autom. Constr. 2016, 61, 134–146. [Google Scholar] [CrossRef]
- Lee, G.; Kim, J. “Walter” Parallel vs. Sequential Cascading MEP Coordination Strategies: A Pharmaceutical Building Case Study. Autom. Constr. 2014, 43, 170–179. [Google Scholar] [CrossRef]
- PParn, E.; Edwards, D.; Sing, M.C. Origins and probabilities of MEP and structural design clashes within a federated BIM model. Autom. Constr. 2018, 85, 209–219. [Google Scholar] [CrossRef]
- Tillmann, P.A. Using the Last Planner System to tackle the social aspects of BIM-enabled MEP coordination. Can. J. Civ. Eng. 2020, 47, 140–152. [Google Scholar] [CrossRef]
- PParti, R.; Hauer, S.; Monsberger, M. Process Model for BIM-Based MEP Design; IOP Publishing: Bristol, UK, 2019; Volume 323, p. 012045. [Google Scholar]
- Guo, J.; Wang, Q.; Park, J.-H. Geometric quality inspection of prefabricated MEP modules with 3D laser scanning. Autom. Constr. 2020, 111, 103053. [Google Scholar] [CrossRef]
- Zhang, J.; He, T.; Lin, J.; Chen, X.; Zhang, Y. Space and MEP topology extraction and application based on BIM. J. Tsinghua Univ. 2018, 58, 587–592. [Google Scholar]
- Kazaz, A.; Manisali, E.; Ulubeyli, S. Effect of Basic Motivational Factors On Construction Workforce Productivity in Turkey/Pagrindinių Motyvacijos Veiksnių Įtaka Statybos Produktyvumui Turkijoje. J. Civ. Eng. Manag. 2008, 14, 95–106. [Google Scholar] [CrossRef] [Green Version]
- Rojas, E.M.; Aramvareekul, P. Labor Productivity Drivers and Opportunities in the Construction Industry. J. Manag. Eng. 2003, 19, 78–82. [Google Scholar] [CrossRef]
- Enshassi, A.; Mohamed, S.; Mayer, P.E. Factors affecting labour productivity in building projects in the gaza strip. J. Civ. Eng. Manag. 2007, 13, 245–254. [Google Scholar] [CrossRef]
- El-gohary, K.M.; Aziz, R.F. Factors influencing construction labor productivity in Egypt. J. Manag. Eng. 2014, 30, 1–9. [Google Scholar] [CrossRef]
- DDossick, C.S.; Neff, G. Organizational Divisions in BIM-Enabled Commercial Construction. J. Constr. Eng. Manag. 2010, 136, 459–467. [Google Scholar] [CrossRef] [Green Version]
- Leite, F.; Akcamete, A.; Akinci, B.; Atasoy, G.; Kiziltas, S. Analysis of modeling effort and impact of different levels of detail in building information models. Autom. Constr. 2011, 20, 601–609. [Google Scholar] [CrossRef]
- Riley, D.R.; Varadan, P.; James, J.S.; Thomas, H.R. Benefit-Cost Metrics for Design Coordination of Mechanical, Electrical, and Plumbing Systems in Multistory Buildings. J. Constr. Eng. Manag. 2005, 131, 877–889. [Google Scholar] [CrossRef]
- Succar, B. Building information modelling framework: A research and delivery foundation for industry stakeholders. Autom. Constr. 2009, 18, 357–375. [Google Scholar] [CrossRef]
- Meng, Y.; Li, X.; Ma, C. Application of the Fuzzy Comprehensive Evaluation Based on AHP in the BIM Application Maturity Evaluation; American Society of Civil Engineers (ASCE): Kunming, China, 2014. [Google Scholar]
- Ghosh, A. Analyzing the Impact of Building Information Modeling (BIM) on Labor Productivity in Retrofit Construction: Case Study at a Semiconductor Manufacturing Facility. Ph.D. Thesis, Arizona State University, Tempe, AZ, USA, 2015. [Google Scholar]
- Durdyev, S.; Mbachu, J. On-site labour productivity of New Zealand construction industry: Key constraints and improvement measures. Australas. J. Constr. Econ. Build. 2011, 11, 18–33. [Google Scholar] [CrossRef] [Green Version]
- Rivas, R.A.; Borcherding, J.D.; González, V.; Alarcón, L.F. Analysis of factors influencing productivity using craftsmen questionnaires: Case study in a Chilean construction company. J. Constr. Eng. Manag. ASCE 2011, 137, 12–320. [Google Scholar] [CrossRef]
- Giel, B.K.; Issa, R.R.A. Return on Investment Analysis of Using Building Information Modeling in Construction. J. Comput. Civ. Eng. 2013, 27, 13–23. [Google Scholar] [CrossRef]
- Spitler, L.; Feliz, T.; Wood, N.; Sacks, R. Constructible BIM elements—A root cause analysis of work plan failures. In Proceedings of the 23rd Annual Conference of the International Group for Lean Construction, Perth, Australia, 29–31 July 2015. [Google Scholar]
- Cox, R.F.; Issa, R.R.A.; Ahrens, D. Management’s Perception of Key Performance Indicators for Construction. J. Constr. Eng. Manag. 2003, 129, 142–151. [Google Scholar] [CrossRef]
- Harris, R.; McAdam, R.; McCausland, I.; Reid, R. Levels of innovation within SMEs in peripheral regions: The role of business improvement initiatives. J. Small Bus. Enterp. Dev. 2013, 20, 102–124. [Google Scholar] [CrossRef]
- Sanders, S.R.; Thomas, H.R. Factors Affecting Masonry-Labor Productivity. J. Constr. Eng. Manag. 1991, 117, 626–644. [Google Scholar] [CrossRef]
- Eadie, R.; Browne, M.; Odeyinka, H.; McKeown, C.; McNiff, S. BIM implementation throughout the UK construction project lifecycle: An analysis. Autom. Constr. 2013, 36, 145–151. [Google Scholar] [CrossRef]
- Dai, J.; Goodrum, P.M.; Maloney, W.F. Construction Craft Workers’ Perceptions of the Factors Affecting Their Productivity. J. Constr. Eng. Manag. 2009, 135, 217–226. [Google Scholar] [CrossRef]
- Cao, D.; Li, H.; Wang, G.; Huang, T. Identifying and contextualising the motivations for BIM implementation in construction projects: An empirical study in China. Int. J. Proj. Manag. 2017, 35, 658–669. [Google Scholar] [CrossRef]
- JJin, R.; Hancock, C.M.; Tang, L.; Wanatowski, D. BIM Investment, Returns, and Risks in China’s AEC Industries. J. Constr. Eng. Manag. 2017, 143, 04017089. [Google Scholar] [CrossRef]
- Johnson, R.A. Miller & Freund’s probability and statistics for engineers. IIE Trans. 2001, 33, 823–825. [Google Scholar]
- Taber, K.S. The Use of Cronbach’s Alpha When Developing and Reporting Research Instruments in Science Education. Res. Sci. Educ. 2018, 48, 1273–1296. [Google Scholar] [CrossRef]
- Eyduran, E.; Karakus, K.; Karakus, S.; Cengız, F. Usage of factor scores for determining relationships among body weight and some body measurements. Bulg. J. Agric. Sci. 2009, 15, 374–378. [Google Scholar]
- Yaraghi, N.; Tabesh, P.; Guan, P.; Zhuang, J. Comparison of AHP and Monte Carlo AHP Under Different Levels of Uncertainty. IEEE Trans. Eng. Manag. 2014, 62, 122–132. [Google Scholar] [CrossRef]
- Saaty, T.L. The Analytic Hierarchy Process: Planning, Priority Setting, Resource Allocation; McGraw-Hill International Book Co.: New York, NY, USA, 1980; p. 287. [Google Scholar]
- Lyu, H.-M.; Zhou, W.-H.; Shen, S.-L.; Zhou, A.-N. Inundation risk assessment of metro system using AHP and TFN-AHP in Shenzhen. Sustain. Cities Soc. 2020, 56, 102103. [Google Scholar] [CrossRef]
- Du, Y.; Chen, W.; Cui, K.; Zhang, K. Study on Damage Assessment of Earthen Sites of the Ming Great Wall in Qinghai Province Based on Fuzzy-AHP and AHP-TOPSIS. Int. J. Arch. Herit. 2020, 14, 903–916. [Google Scholar] [CrossRef]
- Wang, J.; Deng, X. Comprehensive Economic Benefit Evaluation Method of Coastal Enterprises Based on AHP. J. Coast. Res. 2020, 103, 24–28. [Google Scholar] [CrossRef]
- Li, X.; Wang, C.; Alashwal, A. Case Study on BIM and Value Engineering Integration for Construction Cost Control. Adv. Civ. Eng. 2021, 2021, 8849303. [Google Scholar] [CrossRef]
- Siahboomy, M.A.; Sarvari, H.; Chan, D.W.M.; Nassereddine, H.; Chen, Z. A multi-criteria optimization study for locating industrial warehouses with the integration of BIM and GIS data. Arch. Eng. Des. Manag. 2021, 17, 478–495. [Google Scholar]
- Xu, W.; Wang, T.-K. Dynamic safety prewarning mechanism of human–machine–environment using computer vision. Eng. Constr. Arch. Manag. 2020, 27, 1813–1833. [Google Scholar] [CrossRef]
- Govindan, K.; Kaliyan, K.M.; Kannan, D.; Haq, A. Barriers analysis for green supply chain management implementation in Indian industries using analytic hierarchy process. Int. J. Prod. Econ. 2014, 147, 555–568. [Google Scholar] [CrossRef]
- Lu, Q.; Chen, L.; Lee, S.; Zhao, X. Activity theory-based analysis of BIM implementation in building O&M and first response. Autom. Constr. 2018, 85, 317–332. [Google Scholar]
- Liu, G.; Li, K.; Zhao, D.; Mao, C. Business Model Innovation and Its Drivers in the Chinese Construction Industry during the Shift to Modular Prefabrication. J. Manag. Eng. 2017, 33, 04016051. [Google Scholar] [CrossRef]
- Liberatore, M.J.; Luo, W. Coordination in Consultant-Assisted IS Projects: An Agency Theory Perspective. IEEE Trans. Eng. Manag. 2009, 57, 255–269. [Google Scholar] [CrossRef]
- AAnderson, S.; Oyetunji, A. Selection Procedure for Project Delivery and Contract Strategy; American Society of Civil Engineers: Honolulu, HI, USA, 2003. [Google Scholar]
- Oyetunji, A.A.; Anderson, S.D. Relative effectiveness of project delivery and contract strategies. J. Constr. Eng. Manag. 2006, 132, 3–13. [Google Scholar] [CrossRef]
- Du, Y.; Zhou, H.; Yuan, Y.; Xue, H. Exploring the moral hazard evolutionary mechanism for BIM implementation in an integrated project team. Sustainability 2019, 11, 5719. [Google Scholar] [CrossRef] [Green Version]
- Love, P.E.D.; Edwards, D.J.; Smith, J.; Walker, D.H.T. Divergence or Congruence? A Path Model of Rework for Building and Civil Engineering Projects. J. Perform. Constr. Facil. 2009, 23, 480–488. [Google Scholar] [CrossRef] [Green Version]
- Ma, J.; Ma, Z.; Li, J. An IPD-based incentive mechanism to eliminate change orders in construction projects in China. KSCE J. Civ. Eng. 2017, 21, 2538–2550. [Google Scholar] [CrossRef]
Figure 1.
Flowchart of research.

Figure 2.
Evaluation indicator system of BIM-enabled MEP project.

Figure 3.
The weight of category-level factors.

Figure 4.
Weight ranking of 24 factors.


Table 1.
Organizational factors affecting labor productivity in BIM-enabled MEP installation.
| Number | Impact Factor | Instructions |
|---|---|---|
| O1 | Project delivery method | Determine the project implementation framework in terms of the activity sequence, including design, procurement, and construction [32]. An integrated approach to project delivery has been identified as an overall solution of coordination problems caused by the complexity of MEP projects [25]. |
| O2 | Contract mode | Clarify the responsibilities, rights, and obligations of participants during the MEP installation [35], prevent mutual shirk when problems arise, and guarantee the effective implementation of BIM [36]. |
| O3 | BIM team mode | Participants with the highest centrality values can contact other participants to the greatest extent, which means that the center participant will have the strongest control over the coordination process of MEP, and the team mode can determine who is the key actor [10]. |
| O4 | Participants’ support | The support and recognition of BIM application by the participants will actively change the traditional working mode and determine the depth of BIM application [37]. Only if the mechanical, electrical, and plumbing professions all actively adopt BIM can the overall coordination be completed. |
| O5 | Team ability and cooperation | BIM capability and maturity of teams, such as designers and construction; they work together and share information [14]. Due to the high interdependence among multi-specialties in MEP systems, ineffective collaboration may have significant impact on productivity [25]. |
| O6 | BIM investment strategies and objectives | The rationality of funding allocations and related investment strategies in BIM and other technologies [38], such as software purchases, personnel training, etc. The benefits of BIM coordination are most effective when contractual interests are consistent and the whole team is engaged in meeting overall project objectives [25]. |
| O7 | Unified codes and standards | Guidance to the BIM application in intricate MEP projects [38]. |
Table 2.
Management factors affecting labor productivity in BIM-enabled MEP installation.
| Number | Impact Factor | Instructions |
|---|---|---|
| M1 | Quality control (rework) | Quality control in design and construction phrase is required of complex MEP arrangement in confined spaces to mitigate rework and delay [39,40]. |
| M2 | Design changes and management | Change orders affect project progress and create financial losses [41]. Design errors are a root cause of diminished construction project performance [24]. |
| M3 | Information request times | Reduction in requests for information for the coordination in MEP installation between contractors and designers can lead to faster delivery of projects and less money [9]. |
| M4 | Completion on time | An analysis of a weekly plan can be conducted to identify the reason for failures in MEP modeling or construction [42], and avoid delays in progress [43]. |
| M5 | Risk control | Improve the predictability of construction and assist in discovering, identifying, and preventing risks [17]. Clash detection will reduce the probability of risk occurrence effectively [24]. |
| M6 | Multi-party communication | A huge knowledge gap of BIM has developed between senior professionals (architects, MEP designers, etc.) [44]. Effective communication and learning can avoid failure and meet expectations, cost increases, and delays [2]. |
| M7 | Staff training | Rather than training a Revit technician, a proper BIM draughtsman is more greatly needed in a MEP project [24], which requires longer training cycles for personnel. |
| M8 | Construction methods | Considering the MEP density, it plays a decisive role in the implementation of the project [45]. The construction sequence and method of each specialty should be comprehensively considered. |
Table 3.
Technical factors affecting labor productivity in BIM-enabled MEP installation.
| Number | Impact Factor | Instructions |
|---|---|---|
| T1 | BIM modeling accuracy | It includes modeling granularity, presentation method and accuracy, and the ability to update the model to reflect the construction status [37]. Modeling accuracy has an important impact on troubleshooting. A refined model can help find more problems through collision detection, but it also means an increase in time investment. |
| T2 | Data exchange and information sharing | A high concentration of information on one person may lead to a bottleneck in information flow, ultimately slowing down the entire project [23]. In MEP coordination, when information is exchanged with BIM, more information can be extracted with BIM than in a form of 2D drawings, paper documents, or verbal instructions [10]. |
| T3 | BIM software function | It includes the visualization of parameterized modeling, coordination of trades, calculation accuracy, simulation, optimization ability, modeling ability, and so on [14]. In addition to the most basic software Revit, MEP professional modeling also requires some other auxiliary plugins or software. |
| T4 | Data richness | A detailed level of data used to support the intended use of BIM [17]. |
| T5 | Technical requirement | Requirements for software, hardware, and network functionality to manage large-capacity 3D MEP files and images [38]. |
Table 4.
Personnel factors affecting labor productivity in BIM-enabled MEP installation.
| Number | Impact Factor | Instructions |
|---|---|---|
| P1 | Learning curve | Learning curve may determine their acceptability and capability in MEP projects [46], including their ability to learn software and their ability to adapt to new projects, etc. |
| P2 | Understanding of the project | Knowledge gap between architects and MEP engineer [44] will lead to misunderstanding of the project [31,47]. |
| P3 | Job assignment | Clear task assignments and specific responsibilities allocation are important factors affecting the effectiveness of BIM support for MEP coordination [25]. When a conflict occurs, it is necessary to immediately identify the responsible party and provide corresponding solutions. |
| P4 | Modeling experience | This will affect the number of rework and information requests [2]. Experienced modeling engineers may know where problems may occur and effectively avoid them at the beginning of the project. |
Table 5.
Average random consistency value of .
| n | 1 | 2 | 3 | 4 | 5 | 6 | 7 | 8 |
|---|---|---|---|---|---|---|---|---|
| 0 | 0 | 0.52 | 0.89 | 1.12 | 1.26 | 1.36 | 1.41 |
Table 6.
Profiles of the respondents.
| Characteristics | Categories | Owner | Designer | Contractor | Researcher | Consultant |
|---|---|---|---|---|---|---|
| Gender | Male | 2 | 3 | 12 | 6 | 1 |
| Female | 0 | 2 | 2 | 4 | 0 | |
| Position | Manager | 2 | 1 | 3 | 0 | 0 |
| Designer | 0 | 4 | 0 | 0 | 0 | |
| Engineering | 0 | 0 | 11 | 0 | 1 | |
| Researcher | 0 | 0 | 0 | 10 | 0 | |
| Experience (Years) | 1–5 | 0 | 1 | 0 | 2 | 0 |
| 6–10 | 2 | 3 | 8 | 5 | 1 | |
| 10–20 | 0 | 1 | 5 | 2 | 0 | |
| >20 | 0 | 0 | 1 | 1 | 0 | |
| BIM experience (No. of projects) | 1–3 | 0 | 1 | 6 | 2 | 1 |
| 3–5 | 2 | 3 | 7 | 6 | 0 | |
| >5 | 0 | 1 | 1 | 2 | 0 | |
| MEP experience (No. of projects) | 1–3 | 1 | 3 | 7 | 6 | 1 |
| 3–5 | 1 | 2 | 3 | 3 | 0 | |
| >5 | 0 | 0 | 4 | 1 | 0 | |
| Frequency | 32 | 2 | 5 | 14 | 10 | 1 |
| Percentage | 100% | 6.3% | 15.6% | 43.7% | 31.3% | 3.1% |
Table 7.
Judgment matrix of category-level factors.
| Organizational Factors | Management Factors | Technical Factors | Personnel Factors | |
|---|---|---|---|---|
| Organizational Factors | 1 | 1.7368 | 2.1667 | 2.6111 |
| Management Factors | 1 | 2.3158 | 2.5556 | |
| Technical Factors | 1 | 2.4286 | ||
| Personnel Factors | 1 |
Table 8.
Judgment matrix of organizational factors.
| O1 | O2 | O3 | O4 | O5 | O6 | O7 | |
|---|---|---|---|---|---|---|---|
| O1 | 1 | 2.2308 | 2.1667 | 1.6667 | 2.0000 | 2.8750 | 2.3571 |
| O2 | 1 | 2.5556 | 3.1250 | 3.3750 | 2.2941 | 2.6875 | |
| O3 | 1 | 2.3333 | 2.0000 | 2.5000 | 2.5385 | ||
| O4 | 1 | 1.8462 | 2.1875 | 2.5000 | |||
| O5 | 1 | 2.3125 | 2.2941 | ||||
| O6 | 1 | 1.8125 | |||||
| O7 | 1 |
Table 9.
Judgment matrix of management factors.
| M1 | M2 | M3 | M4 | M5 | M6 | M7 | M8 | |
|---|---|---|---|---|---|---|---|---|
| M1 | 1 | 2.4706 | 3.1053 | 2.1429 | 2.6667 | 2.2353 | 3.5625 | 2.3750 |
| M2 | 1 | 2.3571 | 1.6154 | 2.4286 | 2.3333 | 2.6250 | 2.4286 | |
| M3 | 1 | 2.0000 | 1.7500 | 1.1429 | 2.0000 | 1.4000 | ||
| M4 | 1 | 1.5000 | 2.1176 | 3.0000 | 2.3333 | |||
| M5 | 1 | 3.0000 | 2.8500 | 3.0714 | ||||
| M6 | 1 | 2.3889 | 1.8667 | |||||
| M7 | 1 | 1.5714 | ||||||
| M8 | 1 |
Table 10.
Judgment matrix of technical factors.
| T1 | T2 | T3 | T4 | T5 | |
|---|---|---|---|---|---|
| T1 | 1 | 1.4000 | 2.6875 | 1.6667 | 1.9000 |
| T2 | 1 | 3.2222 | 2.0000 | 2.3846 | |
| T3 | 1 | 1.1250 | 2.0909 | ||
| T4 | 1 | 2.4167 | |||
| T5 | 1 |
Table 11.
Judgment matrix of personnel factors.
| P1 | P2 | P3 | P4 | |
|---|---|---|---|---|
| P1 | 1 | 1.4286 | 1.8333 | 2.8333 |
| P2 | 1 | 2.4615 | 2.0526 | |
| P3 | 1 | 1.6154 | ||
| P4 | 1 |
Table 12.
Weights of each factor in consistency tests.
| Category | C.R. | Total Weight | Factor-Level | Weight | Synthesis Weight |
|---|---|---|---|---|---|
| O | 0.0584 | 0.3931 | O1 | 0.2462 | 0.0968 |
| O2 | 0.2349 | 0.0923 | |||
| O3 | 0.1595 | 0.0627 | |||
| O4 | 0.1262 | 0.0496 | |||
| O5 | 0.0997 | 0.0392 | |||
| O6 | 0.0659 | 0.0259 | |||
| O7 | 0.0676 | 0.0266 | |||
| M | 0.0563 | 0.3023 | M1 | 0.2523 | 0.0763 |
| M2 | 0.1771 | 0.0535 | |||
| M3 | 0.1184 | 0.0358 | |||
| M4 | 0.1270 | 0.0384 | |||
| M5 | 0.1231 | 0.0372 | |||
| M6 | 0.0868 | 0.0262 | |||
| M7 | 0.0560 | 0.0169 | |||
| M8 | 0.0593 | 0.0179 | |||
| T | 0.0451 | 0.1910 | T1 | 0.2969 | 0.0567 |
| T2 | 0.2906 | 0.0555 | |||
| T3 | 0.1434 | 0.0274 | |||
| T4 | 0.1680 | 0.0321 | |||
| T5 | 0.1011 | 0.0193 | |||
| P | 0.0204 | 0.1136 | P1 | 0.3756 | 0.0427 |
| P2 | 0.3151 | 0.0358 | |||
| P3 | 0.1792 | 0.0204 | |||
| P4 | 0.1301 | 0.0148 |
Publisher’s Note: MDPI stays neutral with regard to jurisdictional claims in published maps and institutional affiliations. |
© 2022 by the authors. Licensee MDPI, Basel, Switzerland. This article is an open access article distributed under the terms and conditions of the Creative Commons Attribution (CC BY) license (https://creativecommons.org/licenses/by/4.0/).
Share and Cite
MDPI and ACS Style
Wu, Q.; Chen, L.; Shi, P.; Wang, W.; Xu, S. Identifying Impact Factors of MEP Installation Productivity: An Empirical Study. Buildings 2022, 12, 565. https://doi.org/10.3390/buildings12050565
AMA Style
Wu Q, Chen L, Shi P, Wang W, Xu S. Identifying Impact Factors of MEP Installation Productivity: An Empirical Study. Buildings. 2022; 12(5):565. https://doi.org/10.3390/buildings12050565
Chicago/Turabian StyleWu, Qinglin, Lijuan Chen, Peixin Shi, Weijun Wang, and Sheng Xu. 2022. "Identifying Impact Factors of MEP Installation Productivity: An Empirical Study" Buildings 12, no. 5: 565. https://doi.org/10.3390/buildings12050565
Note that from the first issue of 2016, this journal uses article numbers instead of page numbers. See further details here.