
Design Optimisation of Fixed and Adaptive Shading Devices on Four Façade Orientations of a High-Rise Office Building in the Tropics

 , , , and
Abstract
:1. Introduction
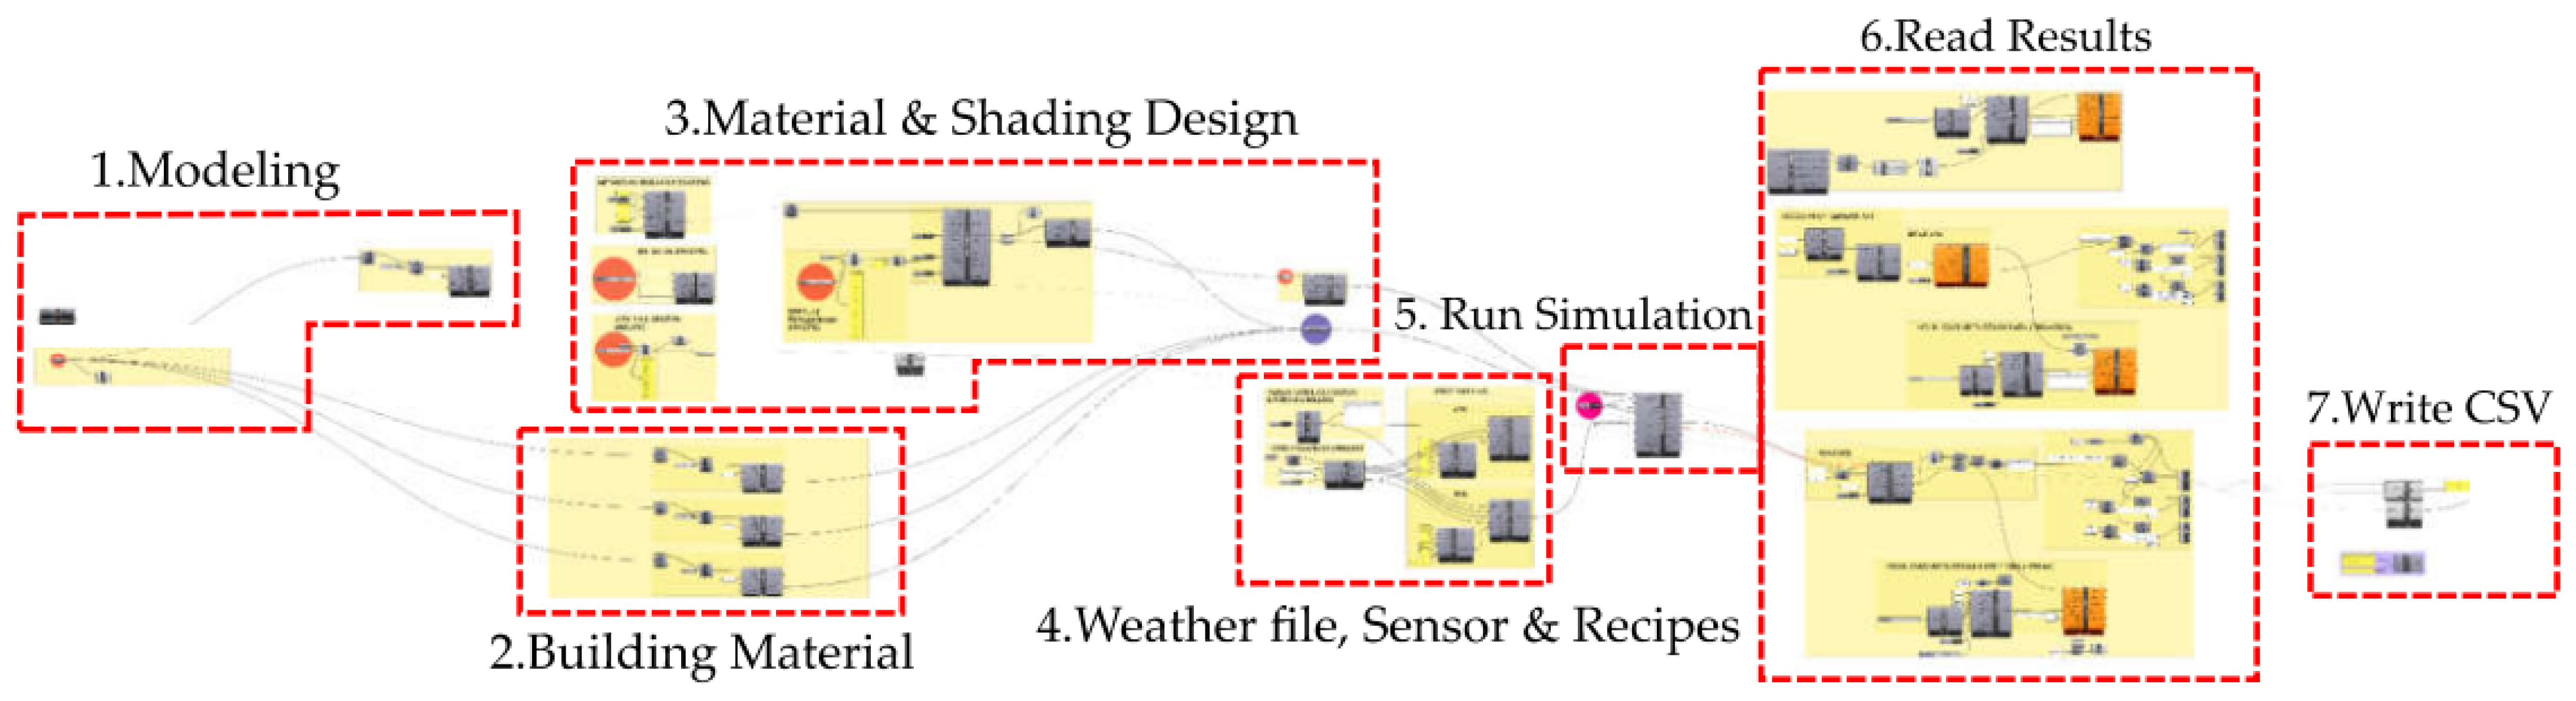
2. Methods
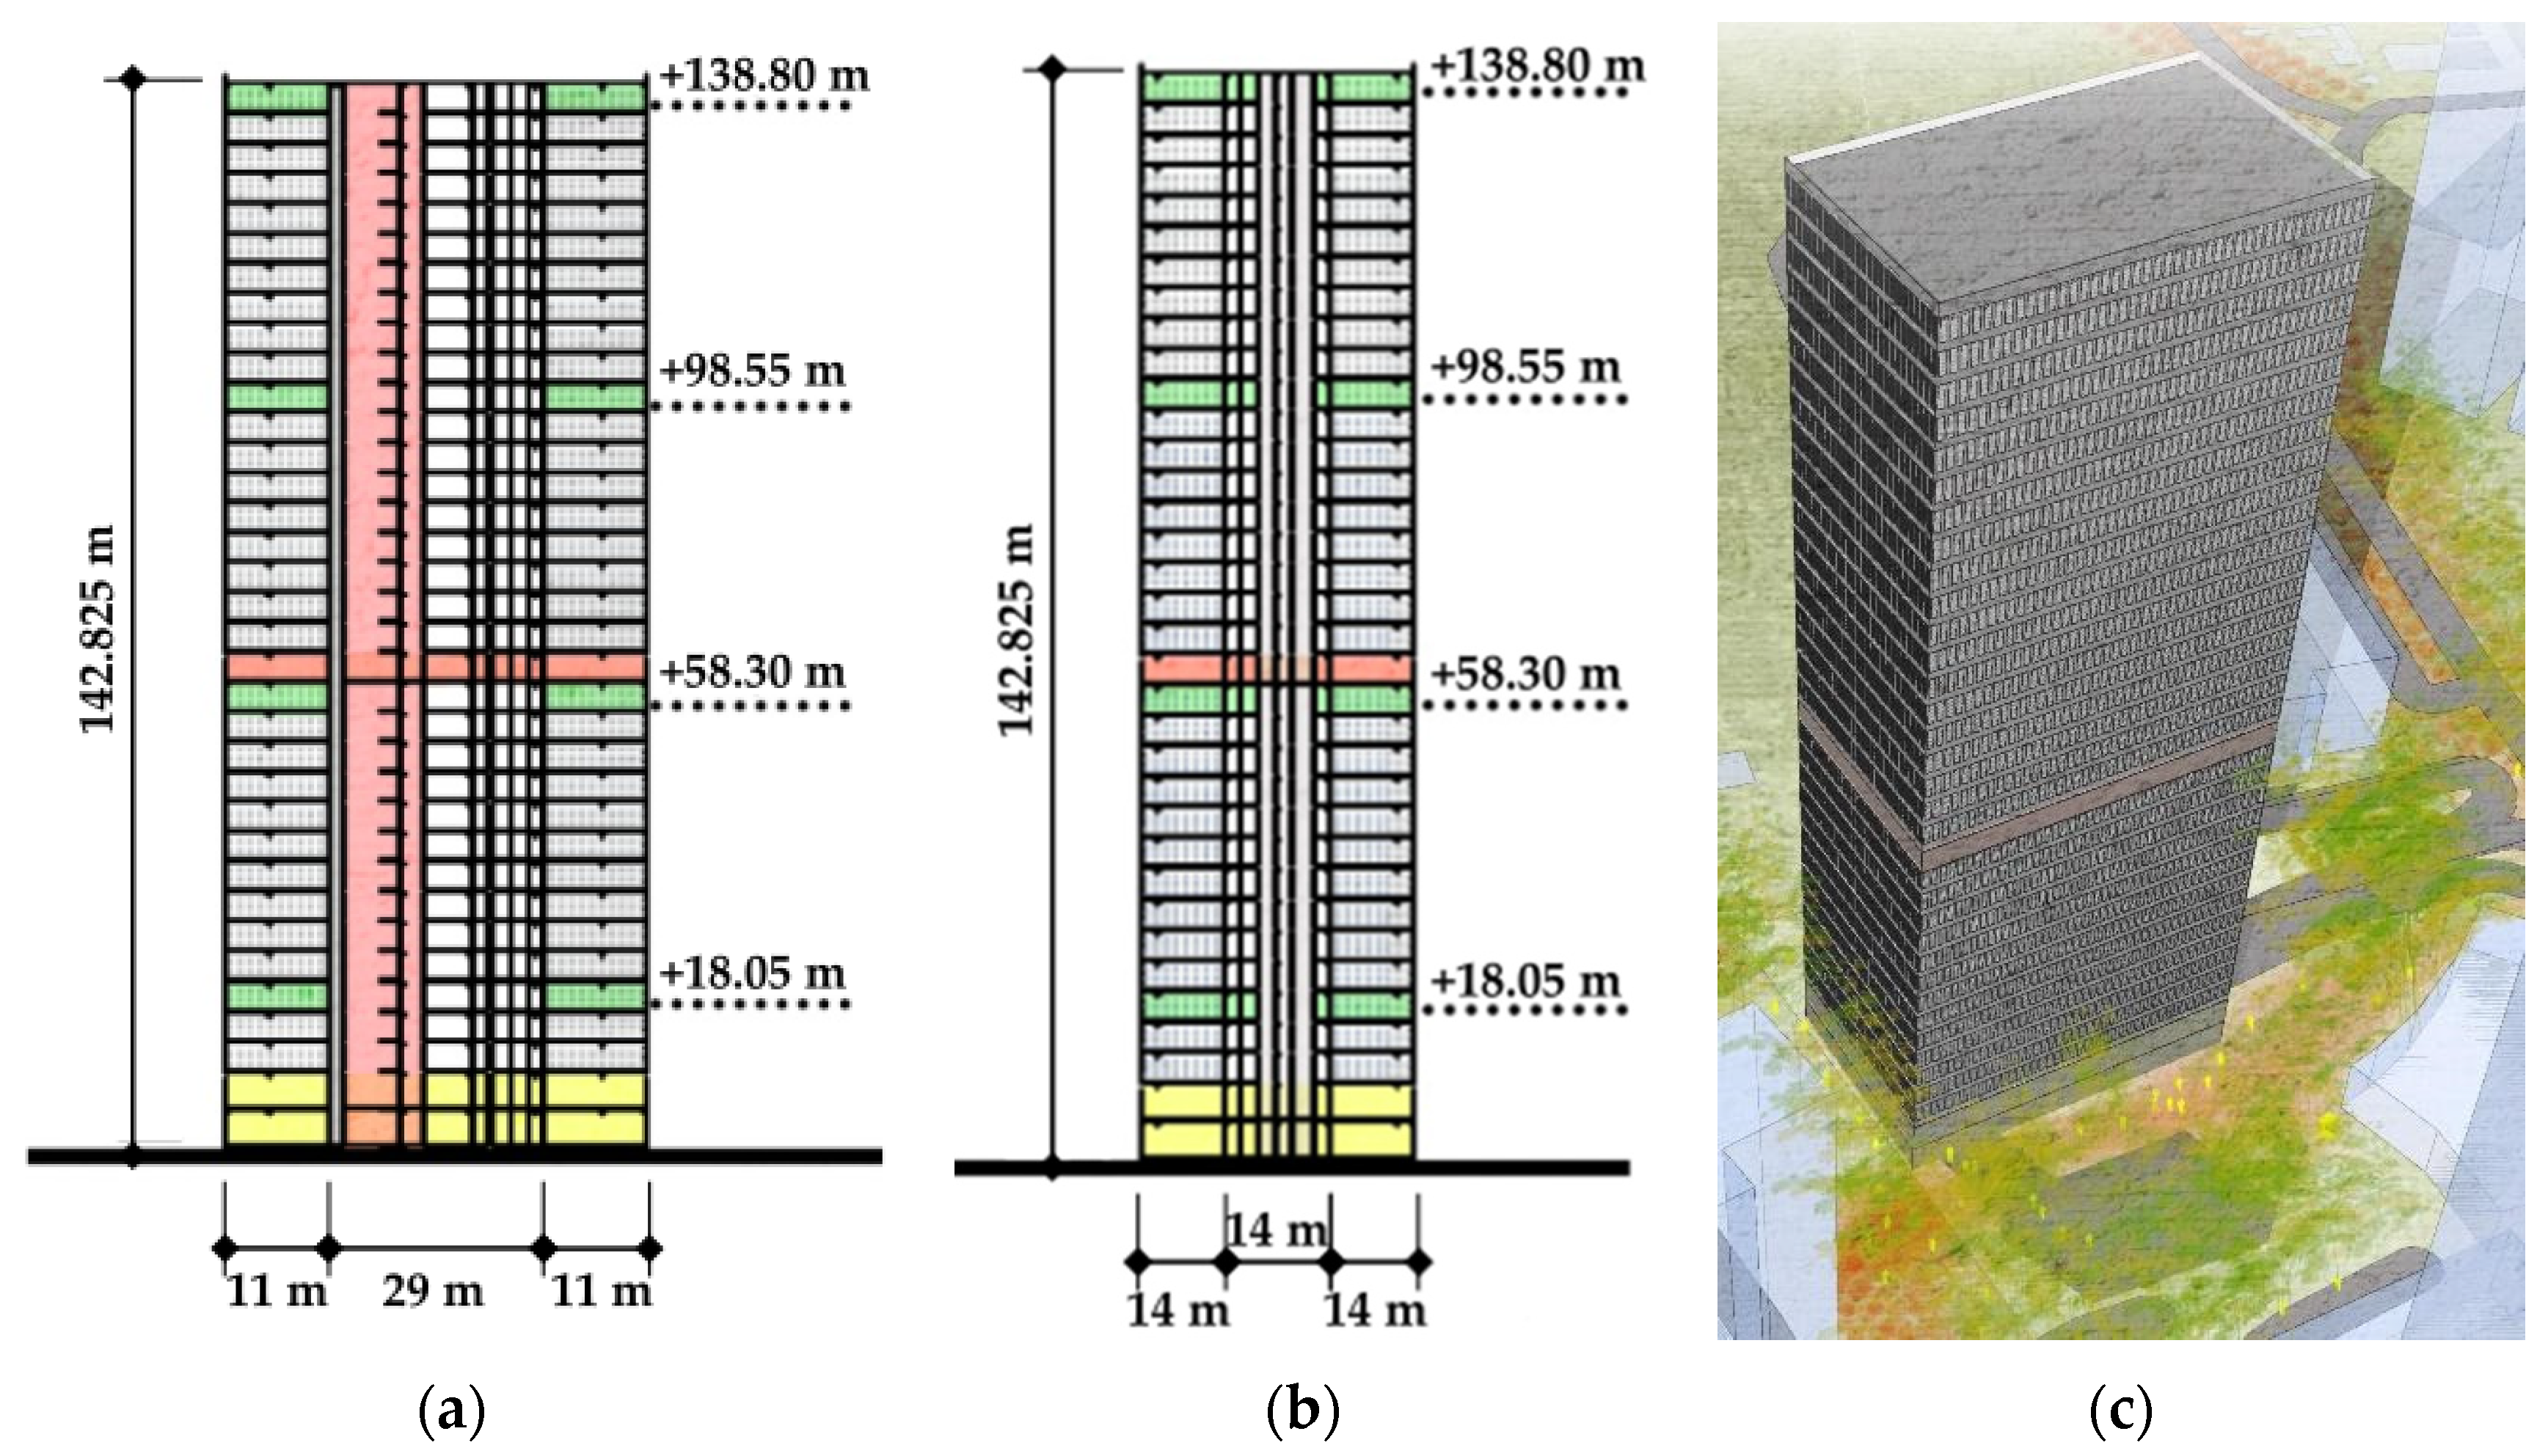
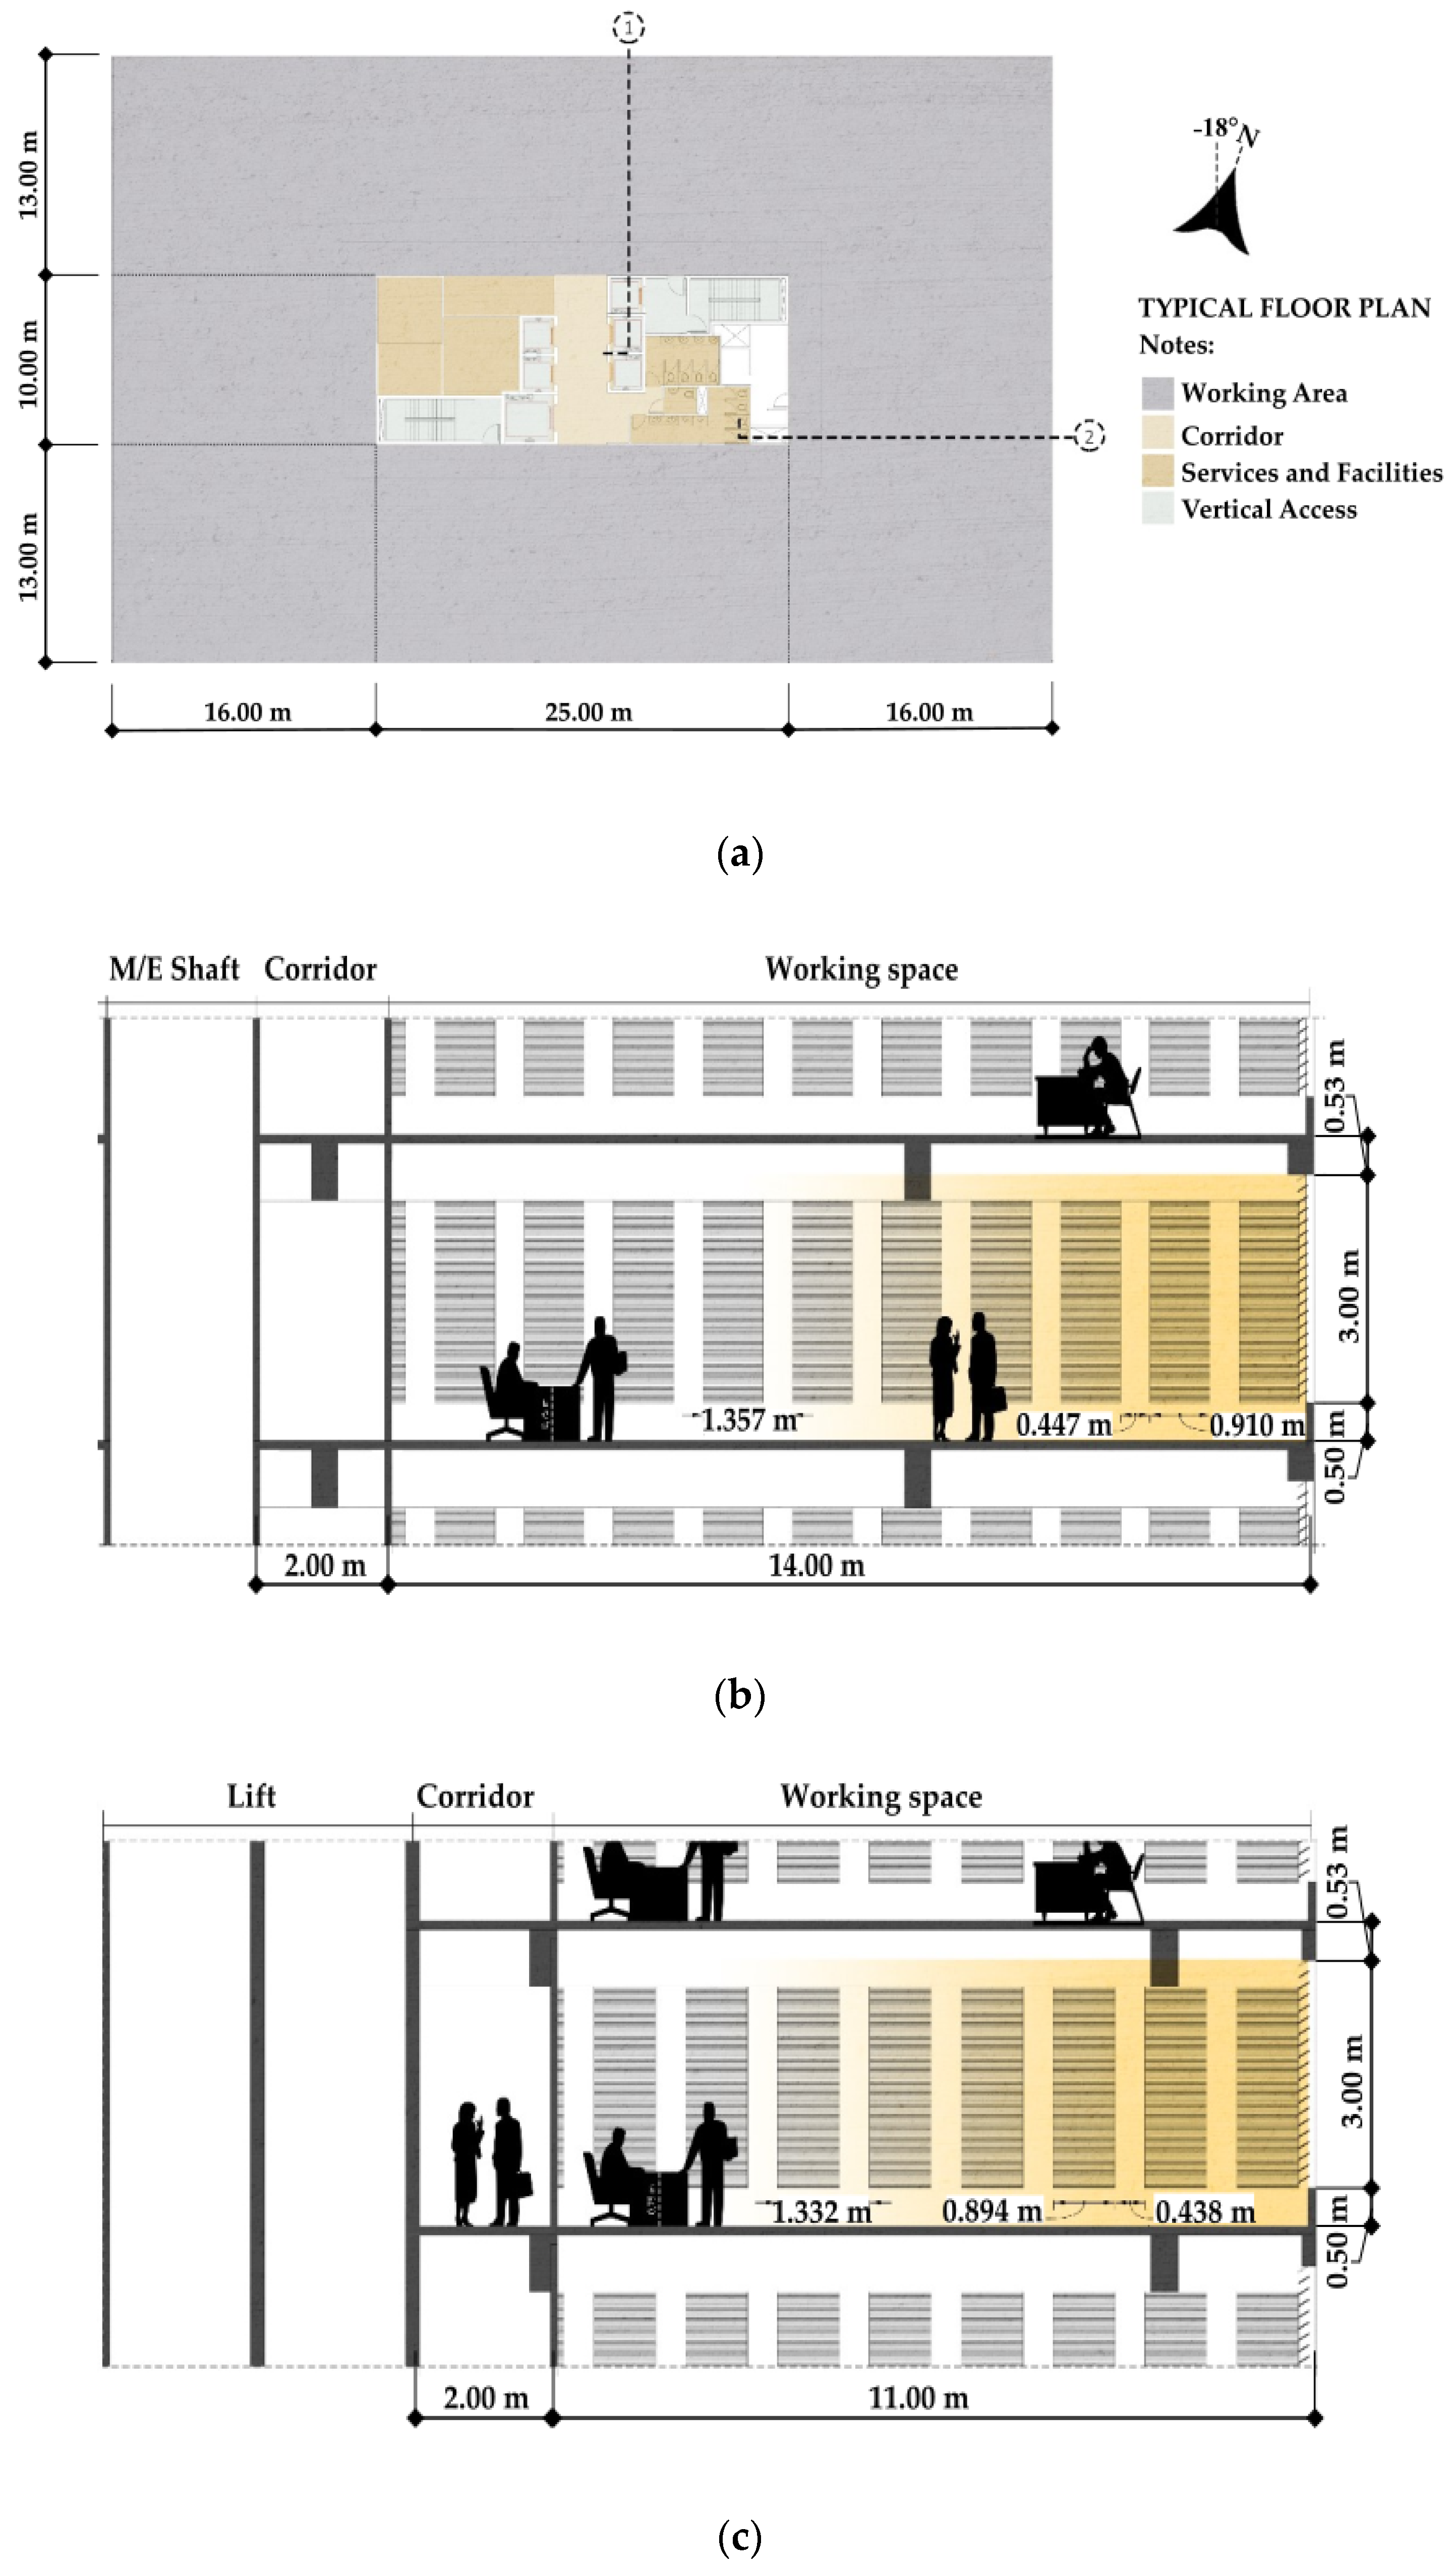
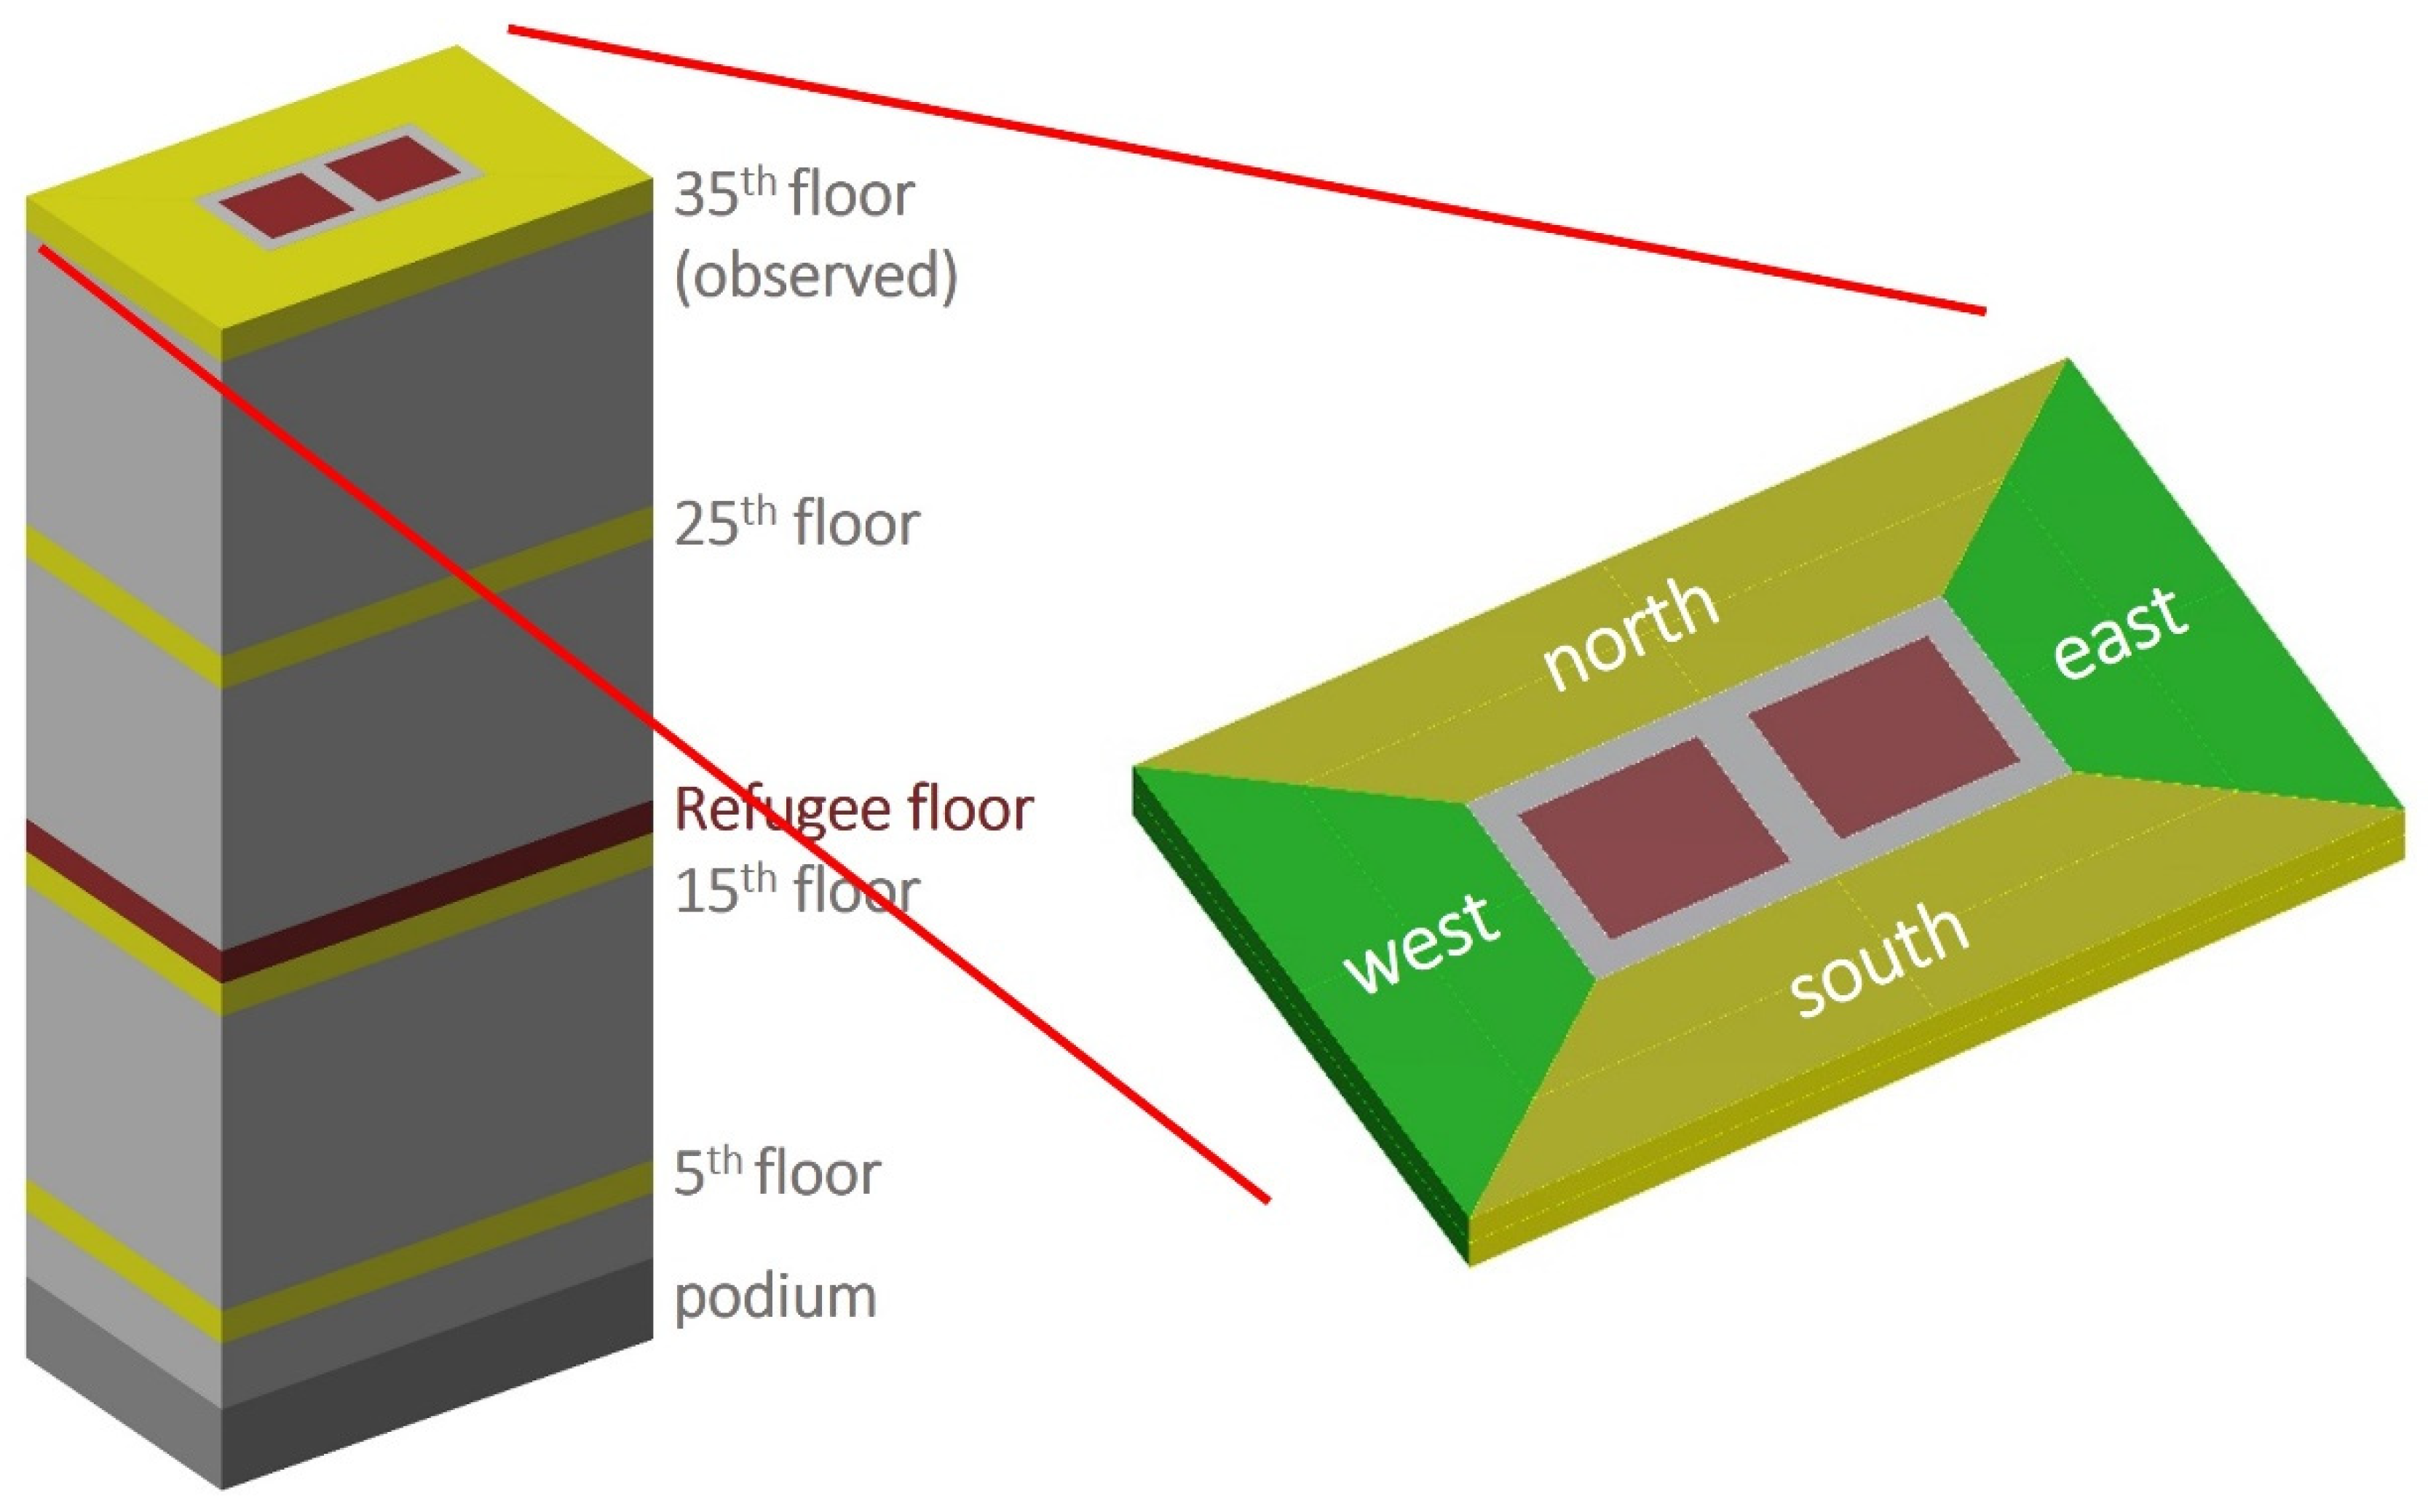
2.1. Baseline Scenario
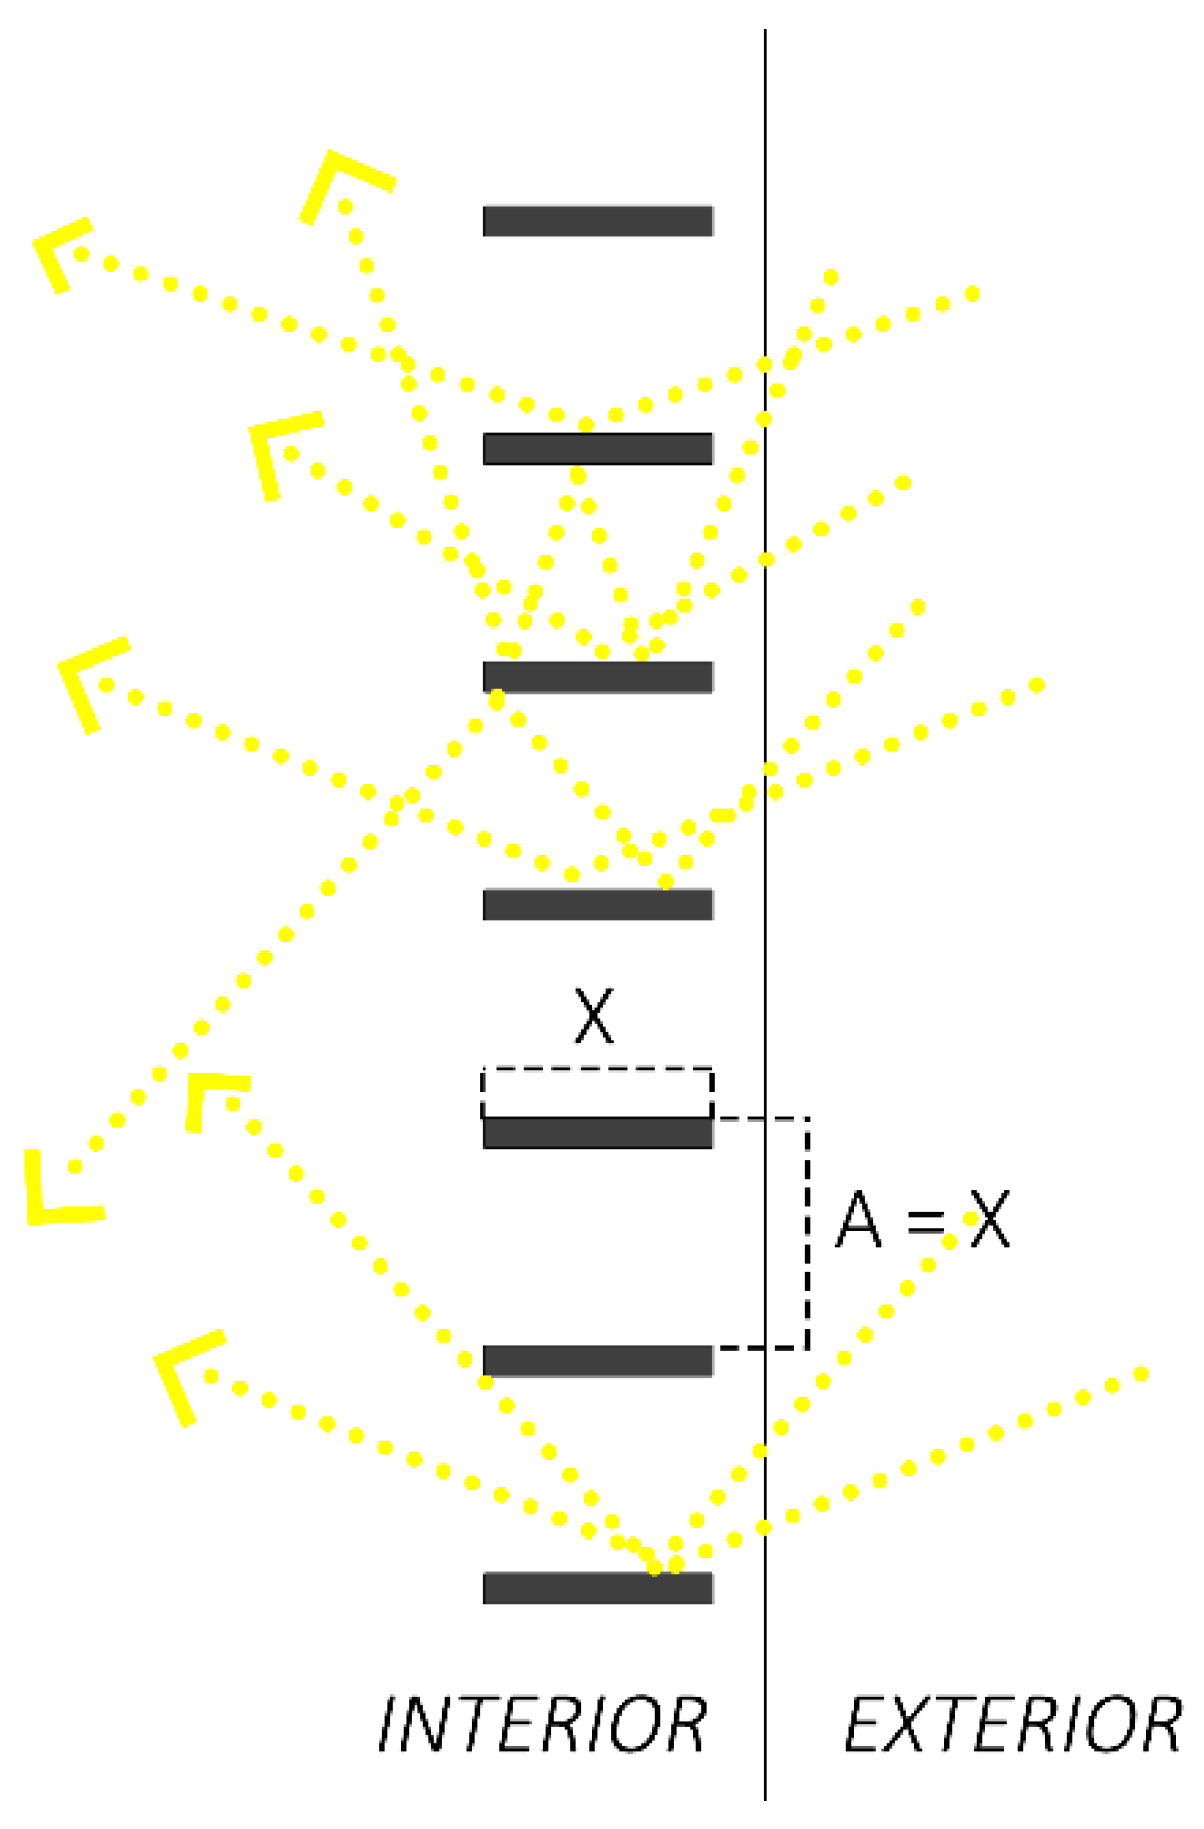
2.2. Fixed Shading Design Option
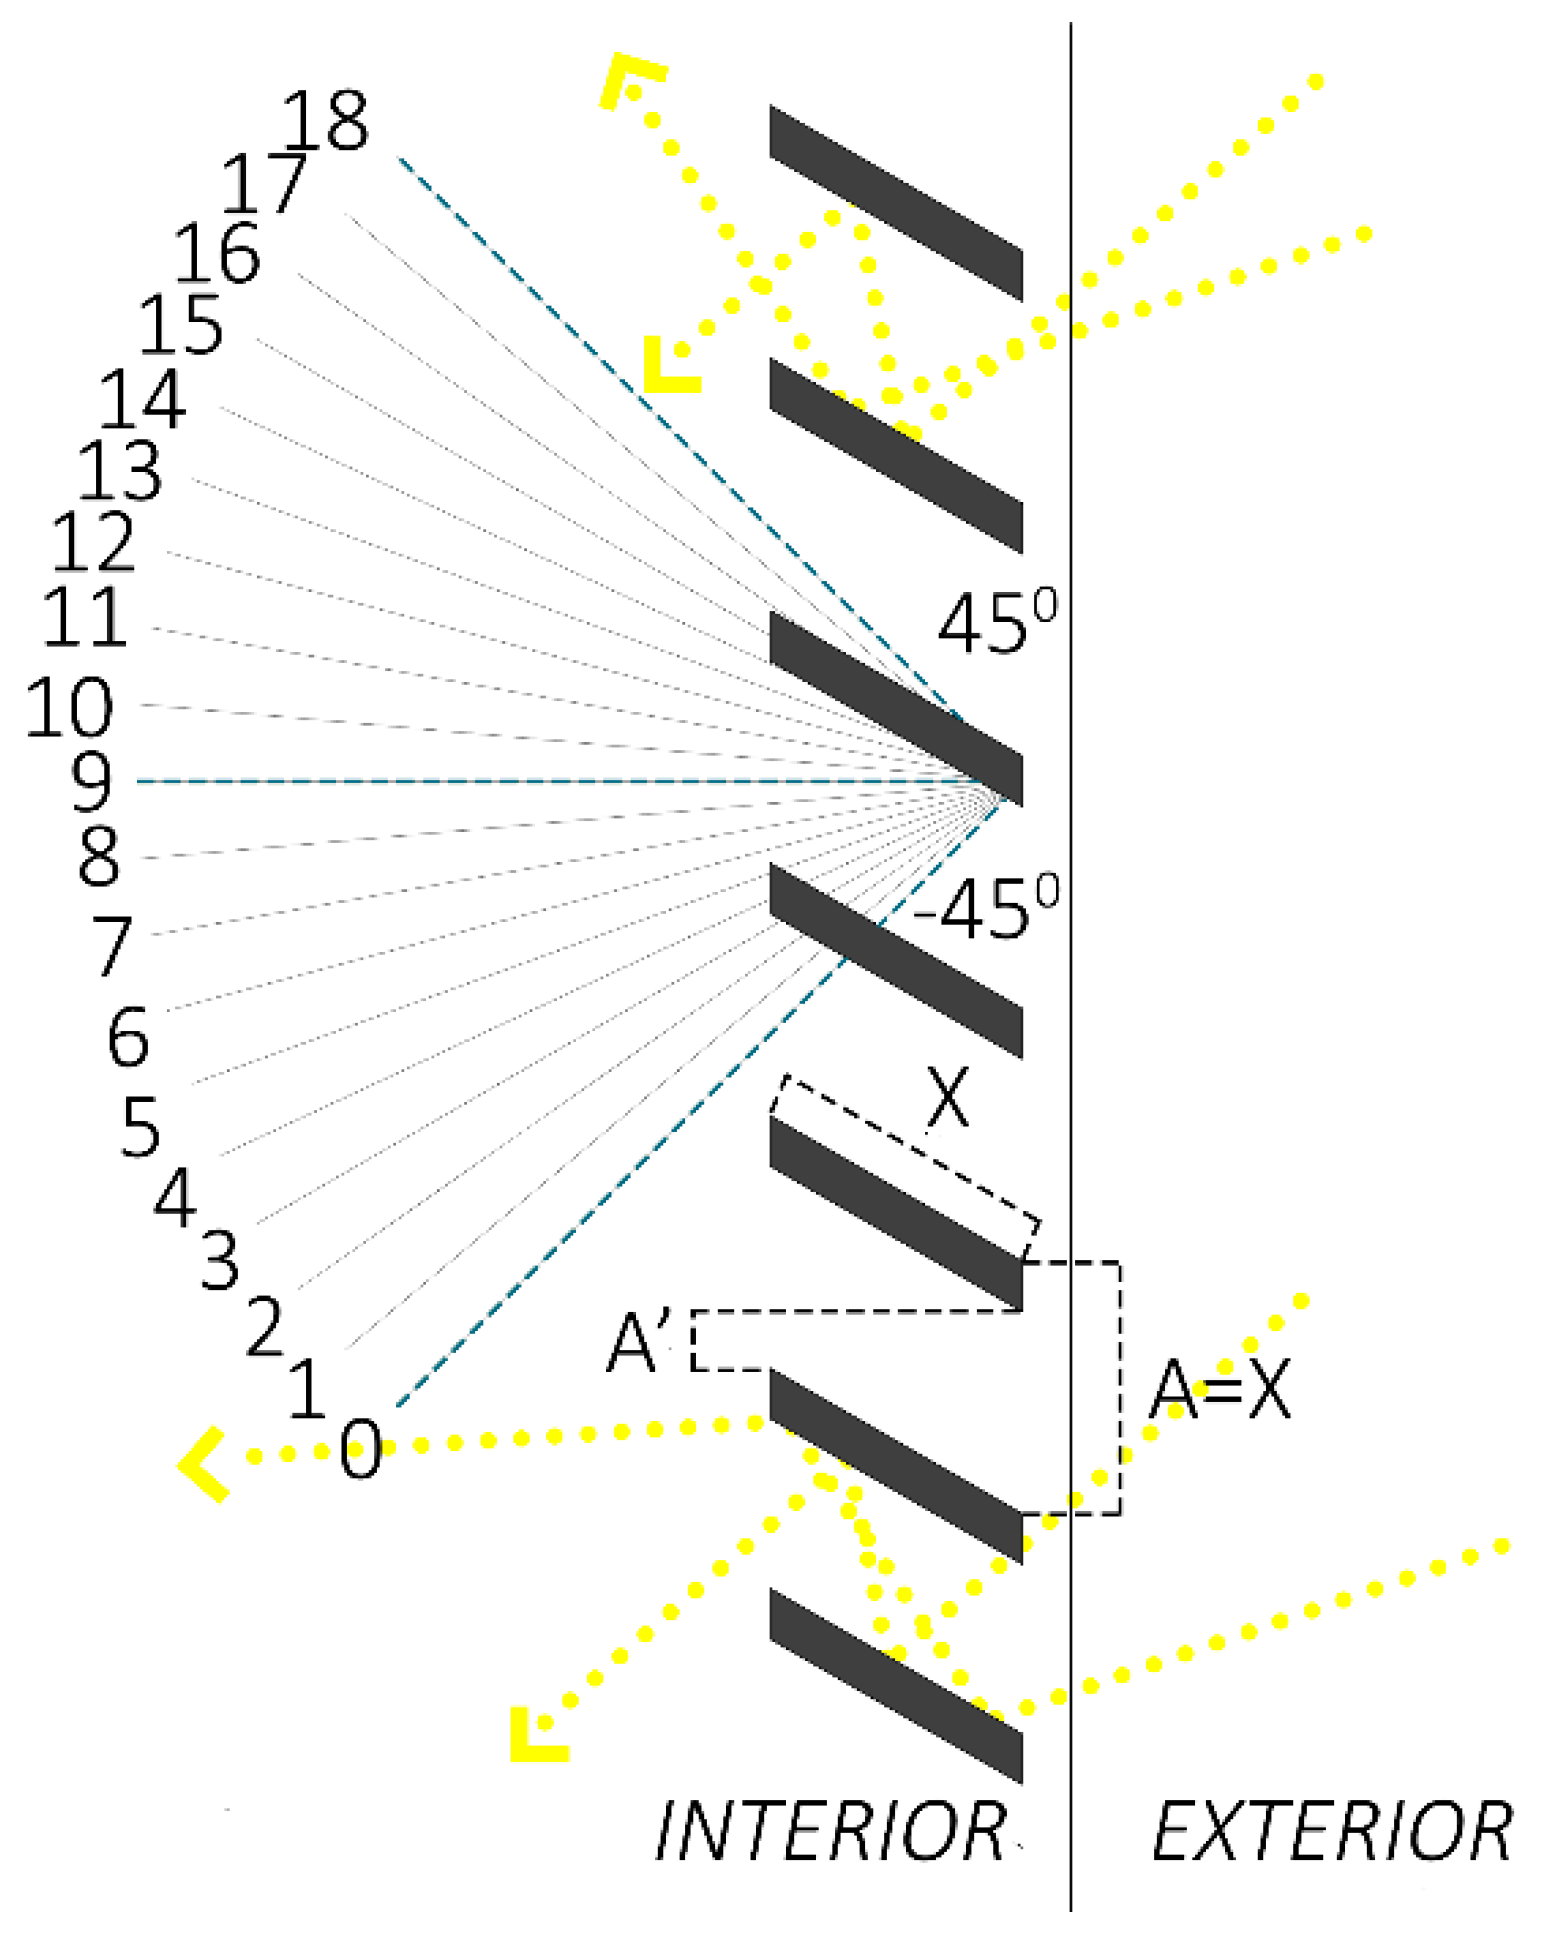
2.3. Adaptive Shading Design Option
3. Results
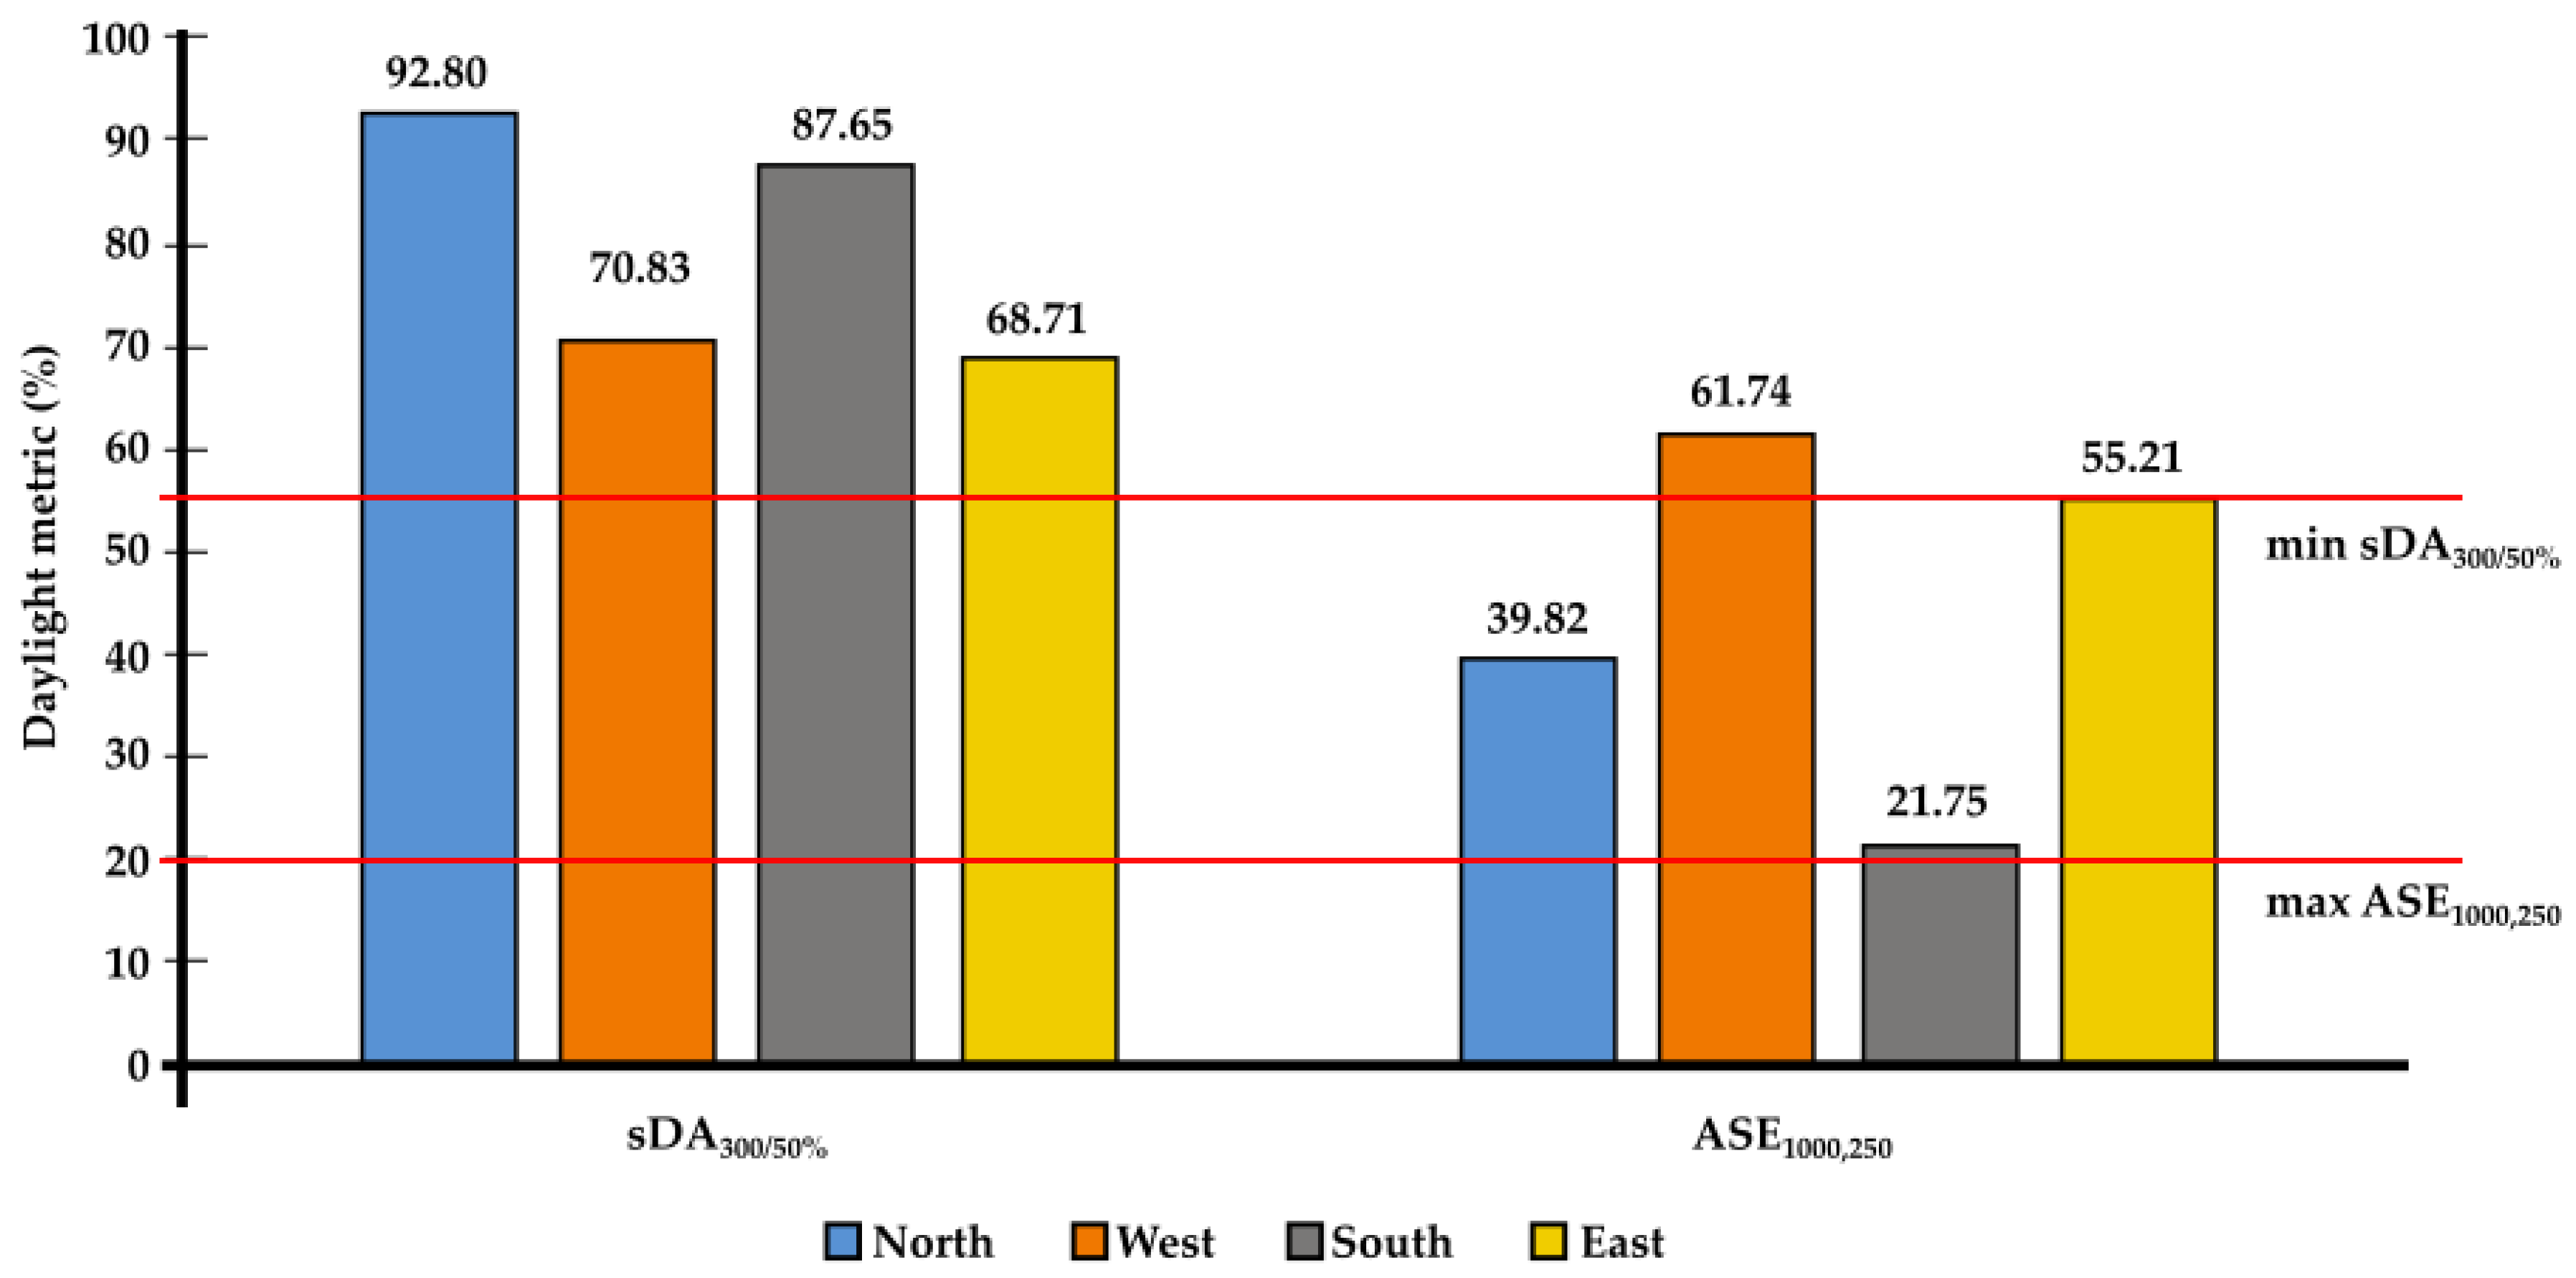
3.1. Baseline Scenario
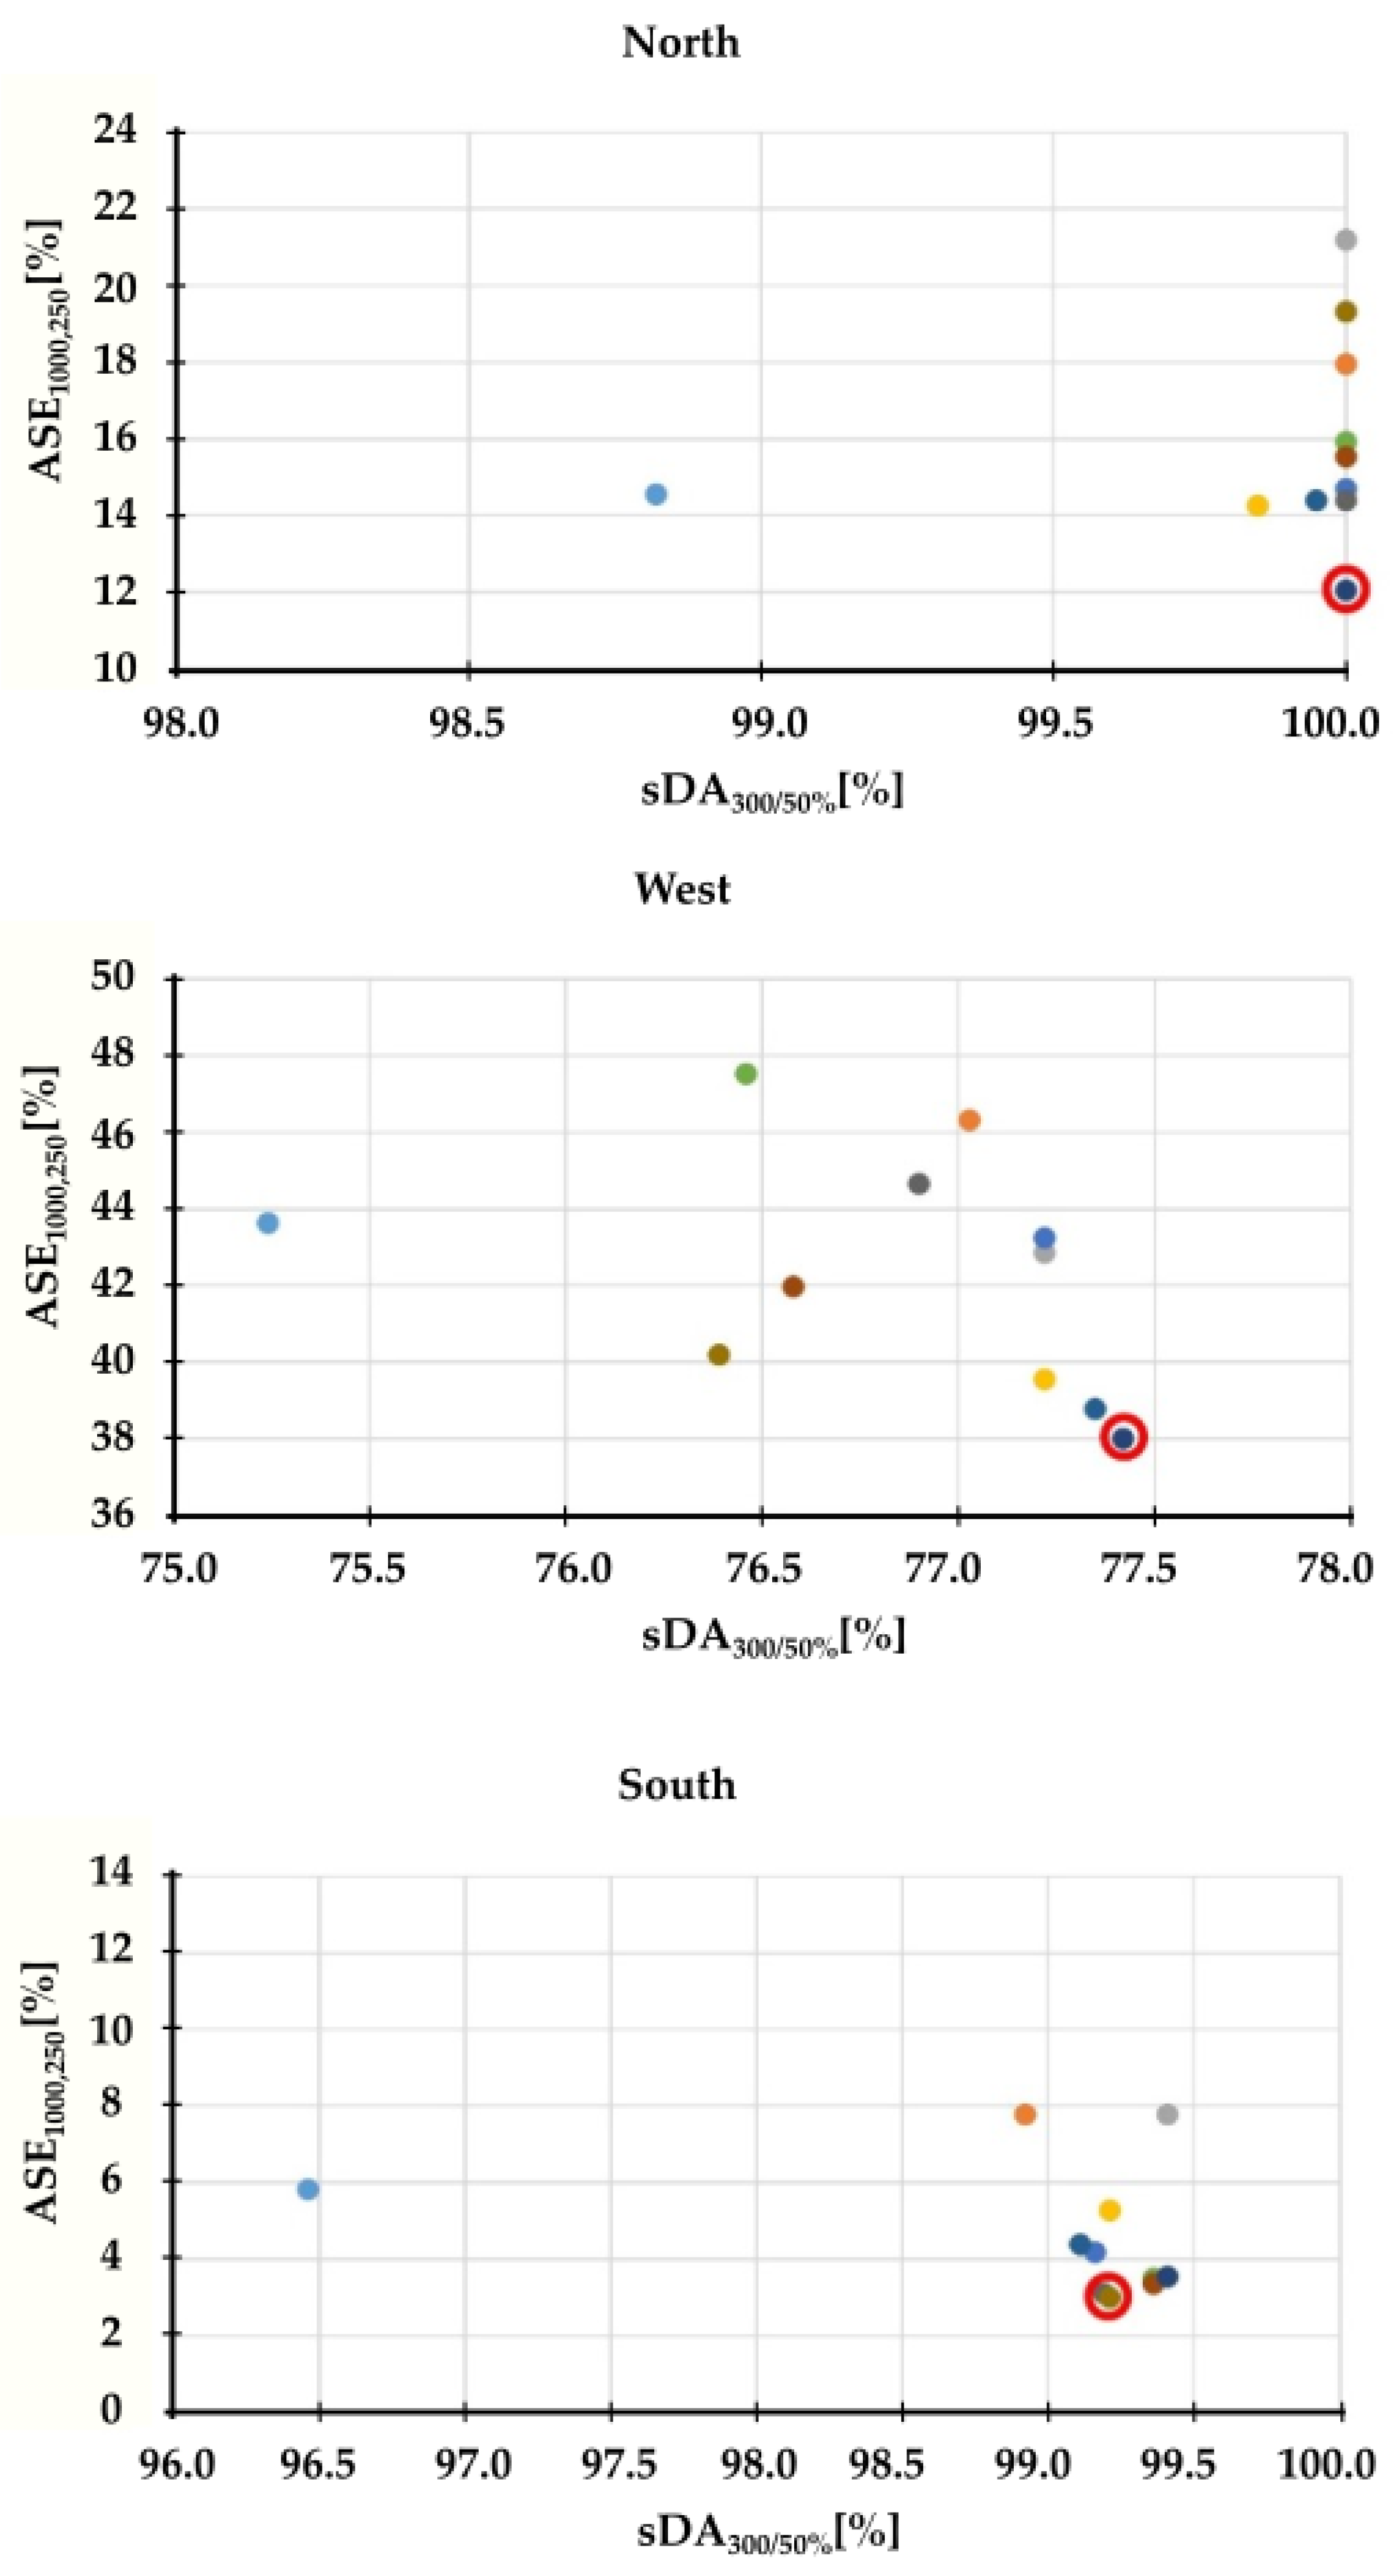
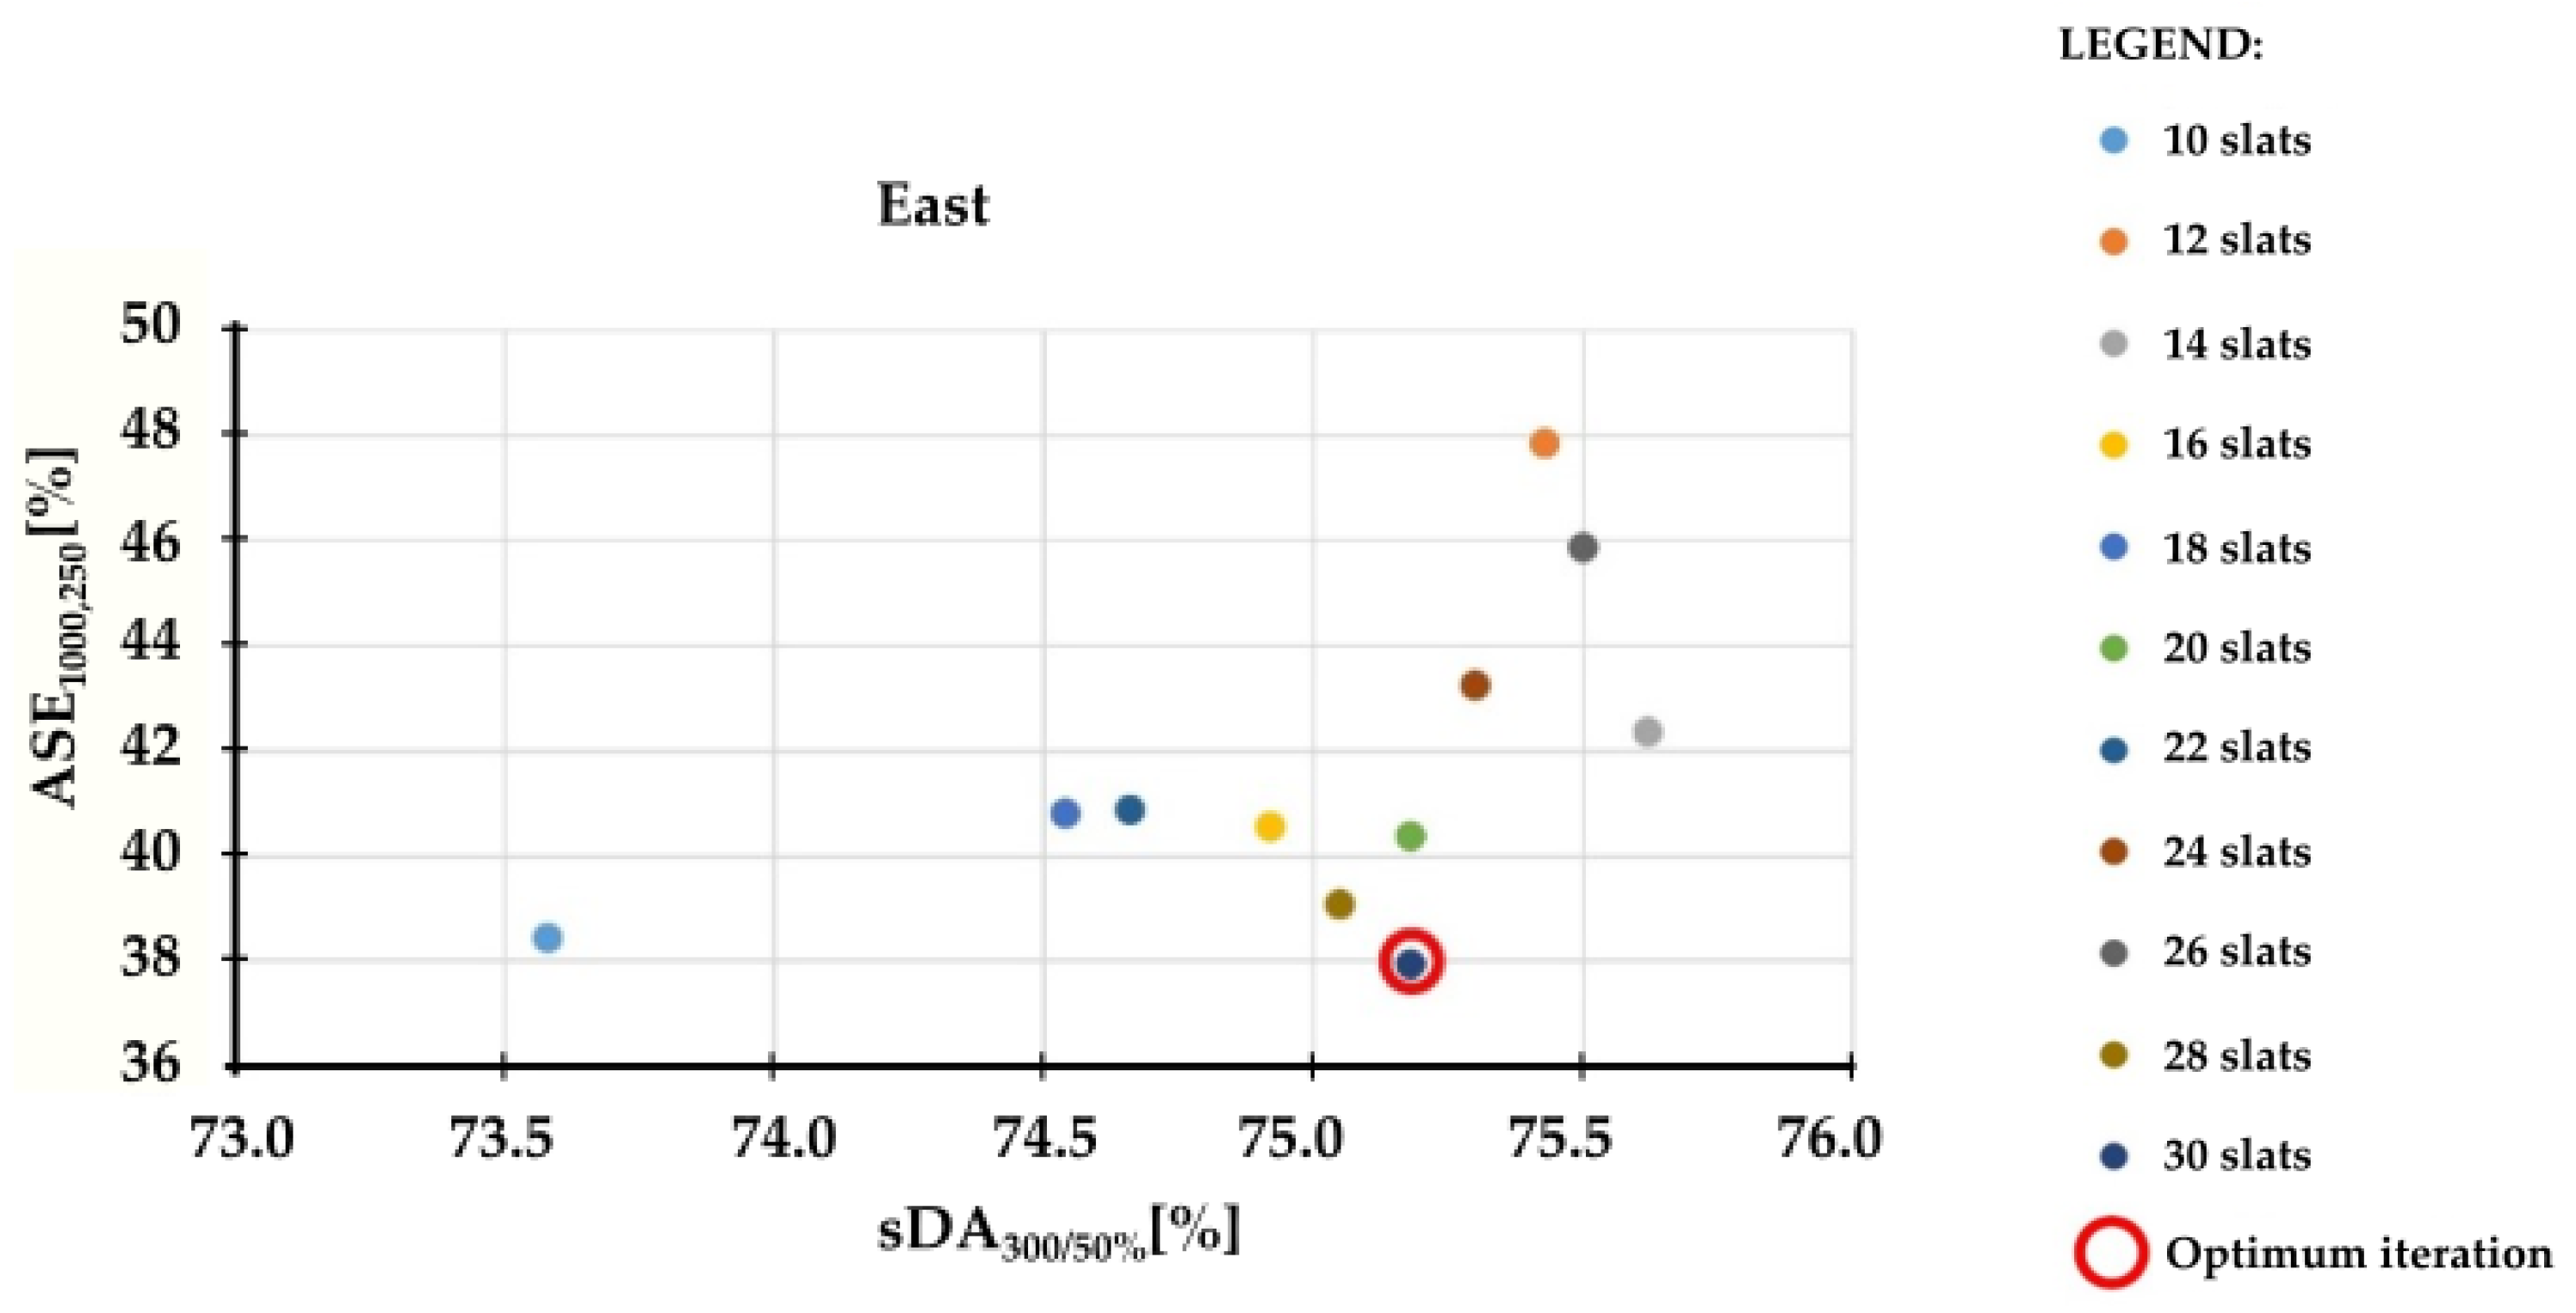
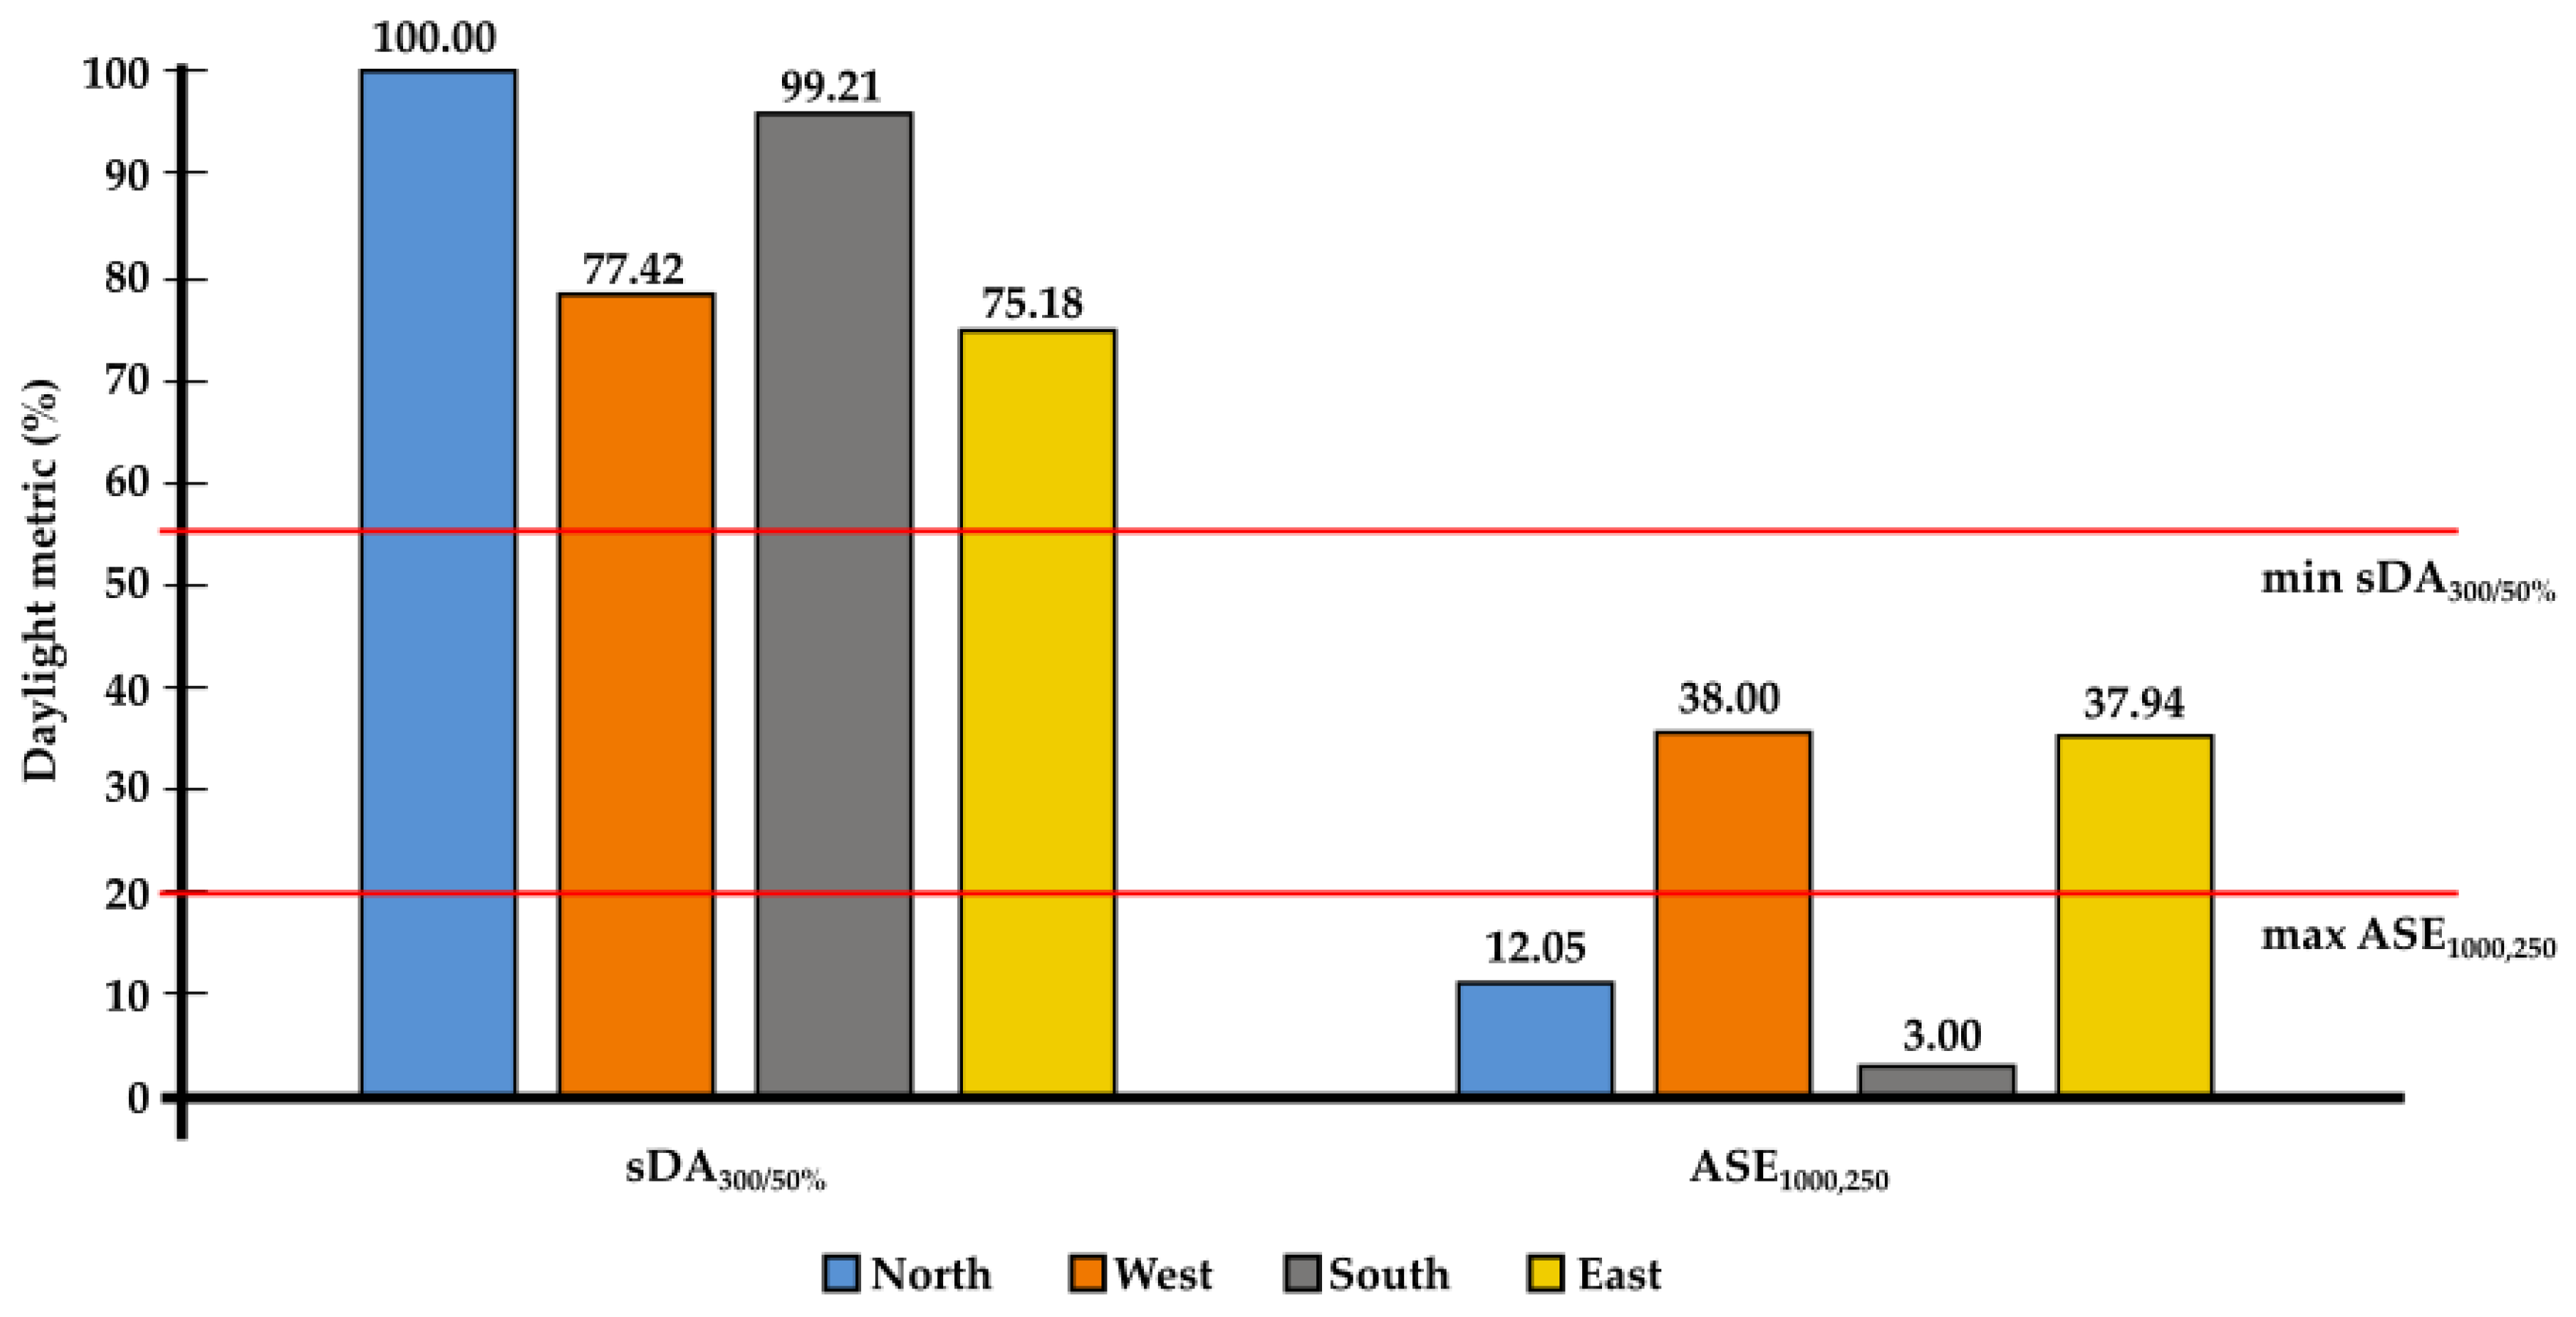
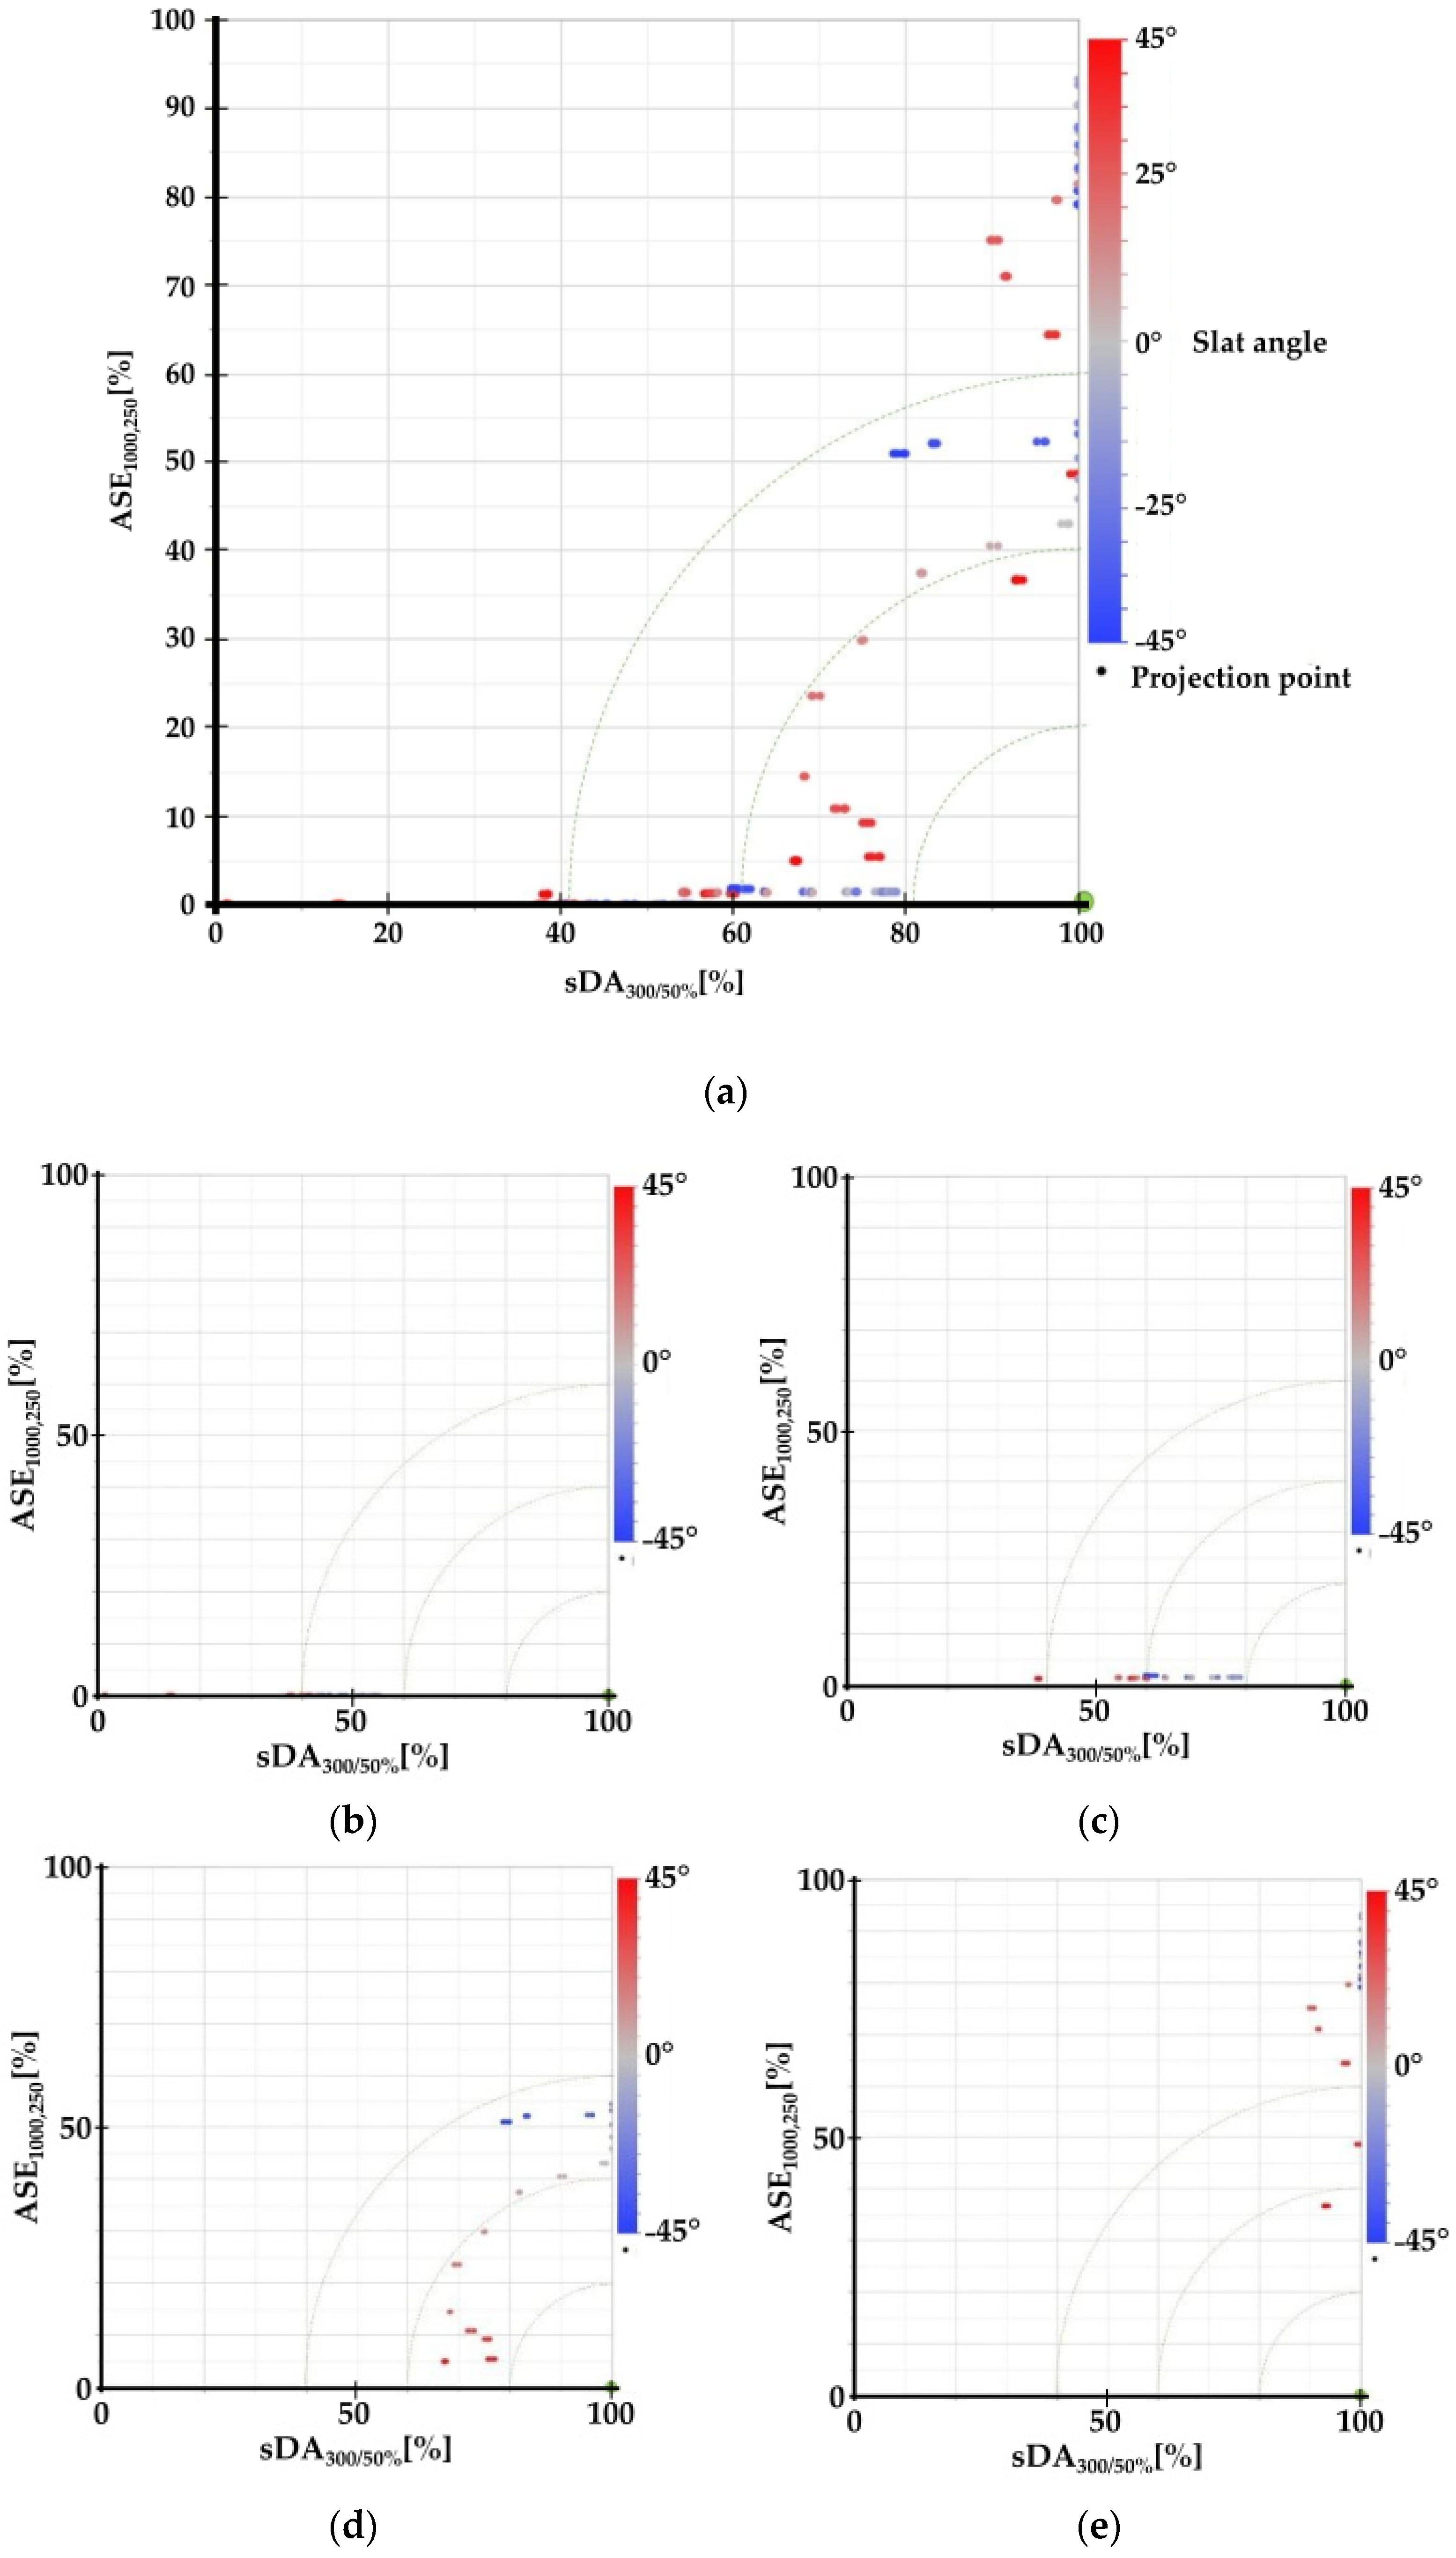
3.2. Fixed Shading Design Option
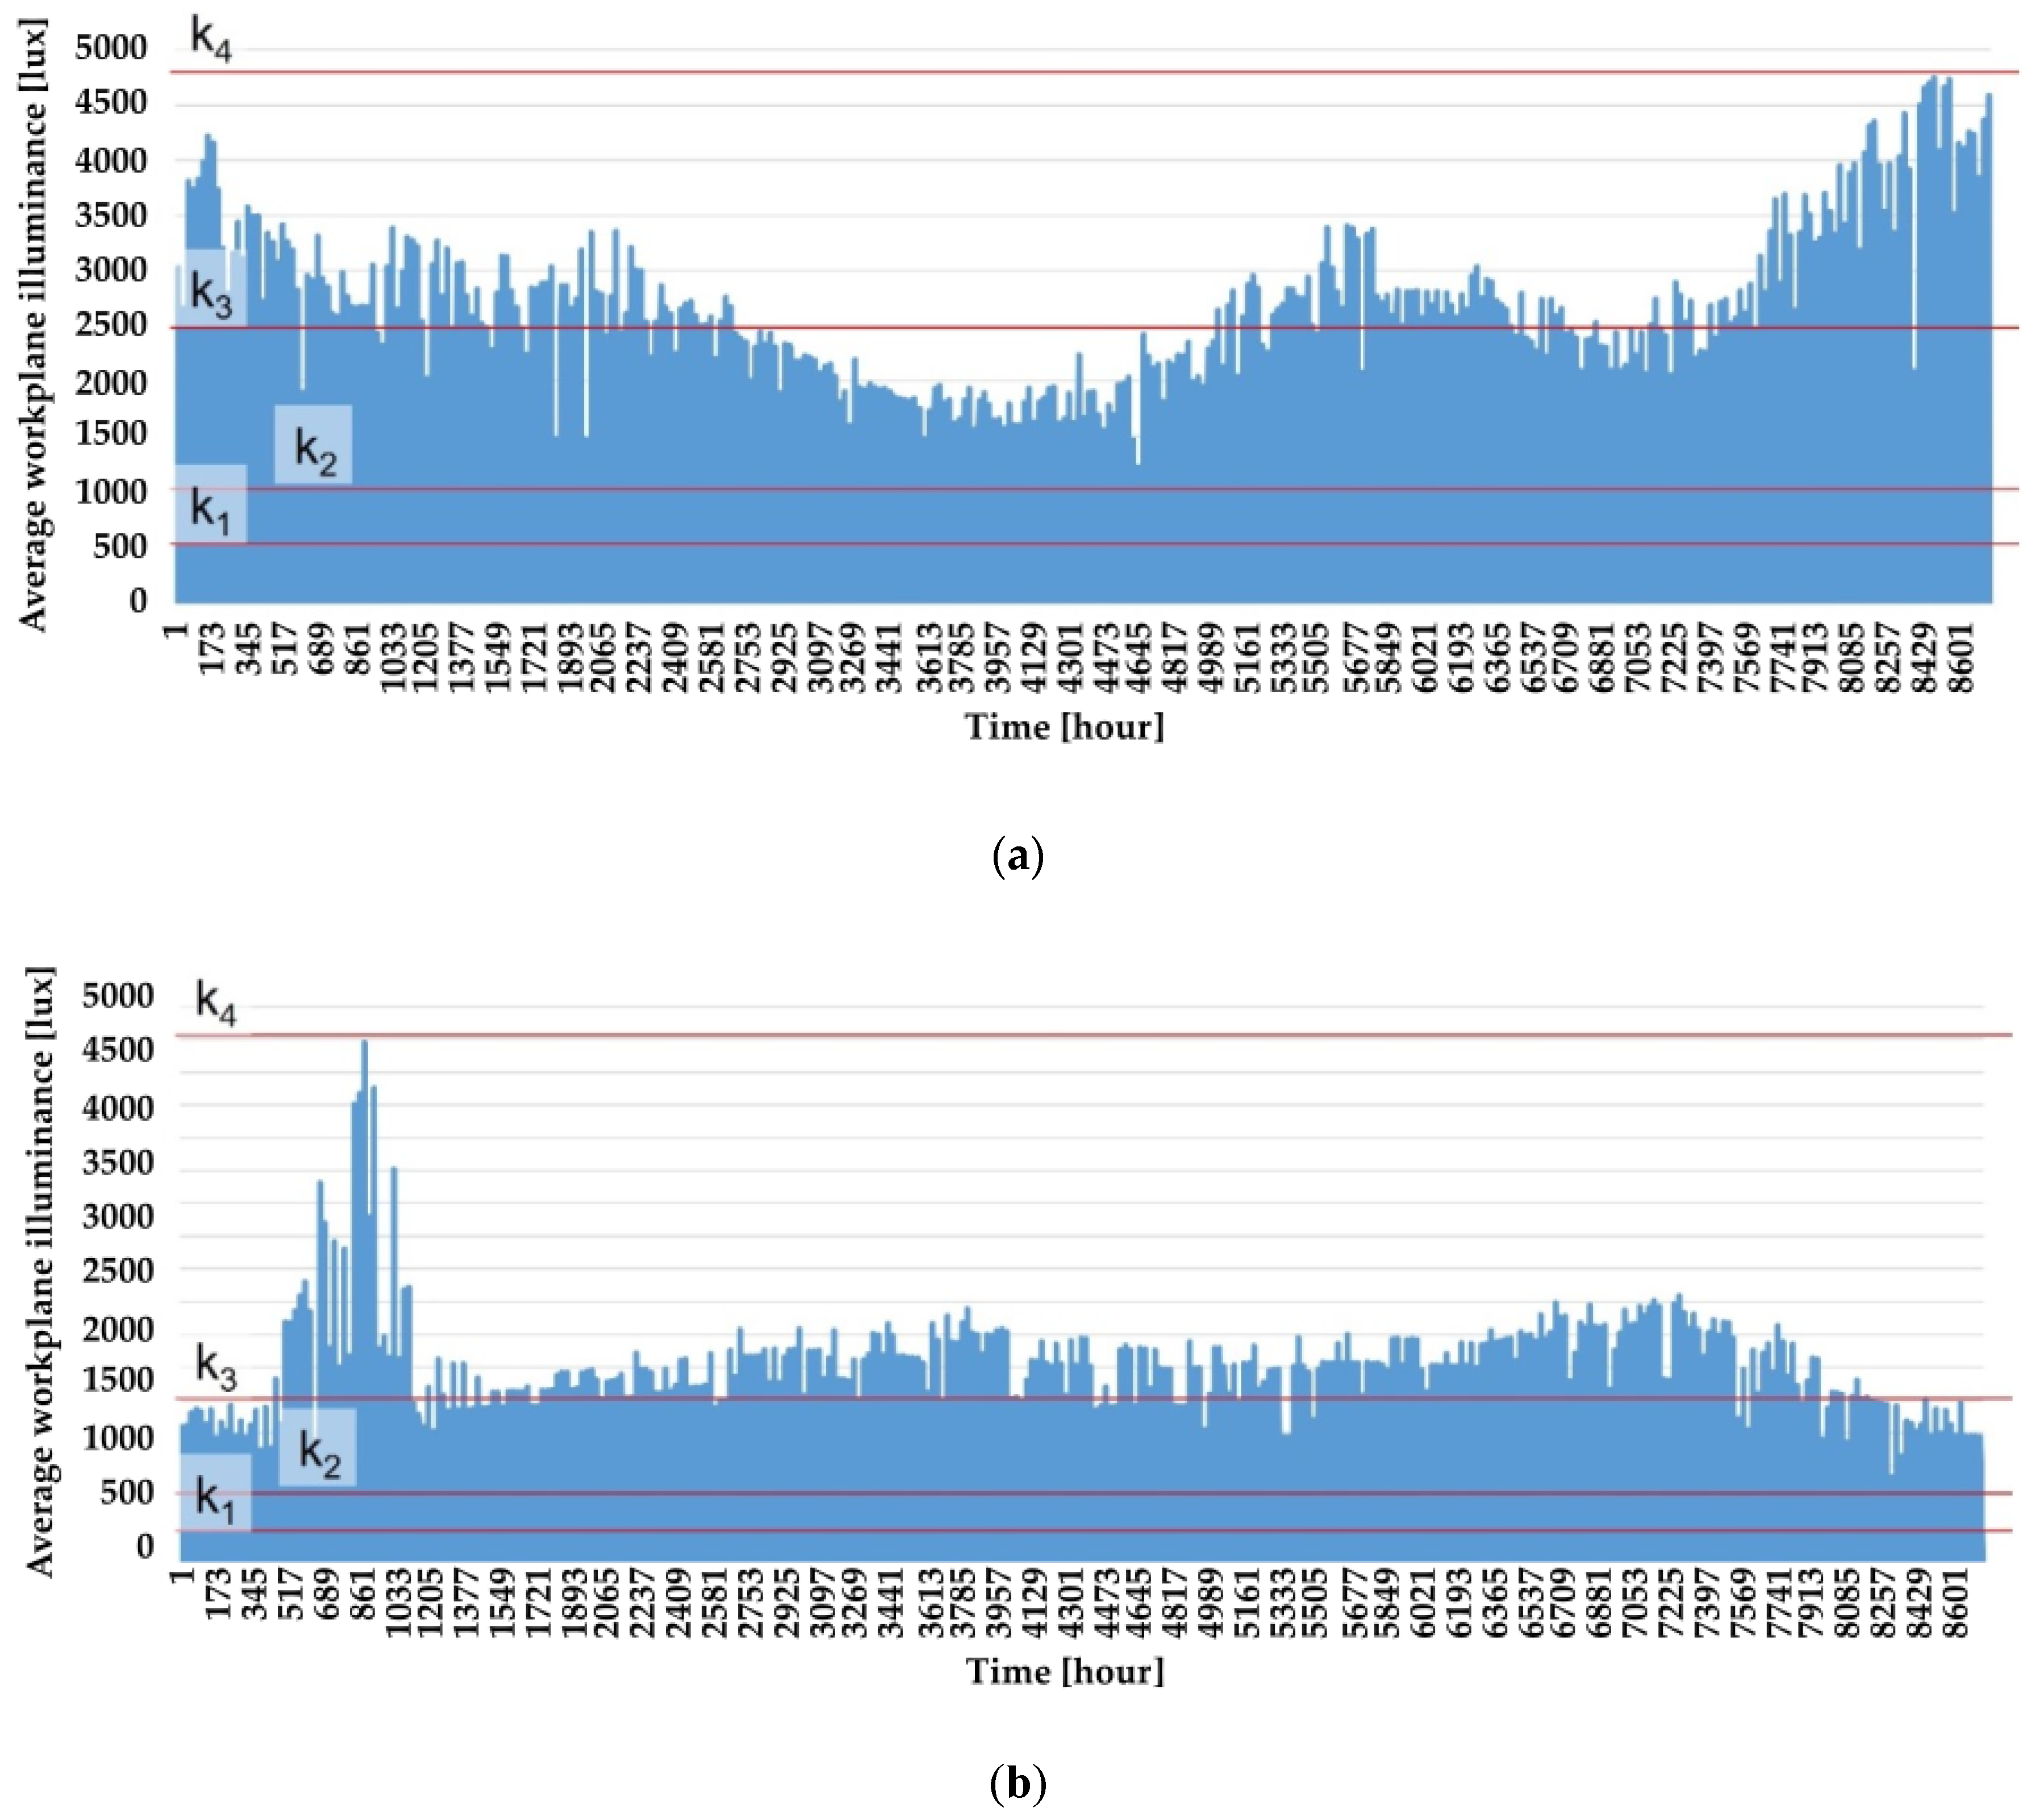
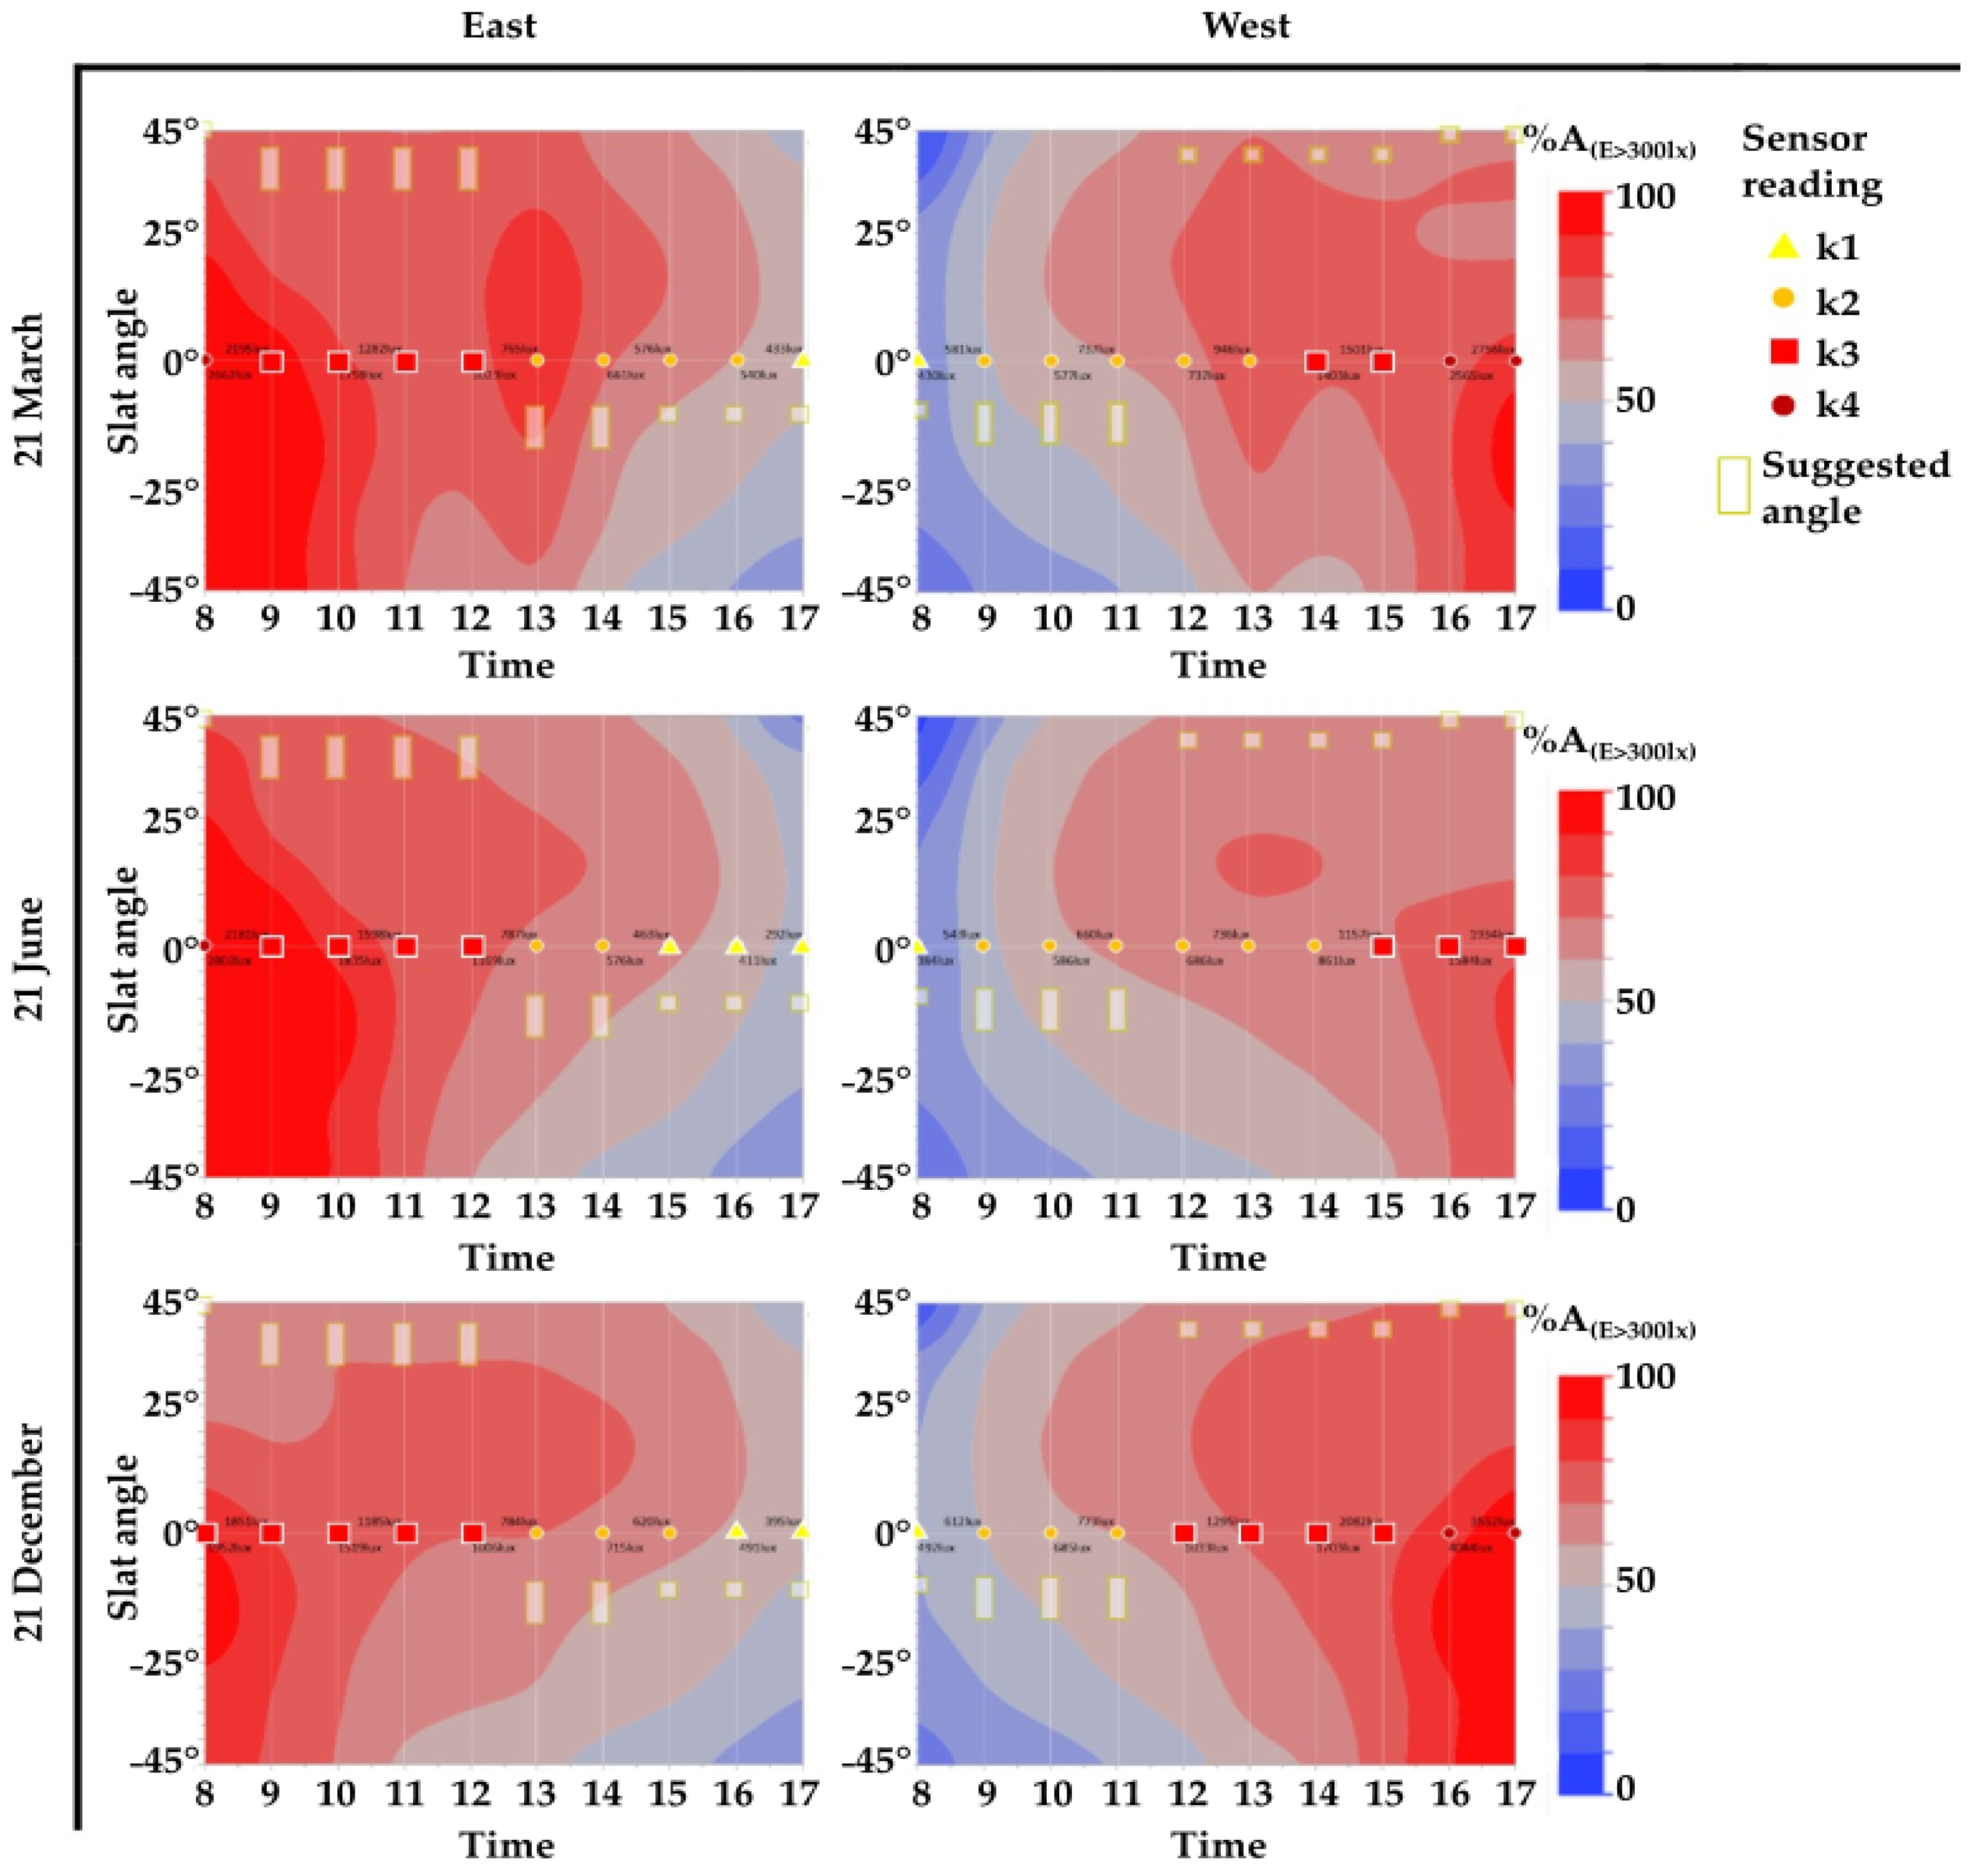
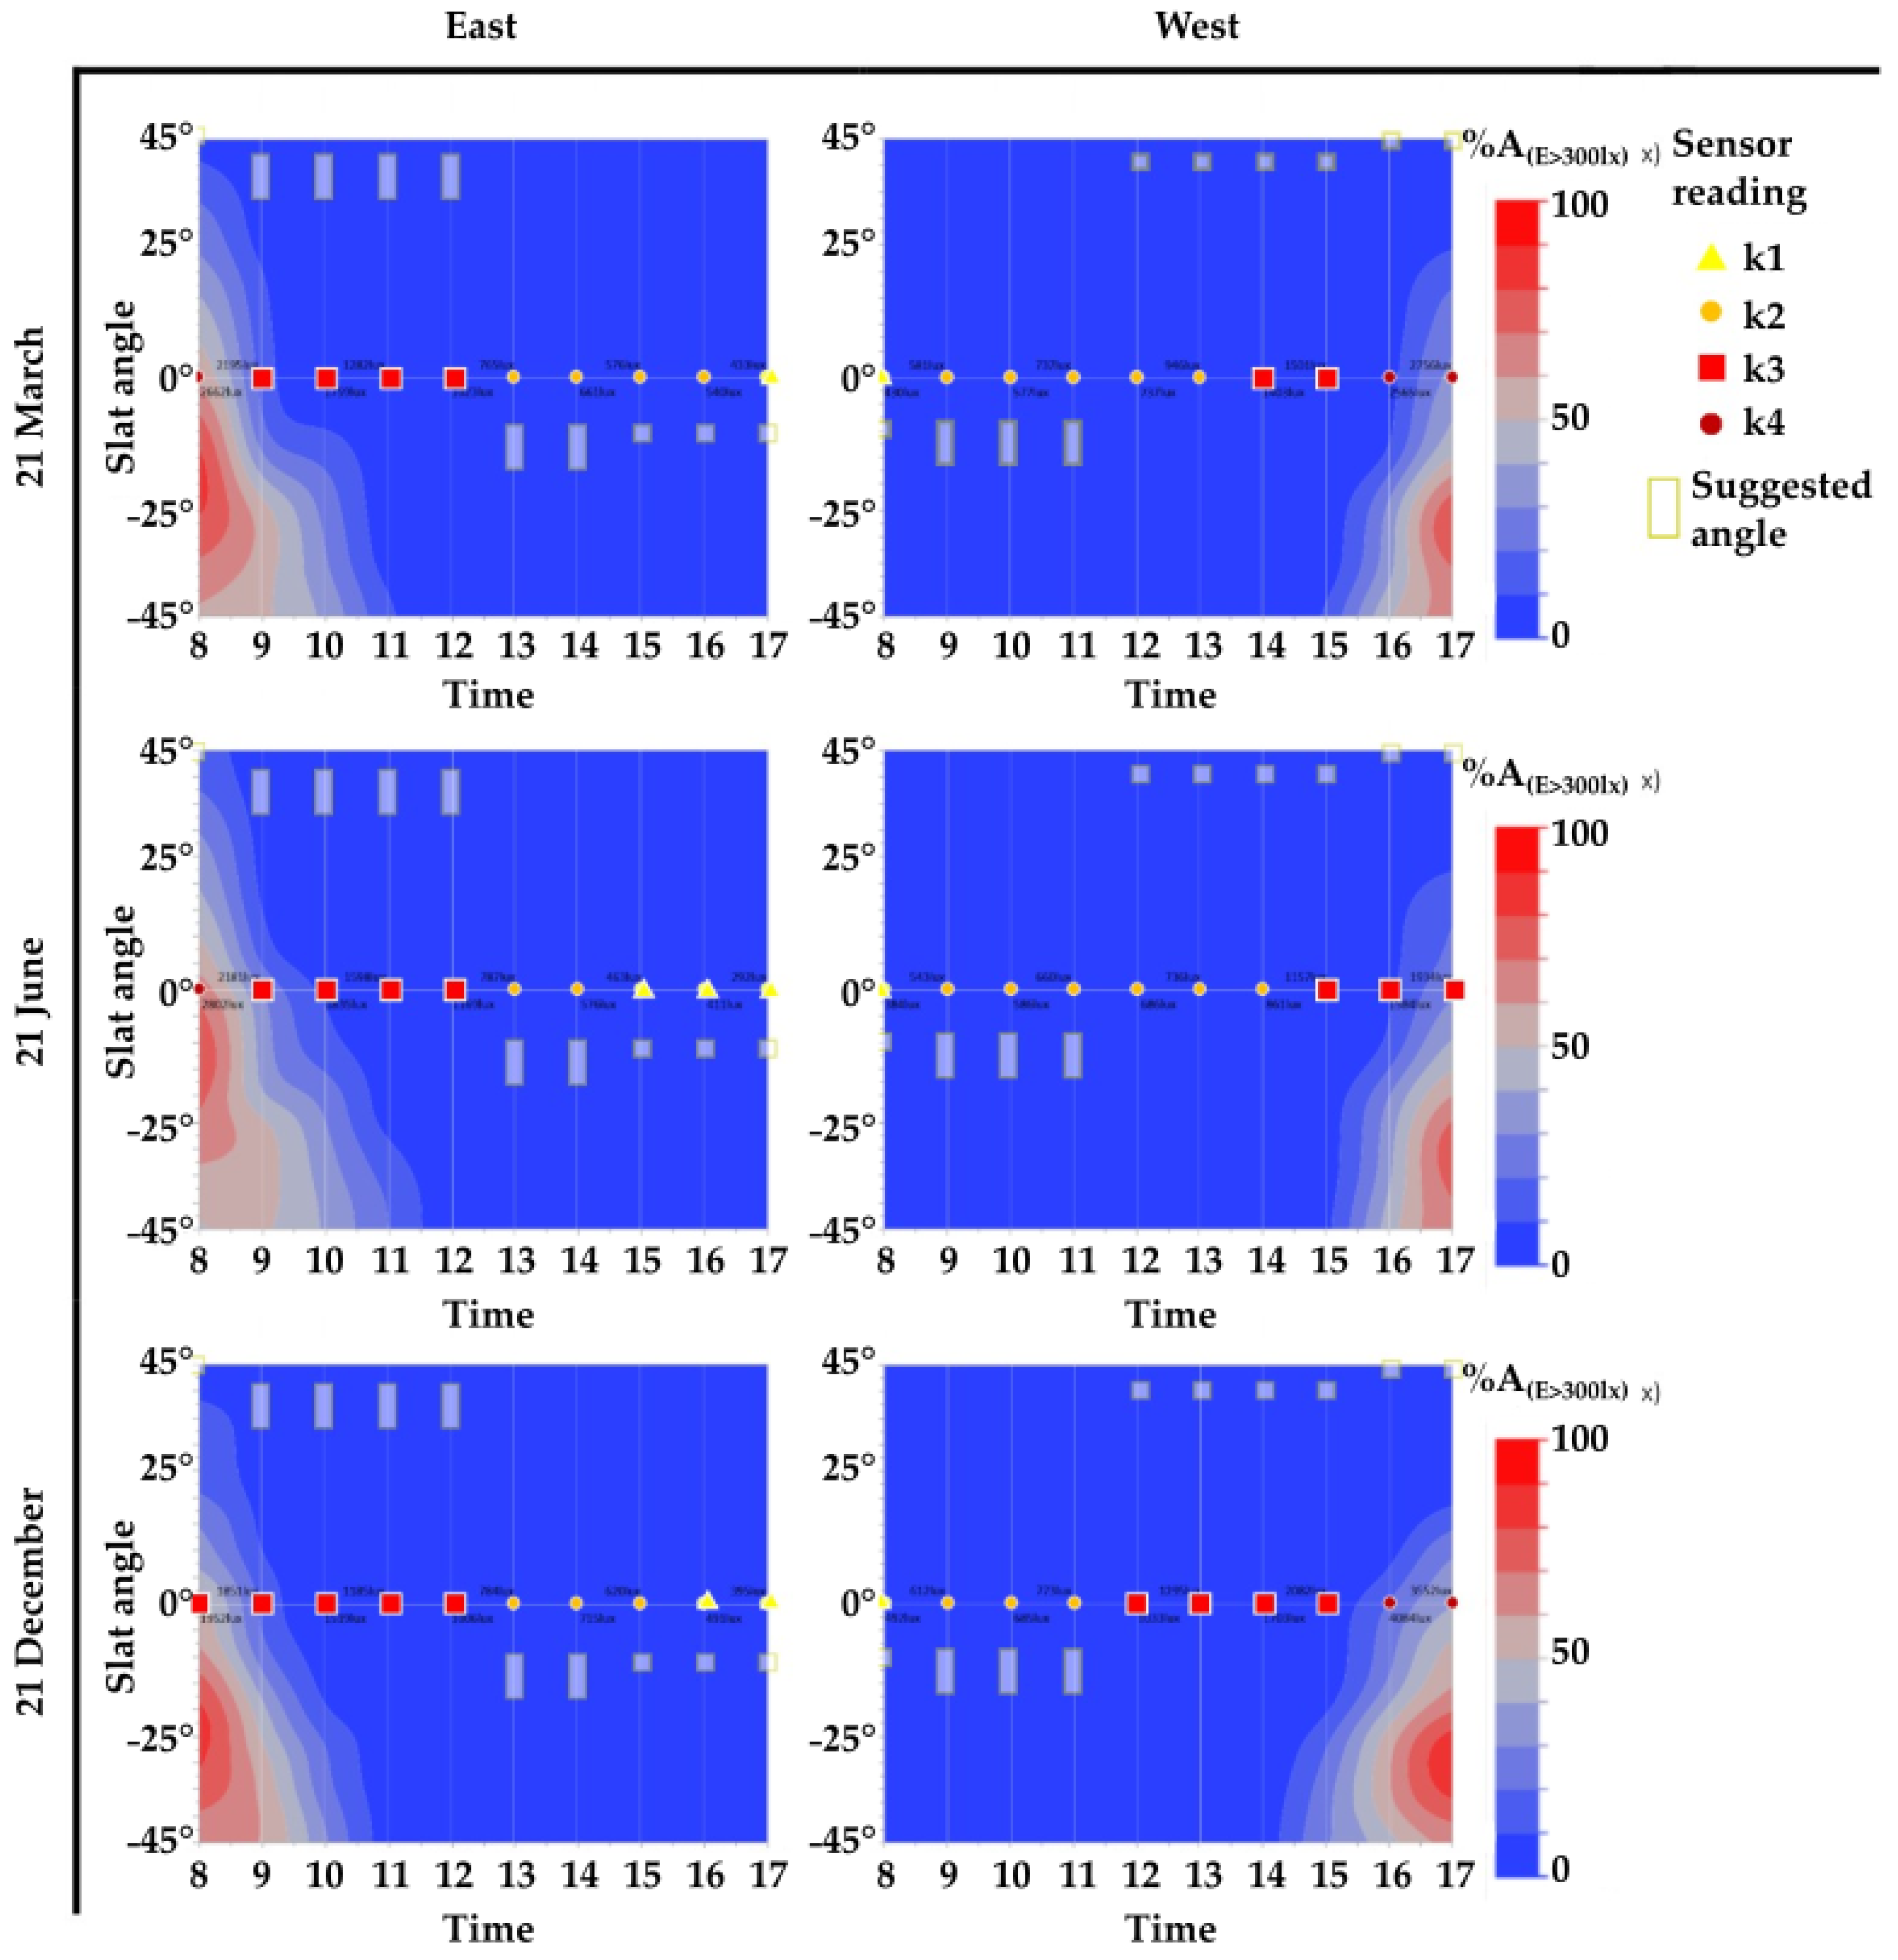
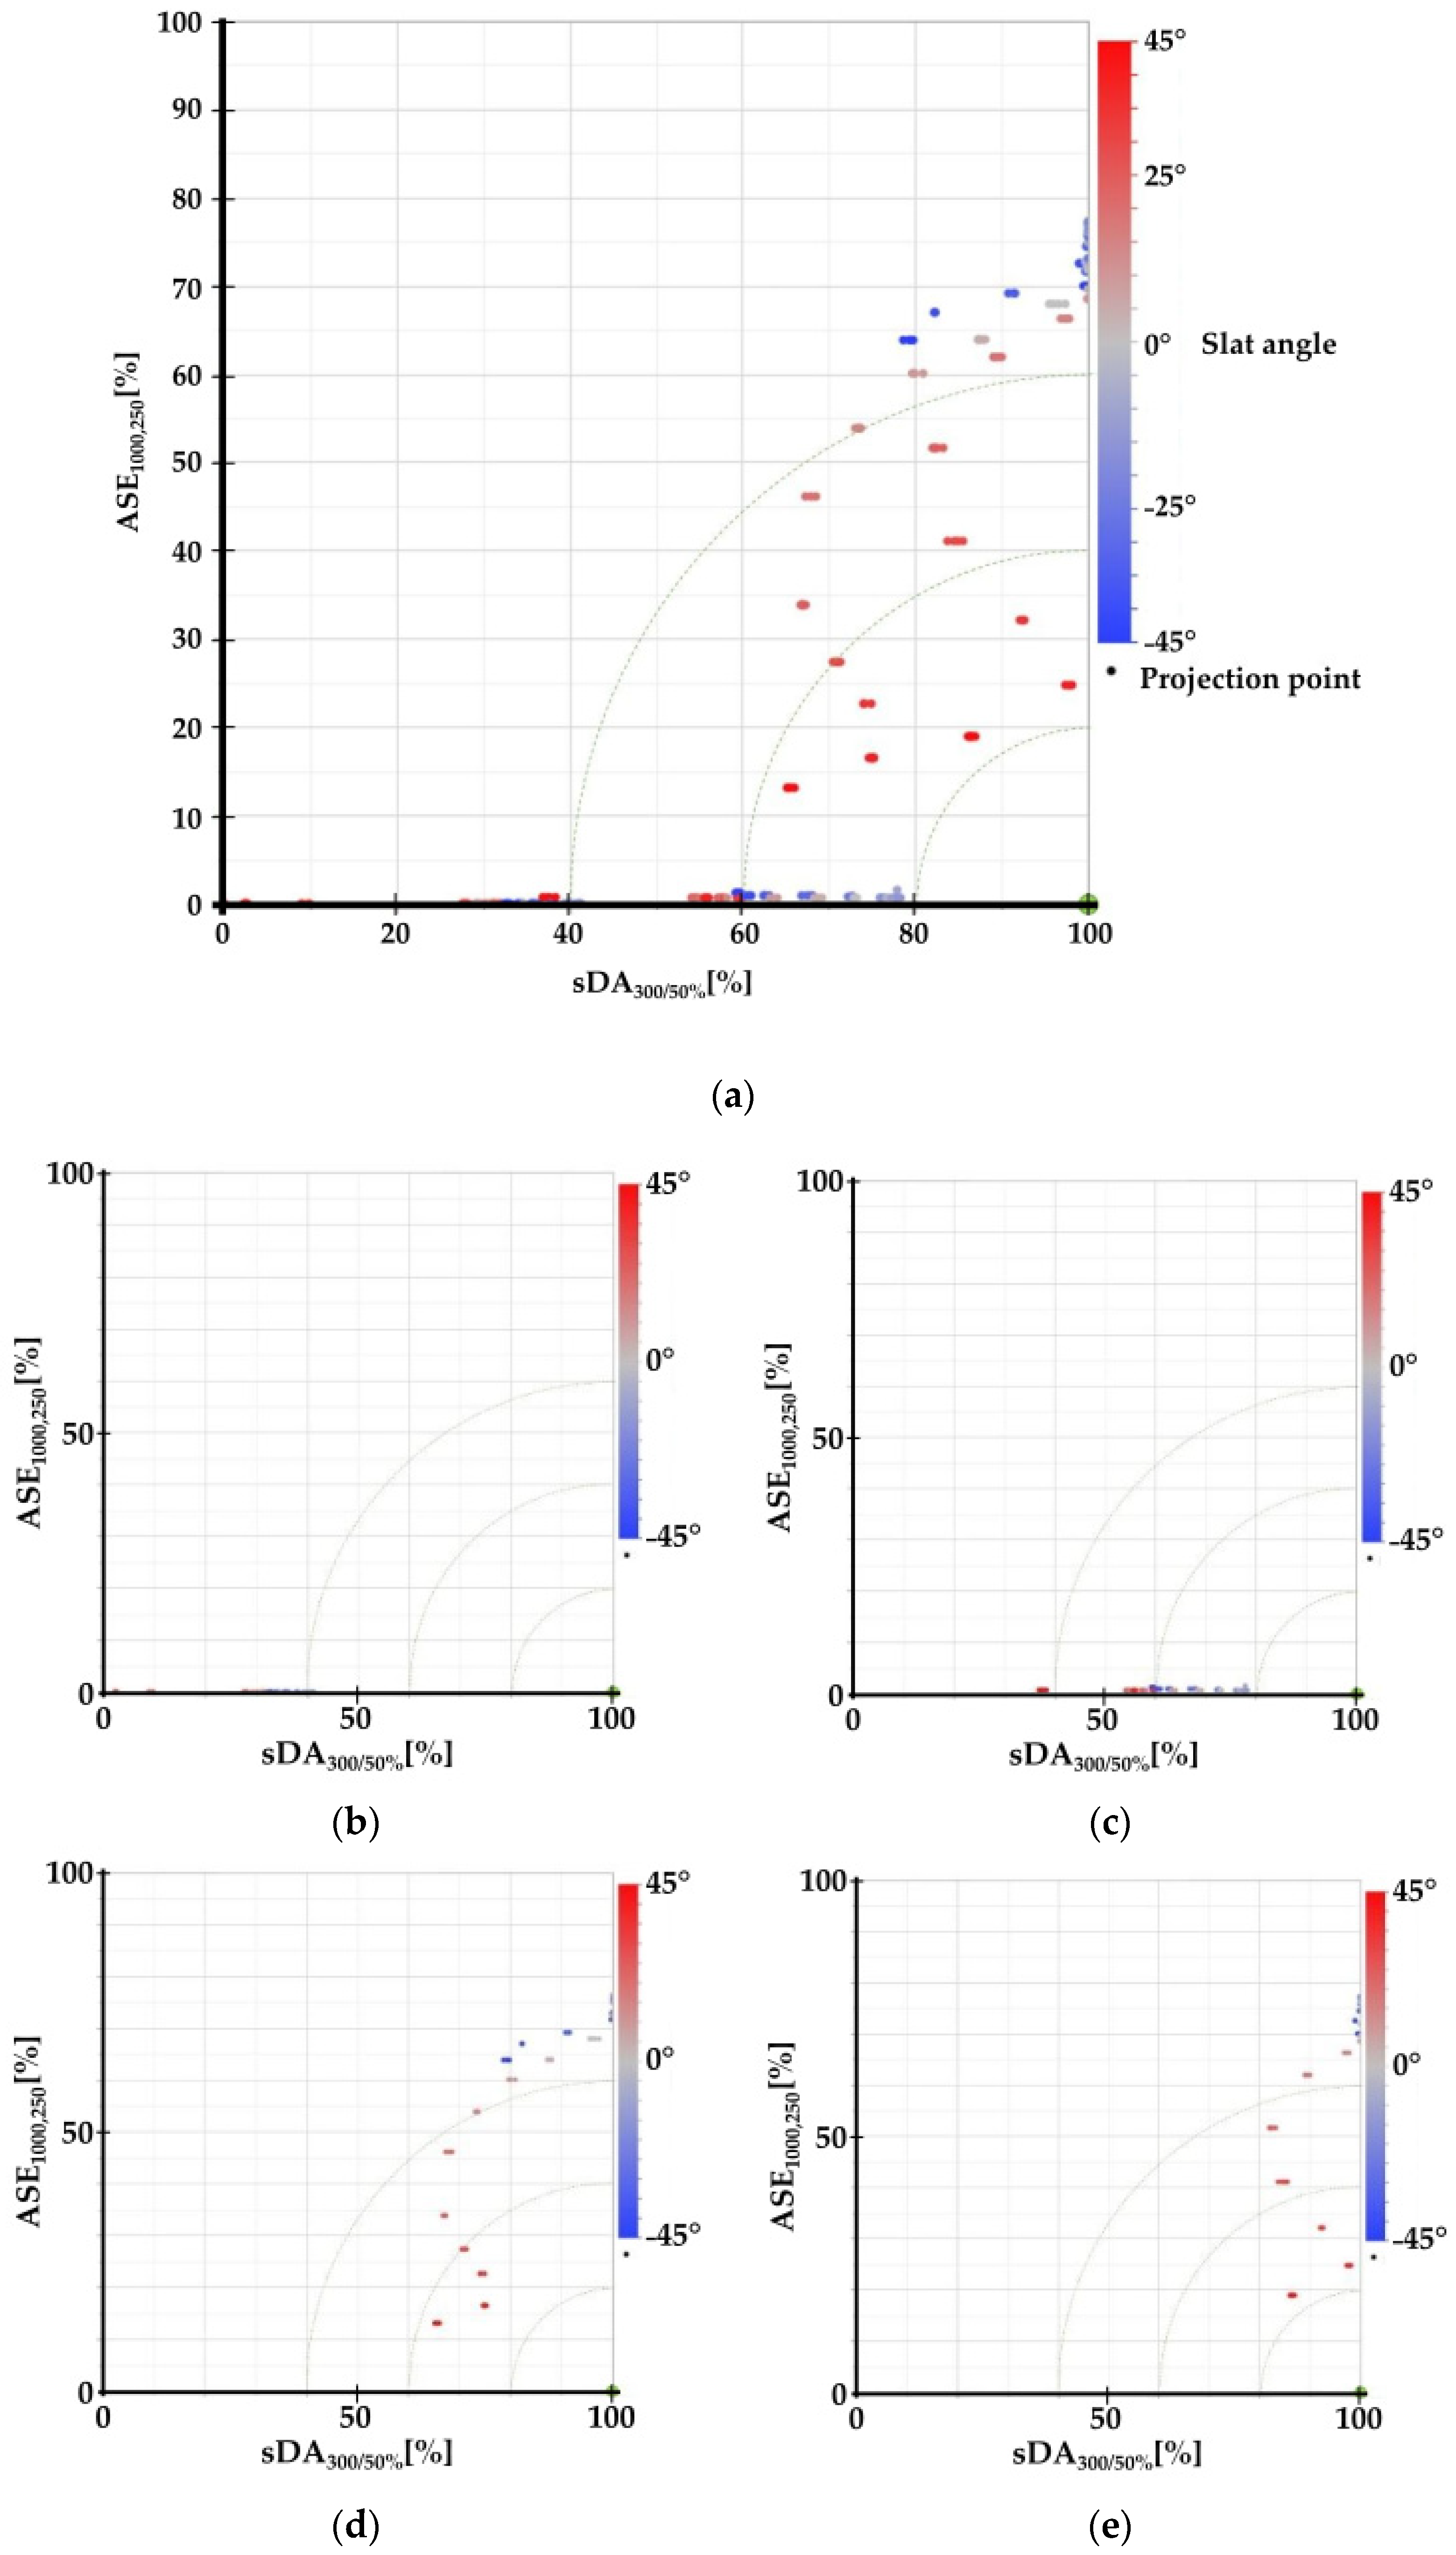
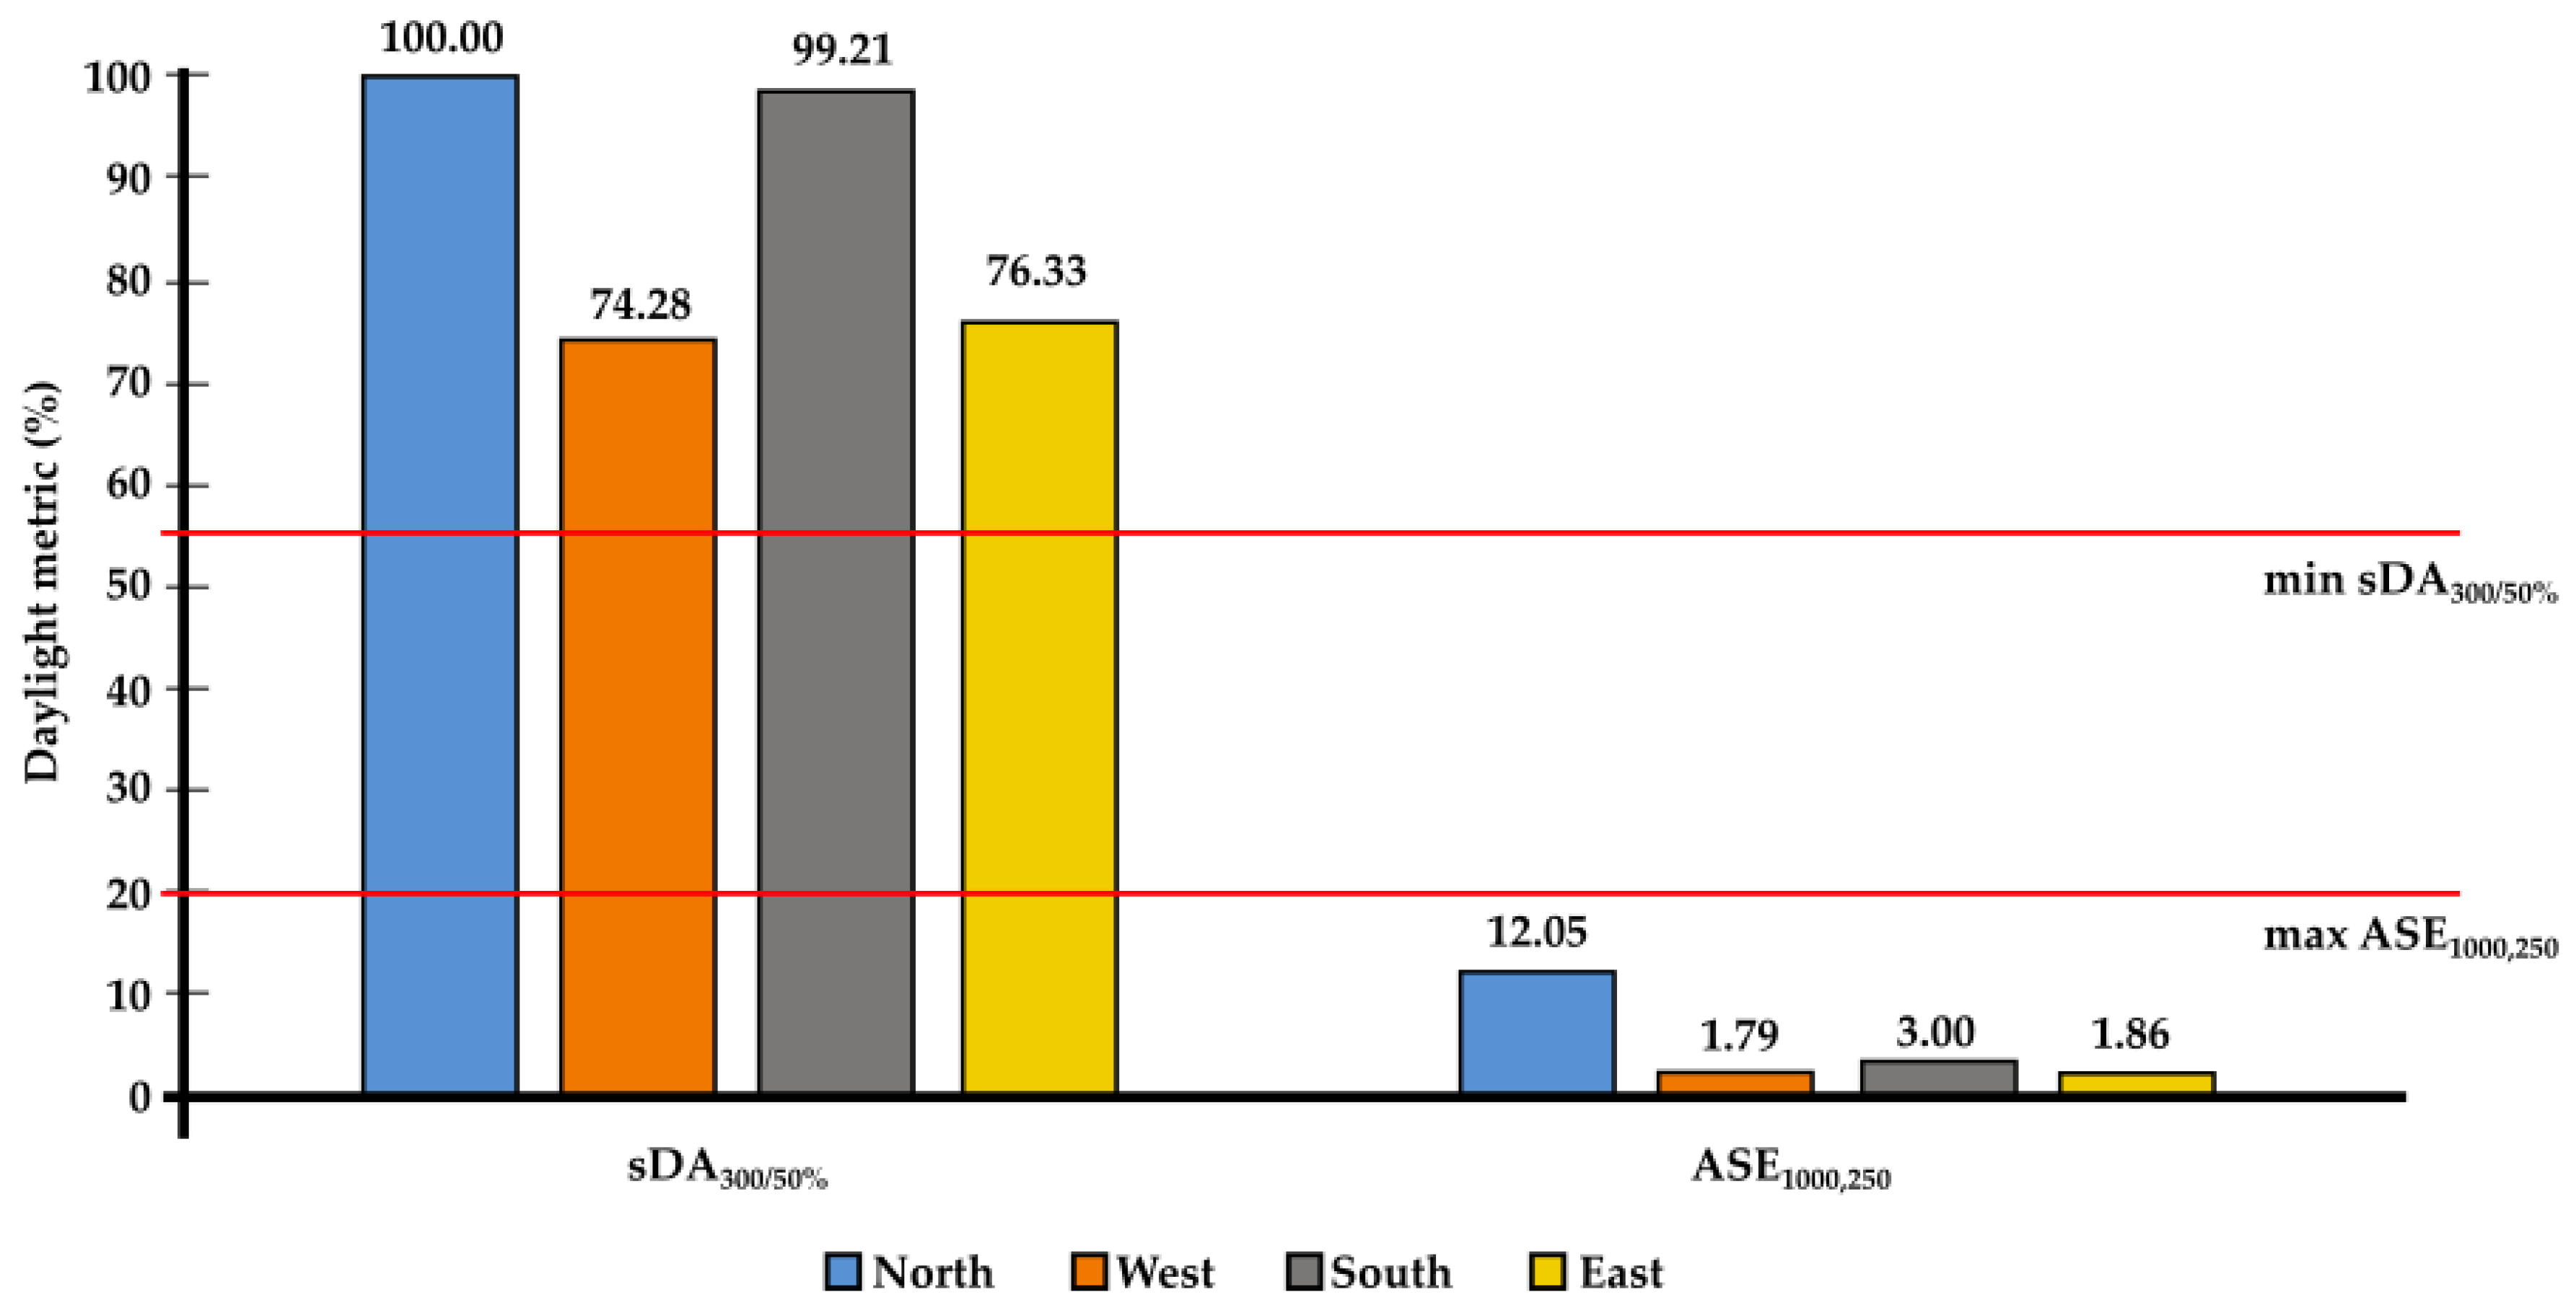
3.3. Adaptive Shading Design Option
4. Discussion
4.1. Annual Glare Probability
4.2. General Discussion
5. Conclusions
Author Contributions
Funding
Institutional Review Board Statement
Informed Consent Statement
Data Availability Statement
Acknowledgments
Conflicts of Interest
References
- Collins, B.L. Windows and People: A Literature Survey. Psychological Reaction to Environments with and without Windows; NBS Buildings Science Series: Washington, DC, USA, 1974; Volume 70.
- Puleo, S.B.H.; Leslie, R.P. Some Effects of the Sequential Experience of Windows on Human Response. J. Illum. Eng. Soc. 1991, 20, 91–99. [Google Scholar] [CrossRef]
- Aries, M.B.C.; Veitch, J.A.; Newsham, G.R. Windows, View, and Office Characteristics Predict Physical and Psychological Discomfort. J. Environ. Psychol. 2010, 30, 533–541. [Google Scholar] [CrossRef]
- Leslie, R.P. Capturing the Daylight Dividend in Buildings: Why and How? Build. Environ. 2003, 38, 381–385. [Google Scholar] [CrossRef]
- Ulrich, R.S.; Simons, R.F.; Losito, B.D.; Fiorito, E.; Miles, M.A.; Zelson, M. Stress Recovery during Exposure to Natural and Urban Environments. J. Environ. Psychol. 1991, 11, 201–230. [Google Scholar] [CrossRef]
- Bakmohammadi, P.; Noorzai, E. Optimization of the Design of the Primary School Classrooms in Terms of Energy and Daylight Performance Considering Occupants’ Thermal and Visual Comfort. Energy Rep. 2020, 6, 1590–1607. [Google Scholar] [CrossRef]
- Li, D.H.W.; Lam, J.C. Evaluation of Lighting Performance in Office Buildings with Daylighting Controls. Energy Build. 2001, 33, 793–803. [Google Scholar] [CrossRef]
- Ochoa, C.E.; Aries, M.B.C.; van Loenen, E.J.; Hensen, J.L.M. Considerations on Design Optimization Criteria for Windows Providing Low Energy Consumption and High Visual Comfort. Appl. Energy 2012, 95, 238–245. [Google Scholar] [CrossRef] [Green Version]
- Yun, G.Y.; Kong, H.J.; Kim, H.; Kim, J.T. A Field Survey of Visual Comfort and Lighting Energy Consumption in Open Plan Offices. Energy Build. 2012, 46, 146–151. [Google Scholar] [CrossRef]
- Mangkuto, R.A.; Rohmah, M.; Asri, A.D. Design Optimisation for Window Size, Orientation, and Wall Reflectance with Regard to Various Daylight Metrics and Lighting Energy Demand: A Case Study of Buildings in the Tropics. Appl. Energy 2016, 164, 211–219. [Google Scholar] [CrossRef]
- Li, D.H.W. A Review of Daylight Illuminance Determinations and Energy Implications. Appl. Energy 2010, 87, 2109–2118. [Google Scholar] [CrossRef]
- Hammad, F.; Abu-Hijleh, B. The Energy Savings Potential of Using Dynamic External Louvers in an Office Building. Energy Build. 2010, 42, 1888–1895. [Google Scholar] [CrossRef]
- Chow, S.K.H.; Li, D.H.W.; Lee, E.W.M.; Lam, J.C. Analysis and Prediction of Daylighting and Energy Performance in Atrium Spaces Using Daylight-Linked Lighting Controls. Appl. Energy 2013, 112, 1016–1024. [Google Scholar] [CrossRef]
- Vanhoutteghem, L.; Skarning, G.C.J.; Hviid, C.A.; Svendsen, S. Impact of Façade Window Design on Energy, Daylighting and Thermal Comfort in Nearly Zero-Energy Houses. Energy Build. 2015, 102, 149–156. [Google Scholar] [CrossRef] [Green Version]
- United States Green Building Council (USGBC). LEED v4.1: Building Design and Construction; United States Green Building Council (USGBC): Washington, DC, USA, 2021. [Google Scholar]
- Green Building Council Indonesia (GBCI). GREENSHIP New Building Rating Tools; Green Building Council Indonesia (GBCI): Jakarta, Indonesia, 2019. [Google Scholar]
- Loonen, R.C.G.M.; Trčka, M.; Cóstola, D.; Hensen, J.L.M. Climate Adaptive Building Shells: State-of-the-Art and Future Challenges. Renew. Sustain. Energy Rev. 2013, 25, 483–493. [Google Scholar] [CrossRef] [Green Version]
- Kasinalis, C.; Loonen, R.C.G.M.; Cóstola, D.; Hensen, J.L.M. Framework for Assessing the Performance Potential of Seasonally Adaptable Facades Using Multi-Objective Optimization. Energy Build. 2014, 79, 106–113. [Google Scholar] [CrossRef] [Green Version]
- Attia, S.; Bilir, S.; Safy, T.; Struck, C.; Loonen, R.; Goia, F. Current Trends and Future Challenges in the Performance Assessment of Adaptive Façade Systems. Energy Build. 2018, 179, 165–182. [Google Scholar] [CrossRef] [Green Version]
- Tällberg, R.; Jelle, B.P.; Loonen, R.; Gao, T.; Hamdy, M. Comparison of the Energy Saving Potential of Adaptive and Controllable Smart Windows: A State-of-the-Art Review and Simulation Studies of Thermochromic, Photochromic and Electrochromic Technologies. Sol. Energy Mater. Sol. Cells 2019, 200, 109828. [Google Scholar] [CrossRef] [Green Version]
- Juaristi, M.; Loonen, R.; Isaia, F.; Gómez-Acebo, T.; Monge-Barrio, A. Dynamic Climate Analysis for Early Design Stages: A New Methodological Approach to Detect Preferable Adaptive Opaque Façade Responses. Sustain. Cities Soc. 2020, 60, 102232. [Google Scholar] [CrossRef]
- Wigginton, M.; Harris, J. Intelligent Skins; Butterworth-Heinemann: Oxford, UK, 2002. [Google Scholar]
- Ochoa, C.E.; Capeluto, I.G. Advice Tool for Early Design Stages of Intelligent Facades Based on Energy and Visual Comfort Approach. Energy Build. 2009, 41, 480–488. [Google Scholar] [CrossRef]
- Fox, M.A.; Yeh, B.P. Intelligent Kinetic Systems in Architecture. In Proceedings of the Managing Interactions in Smart Environments, Dublin, Ireland, 1 December 1999; Nixon, P., Lacey, G., Dobson, S., Eds.; Springer: London, UK, 2000; pp. 91–103. [Google Scholar]
- Mahmoud, A.H.A.; Elghazi, Y. Parametric-Based Designs for Kinetic Facades to Optimize Daylight Performance: Comparing Rotation and Translation Kinetic Motion for Hexagonal Facade Patterns. Sol. Energy 2016, 126, 111–127. [Google Scholar] [CrossRef]
- Formentini, M.; Lenci, S. An Innovative Building Envelope (Kinetic Façade) with Shape Memory Alloys Used as Actuators and Sensors. Autom. Constr. 2018, 85, 220–231. [Google Scholar] [CrossRef]
- Hosseini, S.M.; Mohammadi, M.; Rosemann, A.; Schröder, T.; Lichtenberg, J. A Morphological Approach for Kinetic Façade Design Process to Improve Visual and Thermal Comfort: Review. Build. Environ. 2019, 153, 186–204. [Google Scholar] [CrossRef]
- Hosseini, S.M.; Mohammadi, M.; Guerra-Santin, O. Interactive Kinetic Façade: Improving Visual Comfort Based on Dynamic Daylight and Occupant’s Positions by 2D and 3D Shape Changes. Build. Environ. 2019, 165, 106396. [Google Scholar] [CrossRef]
- Hosseini, S.M.; Mohammadi, M.; Schröder, T.; Guerra-Santin, O. Integrating Interactive Kinetic Façade Design with Colored Glass to Improve Daylight Performance Based on Occupants’ Position. J. Build. Eng. 2020, 31, 101404. [Google Scholar] [CrossRef]
- Le-Thanh, L.; Le-Duc, T.; Ngo-Minh, H.; Nguyen, Q.-H.; Nguyen-Xuan, H. Optimal Design of an Origami-Inspired Kinetic Façade by Balancing Composite Motion Optimization for Improving Daylight Performance and Energy Efficiency. Energy 2021, 219, 119557. [Google Scholar] [CrossRef]
- Lollini, R.; Danza, L.; Meroni, I. Energy Efficiency of a Dynamic Glazing System. Sol. Energy 2010, 84, 526–537. [Google Scholar] [CrossRef] [Green Version]
- Shi, X.; Abel, T.; Wang, L. Influence of Two Motion Types on Solar Transmittance and Daylight Performance of Dynamic Façades. Sol. Energy 2020, 201, 561–580. [Google Scholar] [CrossRef]
- Bakker, L.G.; Hoes-van Oeffelen, E.C.M.; Loonen, R.C.G.M.; Hensen, J.L.M. User Satisfaction and Interaction with Automated Dynamic Facades: A Pilot Study. Build. Environ. 2014, 78, 44–52. [Google Scholar] [CrossRef] [Green Version]
- Kirkegaard, P.H.; Foged, I.W. Development and Evaluation of a Responsive Building Envelope. In Proceedings of the Proceedings of Adaptive Architecture, Nottingham, UK, 3–5 March 2011. [Google Scholar]
- Xu, X.; Dessel, S.V. Evaluation of an Active Building Envelope Window-System. Build. Environ. 2008, 43, 1785–1791. [Google Scholar] [CrossRef]
- Prieto, A.; Klein, T.; Knaack, U.; Auer, T. Main Perceived Barriers for the Development of Building Service Integrated Facades: Results from an Exploratory Expert Survey. J. Build. Eng. 2017, 13, 96–106. [Google Scholar] [CrossRef]
- Shen, H.; Tzempelikos, A. Daylighting and Energy Analysis of Private Offices with Automated Interior Roller Shades. Sol. Energy 2012, 86, 681–704. [Google Scholar] [CrossRef]
- Oh, M.H.; Lee, K.H.; Yoon, J.H. Automated Control Strategies of inside Slat-Type Blind Considering Visual Comfort and Building Energy Performance. Energy Build. 2012, 55, 728–737. [Google Scholar] [CrossRef]
- Manzan, M. Genetic Optimization of External Fixed Shading Devices. Energy Build. 2014, 72, 431–440. [Google Scholar] [CrossRef]
- Eltaweel, A.; Su, Y.; Mandour, M.A.; Elrawy, O.O. A Novel Automated Louver with Parametrically-Angled Reflective Slats; Design Evaluation for Better Practicality and Daylighting Uniformity. J. Build. Eng. 2021, 42, 102438. [Google Scholar] [CrossRef]
- De Vries, S.B.; Loonen, R.C.G.M.; Hensen, J.L.M. Multi-State Vertical-Blinds Solar Shading—Performance Assessment and Recommended Development Directions. J. Build. Eng. 2021, 40, 102743. [Google Scholar] [CrossRef]
- Remund, J.; Müller, S.; Kunz, Z.; Huguenin-Landl, B.; Studer, C.; Klauser, D.; Lehnherr, R. Meteonorm Global Meteorological Database; Meteotest: Bern, Switzerland, 2013; Available online: https://meteonorm.com/ (accessed on 21 December 2021).
- Al-Masrani, S.M.; Al-Obaidi, K.M.; Zalin, N.A.; Aida Isma, M.I. Design Optimisation of Solar Shading Systems for Tropical Office Buildings: Challenges and Future Trends. Sol. Energy 2018, 170, 849–872. [Google Scholar] [CrossRef]
- Lau, A.K.K.; Salleh, E.; Lim, C.H.; Sulaiman, M.Y. Potential of Shading Devices and Glazing Configurations on Cooling Energy Savings for High-Rise Office Buildings in Hot-Humid Climates: The Case of Malaysia. Int. J. Sustain. Built Environ. 2016, 5, 387–399. [Google Scholar] [CrossRef] [Green Version]
- Tang, K.; Chin, N. Building Energy Efficiency Technical Guideline for Passive Design Public Works; Department Malaysia: Kuala Lumpur, Malaysia, 2013.
- Ossen, D.R.; Ahmad, M.H.; Madros, N.H. Impact of Solar Shading Geometry on Building Energy Use in Hot Humid Climates with Special Reference to Malaysia. In Proceedings of the Sustainable Symbiosis, UiTM, Subang Jaya, Malaysia, 10–11 May 2005. [Google Scholar]
- Rahimzadeh, S.D.; Garcia-Hansen, V.; Drogemuller, R.; Isoardi, G. Parametric Modelling for the Efficient Design of Daylight Strategies with Complex Geometries. In Proceedings of the 47th International Conference of the Architectural Science Association (ANZAScA), Hong Kong, China, 13–16 November 2013. [Google Scholar] [CrossRef]
- Arifin, N.A.; Denan, Z. An Analysis of Indoor Air Temperature and Relative Humidity in Office Room with Various External Shading Devices in Malaysia. Procedia Soc. Behav. Sci. 2015, 179, 290–296. [Google Scholar] [CrossRef] [Green Version]
- Denan, Z.; Majid, N.H.A. An Assessment on Glare from Daylight through Various Designs of Shading Devices in Hot Humid Climate, Case Study in Kuala Lumpur, Malaysia. Int. J. Eng. Technol. 2015, 7, 25–29. [Google Scholar] [CrossRef] [Green Version]
- Lim, Y.-W.; Heng, C.Y.S. Dynamic Internal Light Shelf for Tropical Daylighting in High-Rise Office Buildings. Build. Environ. 2016, 106, 155–166. [Google Scholar] [CrossRef]
- Mangkuto, R.A.; Feradi, F.; Putra, R.E.; Atmodipoero, R.T.; Favero, F. Optimisation of Daylight Admission Based on Modifications of Light Shelf Design Parameters. J. Build. Eng. 2018, 18, 195–209. [Google Scholar] [CrossRef]
- Utama Sjarifudin, F.; Justina, L. Daylight Adaptive Shading Using Parametric Camshaft Mechanism for SOHO in Jakarta. EPJ Web Conf. 2014, 68, 00037. [Google Scholar] [CrossRef] [Green Version]
- Priatman, J.; Soegihardjo, O.; Loekita, S. Towards Energy Efficient Facade Through Solar-Powered Shading Device. Procedia Soc. Behav. Sci. 2015, 179, 266–275. [Google Scholar] [CrossRef] [Green Version]
- Al-Obaidi, K.M.; Munaaim, M.A.C.; Ismail, M.A.; Abdul Rahman, A.M. Designing an Integrated Daylighting System for Deep-Plan Spaces in Malaysian Low-Rise Buildings. Sol. Energy 2017, 149, 85–101. [Google Scholar] [CrossRef]
- Mangkuto, R.A.; Dewi, D.K.; Herwandani, A.A.; Koerniawan, M.D.; Faridah. Design Optimisation of Internal Shading Device in Multiple Scenarios: Case Study in Bandung, Indonesia. J. Build. Eng. 2019, 24, 100745. [Google Scholar] [CrossRef]
- Palarino, C.; Piderit, M.B. Optimisation of Passive Solar Design Strategies in Side-Lit Offices: Maximising Daylight Penetration While Reducing the Risk of Glare in Different Chilean Climate Contexts. J. Daylighting 2020, 7, 107–121. [Google Scholar] [CrossRef]
- Eltaweel, A.; Su, Y.; Hafez, M.; Eltaweel, W. An Automated Louver with Innovative Parametrically-Angled Reflective Slats: Prototyping and Validation via Using Parametric Control in Grasshopper along with Arduino Board. Energy Build. 2021, 231, 110614. [Google Scholar] [CrossRef]
- Atthaillah; Mangkuto, R.A.; Koerniawan, M.D.; Soelami, F.X.N. Daylight Annual Illuminance Investigation in Elementary School Classrooms for the Tropic of Lhokseumawe, Indonesia. J. Appl. Sci. Eng. 2021, 25, 129–139. [Google Scholar] [CrossRef]
- JALOXA. Radiance Colour Picker 2021. Available online: http://www.jaloxa.eu/resources/radiance/colour_picker.shtml (accessed on 21 December 2021).
- Hirning, M.B.; Isoardi, G.L.; Cowling, I. Discomfort glare in open plan green buildings. Energy Build. 2014, 70, 427–440. [Google Scholar] [CrossRef] [Green Version]
- Mangkuto, R.A.; Kurnia, K.A.; Azizah, D.A.; Atmodipoero, R.T.; Soelami, F.X.N. Determination of discomfort glare criteria for daylit space in Indonesia. Sol. Energy 2017, 149, 151–163. [Google Scholar] [CrossRef]
- Green Building Council Indonesia (GBCI). GREENSHIP untuk Bangunan Baru, Versi 1.2 [ GREENSHIP for New Buildings, Version 1.2] 2013. Available online: https://www.gbcindonesia.org/files/resource/9b552832-b500-4b73-8c0e-acfaa1434731/Summary%20GREENSHIP%20New%20Building%20V1.2.pdf (accessed on 21 December 2021). (In Indonesian).
- Badan Standardisasi Nasional (BSN). SNI 03-2396-2001: Tata Cara Perancangan Sistem Pencahayaan Alami pada Bangunan Gedung [Design Guidelines for Daylighting Systems in Buildings]; Badan Standardisasi Nasional: Jakarta, Indonesia, 2001. (In Indonesian) [Google Scholar]


| Metric | ab | ad | ar | as | aa | lw |
|---|---|---|---|---|---|---|
| sDA300/50% | 6 | 1000 | 20 | 300 | 0.1 | 0.004 |
| ASE1000,250 | 0 | 1000 | 20 | 300 | 0.1 | 0.004 |
| Surface | Reflectance (-) | Specularity (-) | Roughness (-) | ||
|---|---|---|---|---|---|
| R | G | B | |||
| Ceiling | 0.80 | 0.80 | 0.80 | 0 | 0 |
| Exterior wall | 0.40 | 0.40 | 0.40 | 0 | 0 |
| Interior wall | 0.75 | 0.75 | 0.75 | 0 | 0 |
| Floor | 0.20 | 0.20 | 0.20 | 0 | 0 |
| Metal shading | 0.40 | 0.40 | 0.40 | 0.90 | 0 |
| North | West | South | East |
|---|---|---|---|
| 30 | 30 | 28 | 30 |
| Orientation | k1 | k2 | k3 | k4 |
|---|---|---|---|---|
| East | −10° | −15° | 40° | 45° |
| West | −15° | −15° | 40° | 45° |
| Design Option/Zone | ASE1000,250 (%) | Predicted Max. %DGP>0.21 (%) | Regime | ||
|---|---|---|---|---|---|
| 95% Lower | Average | 95% Upper | |||
| Baseline | |||||
| North | 39.8 | 34.2 | 49.0 | 63.9 | Low contrast |
| West | 61.7 | 47.9 | 67.1 | 86.3 | Low contrast |
| South | 21.8 | 22.9 | 34.2 | 45.4 | Low contrast |
| East | 55.2 | 43.8 | 61.7 | 79.6 | Low contrast |
| Fixed shading | |||||
| North | 12.5 | 17.1 | 26.5 | 35.9 | High contrast |
| 12.5 | 41.9 | 50.6 | 59.3 | Low contrast | |
| West | 38.0 | 33.1 | 47.5 | 62.0 | Low contrast |
| South | 3.0 | 2.8 | 7.4 | 12.0 | High contrast |
| 3.0 | 3.4 | 7.8 | 12.1 | Low contrast | |
| East | 37.9 | 33.0 | 47.5 | 62.0 | Low contrast |
| Adaptive shading | |||||
| North | 12.1 | 16.8 | 26.2 | 35.5 | High contrast |
| 12.1 | 40.1 | 48.6 | 57.0 | Low contrast | |
| West | 1.8 | 0.0 | 2.0 | 6.1 | High contrast |
| 1.8 | 0.0 | 2.3 | 6.1 | Low contrast | |
| South | 3.0 | 2.8 | 7.4 | 12.0 | High contrast |
| 3.0 | 3.4 | 7.8 | 12.1 | Low contrast | |
| East | 1.9 | 0.0 | 2.3 | 6.4 | High contrast |
| 1.9 | 0.0 | 2.6 | 6.5 | Low contrast | |
Publisher’s Note: MDPI stays neutral with regard to jurisdictional claims in published maps and institutional affiliations. |
© 2021 by the authors. Licensee MDPI, Basel, Switzerland. This article is an open access article distributed under the terms and conditions of the Creative Commons Attribution (CC BY) license (https://creativecommons.org/licenses/by/4.0/).
Share and Cite
Mangkuto, R.A.; Koerniawan, M.D.; Apriliyanthi, S.R.; Lubis, I.H.; Atthaillah; Hensen, J.L.M.; Paramita, B. Design Optimisation of Fixed and Adaptive Shading Devices on Four Façade Orientations of a High-Rise Office Building in the Tropics. Buildings 2022, 12, 25. https://doi.org/10.3390/buildings12010025
Mangkuto RA, Koerniawan MD, Apriliyanthi SR, Lubis IH, Atthaillah, Hensen JLM, Paramita B. Design Optimisation of Fixed and Adaptive Shading Devices on Four Façade Orientations of a High-Rise Office Building in the Tropics. Buildings. 2022; 12(1):25. https://doi.org/10.3390/buildings12010025
Chicago/Turabian StyleMangkuto, Rizki A., Mochamad Donny Koerniawan, Sri Rahma Apriliyanthi, Irma Handayani Lubis, Atthaillah, Jan L. M. Hensen, and Beta Paramita. 2022. "Design Optimisation of Fixed and Adaptive Shading Devices on Four Façade Orientations of a High-Rise Office Building in the Tropics" Buildings 12, no. 1: 25. https://doi.org/10.3390/buildings12010025