Article

Exploring Natural Language Processing in Construction and Integration with Building Information Modeling: A Scientometric Analysis

by
Mirko Locatelli
1,*,
Elena Seghezzi
1,
Laura Pellegrini
1,
Lavinia Chiara Tagliabue
2 and
Giuseppe Martino Di Giuda
3
1
Department of Architecture, Built Environment and Construction Engineering, Politecnico di Milano, 20133 Milan, Italy
2
Department of Computer Science, Università degli Studi di Torino, 10149 Turin, Italy
3
Department of Management, Università degli Studi di Torino, 10134 Turin, Italy
*
Author to whom correspondence should be addressed.
Buildings 2021, 11(12), 583; https://doi.org/10.3390/buildings11120583
Submission received: 24 October 2021 / Revised: 19 November 2021 / Accepted: 23 November 2021 / Published: 25 November 2021
(This article belongs to the Special Issue Decision Support Systems for the Digital Built Environment)

Abstract

:
The European Union (EU) aims to increase the efficiency and productivity of the construction industry. The EU suggests pairing Building Information Modeling with other digitalization technologies to seize the full potential of the digital transition. Meanwhile, industrial applications of Natural Language Processing (NLP) have emerged. The growth of NLP is affecting the construction industry. However, the potential of NLP and the combination of an NLP and BIM approach is still unexplored. The study tries to address this lack by applying a scientometric analysis to explore the state of the art of NLP in the AECO sector, and the combined applications of NLP and BIM. Science mapping is used to analyze 254 bibliographic records from Scopus Database analyzing the structure and dynamics of the domain by drawing a picture of the body of knowledge. NLP in AECO, and its pairing with BIM domain and applications, are investigated by representing: Conceptual, Intellectual, and Social structure. The highest number of NLP applications in AECO are in the fields of Project, Safety, and Risk Management. Attempts at combining NLP and BIM mainly concern the Automated Compliance Checking and semantic BIM enrichment goals. Artificial intelligence, learning algorithms, and ontologies emerge as the most widespread and promising technological drivers.

1. Introduction

1.1. European Union Digitalization Strategy

The digitalization of the European market is one of the main objectives set by the European Union (EU). The digitalization of industrial sectors and production processes aims to increase and maximize the efficiency and potential growth of the digital economy in the European common market. The EU digitalization strategy regards, in particular, Architecture, Engineering, Construction, and Owner-operated (AECO) industry, as one of the pillars of EU economy [1]. However, the AECO sector is slowly adopting Digital Technologies and embracing Digital Innovation compared to other industrial sectors (e.g., manufacturing and telecommunication) [2]. To seize the full potential of digitalization of the construction sector, the EU Commission recommends combining Building Information Modelling (BIM) with other digitalization technologies [1]. In the last decade, BIM has become widespread in AECO industry [3,4]. BIM refers to the “use of a shared digital representation of a built asset to facilitate design, construction and operation processes to form a reliable basis for decisions” [5]

1.2. Document-Based and Model-Based Approaches

The construction process deals with several different and complex forms of information that are exchanged and modified by the actors involved, and much of it is captured, exchanged, and delivered using documents [6]. In AECO projects “Documents are interfaces, used to access and navigate through collections of information’’ [7]; thus, the sector can be defined as a document-centric industry [8,9]. As a consequence, a huge amount of unstructured data and information are produced and shared via natural language [6,7,10], such as documents and reports which require the need for specific techniques to be processed and digitally managed [11]. On the other hand, the adoption of BIM methodology tends to shift the sector toward a model-based approach, which is focused on the development and exchange of digital artifacts and models. Despite the widespread use of BIM approaches, AECO information flow is still mainly based on the production and exchange of documents [8,12,13]. Human natural language, written or spoken, is pervasive and the most communicative way to define and share knowledge. However, natural language is unstructured per se and difficult to be digitally managed [14]. Unstructured sources of information, such as text documents, are still essential components of design and construction projects [8]. The adoption of BIM in AECO industry is, in fact, an insufficient condition to leverage the value of BIM data and information [15].

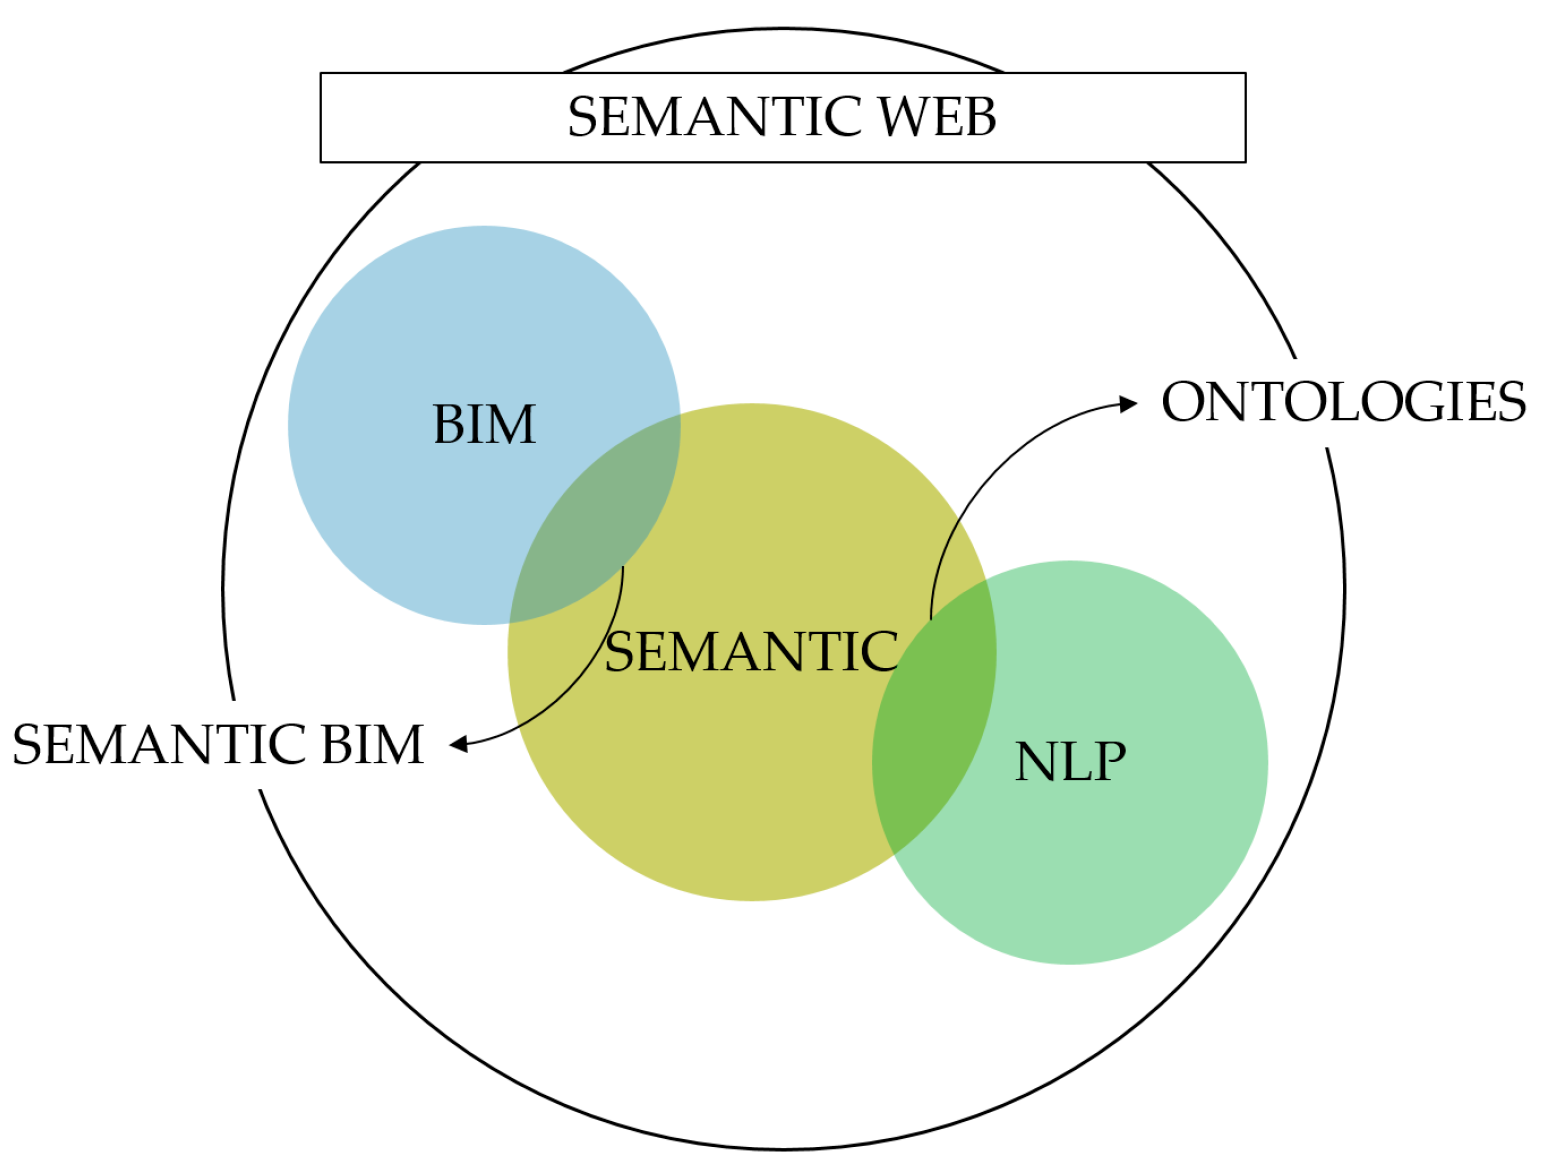
1.3. Seizing the Full Potential of Digitalization: Pairing BIM with NLP Technology

As stated above, to seize the full potential of digitalization of the construction sector, it is necessary to combine BIM with other digitalization technologies [1]. Since the construction industry is an information-intensive sector, based on the transmission of textual documents [6,8], Natural Language Processing (NLP) can be applied to overcome the document-based nature of the sector. NLP is an interdisciplinary field which aims to process natural human languages using computers [16]. NLP, or computational linguistic, is an interdisciplinary field of computer science and linguistics, and a sub-field of Artificial Intelligence (AI). It is defined as the scientific and engineering discipline concerned with understanding written and spoken language from a computational perspective. It aims to represent human language through a formal and machine-readable language [17]. Information expressed in a formal and machine-readable form can be processed, queried, and retrieved by computers similarly to how the alpha-numerical parameters and information are managed via BIM methods and tools. Consequently, the application of NLP in the construction industry may have the capability and potential to enhance and optimize the information flow, thus supporting an effective and efficient management of construction projects [18].

1.4. Goal Setting and Article Structure

The proposed study investigates the knowledge domain of NLP studies and applications in the AECO domain, including the identification and analysis of possible links and integration between BIM and NLP methods through scientific mapping and data visualization techniques. Science mapping allows to depict a picture of the body of knowledge to understand the structure and dynamics of the NLP topic in AECO industry and existing links with a BIM approach. Existing applications and research studies are investigated, helping to identify key themes and trends, visualizing the influence of articles, sources, and authors, and uncovering existing relations between countries, affiliations, and researchers. Data-driven analyses and data visualization techniques are applied to identify gaps, applications, technological drivers, and latest developments of NLP in AECO, and to investigate how NLP and BIM can be linked and can mutually improve their performances.
The manuscript is structured into five main sections: the introduction section is followed by an overview of NLP definitions, fields of application, and latest developments, the third section describes the methodology adopted to collect and analyze the bibliographic data sample, followed by a section about the discussion of the results, and a final section of conclusions and limitations of the research is provided.

2. Natural Language Processing Overview and Evolution

2.1. Linguistic and Natural Language Processing: Definition and Application Areas

Linguistics is the study of the nature, structure, and variation in human language, including: (I) phonology, which concerns the use of sounds in a particular language; (II) morphology, which concerns the structure, formation, and meaning of words; (III) syntax, which concerns the way in which words can be combined together to form (grammatical) sentences and represents the sentence structure itself; (IV) semantics, which explains how lexical meaning is combined morphologically and syntactically to form the meaning of a sentence; (V) pragmatics, which is about the use of language in context, where context includes both the linguistic and situational context of an utterance, and refers to understanding [19].
The practical goals of the NLP research field are several and diverse [20,21], however NLP research can be summarized into five main areas [22,23]:
  • Natural Language Understanding (NLU);
  • Natural Language Generation (NLG);
  • Speech or Voice Recognition;
  • Machine Translation (MT);
  • Automatic Text Summarization (ATS);
  • Spelling Correction and Grammar Checking;
  • Information Retrieval and Extraction (IR and IE);
  • Question Answering Systems or Dialogue Agents (i.e., chatbot);
  • Deep analysis of texts or spoken language for topic, sentiment, or other psychological attributes.
The ultimate goal of NLP is the design of systems able to mimic human-like ability in dialogue, in acquiring and gaining knowledge from human language and text [20]. In general, NLP techniques can be applied to convert unstructured sources of data into machine-readable and processable data and information. In this way, computers can be used to explore and manipulate natural language text or speech [24,25].

2.2. NLP History and Evolution: From Rule-Based to Pre-Trained Models

The first revolution of traditional linguistic concepts coincided with the publication of the book “Syntactic Structures” by Noam Chomsky in 1957 [26]. With his writing, Chomsky theorized that to allow a machine to understand natural language, the structure of the sentence itself must be changed. To this end, Chomsky proposed a language for the translation of natural language sentences into machine language [26]. In 1964, ELIZA, the first rudimentary chatbot in history, was born. ELIZA was designed to imitate the responses of a Rogerian psychotherapist [27]. However, after twelve years of research in the field, the results obtained through NLP were not comparable in quality and cost-effectiveness to the manual ones performed by humans. At the end of the 1960’s, research on artificial intelligence applied to natural language processing was abandoned for at least 10 years until the early 80’s. The new phase was characterized by the use of new concepts and the abandonment of previous theories. The new NLP systems were based on pure statistical systems and no longer on rule-based systems. There was a shift from the so-called rule-based approach to the approach based on statistical models and text corpora supported by the increasing computational power and the rise of the Machine-Learning algorithm. The 1980–1990 decade is known as the period of statistical NLP revolution [28]. At the beginning of the 2000s, the first neural language model based on Recurrent Neural Networks (RNN) was proposed [29]. An artificial neural network (ANN) is a nonlinear model that mimics the neural structure of the human brain in a biologically inspired way [30]. The model is capable of learning to perform different tasks. An artificial neural network is based on artificial neurons (processing elements) and it is organized into three interconnected layers: an input layer, a hidden layer composed by more than one layer, and an output layer [31]. It is demonstrated that the deep learning NLP framework has better performances than most of previous state-of-the-art approaches in several NLP tasks [32]. The deep learning NLP approach relies on Convolutional Neural Networks (CNNs) and Recurrent or Recursive Neural Networks (RNNs).
Summarizing, the NLP evolution can be broken down into three main phases from 1970 to 2010:
  • Rule-based systems: systems based on complex sets of manual written rules.
    Pros: the system has a high level of interpretability;
    Cons: it is not accurate and flexible. A rule-based system is too deterministic to manage noisy and ambiguous text data since human language is per se prone to error and incomplete.
  • Statistical inference systems: systems based on statistical models.
    Pros: statistical NLP affords rapid prototyping, the model is semi-automatically constructed from linguistically annotated resources, for that reason they are cheaper than rule-based systems [33];
    Cons: statistical systems are robust systems which means that an output is always produced regardless of the quality of the input, consequently these systems require a more careful analysis of the quality of the input [34].
  • Deep learning approach: systems based on deep learning algorithm and neural network.
    Pros: they can efficiently manage the sparsity and non-structuring of learning data, respecting the complexity, articulation, and multidimensionality of human language, furthermore, they can solve most non-trivial NLP problems;
    Cons: low explainability of the models since there is no way to investigate and explain the structure of the net after the training task. The phenomenon is called black-box effect [35]. Moreover, one of the biggest issues of the deep learning approach is the shortage of training data, since they require a huge amount of data to be trained [36].

2.3. Latest Developments: Contextual Pre-Trained Models, the Transformers Mechanism

A subset of language models, namely the pre-trained models, were developed to overcome the shortage of training data typical of the deep learning approach. In addition, language modeling is believed to be one of the main challenges in several NLP tasks. Natural language modeling is effectively addressed by such pre-trained models [37]. In fact, pre-trained models are general purpose language models trained using online text corpora (e.g., Wikipedia): such a technique is defined as pre-training [38]. Pre-Trained Models on large corpora can learn universal language representations, avoiding training a new model from scratch. General pre-trained models can then be fine-tuned for specific NLP tasks: this technique is called transfer-learning [39].
Pre-trained language model representations can be context-free or contextual, and contextual representations can be unidirectional or bidirectional. Context-free models do not take into account the words near a given word. On the other hand, contextual models generate a representation of each term considering the other words in the sentence by relating the meaning of a word with the entire sentence. The importance of bidirectional pre-training for language representations has been widely demonstrated [36]. In late 2018, Google released BERT (Bidirectional Encoder Representations from Transformers), a new technique for contextual pre-training. The BERT algorithm is based on Transformers, a type of neural network architecture optimized for processing texts that learns contextual relations between words. BERT and, in general, Transformers-based models, are currently the state of the art for several NLP tasks, allowing the same pre-trained model to successfully tackle a broad set of NLP tasks [36]. Transformers-based language pre-trained models can represent the characteristics of word usage such as syntax and how words are used in various contexts [40]. A list of the main Transformers-based pre trained language models is provided as follows:
  • BERT (Bidirectional Encoder Representations from Transformers);
  • ULMFiT (Universal Language Model Fine-Tuning);
  • OpenAI’s GPT-2 and GPT-3 (Generative Pre-Trained Transformer).
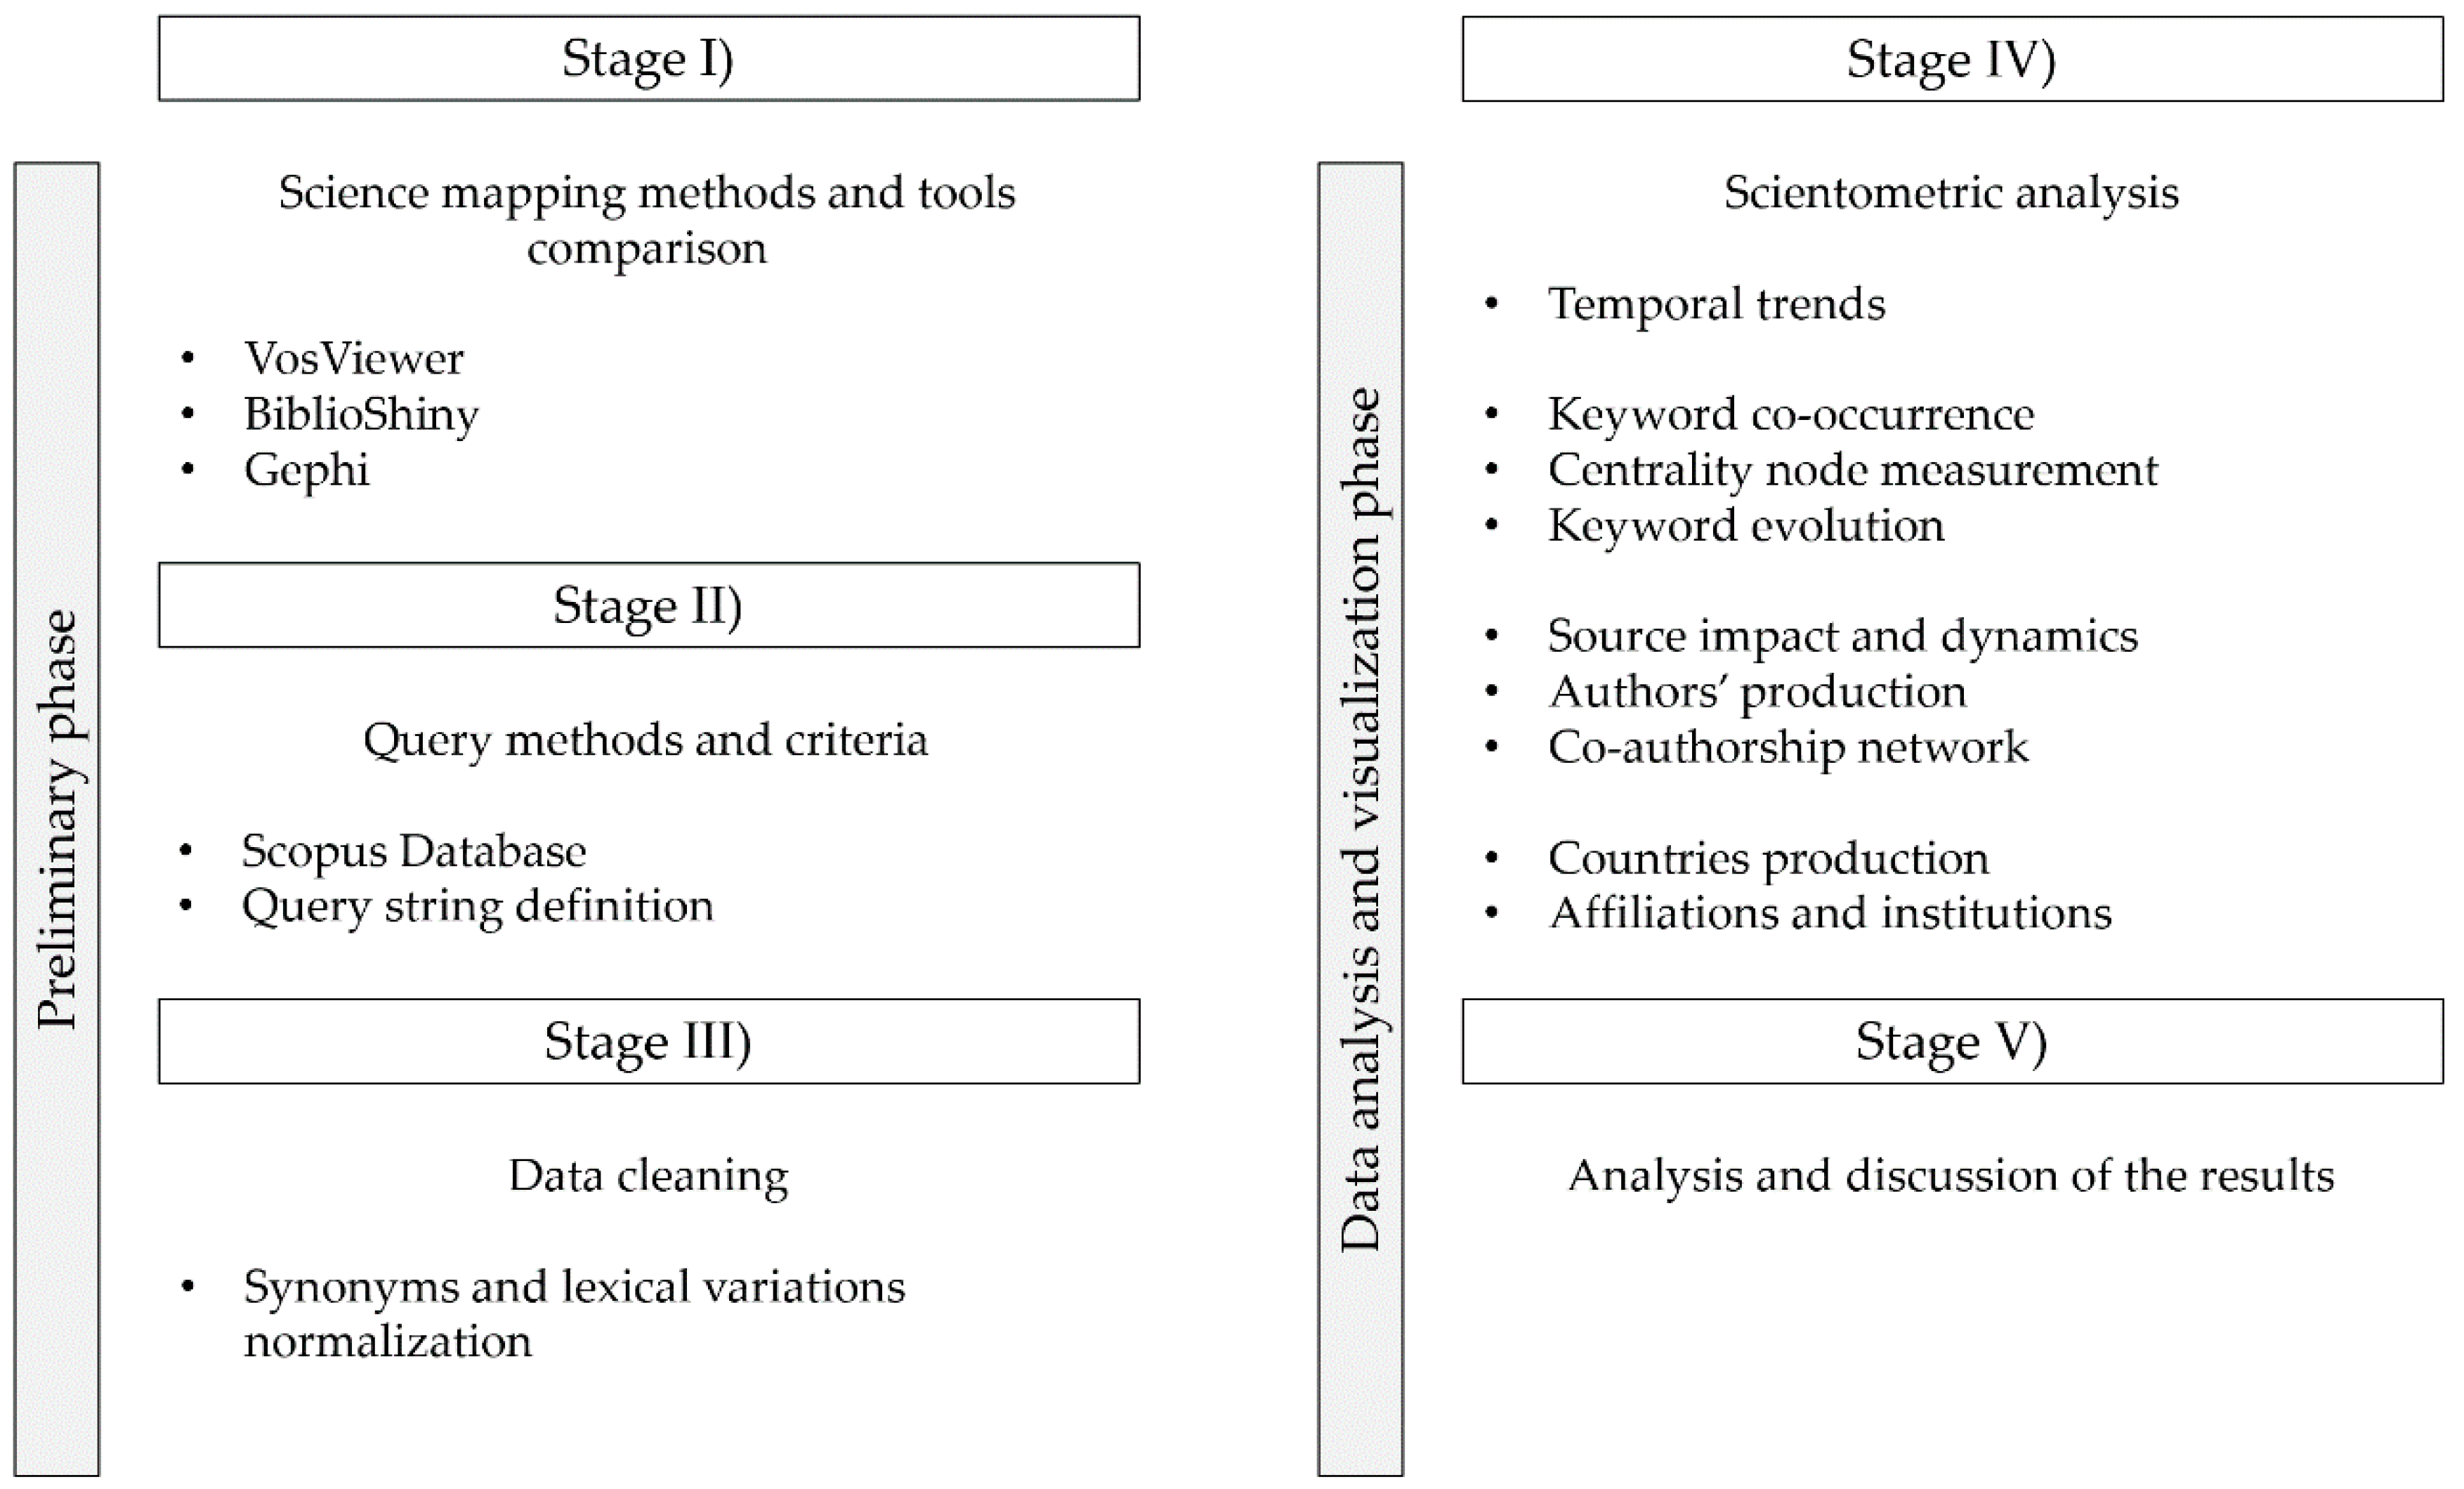
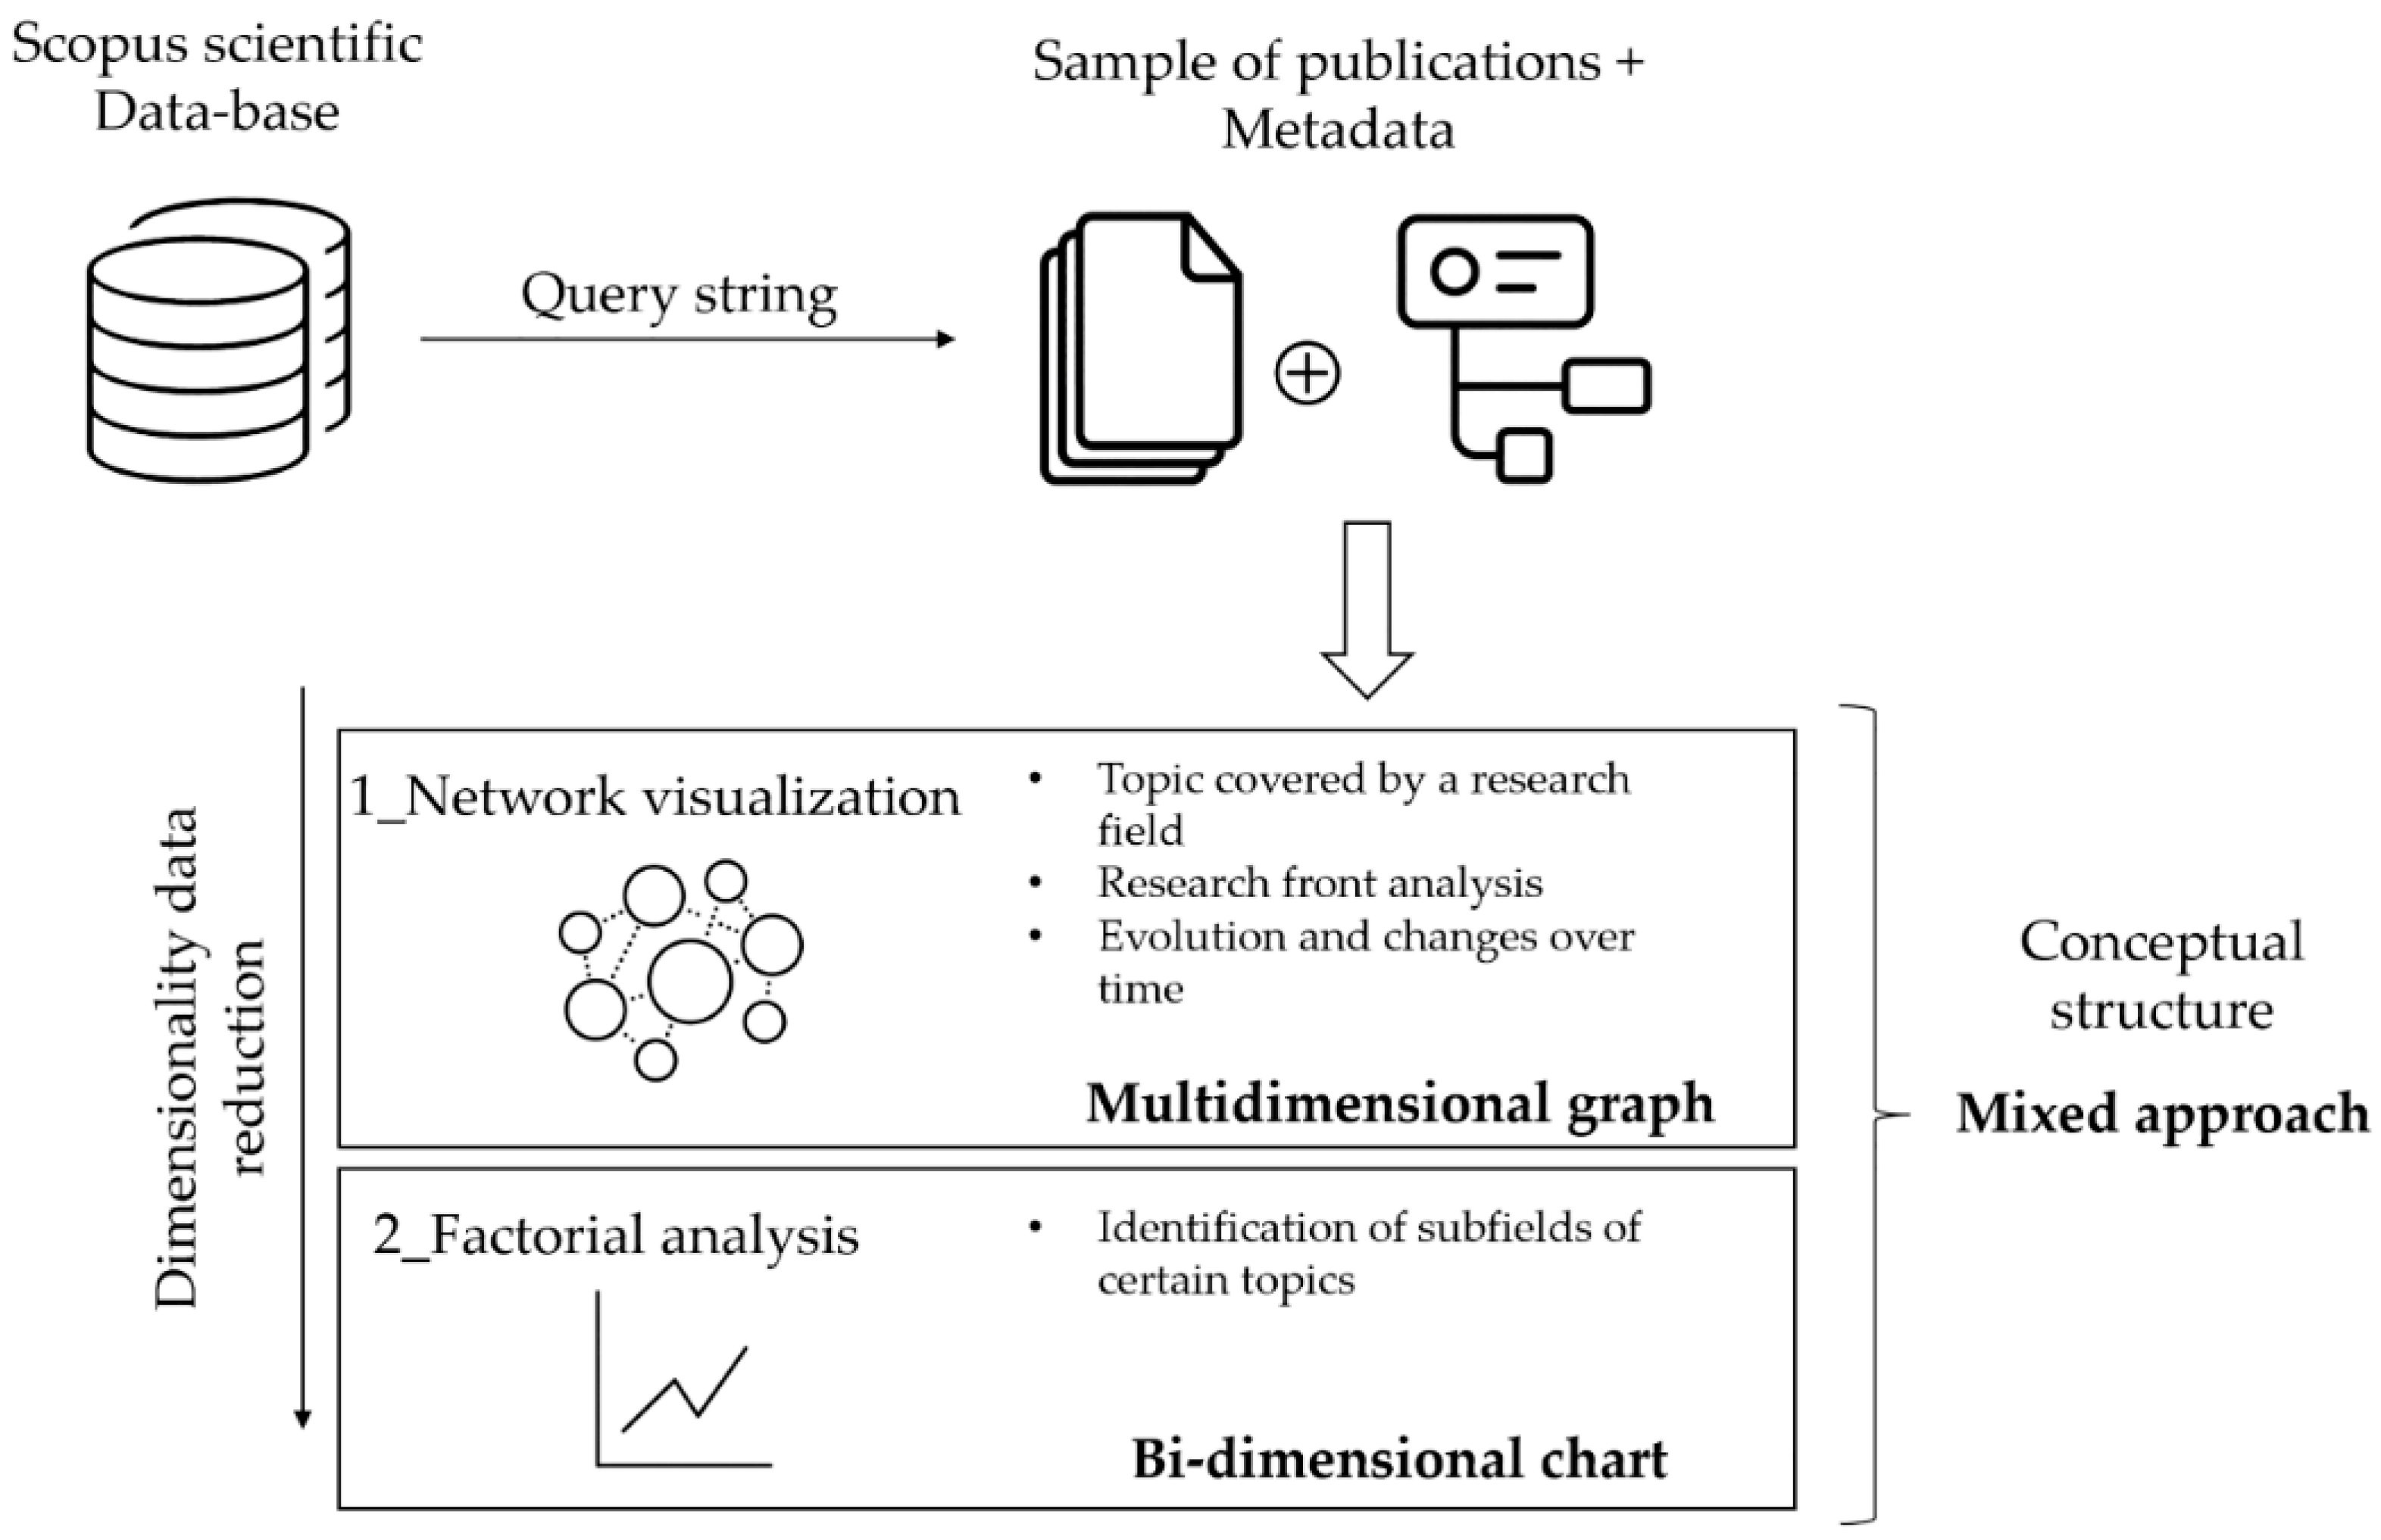
3. Methodology

The research methodology is structured into the following phases: (I) science mapping methods and tools selection; (II) query methods and criteria; (III) data cleaning; (IV) scientometric analysis; (V) analysis and discussion of the results (Figure 1).

3.1. Science Mapping Methods and Tools Selection

The study proposes a scientometric literature review based on data visualization. Science mapping methods and tools are applied to analyze the current scientific literature on NLP in the AECO field and NLP and BIM combined applications. Science mapping purpose is the analysis and visual description of a scientific knowledge domain. In order to represent a specific knowledge domain, a collection of intellectual contributions should be gathered and analyzed [41]. Significant patterns and trends in the scientific literature and bibliographic data can be uncovered by science mapping. Scientometric methods include: longitudinal and cross temporal trends, keyword co-occurrence analysis, co-citation and co-authorship analysis [42], document co-citation analysis [43], and other analyses. Visualization techniques include network visualization [44], and visualizations of temporal and geo-localization structures [45]. Metrics and indicators of research impact are also considered [46].
An analysis of the main science mapping tools has been conducted. Each tool has its own limitations and strengths. Therefore, an analysis and a comparison among tools are necessary. Studies which compare science mapping tools have already been performed [47,48]. Specifically, Moral-Muñoz et al. provide a complete overview and comparison of the features of the main science mapping tools, as summarized in Table 1.
BiblioShiny [49], VosViewer, and Gephi are identified as the most suitable tools for the scientometric analysis. BiblioShiny incorporates all the analyses that the other tools allow to perform separately. Furthermore, it allows obtaining multiple visualizations and graphs directly from the web-based interface. The interface menu follows the science mapping analysis workflow and, thus, coding skills are not needed. VosViewer [50] has fewer features compared to BiblioShiny; however, it allows producing enlightening visualization of network relationships. Therefore, the scientometric analysis is performed using both BiblioShiny and VosViewer. Gephi software is used to calculate specific metrics such as the Degree centrality value, which measures the relative influence of a keyword upon the other keywords.

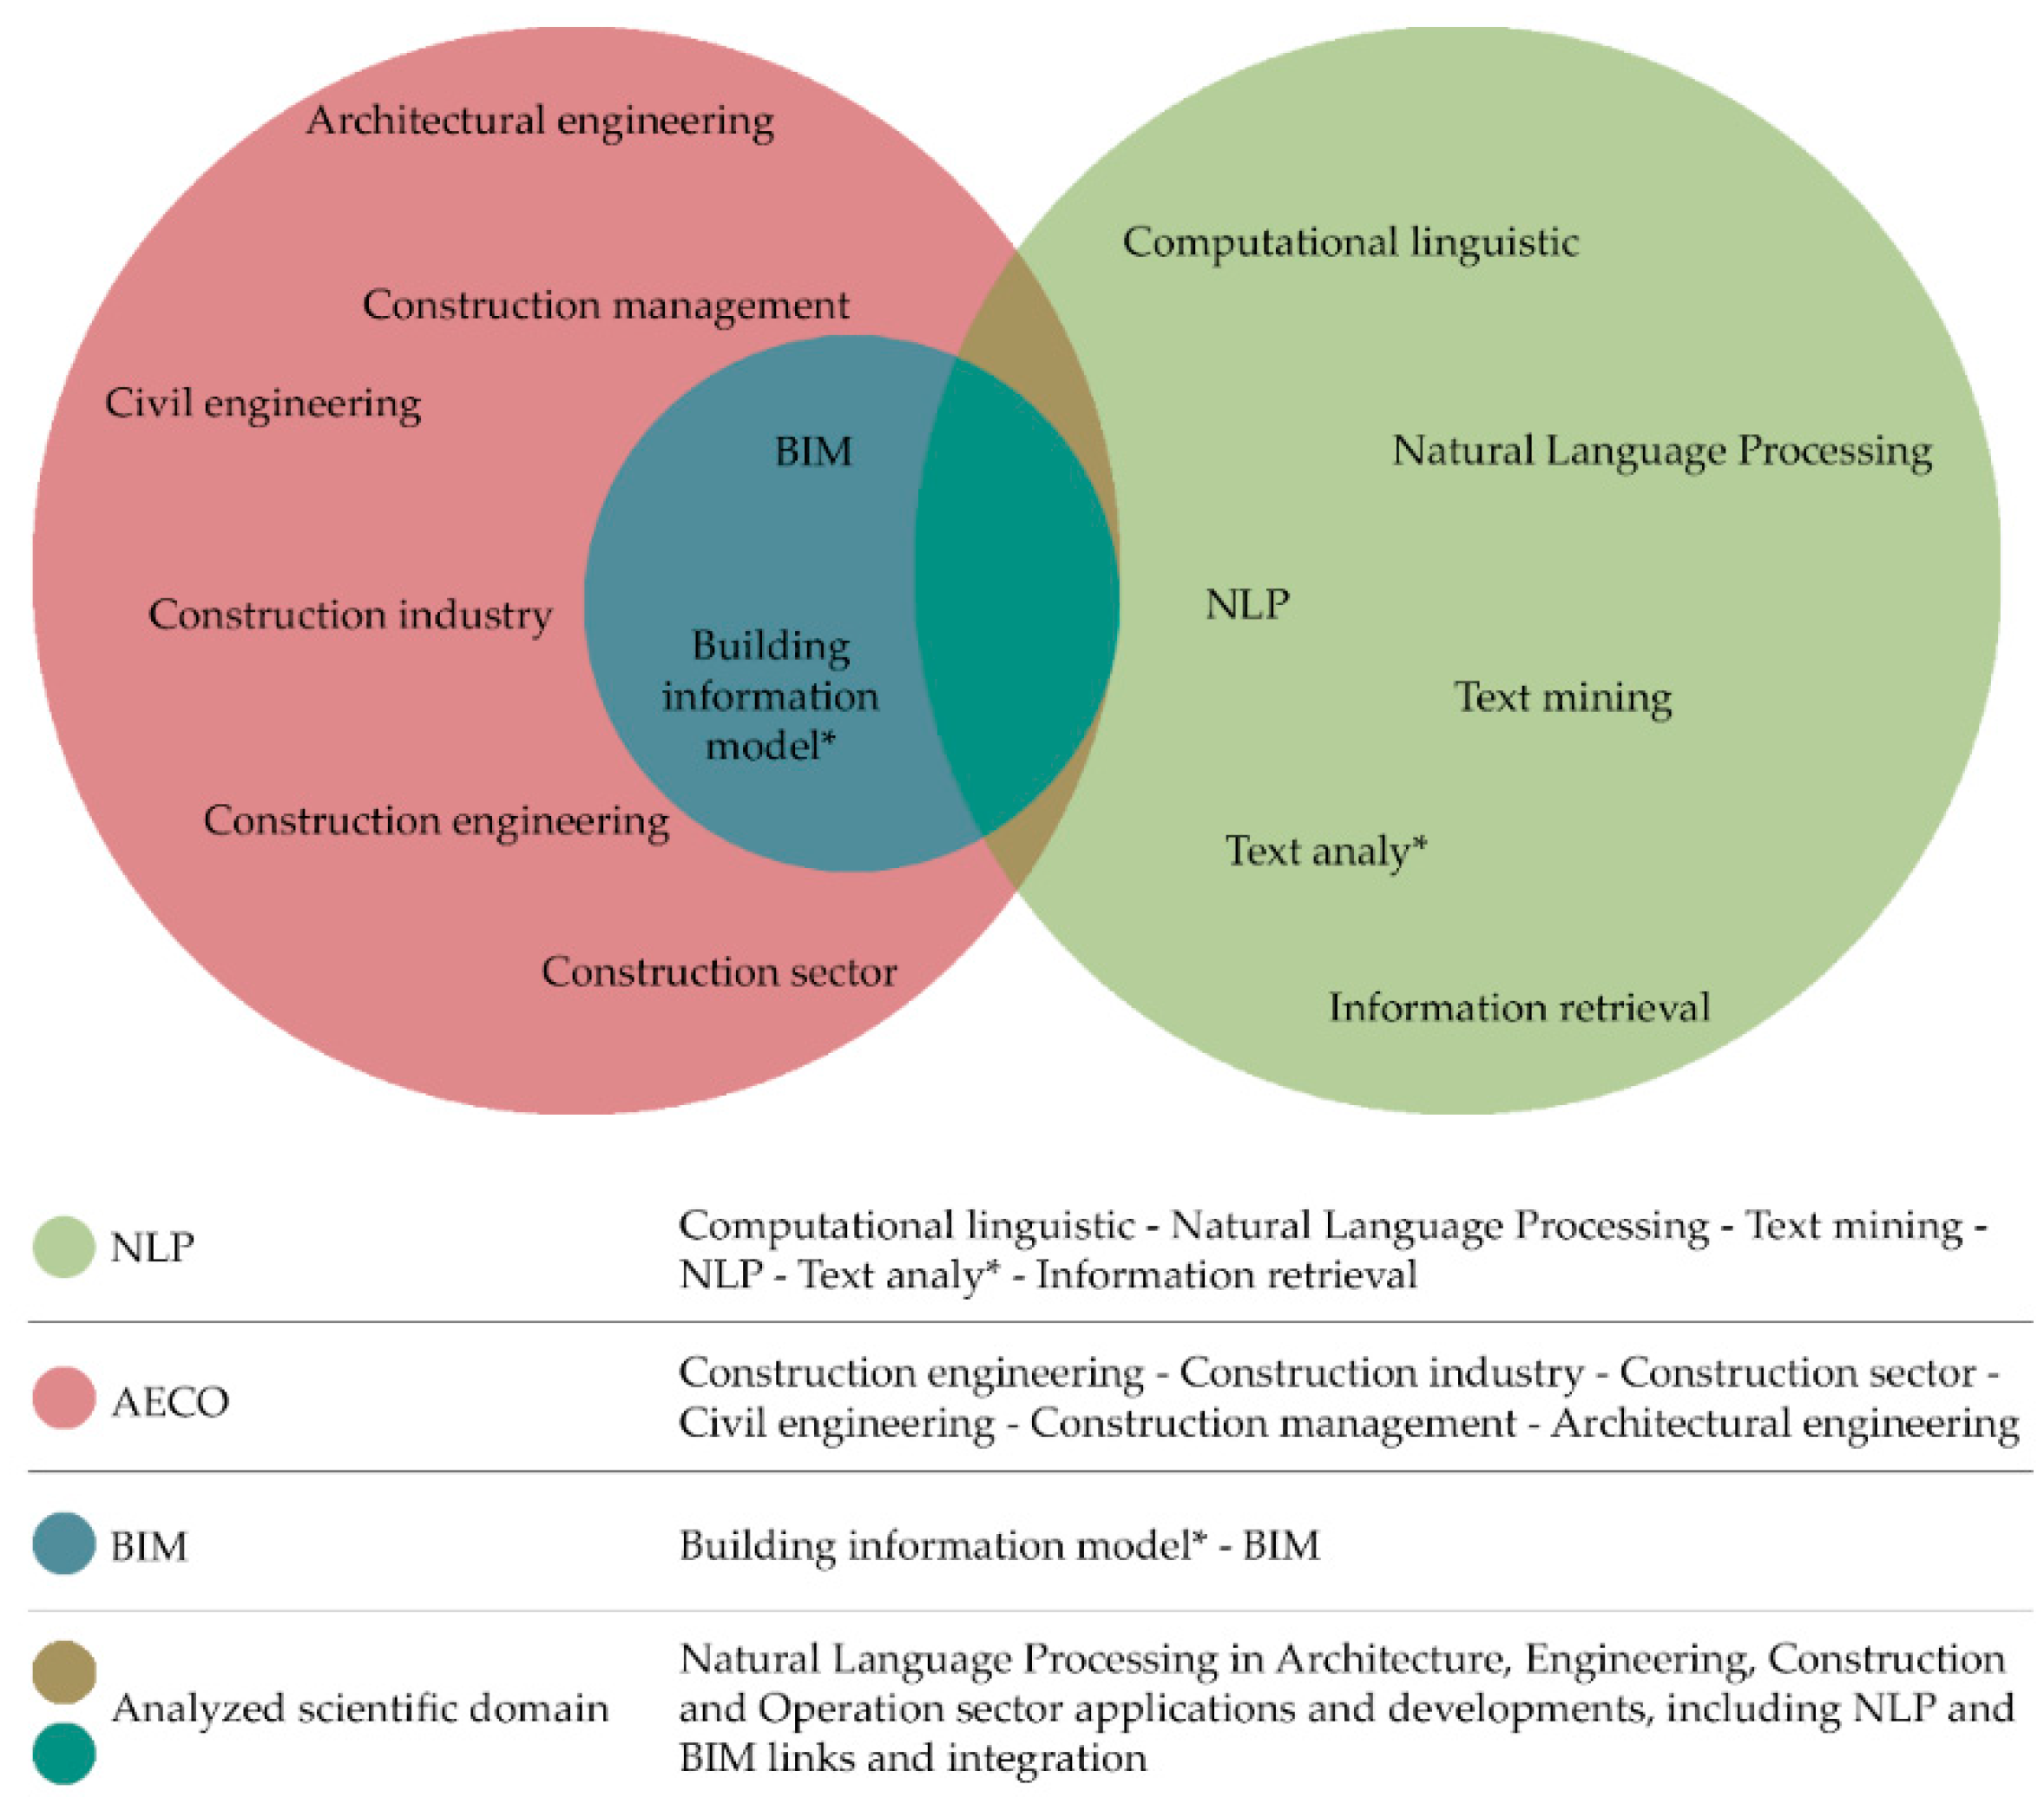
3.2. Query Methods and Criteria

The research was conducted at the end of December 2020, following a systematic literature review method. Specific criteria were established before the search phase: the search was restricted to full-English text articles published and stored in the Scopus Database (DB) only. The most reputable scientific DB available are Web of Science (WOS core collection) and Scopus. Both DBs are recognized as the most complete and reliable data source in several scientific fields [51,52,53]. The two DBs show overlaps in publications and bibliometric data. However, Scopus has a larger coverage of scientific production than WoS. Moreover, Scopus has a faster indexing process than WoS [54]. For these reasons, recent publications can be retrieved in Scopus, improving the scientometric analysis with more updated data. As stated, bibliometric data from the two DBs are strongly related. In addition, Scopus allows for detecting, in a more accurate way, the different researchers through citation count and h-index [55]. It is also demonstrated that there are no significant differences in the bibliometric analysis results coming from the two DBs [56]. According to the rationales given above, the proposed scientometric analysis is based on bibliometric data gathered from Scopus only. Consequently, the study does not merge the data from WoS and Scopus or other Databases. The choice does not affect the validity of the scientometric investigation, as explained above. Moreover, many previous scientometric studies have been based on Scopus, and Scopus has been recognized as a better choice for interdisciplinary research topics, such as NLP in AECO and NLP and BIM, than Web of Science [57,58].
A list of keywords to query the DB has been defined, which allowed the selection of a sample of publications and the related bibliometric meta-data corresponding to the boundaries of the knowledge domain of NLP in AECO, and BIM and NLP combined applications, as detailed in Figure 2. Keywords have been selected from previous related scientometric studies [59]. Boolean operators and wild cards are used to compose a keywords string to query the Scopus DB. Wild cards are shortcut characters (i.e., the asterisk *) which allows the inclusion of spelling variations and derivatives of the keywords without having to type each one individually. The string used to collect the data form the DB is provided as follows:
  • (“Civil engineering” OR “Construction engineering” OR “Architectural engineering” OR “Construction industry” OR “Construction management” OR “Construction sector” OR “BIM” OR “Building information model*”) AND (“Natural Language Processing” OR “NLP” OR “Text mining” OR “Computational linguistic” OR “Information retrieval” OR “Text analy*”).
The first query string represents the AECO field and the BIM subtopic. The keywords list has been defined based on previous review studies on BIM and AECO topics [53,60,61,62]. The second query string represents the NLP topic. The most common synonyms of NLP are used to collect an adequate number of publications. Keywords are again selected based on previous studies on the topic of NLP [63]. The first set of articles has been filtered by subject area, excluding the knowledge fields not related to AECO. A set of 254 publications has been identified, and all the useful bibliographic data, necessary for the analysis, have been downloaded from Scopus DB.

3.3. Data Cleaning

Before running the analyses, similar keywords and synonyms have been normalized by merging different variants of the same keyword (Table 2). The lexical variants and synonyms of BIM, NLP, and construction sector topics have been merged into a single term to clean the dataset from noisy data. On the other hand, keywords not belonging to those topics have not been modified to preserve the heterogeneity of the sample and to better represent the complexity of knowledge related to the main topics.
The data cleaning activity has been performed by two of the co-authors of the paper to improve the normalization of synonyms and lexical variants of the keywords. The data set collected and cleaned has been analyzed through BiblioShiny to provide the main descriptive information about the data sample (Table 3).

4. Results and Discussion

The results and discussion section is divided into sub-paragraphs, each containing a brief description of the scientometric task performed, the results obtained, and the related discussion.

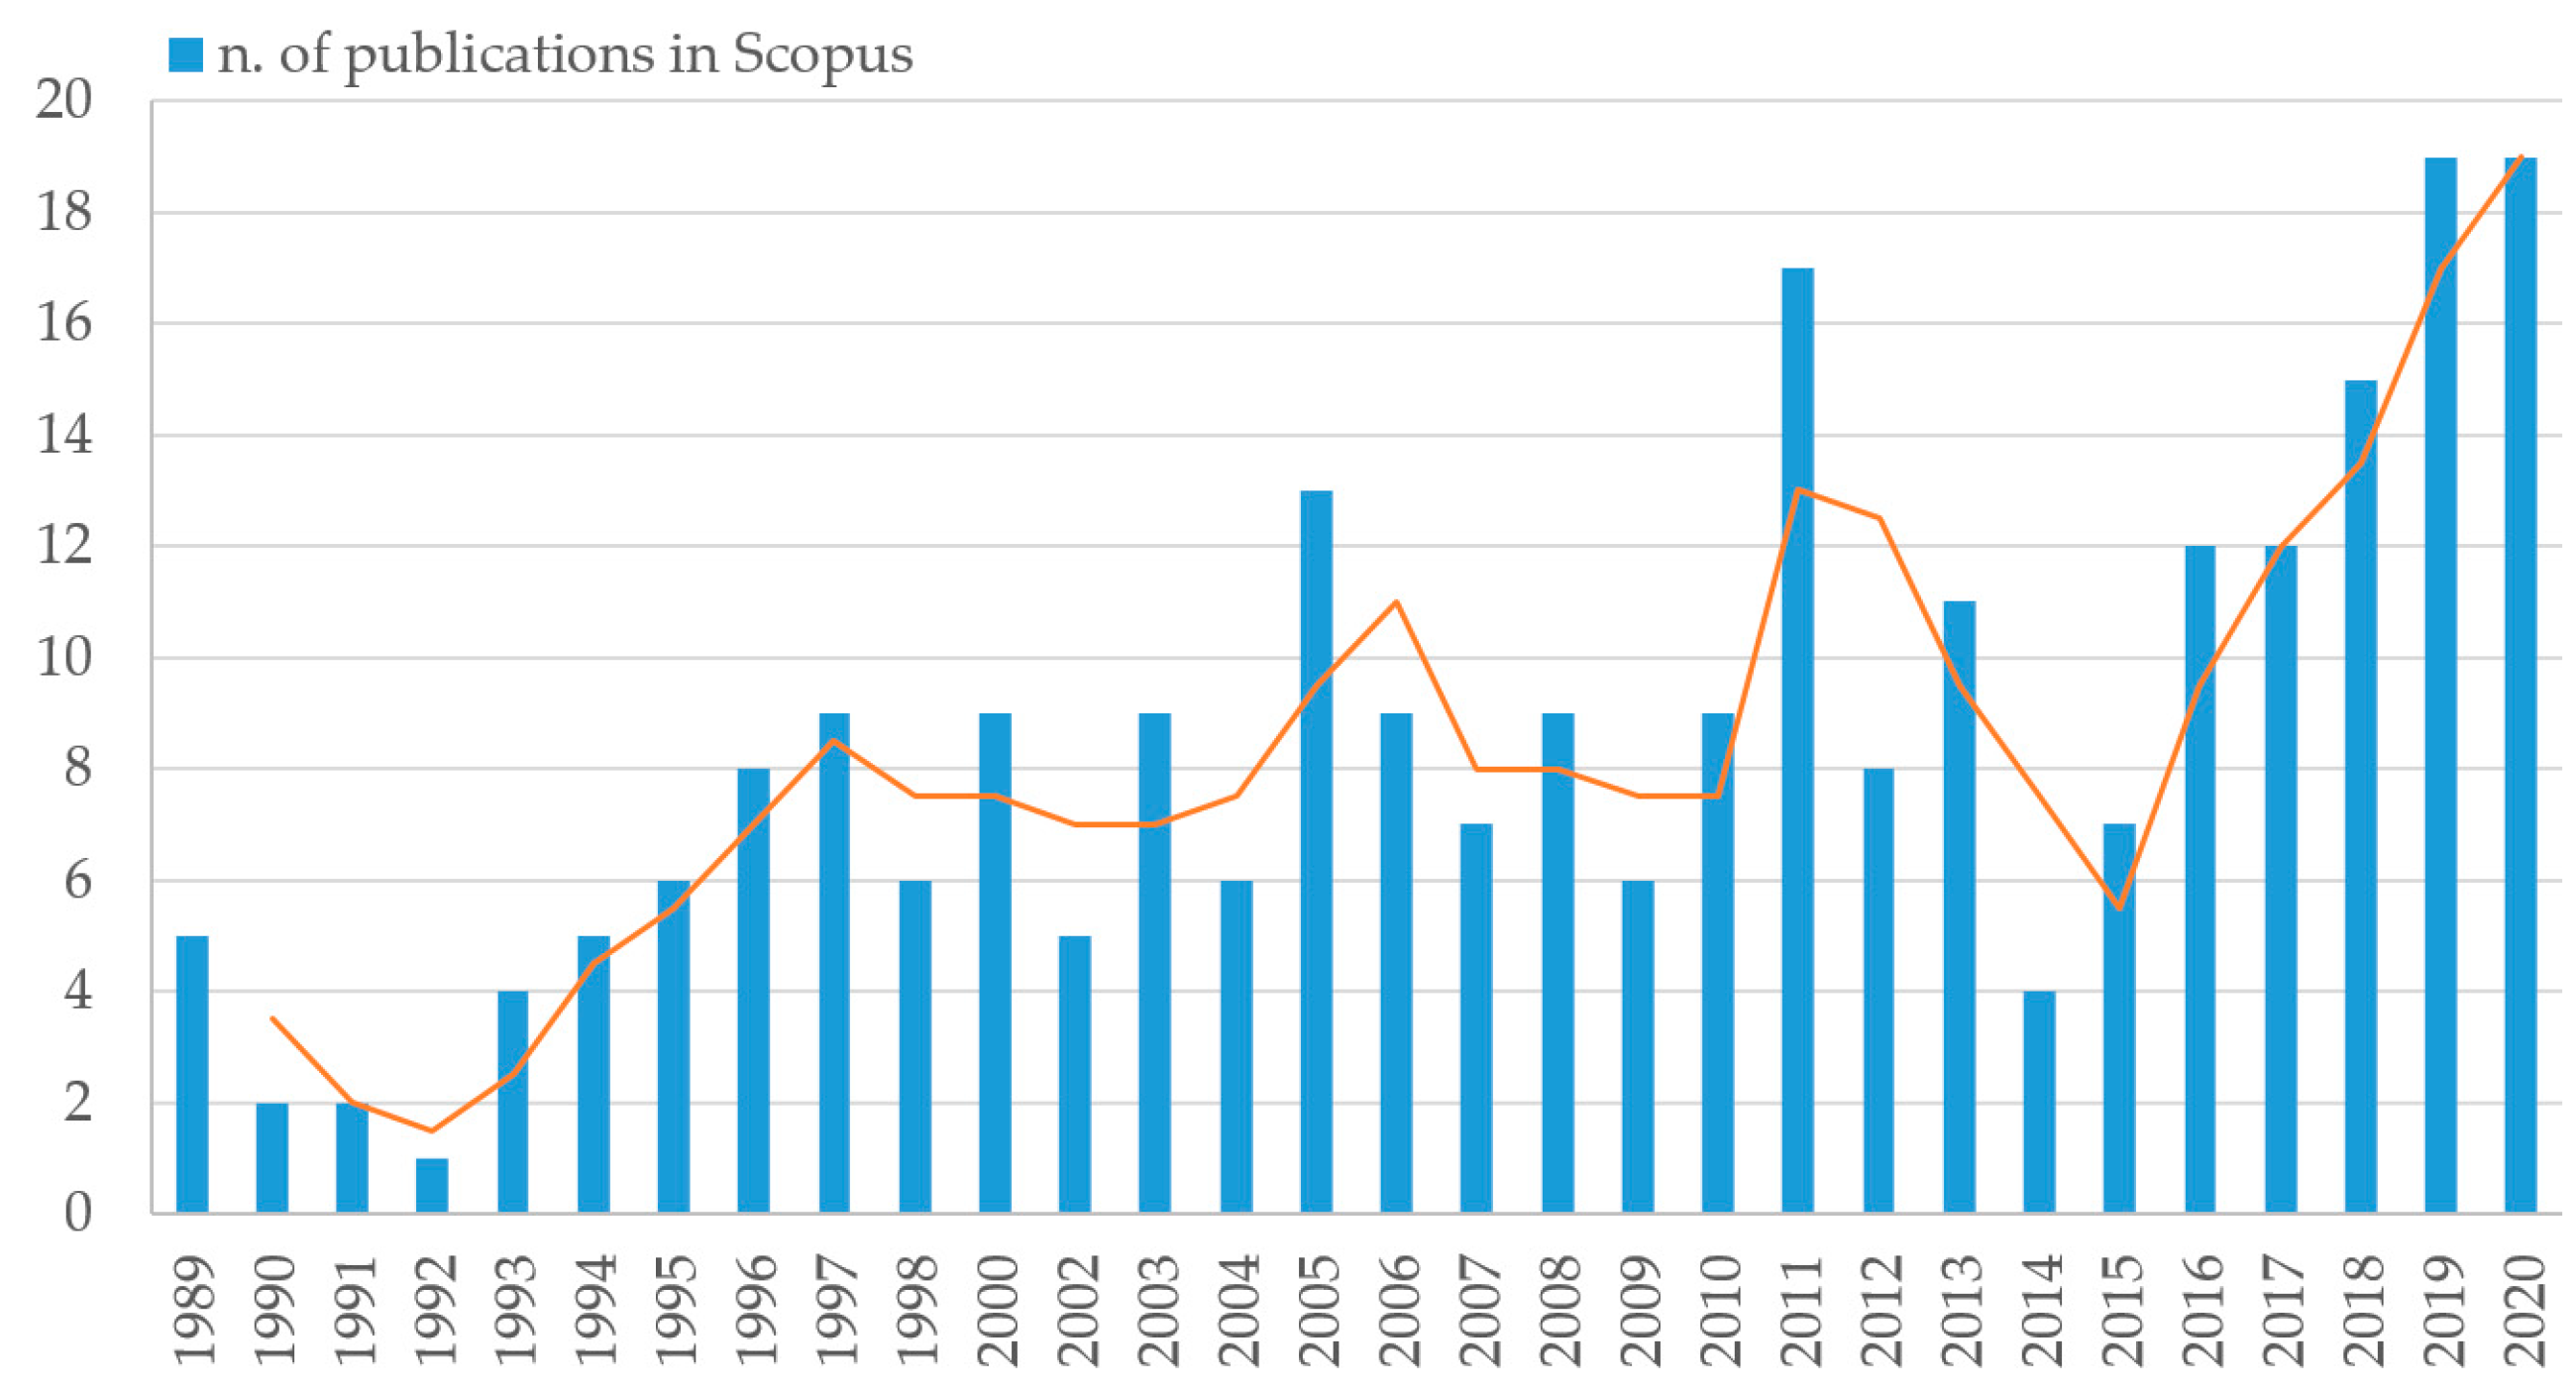
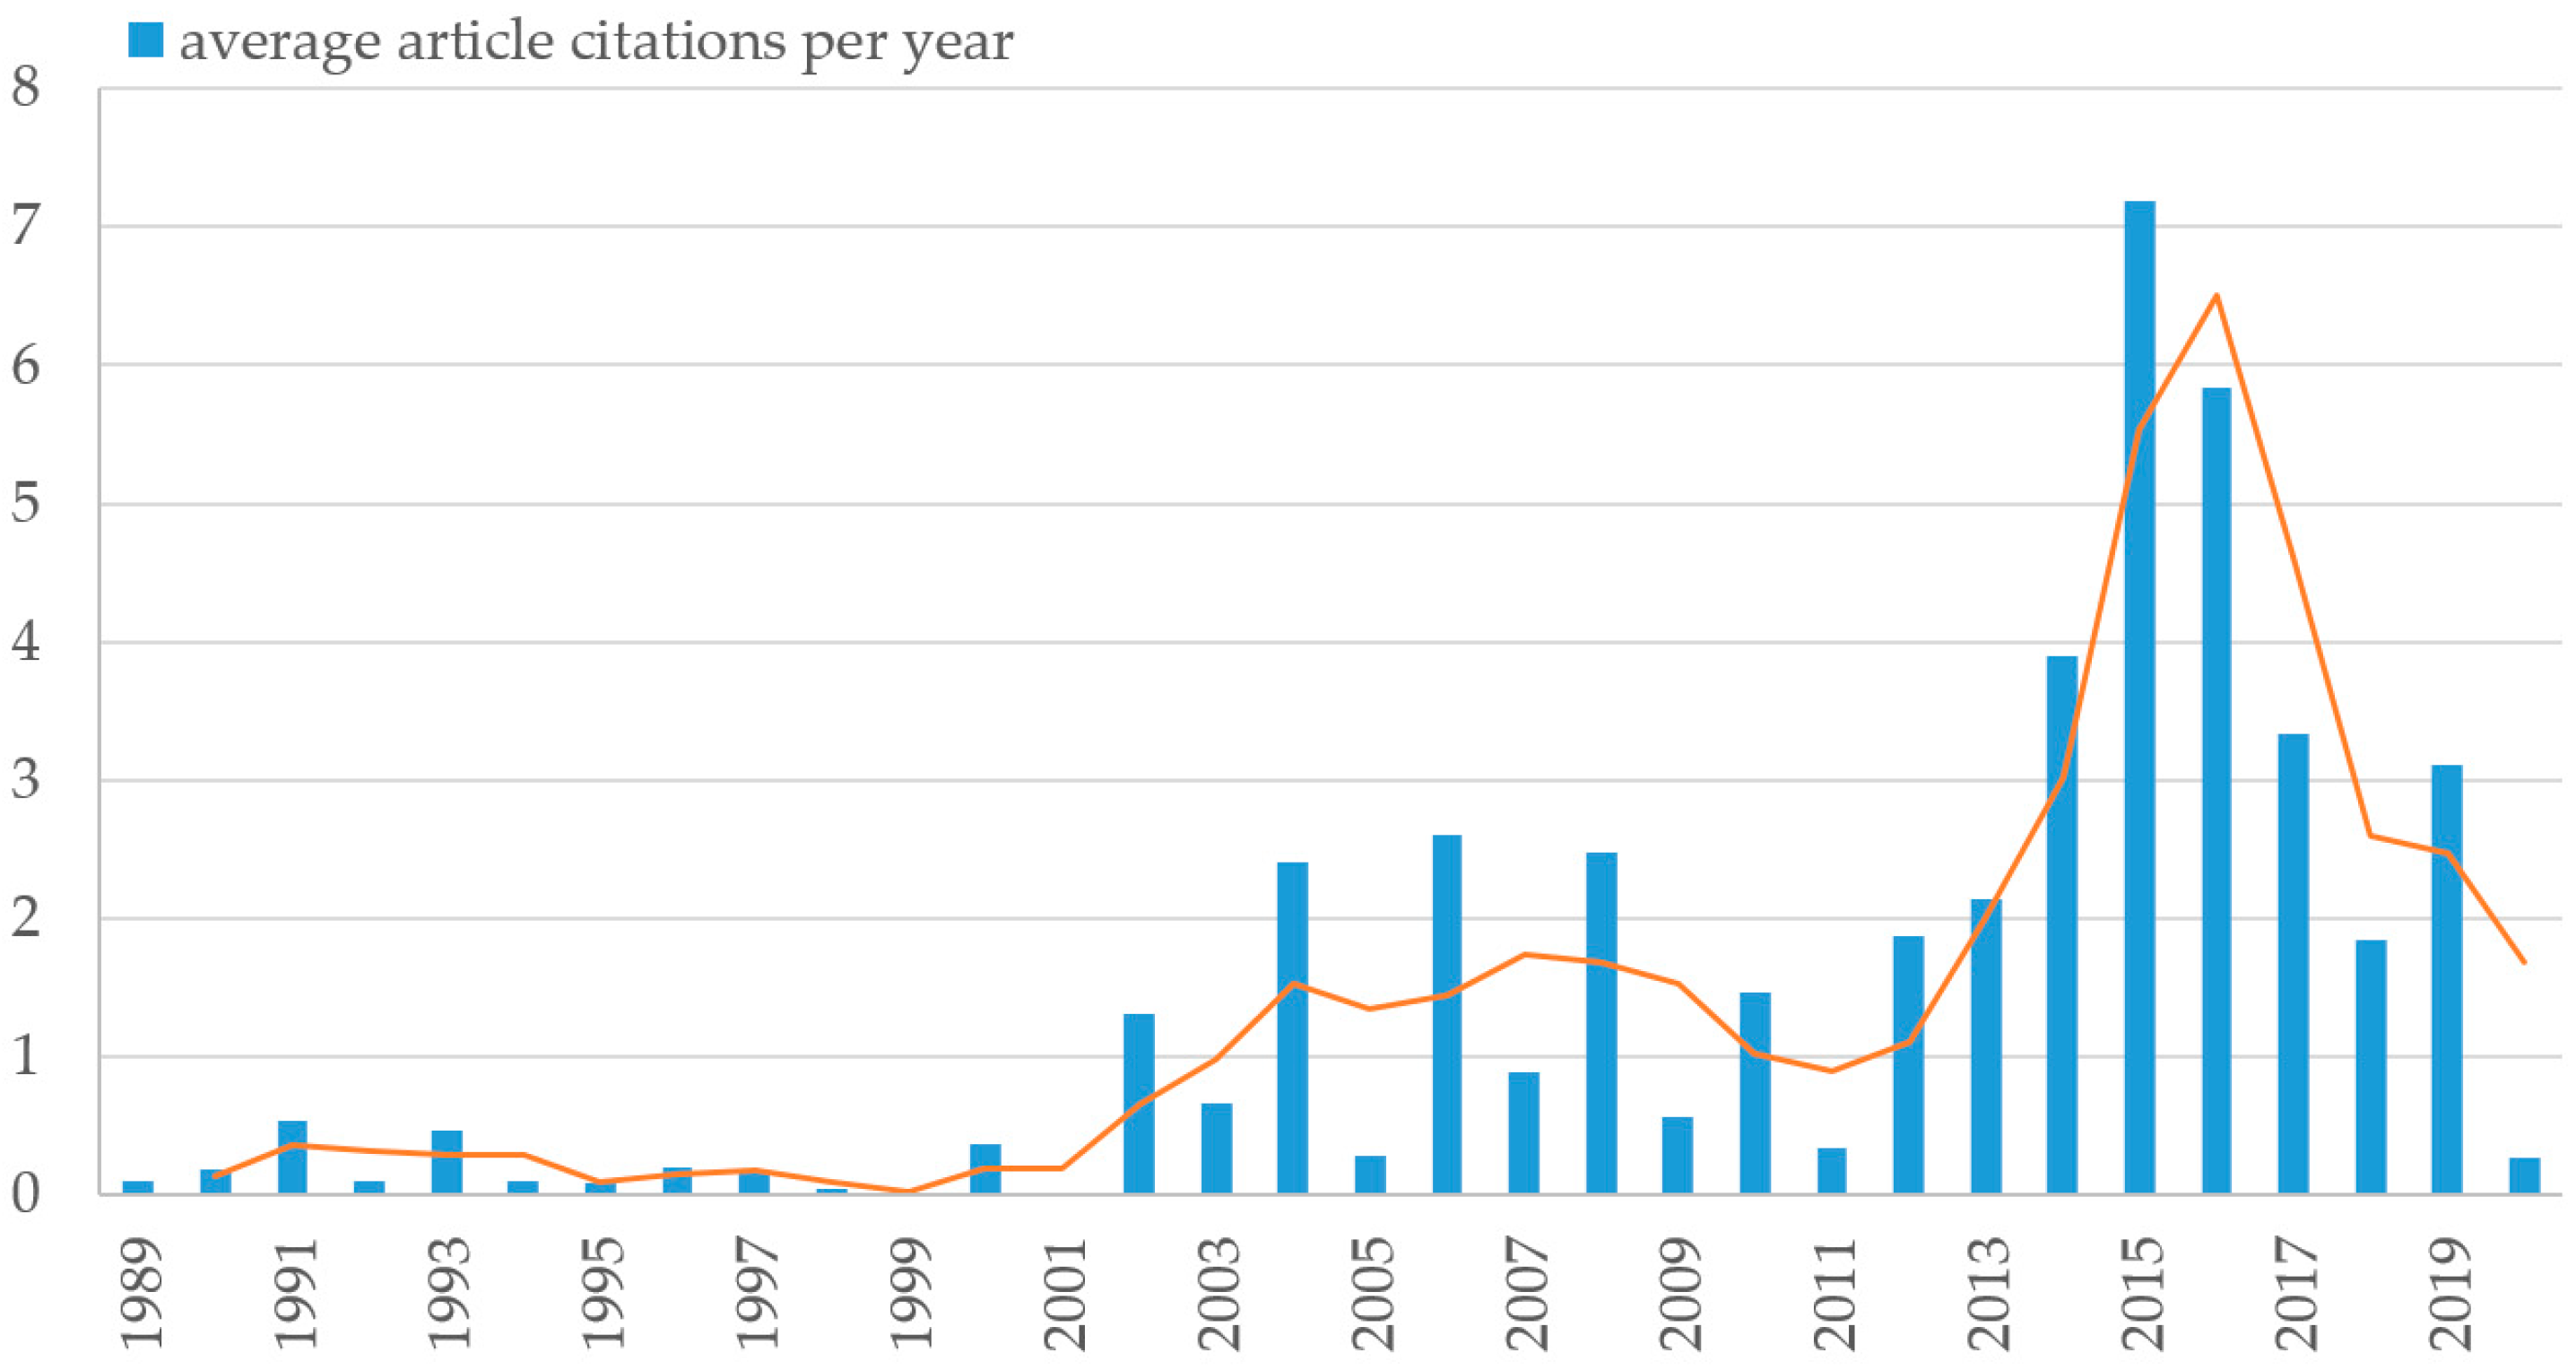
4.1. Temporal Trends

4.1.1. First Application and Annual Scientific Production Trend

The first NLP application on the AECO field appeared in 1989 with an article titled “Knowledge Processing for Construction Management Data Base,” published in the Journal of Construction Engineering and Management. It should be noted that the 1980–1990 decade is known as the period of statistical NLP revolution [28]. In the wake of the statistical revolution, NLP statistical systems, which were cheaper and more flexible than the previous rule-based systems [33], were developed and tested in industry during the decade. The authors Logcher et al. aimed to design a data-base query system to help construction managers retrieve useful information to support the decision making process [64]. In their system architecture, the authors proposed a language analyzer (or natural language processor) to facilitate information retrieval and access by allowing the user to query the database in near-natural language. The natural language processor can be considered the first rudimentary application of NLP systems in the construction industry.
Temporal data show that the research topic has been around for 31 years, with an average Annual Growth Rate of 4.71%. Figure 3 shows the temporal trend of the research topic from 1989 to 2020. The research production about the topic is characterized by several fluctuations. However, the graph shows an upward trend throughout the years, with a sizable increase in research production in the more recent years. A primary increase in scientific production can be seen around 1997, a second around 2005, and a third around 2011, with a clear reduction in the number of publications in 2014 and a subsequent steady and gradual increase of interest in the research community from 2015 onward.
The concurrent need for AECO to manage unstructured data, in order to obtain useful insights to support the decisions making process, and the recent applications of NLP for knowledge acquisition and information retrieval, can be a factor for the rising interest in the topics, as also stated by Bilal et al. 2016 [65].

4.1.2. Average Citation per Year Trend

In the collected data set, one or more articles published in 2015 gather the highest number of average total citation per year, as shown in Figure 4. The trend of average citation per year seems not to match the trend of scientific production with a positive fluctuation in the year 2015 and a steady decrease towards 2020. The misalignment between the two trends can be caused by the high degree of innovativeness of the NLP theme in the construction sector, which is investigated by a limited number of research groups. Moreover, the analysis of the size and degree of collaboration between researchers, reported in detail in the following Section 4.5.3, shows the presence of small research groups with a small network of relationships. Small size and a limited number of collaborations could be the causes of the low impact on the scientific community in terms of citations.

4.2. Conceptual Structure Analysis: Key Research Patterns, Affinity, and Links

The term “conceptual structure” refers to the graphical representation of relations among concepts (keywords or words) in a sample of publications [66]. The conceptual structure of a set of documents can be investigated using a network visualization (e.g., co-words network, co-occurrence keywords network). Network visualization helps to understand the topics covered by a research field, defining the most important and recent topics, the so called research front [67]. Plotting meta-data related to the publication period similarly allows studying the evolution and the changes of a subject over such a period.
A similar approach to network analysis is the factorial analysis. Factorial analysis is a data reduction technique which helps to identify subfields of the major topics. Factorial analysis relies on the dimension reduction algorithm (e.g., correspondence analysis (CA), Multiple Correspondence Analysis (MCA), Principal Component Analysis (PCA)) [68]. The factorial analysis approach reduces the dimensionality of data; this parameter refers to how many attributes/variables are represented in a dataset. Factorial analysis can represent the dataset in a lower-dimensionality space.
This study adopts a mixed approach to investigate the bibliometric data sample; the methodology adopted is summarized in Figure 5. The analysis starts providing conceptual networks (co-occurrence keyword and temporal overlay networks), after which networks are dimensionally reduced using factorial analysis and the related bi-dimensional matrixes are plotted. The x and y axes of the bi-dimensional graph are functions of the centrality and density of the network graphs themselves. The adopted mixed approach allows representing the several subfields and the thematic evolution of the main topics.

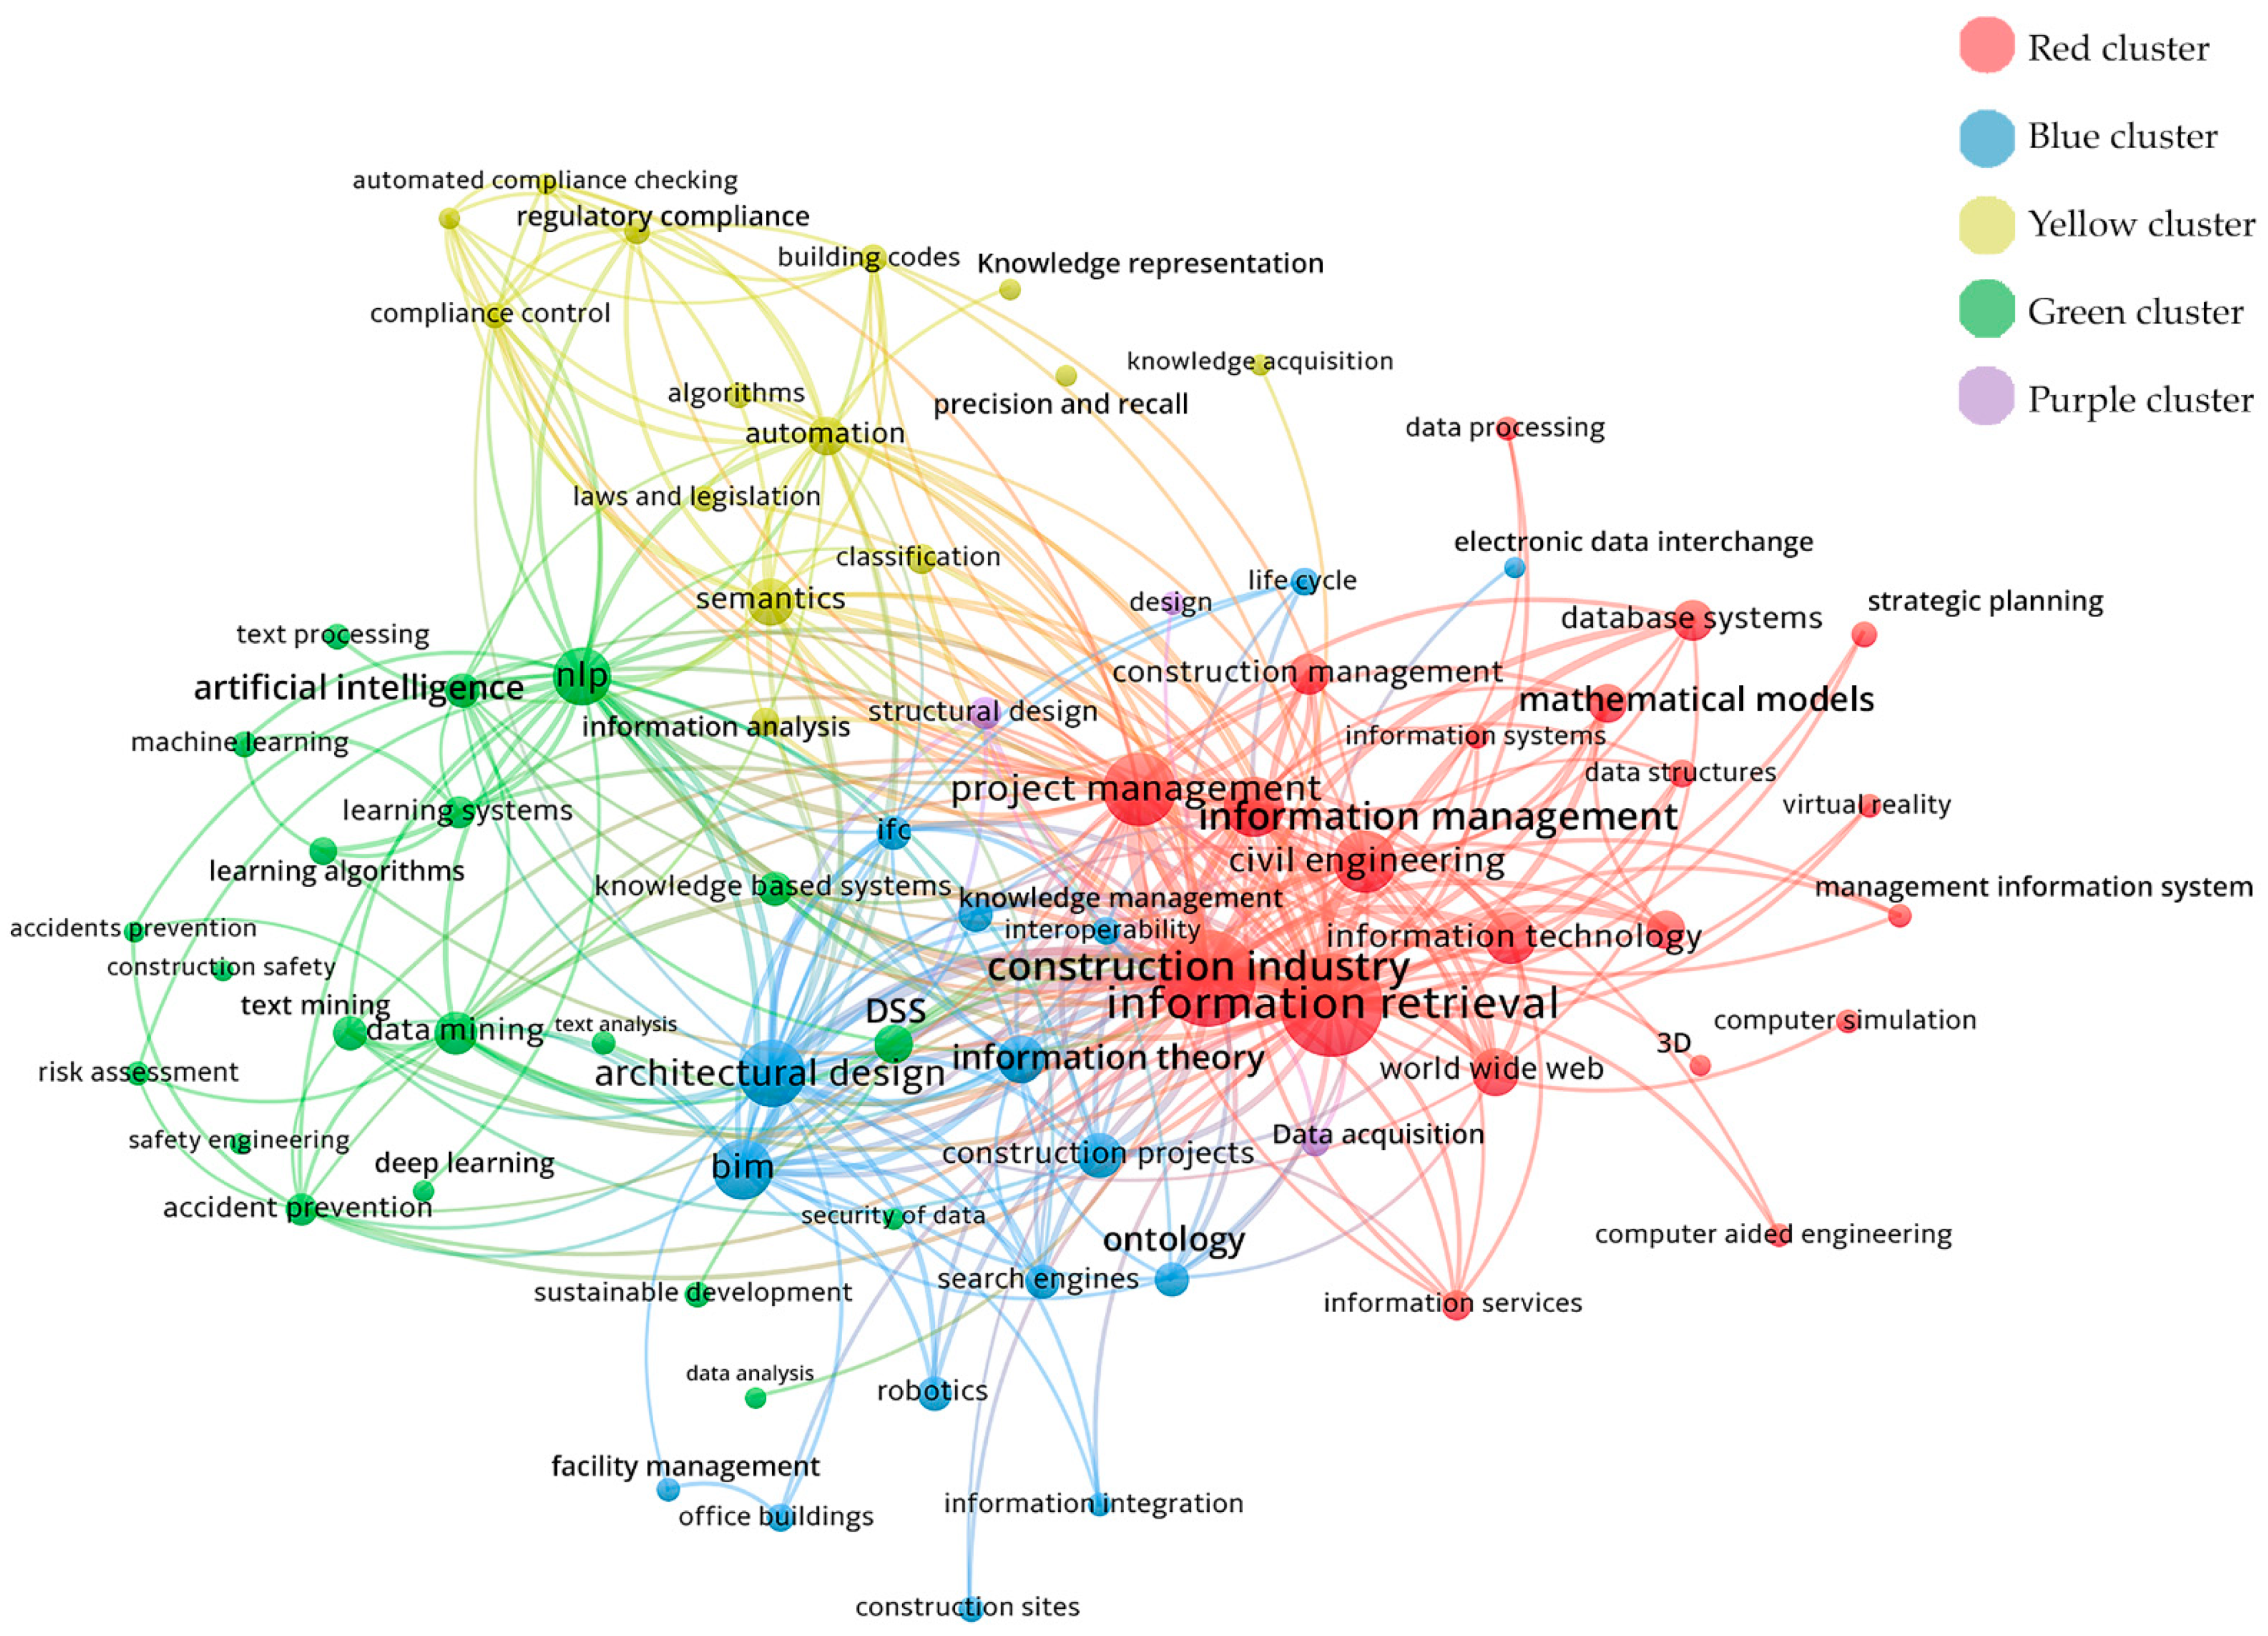
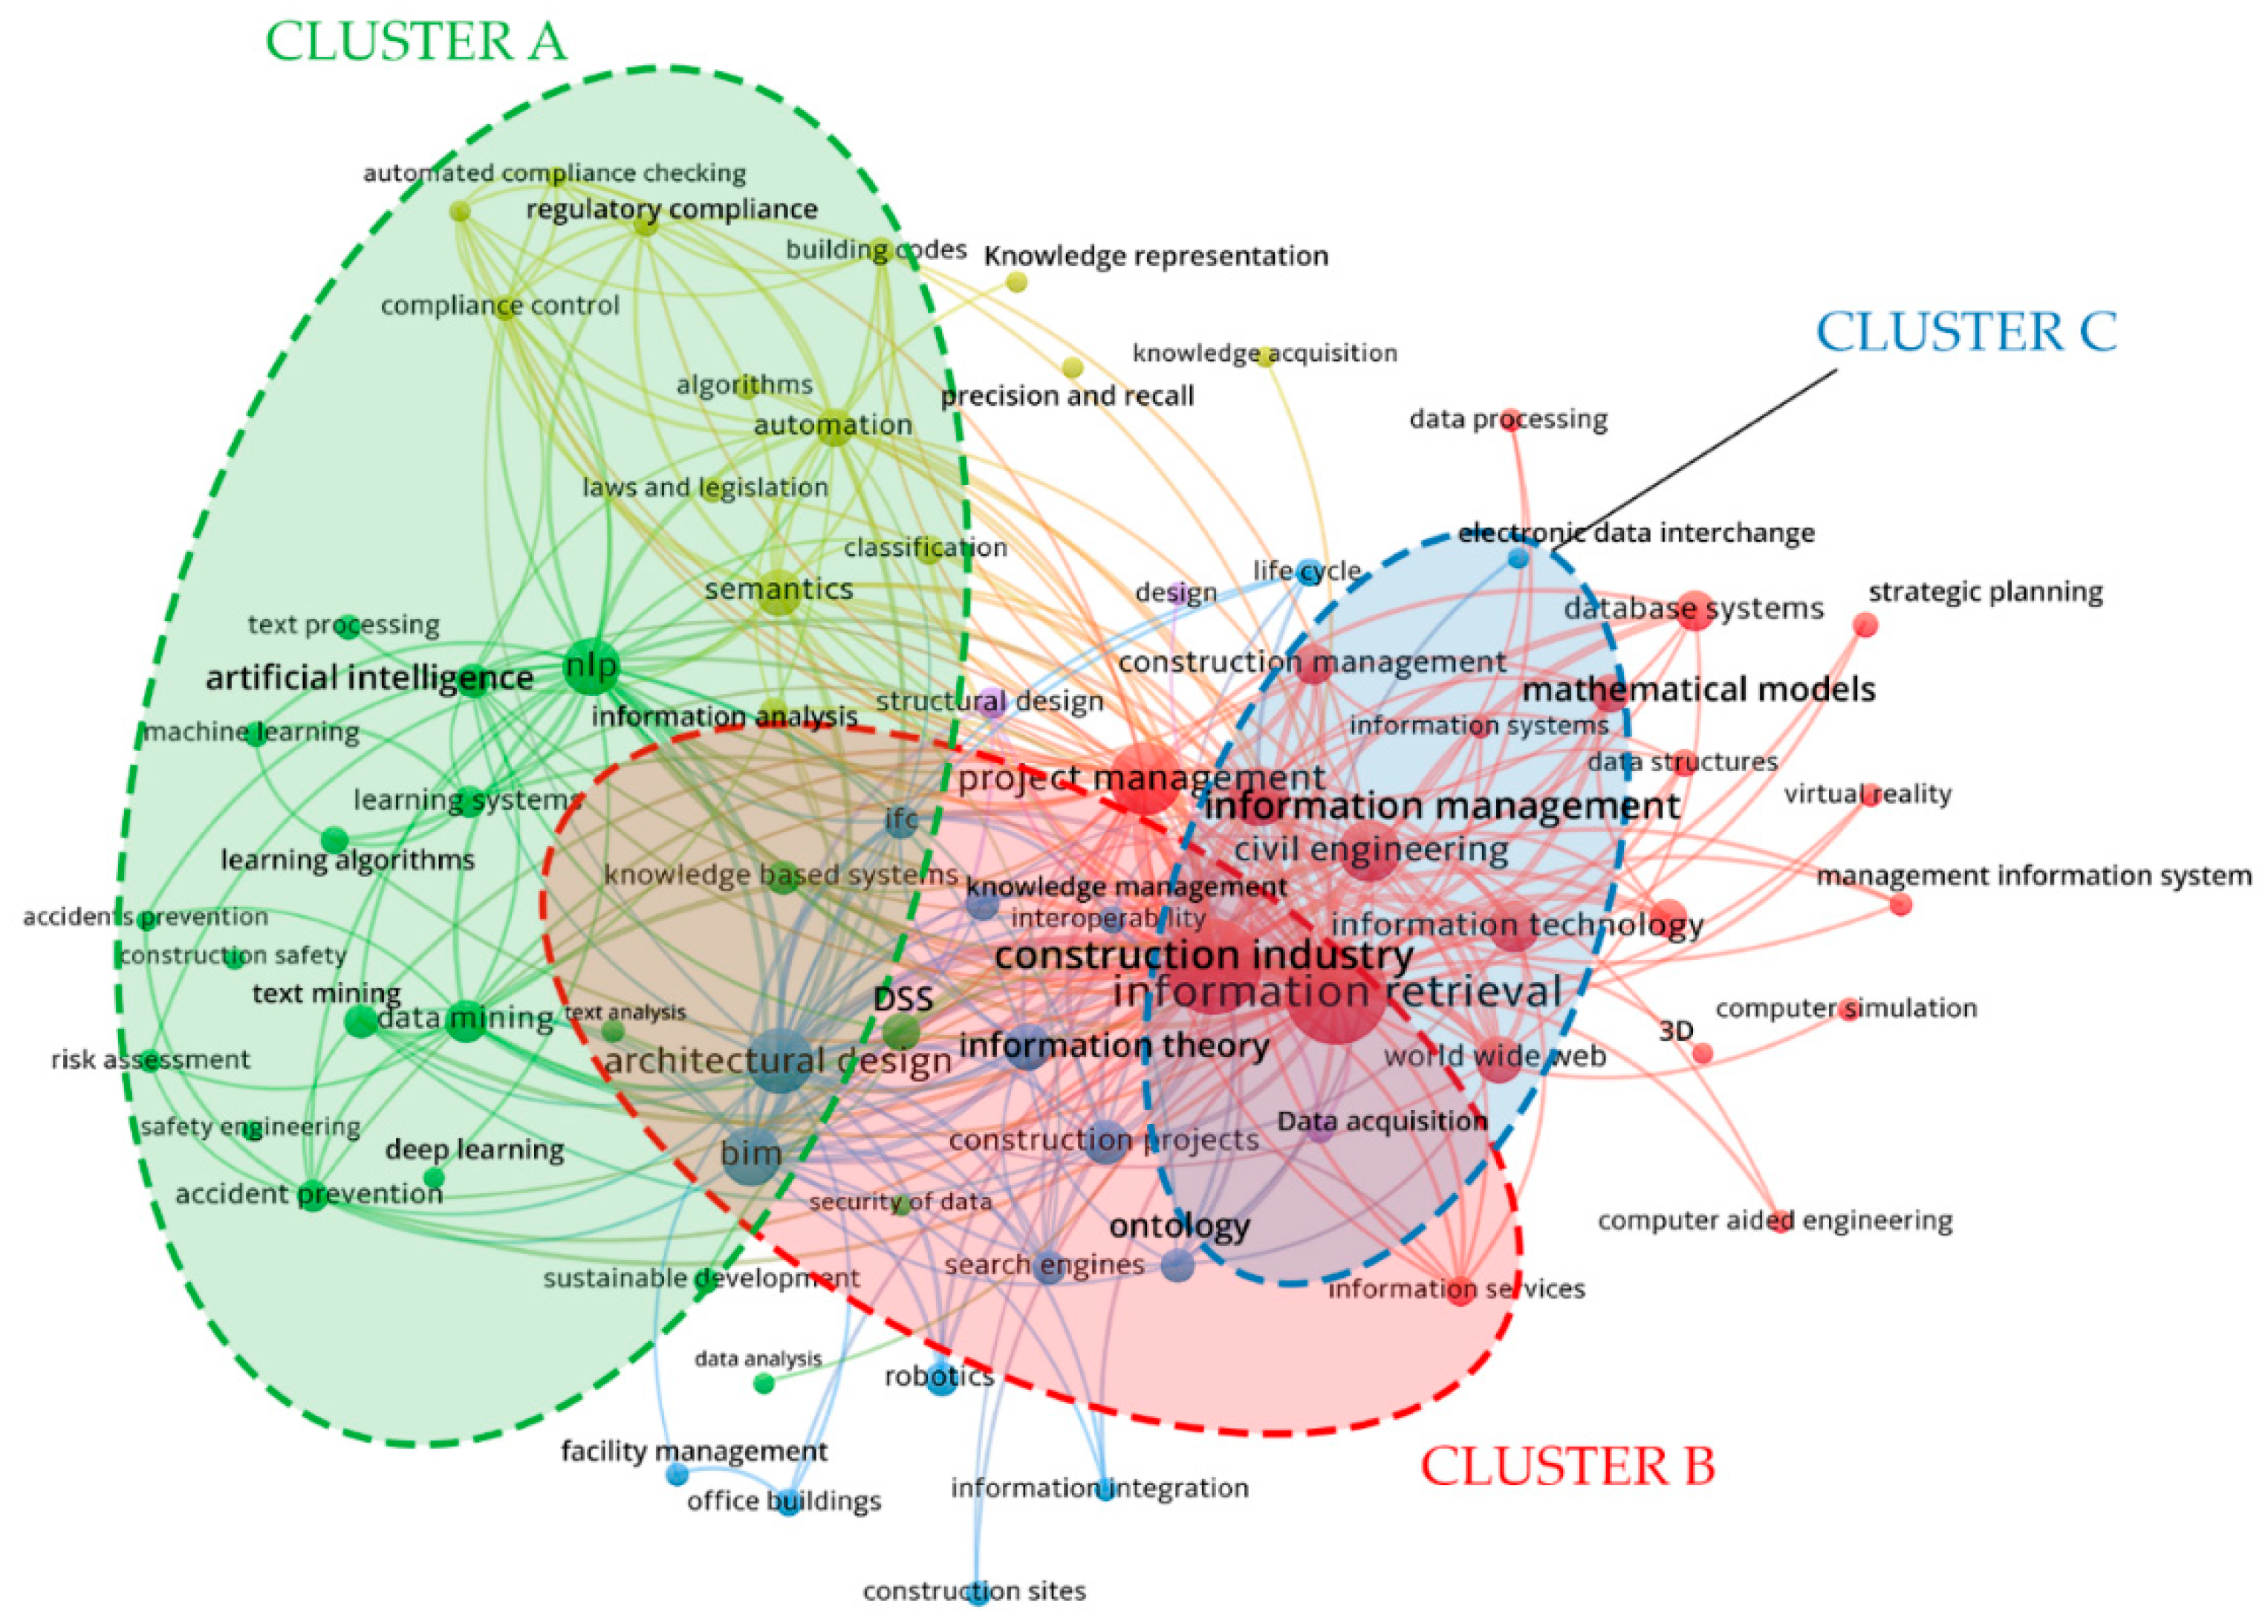
4.2.1. Co-Occurrence Keywords Network Maps

To perform a scientometric analysis and visualize data via science mapping, VosViewer was chosen. VosViewer is used to analyze bibliometric network data; in particular, the study investigates the co-occurrence relations between authors keywords [69]. Co-occurrence is an above-chance frequency of occurrence of two terms from a text corpus alongside each other in a certain order. Co-occurrence in the linguistic sense can be interpreted as an indicator of semantic proximity among topics [70]. Semantic proximity itself can be visualized in a co-occurrence map to uncover main research interests and topics, as well as their relationships. The keyword network represents the investigated knowledge domain and how the different keywords are interconnected [71]. The analysis performed in VosViewer was set as follows:
  • Analysis type: co-occurrence, the relatedness of items (keywords) is determined based on the number documents in which they occur together;
  • Unit of analysis: authors’ keywords;
  • Counting methods: full counting methods, meaning that each co-occurrence link has the same weight;
  • Threshold: the minimum number of occurrences of a keyword is 6; from the set of 1936 initial keywords 74 meet the threshold and they are graphically visualized.
A keywords co-occurrence network was produced (Figure 6). The circles represent the keywords divided into four major clusters (red, blue, yellow, and green) and a minor cluster (purple), and the lines represent the relations among keywords nodes. As stated, lexical variants and synonyms have been previously merged during the data cleaning activity and generic keywords were omitted (i.e., Buildings, Research, User interfaces, Computer software, Documentation, Managers, Expert systems, Visualization, Websites, Engineering research, Design/methodology/approach). The network is composed by 74 nodes divided into five clusters connected via 1340 relation links.
The co-occurrence network shows the presence of five clusters. The most influential, the red cluster, represents the main applications of NLP and BIM in AECO industry. The fields with more applications are the Project and the Construction management fields, the latter closely related to the Information management field. The use of Information Technology (IT) is also highlighted, as well as tools and methods for the implementation of IT in the construction field such as: Database Systems, Computer Simulation, Data Processing, and Virtual Reality.
The blue cluster represents the BIM-related field. The BIM bubble is strongly connected with the Architectural Design theme. The design phase seems to be the phase with the largest number of BIM and NLP independent applications. The keyword Ontology also belongs to the blue cluster. Ontology is a Semantic Web format, and it can be considered as the common and shared vocabulary by which knowledge can be represented [72]. Ontologies seem to be the most promising way to solve the interoperability issue among heterogeneous BIM authoring software applications by making information systems universally accessible and achieving semantic interoperability [73]. The potential of ontology to bring the BIM approach to the semantic web, thus enhancing the interoperability and supporting the collaboration among actors, is widely recognized [74,75]. Several studies have been conducted in this direction with applications in the built environment field, such as: scheduling, cost management and estimation [76,77], smart homes and intelligent environment [78], BIM-based approach [79], construction knowledge management [80], project collaboration and information exchange [81], facility management [82], property management [83], building design [84,85], construction code compliance and conformance checking [86], and building energy efficiency [87].
The Ontology bubble, being a method to enhance collaboration and information sharing, is connected to the IFC term. IFC (Industry Foundation Classes) is an open data model and a digital description of the built asset industry. IFC aims to standardize Building Information Model (BIM) data that are exchanged and shared among software applications used by the several actors of a design, construction, and facility management process [88]. In light of this, the knowledge management, and the interoperability keyword itself, belong to the blue cluster.
The yellow cluster represents the semantic technologies topic; NLP can be described as a semantic technology itself. Main applications fields such as the Automated Compliance Checking (ACC) and the semantic enrichment of the BIM approach, i.e., the quality, accessibility and interpretation of the information stored in BIM models [89], are visualized.
The green cluster shows the main fields of application of NLP systems in the construction industry, such as risk management [90,91] and risk assessment [92], and safety management and safety engineering for accident prevention [93,94,95]. Main tools and methods to perform NLP tasks are also visualized in the graph, the most prominent of which are the following: artificial intelligence, data, and text mining, and learning algorithm with their declinations (machine learning and deep learning). As stated in Section 1.2, deep learning algorithms have the highest performances in several NLP tasks [32] and, for that reason, are widely used and thus underlined in the graph.
The green Natural Language Processing cluster is close to the blue BIM topic and connected to the yellow cluster of semantic technologies. The three topics: BIM, Semantic, and NLP seem to be strongly linked and interconnected. The closeness between the three themes can be explained by the ability of NLP systems to process natural language, which is semantic information itself, and translate it into a machine-understandable format, such as ontologies that are widely investigated with various applications to support interoperability between BIM systems with a focus on semantic interoperability. From this perspective, NLP, which is a semantic technology, and BIM enriched with semantic information can be both considered drivers to lead the industry towards the digital transition by bringing the sector into the Semantic Web [96]. Semantic Web is, in fact, a machine-processable approach supporting universal information exchange understandable by both machines and humans working in cooperation [97]. As investigated by Pauwels et al., there is a clear tendency of the scientific research of investigating and using Semantic Web technologies to solve the interoperability issue of AECO supporting the digital transition of the industry [98].
In summary, BIM, NLP, the Semantic topic, and their intersections are all part of the transition process towards the implementation of the Semantic Web which aims to fully digitalize AECO sector (Figure 7).

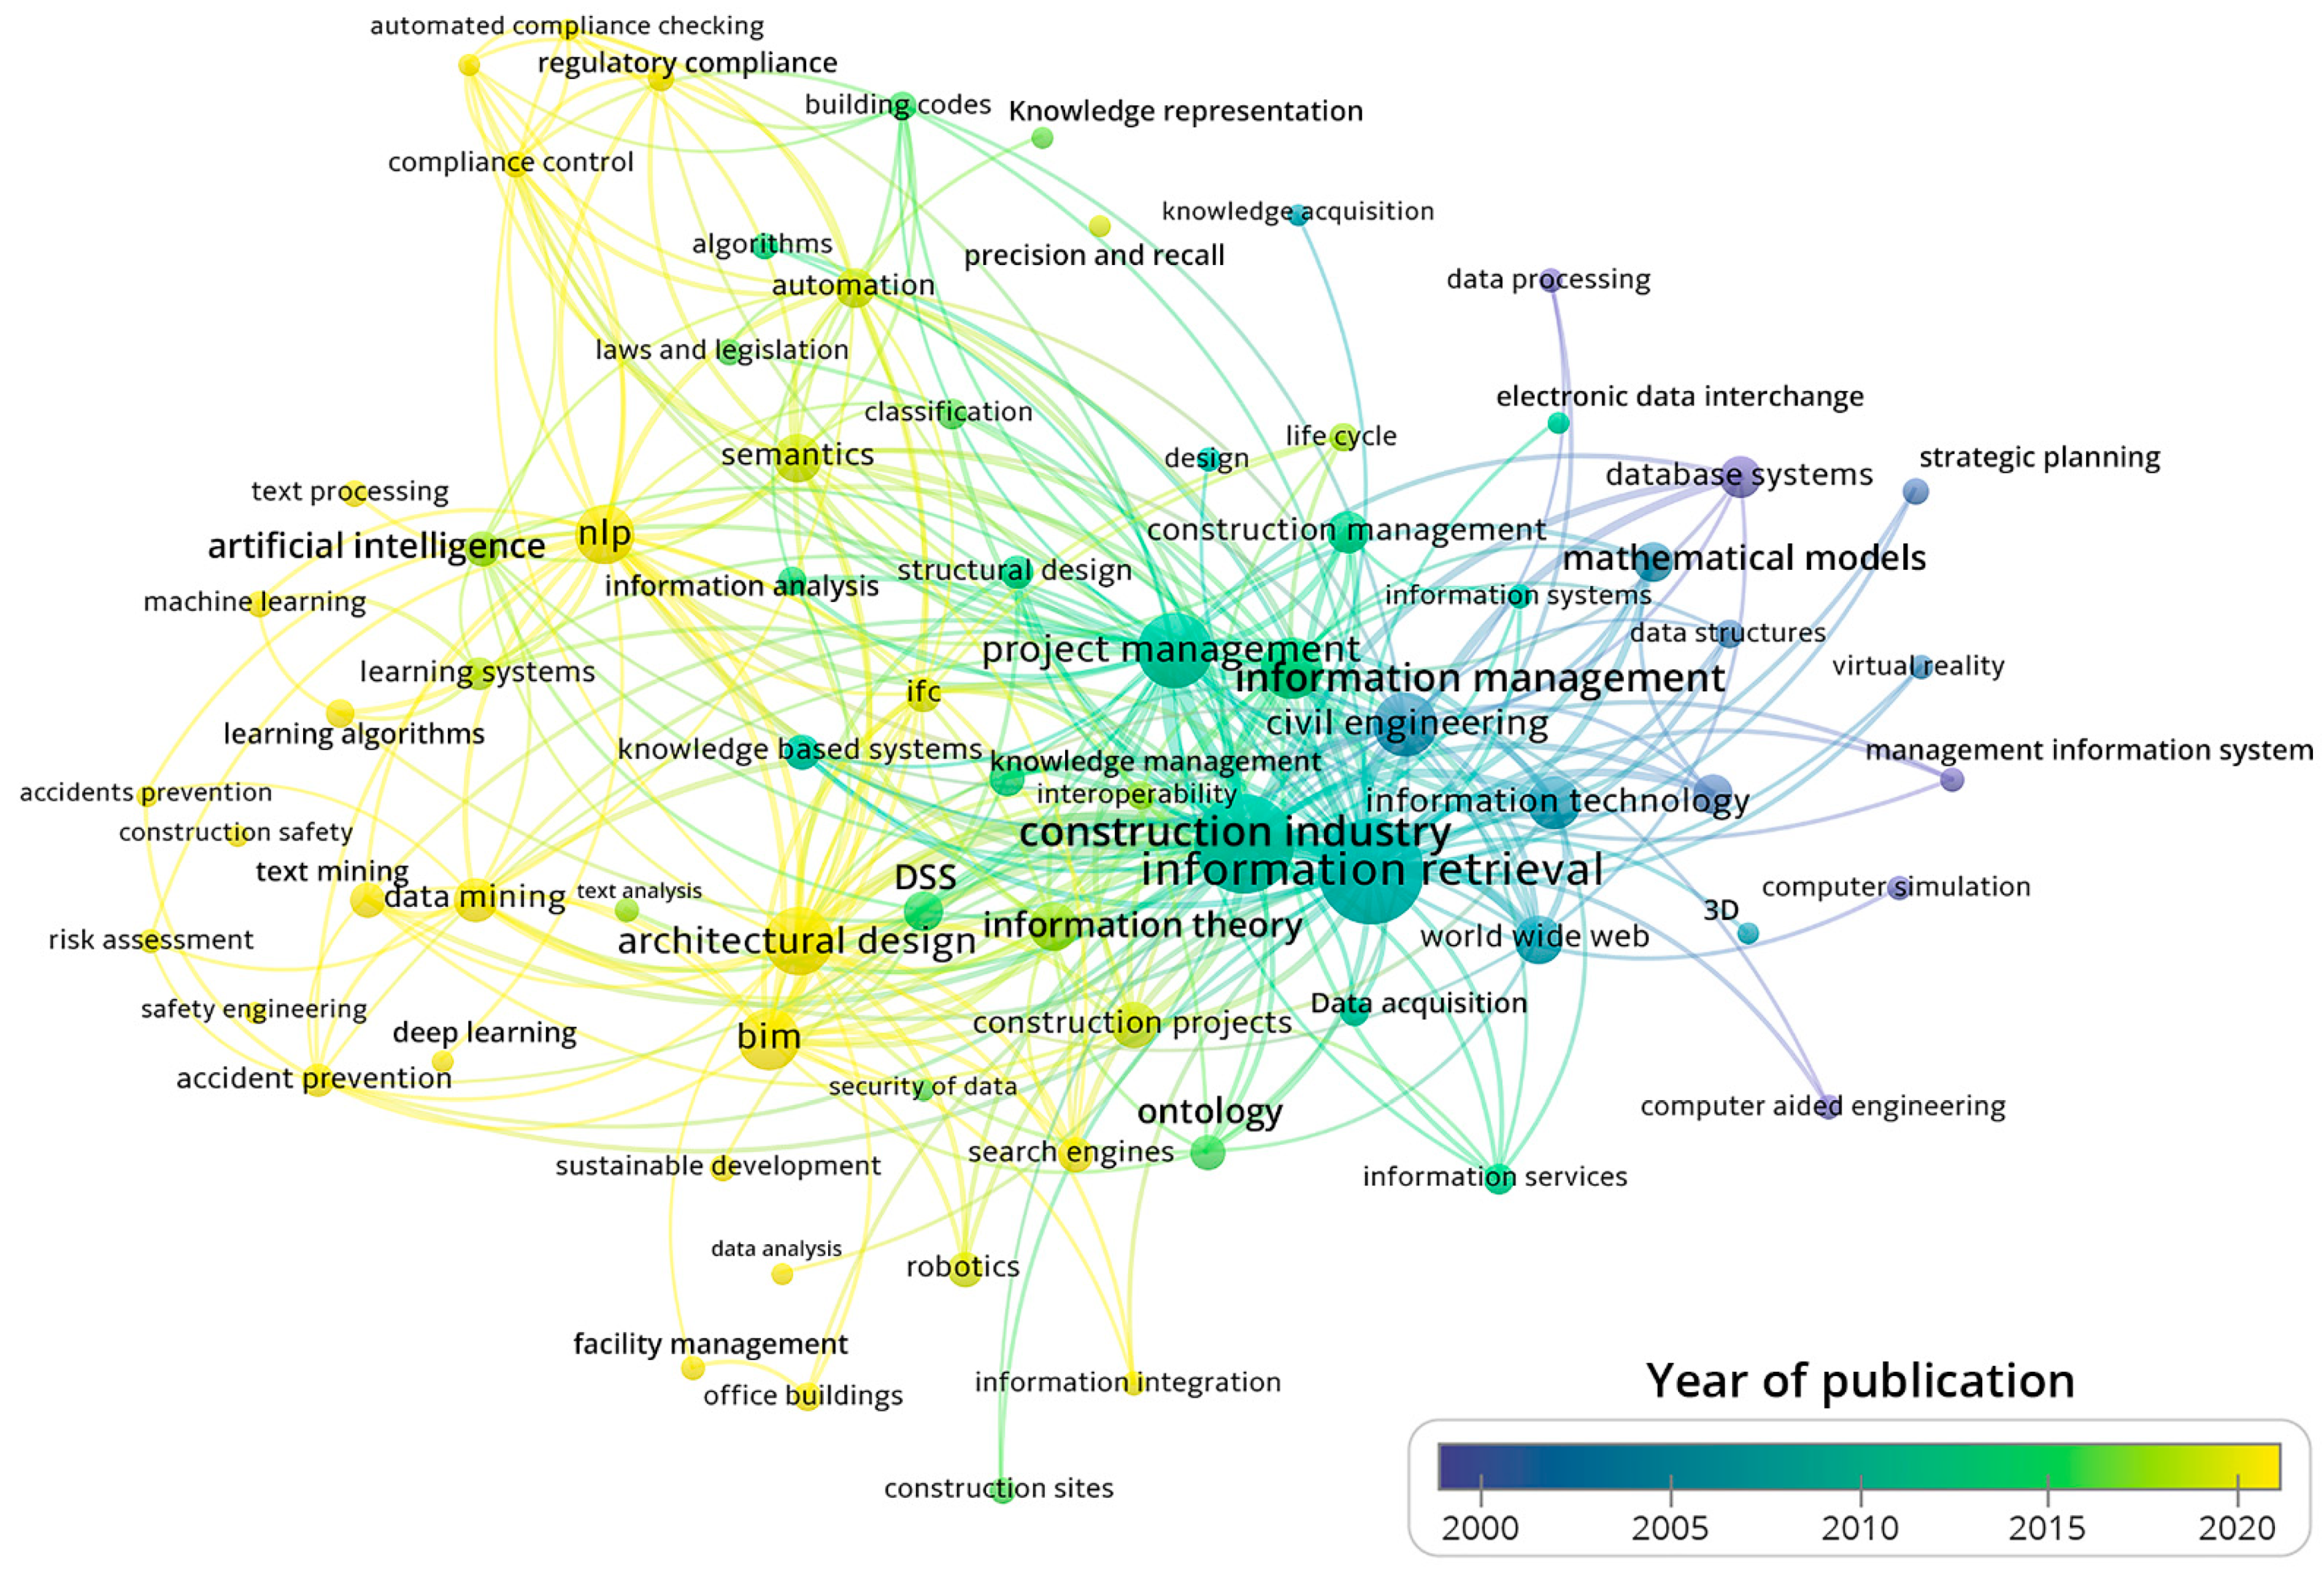
4.2.2. Co-Occurrence Keywords Temporal Overlay Network Maps

VosViewer also allows overlaying temporal meta-data regarding publication years of the articles related to the keywords displayed in the graph. A temporal overlay data map is provided in Figure 8.
The cluster representing the main fields of application of NLP and BIM in the construction sector is the most dated, with keywords dating back to the beginning of 2000. The very first attempts to apply information technology in the construction sector date back to 1998. NLP, BIM, and Semantic topics clusters gather the most recent keywords with an average publication year of 2015. The timespan of the keywords of the green, blue, and yellow clusters covers a range of 10 years from 2009 to 2019. Table 4 shows the average publication years of the four main clusters considering each keyword’s publication years.

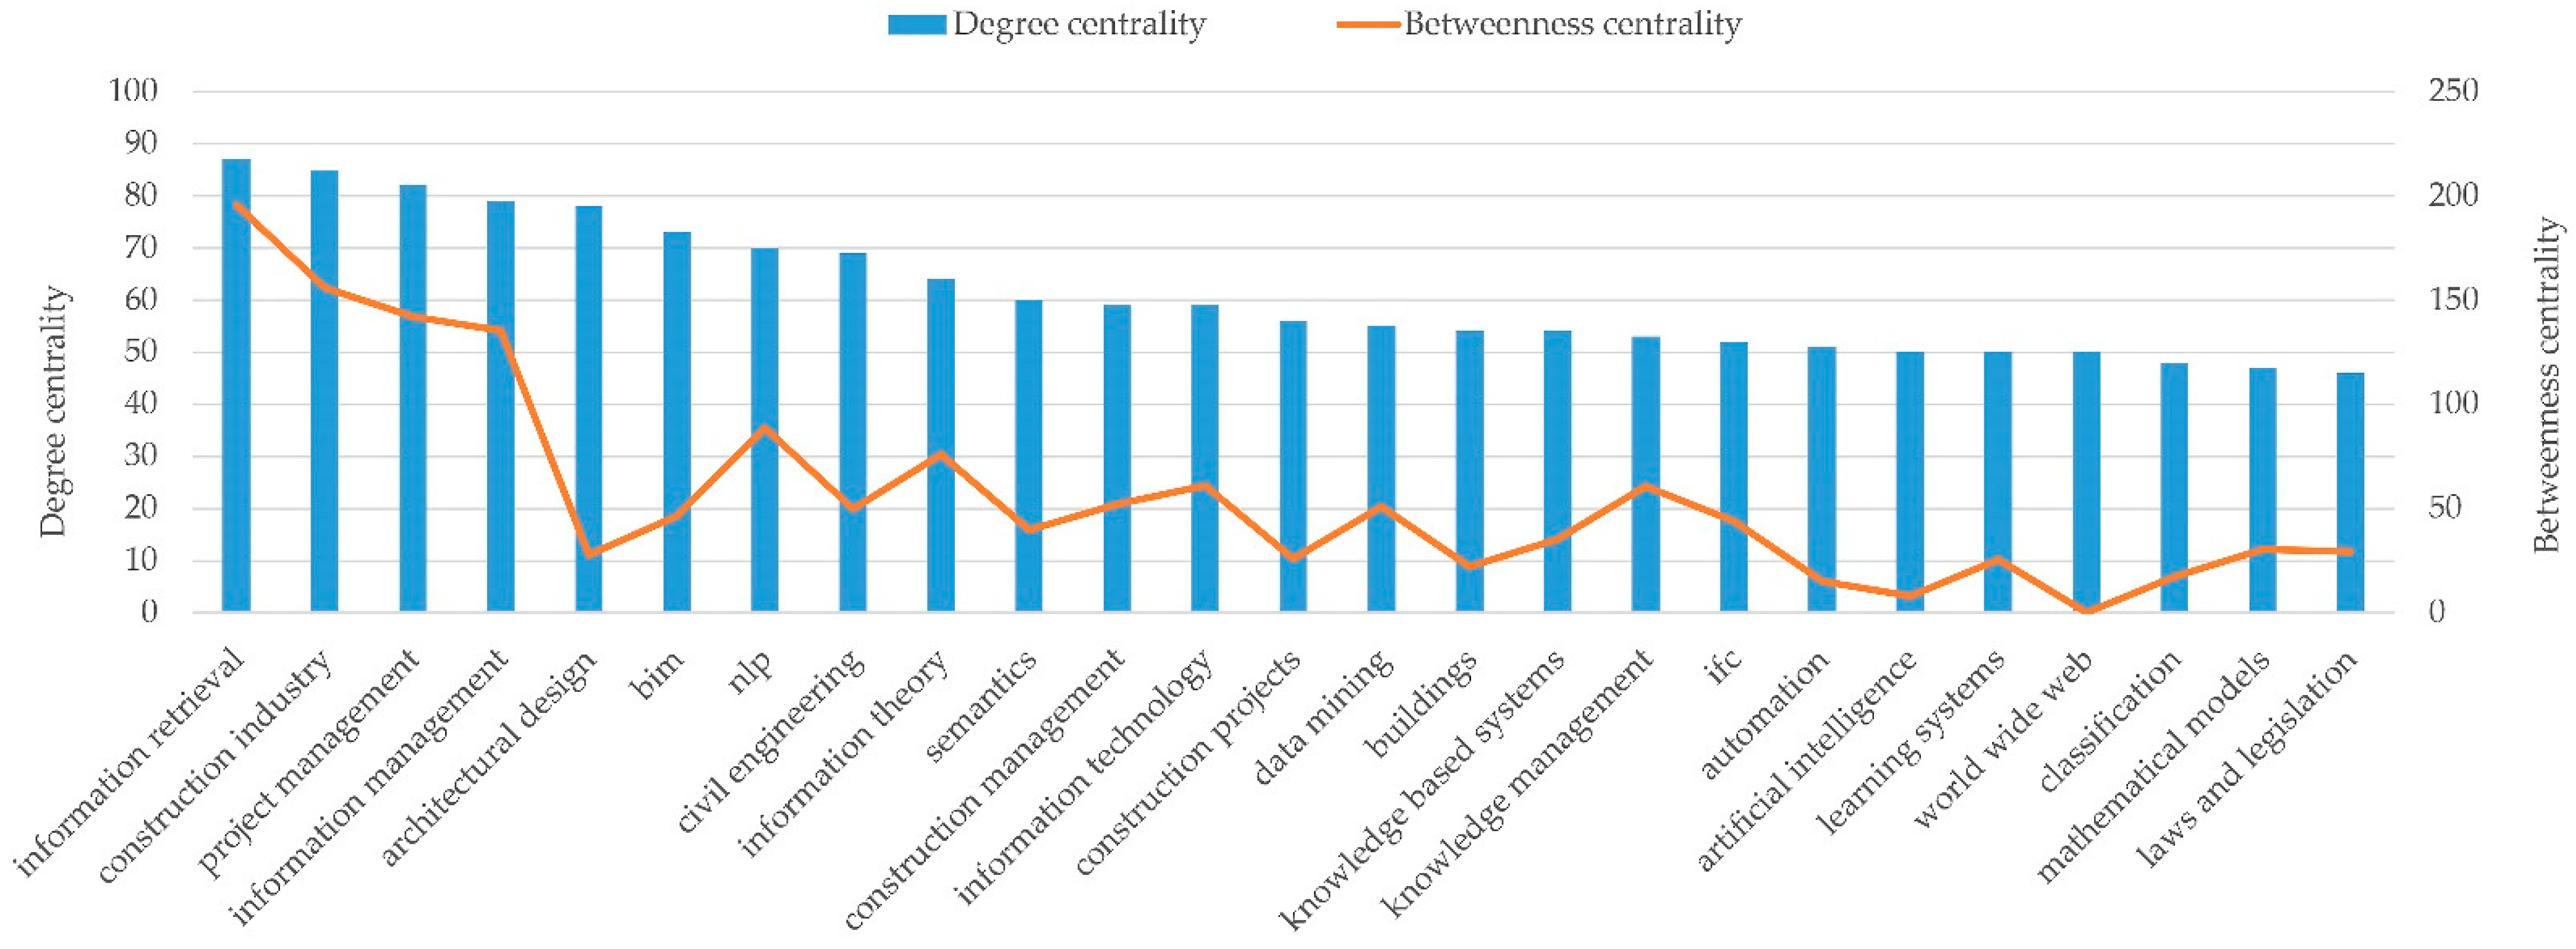
4.2.3. Centrality Node Measurement

The centrality of a node, which corresponds to a keyword, represents the importance of the topic in the research domain analyzed. In other words, centrality allows hierarchizing the keywords, applying a simple and direct approach [99]. In this study, centrality is measured computing the Degree Centrality (DC) which represents the number of links that a keyword has with the other keywords of the network, giving a measure of the influence of a keyword upon the others [100]. Main research interests have been ranked based upon the DC. The influence and importance of a keyword within the network graph is proportional to the DC value. An additional centrality metric, the Betweenness Centrality (BC), was calculated in the case where two nodes had the same DC value. The additional metric represents influential nodes for highest values, capturing how often a node is in between others. This quantifies the number of times a node acts as a bridge along the shortest path between two other nodes [101].
Gephi software was used to calculate the DC of each node. The calculated values of DC and BC of the first 25 keywords are shown in Figure 9. Information retrieval, Construction Industry, and Project and Information Management show the highest values for both Degree Centrality (DC range: 79–87) and Betweenness Centrality (BC range: 135–196); Architectural Design shows a good Degree Centrality (DC: 78) but a low value for the Betweenness Centrality (BC: 28) being an influential keyword but not a keyword bridge. The NLP term has good values for both the metrics (DC: 70, BC: 89) being influential and bridge keyword in the knowledge domain, likewise BIM Information theory, Semantics, Data mining and Knowledge management keywords (DC: 73–53, BC: 76–46). DC and BC values of the analyzed 25 keywords are provided in Table 5.

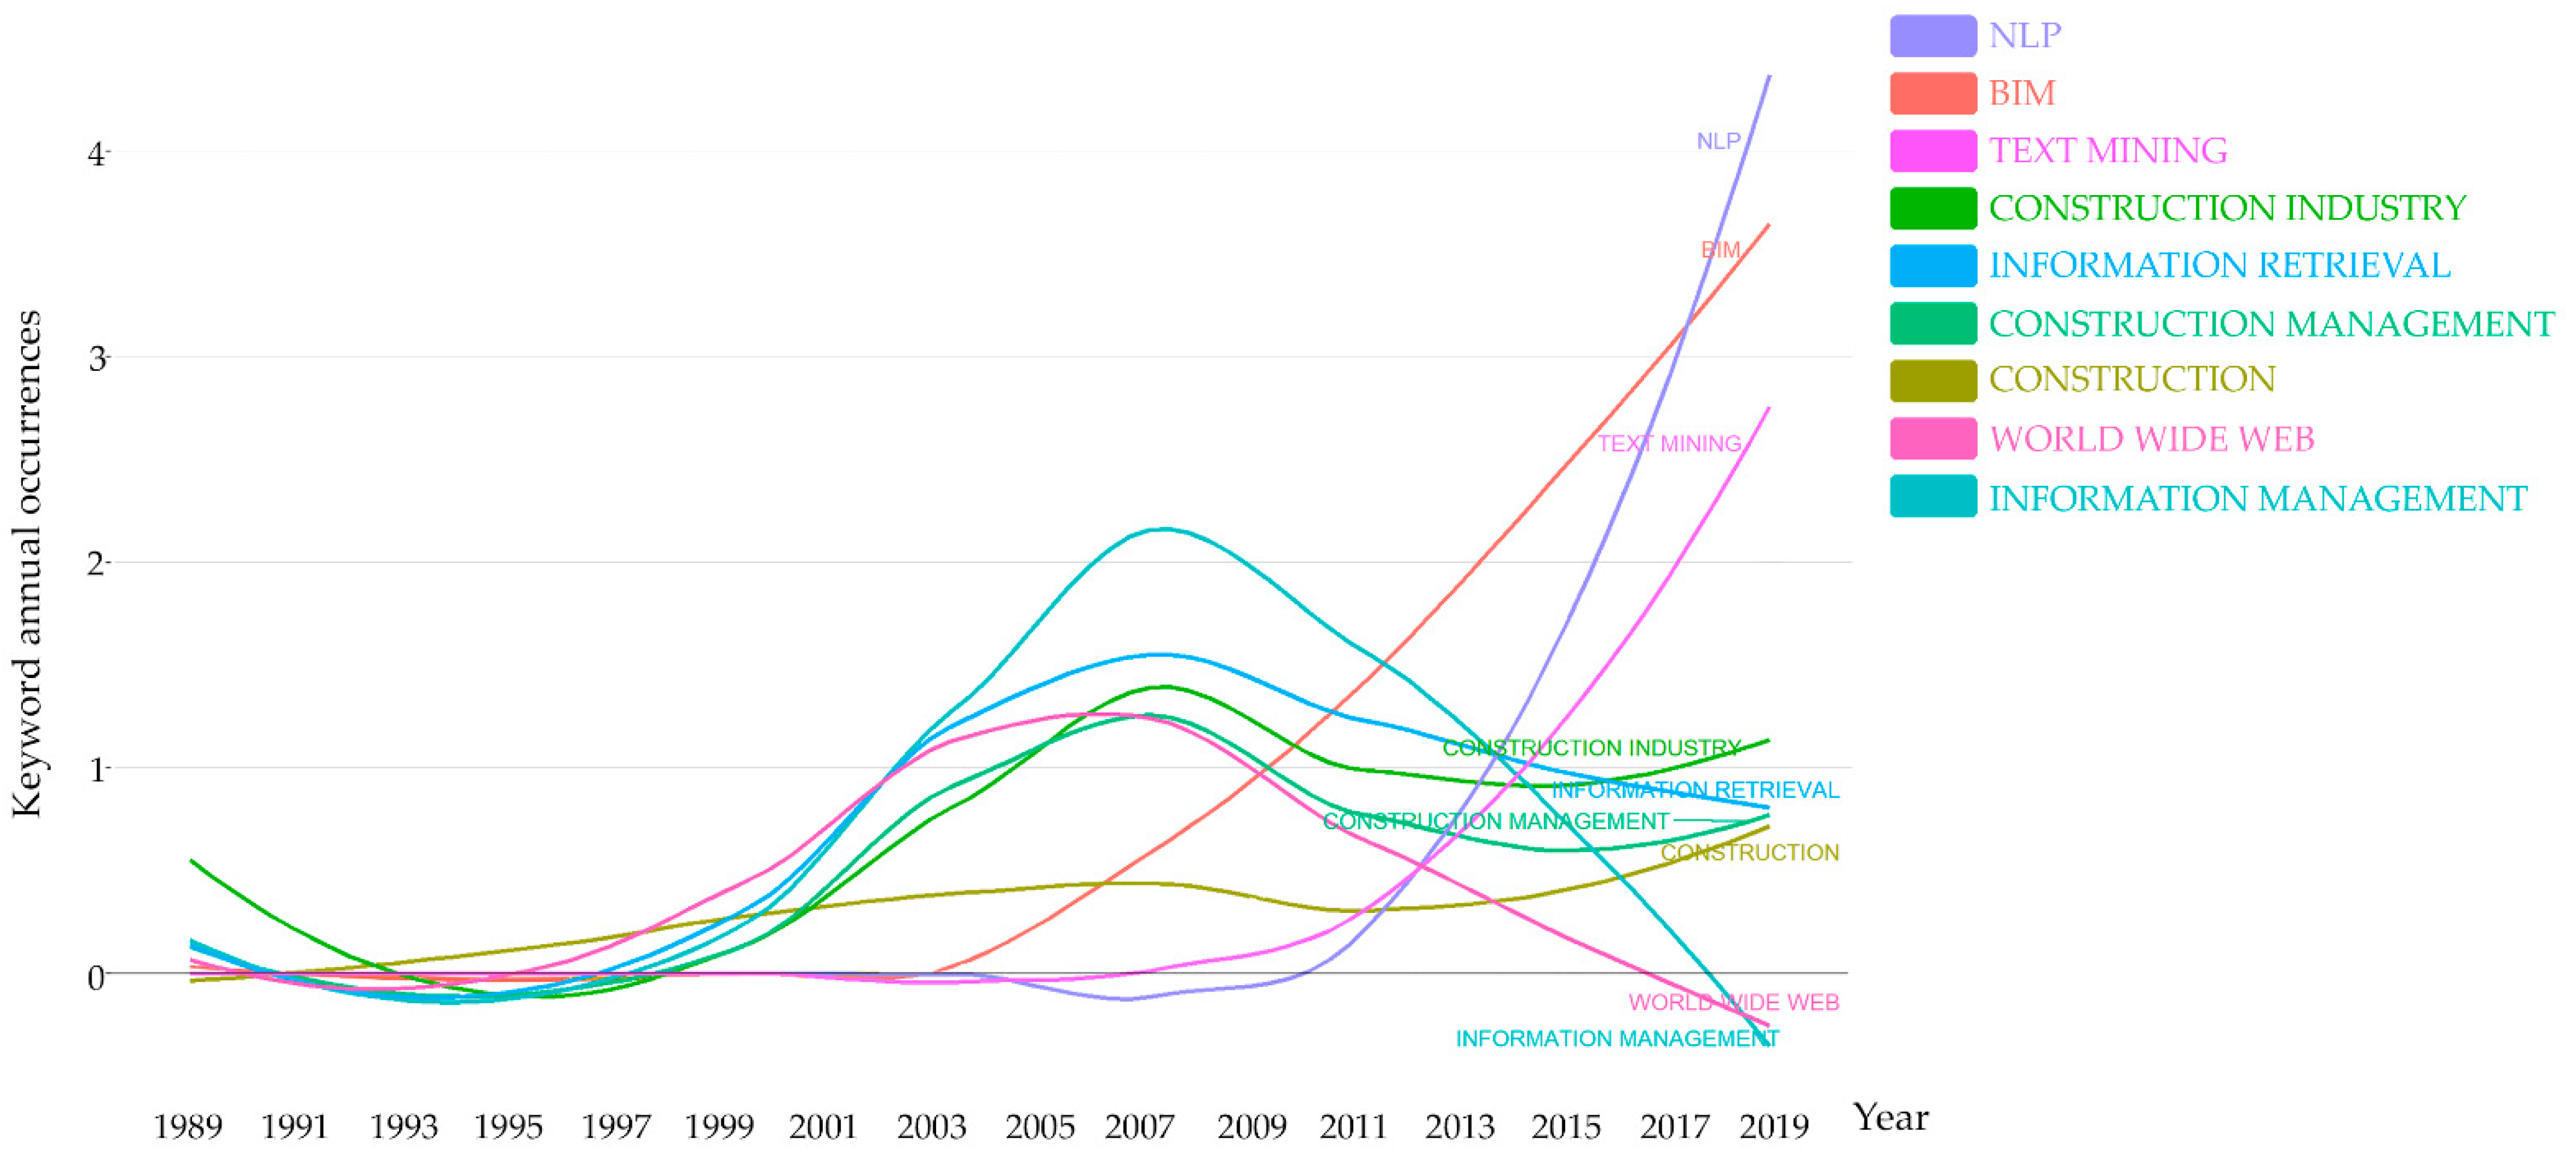
4.2.4. Keywords Evolution (1989–2020)

A graph, which shows the trend of keywords over time (from 1989 to 2020) in the investigated body of knowledge, is provided in Figure 10.
NLP and BIM keywords have the most quickly growing trend. The upward trend of the BIM topic started in 2003. The NLP topic has a fluctuation in the four-year period 2005–2009, with a subsequent upward trend starting from 2010. The graph shows a similar pattern for the Text Mining topic being a subfield of the NLP topic. Information management related topics have a fluctuation in 2007 with a subsequent downward trend until 2020. Construction management and information retrieval topics show a steady trend over time.

4.3. Factorial Approach and Thematic Map: From Network Graph to Bivariate Map

As stated in Section 4.2, factorial analysis allows reducing the dimensionality of data and represent it in a lower-dimensionality space, in this case in a 2D graph. The methodology applied to reduce the dimensionality is the Correspondence Analysis (CA). Keywords are plotted as points with coordinates in a bi-dimensional space: the more the keywords are similarly distributed in the data set, the closer they are plotted in the bivariate map. Summarizing, keywords are grouped into the same cluster if they are discussed together in a large proportion of articles; the opposite, keywords are distant when a small fraction of papers uses the terms together. The origin of the chart represents the center of the research field analyzed, namely the large shared topics [102].

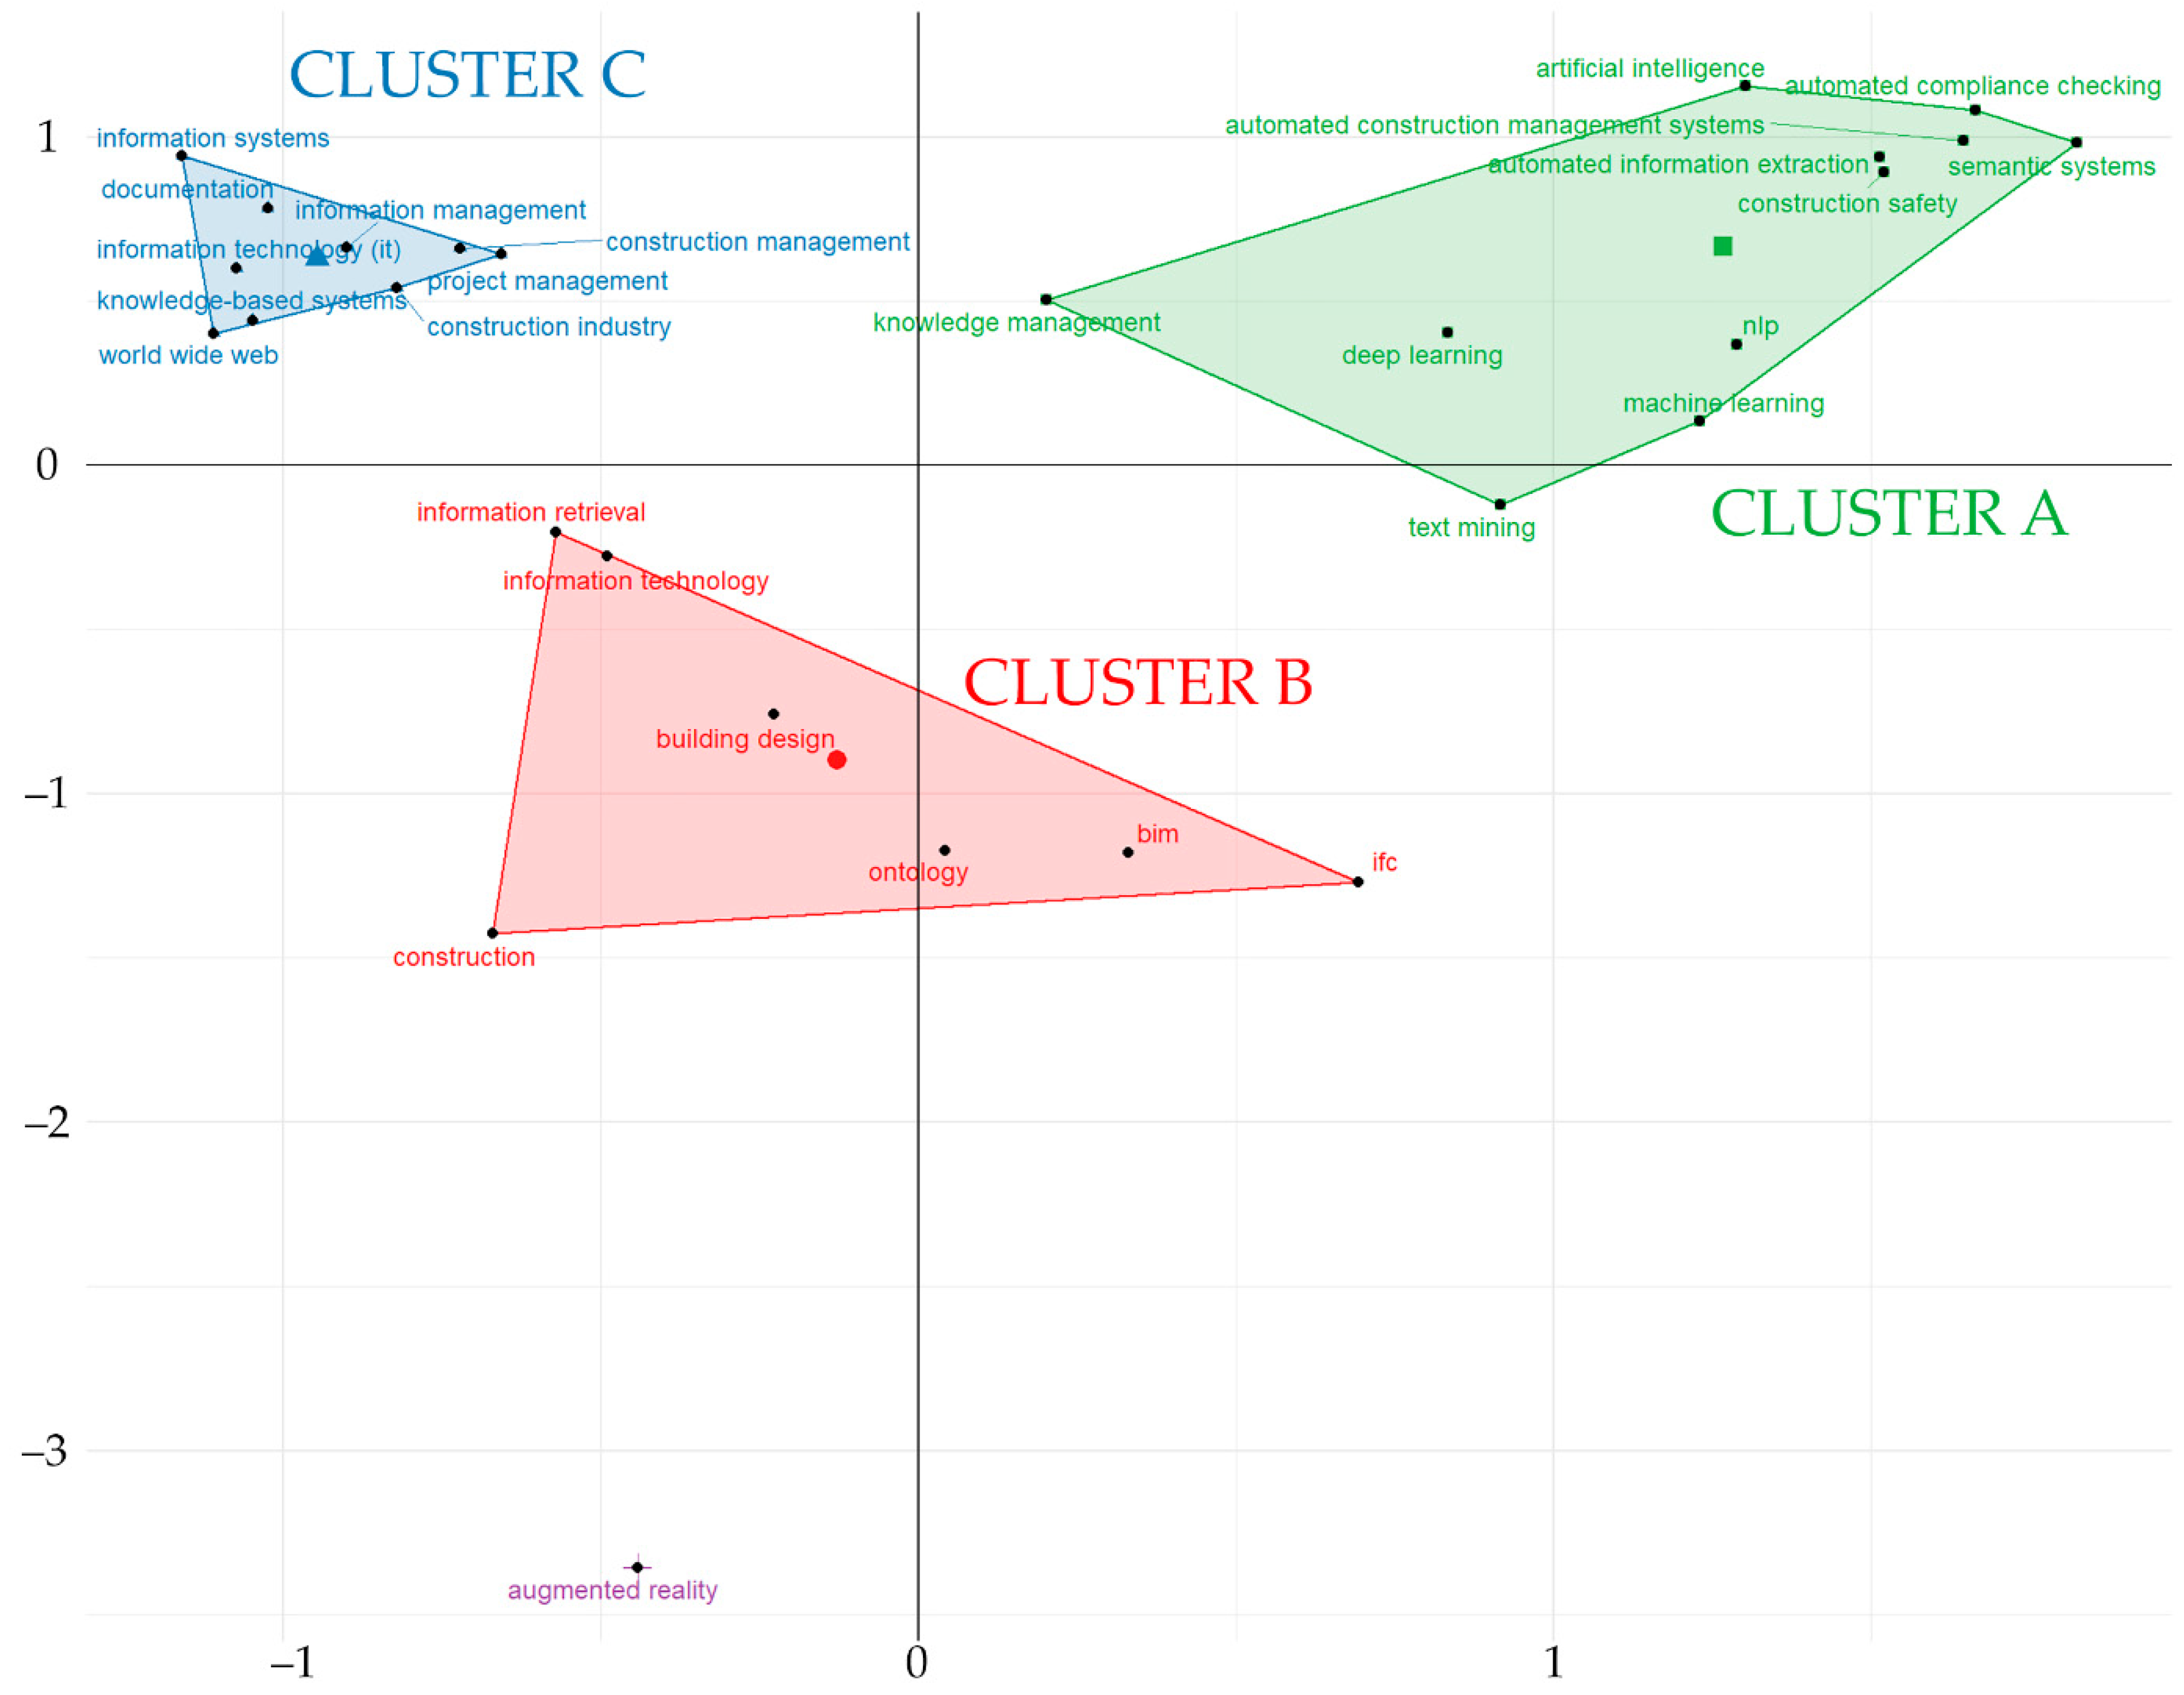
4.3.1. Correspondence Analysis and Clustering: Map of Words

The factorial bi-dimensional map (Figure 11) shows three main clusters. The cluster in blue is identified by the Information Technology keywords and 9 secondary terms, including terms such as Construction and Project management. The green cluster is identified by the Construction safety topic and gathers 11 keywords including the NLP term; NLP application in safety and risk management is one of the most investigated alongside the Automated Compliance Checking task, and some relevant papers of the clusters are also listed in Table 6. In the green cluster the following keywords can also be found: Deep learning, Machine learning, and Artificial intelligence terms which are the three keywords depicting approaches and tools employed for NLP tasks. The red cluster is identified by the Building design terms and is composed of seven keywords, including: BIM, ifc, and ontology.
Keywords clusters, corresponding to the factorial analysis reduction map (Figure 11), are marked in the co-occurrence network. Cluster A (green), cluster B (red), and cluster C (blue) of the factorial analysis reduction map intermingle closely, indicating their close relation in terms of research themes. Cluster B, the red cluster in the factorial map (BIM, ontology, and ifc keywords), can be considered a bridge theme, being the connection between the NLP and Semantic green A cluster, and the Information Technology and Construction management blue C cluster, as shown in Figure 12.

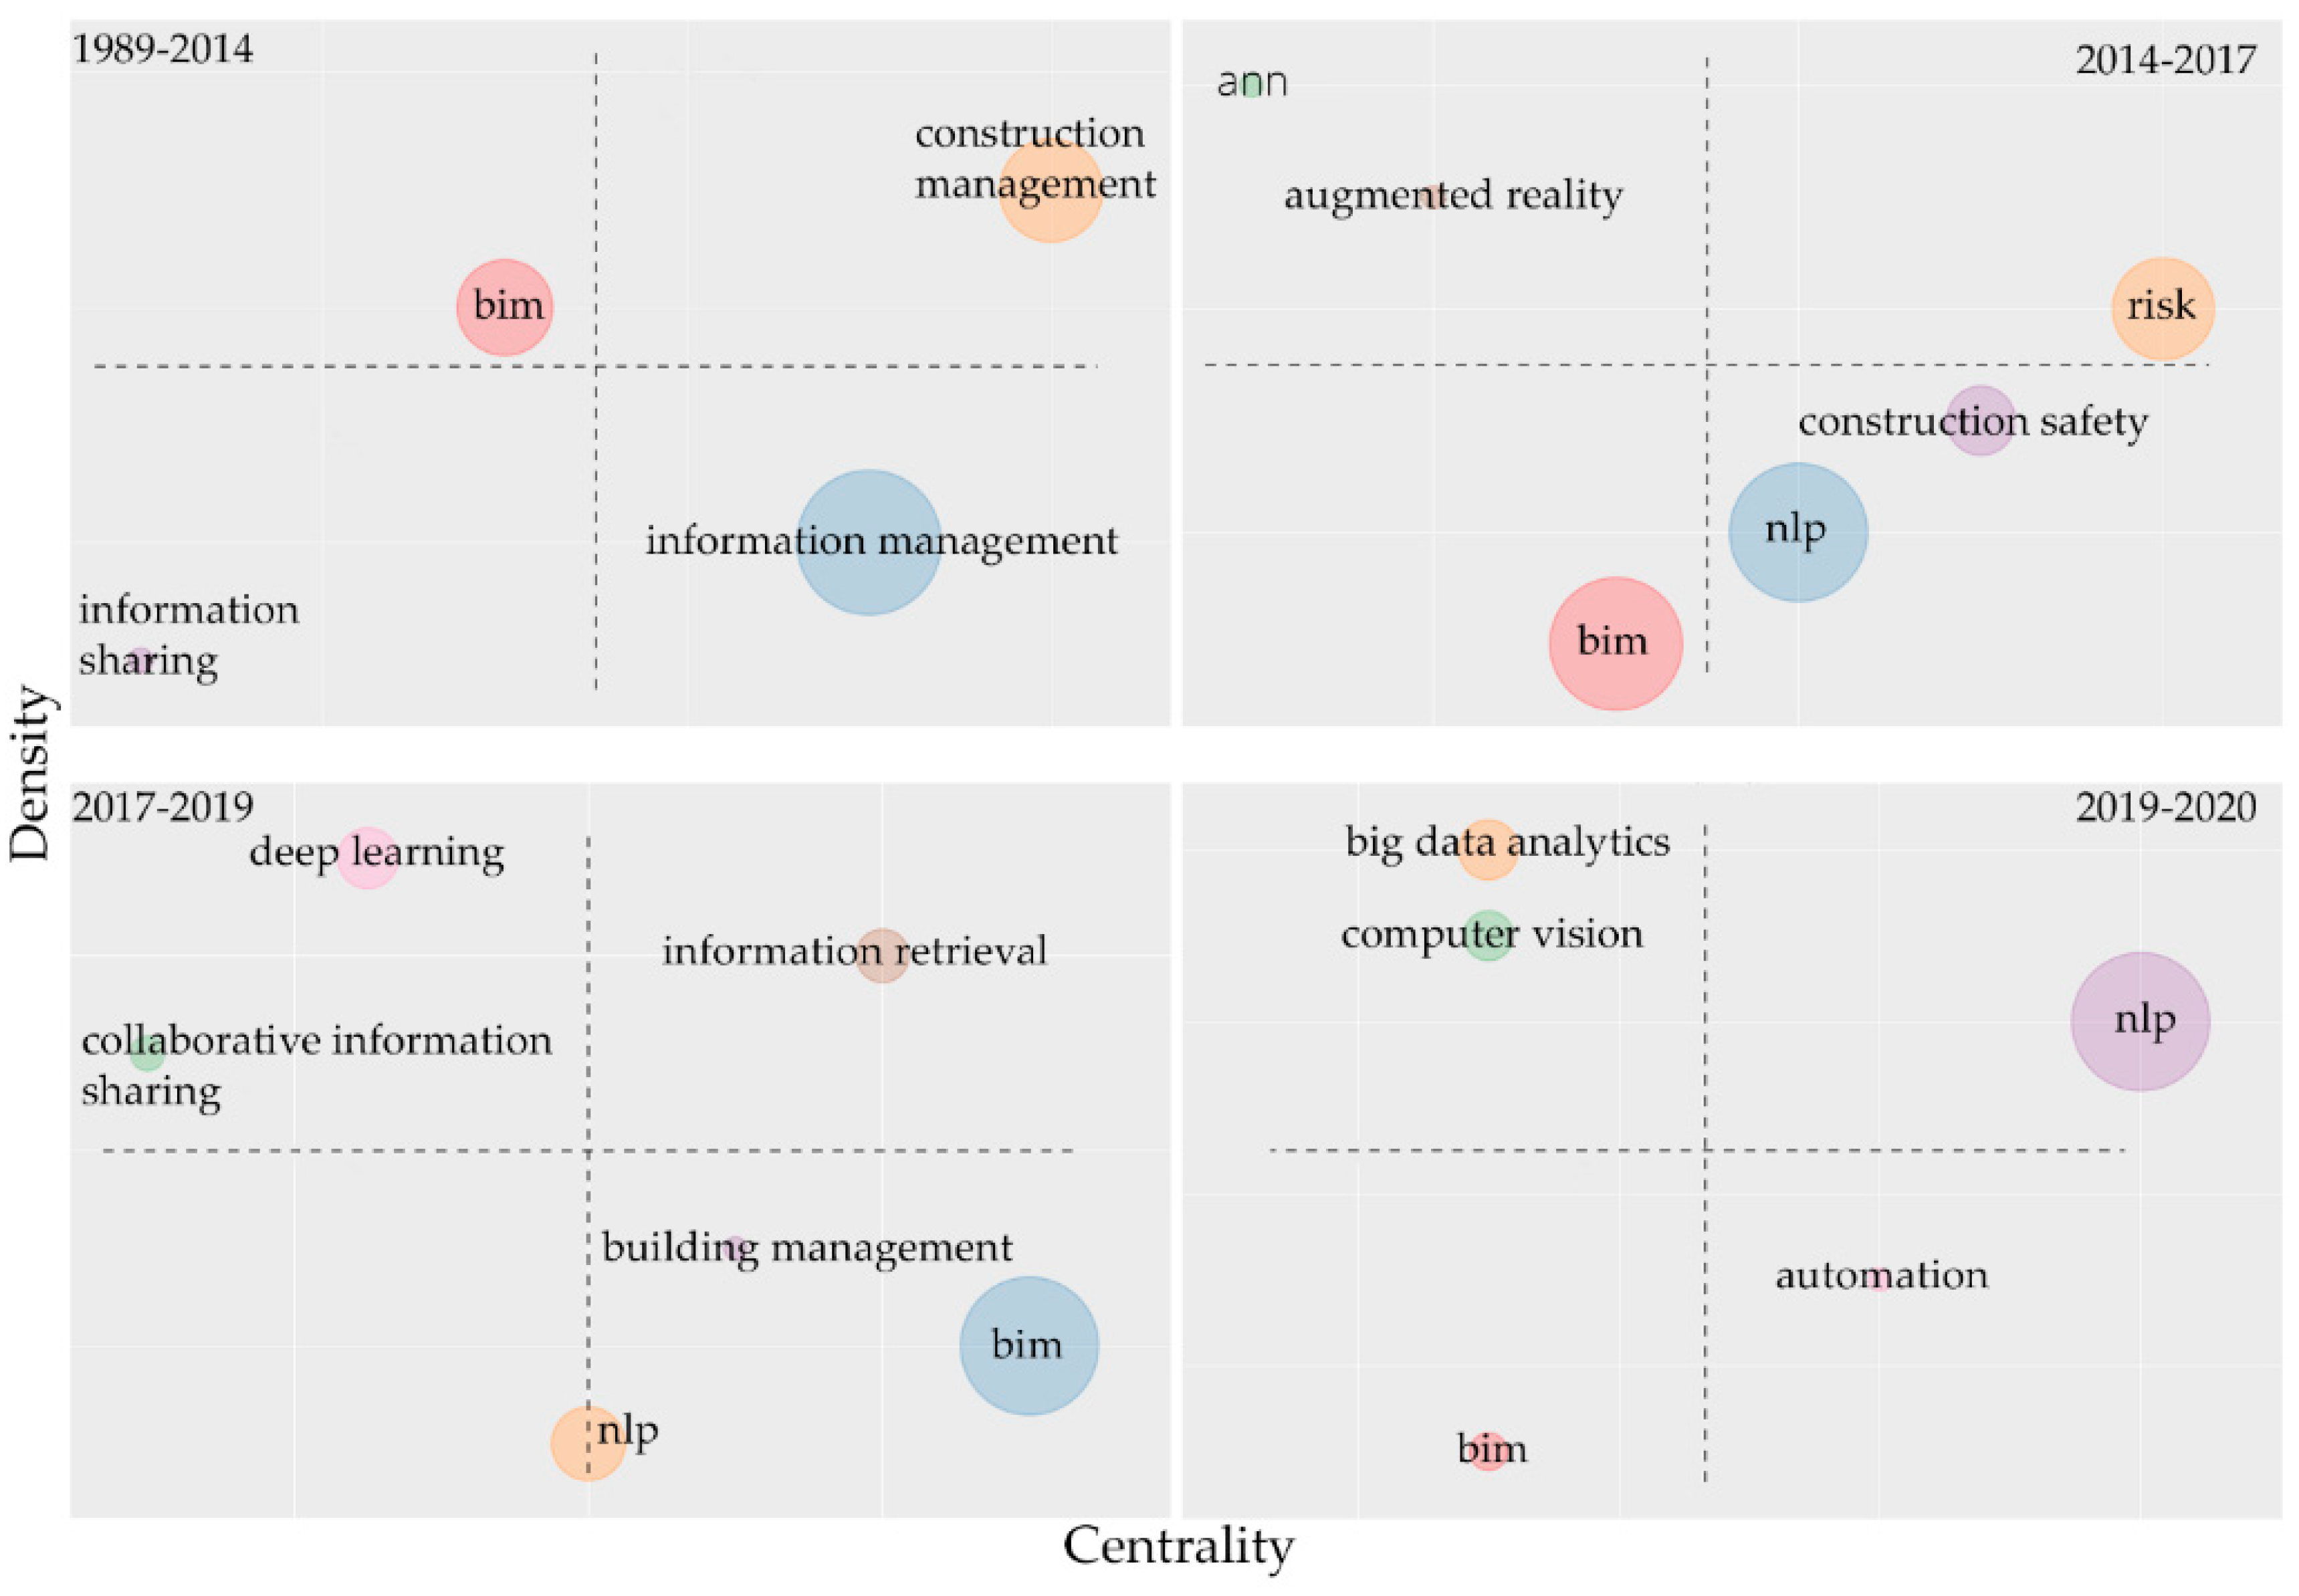
4.3.2. Thematic Map Analysis

To analyze the temporal evolution of topics, a thematic map is provided (Figure 13). BiblioShiny allows, by using a clustering algorithm, gathering different keywords in investigated topics. Each topic is plotted on a thematic or strategic map [107]. The graph has two dimensions: on the x-axis, the Callon Centrality and on the y-axis, the Callon Density [108]. Centrality can be interpreted as the importance of the theme in the entire knowledge domain, and Density as the maturity level of the themes themselves. According to the quadrant, it is possible to define four types of themes [108,109,110]:
  • Upper left quadrant: highly developed but isolated themes, very specialized themes with few connections with other topics;
  • Upper right quadrant: motor-themes, themes with high density and high centrality values, they are well developed and are core elements of the structure of the research field;
  • Lower left quadrant: emerging or declining themes, themes with low density and low centrality values, they are weakly developed and currently marginal;
  • Lower right quadrant: transversal and general, basic themes, and themes important to the research field which are nonetheless not developed;
Furthermore, the dimension of the bubbles representing the investigated topics is proportional to the relative importance of each topic, respectively, to the others.
To investigate the evolution of the topics (trajectory along time), the timespan (1989–2020) is divided into time-slices according to the annual scientific production trend analysis (Figure 3):
  • First time-slice (1989–2014);
  • Second time-slice (2014–2017);
  • Third time-slice (2017–2019);
  • Fourth time-slice (2019–2020).
The time slices are chosen to focus on the most recent developments (second time-slice (2014–2017), third time-slice (2017–2019), and fourth time-slice (2019–2020)). The knowledge domain is investigated starting from the point of reduction in the number of publications (2014) and the subsequent steady and gradual increase in interest from 2015 to 2020. To better analyze the obtained results, generic terms, such as construction and construction industry, are excluded from the thematic map.
The first time-slice (1989–2014) does not report the theme related to NLP. The BIM theme falls in the upper left quadrant, identified as a highly developed but isolated theme, very specialized with few connections with other topics. The theme of information management begins to be considered as a fundamental aspect for the research; however, it is not yet fully investigated and developed in the period, and the same is true for information sharing, which is characterized as an emerging topic.
In the second time-slice (2014–2017), the BIM topic moves to the lower left quadrant, being identified as a declining theme, leaving room for topics such as Augmented Reality (AR) and artificial neural networks (ANN) in the upper left quadrant of the highly developed and specialized topics. In the quadrant of themes important for the research field but not yet developed, the NLP topic and the field of construction safety appear. The scope related to risk management is defined as a core element of the structure of the research field in the period 2014–2017.
In the third time-slice (2017–2019), the NLP is identified as an emerging theme, while two new themes related to the use of deep-learning algorithms and collaborative information sharing techniques appear. The theme of information retrieval in the analyzed three-year period is identified as a motor theme for the structure of the research field.
In the last time-slice (2019–2020), NLP is identified as a motor theme with high density and high centrality values, which means that it is a well-developed and core element of the structure of the research field. Two new topics related to big data analytics and computer vision appear as highly developed, although isolated, themes.

4.4. Source Impact and Dynamics

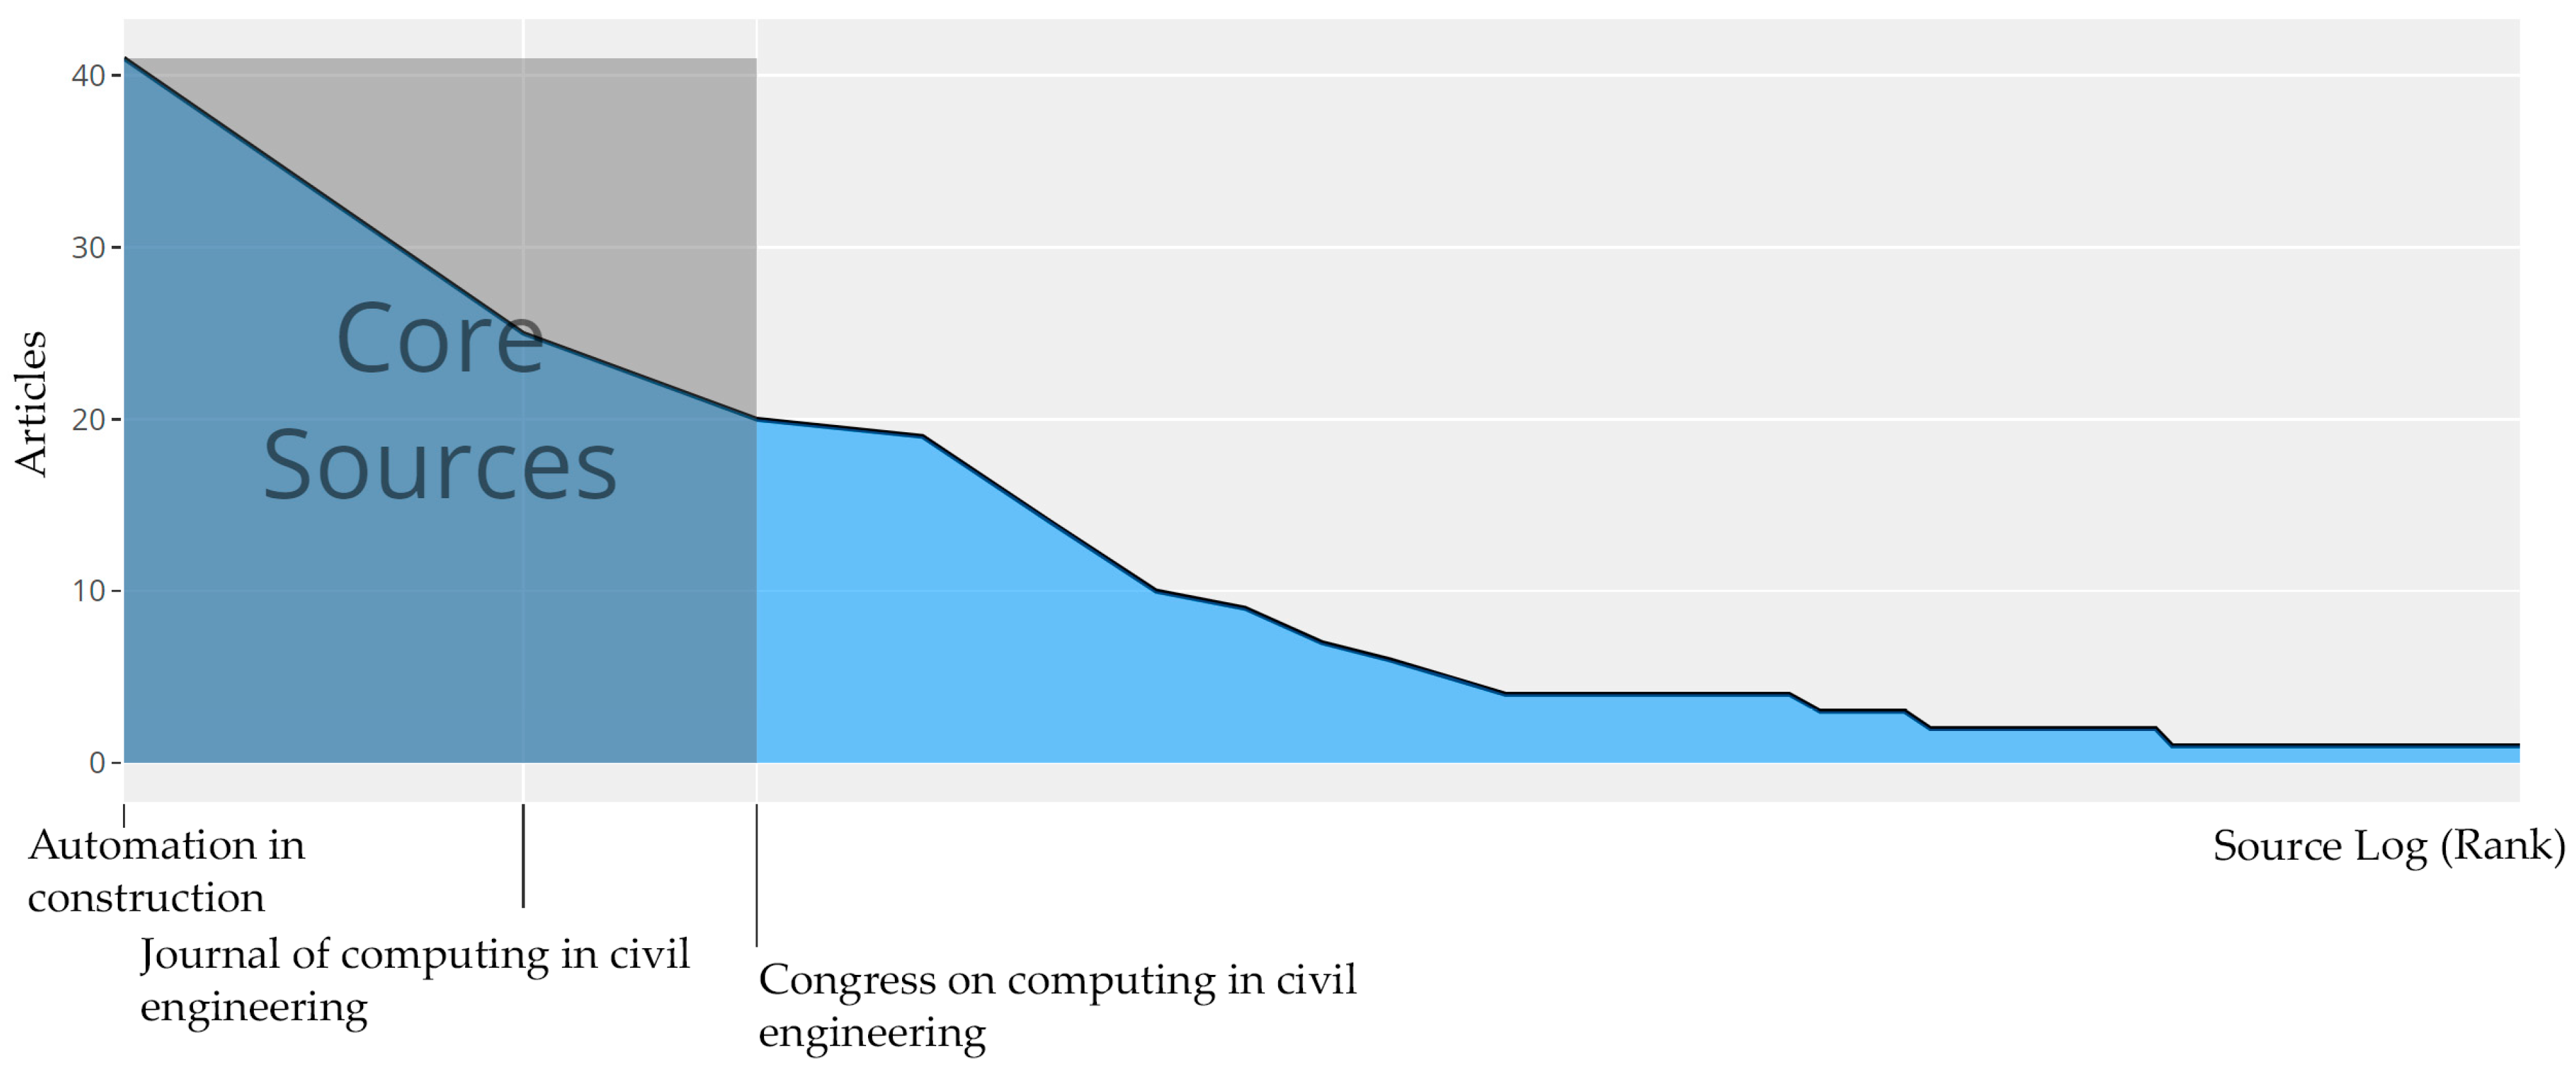
4.4.1. Source Ranking and Impact: The Bradford’s Law

To identify the most relevant journals and conferences in the analyzed domain knowledge, a counting of articles divided into sources is provided in Table 7. The analysis of academic journals and conference articles can be useful for researchers and scholars to find the most active and up-to-date sources, authors, and research groups.
A further analysis of the source impact is carried out based on Bradford’s Law using the BiblioShiny online tool. Bradford’s law describes how information is scattered in a field, based on the distribution of citations [111]. Literally, Bradford’s Law states: “if the journals are arranged in descending order the number of articles they carried on the subject, then successive zones of periodicals containing the same number of articles on the subject form the simple geometric series 1: n1S: n2S: n3S. Bradford’s Law divides all citations of a subject equally into three zones; the first zone is called “core zone” and it gathers the highest numbers of citations with the smallest number of journals. The second zone requires more journals to obtain the same number of citations, and the third zone more than the second one. Bradford describes a “decrease in productivity” in the transition from core zone 1 to zone 3 [112]. Bradford’s Law has influenced the methodology of creating the collections, supporting the organization and management of bibliographic works, and academic documentation [113]. From this perspective, Bradford’s Law can be used to identify the most highly cited journals for a field or subject, helping to categorize core journals in the field, as shown in Figure 14.
The core zone, Zone 1, is composed by 86 articles gathered in three sources, two journals, and one conference proceeding: Automation in Construction, Journal of Computing in Civil Engineering, and Proceedings of Congress on Computing in Civil Engineering. Eighty-six articles grouped in eleven sources compose zone 2, the middle zone, and Zone 3, the minor zone, gathers eighty-two articles in fifty sources.

4.4.2. Source Impacts: H-Index, G-Index, and M-Index

To find the most impactful source, H-index, G-index, and M-index are also calculated and compared in Table 8:
  • H-index, or Hirsch-index, is an author’s or journals’ number of published items (i.e., articles), each of which has been cited in others papers at least a number of times (h) [114];
  • G-index, introduced in 2006 is: “an improvement of H-index to measure the global citation performance of a set of articles. If this set is ranked in decreasing order of the number of citations that they received, the G-index is the (unique) largest number such that the top g articles received (together) at least g2 citations” [115];
  • M-index is equal to H-index/n, where n is the number of years since the first published paper of the source [114].
As already shown in core zone 1 of the Bradford’s Law plot, Automation in Construction and Journal of Computing in Civil Engineering are the most impactful journals considering all the three indexes, H-index, G-index, and M-index. They are followed by the Journal of Construction Engineering and Management and by the Proceedings of Congress on Computing in Civil Engineering, the latter also having been identified in the core zone 1 of the Bradford’s Law plot.

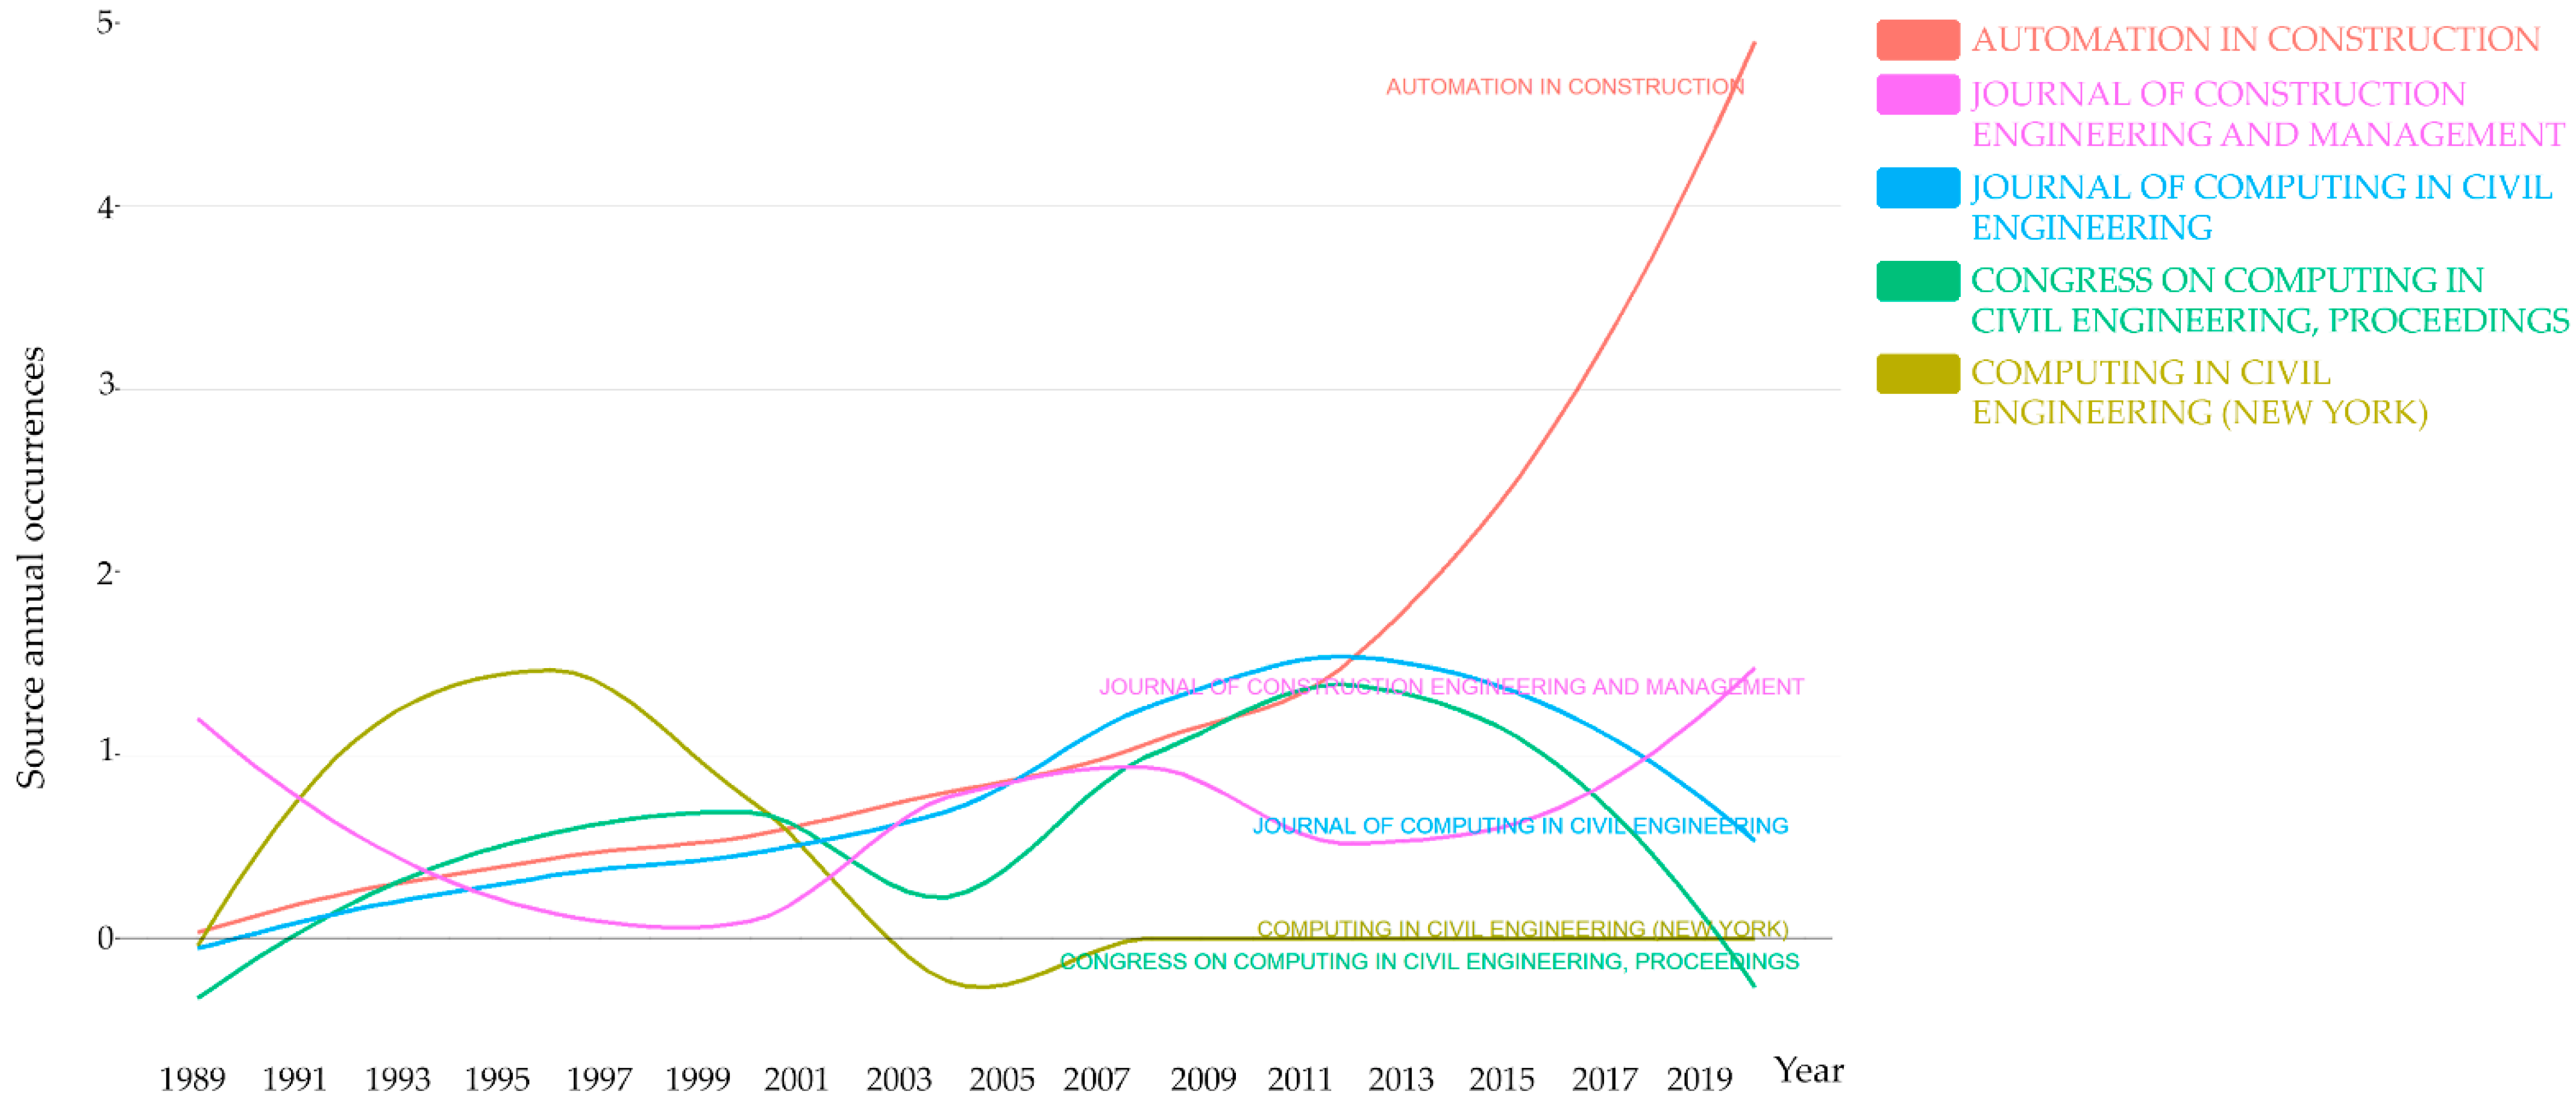
4.4.3. Source Evolution and Dynamics

Once the sources with the greatest impact on the scientific community with respect to NLP and BIM topics in the construction industry had been identified, a graph of the trend of the top five sources in terms of impact was produced to investigate their evolution over the period 1989–2020 (Figure 15).
Only two out of the identified five sources show an upward trend over the 2009–2019 decade: Automation and Construction and the Journal of Construction Engineering and Management. In fact, the latest impactful articles about the application of NLP and BIM in the AECO sector were published in those two Journals.

4.5. Author Production over Time

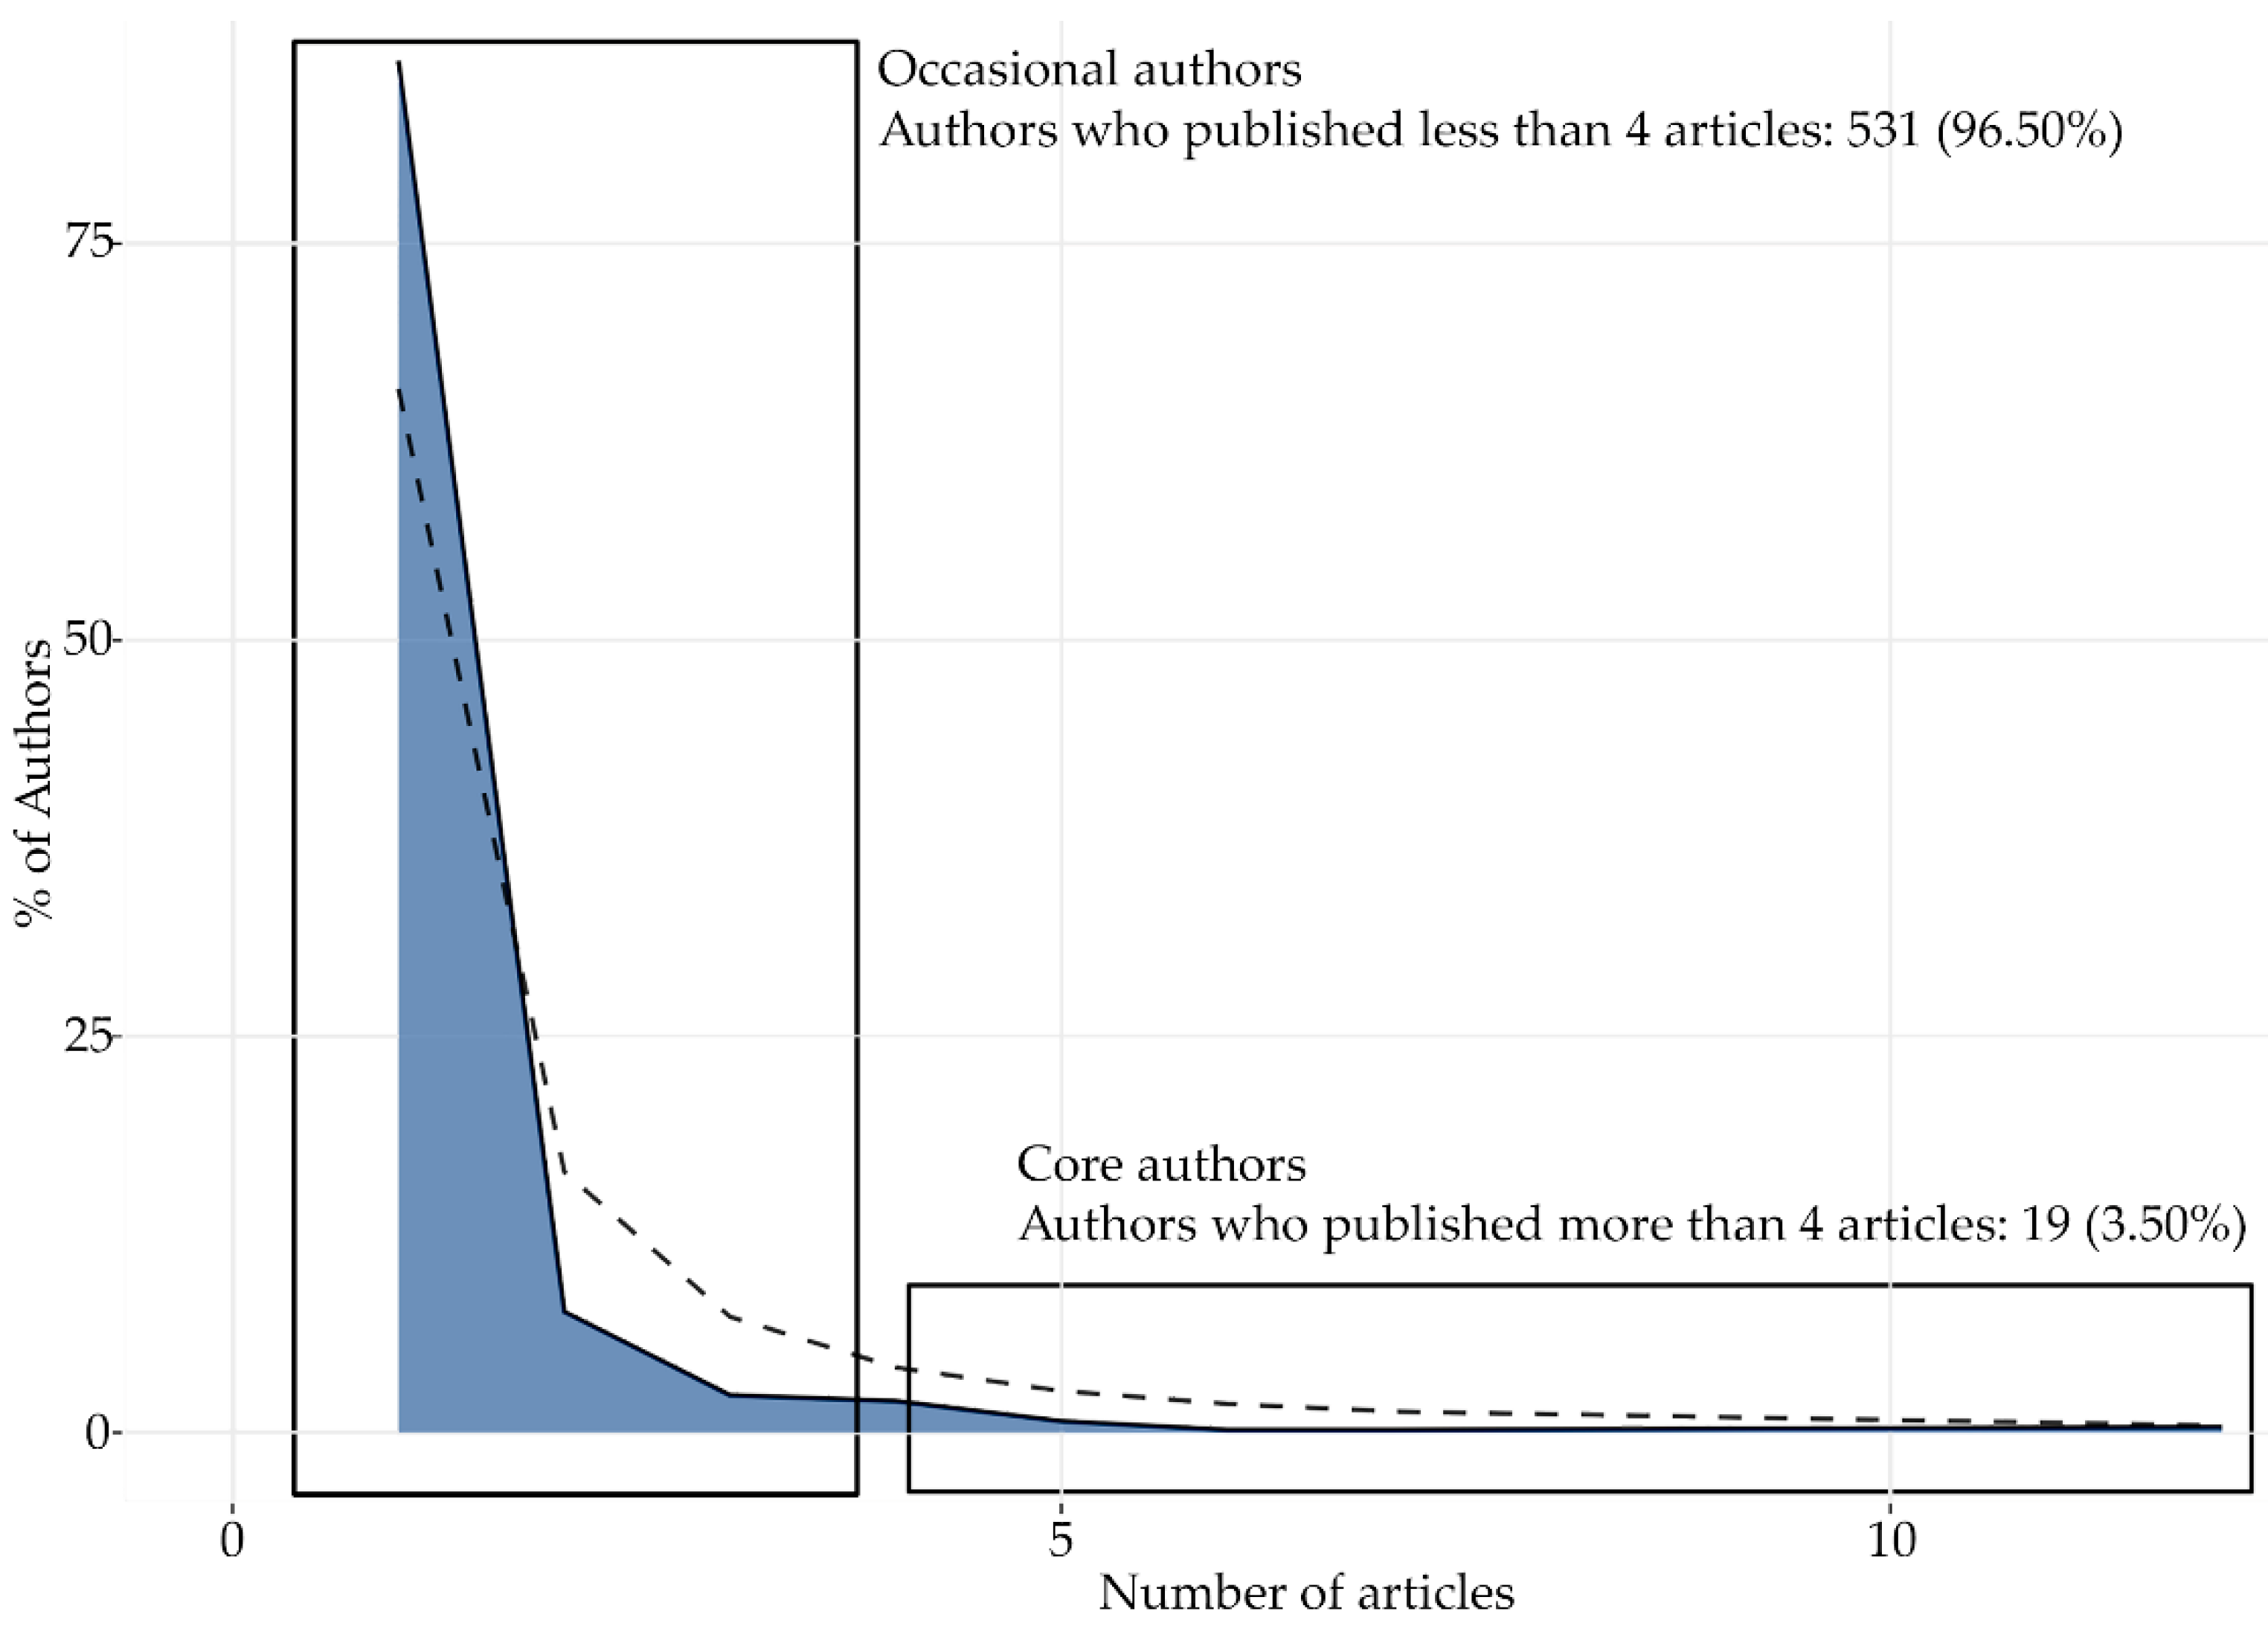
4.5.1. Top-Authors’ Productivity: Lotka’s Law (1993–2020)

The frequency of publications per author can be described using Lotka’s Law. Lotka’s Law states: “as the number of published articles increases, authors producing many publications become less frequent” [116,117].
Figure 16 shows that only 19 authors are relevant and have an impact on the knowledge domain. The chart allows identifying the significant authors in the analyzed topic. The scientific production of the most relevant authors is analyzed in the following section.

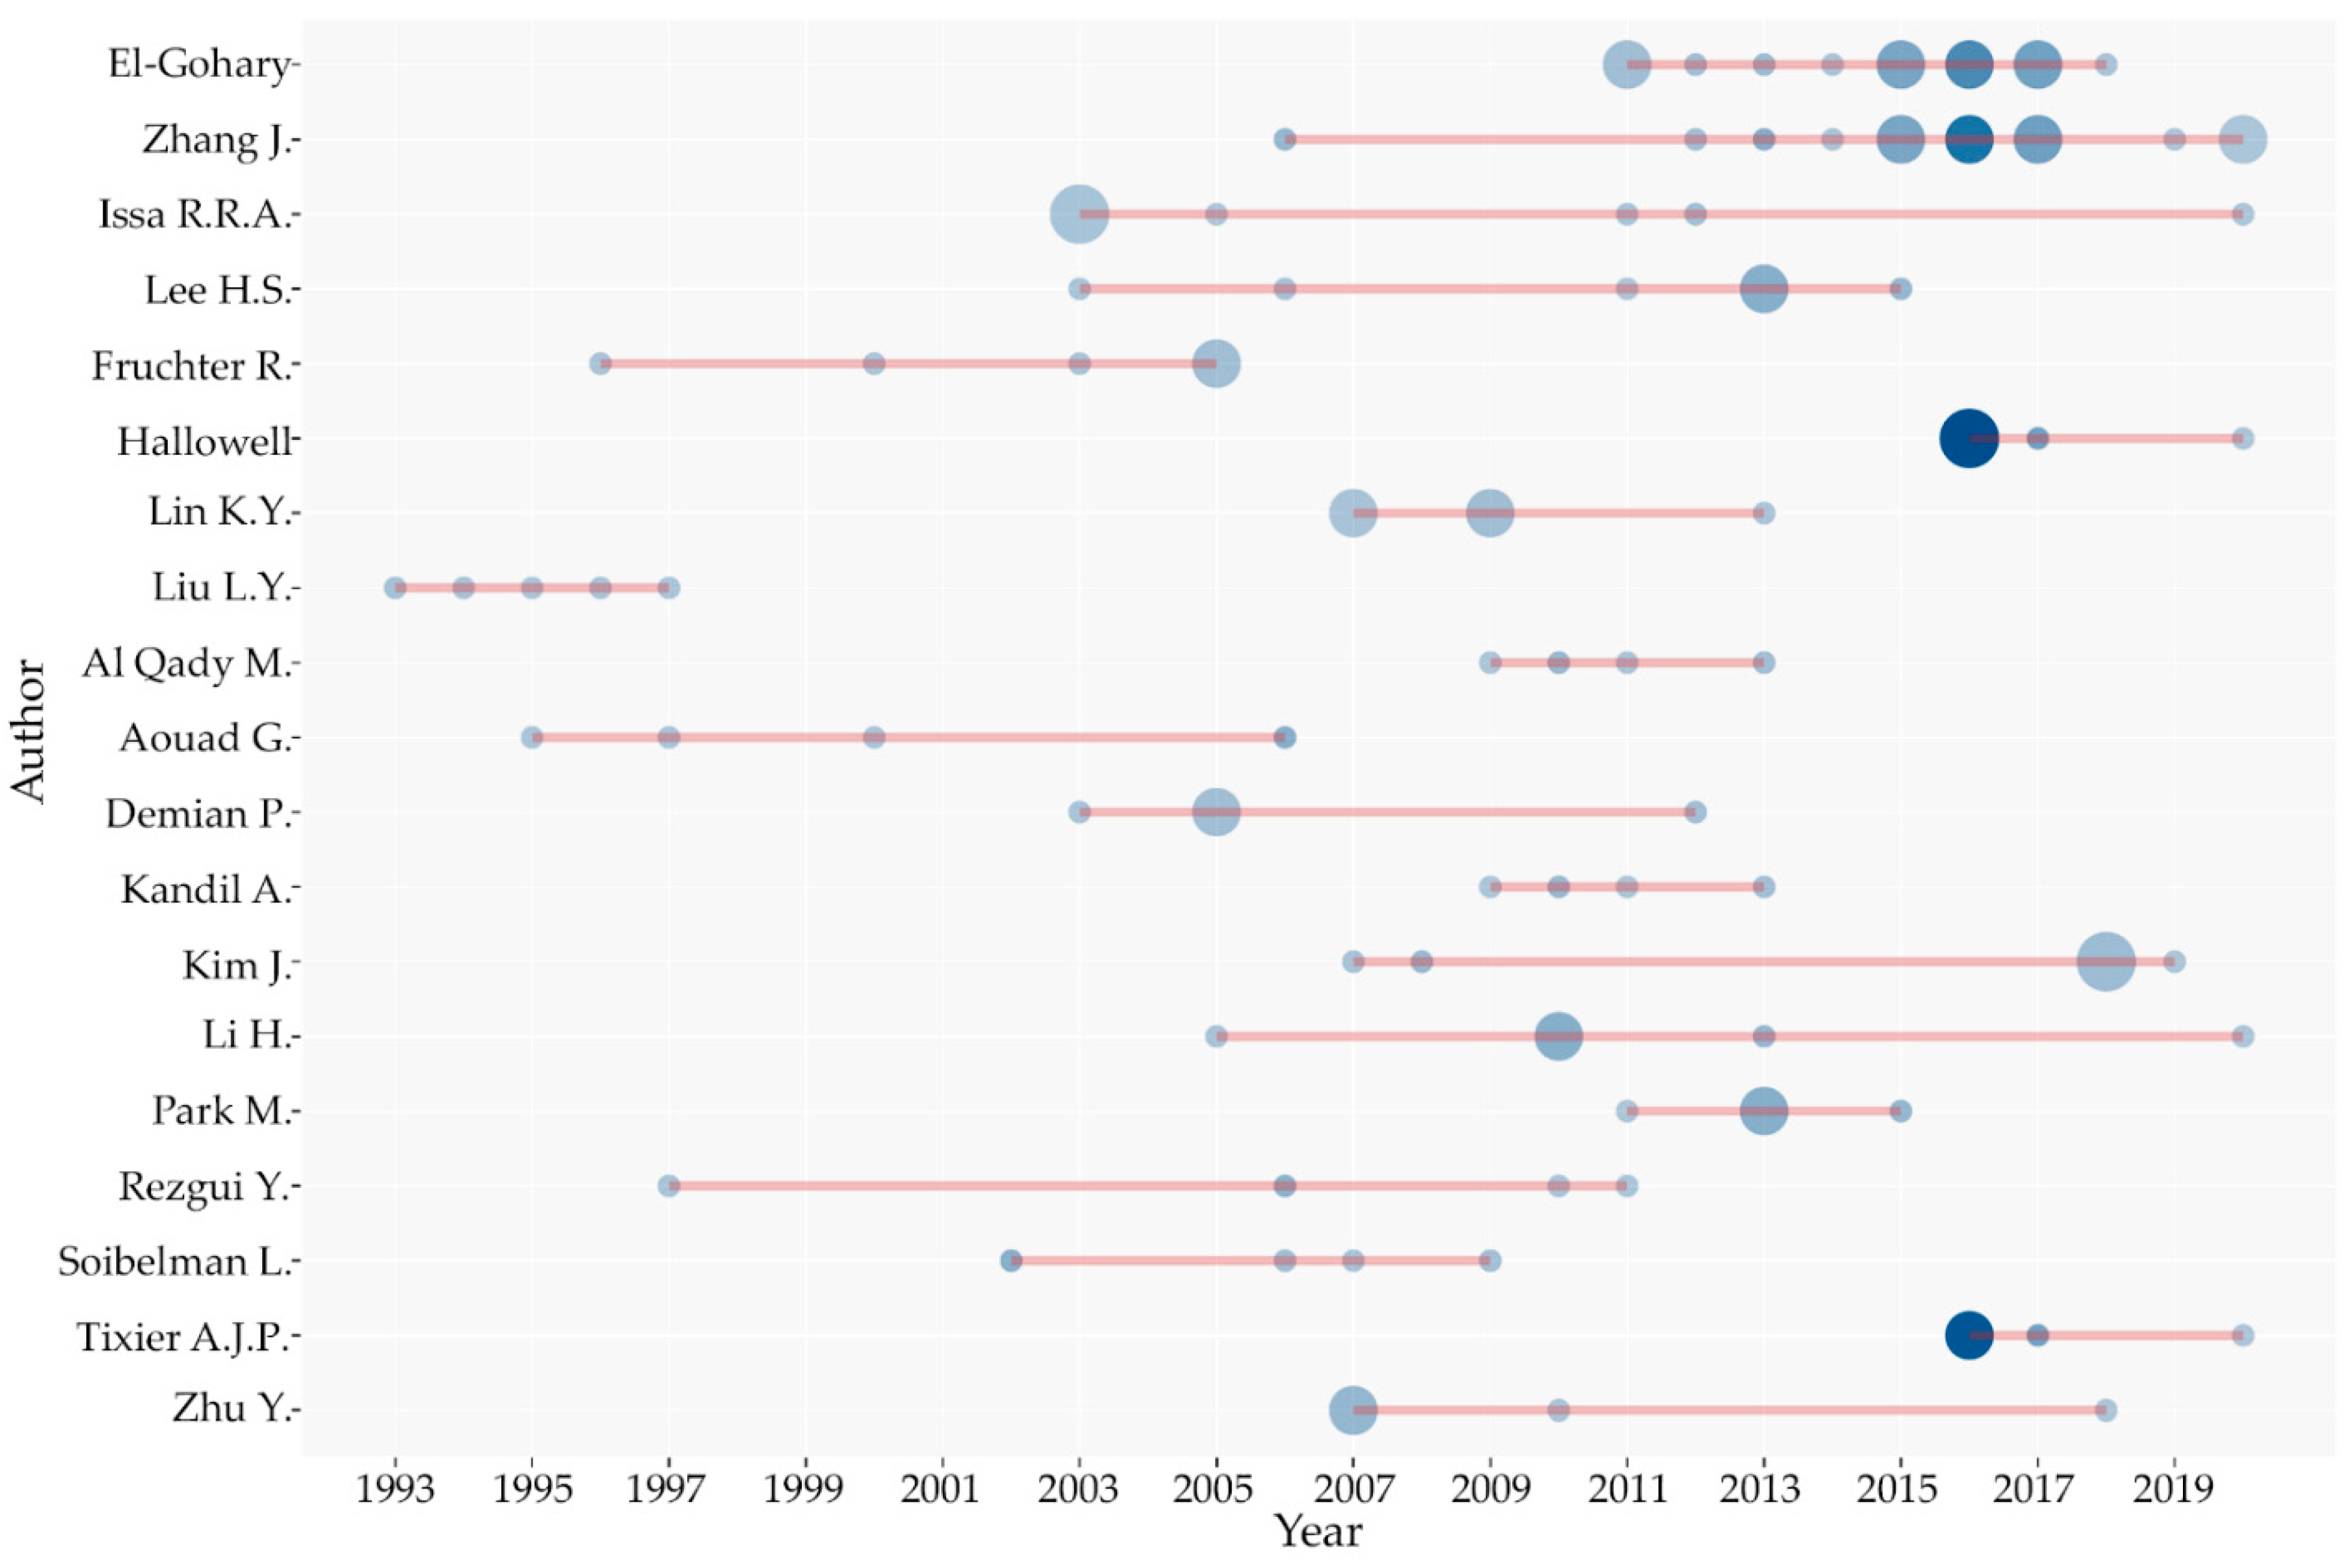
4.5.2. Top-Authors’ Production (1993–2020)

In the proposed graph (Figure 17), the scientific production of the core authors is plotted. The lines represent the author’s scientific production timeline, the bubble size is proportional to the numbers of documents published in a certain year, and the bubble color intensity is proportional to the number of citations per year.
The most active period in terms of publications and citations ranges from 2003 to 2019. Before that period, Professor L. Y. Liu from the University of Illinois Urbana-Champaign published an article in 1993 [118]. The latest publications belong to Zhang J. [119], Issa R. R. A. [120], Hallowell M. R., Tixier A. J.-P. [121], and Li H. [122]. The most productive authors in terms of number of publications and references in the period 2015–2020 are: El-Gohary N. M., Zhang J., Issa R. R. A., Lee H. S., and Hallowell M. R. and Tixier A. J.-P.

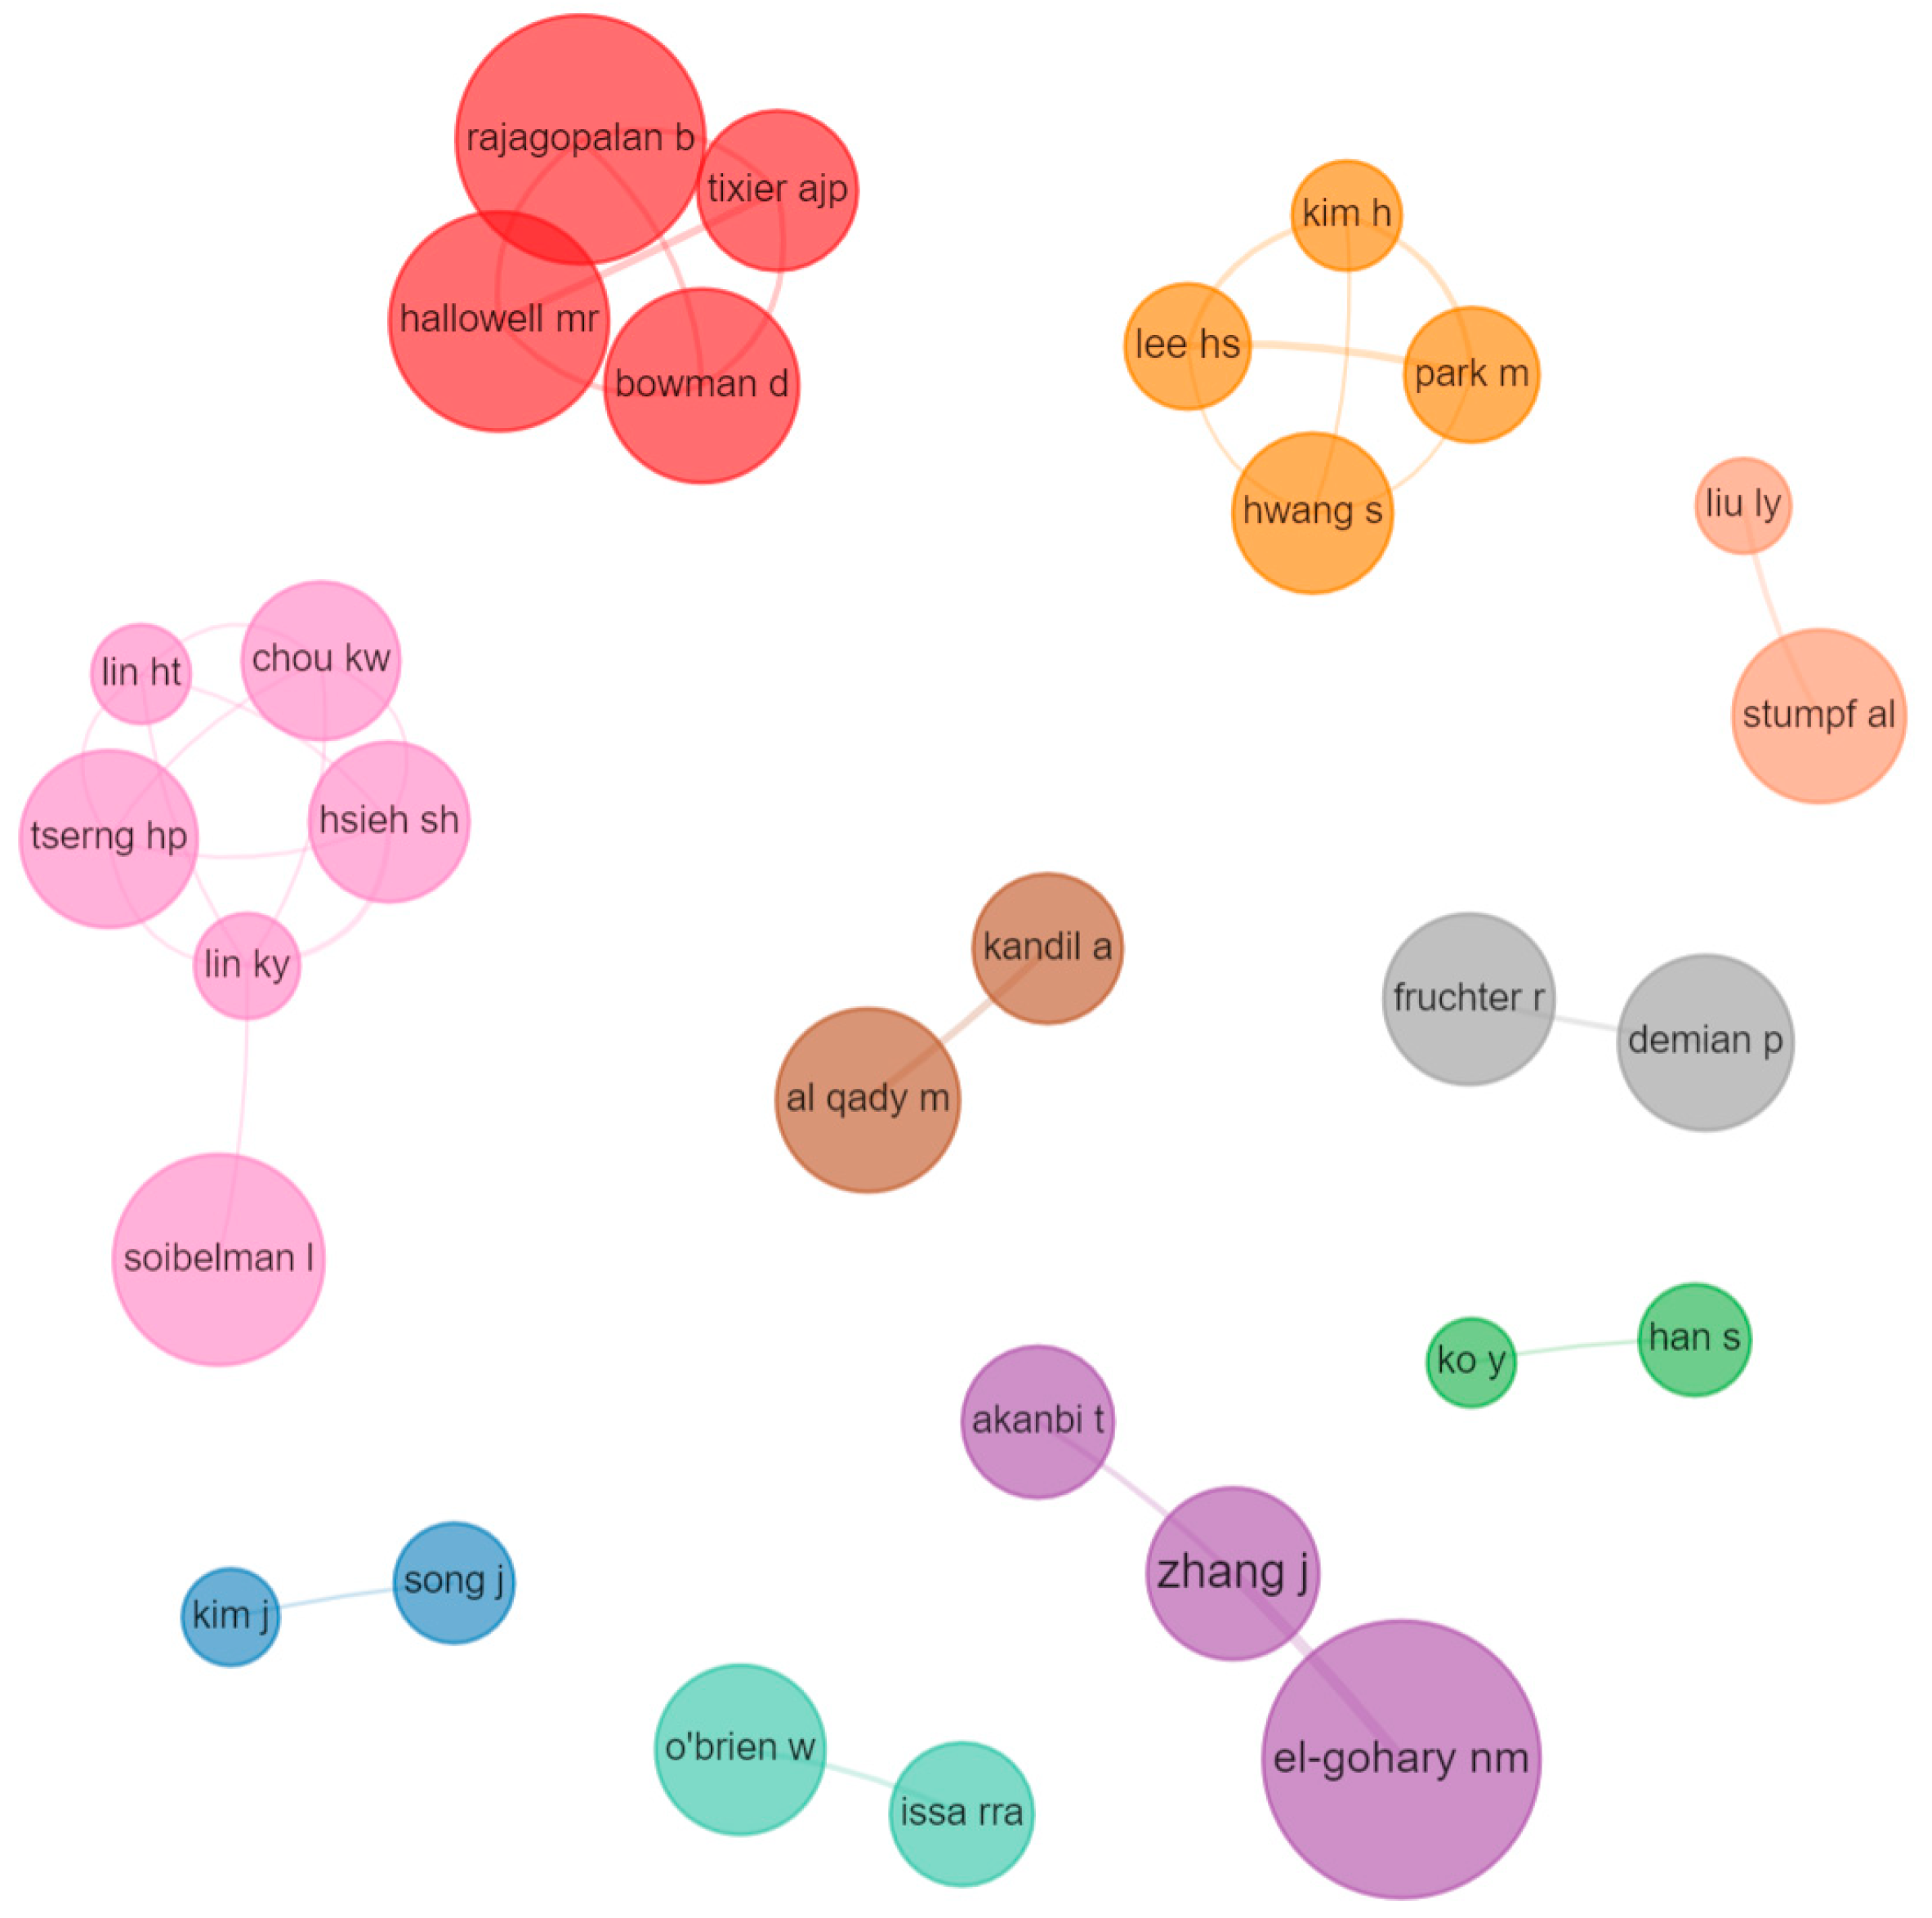
4.5.3. Authors Collaboration: Co-Authorship Network

To investigate and visualize the relationships among authors, i.e., the so called social structure of the research field [123], a co-authorship network is provided (Figure 18).
The co-authorship network shows the existence of 10 main research groups. Only 4 out of 10 groups are composed by more than two people. The network shows a social structure composed by small research groups with few relationships between them. Six researchers compose the largest group, while the remaining groups vary from a minimum of two to a maximum of four members.

4.6. Social and Geographical Analysis

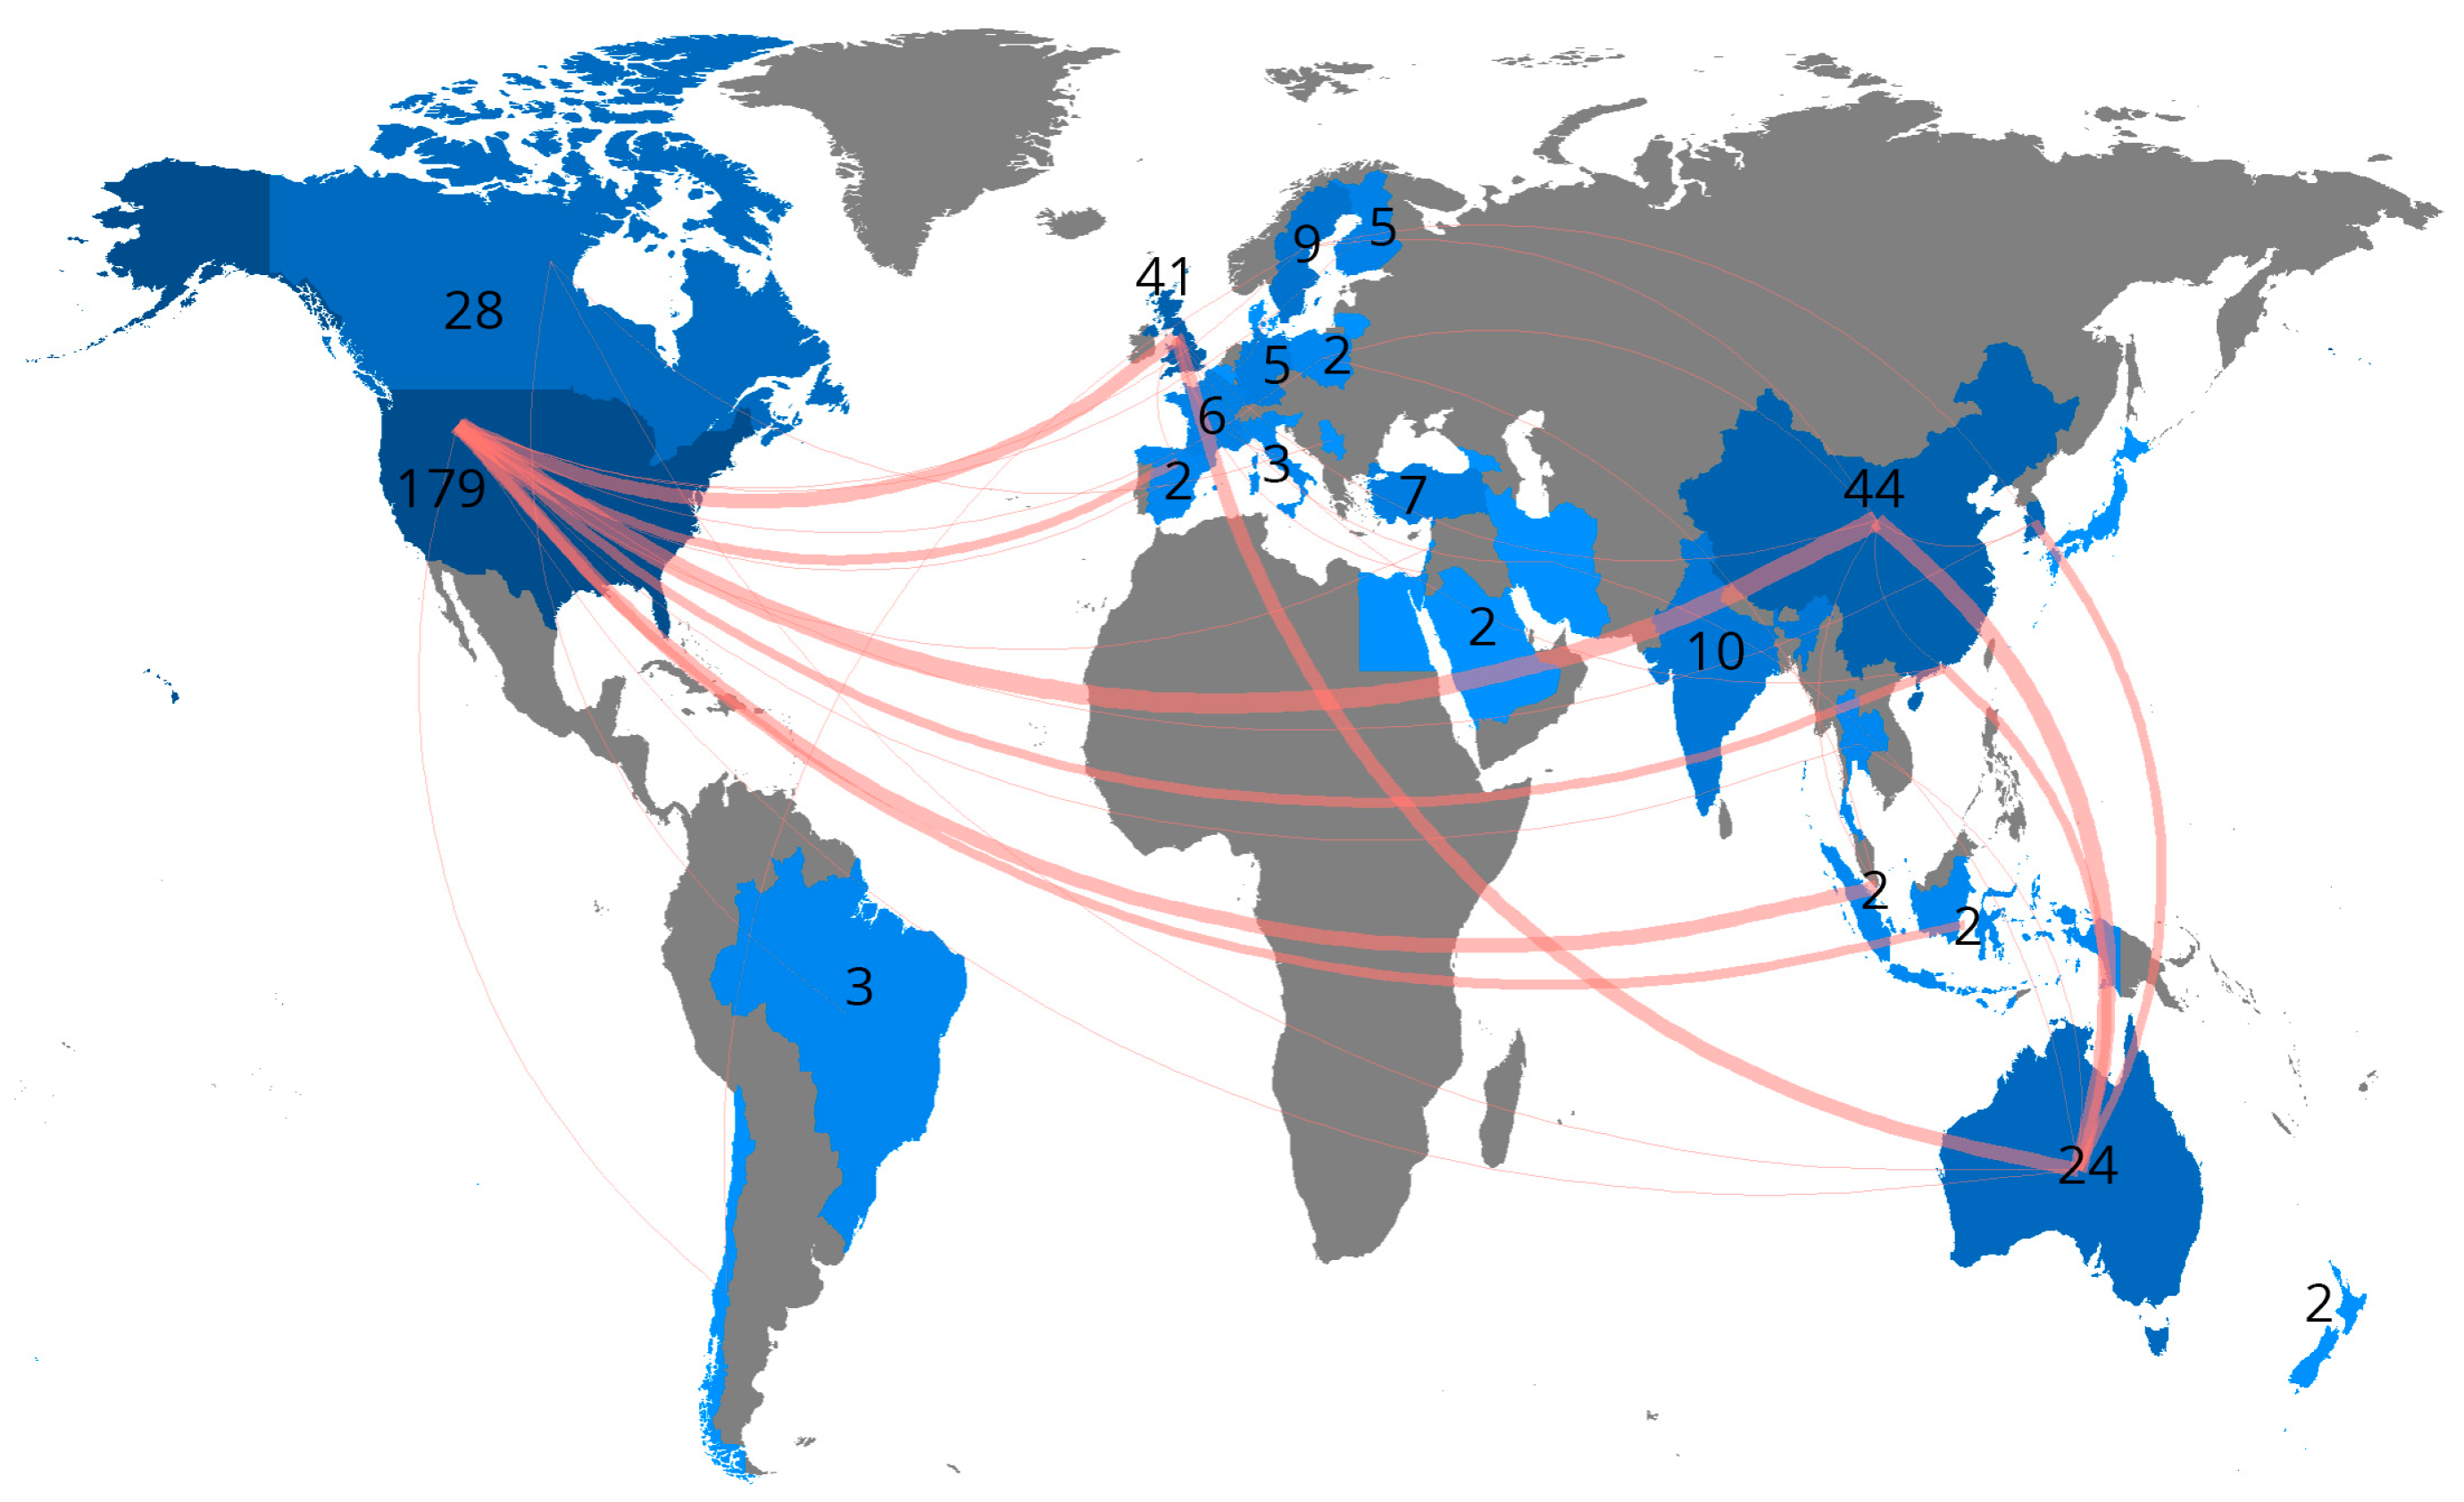
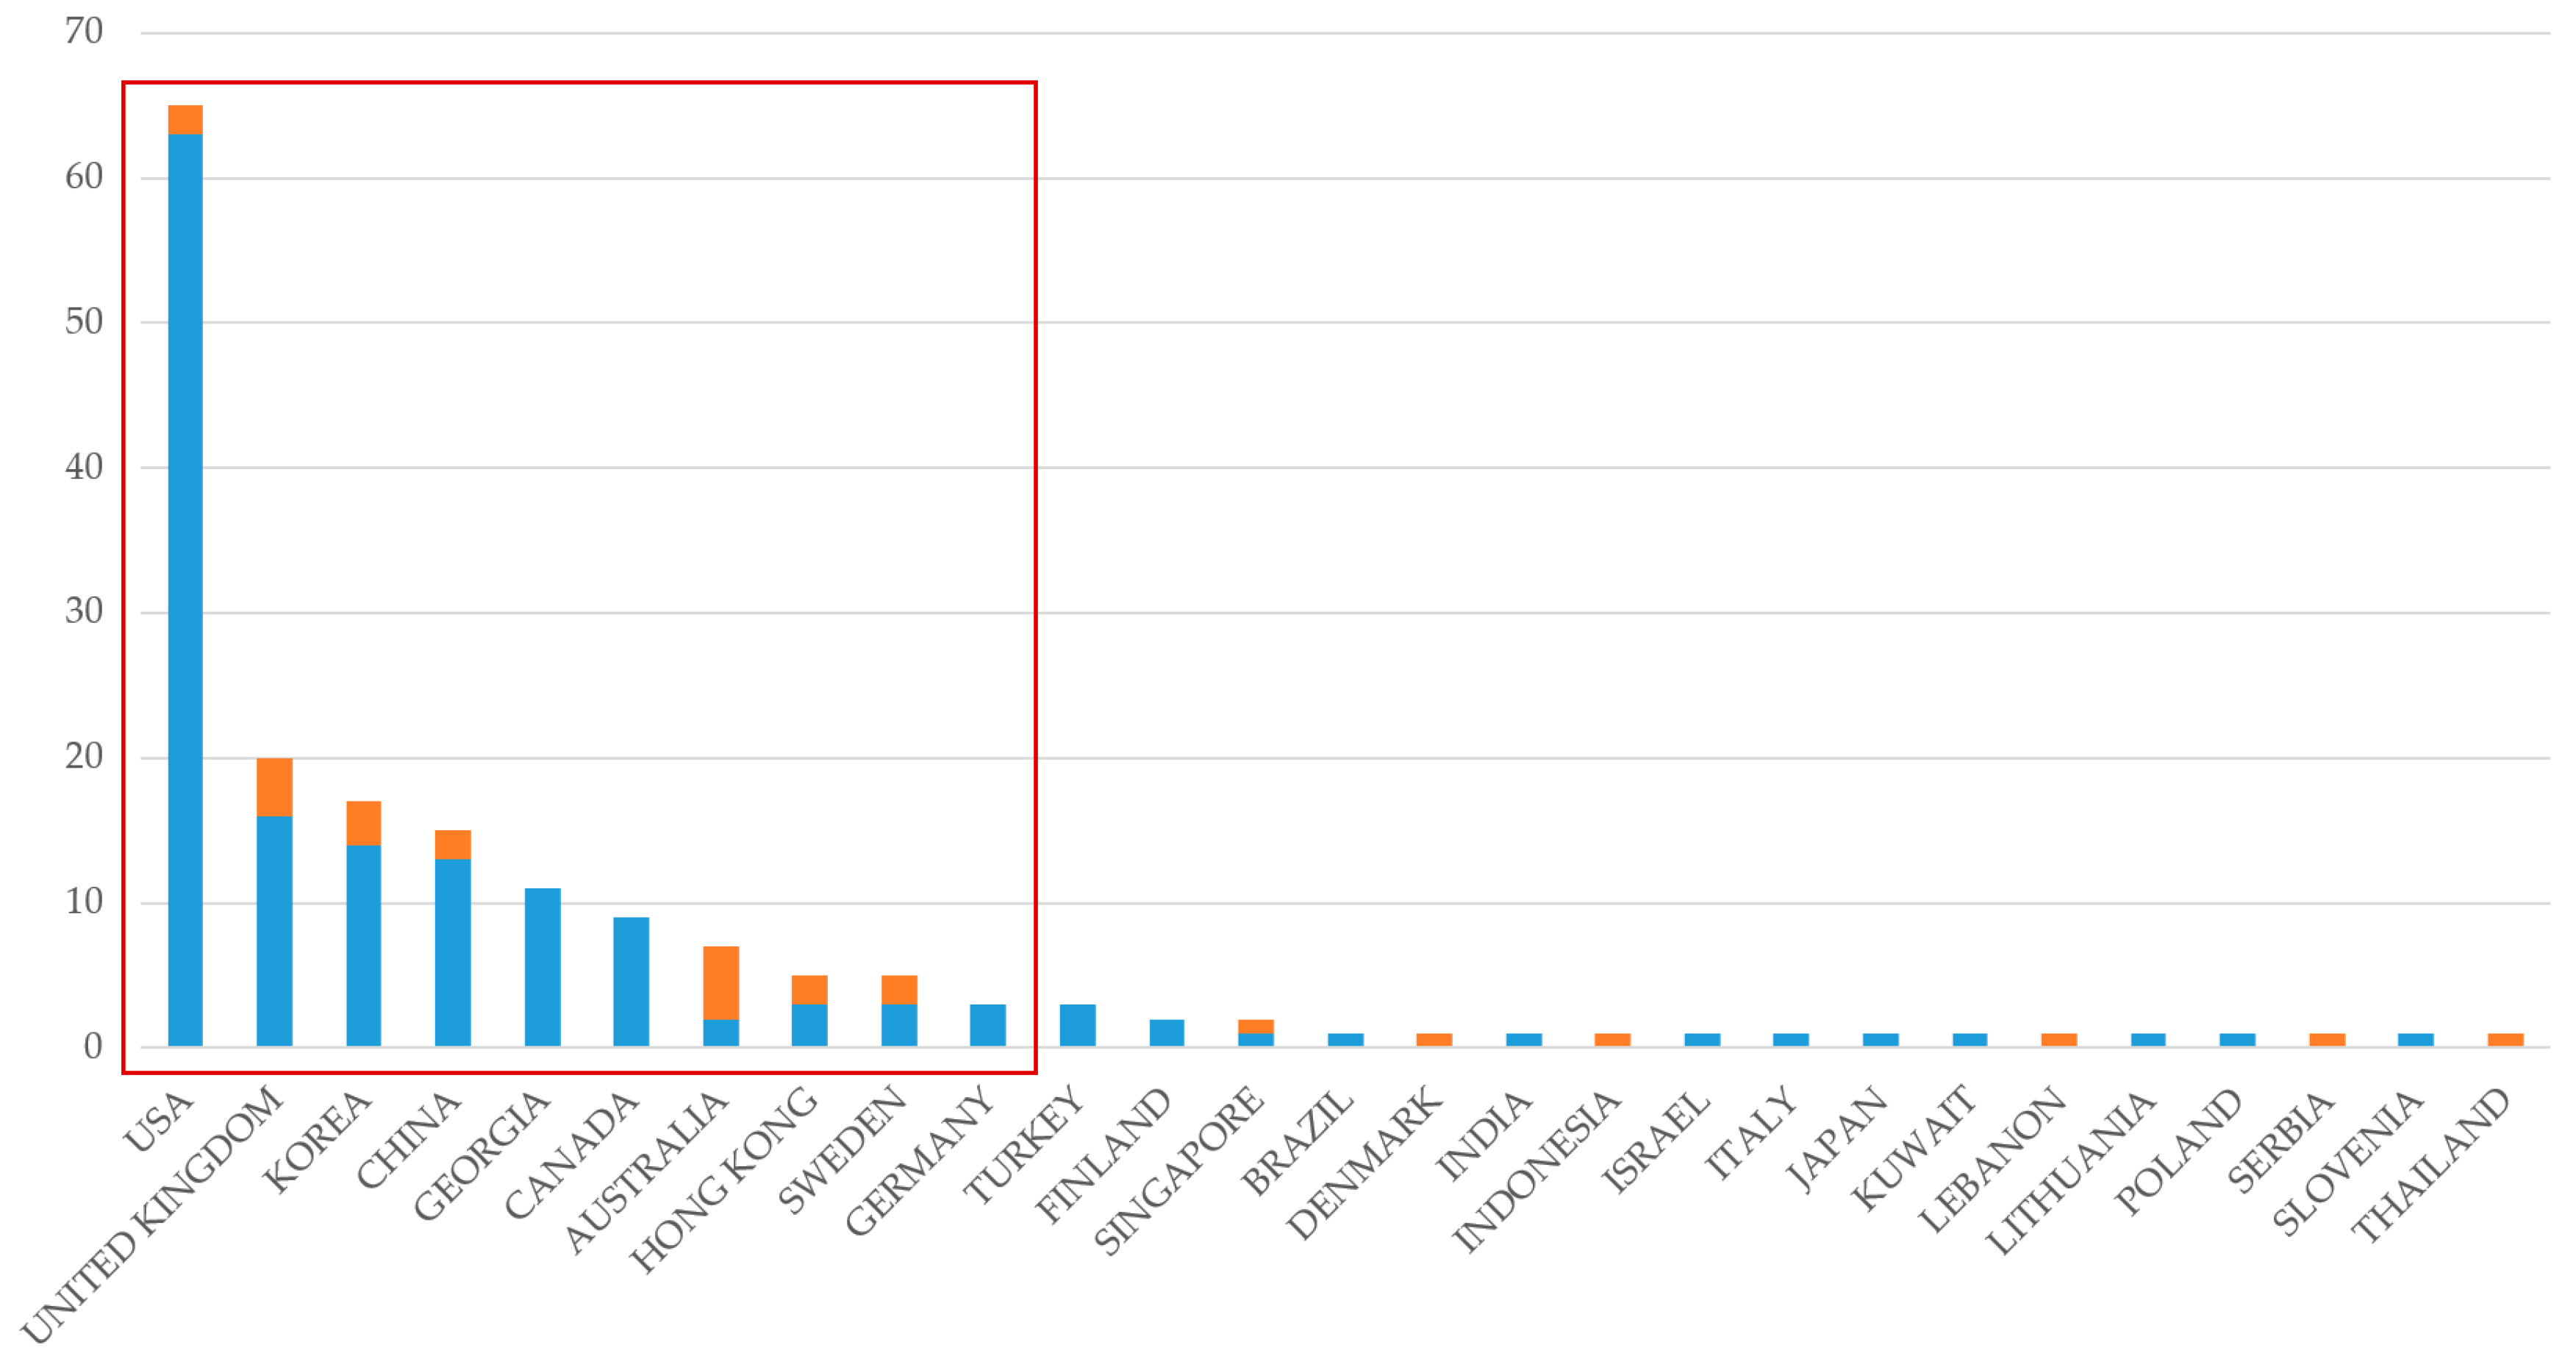
4.6.1. Countries Scientific Production and Collaboration Intensity

A geographical map representing the provenance of the scientific production and the collaboration among countries is provided (Figure 19).
The countries with the highest scientific production in the field are the United States of America (179 articles), followed by China (44 articles), the United Kingdom (41 articles), Canada (28 articles), and Australia (24 articles). To visualize and investigate the collaboration among researchers from different countries, a collaboration bar chart is provided (Figure 20). The bar chart indicates, for each country, the number of documents in which there is at least one co-author from a different country than the corresponding author.
The chart shows a low degree of collaboration among researchers from different countries. Considering the first 10 countries for scientific production, only 20 articles out of 137 have at least one co-author from a different country of the corresponding author. The unique country with a higher number of publications from multiple countries authors is Australia.

4.6.2. Most Relevant Affiliations and Institutions

Affiliations are listed according to the number of published articles (Table 9). Seven out of the ten most scientifically productive institutes are American, two are Canadian, and only one is Taiwanese.

5. Conclusions

Information sharing, storing, and management procedures in AECO are highly based on document production and exchange. Text documents, i.e., unstructured sources of information, are still essential for the construction process [8]. On the other hand, the adoption of BIM in AECO industry tends to shift the sector toward a model-based approach. Despite the widespread use of BIM approaches, AECO information flow is still mainly based on document production and exchange [8,12,13]. For that reason, adopting BIM is insufficient to leverage the whole value of unstructured data and information [15]. The study identifies Natural Language Processing as a possible approach to process unstructured text information, helping to overcome the document-based nature of the sector and to seize the full potential of digitalization in the construction sector [1].
The proposed study aims to investigate the knowledge domain of NLP technologies and applications in AECO, including the identification and analysis of possible links and integration between BIM and NLP methods, drawing a picture of the body of knowledge. Scientometric and data visualization approaches are applied to explore: Conceptual (main themes and trends, in Section 4.1, Section 4.2 and Section 4.3), Intellectual (influence of articles, sources, and authors, in Section 4.4 and Section 4.5), and Social structure (interaction among countries, affiliations, and researchers in Section 4.6) of the selected knowledge domain.
The research methodology is structured into five main phases: (I) science mapping methods and tools selection; (II) query methods and criteria; (III) data cleaning; (IV) scientometric analysis; (V) analysis and discussion of the results. Each science mapping tool has its own limitations and strengths. To select the best set of tools, an analysis and a comparison is conducted. BiblioShiny [49], VosViewer, and Gephi are identified as the most suitable science mapping tools. The bibliometric data are gathered from Scopus DB only. Scopus has a larger coverage of scientific production and a faster indexing process than Web of Science [54]. A keywords string, composed by keywords used by previous studies on NLP, BIM, and AECO topics [63], has been defined to query the Scopus DB and to download the bibliometric meta-data corresponding to the boundaries of the investigated knowledge domain. A sample of 254 publications and the related useful bibliographic data are downloaded from Scopus DB.
Temporal trends analysis results underline an increasing interest of the scientific community in the NLP topic in the AECO sector. The increasing volume of, and the consequent need for AECO to manage, unstructured data to support the decision-making process, and the recent advancements of NLP, can be factors for the rising interest in the topics, as also stated by Bilal et al. 2016 [65]. A misalignment between the trend of average citations per year and the scientific production trend is discovered, likely caused by the high degree of innovativeness regarding the NLP theme in the construction sector investigated by a limited number of research groups. A small size and limited number of research groups investigating the theme paired with a low degree of collaboration between researchers, as reported in Section 4.5 and Section 4.6, could be the causes of the low impact on the scientific community in terms of citations.
Network visualization (i.e., co-words network, co-occurrence keywords network) is performed to investigate the conceptual structure of the data sample, defining the most important and recent topics [67]. Meta-data related to the publication year are plotted to study the evolution and the changes of a subject over a period. The co-occurrence keywords network, Section 4.2, shows a close relationship among BIM, Semantic, and NLP topics, which can be explained by the capability of NLP systems to process natural language, which is a semantic information itself, and translate it into a machine-understandable format, such as ontologies. Ontologies seem to be well-explored and promising digital artifacts to support the interoperability between BIM systems with a focus on semantic interoperability. There is a clear tendency of the scientific community towards investigating and using Semantic Web technologies to solve the interoperability issue of AECO industry [98]. NLP, BIM, the Semantic topic, and their intersections can all be considered part of the transition process towards the implementation of the Semantic Web in AECO processes aiming to fully digitalize the sector.
A factorial analysis is applied to reduce the dimensionality of network graphs, representing them in a two-dimensional space. The factorial analysis reduction map shows the role of the cluster, composed by the BIM, ontology, and ifc keywords, as a bridge theme connecting the NLP and Semantic cluster and the Information Technology and Construction management cluster. A thematic map is provided to analyze the temporal evolution of topics; the map shows the evolution of the NLP topic from the quadrant of “important but not really developed themes” to the lower left quadrant being an emerging topic in the 2017–2019 time-slice. In the last time-slice, 2019–2020, NLP is identified as a motor theme with high density and high centrality values; big data analytics and computer vision appear as highly developed and isolated themes. The analysis of the conceptual structure also allows identifying the main NLP technological drivers: Artificial intelligence, Text mining, and Learning algorithms; their declinations (Machine learning and Deep learning) emerge as the most widespread and promising technological drivers. The application of NLP seems to be pervasive in several AECO fields. Project, Safety, and Risk Management are the fields with the highest number of NLP applications. Regarding the combined applications of NLP and BIM, the Automatic Compliance Checking field has the highest number of articles. These are likely regulation documents, which are highly standardized and structured into formats, and are feasible to be processed by NLP systems and translated into machine-readable language. NLP-based systems to convert regulatory information represent an active field of research. Information Retrieval from BIM models and Information Enrichment of BIM objects are further active fields of investigation. No articles seem to be related to the preliminary design or requirement definition phases, representing possible research areas not covered by the Academia.
As stated, data about provenance of corresponding authors and co-authors show a low degree of collaboration among researchers from different countries, only 20 articles out of 137 have at least one co-author from a different country of the corresponding author. The most relevant and impactful journals and conferences are also identified through a source impact analysis.
As conclusive remarks, the evolution of the research about NLP and BIM systems suggests an effort from the research community to support the sector in the transition from a document-centric to a fully information-based approach. Semantic information, by its nature, is closely related to natural language that can be managed and processed through NLP systems. Thus, the combined use of NLP and BIM systems can have a positive impact on the digitalization of the AECO sector. NLP tools and technique can become a connection between the world of documents and the world of digital entities, such as BIM models, ontologies, or knowledge graphs (KG). NLP services built on the latest transformer-based pre-trained language models (e.g., BERT or GPT-3) will enable the processing of text documents and returning digitalized and queryable information and entities in a semi-automatic way. Consequently, the separation of the informative sources, i.e., the document-based and the BIM model-based sources, which is demonstrated to be counterproductive, will be averted. NLP, BIM, and Semantic technologies and their intersections can all be considered drivers for the digital transition of the design and construction process. The latest research focuses on modelling and visualizing semantic information and knowledge [124]. The recent semantic and knowledge modeling approaches in the AECO sector mainly aim to find a methodology to model and store semantic data in a structured way [125], and to maintain the interrelation among numerical and semantic data during the whole progress of the construction project, thus preserving the traceability of data properties’ progression [125,126]. The semantic modelling approach ultimately aims to overcome the document-centric approach based on unstructured data, in order to reduce the fragmentation typical of the traditional information management method [127,128]. The performed bibliometric analysis confirms the industry’s growing interest in BIM, NLP, and Semantic technologies integration, aiming to overcome the above-mentioned limitations of current document-centric processes of AECO sector.
The findings of the analysis are to be considered in light of some limitations. The main limitations of the proposed approach are the following: (I) research findings do not fully reflect the entire NLP and BIM knowledge domain in AECO industry, being the Scopus DB query circumscribed by the selected keyword string, e.g., non-English articles are omitted from the analysis (18 out of 272); (II) the study is a static picture of the body of knowledge in a specific period (1989–2020). Regarding the second limitation, it is worth noting how applying the same bibliometric approach in the future will allow further investigation of the dynamic nature and the evolution of the NLP and BIM topic.

Author Contributions

Conceptualization, M.L. and G.M.D.G.; methodology, M.L. and G.M.D.G.; software, M.L. and L.P.; validation, M.L., E.S., L.C.T., and G.M.D.G.; formal analysis, M.L.; investigation, M.L.; resources, M.L. and L.C.T.; data curation, M.L. and L.P.; writing—original draft preparation, M.L.; writing—review and editing, M.L., L.C.T., E.S. and L.P.; visualization, M.L.; supervision, L.C.T. and E.S.; project administration, G.M.D.G.; funding acquisition, G.M.D.G. All authors have read and agreed to the published version of the manuscript.

Funding

This research received no external funding.

Institutional Review Board Statement

Ethical review and approval were waived for this study because they were not applicable.

Conflicts of Interest

The authors declare no conflict of interest.

References

  1. European Comission. Supporting Digitalisation of the Construction Sector and SMEs: Including Building Information Modelling; European Comission: Brussels, Belgium, 2019. [Google Scholar]
  2. World Economic Forum. Shaping the Future of Construction a Breakthrough in Mindset and Technology; World Economic Forum: Cologny, Switzerland, 2016. [Google Scholar]
  3. Abanda, F.H.; Mzyece, D.; Oti, A.H.; Manjia, M.B. A study of the potential of cloud/mobile bim for the management of construction projects. Appl. Syst. Innov. 2018, 1, 9. [Google Scholar] [CrossRef] [Green Version]
  4. Ullah, K.; Lill, I.; Witt, E. An overview of BIM adoption in the construction industry: Benefits and barriers. In Proceedings of the 10th Nordic Conference, Tallinn, Estonia, 7–8 May 2019; Emerald Publishing Limited: Tallin, Estonia, 2019; Volume 2, pp. 297–303. [Google Scholar]
  5. International Organization for Standardization. ISO 19650-1:2018—Organization and Digitization of Information about Buildings and Civil Engineering Works, Including Building Information Modelling (BIM)—Information Management Using Building Information Modelling; International Organization for Standardization: Geneve, Switzerland, 2021. [Google Scholar]
  6. Rezgui, Y.; Cooper, G.; Marir, F.; Vakola, M.; Tracey, A. Advanced Document Management Solutions for the Construction Industry: The Condor Approach. In Proceedings of the Life-Cycle of Construction IT Innovations—Technology Transfer from Research to Practice, Stockholm, Sweden, 3–5 June 1998; Bjork, B.C., Jagbecj, A., Eds.; Royal Institute of Technology: Stockholm, Sweden, 1998; pp. 1–11. [Google Scholar]
  7. Haimes, R. Document Interface. Interactions 1994, 1, 15–18. [Google Scholar] [CrossRef]
  8. Opitz, F.; Windisch, R.; Scherer, R.J. Integration of document- and model-based building information for project management support. Procedia Eng. 2014, 85, 403–411. [Google Scholar] [CrossRef] [Green Version]
  9. Rezgui, Y.; Zarli, A. Paving the Way to the Vision of Digital Construction: A Strategic Roadmap. J. Constr. Eng. Manag. 2006, 132, 767–776. [Google Scholar] [CrossRef]
  10. Wang, C.C.; Plume, J.; Jim, P. A Review on Document and Information Management in the Construction Industry: From Paper-based Documents to BIM-based Approach. In Proceedings of the 2012 International Conference on Construction and Real Estate Management, Kansas City, MO, USA, 1–2 October 2012; pp. 369–373. [Google Scholar]
  11. Moon, S.; Shin, Y.; Hwang, B.-G.; Chi, S. Document Management System Using Text Mining for Information Acquisition of International Construction. KSCE J. Civ. Eng. 2018, 22, 4791–4798. [Google Scholar] [CrossRef]
  12. Zhu, Y.; Raja, R.A.I.; Cox, R.F. Web-Based Construction Document Processing Via Malleable Frame. J. Comput. Civ. Eng. 2001, 15, 157–169. [Google Scholar] [CrossRef]
  13. Hala, N.; Mahmoud, E.J.; Melanie, P. Transforming the AEC Industry: A Model-Centric Approach. In Creative Construction e-Conference; Skibniewski, M.J., Hajdu, M., Eds.; Budapest University of Technology and Economics: Budapest, Hungary, 2020; pp. 13–18. [Google Scholar]
  14. Mich, L. NL-OOPS: From natural language to object oriented requirements using the natural language processing system LOLITA. Nat. Lang. Eng. 1996, 2, 161–187. [Google Scholar] [CrossRef]
  15. Sacks, R.; Girolami, M.; Brilakis, I. Building Information Modelling, Artificial Intelligence and Construction Tech. Dev. Built Environ. 2020, 4, 1–9. [Google Scholar] [CrossRef]
  16. Lenci, A.; Montemagni, S.; Pirelli, V. Testo e Computer. Elementi di Linguistica Computazionale; Carocci Editore@Aulamagna: Rome, Italy, 2005. [Google Scholar]
  17. Young, T.; Hazarika, D.; Poria, S.; Cambria, E. Recent trends in deep learning based natural language processing. IEEE Comput. Intell. Mag. 2018, 13, 55–75. [Google Scholar] [CrossRef]
  18. Di Giuda, G.M.; Locatelli, M.; Schievano, M.; Pellegrini, L.; Pattini, G.; Giana, P.E.; Seghezzi, E. Natural Language Processing for Information and Project Management. In Digital Transformation of the Design, Construction and Management Processes of the Built Environment; Springer International Publishing: Berlin/Heidelberg, Germany, 2020; pp. 95–102. ISBN 9783030335700. [Google Scholar]
  19. Briscoe, T. Introduction to Linguistics for Natural Language Processing, 4th ed.; Cambridge University: Cambridge, UK, 2013. [Google Scholar]
  20. Schubert, L. Computational Linguistics. In The Stanford Encyclopedia of Philosophy; Zalta, E.N., Ed.; Metaphysics Research Lab, Stanford University: Stanford, CA, USA, 2020. [Google Scholar]
  21. Khurana, D.; Koli, A.; Khatter, K.; Singh, S. Natural Language Processing: State of The Art, Current Trends and Challenges. arXiv 2018, arXiv:1708.05148. [Google Scholar]
  22. Church, K.W.; Rau, L.F. Commercial Applications of Natural Language Processing. Commun. ACM 1995, 38, 71–79. [Google Scholar] [CrossRef]
  23. Singh, S. Natural Language Processing for Information Extraction. arXiv 2018, arXiv:1807.02383. [Google Scholar]
  24. Kaur, N.; Pushe, V.; Kaur, R. Natural Language Processing Interface for Synonym. Int. J. Comput. Sci. Mob. Comput. 2014, 3, 638–642. [Google Scholar]
  25. Vijayarani, S.; Ilamathi, J.; Nithya, S. Preprocessing Techniques for Text Mining—An Overview. Int. J. Comput. Sci. Commun. Netw. 2015, 5, 7–16. [Google Scholar]
  26. Chomsky, N. Syntactic Structures; The Hague, Mouton: New York, NY, USA, 1957; ISBN1 9027933855. ISBN2 9789027933850. [Google Scholar]
  27. Weizenbaum, J. ELIZA—A Computer Program for the Study of Natural Language Communication between Man and Machine. Commun. ACM 1966, 9, 36–45. [Google Scholar] [CrossRef]
  28. Sparck, J.K. Natural Language Processing: A Historical Review. In Current Issues in Computational Linguistics: In Honour of Don Walker. Linguistica Computazionale; Zampolli, A., Calzolari, N., Palmer, M., Eds.; Springer: Dordrecht, The Netherlands, 1994; Volume 9, pp. 3–16. [Google Scholar]
  29. Bengio, Y.; Ducharme, R.; Vincent, P.; Jauvin, C. A Neural Probabilistic Language Model. J. Mach. Learn. Res. 2003, 3, 1137–1155. [Google Scholar]
  30. Guresen, E.; Kayakutlu, G. Definition of Artificial Neural Networks with comparison to other networks. Procedia Comput. Sci. 2011, 3, 426–433. [Google Scholar] [CrossRef] [Green Version]
  31. Haykin, S. Neural Networks: A Comprehensive Foundation; Prentice Hall: Hoboken, NJ, USA, 1999. [Google Scholar]
  32. Collobert, R.; Weston, J.; Bottou, L.; Karlen, M.; Kavukcuoglu, K.; Kuksa, P. Natural language processing (almost) from scratch. J. Mach. Learn. Res. 2011, 12, 2493–2537. [Google Scholar]
  33. Callison-Burch, C.; Osborne, M. Statistical Natural Language Processing. In A Handbook for Language Engineers; Farghaly, A., Ed.; CSLI Publications: Stanford, CA, USA, 2003; pp. 1–31. ISBN 1575863952. [Google Scholar]
  34. Junqua, J.-C.; Van Noord, G. Chapter 1. In Robustness in Language and Speech Technology; Junqua, J.-C., van Noord, G., Eds.; Springer: Dordrecht, The Netherlands, 2001; pp. 1–7. ISBN 978-94-015-9719-7. [Google Scholar]
  35. Paliwal, M.; Kumar, U.A. Assessing the contribution of variables in feed forward neural network. Appl. Soft Comput. J. 2011, 11, 3690–3696. [Google Scholar] [CrossRef]
  36. Devlin, J.; Chang, M.-W.; Lee, K.; Toutanova, K. BERT: Pre-training of Deep Bidirectional Transformers for Language Understanding. arXiv 2019, arXiv:1810.04805. [Google Scholar]
  37. Nagda, K.; Mukherjee, A.; Shah, M.; Mulchandani, P.; Kurup, L. Ascent of Pre-Trained State-of-the-Art Language Models. In Advanced Computing Technologies and Applications. Algorithms for Intelligent Systems; Vasudevan, H., Michalas, A., Shekokar, N., Narvekar, M., Eds.; Springer: Singapore, 2020; pp. 269–280. ISBN 978-981-15-3242-9. [Google Scholar]
  38. Hinton, G.E.; Salakhutdinov, R.R. Reducing the Dimensionality of Data with Neural Networks. Science 2006, 313, 504–507. [Google Scholar] [CrossRef] [Green Version]
  39. Malte, A.; Ratadiya, P. Evolution of Transfer Learning in Natural Language Processing. arXiv 2019, arXiv:1910.07370. [Google Scholar]
  40. Peters, M.E.; Neumann, M.; Iyyer, M.; Gardner, M.; Clark, C.; Lee, K.; Zettlemoyer, L. Deep contextualized word representations. In Proceedings of the Conference of the North American Chapter of the Association for Computational Linguistics: Human Language Technologies; Association for Computational Linguistics, New Orleans, LA, USA, 1–6 June 2018; Volume 1, pp. 2227–2237. [Google Scholar]
  41. Chen, C. Science Mapping: A Systematic Review of the Literature. J. Data Inf. Sci. 2017, 2, 1–40. [Google Scholar] [CrossRef] [Green Version]
  42. Chen, C. Visualising semantic spaces and author co-citation networks in digital libraries. Inf. Process. Manag. 1999, 35, 401–420. [Google Scholar] [CrossRef] [Green Version]
  43. Small, H. Co-citation in the scientific literature: A new measure of the relationship between two documents. J. Am. Soc. Inf. Sci. 1973, 24, 265–269. [Google Scholar] [CrossRef]
  44. Herman, I.; Melançon, G.; Marshall, M.S. Graph visualization and navigation in information visualization: A survey. IEEE Trans. Vis. Comput. Graph. 2000, 6, 24–43. [Google Scholar] [CrossRef] [Green Version]
  45. Morris, S.A.; Yen, G.; Asnake, B. Time line visualization of research fronts. J. Am. Soc. Inf. Sci. Technol. 2003, 54, 413–422. [Google Scholar] [CrossRef]
  46. Garfield, E. Citation indexes for science. Science 1955, 122, 108–111. [Google Scholar] [CrossRef] [PubMed]
  47. Bankar, R.S.; Lihitkar, S.R. Science Mapping and Visualization Tools Used for Bibliometric and Scientometric Studies: A Comparative Study. J. Adv. Libr. Sci. 2019, 6, 382–394. [Google Scholar] [CrossRef]
  48. Moral-Muñoz, J.A.; Herrera-Viedma, E.; Santisteban-Espejo, A.; Cobo, M.J. Software tools for conducting bibliometric analysis in science: An up-to-date review. Prof. Inf. 2020, 29, 1–20. [Google Scholar] [CrossRef] [Green Version]
  49. Aria, M.; Cuccurullo, C. bibliometrix: An R-tool for comprehensive science mapping analysis. J. Informetr. 2017, 11, 959–975. [Google Scholar] [CrossRef]
  50. Van Eck, N.J.; Waltman, L. Software survey: VOSviewer, a computer program for bibliometric mapping. Scientometrics 2010, 84, 523–538. [Google Scholar] [CrossRef] [Green Version]
  51. Pouris, A.; Pouris, A. Scientometrics of a pandemic: HIV/AIDS research in South Africa and the World. Scientometrics 2011, 86, 541–552. [Google Scholar] [CrossRef]
  52. Song, J.; Zhang, H.; Dong, W. A review of emerging trends in global PPP research: Analysis and visualization. Scientometrics 2016, 107, 1111–1147. [Google Scholar] [CrossRef]
  53. Zhao, X. A scientometric review of global BIM research: Analysis and visualization. Autom. Constr. 2017, 37–47. [Google Scholar] [CrossRef]
  54. Zhao, X.; Zuo, J.; Wu, G.; Huang, C. A bibliometric review of green building research 2000–2016. Archit. Sci. Rev. 2019, 62, 74–88. [Google Scholar] [CrossRef]
  55. Meho, L.I.; Rogers, Y. Citation counting, citation ranking, and h-index of human-computer interaction researchers: A comparison of scopus and web of science. J. Am. Soc. Inf. Sci. Technol. 2008, 59, 1711–1726. [Google Scholar] [CrossRef] [Green Version]
  56. Archambault, É.; Campbell, D.; Gingras, Y.; Larivière, V. Comparing bibliometric statistics obtained from the web of science and Scopus. J. Am. Soc. Inf. Sci. Technol. 2009, 60, 1320–1326. [Google Scholar] [CrossRef]
  57. Yin, X.; Liu, H.; Chen, Y.; Al-Hussein, M. Building information modelling for off-site construction: Review and future directions. Autom. Constr. 2019, 101, 72–91. [Google Scholar] [CrossRef]
  58. Mongeon, P.; Paul-Hus, A. The journal coverage of Web of Science and Scopus: A comparative analysis. Scientometrics 2016, 106, 213–228. [Google Scholar] [CrossRef]
  59. Locatelli, M.; Seghezzi, E.; Di Giuda, G.M. Exploring BIM and NLP applications: A scientometric approach. In Proceedings of the International Structural Engineering and Construction, Interdisciplinary Civil and Construction Engineering Projects; El Baradei, S.A., Abodonya, A., Singh, A., Yazdani, S., Eds.; ISEC Press: Fargo, ND, USA, 2021; Volume 8, pp. 1–6. [Google Scholar]
  60. Akram, R.; Thaheem, M.J.; Nasir, A.R.; Ali, T.H.; Khan, S. Exploring the role of building information modeling in construction safety through science mapping. Saf. Sci. 2019, 120, 456–470. [Google Scholar] [CrossRef]
  61. Zhong, B.; Wu, H.; Li, H.; Sepasgozar, S.; Luo, H.; He, L. A scientometric analysis and critical review of construction related ontology research. Autom. Constr. 2019, 101, 17–31. [Google Scholar] [CrossRef]
  62. Darko, A.; Chan, A.P.C.; Adabre, M.A.; Edwards, D.J.; Hosseini, M.R.; Ameyaw, E.E. Artificial intelligence in the AEC industry: Scientometric analysis and visualization of research activities. Autom. Constr. 2020, 112. [Google Scholar] [CrossRef]
  63. Hao, T.; Chen, X.; Li, G.; Yan, J. A bibliometric analysis of natural language processing in medical research. Soft Comput. 2018, 22, 7875–7892. [Google Scholar] [CrossRef]
  64. Logcher, R.D.; Wang, M.; Chen, F.H. Knowledge Processing for Construction Management Data Base. J. Constr. Eng. Manag. 1989, 115, 196–211. [Google Scholar] [CrossRef] [Green Version]
  65. Bilal, M.; Oyedele, L.O.; Qadir, J.; Munir, K.; Ajayi, S.O.; Akinade, O.O.; Owolabi, H.A.; Alaka, H.A.; Pasha, M. Big Data in the construction industry: A review of present status, opportunities, and future trends. Adv. Eng. Inform. 2016, 30, 500–521. [Google Scholar] [CrossRef]
  66. Randall, J.H. Conceptual Structure. In Linking: The Geometry of Argument Structure; Springer: Dordrecht, The Netherlands, 2010; pp. 11–34. ISBN 978-1-4020-8308-2. [Google Scholar]
  67. Li, M.; Chu, Y. Explore the research front of a specific research theme based on a novel technique of enhanced co-word analysis. J. Inf. Sci. 2017, 43, 725–741. [Google Scholar] [CrossRef]
  68. Nishisato, S. Correspondence Analysis and Dual Scaling. In Encyclopedia of Social Measurement; Elsevier Inc.: Amsterdam, The Netherlands, 2004; pp. 531–536. ISBN 9780123693983. [Google Scholar]
  69. Van Eck, N.J.; Waltman, L. Text Mining and Visualization Using VOSviewer 2011; Springer: Berlin/Heidelberg, Germany, 2011; pp. 1–5. [Google Scholar]
  70. Kroeger, P. Analyzing Grammar: An Introduction; Cambridge University Press: Cambridge, UK, 2005; ISBN 978-0-521-01653-7. [Google Scholar]
  71. Van Eck, N.J.; Waltman, L. Visualizing bibliometric networks. In Measuring Scholarly Impact; Springer: Cham, Switzerland, 2014; pp. 285–320. ISBN 9783319103778. [Google Scholar]
  72. Gruber, T.R. A translation approach to portable ontology specifications. Knowl. Acquis. 1993, 5, 199–220. [Google Scholar] [CrossRef]
  73. Karshenas, S.; Niknam, M. Ontology-Based Building Information Modeling. Comput. Civ. Eng. 2013, 2013, 476–483. [Google Scholar]
  74. Beetz, J.; van Leeuwen, J.P.; de Vries, B. An Ontology Web Language Notation of the Industry Foundation Classes. In Proceedings of the 22nd CIB W78 Conference on Information Technology in Construction, Dresden, Germany, 19–21 July 2005; pp. 193–198. [Google Scholar]
  75. Abanda, F.H.; Tah, J.H.M.; Keivani, R. Trends in built environment Semantic Web applications: Where are we today? Expert Syst. Appl. 2013, 40, 5563–5577. [Google Scholar] [CrossRef]
  76. Cheng, J.; Law, K.H. Using process specification language for project information exchange. In Proceedings of the 3rd International Conference on Concurrent Engineering in Construction, Dublin, Ireland, 24–25 September 2002. [Google Scholar]
  77. Staub-French, S.; Fischer, M.; Kunz, J.; Paulson, B. An Ontology for Relating Features with Activities to Calculate Costs. J. Comput. Civ. Eng. 2003, 17, 243–254. [Google Scholar] [CrossRef]
  78. Gu, T.; Wang, X.H.; Zhang, D.Q. An ontology-based context model in intelligent environments. In Proceedings of the Communication Networks and Distributed Systems Modeling and Simulation Conference, San Diego, CA, USA, 18–24 January 2004. [Google Scholar]
  79. Schevers, H.; Drogemuller, R. Converting industry foundation classes to the Web ontology language. In Proceedings of the Proceedings of the 1st international conference on semantics, knowledge and grid, Washington, DC, USA, 27–29 November 2005. [Google Scholar]
  80. Lima, C.; El-Diraby, T.; Fiès, B.; Zarli, A.; Ferneley, E. The e-COGNOS project: Current status and future directions of an ontology-enabled IT solution infrastructure supporting knowledge management in construction. In Proceedings of the Construction Research Congress, Honolulu, HI, USA, 19–1 March 2003; pp. 1–8. [Google Scholar]
  81. Yang, Q.Z.; Zhang, Y. Semantic interoperability in building design: Methods and tools. CAD Comput. Aided Des. 2006, 38, 1099–1112. [Google Scholar] [CrossRef]
  82. Schevers, H.; Mitchell, J.; Akhurst, P.; Marchant, D.; Bull, S.; McDonald, K.; Drogemuller, R.; Linning, C. Towards digital facility modelling for Sydney Opera House using IFC and semantic web technology. Electron. J. Inf. Technol. Constr. 2007, 12, 347–362. [Google Scholar]
  83. Mauher, M.; Vanja, S. Municipal asset and property management system for the web collaborative environment. In Proceedings of the 31st International Convention on Information and Communication Technology, Electronics and Microelectronics: DE\&ISS\&miproBIS\&LG\&SP., Opatija, Croatia, 26–30 May 2008; p. 200. [Google Scholar]
  84. Aksamija, A.; Grobler, F. Architectural Ontology: Development of Machine-Readable Representations for Building Design Drivers. In Proceedings of the Computing in Civil Engineering; American Society of Civil Engineers (ASCE), Pittsburgh, PA, USA, 24–27 July 2007; pp. 168–175. [Google Scholar]
  85. García, L.E.R. Ontological CAD data interoperability framework. In Proceedings of the 4th International Conference on Advances in Semantic Processing, Florence, Italy, 25–30 October 2010. [Google Scholar]
  86. Yurchyshyna, A.; Faron-Zucker, C.; Le Thanh, N.; Zarli, A. Knowledge capitalisation and organisation for conformance checking model in construction. Int. J. Knowl. Eng. Soft Data Paradig. 2010, 2, 15–32. [Google Scholar] [CrossRef]
  87. Kumar, V.; Tomic, S.; Pellegrini, T.; Fensel, A.V.; Mayrhofer, R. User created machine-readable policies for energy efficiency in smart homes. In Proceedings of the Ubicomp 2010 Workshop: Ubiquitous Computing for Sustainable Energy (UCSE), Copenhagen, Denmark, 26–29 September 2010. [Google Scholar]
  88. International Organization for Standardization. ISO 16739-1:2018 Industry Foundation Classes (IFC) for Data Sharing in the Construction and Facility Management Industries—Part 1: Data Schema; ISO: Geneve, Switzerland, 2018. [Google Scholar]
  89. Simeone, D.; Cursi, S. The role of semantic enrichment in Building Information Modelling. TEMA 2016, 2, 1–30. [Google Scholar]
  90. Zou, Y.; Kiviniemi, A.; Jones, S.W. Retrieving similar cases for construction project risk management using Natural Language Processing techniques. Autom. Constr. 2017, 80, 66–76. [Google Scholar] [CrossRef]
  91. Marzouk, M.; Enaba, M. Text analytics to analyze and monitor construction project contract and correspondence. Autom. Constr. 2019, 98, 265–274. [Google Scholar] [CrossRef]
  92. Lee, J.; Yi, J.-S.; Son, J. Development of Automatic-Extraction Model of Poisonous Clauses in International Construction Contracts Using Rule-Based NLP. J. Comput. Civ. Eng. 2019, 33, 04019003. [Google Scholar] [CrossRef]
  93. Tixier, A.J.P.; Hallowell, M.R.; Rajagopalan, B.; Bowman, D. Construction Safety Clash Detection: Identifying Safety Incompatibilities among Fundamental Attributes using Data Mining. Autom. Constr. 2017, 74, 39–54. [Google Scholar] [CrossRef] [Green Version]
  94. Baker, H.; Hallowell, M.R.; Tixier, A.J.P. AI-based prediction of independent construction safety outcomes from universal attributes. Autom. Constr. 2020, 118, 103146. [Google Scholar] [CrossRef]
  95. Kim, T.; Chi, S. Accident Case Retrieval and Analyses: Using Natural Language Processing in the Construction Industry. J. Constr. Eng. Manag. 2019, 145, 1–13. [Google Scholar] [CrossRef]
  96. Pan, J.; Anumba, C.J.; Ren, Z. Potential application of the semantic web in construction. In Proceedings of the 20th Annual ARCOM Conference; Khosrowshahi, F., Ed.; Association of Researchers in Construction Management: Edinburgh, UK, 2004; Volume 2, pp. 923–932. [Google Scholar]
  97. Kuck, G. Tim Berners-Lee’s Semantic Web. SA J. Inf. Manag. 2004, 6. [Google Scholar] [CrossRef] [Green Version]
  98. Pauwels, P.; Zhang, S.; Lee, Y.-C.C. Semantic web technologies in AEC industry: A literature overview. Autom. Constr. 2017, 8, 55. [Google Scholar] [CrossRef]
  99. Prell, C. Social Network Analysis: History, Theory and Methodology; Sage: Los Angeles, CA, USA, 2012; ISBN 1412947146. [Google Scholar]
  100. Hosseini, M.R.; Martek, I.; Zavadskas, E.K.; Aibinu, A.A.; Arashpour, M.; Chileshe, N. Critical evaluation of off-site construction research: A Scientometric analysis. Autom. Constr. 2018, 87, 235–247. [Google Scholar] [CrossRef]
  101. Freeman, L.C. A Set of Measures of Centrality Based on Betweenness. Sociometry 1977, 40, 35–41. [Google Scholar] [CrossRef]
  102. Cuccurullo, C.; Aria, M.; Sarto, F. Foundations and trends in performance management. A twenty-five years bibliometric analysis in business and public administration domains. Scientometrics 2016, 108, 595–611. [Google Scholar] [CrossRef]
  103. Lee, J.; Yi, J.-S. Predicting Project’s Uncertainty Risk in the Bidding Process by Integrating Unstructured Text Data and Structured Numerical Data Using Text Mining. Appl. Sci. 2017, 7, 1141. [Google Scholar] [CrossRef] [Green Version]
  104. Salama, D.M.; El-Gohary, N.M. Semantic Text Classification for Supporting Automated Compliance Checking in Construction. J. Comput. Civ. Eng. 2016, 30. [Google Scholar] [CrossRef]
  105. Song, J.; Kim, J.; Lee, J.-K. NLP and Deep Learning-based Analysis of Building Regulations to Support Automated Rule Checking System. In Proceedings of the 35th International Symposium on Automation and Robotics in Construction (ISARC), Berlin, Germany, 20–25 July 2018; Curran Associates: New York, NY, USA, 2018. [Google Scholar]
  106. Zhang, F.; Fleyeh, H.; Wang, X.; Lu, M. Construction site accident analysis using text mining and natural language processing techniques. Autom. Constr. 2019, 99, 238–248. [Google Scholar] [CrossRef]
  107. Cobo, M.J.; López-Herrera, A.G.; Herrera-Viedma, E.; Herrera, F. An approach for detecting, quantifying, and visualizing the evolution of a research field: A practical application to the Fuzzy Sets Theory field. J. Informetr. 2011, 5, 146–166. [Google Scholar] [CrossRef]
  108. Callon, M.; Courtial, J.; Laville, F. Co-word analysis as a tool for describing the network of interactions between basic and technological research: The case of polymer chemsitry. Scientometrics 1991, 22, 155–205. [Google Scholar] [CrossRef]
  109. Courtial, J.P. A coword analysis of scientometrics. Scientometrics 1994, 31, 251–260. [Google Scholar] [CrossRef]
  110. Qin, H. Knowledge Discovery Through Co-Word Analysis. Libr. Trends 1999, 48, 133–159. [Google Scholar]
  111. Bradford, S. Sources of information on specific subject. Engineering 1934, 137, 85–86. [Google Scholar]
  112. Venable, G.T.; Shepherd, B.A.; Loftis, C.M.; McClatchy, S.G.; Roberts, M.L.; Fillinger, M.E.; Tansey, J.B.; Klimo, P. Bradford’s law: Identification of the core journals for neurosurgery and its subspecialties. J. Neurosurg. 2016, 124, 569–579. [Google Scholar] [CrossRef] [Green Version]
  113. Hjørland, B.; Nicolaisen, J. Bradford’s law of scattering: Am-biguities in the concept of “subject”. In Information Context: Nature, Impact, and Role; Crestani, F., Ruthven, I., Eds.; Springer: Berlin, Germany, 2005; pp. 96–106. [Google Scholar]
  114. Hirsch, J.E. An index to quantify an individual’s scientific research output. Proc. Natl. Acad. Sci. USA 2005, 102, 16569–16572. [Google Scholar] [CrossRef] [Green Version]
  115. Egghe, L. Theory and practise of the g-index. Scientometrics 2006, 69, 131–152. [Google Scholar] [CrossRef]
  116. Pao, M.L. Lotka’s law: A testing procedure. Inf. Process. Manag. 1985, 21, 305–320. [Google Scholar] [CrossRef]
  117. Qiu, J.; Zhao, R.; Yang, S.; Dong, K. Informetrics: Theory, Methods and Applications; Springer: Berlin/Heidelberg, Germany, 2017; ISBN 9789811040320. [Google Scholar]
  118. Ioannou, P.G.; Liu, L.Y. Advanced Construction Technology System—ACTS. J. Constr. Eng. Manag. 1993, 119, 288–306. [Google Scholar] [CrossRef] [Green Version]
  119. Xiaorui, X.; Jiansong, Z. Building Codes Part-of-Speech Tagging Performance Improvement by Error-Driven Transformational Rules. J. Comput. Civ. Eng. 2020, 34, 4020035. [Google Scholar] [CrossRef]
  120. Sangyun, S.; Chankyu, L.; Issa, R.R. Framework for Automatic Speech Recognition-Based Building Information Retrieval from BIM Software. Constr. Res. Congr. 2020, 2020, 992–1000. [Google Scholar]
  121. Baker, H.; Hallowell, M.R.; Tixier, A.J.P. Automatically Learning Construction Injury Precursors from Text. Autom. Constr. 2019, 118, 103145. [Google Scholar] [CrossRef]
  122. Mo, Y.; Zhao, D.; Du, J.; Syal, M.; Aziz, A.; Li, H. Automated staff assignment for building maintenance using natural language processing. Autom. Constr. 2020, 113, 103150. [Google Scholar] [CrossRef]
  123. Peters, H.P.F.; Van Raan, A.F. Structuring scientific activities by co-author analysis—An exercise on a university faculty level. Scientometrics 1991, 20, 235–255. [Google Scholar] [CrossRef]
  124. Leng, S.; Hu, Z.-Z.; Luo, Z.; Zhang, J.-P.; Lin, J.-R. Automatic MEP knowledge acquisition based on documents and Natural Language Processing. In Proceedings of the 36th International Conference of CIB W78, Newcastle-upon-Tyne, UK, 18–20 September 2019; pp. 800–809. [Google Scholar]
  125. Rasmussen, M.H.; Lefrançois, M.; Pauwels, P.; Hviid, C.A.; Karlshøj, J. Managing interrelated project information in AEC Knowledge Graphs. Autom. Constr. 2019, 108, 102956. [Google Scholar] [CrossRef]
  126. Santos, R.; Costa, A.A.; Grilo, A. Bibliometric analysis and review of Building Information Modelling literature published between 2005 and 2015. Autom. Constr. 2017, 80, 118–136. [Google Scholar] [CrossRef]
  127. Isikdag, U.; Aouad, G.; Underwood, J.; Wu, S. Building information models: A review on storage and exchange mechanisms. In Proceedings of the International Conference on IT for Construction CIBW78, Maribor, Slovenia, 27–29 June 2007; pp. 135–143. [Google Scholar]
  128. Deshpande, A.; Azhar, S.; Amireddy, S. A framework for a BIM-based knowledge management system. Procedia Eng. 2014, 85, 113–122. [Google Scholar] [CrossRef] [Green Version]
Figure 1. Methodology steps schema.
Buildings 11 00583 g001
Figure 2. Visualization of research topics investigated.
Buildings 11 00583 g002
Figure 3. Annual Scientific Production.
Buildings 11 00583 g003
Figure 4. Average citations per year.
Buildings 11 00583 g004
Figure 5. Conceptual analysis approach for the investigation of the research topic.
Buildings 11 00583 g005
Figure 6. Co-occurrence keywords network graph. Software: VosViewer version 1.6.15.
Buildings 11 00583 g006
Figure 7. Semantic Web topic, it includes the sub-topics BIM, NLP, and Semantic.
Buildings 11 00583 g007
Figure 8. Co-occurrence keyword with temporal overlay data. Software: VosViewer version 1.6.15.
Buildings 11 00583 g008
Figure 9. Relative influence of existing research via Degree Centrality ranking.
Buildings 11 00583 g009
Figure 10. Temporal evolution of keywords. Software: BiblioShiny version 3.0.
Buildings 11 00583 g010
Figure 11. Factorial analysis reduction 2D map. Software: BiblioShiny version 3.0.
Buildings 11 00583 g011
Figure 12. Overlay of factorial map clusters on the co-occurrence network. Software: VosViewer version 1.6.15.
Buildings 11 00583 g012
Figure 13. Thematic bivariate map. Software: BiblioShiny version 3.0.
Buildings 11 00583 g013
Figure 14. Bradford’s Law plot. Software: BiblioShiny version 3.0.
Buildings 11 00583 g014
Figure 15. Source trend dynamics. Software: BiblioShiny version 3.0.
Buildings 11 00583 g015
Figure 16. Lotka’s law graph. Occasional and core authors. Software: BiblioShiny version 3.0.
Buildings 11 00583 g016
Figure 17. Top 19 author’s scientific production map (1993–2020). Software: BiblioShiny version 3.0.
Buildings 11 00583 g017
Figure 18. Co-authorship network. Software: BiblioShiny version 3.0.
Buildings 11 00583 g018
Figure 19. Number of publications per country and collaboration. Software: BiblioShiny version 3.0.
Buildings 11 00583 g019
Figure 20. Research collaboration bar chart.
Buildings 11 00583 g020
Table 1. Science mapping tool features (adapted from Moral-Muñoz et al. [48]).
Tool Comparison MatrixScience Mapping Tool
BibexcelBiblioShinyBiblioMapsCiteSpaceCitNetExplorerSciMATSci ToolVosViewerGephi
Network analysisThematicyesyesyesyes yesyesyesyes
Authoryesyesyesyes yesyesyesyes
Referenceyesyesyesyesyesyesyesyesyes
Otheryesyesyesyes yesyesyesyes
Geospatialyesyesyesyes yes
Other analysisBurst detection yes yes yes
Spectrogram yes
Map visualizationNetworkyesyesyes yes yesyesyes
Geospatialyesyes yes yes
Temporalyesyes yes
Clusteryesyes yes
Evolutionyesyes
Overlayyesyes yes yes
Densityyesyes yes yes
Tree ringyesyes yes
Otheryesyes yes
Table 2. Synonyms and lexical variants normalization.
TopicSynonymsNormalized Term
Building Information Modelingbuilding information model-bimbim
bim
building information model
building information modeling
building information modeling (bim)
building information modelling
Industry Foundation Classesindustry foundation classes (ifc)ifc
industry foundation classes—ifc
industry foundation classes
Natural Language Processingcomputational linguisticsnlp
natural language processing
natural language processing systems
nlp systems
Construction sectorconstructions sectorsconstruction industry
construction
constructions
construction sector
Table 3. Descriptive information about the dataset.
Main Information about the Data Set
Timespan1989:2020
Sources64
Documents254
Average years from publication11.4
Average citations per documents12.77
Average citations per year per doc1.662
References6169
Document types
Article141
Conference paper113
Document contents
Indexed keywords1725
Author’s keywords473
Authors
Authors551
Author appearances700
Authors of single-authored documents31
Authors of multi-authored documents520
Authors collaboration
Single-authored documents33
Documents per Author0.461
Authors per Document2.17
Co-Authors per Documents2.76
Collaboration Index2.35
Table 4. Cluster topic average publication year.
Color ClusterMain Cluster TopicKeywordsLess Recent PublicationAverage Publication YearMost Recent Publication
RedConstruction and Information Management21199820042010
BlueBIM, Design, Ontology and IFC (Interoperability format and Knowledge Management)16200920132016
YellowSemantic technology and Automated Compliance Checking14200520122017
GreenNLP tools and application in AECO20200820152019
Table 5. Degree Centrality and Betweenness Centrality values. Software: Gephi version 0.9.2.
KeywordsDegree CentralityBetweenness Centrality
information retrieval87196
construction industry85156
project management82142
information management79135
architectural design7828
bim7346
nlp7089
civil engineering6950
information theory6476
semantics6040
construction management5952
information technology5961
construction projects5626
data mining5551
buildings5422
knowledge based systems5435
knowledge management5361
ifc5244
automation5115
artificial intelligence508
learning systems5026
world wide web500
classification4817
mathematical models4730
laws and legislation4629
Table 6. Relevant papers about NLP application for Safety and Risk mitigation, and Automated Compliance Checking task.
TopicBrief Description and Main GoalReference
Risk managementNLP based system to analyze the uncertainty of the bidding documents: predicting risks during the bidding process of construction projects.[103]
Automated Compliance CheckingSemantic machine learning-based text classification algorithm for classifying clauses and sub-clauses: enhancing Automated Compliance Checking (ACC).[104]
NLP and deep learning-based approach, converting human-readable building regulations to computer-readable format: supporting Automated Rule Checking activity.[105]
Construction safetyNLP techniques performed on construction accident report databases: improving efficiency and performance of risk mitigation Case Base Reasoning (CBR) method.[90]
Text mining and NLP to analyze construction site accident: preventing reoccurrence of similar accidents enhancing scientific risk control plans.[106]
Table 7. First 20 sources ranked by number of articles.
SourceJournal ArticlesConference Papers
Automation in Construction41-
Journal of Computing in Civil Engineering25-
Congress on Computing in Civil Engineering-20
Journal of Construction Engineering and Management19-
Computing in Civil Engineering (New York)-14
Computing in Civil and Building Engineering-10
Canadian Society for Civil Engineering- Annual Conference-9
Journal of Management in Engineering7-
Engineering, Construction and Architectural Management6-
ASCE Construction Congress-5
Computer-Aided Civil And Infrastructure Engineering4-
Construction Innovation4-
Electronic Journal of Information Technology in Construction4-
ISARC-International Symposium On Automation And Robotics in Construction-4
Journal of Civil Engineering and Management4-
Journal of Information Technology in Construction4-
ASCE International Conference on Computing in Civil Engineering-4
Towards a Vision for Information Technology in Civil Engineering-4
Architectural Engineering and Design Management3-
Civil Engineering Systems3
Total12470
Table 8. H, G, and M-index sources comparison.
Source: Journal or Conference ProceedingsH-IndexG-IndexM-IndexNumber of DocumentsTotal CitationsYears of Publications
Automation in Construction21350.784112271994
Journal of Computing in Civil Engineering14250.54256331995
Congress on Computing in Civil Engineering690.2620931998
Journal of Construction Engineering and Management11190.34194651989
Computing in Civil Engineering (New York)450.1514371994
Computing in Civil and Building Engineering460.1410381993
Canadian Society for Civil Engineering- Annual Conference110.06942003
Journal of Management in Engineering670.1971371990
Engineering, Construction and Architectural Management260.136912006
ASCE Construction Congress230.085111995
Computer-Aided Civil And Infrastructure Engineering440.214702002
Construction Innovation340.174292003
Electronic Journal of Information Technology in Construction340.1741142003
ISARC-International Symposium On Automation And Robotics in Construction110.33432018
Journal of Civil Engineering and Management340.164622002
Journal of Information Technology in Construction240.254232013
ASCE International Conference on Computing in Civil Engineering110.06422005
Towards a Vision for Information Technology in Civil Engineering340.174172003
Architectural Engineering and Design Management230.673122018
Civil Engineering Systems110.03331989
Table 9. Affiliation and institution ranked per published articles.
AffiliationCountryArticles
University of Illinois At Urbana-ChampaignUSA17
University of FloridaUSA9
Purdue UniversityUSA8
University of Colorado At BoulderUSA8
Concordia UniversityCanada7
Stanford UniversityUSA7
Florida International UniversityUSA5
Georgia Institute of TechnologyUSA5
National Taiwan UniversityTaiwan5
University Of TorontoCanada5
Publisher’s Note: MDPI stays neutral with regard to jurisdictional claims in published maps and institutional affiliations.

